

Page 1

Application Note
Cell Migration and
Invasion
Incorporation of a Novel, Automated
Scratch Tool and Kinetic Label-Free
Imaging to Perform Wound
HealingAssays
Author
Brad Larson
Agilent Technologies, Inc.
Abstract
The wound healing or "scratch" assay is one of the most highly used in vitro methods
to monitor and quantify collective cell migration. The current standard involves
manual wound creation, which yields low reproducibility between wounds, high
variability within generated data, and possible false conclusions regarding test
molecules. Using an automated wound creation tool, in addition to kinetic image
capture and analysis, repeatable wounds and robust and repeatable results are
easily attained.
Page 2

Introduction
Materials and methods
The movement of cells when influenced by interactions
with neighboring cells, otherwise known as collective cell
migration, plays a role in numerous critical physiological
processes, including morphogenesis and tissue regeneration.
This type of movement as a cohesive group has also been
shown to be critical in wound healing and cancer metastasis.
In wound healing, epithelial cells collectively migrate as a
sheet of cells. Wounding of the epithelial layer induces cell
migration in a directional manner. During this process, cells
maintain tight intercellular adhesion, healing the original
2
wound.
Similarly, collective cell migration has also been
implicated as playing a major role in cancer metastasis. An
increasing number of publications indicate that metastatic
cells cluster and invade collectively in the vasculature and
3-4
lymphatics of cancer patients.
Therefore, attaining a better
understanding of collective cell movement is of critical value
for the treatment of multiple disease types.
One of the most widely used methods to measure collective
cell migration is the wound healing or "scratch" assay.
Following creation of a wound, or cell-free zone, within the
confluent cell layer, cell movement back into the wound
area is monitored over time using cellular imaging. Kinetic
and endpoint data then allow for quantification of cell
migration, either when uninhibited or under the influence of
a test molecule. For wound creation, commonly a pipette
tip is manually dragged through the cells, which can lead
to wounds that vary drastically in width, orientation, and in
placement within the well. This yields increased variability in
calculated measurements within replicate wells and across
titrations, complicating final conclusions regarding the
migratory ability of test cell models and treatments, especially
when comparing assay to assay data. To increase the
robustness of generated data, a method to create consistent
wounds is necessary.
This study demonstrates the use of a novel, automated tool
to create scratch wounds in cell monolayers formed on the
bottom of a microplate. With the single push of a button, and
using a 4- or 8-pin head, consistent scratches of equivalent
size and area are made in either 24- or 96-well plates. A
multi-reservoir cleaning trough is also incorporated on the
deck of the tool. Using the onboard programmed procedure,
unattended cleaning and decontamination of each pin is
accomplished before and after use. The small footprint
permits insertion of the tool; using any size laminar flow
hood enabling wound creation in a sterile manner. Following
washing, the plate can then be transferred to an Agilent
BioTek automated imager or the Agilent BioTek BioSpa live
cell analysis system to kinetically monitor cell migration.
Materials
Cells
1
HT-1080 fibrosarcoma cells (partnumberCCL-121)
were purchased from ATCC (Manassas, VA).
Human neonatal dermal fibroblasts expressing RFP
(partnumbercAP-0008RFP) were purchased from
Angio-Proteomie (Boston, MA). U-87 glioblastoma cells
expressing GFP were generously donated by Dr. Sachin Katyal
(University of Manitoba, Winnipeg, Manitoba, Canada).
Experimental components
Advanced DMEM (partnumber12491- 015), fetal bovine
serum (partnumber10437-036), penicillin-streptomycinglutamine (100x) (partnumber10378-016), TrypLE express
enzyme (1x), phenol red (partnumber12605-010), Alconox
powdered precision cleaner (partnumber16-000-104),
Virkon-S (partnumberNC9821357), and CellTracker Green
CMFDA Dye (partnumberC2925) were purchased from
Thermo Fisher Scientific (Waltham, MA). Cytochalasin
D (partnumber1233) was purchased from Bio-Techne
Corporation (Minneapolis, MN). 24-well clear TC-treated
multiple well plates (partnumber3524) and 96-well
clear, flat bottom, polystyrene TC-treated microplates
(partnumber3598) were purchased from Corning Life
Sciences (Corning, NY).
Agilent BioTek AutoScratch wound making tool
The Agilent BioTek AutoScratch wound making tool
automatically creates reproducible scratch wounds in cell
monolayers grown in microplates. The simple pushbutton
operation and tool-free scratch pin manifold exchange
make it easy to process either 96- or 24-well plates, which
are commonly used in migration and invasion assays. The
compact system features an onboard, preprogrammed
cleaning routine to keep the scratch pins free of buildup and
avoiding contamination. AutoScratch precisely and efficiently
automates the sample prep for imaging workflows with
Agilent BioTek Cytation cell imaging multimode readers and
Agilent BioTek Lionheart automated microscopes.
2
Page 3

Agilent BioTek Cytation 5 cell imaging multimode reader
Cytation 5 is a modular multimode microplate reader
combined with an automated digital microscope. Filter- and
monochromator-based microplate reading are available, and
the microscopy module provides up to 60x magnification in
fluorescence, brightfield, color brightfield and phase contrast.
The instrument can perform fluorescence imaging in up to
four channels in a single step. With special emphasis on
live cell assays, Cytation 5 features shaking, temperature
control to 65 °C, CO
gas control and dual injectors
2/O2
for kinetic assays and is controlled by integrated Agilent
BioTek Gen5 microplate reader and imager software, which
also automates image capture, analysis and processing.
The instrument was used to capture kinetic high contrast
brightfield and fluorescent images over the incubation period.
Agilent BioTek BioSpa 8 automated incubator
The BioSpa 8 automated incubator links Agilent BioTek
readers or imagers together with Agilent BioTek washers
and dispensers for full workflow automation of up to eight
microplates. Temperature, CO
and humidity levels are
2/O2
controlled and monitored through the Agilent BioTek BioSpa
software to maintain an ideal environment for cell cultures
during all experimental stages. Test plates were incubated in
the BioSpa to maintain proper atmospheric conditions during
incubation and automatically transferred to the Cytation 5 for
high contrast brightfield and fluorescentimaging.
Agilent BioTek MultiFlo FX multimode dispenser
The MultiFlo FX is a modular, upgradable reagent dispenser
that can have as many as two peristaltic pump (8-tube
dispensers), two syringe pump dispensers and a strip washer.
The syringe and washer manifolds can be configured for plate
densities from 6- to 384-well.
Methods
Cell preparation
Cells were cultured in T-75 flasks until reaching 80%
confluency. Subsequent to detachment from the flask
with TrypLE, cells were resuspended to preoptimized
concentrations depending on plate well density and culture
conditions (Table 1).
Table 1. Automated 3D tumoroid invasion imaging
parameters.
Cell Plating Concentrations
24-Well Format 96-Well Format
HT-1080
Fibroblast
U-87
2.4 × 10⁵ cells/mL 4.0 × 10⁵ cells/mL
– 2.0 × 10⁵ cells/mL
2.4 × 10⁵ cells/mL 4.0 × 10⁵ cells/mL
AutoScratch cleaning procedure
Prior to wound creation in test plates, the AutoScratch
tool pins were cleaned and sterilized. The four cleaning
components were added to individual reservoirs of the
cleaning trough, labeled to assist with appropriate component
and volume addition (Table 2).
Table 2. Cleaning trough reagent setup.
AutoScratch Cleaning Components
Reservoir 1
Reservoir 2
Reservoir 3
Reservoir 4
Alconox, 0.5% 12 mL
Virkon-S, 1% 12 mL
Sterile DI H2O 12 mL
70% Ethanol 12 mL
The “Clean” button was pressed to initiate the cleaning
procedure. During the process, the scratching arm containing
the pins moves from the home position into the reservoir
containing 0.5% Alconox, agitates in the Y-axis for 3seconds,
then soaks the pins in the component for 5 minutes. At the
completion of the 5-minute incubation period, the arm moves
the pins to the Virkon-S. The process is then automatically
repeated for each of the remaining components. At the end of
the 20-minute cleaning cycle, the pins were cleaned, sterilized,
and ready to be used for woundcreation.
Scratch wound creation
Following completion of the cleaning procedure, the test plate
was added to the deck of the AutoScratch tool and the lid
removed. The “Scratch” button appropriate for the microplate
density being used, “24” or “96”, was pressed to begin the
wounding process. Here the arm moves the pins from the
home position to column 1 of the plate where a scratch is
made vertically at the center of the well. The arm then moves
the pins back to the reservoir containing the DI H
O and
2
performs a three second agitation to remove any dislodged
cells sticking to the pins. The pins are then moved to
column2 and the scratching and cleaning steps are repeated
for each column of the plate.
3
Page 4

Post scratch plate washing
Wt = IA – Object Sum Area
t
Upon completion of the wound creation routine, the plate was
transferred to a separate laminar flow hood containing the
Agilent BioTek MultiFlo FX. Here a plate washing procedure
was carried out to remove cells dislodged from the bottom
of the plate. The stainless steel tubes of the strip washer,
previously sterilized using 70% ethanol, were used to aspirate
media while the peristaltic pump and an autoclaved 5 uL
cassette dispensed back fresh media. For uninhibited wells,
the procedure was repeated 3x. For wells containing the
cytochalasin D titration, media containing inhibitor was added
manually following the third aspiration cycle.
Kinetic image-based monitoring of cell migration
Plates were then placed into the BioSpa 8, with atmospheric
conditions previously set to 37 °C/5% CO
. Water was
2
added to the pan to create a humidified environment. The
BioSpa8 software was programmed such that the plates
were automatically transferred to Cytation 5 for high contrast
brightfield or high contrast brightfield and fluorescent imaging
of the test wells, depending on the incorporated cell types.
A single 4x image was taken with each channel (Table 3) to
capture potential cell movement into the original wound area.
Table 3. Included imaging channels per test
cell model.
Incorporated Imaging Channels
HT-1080
Fibroblast
U-87
High contrast brightfield/GFP
High contrast brightfield/RFP
High contrast brightfield/GFP
Plates were then transferred back to the BioSpa 8. Kinetic
imaging cycles were carried out using iterations optimized
depending on the speed of migration for each cell model
(Table 4).
Table 4. Optimized imaging intervals per
cell model.
Kinetic Imaging Intervals
HT-1080
Fibroblast
U-87
Fibroblast/U-87 Co-culture
60 minutes
90 minutes
90 minutes
90 minutes
Table 5. Image preprocessing parameters.
Incorporated Imaging Channels
Channel
High Contrast
Brightfield
RFP
GFP
Apply Image
Processing Background Rolling Ball Priority
Yes Dark 25 μm Fine results
Yes Dark Auto Fine results
Yes Dark Auto Fine results
Cellular analysis of preprocessed images
Cellular analysis was carried out on the processed images
to quantify the cell containing areas of each image using the
criteria in Table 6.
Table 6. Object mask analysis parameters.
Primary Cellular Analysis Parameters
Channel
Threshold
Background
Split Touching Objects
Fill Holes in Masks
Minimum Object Size
Maximum Object Size
Include Primary Edge Objects
Analyze Entire Image
Advanced Detection Options
Rolling Ball Diameter
Image Smoothing Strength
Evaluate Background On
Expand the Threshold Mask
Analysis Metric
Metric of Interest
Tsf[Brightfield]
2,000
Dark
Unchecked
Checked
100 μm
10,000 μm
Checked
Checked
40
20
1% of lowest pixels
5 μm
Object sum area
Wound healing metric calculation
The kinetic cell area coverage values (object sum area) were
then used to generate three additional wound healing metrics,
including wound width, wound confluence, and maximum
wound healing rate. Each metric is automatically calculated
by the Agilent BioTek Gen5 wound healing protocol.
Wound width
Wound width, or the average width of the cell-free zone over
time, is calculated using the following formula:
Image processing
Following capture, using the settings in Table 5, high contrast
brightfield images were processed to increase the contrast
in brightfield signal between background and cell containing
areas of the image, while fluorescent images were processed
to remove background signal.
4
I
H
Where Wt is the average wound width (µm) over time, IA is
the total area of the 4x image, Object Sum Area
covered by cells at each time point, and I
is the area
t
is the height of a
H
4ximage.
Page 5

Wound confluence
Ct = Object Sum Areat – Object Sum Area0 * 100
AB
AB
AB
Wound confluence, or the percentage of the original wound
area covered by migrating cells over time, is calculated using
the following formula:
from the 24-well plate once again illustrated consistent
wound shape and size similar to that seen from the 96-well
plates (Figure 2).
IA - Object Sum Area
0
Where Ct is the percent wound confluence over time, Object
Sum Area
Object Sum Area
is the area covered by cells at each time point,
t
is the area covered by cells at time 0, and IA
0
is the total area of the 4x image.
Maximum wound healing rate
The maximum wound healing rate is calculated using a
Kinetic Analysis step in Gen5. The Max V calculation type
is selected and the rate is calculated using six data points
along the sum area curve. The value is then expressed as
2
perhour.
µm
Results and discussion
Validation of consistency within scratch wound creation
To validate the ability of the Agilent BioTek AutoScratch unit
to create wounds of a consistent size, HT-1080 cells were
plated into each well of 96-well microplates using a volume of
100µL and a concentration of 4.0 × 10
an overnight incubation to allow for attachment, the plates
were placed one at a time onto the deck and scratched by
the AutoScratch tool to create wounds in each well. Visual
inspection of the high contrast brightfield images illustrated
the consistent wound shape and size that could be achieved
from well to well (Figure 1).
5
cells/mL. Following
Figure 2. Images captured from a 24-well plate immediately following
wound creation with the Agilent BioTek AutoScratch using the high contrast
brightfield imaging channel and a 4x objective.
To quantify the consistency of wound creation, high contrast
brightfield images (Figure 3A) were then preprocessed using
the parameters described in Table 5. Using this method,
the contrast between image areas containing cells and
background is increased (Figure 3B). This allows accurate
object mask placement around cell containing areas
(Figure3C) using the cellular analysis criteria in Table 6.
C
Figure 1. Images captured from a 96 -well plate immediately following
wound creation with the Agilent BioTek AutoScratch using the high contrast
brightfield imaging channel and a 4x objective.
Validation of consistent wound creation was also performed
in 24-well plates. Here HT-1080 cells were added to
each well using a volume of 1 mL and concentration of
5
2.4×10
incubation period, the plates were again placed onto the
deck and scratched by the Agilent BioTek AutoScratch tool.
cells/mL. Following the overnight cell attachment
Visualinspection of high contrast brightfield images captured
Figure 3. High contrast brightfield image processing and analysis. (A) Raw
high contrast brightfield image; (B) preprocessed high contrast brightfield
image; and (C) preprocessed high contrast brightfield image with object
mask placement.
Using the wound width formula described previously, the
average wound width at time 0 following wound creation
was generated for each well of the 96- and 24-well plates.
The %CV of the wound width values across all wells of the
96-well test plate was calculated to be 2.1%, whereas the %CV
of the wound width values across the 24-well test plate was
1.4%, illustrating the high degree of repeatability in created
wound size when using the AutoScratch tool with either plate
welldensity.
5
Page 6
Cell carryover testing
AB
Because wound creation takes place in a column wise fashion
across the microplate, it was necessary to confirm that the
cleaning process that follows wounding in each column
effectively presents carryover and cross-contamination
(cells were not carried from column to column on the pins
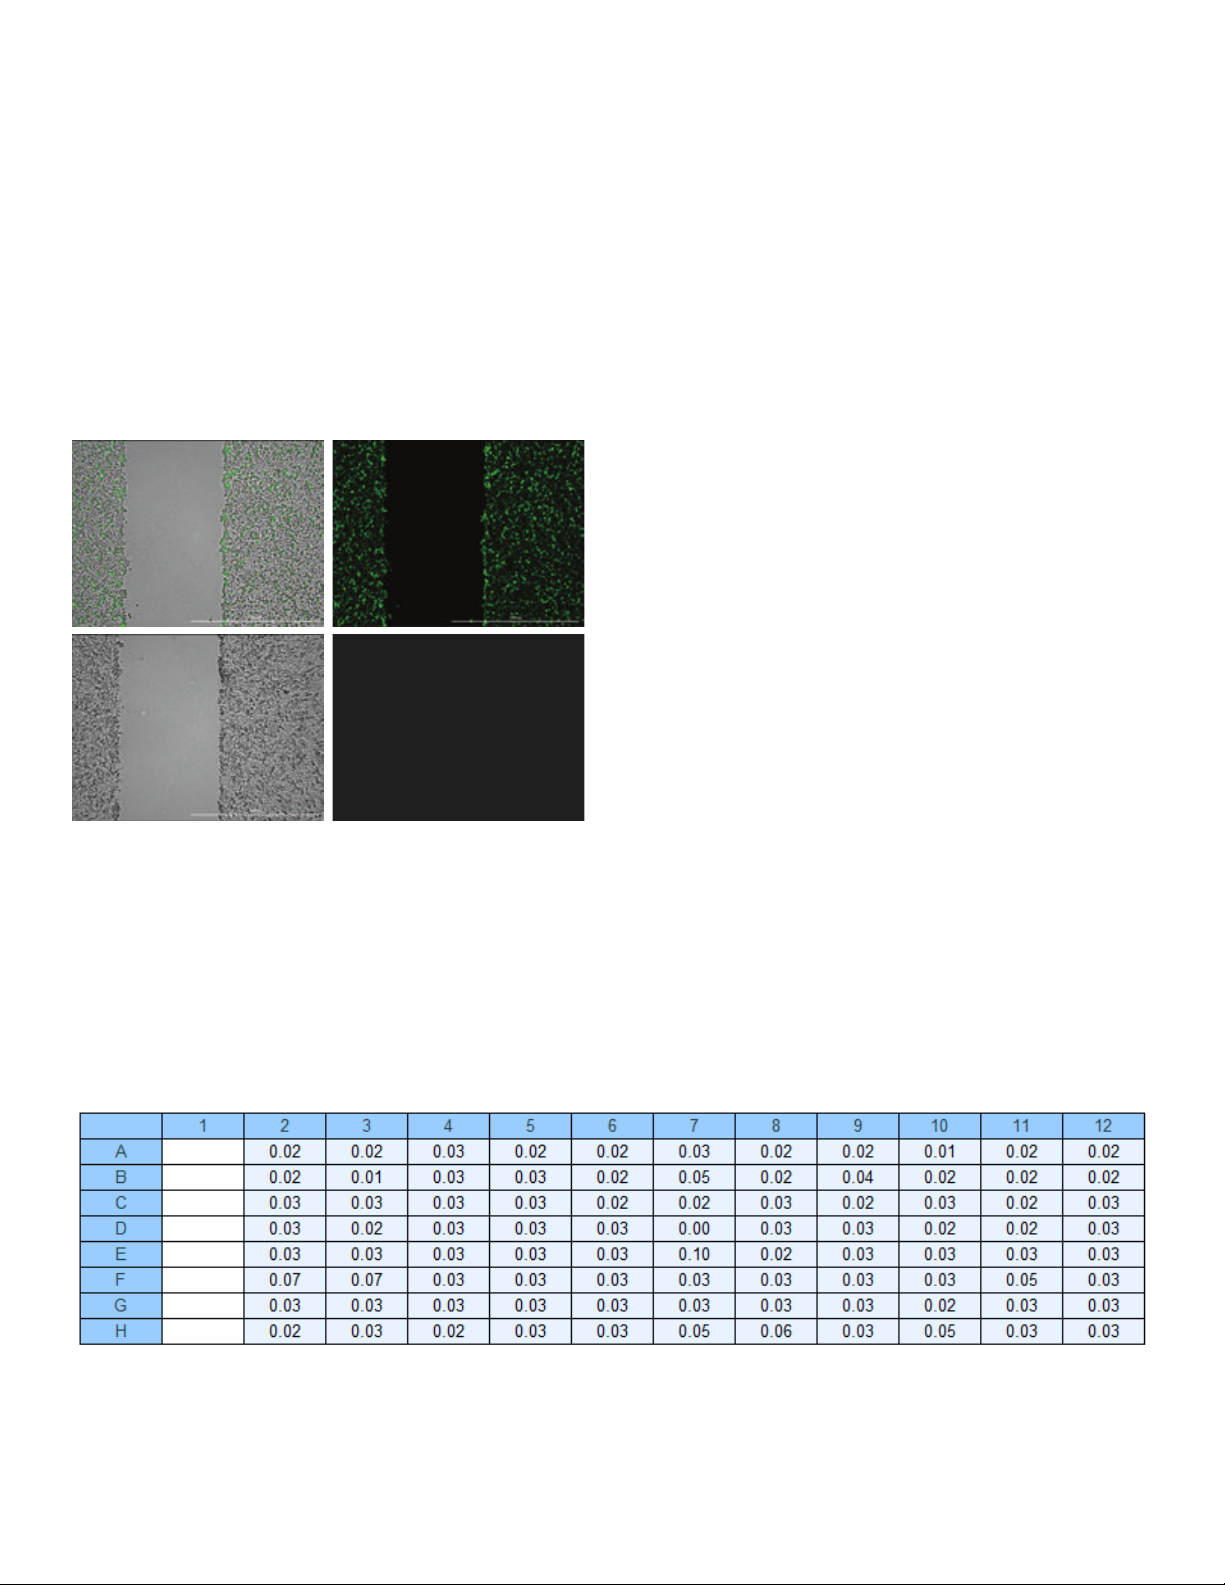
of the AutoScratch tool). For this experiment, HT-1080 cells
in column 1 of a 96-well plate were stained with CellTracker
Green fluorescent probe, whereas all other wells in columns
2to12 were left unstained (Figure 4).
C D
Figure 4. High contrast brightfield and GFP images. (A) High contrast
brightfield/GFP overlaid images; and (B) GFP images only following wound
creation for CellTracker Green stained cells in column 1. (C) High contrast
brightfield/GFP overlaid images; and (D) GFP images only following wound
creation for unstained cells in column 2.
Wound creation was then allowed to proceed as previously
described. Following image processing, image analysis was
performed to quantify the total GFP signal per image. The
percent GFP signal in columns 2to12 compared to the signal
in column 1, per row, was then calculated.
As seen in Figure 5, signal percentages were less than 0.1%
for every well subsequent to column 1, demonstrating that
the cleaning process following wounding in each column
effectively prevents cells from being carried from column
to column, eliminating carryover and cross-contamination
(carryover and cross-contamination between the columns of
each test plate).
Kinetic wound healing metrics
Kinetic imaging of the test plates was then allowed to
proceed to monitor cell migration into the wound area. Test
plates were added to the BioSpa 8 and robotically transferred
to the Cytation 5 at predefined intervals. Due to the fact
that HT-1080 cells migrate rapidly, a more frequent imaging
interval of 60 minutes was selected to properly capture
movement of the cells over time. As with the wound width
metric, sum area values were used to calculate wound
confluence for each well over the entire incubation period.
All metrics for each plate type, including the original sum
area values in addition to calculated wound width and wound
confluence, were then plotted versus time to assess data
consistency by comparing the kinetic curves from each well
(Figure 6).
The kinetic sum area graphs were also used to calculate the
final kinetic wound healing metric, maximum wound healing
rate. From examining the kinetic curves generated from each
metric, it is clear that a high degree of similarity is seen from
well to well. In addition, the average of the maximum wound
healing rate values from each well of the 96- or 24-well plates,
5
at a 95% confidence interval was 1.61 ±0.01×10
with a %CV of 3.8% for 96-, and 1.612 ±0.005×10
µm2/hour
5
µm2/hour
with a %CV of 2.1% for 24-well format, confirm that use of
the AutoScratch tool yields kinetic wound healing results with
high levels of consistency within wells of a single plate, and
also between different plate well formats.
Figure 5. Calculated percent GFP signal carryover values from stained cells in column 1.
6
Page 7

A B
C
E
D
F
Figure 6. Full plate screenshots of plotted kinetic wound healing metric data. Kinetic sum area, wound width and wound confluence graphs for (A, C, and E)
96- and (B, D, and F) 24-well plates, respectively.
7
Page 8

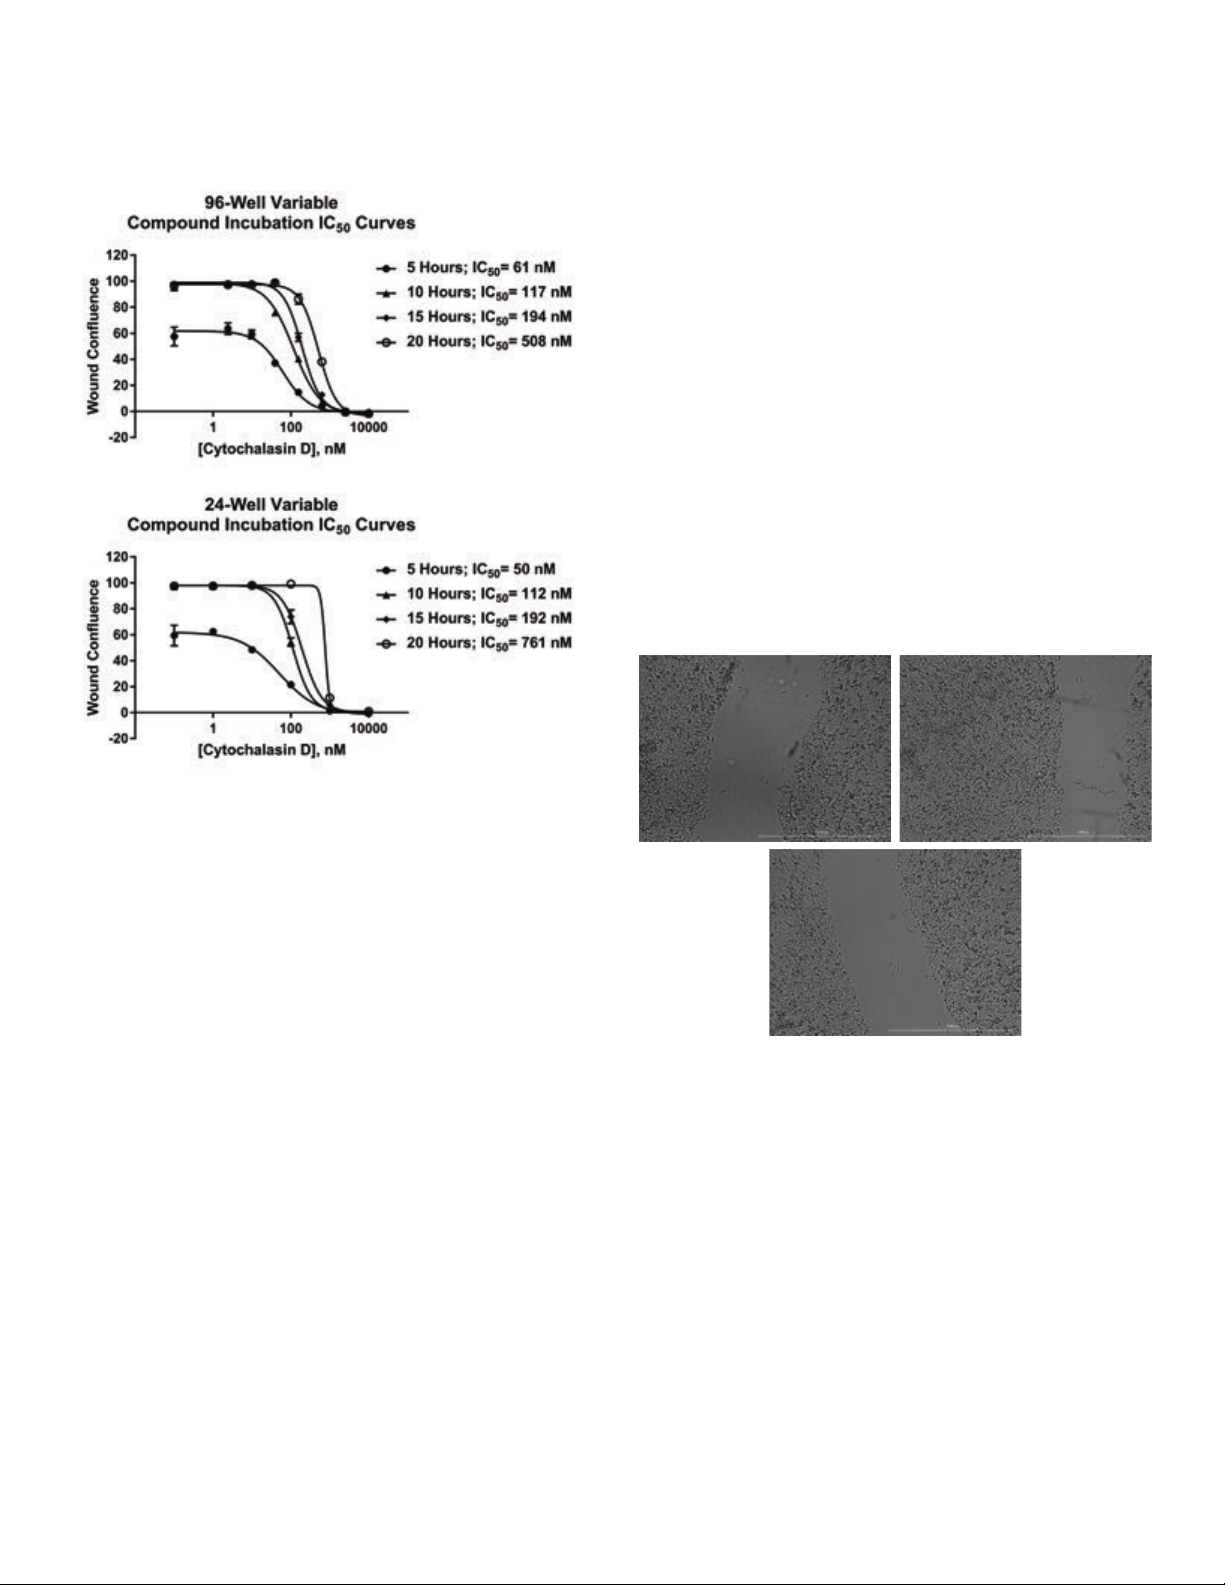
Cell migration inhibition analysis
A
B
A
B
The AutoScratch tool was also used to prepare for a wound
healing inhibition test. Here the automated wounding and
washing procedures were carried out as previously described.
However, in this case, following the third wash aspiration step,
media containing varying concentrations of cytochalasin
D was added to the wells. Twelve replicates of an 8-point
titration were added across the plate in 96-well format, and
four replicates of a 6-point titration were added down the
plate in 24-well format. Test plates were once again added
to the BioSpa 8 and automatically imaged as previously
defined. The kinetic migration curves demonstrate the
consistency achieved amongst replicates within each inhibitor
concentration (Figure7).
Average kinetic curves from each tested concentration were
then plotted on a single graph for data generated in either
96- or 24-well format (Figure 8).
Figure 8. Average kinetic cytochalasin D titration wound confluence graphs.
Average, plus/minus standard deviation plotted for each test cytochalasin D
concentration at every captured timepoint in (A) 96-well; and (B) 24-well plate
formats.
Upon observation of the individual kinetic curves, it is then
possible to see the total effect of the compound titration
over time. The advantage of being able to collect images
over the entire incubation period, and generate kinetic data,
as opposed to performing endpoint imaging at a predecided
Figure 7. Kinetic cytochalasin D titration wound confluence graphs.
(A) 96-well plate containing 12 replicates each of an 8-point titration.
Cytochalasin D titrated from 10,000 nM using serial 1:4 dilutions from rows
AtoG, with row H being no compound negative control. (B) 24-well plate
containing 4 replicates each of a 6-point titration. Cytochalasin D titrated
from 10,000nM using serial 1:10 dilutions from column 1to5, with column 6
being no compound negative control.
upon time, becomes apparent when comparing IC
and values generated from individual incubation periods
(Figure 9).
curves
50
8
Page 9
A
B
Manual scratch wound creation
AB
Wound creation was also carried out manually using a P200
pipette tip in 96-well format to compare results achieved
using a commonly incorporated manual method to those
described previously using the AutoScratch tool.
From the images in Figure 10, the variability within each
created wound is noticeably greater than those made by the
AutoScratch. Images in Figures 10A and 10B show wounds
having greater widths at the top of the image, while being
visibly smaller towards the bottom of the image. Even when
the wound is of a more consistent width down the image
(Figure 10C), the lack of verticality can also skew generated
results. This is apparent from the %CV calculated using Gen5
generated wound widths from 48 wells where wounds were
manually created. The final value of 9.2% is greater than 4x
that seen when using the AutoScratch to create wounds in a
96-well plate (2.1%) and greater than 6x that seen when using
the AutoScratch to create wounds in a 24-well plate.
Figure 9. Variable incubation cytochalasin D dose response graphs. Dose
response curves and generated IC
cells with cytochalasin D for 5, 10, 15, or 20 hours in (A) 96-well; and
(B) 24-well plate formats.
values following incubation of HT-1080
50
From the 5-hour incubation dose response curves generated
from experiments run in either 96- or 24-well format, it
is obvious that cell migration is incomplete in negative
control and low compound treatment wells. Therefore
calculated IC
values would not properly reflect the ability
50
of the compound to inhibit cell migration. By increasing
the incubation period by an additional five hours it is then
apparent that wells containing little or no compound achieve
total wound closure. Complete inhibition is also attained with
the highest concentrations, yielding a full dose response and
more accurate IC
period, equivalent dose response curves and IC
also seen. However, if the cells are allowed to migrate for
20 hours, dose response curve shapes change dramatically
and IC
values increase 2.5to3.5x over those seen from
50
value. When using a 15-hour incubation
50
values are
50
the 10- and 15-hour incubation periods. By using the
information from the complete data set, a proper incubation
period of 10to15 hours can then be decided upon for
futureexperiments.
C
Figure 10. Images captured from a 96-well plate immediately following
wound creation with a P200 pipette tip using the high contrast brightfield
imaging channel and a 4x objective.
The difference in data quality between plates containing
wounds created manually and with the AutoScratch is further
illustrated upon view of cytochalasin D dose response curves
(Figure 11) generated from kinetic cell migration data.
9
Page 10

Figure 11. Manual and Agilent BioTek AutoScratch cytochalasin D dose
AB
response graphs. Dose response curves and generated IC
incubation of HT-1080 cells with cy tochalasin D for 10 hours in 96-well plates
scratched manually or with the AutoScratch tool.
values following
50
C D
When using the same compound incubation period, the
curve shape lacks the sigmoidal dose response seen with
AutoScratch created wounds and the IC
value is 5x greater,
50
which could lead to false assumptions being made regarding
the potency of the test molecule when incorporating a manual
wounding process.
AutoScratch wound creation using variable size
cellmodels
As a wide variety of cell models are incorporated into 2D
scratch wound healing assays, the AutoScratch tool was also
used to create wounds using primary fibroblasts and U-87
glioblastoma cells, which have a larger size and different plate
attachment pattern compared to HT-1080 cells. Because
the Cytation 5 can capture images using both high contrast
brightfield and fluorescence, the fibroblasts, which express
RFP, and the U-87 cells, which express GFP, could be captured
using the high contrast brightfield and either RFP or GFP
signal from the cells in a single imaging step (Figure 12).
Figure 12. High contrast brightfield and fluorescent images of primary
fibroblasts and U-87 glioblastoma cells. (A) High contrast brightfield; and
(B) RFP images of RFP expressing primary fibroblasts. (C) High contrast
brightfield; and (D) GFP images of GFP expressing U-87 cells.
Percent CV values calculated from wound widths generated
at time 0 using high contrast brightfield images across
96wells for fibroblasts (3.2%), and across 24 wells for U-87
cells (2.6%) demonstrate that the AutoScratch tool can create
consistent wounds in each well despite the irregular shape of
the cell models.
The similarity in the kinetic wound healing inhibition curves
following cytochalasin D treatment of the fibroblasts or U-87
cells (Figure 13), compared to the curves seen in Figure 8
using HT-1080 cells also proves that Gen5 cellular analysis
metrics can place accurate object masks around cells of
varying size and shape.
10
Page 11

A
B
Figure 13. Average fibroblast and U -87 kinetic cytochalasin D titration
wound confluence graphs. Average, plus/minus standard deviation plotted
for each test cy tochalasin D concentration at every captured timepoint with
(A)primar y fibroblasts; or (B) U-87 cells.
Conclusion
The Agilent BioTek AutoScratch wound making tool creates
consistent wounds in an automated fashion in both 96- and
24-well plate formats. The disinfection and sterilization
procedure before and after wounding, in addition to cell
removal between columns, simplifies cleaning of the tool and
also prevents carryover of cells from column to column. When
compared to results generated from plates with wounds
created manually, initial wound widths and kinetic values
show improved reproducibility and increased robustness. The
combination of the automated wound creation procedure,
kinetic imaging, and Agilent BioTek Gen5 cellular analysis
method creates an easy to use, dependable process to
carryout wound healingassays.
References
1. Li, L. et al. Collective Cell Migration: Implications for
Wound Healing and Cancer Invasion. Burns Trauma,
2013, 1(1), 21–26.
2. Poujade, M. et al. Collective Migration of an Epithelial
Monolayer in Response to a Model Wound. Proc. Natl.
Acad. Sci., 2007, 104(41), 15988–93.
3. Giampieri, S. et al. Localized and Reversible TGFbeta
Signalling Switches Breast Cancer Cells from Cohesive to
Single Cell Motility. Nat. Cell Biol., 2009, 11(11), 1287–96.
4. Friedl, P.; Hegerfeldt, Y.; Tusch, M. Collective Cell Migration
in Morphogenesis and Cancer. Int. J. Dev. Biol., 2004,
48(5-6), 441–9.
www.agilent.com/lifesciences/biotek
For Research Use Only. Not for use in diagnostic procedures.
RA44216.561724537
This information is subject to change without notice.
© Agilent Technologies, Inc. 2018, 2021
Printed in the USA, April 1, 2021
5994-2585EN
AN100118_10
 Loading...