

Page 1

Aria Real-Time PCR
Software
Always make sure you are using the most recent version of the Aria software. Check the
Aria software download website at www.agilent.com/en/ariamx-software-download.
User Manual
Revision H0, March 2021
AriaMx: For Research Use Only. Not for use in
diagnostic procedures.
AriaDx: For In Vitro Diagnostic Use
Agilent Technologies
Page 2

1 Getting Started with the Aria Software 14
The Aria software 15
Getting Started with the Aria Software 16
Introduction to the Aria software 16
Overview of the user interface 18
Home screen 18
Menu toolbar 18
Tabs 18
Left and right panels 18
Home/Notifications/Help icons 19
Getting Started screen 19
Experiment Notes / Project Notes 19
Help access for the Aria software 20
Help system 20
Sample experiments 21
2 Specifying Hardware and Software Settings 22
Update instrument optics 23
Change the default crosstalk correction settings 25
Set software preferences 28
Set default file name configuration 28
Create and apply analysis templates 29
3 Performing Hardware and Software Tests and HRM Calibrations 32
Run an instrument qualification test 33
Run the test 33
About the Qualification Test graphical data 34
Perform an Installation Qualification test 36
Run an HRM calibration plate (HCP) 38
Prepare the plate 38
Agilent Aria Real-Time PCR Program 2
Page 3

Run an HCP 39
If the HCP fails 40
4 Creating/Opening an Experiment 42
Overview of the Getting Started screen 43
Tools available on the Getting Started screen 44
About the Aria file types 45
Quick Start Protocol 46
How to create, set up, run, analyze, and generate reports for an experiment 46
Create a new experiment 49
Create an experiment based on experiment type 49
Create an experiment from a template 50
Create an experiment from a LIMS data file 51
Open an existing experiment 53
Save a copy of an existing experiment 54
Create a template from an existing experiment 55
Convert an experiment to a new experiment type 56
5 Selecting an Experiment Type 58
Overview of Experiment Types 59
Quantitative PCR 59
Comparative Quantitation 59
Allele Discrimination - Fluorescence Probes 60
Allele Discrimination - DNA Binding Dye with High-Resolution Melt 60
User Defined 60
The Quantitative PCR Experiment Type 61
Multiplexing quantitative PCR experiments 61
Well types for Quantitative PCR experiments 62
The Comparative Quantitation Experiment Type 63
Normalizing chance variations in target levels 63
3 Agilent Aria Real-Time PCR Program
Page 4

Determining amplification efficiencies for the targets of interest and normalizer targets 64
Including biological replicates in comparative quantitation 65
Well types for Comparative Quantitation experiments 66
The Allele Discrimination - DNA Binding Dye Experiment Type 67
About HRM calibration plates 67
Well types for Allele Discrimination - DNA Binding Dye experiments 68
The Allele Discrimination - Fluorescence Probe Experiment Type 69
Well types for Allele Discrimination - Fluorescence Probe experiments 70
The User Defined Experiment Type 71
6 Setting Up the Plate 72
Overview of the Plate Setup screen 73
The plate map 74
Well type 74
Well name / Sample name 74
Target information 75
Replicate number 75
Reference dye 75
The Properties panel 76
Additional tools for setting up a plate 76
Import a plate setup 78
Select and view wells in the plate map 79
Select wells in the plate map 79
Unselect wells in the plate map 80
View details of a well or wells 80
Export the plate map image 85
Assign plate properties for a Quantitative PCR DNA Binding Dye experiment 86
Assign well types 86
Assign well names 86
Assign dyes/targets 88
Select a reference dye 89
Agilent Aria Real-Time PCR Program 4
Page 5

Assign replicates 90
Assign quantities to Standard wells 92
Assign plate properties for a Quantitative PCR Fluorescence Probe experiment 94
Assign well types 94
Assign well names 94
Assign dyes/targets 96
Select a reference dye 97
Assign replicates 98
Assign quantities to Standard wells 100
Assign plate properties for a Comparative Quantitation experiment 102
Assign well types 102
Assign well names 103
Assign sample names and biological replicates 104
Assign dyes/targets 107
Select a reference dye 108
Designate the normalizer 108
Assign replicates 109
Assign quantities to Standard wells 111
Assign plate properties for an Allele Discrimination DNA Binding Dye experiment 113
Assign well types 113
Assign well names 113
Assign sample names 115
Assign dyes/targets 117
Select a reference dye 118
Assign replicates 119
Assign plate properties for an Allele Discrimination Fluorescence Probe experiment 122
Assign well types 122
Assign well names 122
Assign sample names 124
Assign dyes/targets 126
Select a reference dye 127
Assign Alleles 128
5 Agilent Aria Real-Time PCR Program
Page 6

Assign replicates 128
Assign plate properties for a User Defined experiment 131
Assign well types 131
Assign well names 131
Assign sample names and biological replicates 133
Assign dyes/targets 135
Select a reference dye 137
Designate the normalizer 137
Assign Alleles 138
Assign replicates 138
Assign quantities to Standard wells 141
7 Setting Up the Thermal Profile 142
Set up the thermal profile 143
Elements of a Thermal Profile 144
Import a thermal profile 146
Edit the thermal profile 147
Export the thermal profile image 159
8 Running and Monitoring Experiments 160
Overview of the Instrument Explorer dialog box 161
Add instruments to your network 162
Add a new instrument based on its IP address 162
Add a new instrument based on its port number 163
View information about an instrument 163
Start, stop, or pause a run 165
Start a run 165
Cancel a run 166
Pause a run 167
Monitor a run 168
Connect to the running instrument 168
Agilent Aria Real-Time PCR Program 6
Page 7

Monitor a run by viewing its progress through the thermal profile 169
Monitor a run by viewing the raw data plots 169
Change the display options for the raw data plots 170
Stop monitoring a run 172
Retrieve run data from the instrument 173
Retrieve data through the network 173
Retrieve data using a USB drive 174
Export instrument data to a CSV file 175
Export instrument data by column 175
Export instrument data by target 175
Export instrument data by wells 175
9 Setting Analysis Criteria 176
Overview of the Analysis Criteria screen 177
Toggle display of plate map wells 178
Select the wells and well types to include in analysis 179
Select wells for analysis using the plate map 179
Select wells for analysis based on well type 179
Select the targets to include in analysis 180
Select which data collection points to analyze 181
Choose a treatment for replicate wells 182
Assign an HRM calibration plate 183
Assign an HCP for new experiments 183
Assign an HCP using the HCP icon 184
10 Viewing Graphical Displays of the Results 186
Overview of the Graphical Displays screen 187
Graphs 187
Result table 188
Display options 188
7 Agilent Aria Real-Time PCR Program
Page 8

Zooming 190
Configure and apply analysis templates 192
Configure an analysis template in the Analysis Term Settings dialog box 193
View the Amplification Plots 197
View data for a single data point 197
Select a fluorescence data type 198
Specify the use of smoothing 198
Adjust the graph properties 199
Adjust the baseline correction settings 199
Adjust the crosstalk correction settings 201
Select the scale (linear or log) of the Y-axis 206
Manually adjust threshold fluorescence values 207
Adjust threshold fluorescence values by altering the algorithm settings 209
Lock or unlock the threshold fluorescence values 210
View the Melt Curve - Raw/Derivative Curve 212
About raw/derivative curves 212
View data for a single data point 213
Select a fluorescence data type 213
Adjust the graph properties 214
Specify the use of smoothing 214
Normalize the fluorescence values 214
Adjust the range of the X-axis 215
Adjust product melting temperature settings 216
View the Melt Curve - Difference Plots 218
About difference plots 218
Select a fluorescence data type 220
Assign the control target 220
View data for a single data point 221
Manually assign Unknowns to a genotype call 221
Adjust the graph properties 224
View the Standard Curve 225
Agilent Aria Real-Time PCR Program 8
Page 9

View data for a single data point 225
Select a fluorescence data type 226
View the R-squared values, slopes, and amplification efficiencies 227
Adjust the graph properties 228
Manually adjust threshold fluorescence values 228
Display and adjust confidence intervals 229
View the Relative Quantity 230
About relative quantities 230
Select a fluorescence data type 231
Set the Y-axis scale for the Relative Quantity chart 231
Add error bars to the Relative Quantity chart 232
Adjust the graph properties 232
Select the algorithm method 232
Enter the amplification efficiencies for the targets 233
View the Allele Determination graph 235
View data for a single data point 235
Select data type and fluorescence type to display 236
Display genotype groups on the graph 237
Adjust the graph properties 238
Adjust the last cycle 238
Rename the genotype groups 239
Customize graph properties 240
Customize graph properties using the short-cut menu 240
Customize graph properties using the Graph Properties dialog box 243
11 Generating Reports and Exporting Results 252
Generate report of results 253
View a preview of the report 253
Select report type 253
Generate the report 253
Configure the report 254
Create or edit report configuration definitions 257
9 Agilent Aria Real-Time PCR Program
Page 10

Export data/results to an Excel, text, LIMS data, or RDML file 260
Configure the file and export data 260
Load a saved data export definition 264
Create or edit data export definitions 265
12 Creating and Setting Up an MEA Project 268
Quick Start Protocol 269
How to create, set up, analyze, and generate reports for a multiple experiment analysis
project 269
Overview of multiple experiment analysis 270
Applications 270
Restrictions 271
Guidelines for Comparing Cq Values Across Experiments 272
Reducing plate-to-plate variability 272
Selecting a method for setting threshold fluorescence levels 273
Create an MEA project 275
Open an existing MEA project 276
Select experiments for a project 277
Add or remove experiments from the project 277
Include or exclude experiments in the project analysis 278
Edit the plate setup of experiments in a project 279
Select an experiment to edit 279
Differentiate between targets across experiments 279
Edit plate properties 280
View the thermal profiles of experiments in a project 281
13 Analyzing Multiple Experiment Analysis Project Results 282
Set analysis criteria for a project 283
Toggle display between one experiment and all experiments 283
Select the wells and well types to include in analysis 283
Select the targets to include in analysis 284
Agilent Aria Real-Time PCR Program 10
Page 11

Select which data collection points to analyze 284
Choose a treatment for replicate wells 285
Overview of the Graphical Displays screen for a project 286
Graphs 286
Result table 287
Display options 287
Zooming 289
Compare amplification plots in a project 291
Compare amplification plots by experiment 291
Compare amplification plots by target 291
Consolidate the amplification plots 292
Compare raw or derivative melt curves in a project 293
Compare raw or derivative melt curves by experiment 293
Compare raw or derivative melt curves by target 294
Consolidate the raw or derivative melt curves 294
Compare standard curves in a project 295
Compare standard curves by experiment 295
Compare standard curves by target 296
Consolidate the standard curves 296
Compare Relative Quantity charts in a project 297
Compare relative quantities by experiment 297
Compare relative quantities by target 298
Consolidate the relative quantities 298
Compare Allele Determination graphs in a project 299
14 Generating Multiple Experiment Analysis Reports and Exporting Results 300
Generate report of MEA project results 301
View a preview of the report 301
Select report type 301
Generate the report 301
Configure the report 302
11 Agilent Aria Real-Time PCR Program
Page 12

Create or edit report configuration definitions 305
Export MEA data/results to an Excel, text, or LIMS data file 308
Configure the file and export data 308
Load a saved data export definition 311
Create or edit data export definitions 312
15 “How-To” Examples for Multiple Experiment Analysis Projects 314
Example 1 315
How to find the initial template quantity of a target in an unknown sample using a standard curve
from a separate experiment 315
Example 2 317
How to normalize target quantities in Unknown and Calibrator wells using a normalizer target from a
separate experiment 317
16 Help for the Aria ET (Electronic Tracking) Software 320
Overview of the Aria ET software 321
Open an experiment in the Aria ET software 323
Open an experiment 323
Import and export experiments in the Aria ET software 326
Import experiments into the database 326
Export experiments from the database 326
Lock or log out of the Aria ET software 328
Lock the program 328
Log out of the program 328
Change your password in the Aria ET software 330
Create a multiple experiment analysis project in the Aria ET software 331
Manage users in the Aria ET software 332
Set account properties for all users 332
Manage user accounts 335
Archive and restore experiments in the Aria ET software 339
Agilent Aria Real-Time PCR Program 12
Page 13

Archive experiments 339
Restore experiments 341
View audit trails and system logs in the Aria ET software 343
View the audit trail logs 343
View the system logs 346
Add and remove databases in the Aria ET software 348
Add an Aria ET database 349
Remove an Aria ET database 350
View transaction logs in the Aria ET software 352
View transaction logs for primary database 352
View transaction logs for an archive database 353
17 Reference Help and Troubleshooting & Support 354
QPCR Glossary 355
Experiment Type and QPCR Detection Chemistry Terms 355
Well-Types 357
Analysis Terms 358
LIMS File Format for Aria Software 361
Plate Setup 361
Experiment Setup 363
Thermal Profile 363
Default Optical Module 364
Threshold Fluorescence 364
Trademarks 366
Troubleshooting and Support 367
Troubleshooting Guide
Contact Agilent Technical Support 370
13 Agilent Aria Real-Time PCR Program
Page 14

1
Getting Started with the Aria Software
The Aria software 15 Getting Started with the Aria Software 16
Introduction to the Aria software 16
Overview of the user interface 18
Home screen 18
Menu toolbar 18
Tabs 18
Left and right panels 18
Home/Notifications/Help icons 19
Getting Started screen 19
Experiment Notes / Project Notes 19
Help access for the Aria software 20
Help system 20
Sample experiments 21
Agilent Technologies
Page 15

1 Getting Started with the Aria Software
The Aria software
The Aria software
The Aria software features a variety of experiment type options with
customized plate and thermal profile setup, and experiment analysis
screens that streamline the process of collecting and analyzing data for
specific applications. The software capabilities allow you to:
• Quickly set up an experiment using a template or the Import Plate
Setup function
• View raw fluorescence data without mathematical correction or
calibration factors
• Quantitate the initial template quantity of a DNA target based on a
standard curve
• Generate and display normalized relative quantity values on a log(2)
fold change chart to assess the effects of an experimental treatment on
gene expression levels
• Export any data set directly to Microsoft Excel or to a text file
• View and analyze the data from several experiments together in a single
project using the multiple experiment analysis functions
• Use high resolution melt analysis for SNP genotyping in an Allele
Discrimination experiment
15 Agilent Aria Real-Time PCR Program
Page 16
Getting Started with the Aria Software
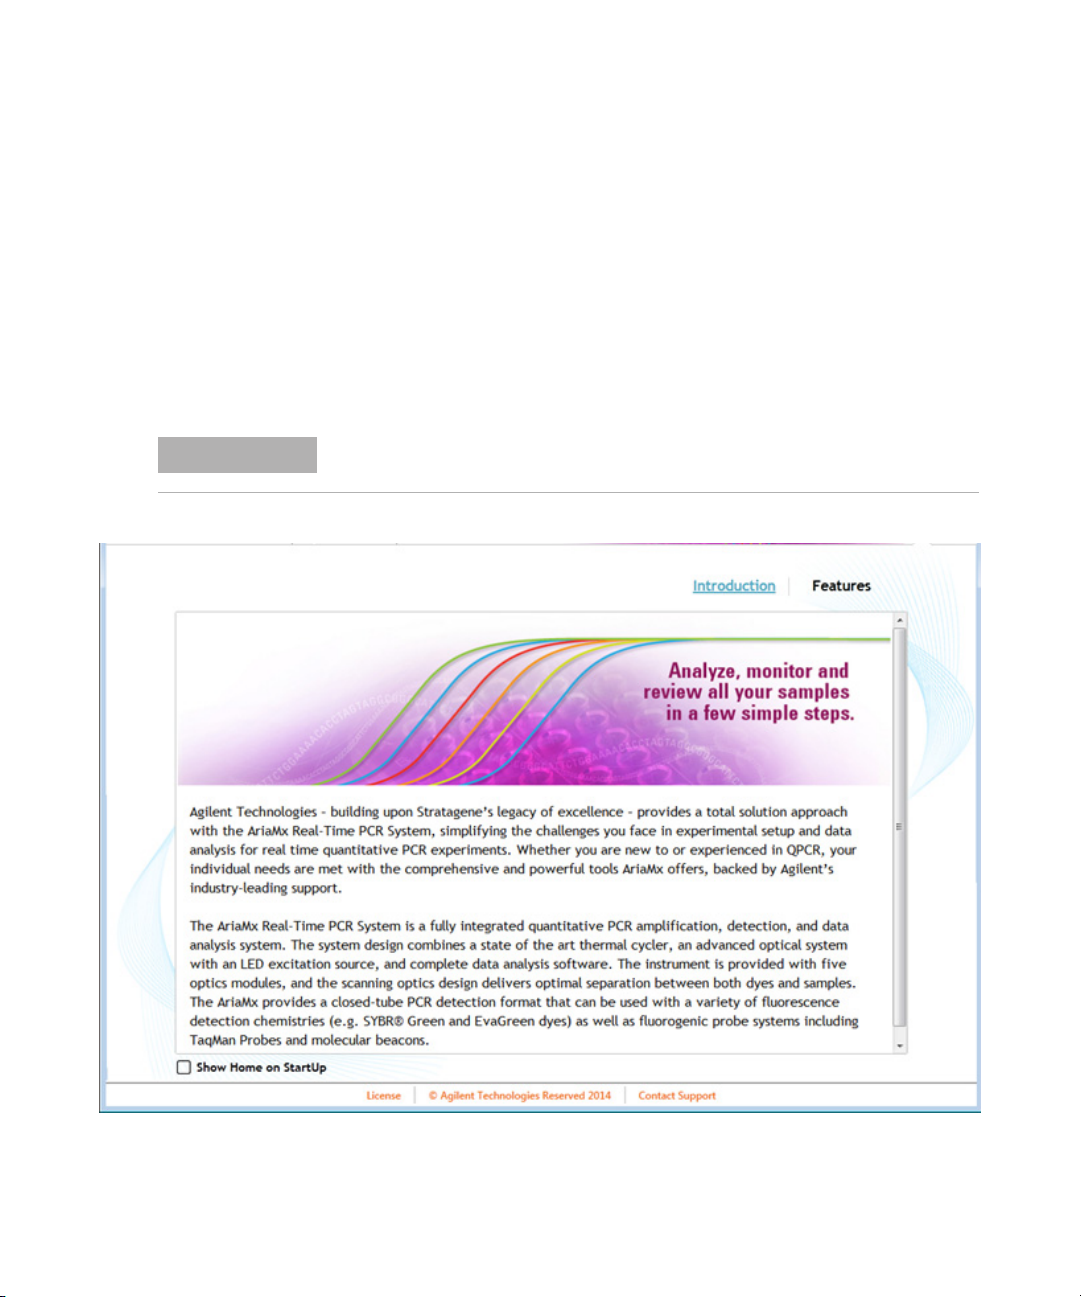
Introduction to the Aria software
The software's Home screen provides an introduction to the program and
a list of program features.
To open the Home screen: Click the Home icon near the upper right
corner of the program window.
Getting Started with the Aria Software 1
Getting Started with the Aria Software
NOTE
NOTE
If you want the program to open to the Home screen, mark the check box near the
bottom of the screen labeled Show Home on StartUp.
Agilent Aria Real-Time PCR Program 16
Page 17

1 Getting Started with the Aria Software
Getting Started with the Aria Software
Introduction
To view the Introduction, click Introduction (near the top right corner of
the Home screen). The text on this screen provides an overview of the
AriaMx/AriaDx Real- Time PCR System.
Features
To view the Features, click Features (near the top right corner of the
Home screen). The text on this screen lists the features of the Aria
software.
Minimum PC requirements
Table 1 lists the minimum PC requirements needed to run the Aria
software.
Table 1 Minimum requirements for running the Aria software
Operating system Windows 10 – with regional format set to English (United States)
Supported architectures ×64 (64 bit)
Programs* Microsoft .NET Framework 4.0
Microsoft SQL Server 2012 (required for ET software only)
Runtime components of Microsoft Visual C++ 2010 Libraries
Processor 2 GHz Dual Core Processor
Working memory (RAM) 2 GB (more is recommended)
Hard disk space 40 GB
Display resolution 1024 × 768 (1280 × 1024 is recommended)
* Installers for Microsoft .NET Framework 4.0 and Microsoft SQL Server 2012 are provided
on the Aria Software Download page of the Agilent website. If you do not have the needed
Microsoft Visual C++ 2010 components, then the Aria installer will automatically install
them to your PC when you initiate installation of the Aria software.
17 Agilent Aria Real-Time PCR Program
Page 18

Overview of the user interface
Home screen
The Home screen provides an introduction to the AriaMx/AriaDx system
and a list of program features. See “Introduction to the Aria software” on
page 16 for detailed information on the Home screen.
Menu toolbar
At the top of the program window are the File and Instrument menus.
• The File menu contains commands for opening, closing, saving, and
printing experiments and projects.
• The Instrument menu contains commands for connecting to,
configuring, exporting data from, and testing the AriaMx/AriaDx
instrument.
Getting Started with the Aria Software 1
Overview of the user interface
Tabs
The user interface of the Aria software allows you to open up to 5
experiments at a time (when experiment files are < 1.5 MB), or one
project at a time. The program displays each open experiment or project
on its own tab, enabling you to quickly switch between them. Click the
icon to the right of the tabs to open a new tab. New tabs open to the
Getting Started screen.
Left and right panels
When you are working in an experiment or project, the left side of the
screen displays the Experiment Area panel, and the right side of the
screen displays a panel with tools for the currently open screen (e.g., the
Report Configuration panel is displayed on the Generate Report screen).
You can hide these panels by clicking the arrow icon next to the panel
name. Click the arrow icon again to expand the panel.
Agilent Aria Real-Time PCR Program 18
Page 19

1 Getting Started with the Aria Software
Overview of the user interface
Home/Notifications/Help icons
The top right corner of the program window has 3 icons for quickly
accessing the Home screen, viewing any notifications from the program,
and opening the Aria help system.
- Click this icon to open the Home screen. Click the icon again to close
the Home screen and return to previous screen.
- Click this icon to open a text box displaying any notifications from
the program. When you have unread notifications waiting, the icon is dark
blue.
- Click this icon to open the program's help system to the topic that
pertains to the currently displayed screen.
Getting Started screen
When you open a new tab in the program (from the File menu or the
icon), it opens to the Getting Started screen. From this screen you can
create a new experiment (from scratch or from a template), create a new
multiple experiment analysis project, or open an existing experiment or
project. See “Overview of the Getting Started screen” on page 43 for more
information.
Experiment Notes / Project Notes
The Experiment Notes icon or Project Notes icons appears in the lower
left corner of the screen whenever an experiment or project is open.
Clicking the icon opens the Experiment Notes or Project Notes text box.
Use this text box to type your own notes pertaining to the particular
experiment or project. Click Save to save your notes for later reference.
19 Agilent Aria Real-Time PCR Program
Page 20

Help access for the Aria software
The Aria software contains a help system that provides instructions on
setting up, running, and analyzing experiments and creating multiple
experiment projects. You can also view video tutorials on the Agilent
website that describe how to perform some of the most common tasks in
the program.
Help system
From any screen or dialog box, click the help icon ( ) in the upper
right corner of the screen to open the help system. The help system
automatically opens to the most relevant topic based on where you are in
the program.
You can navigate the help system window from the Contents tab or the
Search tab.
• On the Contents tab, use the table of contents on the left side of the
window to browse the chapters and topics within the help system.
• On the Search tab, type a search word into the field and click GO to
find the help topics that contain the word. If you type multiple words
into the field, the program will list help topics that contain all of the
words. Use quotes to search for a complete phrase (e.g., “comparative
quantitation”). You can also use the Boolean operators AND and OR to
find topics that contain more than one search word (e.g., comparative
AND quantitation), or topics that contain any one of multiple search
words (e.g., comparative OR quantitation).
Getting Started with the Aria Software 1
Help access for the Aria software
The help system contains the following chapters:
• Getting Started with the Aria Software- Contains help topics to
familiarize new users with the program and provide instructions for
getting started
• How- To Help - Provides step- by- step instructions on how to use the
program
• Reference Help - Contains trademark designations and a glossary of
QPCR terms
• Troubleshooting and Support - Contains troubleshooting suggestions
and a directory for contacting a technical support person in your region
Agilent Aria Real-Time PCR Program 20
Page 21

1 Getting Started with the Aria Software
Help access for the Aria software
Sample experiments
The Aria software comes with several sample experiment files that include
post- run data. The sample experiments are saved to the folder
C:\Users\Public\Public Documents\Agilent Aria\Sample Experiments
during installation of the software. The folder includes a sample
experiment for each experiment type and subtype for both the AriaMx
(*.amxd) and AriaDx (*.adxd) software modes. You open the sample
experiments in the Aria software to help familiarize yourself with the
experimental setup and graphical displays available for each experiment
type.
21 Agilent Aria Real-Time PCR Program
Page 22

2
Specifying Hardware and Software
Settings
Update instrument optics 23
Change the default crosstalk correction settings 25
Set software preferences 28
Agilent Technologies
Page 23
2 Specifying Hardware and Software Settings
Update instrument optics
Update instrument optics
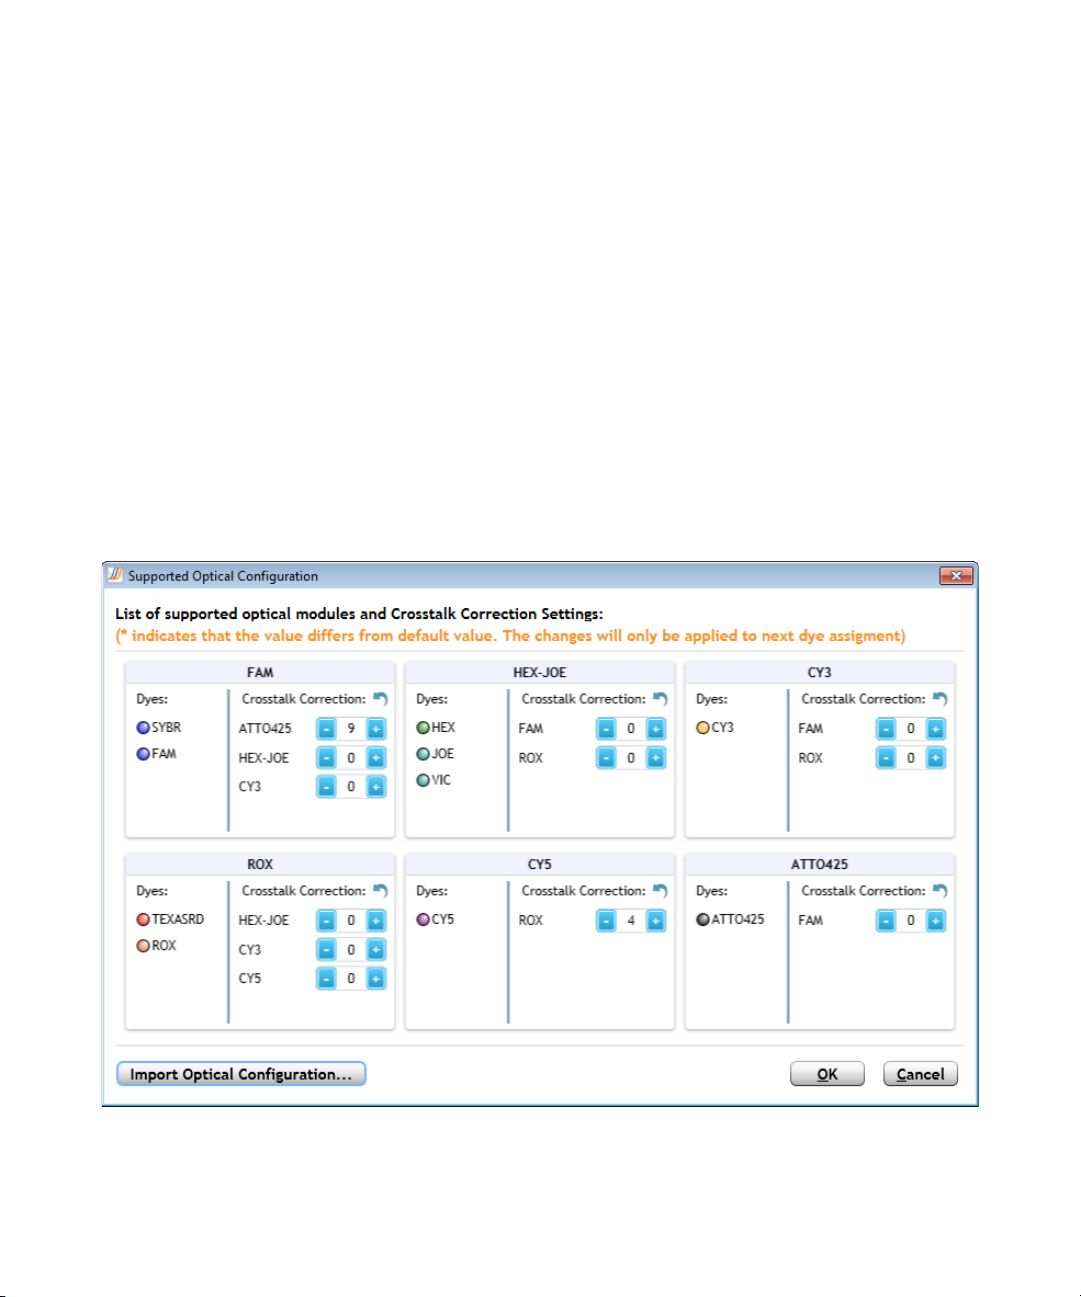
Multiple optical modules are available for use with the AriaMx/AriaDx
instrument for detection of different dye spectra. In the Supported Optical
Configuration dialog box, you can view the optical modules, their currently
supported dyes, and the crosstalk correction settings for non- target dyes
that could be detected by each module.
Periodically, Agilent may add new supported dyes and optical modules to
the AriaMx/AriaDx Real- Time PCR System, and make a new optics
configuration file available to you. You can use the Supported Optical
Configuration dialog box to load that new file.
To open the Supported Optical Configuration dialog box: At the top of
the program window, click Instrument > Optical Configuration.
23 Agilent Aria Real-Time PCR Program
Page 24

Specifying Hardware and Software Settings 2
Update instrument optics
To update the optical configuration file:
1 Open the Supported Optical Configuration dialog box.
2 Click Import Optical Configuration.
The Open dialog box opens.
3 Browse to the folder of the configuration file that you received from
Agilent. Select the file and click Open. The Supported Optical
Configuration dialog box is updated with the new configuration.
Agilent Aria Real-Time PCR Program 24
Page 25
2 Specifying Hardware and Software Settings
Change the default crosstalk correction settings
Change the default crosstalk correction settings
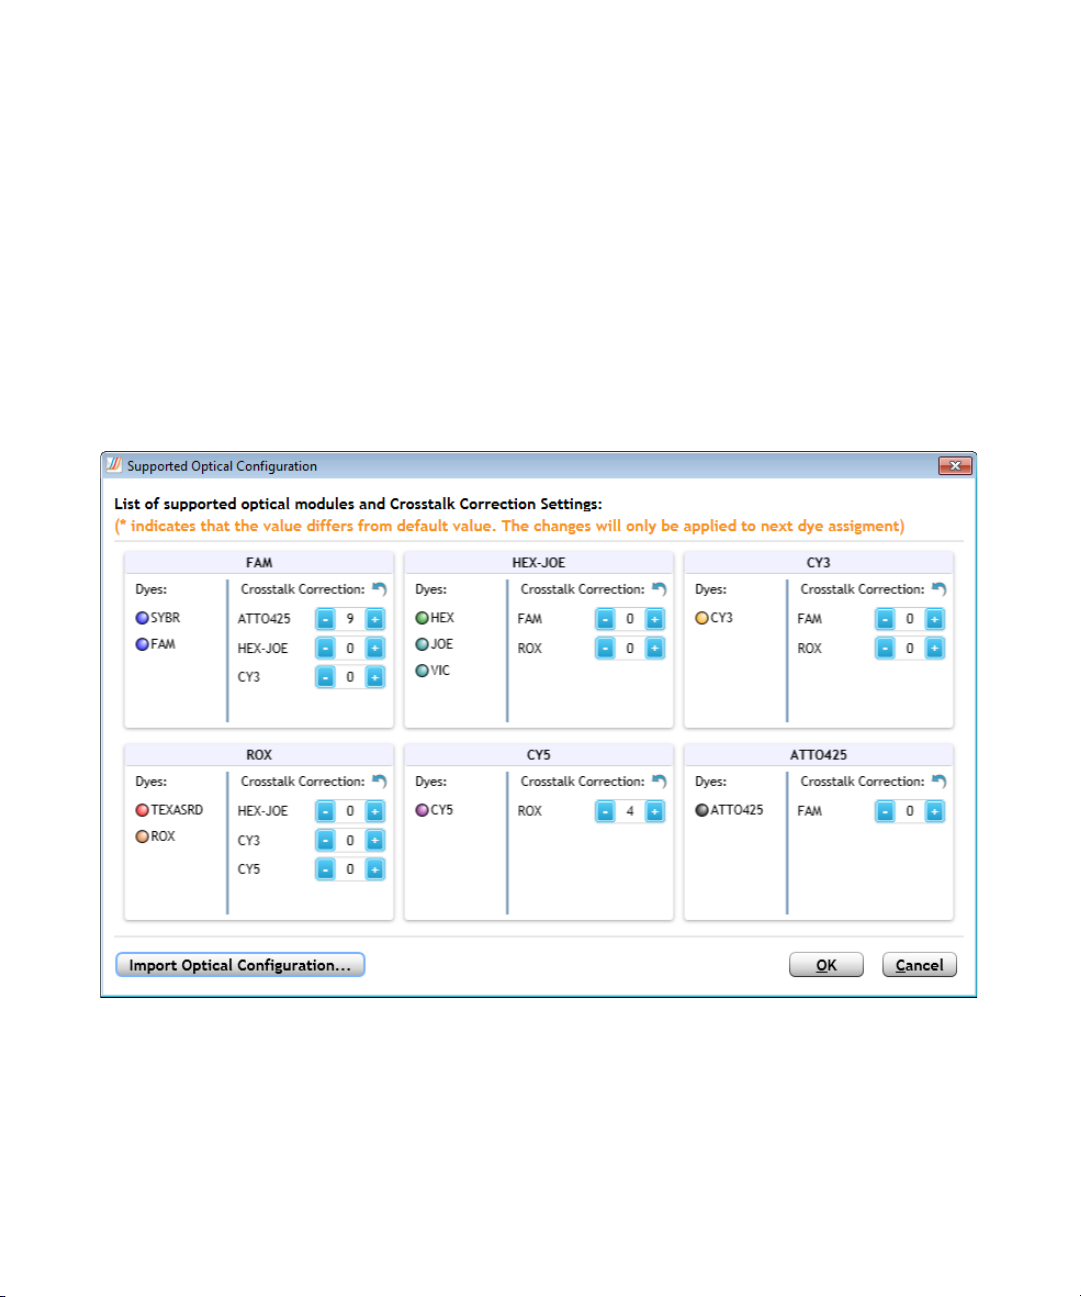
Multiple optical modules are available for use with the AriaMx/AriaDx
instrument for detection of different dye spectra. In the Supported Optical
Configuration dialog box, you can view the optical modules and their
currently supported dyes, and change the crosstalk correction settings for
non- target dyes that could be detected by each module.
To open the Supported Optical Configuration dialog box: At the top of
the program window, click Instrument > Optical Configuration.
Crosstalk occurs when emission from one dye is detected by two different
optical modules (the target optical module and the spillover optical
module). A dye is at risk for crosstalk when its emission spectra overlaps
that of another dye that is assigned to a different optical module. The
Aria software includes crosstalk correction settings, which can help
compensate for crosstalk.
25 Agilent Aria Real-Time PCR Program
Page 26
Specifying Hardware and Software Settings 2
Change the default crosstalk correction settings
The factory settings for crosstalk correction are the default settings, unless
the default settings are changed in the Supported Optical Configuration
dialog box. Once changed, the new default crosstalk correction settings are
applied to all experiments going forward. Alternatively, you can adjust the
crosstalk correction settings for an individual post- run experiment using
the tools in the Amplification Plots graph. See “Adjust the crosstalk
correction settings” on page 201 for instructions.
NOTE
The factory settings for crosstalk correction have been optimized to eliminate
potential crosstalk for dyes that are part of the default optical configuration.
Agilent does not recommend changing the crosstalk correction settings unless
you are using a new custom dye and the emission wavelength of that dye could be
detected by more than one optical module in the instrument.
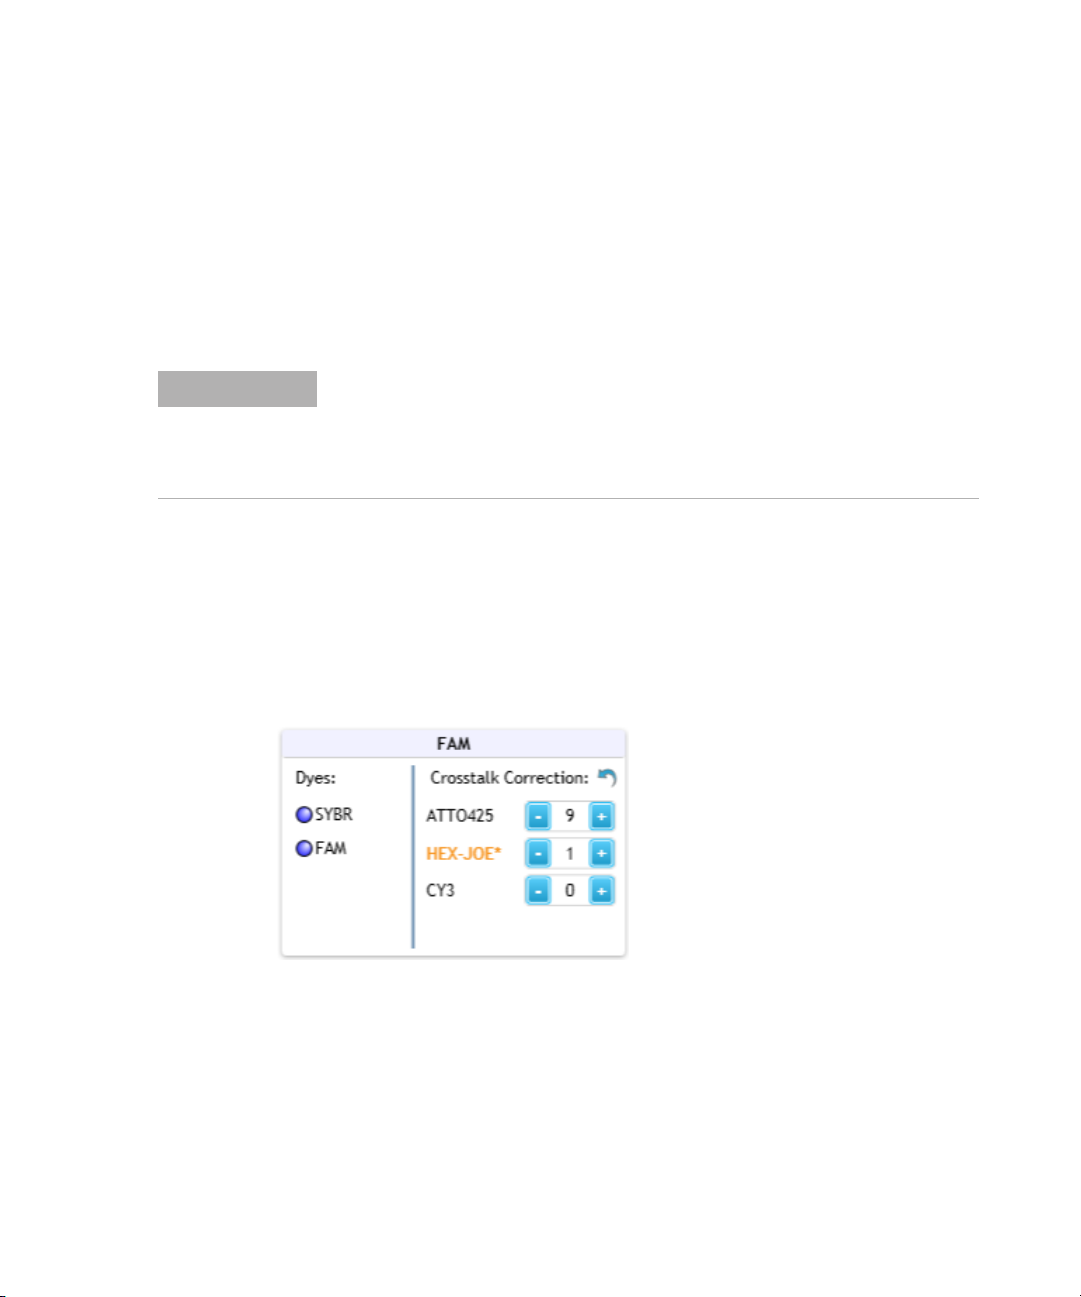
To change the default crosstalk correction settings:
1 In the Supported Optical Configuration dialog box, locate the box for
the optical module that is or could be reporting crosstalk fluorescence
(i.e., the spillover optical module). The dyes that have the potential to
crosstalk with that optical module are listed in that box (e.g., the
HEX- JOE dye in the FAM optical module).
2 Change the crosstalk correction setting for the dye by adjusting the
value in the field.
The values in these fields are percentages of the total raw fluorescence.
They will be subtracted from the raw fluorescence signal for the optical
module when that dye is used as a target.
Crosstalk correction values that differ from the factory settings are
noted with an asterisk (*).
Agilent Aria Real-Time PCR Program 26
Page 27

2 Specifying Hardware and Software Settings
Change the default crosstalk correction settings
3 Click OK to apply your changes and close the dialog box.
To reset the crosstalk correction settings back to the factory settings:
1 In the Supported Optical Configuration dialog box, locate the box for
the optical module that you want to reset.
Crosstalk correction values that differ from the factory settings are
noted with an asterisk (*).
2 Within that box, click the reset icon next to Crosstalk Correction.
The crosstalk correction values for all dyes listed in the box are reset to
the factory values.
3 Click OK to apply your changes and close the dialog box.
NOTE
The Supported Optical Configuration dialog box does not include crosstalk
correction settings between the HEX-JOE and Cy3 optical modules because the
degree of crosstalk is too significant to be adequately corrected. Agilent does not
recommend using HEX-JOE and Cy3 together in a multiplex reaction.
27 Agilent Aria Real-Time PCR Program
Page 28
Set software preferences
The Preferences dialog box is used for setting your preference on the
default file name configuration and for creating and selecting analysis
templates.
To open the Preferences dialog box: At the top of the program window,
click File > Preferences.
Set default file name configuration
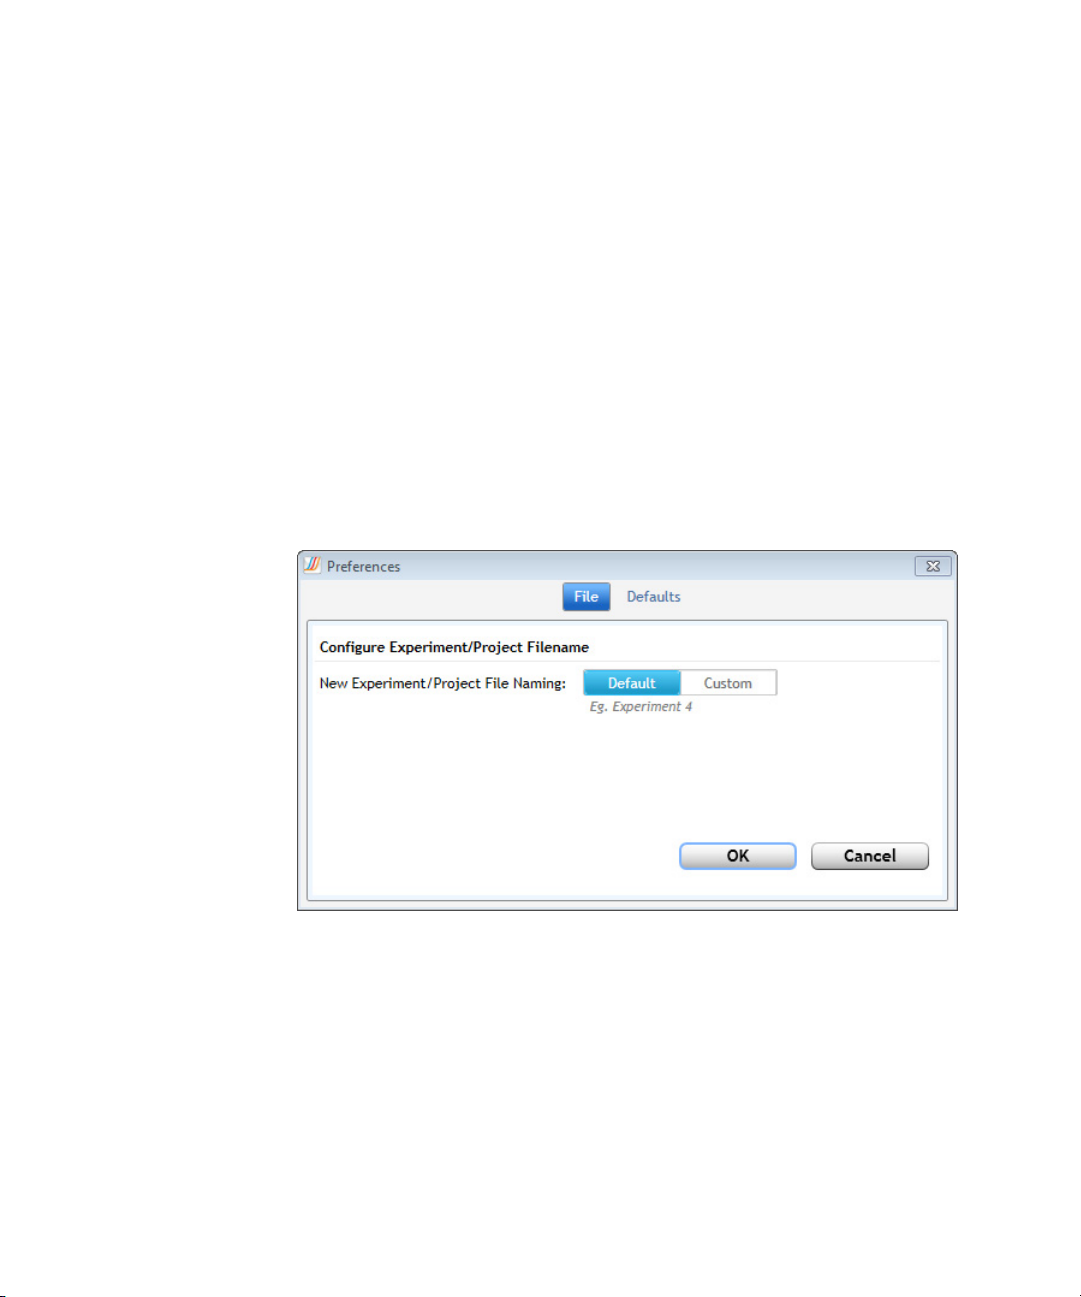
To configure the default file name for experiments and projects:
1 In the Preferences dialog box, make sure File is selected at the top.
Specifying Hardware and Software Settings 2
Set software preferences
2 Next to New Experiment/Project File Naming, click one of the
following options:
• Default - Select this option to use the program's default file naming
system. For experiments, the default file name is “Experiment”
followed by the next available number (e.g., “Experiment 3"). For
projects, the default file name is “Project” followed by the next
available number (e.g., “Project 3").
Agilent Aria Real-Time PCR Program 28
Page 29
2 Specifying Hardware and Software Settings
Set software preferences
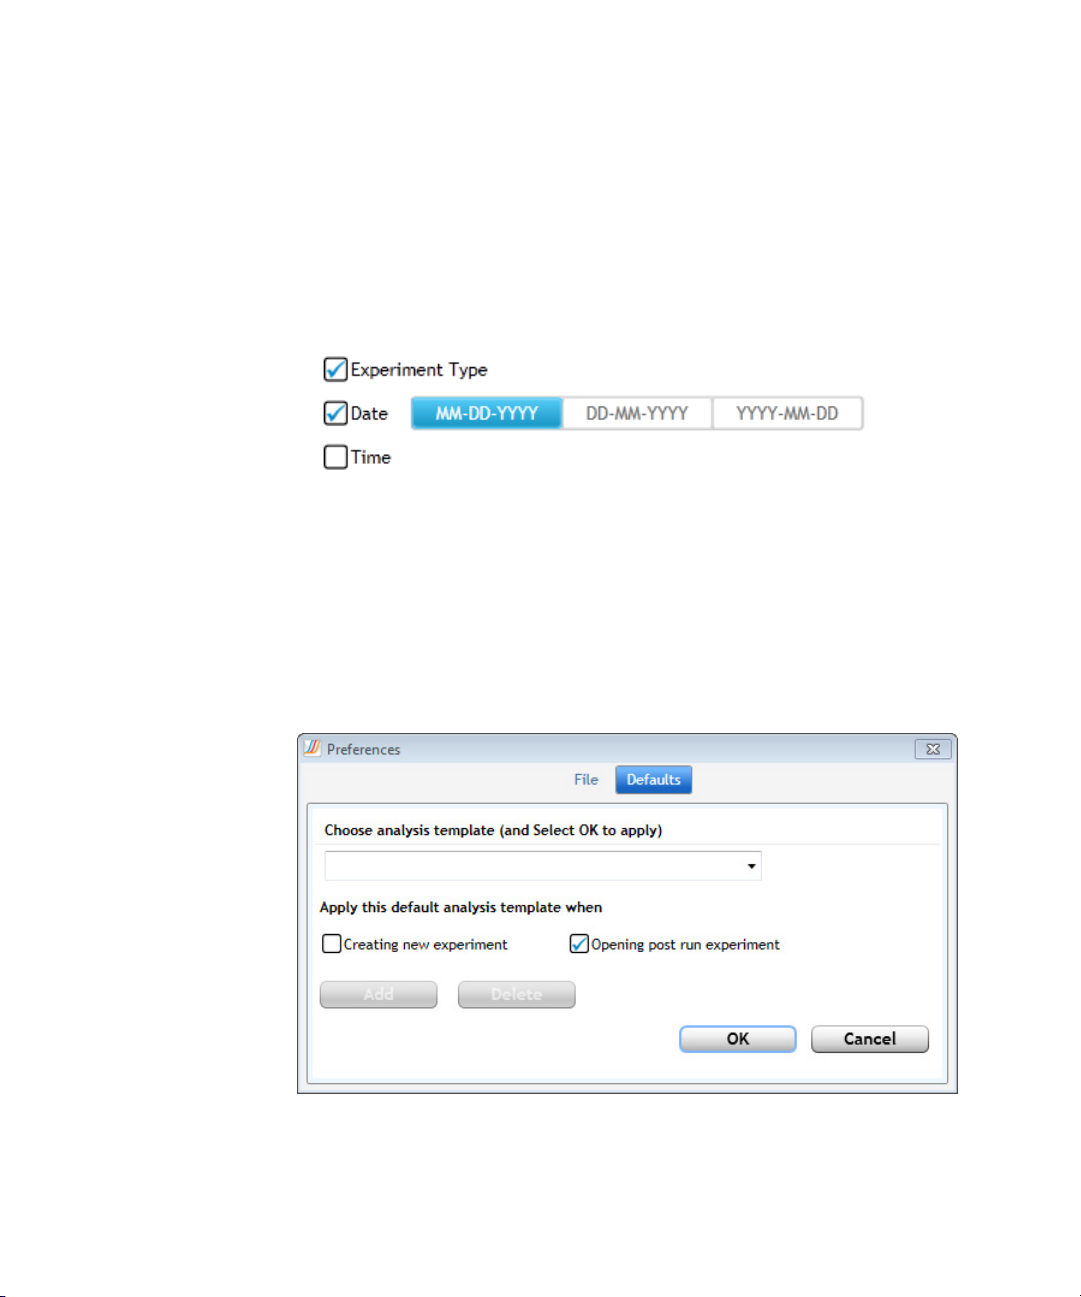
• Custom - Select this option to configure your own file naming
system by selecting which pieces of information to include in the
default file name. Using the check boxes, you can select to include
the experiment type, the creation date for the experiment or project
(in format MM- DD- YYYY, DD- MM- YYYY, or YYYY- MM- DD), and the
time that the experiment or project was created.
3 Click OK to close the dialog box and save your changes.
Create and apply analysis templates
To create an analysis template that sets the default analysis settings for
experiments:
1 In the Preferences dialog box, select Defaults at the top.
2 Type a name for the new template into the field below Choose analysis
template (and Select OK to apply).
29 Agilent Aria Real-Time PCR Program
Page 30
Specifying Hardware and Software Settings 2
Set software preferences
3 Select when to apply the analysis template using the check boxes. You
can mark one check box, both check boxes, or neither check box.
• Mark Creating new experiment if you want to apply the analysis
template to all newly created experiments going forward.
• Mark Opening post run experiment if you want to apply the
analysis template anytime a post run experiment is opened in the
program.
• Clear both check boxes if you do not want the analysis template to
be automatically applied to experiments.
4 Click Add.
A message box opens asking you to confirm that you want to create the
new template. Click OK to continue.
5 Click OK to close the Preferences dialog box.
The program will apply the template to your experiments according to
the check box selections made in step 3.
Newly created analysis templates have only default analysis settings. See
“Configure and apply analysis templates” on page 192 for instructions
on configuring the analysis settings in the analysis template.
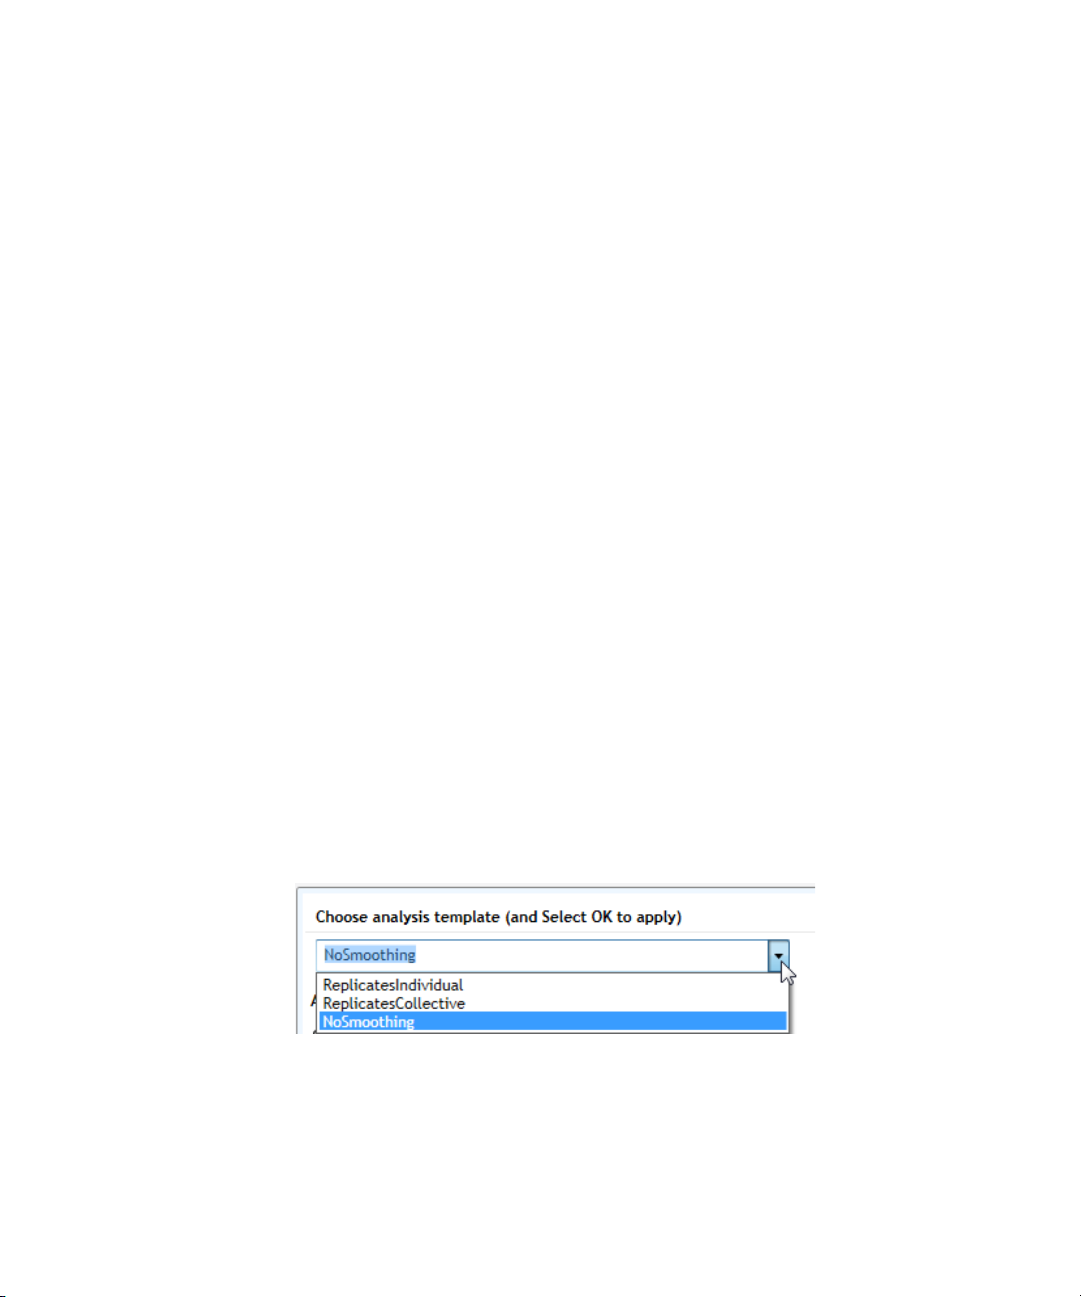
To select an existing analysis template to be applied to experiments:
1 In the Preferences dialog box, select Defaults at the top.
2 In the field below Choose analysis template (and Select OK to apply),
click the arrowhead to expand the drop- down list. The list contains all
of the existing analysis templates.
3 Select a template from the list.
4 Select when to apply the analysis template using the check boxes. You
can mark one check box, both check boxes, or neither check box.
Agilent Aria Real-Time PCR Program 30
Page 31

2 Specifying Hardware and Software Settings
Set software preferences
• Mark Creating new experiment if you want to apply the analysis
template to all newly created experiments going forward.
• Mark Opening post run experiment if you want to apply the
analysis template anytime a post run experiment is opened in the
program.
• Clear both check boxes if you do not want the analysis template to
be automatically applied to experiments.
5 Click OK to close the Preferences dialog box. The program will apply
the template to your experiments according to the check box selections
made in step 3. See “Configure and apply analysis templates” on
page 192 for instructions on configuring the analysis settings in the
analysis template.
To delete an existing analysis template:
1 In the Preferences dialog box, select Defaults at the top.
2 In the field below Choose analysis template (and Select OK to apply),
click the arrowhead to expand the drop- down list. The list contains all
of the existing analysis templates.
3 Select a template from the list.
4 Click Delete.
5 In the message box that opens, click OK to confirm that you want to
delete the selected template.
6 If desired, select a different template from the list, or create a new
template.
7 When finished making changes, click OK to close the Preferences dialog
box.
31 Agilent Aria Real-Time PCR Program
Page 32

3
Performing Hardware and Software Tests and HRM Calibrations
Run an instrument qualification test 33
Run the test 33
About the Qualification Test graphical data 34
Perform an Installation Qualification test 36
Run an HRM calibration plate (HCP) 38
Prepare the plate 38
Run an HCP 39
If the HCP fails 40
Agilent Technologies
Page 33

3 Performing Hardware and Software Tests and HRM Calibrations
Run an instrument qualification test
Run an instrument qualification test
Running a qualification test is one way to test for instrument errors. You
perform the test using a qualification test plate that must be purchased
separately from Agilent (part number 5190- 7708). The wells of the test
plate are pre- filled with the QPCR reagent mixture needed to run the test.
Run the test
Running a qualification test requires preparing the plate, running the
experiment on the AriaMx/AriaDx instrument, and checking the results.
To run a qualification test:
1 Prepare the qualification test plate according to the instructions that
came with the plate.
2 At the top of the program window, click Instrument > Qualification
Test.
A new tab opens for the Qualification Test experiment. The experiment
opens to the Thermal Profile screen.
3 Click Run.
The Instrument Explorer dialog box opens.
4 Locate the instrument that you will be using for the run and click Send
Config.
• If the instrument is not listed, see “Add instruments to your
network” on page 162 for instructions on searching for and adding
instruments.
• If this is the first time you have connected to an instrument since
last launching the Aria software, the Login dialog box opens. Select
your Username from the drop- down list, type your login password
into the Password field, and click Login. To log in with a different
user account, right- click on the instrument name and click Log off
current user. You can then log in using the desired user account
A message box opens notifying you that you must save the
experiment before you can connect to the instrument.
5 Click Save in the message box.
The Save As dialog box opens.
33 Agilent Aria Real-Time PCR Program
Page 34

Performing Hardware and Software Tests and HRM Calibrations 3
Run an instrument qualification test
6 Select a folder for the experiment and type a name into the File name
field (or use the default). Click Save.
7 Take the prepared qualification test plate over to the instrument and
load it into the thermal block.
8 On the instrument touchscreen, open the primed experiment to the
Thermal Profile screen and press Run Experiment.
The instrument starts running the qualification test experiment.
9 Return to the PC program. The program directs you to the Raw Data
Plots screen, where you can monitor the progress of the run. See
“Monitor a run” on page 168.
10 At the end of the run, save the qualification test experiment to your PC
(see “Retrieve run data from the instrument” on page 173 for
instructions). Open the experiment in the Aria software on your PC.
11 Click Graphical Displays in the Experiment Area panel on the left side
of the screen. (See “About the Qualification Test graphical data” on
page 34 for more information about the graphs on this screen.)
12 Check the panel on the right side of the screen to determine if the
qualification test passed.
• If it passed, the panel displays Results Pass.
• If it failed, the panel displays Results Check.
If your qualification test failed, contact Agilent Technical Support for help
with troubleshooting. See “Contact Agilent Technical Support”.
About the Qualification Test graphical data
For a qualification test, the Graphical Displays screen includes graphs for
the Amplification Plots, the Standard Curve, and the Population
Distribution.
The Population Distribution graph is unique to Qualification Test
experiments. For each row of Unknown wells on the plate, this graph plots
the number of initial template copies calculated for that row against the
plate's column number. Because all wells in rows A, B, and C are
replicates and all wells in rows F, G, and H are replicates, the distribution
of the plot lines indicate the variability in initial template calculations
across the thermal block within the two populations (the ABC population
and the FGH population). In order to pass the qualification test, the
Agilent Aria Real-Time PCR Program 34
Page 35

3 Performing Hardware and Software Tests and HRM Calibrations
Run an instrument qualification test
program requires that both populations be at least 98.5% distinct after
outlier wells are culled. The percent distinct for the Population
Distribution graph is displayed in the panel on the right side of the
Graphical Displays screen (next to % Distinct). Note that outlier wells are
plotted on the Population Distribution graph with a red x.
If your qualification test failed, Agilent's Technical Support staff may use
the graphical data to help troubleshoot the cause of the failure.
35 Agilent Aria Real-Time PCR Program
Page 36

Performing Hardware and Software Tests and HRM Calibrations 3
Perform an Installation Qualification test
You can run an Installation Qualification (IQ) test to determine if the Aria
software is properly installed on your system. The IQ test is comprised of
three separate tests:
• GUI Software Installation Qualification: Verifies the integrity of the
files and folders that are created as part of Aria software installation
• Permissions test: Verifies that the current user has full access to the
software's default file path for experiment files
• Connectivity test: Tests the communication between software and
instrument via FTP or TCP protocol service (if the firmware version is
determined to be outdated, a message box opens prompting you to
upgrade the firmware)
To perform the IQ test:
1 Click File > Qualifications. The Qualifications dialog box opens.
Perform an Installation Qualification test
Agilent Aria Real-Time PCR Program 36
Page 37

3 Performing Hardware and Software Tests and HRM Calibrations
Perform an Installation Qualification test
2 Next to Report is the file path and file name of the report that the
program generates at the end of the test. To select a different folder or
file name for the report, click Change. Then, in the Save As dialog box,
select a different folder and/or file name.
3 Click Start to start the test.
The program displays the status of the test in the Test Log area of the
dialog box. When finished, the program updates the Status column in
the dialog box and displays the overall result (Passed or Failed). If the
test failed, contact Agilent Technical Support for assistance.
4 Click Open Report to open the PDF report generated by the program.
5 To run the test again, click Reset to clear the results of the previous
test.
NOTE
The Operational option on the Qualifications dialog box has tools to run an
Operational Qualification (OQ) test. However, the Operational option is only
available to Agilent Service Engineers with an appropriate password.
37 Agilent Aria Real-Time PCR Program
Page 38

Performing Hardware and Software Tests and HRM Calibrations 3
Run an HRM calibration plate (HCP)
For experiments that include a high resolution melt (HRM) segment, before
you can analyze the HRM data on a Difference Plots graph, you must
associate the experiment with an HRM calibration plate (HCP) that was
run on the same instrument. The purpose of the HCP is to calculate an
offset temperature for each well in order to help normalize well- to- well
temperature variations. See “About HRM calibration plates” on page 67 for
more information.
Run an HRM calibration plate (HCP)
NOTE
Prepare the plate
Use the Agilent HRM Calibration Plate
Agilent offers a HRM Calibration Plate that you can use for HRM
calibration (Agilent part number 5190- 7701). The plate comes
pre- aliquoted with a master mix containing EvaGreen dye. See the plate's
user manual for more information.
Visit www.agilent.com/genomics for ordering information on the HRM
Calibration Plate.
Prepare the plate with your own reagents
Alternatively, you can prepare your own reagent mixture to be used in the
HCP run.
The 1x mixture needs to contain a purified amplicon at a concentration of
0.1- 0.3 mM. Ideally, the amplicon has a melting temperature (Tm) close to
that of the amplicon that you will be analyzing in your Allele
Discrimination experiment. The 1x mixture also needs to contain the same
DNA binding dye, at the same concentration, that you use in the QPCR
reactions for the Allele Discrimination experiment.
A separate HRM software license is required in order to associate an experiment
with an HCP. To purchase a software license, contact your Agilent Sales
representative. The HRM license option is only available for the AriaMx system.
The license is not supported for the AriaDx system.
Agilent Aria Real-Time PCR Program 38
Page 39

3 Performing Hardware and Software Tests and HRM Calibrations
Run an HRM calibration plate (HCP)
Instead of using a purified amplicon in your reagent mixture, you can use
a template, primers, and polymerase to produce the amplicon during the
HCP run. If you choose this approach, you need to add an amplification
segment to the default HCP thermal profile.
Note that the Aria calibration algorithms were tested and optimized using
the Agilent HRM Calibration Plate. Using your own HCP reagent mixture
may impact results.
Run an HCP
All HCP experiments must be set up and run directly from the instrument
(you cannot set up an HCP experiment from the Aria program on your
PC).
To run an HCP experiment:
1 On the instrument Home screen, press the HRM Calibration icon.
2 On the subsequent screen, press Open Default Experiment.
The default HCP experiment opens to the Plate Setup screen. All wells
are set to the Unknown well type and the SYBR dye is selected for
target detection in all wells
The EvaGreen dye used in the Agilent HCP kit is detectable with the
FAM/SYBR optic module.
3 Navigate to the Thermal Profile screen and press Run Experiment.
A message box opens on the touchscreen prompting you to save the
experiment. Press OK in the message box to save the experiment to the
HCP folder.
4 Select a file name for the experiment and press Save.
The instrument starts running the experiment.
5 After the run, a message box opens on the screen notifying you if the
HCP passed or failed.
• If it passed, copy the post- run HCP experiment file to your PC (see
“Retrieve run data from the instrument” on page 173 for
instructions). You can then use the HCP to calibrate HRM data from
an experiment. See “Assign an HRM calibration plate” on page 183
for instructions.
39 Agilent Aria Real-Time PCR Program
Page 40

• If it failed, you cannot use the HCP to calibrate HRM data from an
If the HCP fails
If the HCP fails the system's quality check, the touchscreen displays a
message box at the end of the HCP run notifying you of the failure. You
will also see a warning icon (as shown below) if you open the experiment
in the Aria program on your PC.
Possible causes of a failed plate include pipetting errors during set up of
the plate and amplicon degradation. If you find your HCP runs repeatedly
fail, try setting up the plate using the Agilent HRM Calibration Plate. If
problems persist, contact Agilent Technical Support (see “Contact Agilent
Technical Support” on page 370). Note that you cannot associate a failed
HCP with an experiment.
Performing Hardware and Software Tests and HRM Calibrations 3
Run an HRM calibration plate (HCP)
experiment. See “If the HCP fails”, below, for information on failed
HCPs.
Agilent Aria Real-Time PCR Program 40
Page 41

3 Performing Hardware and Software Tests and HRM Calibrations
Run an HRM calibration plate (HCP)
41 Agilent Aria Real-Time PCR Program
Page 42

4
Creating/Opening an Experiment
Overview of the Getting Started screen 43
Tools available on the Getting Started screen 44
About the Aria file types 45
Quick Start Protocol 46
How to create, set up, run, analyze, and generate reports for an
experiment 46
Create a new experiment 49
Create an experiment based on experiment type 49
Create an experiment from a template 50
Create an experiment from a LIMS data file 51
Open an existing experiment 53
Save a copy of an existing experiment 54
Create a template from an existing experiment 55
Convert an experiment to a new experiment type 56
Agilent Technologies
Page 43

4 Creating/Opening an Experiment
Overview of the Getting Started screen
Overview of the Getting Started screen
The tools on the Getting Started screen allow you to create a new
experiment (from scratch or from a template), create a new multiple
experiment analysis project, or open an existing experiment or project.
To open the Getting Started screen: At the top of the program window,
click File > New. Alternatively, click the icon to open a new tab in the
program. The new tab opens to the Getting Started screen.
43 Agilent Aria Real-Time PCR Program
Page 44

Creating/Opening an Experiment 4
Overview of the Getting Started screen
Tools available on the Getting Started screen
The content in the center of the screen changes depending on which
option is selected in the panel on the left. These options are described in
the table below
Option Description
New Experiment
Experiment Types Click this option to create a new experiment based on the desired experiment type.
The center of the screen displays the experiment types for selection.
My Templates Click this option to create a new experiment from a template. The center of the
screen displays the template files in the Experiments Templates folder that is
created during program installation.
From LIMS file... Click this option to create a new experiment from a LIMS data file that specifies the
plate setup and, optionally, the thermal profile. The center of the screen displays the
Import From LIMS Data File wizard.
New Project
Multiple Experiment
Analysis
Saved
Recently Opened Click this option to open an existing experiment or project that you recently
Browse Click this option to open an existing experiment or project by browsing to a desired
Links at the bottom of the screen
License Click this link to open a message box about licensing. In the message box, click
© Agilent Technologies Click this link to open the About message box. This box displays the full version
Contact Support Click this link to create a new email message directed to the Agilent Technical
Agilent Aria Real-Time PCR Program 44
Click this option to create a new project for analyzing and comparing multiple
post-run experiments. The center of the screen displays tools for adding
experiments to the new project.
accessed. The center of the screen displays a list of experiments that you have
recently opened.
folder.
License Agreement to view the full text of the Aria software license agreement.
number of the software.
Support group.
Page 45

4 Creating/Opening an Experiment
Overview of the Getting Started screen
About the Aria file types
Three different files types can be created in the Aria program: an
experiment file, a protocol template file, and a project file. These file types
are summarized below.
Experiment Files (*.amxd or *.adxd)
In the Aria software, experiments of all types (Quantitative PCR,
Comparative Quantitation, Allele Discrimination, and User Defined) are
saved as experiment files. When an experiment file is open, the program
includes screens for defining the wells of the experimental plate, setting
up the thermal profile, running the experiment, and analyzing the results
of that run. AriaMx experiment files are given the extension amxd, and
AriaDx experiment files are given the extension adxd.
Template Files (*.amxt or *.adxt)
In addition to saving an experiment as an experiment file, the plate setup
and thermal profile of an experiment can be saved as a template file.
Creating a new experiment from a template file allows you to quickly set
up new experiments that require a similar plate setup or thermal profile.
AriaMx template files are given the extension amxt, and AriaDx template
files are given the extension adxt.
Project Files (*.amxp or *.adxp)
Multiple experiment analysis projects are saved as project files. Up to 8
post- run experiment files (of the same experiment type) can be added to
a project, enabling you to analyze the results side by side or combine
results across experiments. AriaMx project files are given the extension
amxp, and AriaDx project files are given the extension adxp.
45 Agilent Aria Real-Time PCR Program
Page 46

Quick Start Protocol
How to create, set up, run, analyze, and generate reports for an experiment
1. Create the experiment
• Open a new tab. On the Getting Started screen, under New
Experiment, click Experiment Types (to create a new experiment by
the experiment type) or My Templates (to create a new experiment
from a template).
2. Set up the plate
• After creating the experiment, the experiment opens to the Plate
Setup screen.
• Assign the plate properties based on experiment type, including
assigning well types, replicate numbers, and dyes/targets. See the
topics below for instructions specific to each experiment type.
“Assign plate properties for a Quantitative PCR DNA Binding Dye
experiment” on page 86
“Assign plate properties for a Quantitative PCR Fluorescence Probe
experiment” on page 94
“Assign plate properties for a Comparative Quantitation experiment”
on page 102
“Assign plate properties for an Allele Discrimination DNA Binding
Dye experiment” on page 113
“Assign plate properties for an Allele Discrimination Fluorescence
Probe experiment” on page 122
“Assign plate properties for a User Defined experiment” on page 131
Creating/Opening an Experiment 4
Quick Start Protocol
3. Set up the thermal profile
• Navigate to the Thermal Profile screen. (Click Thermal Profile in the
Experiment Area panel on the left side of the screen.)
• Edit the thermal profile as desired, or use the default/template
thermal profile.
Agilent Aria Real-Time PCR Program 46
Page 47

4 Creating/Opening an Experiment
Quick Start Protocol
4. Run the experiment
• From the Thermal Profile screen, click Run. In the Instrument
Explorer dialog box that opens, locate the instrument and click Send
Config.
• Load your reaction plate into the instrument's thermal block. On the
instrument touchscreen, open the primed experiment to the Thermal
Profile screen and press Run.
• If desired, monitor the progress of the run from your PC.
5. Set the analysis criteria
• When the run is finished, navigate to the Analysis Criteria screen.
(Click Analysis Criteria in the Experiment Area panel on the left
side of the screen.)
• Select the wells, well types, and targets to include in the analysis,
specify the treatment of replicate wells, and select the data collection
marker to use for analysis. If your experiment included a high
resolution melt segment (HRM), assign an HRM calibration plate to
the experiment.
6. Analyze the data
• Navigate to the Graphical Displays screen. (Click Graphical Displays
in the Experiment Area panel on the left side of the screen.)
• View the results of the analysis and customize analysis settings for
individual graphs. See the topics below for instructions specific to
each graph.
“View the Amplification Plots” on page 197
“View the Melt Curve - Raw/Derivative Curve” on page 212
“View the Melt Curve - Difference Plots” on page 218
“View the Standard Curve” on page 225
“View the Relative Quantity” on page 230
“View the Allele Determination graph” on page 235
47 Agilent Aria Real-Time PCR Program
Page 48

Creating/Opening an Experiment 4
Quick Start Protocol
7. Export the results
• To generate a report of the results, navigate to the Generate Report
screen (click Generate Report in the Experiment Area panel on the
left side of the screen). Configure and create the report according to
your selections.
• To export numerical data from the experiment, navigate to the
Export Data screen (click Export Data in the Experiment Area panel
on the left side of the screen). Select the file type and information
you want to export.
Agilent Aria Real-Time PCR Program 48
Page 49

4 Creating/Opening an Experiment
Create a new experiment
Create a new experiment
The Getting Started screen allows you to create a new experiment. To
create the new experiment from scratch, you start by selecting the
experiment type. To create the new experiment from a template or LIMS
data file, you start by selecting the template or LIMS data file that you
want to use. Once created, you can edit the plate setup and thermal
profile for the new experiment.
To open the Getting Started screen: At the top of the program window,
click File > New, or click the icon, to open a new tab in the program.
The new tab opens to the Getting Started screen.
Create an experiment based on experiment type
When you create a new experiment based on experiment type, your
selection of the experiment type determines some of the setup options and
analysis outputs. The thermal profile of the new experiment is set to the
default for the chosen experiment type. The plate setup of the experiment
is blank, but the available well types and other well configuration tools on
the Plate Setup screen are specific to the experiment type.
To create an experiment based on experiment type:
1 Open the Getting Started screen.
2 Under New Experiment, click Experiment Types.
The center of the screen displays all the available experiment types. See
“Overview of Experiment Types” on page 59.
3 Click the desired experiment type to select it.
4 In the Experiment Name field, type a name for the new experiment,
then click Create.
The program creates the new experiment and opens the experiment to
the Plate Setup screen.
NOTE
49 Agilent Aria Real-Time PCR Program
At step 3, you can double-click the desired experiment type to select it with the
default experiment name. The program creates the new experiment and opens the
experiment to the Plate Setup screen (or to the Thermal Profile screen for User
Defined experiments).
Page 50

Create an experiment from a template
When you create a new experiment from a template, the experiment has
the plate setup and thermal profile of the selected template. After you
create the experiment, you can edit the plate setup and thermal profile as
desired.
The Aria software comes with three sample template files. The templates
are available in the folder C:\Users\Public\Public Documents\Agilent
Aria\Experiment Templates.
To create an experiment from a template:
1 Open the Getting Started screen.
2 Under New Experiment, click My Templates.
The center of the screen displays the template files in the default
template folder.
Creating/Opening an Experiment 4
Create an experiment from a template
NOTE
You can toggle between displaying the templates in list format and tile format by
clicking the icons in top right corner.
= List view icon
= Tile view icon
3 In the Experiment Name field, type a name for the new experiment.
4 Select the desired template and create the experiment.
• If the template is in the default folder, click directly on the template
to select it and then click Create (or double- click directly on the
template). The program creates the new experiment and opens the
experiment to the Plate Setup screen.
• If the template is not in the currently selected folder, click the
Browse to Template icon (shown below) to open the browser window.
Browse to the folder of the desired template file. Select the file and
click Open. The program creates the new experiment and opens the
experiment to the Plate Setup screen.
Agilent Aria Real-Time PCR Program 50
Page 51

4 Creating/Opening an Experiment
Create an experiment from a template
Create an experiment from a LIMS data file
To create a new experiment from a LIMS data file, you must provide a
valid file. The file may be generated by exporting a post- run Aria
experiment to a LIMS data file (see “Export to a LIMS data file” on
page 262), by setting up a text file in the necessary Aria- supported LIMS
data file format, or by a LIMS software program. See “LIMS File Format
for Aria Software” on page 361 for information on format requirements for
LIMS data files used to create new experiments in the Aria program. After
you import the file and create the experiment, you can edit the plate
setup and thermal profile as desired from the Plate Setup and Thermal
Profile screens.
The Aria software comes with sample LIMS data files (text files and CSV
files). The files are available in the folder C:\Users\Public\Public
Documents\Agilent Aria\Sample LIMS Import Files.
To create an experiment from a LIMS data file:
1 Open the Getting Started screen.
2 Under New Experiment, click From LIMS file....
The center of the screen displays the Import From LIMS Data File
wizard.
3 In the Filename field under LIMS data file, type the file path for the
LIMS data file, or click Browse to browse to and select the LIMS data
file. The file type can be a text file (*.txt) or a CSV file (*.csv).
The program populates the fields in the Experiment setup and
Thermal profile setup areas of the LIMS Data File wizard using the
available information from the selected file. Note that the file may not
include all experiment details.
4 (Optional) Edit the information in the Experiment setup fields as
desired.
• In the Name field, type a name for the experiment. If the imported
LIMS data file specified the experiment name, then the field is
populated with that name.
• In the Type drop- down list, select an experiment type. If the
imported LIMS data file specified the experiment type, then the
drop- down list is set to that selection. See “Overview of Experiment
Types” on page 59 for descriptions of the Aria experiment type
options.
51 Agilent Aria Real-Time PCR Program
Page 52

Creating/Opening an Experiment 4
Create an experiment from a template
• In the Notes field, type any experiment notes that you want
associated with the new experiment. If the imported LIMS data file
included experiment notes, then the field is populated with those
notes.
5 Click Next.
The screen displays the plate setup information for the experiment.
6 (Optional) Edit the Reference Dye selection and other target information
as permitted for the experiment type.
7 Click Finish.
The program creates the new experiment and opens the experiment to
the Plate Setup screen. A message box opens confirming that the
experiment has been successfully imported. Click OK to close the
message box.
Agilent Aria Real-Time PCR Program 52
Page 53

4 Creating/Opening an Experiment
Open an existing experiment
Open an existing experiment
The program allows you to open up to 5 experiments at a time, or one
project at a time. The program displays each open experiment or project
on its own tab.
To open an experiment in a new tab:
1 Click the icon to the right of the tabs to open a new tab.
The new tab opens to the Getting Started screen.
2 Click one of the options under Saved:
• To open an existing experiment that you recently accessed, click
Recently Opened. The center of the screen displays a list of
experiments and projects that you have recently opened. Double- click
the experiment you want to open. The program opens the experiment
to the Plate Setup screen.
• To browse to the folder of the experiment, click Browse. The Open
dialog box opens. Browse to the folder location of the experiment.
Select the experiment and click Open. The dialog box closes and the
program opens the experiment to the Plate Setup screen.
To open an experiment in an already open tab:
1 From the toolbar, click File > Open.
The Open dialog box opens. If an experiment or project is currently
open in the tab, the program closes that experiment or project, and
prompts you to save any changes.
2 Browse to the folder location of the experiment. Select the experiment
and click Open.
The dialog box closes and the program opens the experiment to the
Plate Setup screen.
53 Agilent Aria Real-Time PCR Program
Page 54

Save a copy of an existing experiment
You can use the Save As command to copy the open experiment and save
it with a new experiment name.
To copy an existing experiment using the Save As command:
1 Open the existing experiment that you want to copy.
2 Click File > Save As.
The Save As dialog box opens.
3 Select a folder for the new experiment and type a name into the file
name field.
4 Click Save.
The program saves the open experiment under the new name.
Creating/Opening an Experiment 4
Save a copy of an existing experiment
Agilent Aria Real-Time PCR Program 54
Page 55

4 Creating/Opening an Experiment
Create a template from an existing experiment
Create a template from an existing experiment
You can use the Save As Template command to create a template file
based on the plate setup and thermal profile of an existing experiment.
You can later use the template to quickly create new experiments. See
“Create an experiment from a template” on page 50.
To create a template from an existing experiment using the Save As
Template command:
1 Open the existing experiment that you want to create a template from.
2 Click File > Save As Template.
The Save As dialog box opens. If you are running the AriaMx mode of
the software, the file type set to AriaMx Template Files (*.amxt). If
you are running the AriaDx mode of the software, the file type set to
AriaDx Template Files (*.adxt).
3 Select a folder for the new template and type a name into the file name
field.
4 Click Save.
The dialog box closes and the program saves the new template file
(*.amxt or *.adxt) to the designated folder.
55 Agilent Aria Real-Time PCR Program
Page 56

Convert an experiment to a new experiment type
Convert an experiment to a new experiment type
The Convert Experiment Type command can convert a post- run
experiment into another experiment type. This command is useful when
the experiment was set up as one type and the data needs to be
re- analyzed as a different experiment type. The program applies the
analysis algorithms and display options based on the new experiment type.
To convert an experiment to a new experiment type:
1 Open the existing post- run experiment that you want to convert.
2 Click File > Convert Experiment Type, and in the sub-menu, select the
new experiment type.
A message box opens notifying you that the conversion was successful
and that some well types may have changed.
3 Click OK to close the message box.
The program creates a new experiment file for the converted
experiment and opens the experiment to the Plate Setup screen. By
default, the new experiment has the same name as the parent
experiment with the word “Converted” added at the beginning.
4 Click File > Save As.
The Save As dialog box opens.
5 Select a folder for the new experiment. Type a name into the file name
field or use the default file name.
6 Click Save.
The program saves the new experiment to the designated folder.
Creating/Opening an Experiment 4
Agilent Aria Real-Time PCR Program 56
Page 57

4 Creating/Opening an Experiment
Convert an experiment to a new experiment type
57 Agilent Aria Real-Time PCR Program
Page 58

5
Selecting an Experiment Type
Overview of Experiment Types 59
Quantitative PCR 59
Comparative Quantitation 59
Allele Discrimination - Fluorescence Probes 60
Allele Discrimination - DNA Binding Dye with High-Resolution
Melt 60
User Defined 60
The Quantitative PCR Experiment Type 61
Multiplexing quantitative PCR experiments 61
Well types for Quantitative PCR experiments 62
The Comparative Quantitation Experiment Type 63
Normalizing chance variations in target levels 63
Determining amplification efficiencies for the targets of interest and
normalizer targets 64
Including biological replicates in comparative quantitation 65
Well types for Comparative Quantitation experiments 66
The Allele Discrimination - DNA Binding Dye Experiment Type 67
About HRM calibration plates 67
Well types for Allele Discrimination - DNA Binding Dye
experiments 68
The Allele Discrimination - Fluorescence Probe Experiment Type 69
Well types for Allele Discrimination - Fluorescence Probe
experiments 70
The User Defined Experiment Type 71
Agilent Technologies
Page 59

5 Selecting an Experiment Type
Overview of Experiment Types
Overview of Experiment Types
The Aria program offers a variety of experiment types. Each experiment
type was designed for a specific application and has its own unique
options for experimental setup and analysis that are specialized for that
application. The Aria experiment types are summarized below.
Quantitative PCR
The Quantitative PCR experiment type is the best choice when you need
to determine the exact quantity of a particular DNA target in the
experimental template samples. This experiment type uses a standard
curve produced with samples of known template quantity to derive the
initial quantity of the target in the experimental sample.For more
information, see “The Quantitative PCR Experiment Type” on page 61.
The program offers two sub- types for the Quantitative PCR experiment
type: DNA Binding Dye Including Standard Melt and Fluorescence Probe.
These sub- types differ by the type of chemistry used to detect the PCR
products. In the DNA Binding Dye Including Standard Melt sub- type,
detection is based on signal from a double- stranded DNA binding dye, e.g.,
SYBR Green, and the default thermal profile includes a melt curve. In the
Fluorescence Probe sub- type, a target- specific probe, e.g., a TaqMan probe,
is used for target detection.
Comparative Quantitation
The Comparative Quantitation experiment type is best used for comparing
levels of RNA or DNA across samples when you do not require
information about the absolute amount of target. Most common is the
comparison of amounts of mRNA in treated versus untreated, or normal
versus diseased cells or tissues. The program will ask you to identify
which wells contain the control sample (called the “calibrator”) and which
wells contain the associated experimental sample (called the “unknown”).
For accurate results, you need to normalize the data to the quantity of a
target gene (called a “normalizer”) that is known to be unaffected by the
experimental conditions, such as a housekeeping gene. For more
information, see “The Comparative Quantitation Experiment Type” on
page 63.
59 Agilent Aria Real-Time PCR Program
Page 60

Selecting an Experiment Type 5
Overview of Experiment Types
Allele Discrimination - Fluorescence Probes
The Allele Discrimination experiment type is used to discriminate between
two alleles in a DNA sample. For more information, see “The Allele
Discrimination - Fluorescence Probe Experiment Type” on page 69.
The program offers two sub- types for the Allele Discrimination experiment
type. In the sub- type Fluorescence Probe, you use two fluorogenic probes
labeled with different dyes to discriminate between two alleles in a DNA
sample. For example, if amplification in an unknown DNA sample is
detected for the dye identifying the wild- type allele but not for the dye
identifying a mutant allele, the sample can be designated as wild- type
homozygous.
Allele Discrimination - DNA Binding Dye with High-Resolution Melt
The Allele Discrimination experiment type is used to discriminate between
two alleles in a DNA sample. For more information, see “The Allele
Discrimination - DNA Binding Dye Experiment Type” on page 67.
The program offers two sub- types for the Allele Discrimination experiment
type. In the sub- type Fluorescence Probe, you use two fluorogenic probes
labeled with different dyes to discriminate between two alleles in a DNA
sample. For example, if amplification in an unknown DNA sample is
detected for the dye identifying the wild- type allele but not for the dye
identifying a mutant allele, the sample can be designated as wild- type
homozygous
User Defined
The User Defined experiment type provides the greatest flexibility in setup
and analysis of an experiment. All the well types and other plate setup
options that are available across the other experiment types are available
on the Plate Setup screen in a User Defined experiment. Similarly, on the
Thermal Profile screen, you can add any type of segment to the thermal
profile, and on the Graphical Displays screen, you can view the results for
any of the experiment type- specific graphs.
Agilent Aria Real-Time PCR Program 60
Page 61

5 Selecting an Experiment Type
The Quantitative PCR Experiment Type
The Quantitative PCR Experiment Type
In Quantitative PCR experiments, the instrument detects the fluorescence
of one or more dyes or fluorophores during each cycle of the thermal
cycling process and a fluorescence value is reported for each
dye/fluorophore at each cycle. Generally, you want the instrument to
acquire fluorescence readings during the annealing stage of thermal
cycling.
You can quantify the initial copy numbers of RNA or DNA targets based
on quantification cycle (Cq) determinations. The Cq is defined as the cycle
at which a statistically- significant increase in fluorescence is first
detected. The threshold cycle is inversely proportional to the log of the
initial copy number. In other words, the more template that is present
initially, the fewer the number of cycles required for the fluorescence
signal to be detectable above background. The Aria program offers both
automatic and manual methods for determination of the threshold
fluorescence level that is used to determine Cq values.
Typical Quantitative PCR experiments use a standard curve to quantitate
the amount of target present in an experimental sample (called the
“unknown” sample since the quantity of the target is unknown). In this
method, you set up the plate to amplify a series of standards to generate
a standard curve that relates initial template quantity to Cq. You generate
the standards by serial dilution of a template sample that contains a
known quantity of the target under investigation. The program then uses
the standard curve to derive the initial template quantity of this target in
the unknown samples based on their Cq values.
Multiplexing quantitative PCR experiments
The instrument records fluorescence readings for each sample on all five
optical modules. This allows you to use multiplex PCR for quantitation of
multiple targets in the same well by using spectrally- distinct dyes to
detect each target. The Aria program reports each target in each well
separately on amplification plots and other graphical results displays.
61 Agilent Aria Real-Time PCR Program
Page 62

Well types for Quantitative PCR experiments
Well Type Description
Unknown Contains a complete reaction mixture including a test template that
contains an unknown amount of the target-of-interest.
Buffer Contains only buffer; used to monitor the background fluorescence
attributable to the buffer.
NAC No amplification control; contains all reaction components except DNA
polymerase.
NTC No template control; contains all reaction components except the
template nucleic acid.
This well type is useful for detecting amplicon contamination.
Standard Contains a complete reaction mixture including a known concentration
of the target-of-interest.
This well type is used to generate a standard curve, which is then used to
relate the quantification cycle (Cq) to initial template quantity in
Unknown wells and calculate the amplification efficiency.
No RT No reverse transcriptase control; contains all QRT-PCR reaction
components except reverse transcriptase.
In one-step RT-PCR assays, this control is useful for assessing levels of
genomic DNA carryover that may contribute to fluorescence increase in
the sample.
Selecting an Experiment Type 5
The Quantitative PCR Experiment Type
Agilent Aria Real-Time PCR Program 62
Page 63

5 Selecting an Experiment Type
The Comparative Quantitation Experiment Type
The Comparative Quantitation Experiment Type
The Comparative Quantitation experiment type provides an efficient
method for comparing levels of RNA or DNA across samples when you do
not require information about the absolute amount of target in any
sample. The most common application is the comparison of amounts of
mRNA in treated versus untreated, or normal versus diseased cells or
tissues.
For many gene expression studies, your experiments do not require you to
determine the absolute amount of a target in a particular sample; evidence
of a relative increase or decrease in expression, compared to a sample of
reference, is sufficient. The sample of reference is referred to as the
calibrator. For example, in a study in which a large number of compounds
are screened for the ability to induce the expression of a certain set of
genes in HeLa cells, the calibrator might be a nucleic acid sample isolated
from an untreated HeLa cell culture. In a study involving the expression
of a cancer marker gene, the calibrator might be a nucleic acid sample
isolated from the normal, non- diseased part of the organ, whereas the test
samples (referred to in the program as Unknowns) are nucleic acids
isolated from the diseased tissue of the same patient. The expression level
of the target- of- interest (i.e., the gene you are studying) in the calibrator
is defined as 1× (or 1.0). Expression levels in all unknown samples are
reported as a fold difference relative to this calibrator benchmark.
Normalizing chance variations in target levels
The quantity of a target- of- interest present across a set of
independently- isolated samples is subject to many variables such as
sample- to- sample differences in total amount of input nucleic acid and
differences in the efficiency of RNA extraction or reverse transcription.
You can include a normalizer target in the assay to reduce the effect of
these spurious variations that do not reflect true differences in target
abundance as a result of experimental treatment. Any gene with little to
no variance in expression due to the experimental treatment can serve as
a normalizer. (Commonly- used examples include housekeeping genes such
as GAPDH, cyclophilin, GUS, TFIID, or 18S, or 28S ribosomal RNA.) The
abundance of the normalizer and the target- of- interest should be similar.
In a typical Comparative Quantitation experiment, you would set up the
wells containing the calibrator sample to run alongside a variety of
63 Agilent Aria Real-Time PCR Program
Page 64

Selecting an Experiment Type 5
The Comparative Quantitation Experiment Type
unknown samples to test the effect of some variable on the expression
level of one or more genes of interest. You can set up the reactions
amplify the normalizer target in the same well as the target- of- interest
(using multiplexing) or set up the reactions to amplify the normalizer and
the target- of- interest in different wells.
During analysis, the program automatically adjusts the levels of the
target- of- interest in both Unknown and Calibrator wells to compensate for
differences in the levels of the normalizer. The program then compares the
normalized value for each unknown sample to the normalized calibrator
value, and reports the relative quantity for each unknown. (The expression
level of the target- of- interest in the Calibrator wells is set to 1.0.)
Establish the amplification efficiencies of the normalizer target and the
target- of- interest before you use a particular normalizer in a Comparative
Quantitation experiment.
See the following section (“Determining amplification efficiencies for the
targets of interest and normalizer targets”) for more information.
Determining amplification efficiencies for the targets of interest and normalizer targets
In developing a Comparative Quantitation experiment, it is important that
the amplification efficiencies of the target- of- interest and the normalizer
target are reproducible and, ideally, very similar. To measure the
amplification efficiency for each target, generate a standard curve in a
Quantitative PCR experiment. When running a standard curve for the sole
purpose of determining the amplification efficiency for a particular target,
it is not necessary to know the exact quantity of your targets. Instead, you
can use serially diluted template as the standard samples and assign the
standard quantities in Plate Setup using the “relative” unit designation.
The program then analyzes the standard curve data and calculates the
amplification efficiency from the slope of the curve. (See “View the
R- squared values, slopes, and amplification efficiencies” on page 227 for
more information on deriving amplification efficiencies from standard
curves.)
If differences in amplification efficiency exist
In an idealized Comparative Quantitation experiment, the amplification
efficiencies for the target- of- interest and normalizer target must be
Agilent Aria Real-Time PCR Program 64
Page 65

5 Selecting an Experiment Type
The Comparative Quantitation Experiment Type
identical in order to allow a direct correction of target levels across
samples. However, if you find from your standard curves that the
target- of- interest and normalizer have different amplification efficiencies,
the program allows you to compensate for this difference using the
settings under Amplification Efficiencies in the Graphical Displays screen.
To access these settings, expand the menu in the panel on the right side
of the Graphic Displays screen. (See “Enter the amplification efficiencies
for the targets ” on page 233 for detailed instructions.)
Including biological replicates in comparative quantitation
In QPCR, biological replicates are template samples that were isolated
independently but from biologically- identical sources (sources that are
genetically identical are of the same cell type and were treated identically
during experimentation). For example, two samples of cDNA that were
isolated from the same tissue source in two different mice that were
exposed to identical conditions and have the same genotype would be
biological replicates. Biological replicates help you determine the level of
variability in gene expression for your specific experiment that is due to
uncontrolled biological variation from sample to sample.
When setting up the plate for a Comparative Quantitation experiment, you
may designate two or more samples as biological replicates while assigning
the sample names. Samples that are biological replicates are assigned the
same sample name but have different biological replicate ID numbers.
During analysis, the program treats biological replicates independently as
different samples.
If the experiment includes multiple biological replicates of the calibrator
sample, you can designate only one of the samples within the set of
replicates as the calibrator. You can change the assignment of the
calibrator after the run if you want to re- analyze the results using a
different calibrator designation.
65 Agilent Aria Real-Time PCR Program
Page 66

Selecting an Experiment Type 5
The Comparative Quantitation Experiment Type
Well types for Comparative Quantitation experiments
Well Type Description
Unknown Contains a complete reaction mixture including a test template that
contains an unknown amount of the target-of-interest.
Calibrator Contains a complete reaction mixture including an unknown amount of
the target-of-interest.
The level of a target-of-interest in the calibrator wells is set to 1.0 for
comparison to the relative quantities in unknown samples.
NTC No template control; contains all reaction components except the
template nucleic acid.
Standard Contains a complete reaction mixture including a known concentration
of the target-of-interest.
This well type is used to generate a standard curve, which is then used to
relate the quantification cycle (Cq) to initial template quantity in
Unknown wells and calculate the amplification efficiency.
No RT No reverse transcriptase control; contains all QRT-PCR reaction
components except reverse transcriptase.
In one-step RT-PCR assays, this control is useful for assessing levels of
genomic DNA carryover that may contribute to fluorescence increase in
the sample.
NAC No amplification control; contains all reaction components except DNA
polymerase.
Buffer Contains only buffer; used to monitor the background fluorescence
attributable to the buffer.
Agilent Aria Real-Time PCR Program 66
Page 67

5 Selecting an Experiment Type
The Allele Discrimination - DNA Binding Dye Experiment Type
The Allele Discrimination - DNA Binding Dye Experiment Type
The Allele Discrimination - DNA Binding Dye experiment type is used to
discriminate between two alleles of a gene in a genomic DNA or cDNA
sample using a double- stranded DNA binding dye, such as SYBR Green or
EvaGreen dye, and a high- resolution melt (HRM).
HRM analysis is a technique used for genotyping samples that include a
single nucleotide polymorphism (SNP) in the DNA sequence. Applications
that may use HRM analysis include species identification, mutation
screening, and haplotype characterization. When using the allele
discrimination experiment type for HRM analysis, you set up the
experiment to amplify all alleles in the same well using the same set of
primers, and the program detects all alleles using the same
double- stranded DNA- binding dye (such as SYBR Green or EvaGreen dye).
The thermal profile includes a melt segment so that melt curves of the
targets can be generated. Even DNA amplicons that differ in sequence by
only a single nucleotide will yield slightly different melt curves. An Allele
Discrimination experiment that uses HRM analysis needs to include
positive control samples for each base pair possibility at the SNP location
(homozygous as well as heterozygous positive control samples).
On the Graphical Displays screen, Difference Plots show the difference in
fluorescence between two plots during a melt ramp (Y axis) as a function
of temperature (X axis). By graphing the difference in fluorescence, the
program can detect even slight differences between two melt curves. You
can use the difference plots to compare samples of unknown genotype to
positive control samples, and visually determine which genotype group the
target in the unknown sample falls into.
NOTE
A separate HRM software license is required in order to view the Difference Plots.
To purchase a software license, contact your Agilent Sales representative.
About HRM calibration plates
During the HRM segment of the thermal profile, the instrument ramps the
temperature of the thermal block in 0.2°C increments. At any given target
temperature, very slight differences in the exact temperature may exist
from well to well across the thermal block. The purpose of an HRM
calibration plate (HCP) is to calculate an offset temperature for each well
67 Agilent Aria Real-Time PCR Program
Page 68

Selecting an Experiment Type 5
The Allele Discrimination - DNA Binding Dye Experiment Type
in order to help normalize these temperature variations. The offset
temperature is the difference between the Tm (melting temperature) in
any given well and the average Tm for the plate. When you associate your
Allele Discrimination experiment with an HCP experiment, the program
subtracts the offset temperature from the calculated Tm in each well. This
normalization improves the accuracy and clarity of the difference plots
and the raw/derivative melt curves.
In order to calculate the offset temperatures, an HCP must contain the
identical amplicon in each well. During the HCP run, that amplicon is
melted in an HRM segment. The program then calculates a Tm for each
well and an average Tm for the plate.
All HCP experiments must be set up and run directly from the instrument
(you cannot set up an HCP experiment from your PC). See “Run an HRM
calibration plate (HCP)” on page 38 for instructions.
You can use the same HCP experiment for multiple Allele Discrimination
experiments. For each instrument, Agilent recommends running a new
HCP experiment at least once per year.
Well types for Allele Discrimination - DNA Binding Dye experiments
Well Type Description
Unknown Contains a complete reaction mixture including a test template that
contains an unknown amount of the specific target.
NTC No template control; contains all reaction components except the
template nucleic acid.
This control is useful for detecting amplicon contamination.
Homo Allele A Contains a complete reaction mixture with a positive control template
that is known to be homozygous for allele A.
Home Allele B Contains a complete reaction mixture with a positive control template
that is known to be homozygous for allele B.
Hetero Contains a complete reaction mixture with a heterozygous positive
control template that is known to include both allele A and allele B.
Agilent Aria Real-Time PCR Program 68
Page 69

5 Selecting an Experiment Type
The Allele Discrimination - Fluorescence Probe Experiment Type
The Allele Discrimination - Fluorescence Probe Experiment Type
The Allele Discrimination experiment type is used to discriminate between
two alleles of a gene in a genomic DNA or cDNA sample. An Allele
Discrimination experiment can be performed two different ways: using
fluorescent probes (as described below) or using a double- stranded DNA
binding dye.
Using the probe method for allele discrimination, two fluorescent probes
labeled with two spectrally distinct dyes are used to discriminate between
the two alleles and, subsequently, determine the genotype of a sample. For
example, if the program detects amplification in an unknown DNA sample
for the dye identifying the wild- type allele but not for the dye identifying
a mutant allele, the program designates the sample as wild- type
homozygous. If the program detects amplification in an unknown DNA
sample for the dye identifying the mutant allele but not for the dye
identifying the wild- type allele, the program designates the sample as
mutant homozygous. If the program detects amplification for both dyes, it
designates the unknown sample as heterozygous for the two alleles. With
properly designed probes, this assay is sensitive enough to detect a
single- base difference (single nucleotide polymorphism or SNP) between
two alleles.
The program uses the quantification cycle (Cq) value for each target in
each sample to determine the genotypes of the samples. A Cq value of 24
to 32 is expected for a sample that contains the specific allele recognized
by the probe. A Cq value equal to the final cycle of the PCR reaction
(typically 40) or equal to the Cq of the negative control samples indicates
the absence of a specific allele. The program displays the results in the
Allele Determination graph, which is a scatter plot that shows the Cq for
the dye specific to one allele plotted against the Cq for the dye specific to
the other allele. The program groups plotted points according to their
positions on the graph, providing a convenient visualization of samples
which share the same genotype (allelic composition).
In the analysis of real- time Allele Discrimination experiments that use
fluorescence probes (e.g., TaqMan probes), you would typically monitor
and report fluorescence at the end of the annealing/extension step. At
that point, the polymerase has already extended across the template and
hydrolyzed any probe that had annealed.
69 Agilent Aria Real-Time PCR Program
Page 70

Selecting an Experiment Type 5
The Allele Discrimination - Fluorescence Probe Experiment Type
Well types for Allele Discrimination - Fluorescence Probe experiments
Well Type Description
Unknown Contains a complete reaction mixture including a test template that
contains an unknown amount of the specific target.
NTC No template control; contains all reaction components except the
template nucleic acid.
This control is useful for detecting amplicon contamination.
Homo Allele A Contains a complete reaction mixture with a positive control template
that is known to be homozygous for allele A.
Home Allele B Contains a complete reaction mixture with a positive control template
that is known to be homozygous for allele B.
Hetero Contains a complete reaction mixture with a heterozygous positive
control template that is known to include both allele A and allele B.
Agilent Aria Real-Time PCR Program 70
Page 71

5 Selecting an Experiment Type
The User Defined Experiment Type
The User Defined Experiment Type
The User Defined experiment type provides the greatest flexibility in setup
and analysis of an experiment. All the well types and other plate setup
options that are available across the other three experiment types are
available on the Plate Setup screen in a User Defined experiment.
Similarly, on the Thermal Profile screen, you can add any type of segment
to the thermal profile, and on the Graphical Displays screen, you can view
the results for any of the experiment type- specific graphs.
71 Agilent Aria Real-Time PCR Program
Page 72

6
Setting Up the Plate
Overview of the Plate Setup screen 73
The plate map 74
Well type 74
Well name / Sample name 74
Target information 75
Replicate number 75
Reference dye 75
The Properties panel 76
Additional tools for setting up a plate 76
Import a plate setup 78
Select and view wells in the plate map 79
Select wells in the plate map 79
Unselect wells in the plate map 80
View details of a well or wells 80
Export the plate map image 85
Assign plate properties for a Quantitative PCR DNA Binding Dye
experiment 86
Assign plate properties for a Quantitative PCR Fluorescence Probe
experiment 94
Assign plate properties for a Comparative Quantitation experiment 102
Assign plate properties for an Allele Discrimination DNA Binding Dye
experiment 113
Assign plate properties for an Allele Discrimination Fluorescence Probe
experiment 122
Assign plate properties for a User Defined experiment 131
Agilent Technologies
Page 73

6 Setting Up the Plate
Overview of the Plate Setup screen
Overview of the Plate Setup screen
The Plate Setup screen has tools for assigning properties to the wells of
the plate so that the program can properly analyze your data.
To open the Plate Setup screen: With an experiment or project file open,
click Plate Setup in the Experiment Area panel on the left side of the
screen.
73 Agilent Aria Real-Time PCR Program
Page 74

The plate map
In the center of the Plate Setup screen is a representation of the wells of
a 96- well plate. This diagram, called a plate map, is used for showing
which wells in the plate are in use in the current experiment, what kind
of sample is in each well, which dyes are being used for detection in the
wells, and what targets those dyes are detecting.
The properties assigned to the wells are indicated in the plate map. To see
more detailed information on the properties of a particular well, such as
target names and standard quantities, hover your cursor over the well.
Setting Up the Plate 6
Overview of the Plate Setup screen
You can also open a mini plate map to view the details in a selected set
of wells.
Well type
All wells that are in- use in the experiment need to be assigned a well
type. This assignment indicates to the program the type of reaction in the
well. For example, the Unknown well type is used for experimental
templates in which the quantity of the target(s) is unknown. When the
Show setting on the Plate Setup Properties panel is set to Type, the well
type appears at the top of the well.
The available well types vary depending on the experiment type.
Well name / Sample name
If desired, you can assign names to the wells of the plate. When the Show
setting on the Plate Setup Properties panel is set to Name, the well name
appears at the top of the well. The Comparative Quantitation, Allele
Agilent Aria Real-Time PCR Program 74
Page 75

6 Setting Up the Plate
Overview of the Plate Setup screen
Discrimination, and User Defined experiment types also allow you to
assign sample names to designate the template sample used in each well.
The program displays the sample name at the top of each well when the
Show setting is set to Sample.
Target information
All experiment types require, at a minimum, that you designate the dyes
being used for detection in the wells. You may also assign a name to the
target being detected by each dye. If the same dye will be used to amplify
multiple targets in the experiment, assigning a unique name to each target
allows the program to distinguish between these targets during analysis.
Replicate number
If some of the wells on the plate are technical replicates of each other
(i.e., they have the exact same reaction components), you can designate
the replicate wells during plate setup by assigning them the same replicate
number. During analysis, you can choose to have the results from replicate
wells averaged together at each cycle, or you can treat replicates
separately to monitor for well- to- well variation among identical reactions.
Invalid Sets: When assigning replicates, if you see a flashing red warning
icon in the Properties panel next to Replicates, you have an invalid
replicate set on the plate. To be valid, all the wells of a set must be of the
same well type and have the same target assignments. Hover your cursor
over the warning icon to view specific information on why the program
has called a replicate set invalid.
Note that technical replicates are different from biological replicates. The
assignment of biological replicate IDs is unique to Comparative
Quantitation (and User Defined) experiments.
Reference dye
Passive reference dyes are used for normalization of the fluorescence
signal in order to compensate for non- PCR related variations in
fluorescence, such as pipetting variation from well to well. Typically, most
experiments use ROX as the reference dye.
75 Agilent Aria Real-Time PCR Program
Page 76

If you will be adding a dye to the wells of your plate as a passive
reference dye, you need to assign a reference dye in the plate setup. The
assignment of that dye as a reference dye is indicated in the wells by the
target name REF. Note that if you assign a reference dye, you must assign
it to all wells in use on the plate.
The Properties panel
The panel on the right side of the Plate Setup screen has the tools for
assigning properties to the wells in the plate map. The content of this
panel depends on the experiment type. See the following help topics for
information on your experiment type:
“Assign plate properties for a Quantitative PCR DNA Binding Dye
experiment” on page 86
“Assign plate properties for a Quantitative PCR Fluorescence Probe
experiment” on page 94
“Assign plate properties for a Comparative Quantitation experiment” on
page 102
Setting Up the Plate 6
Overview of the Plate Setup screen
“Assign plate properties for an Allele Discrimination DNA Binding Dye
experiment” on page 113
“Assign plate properties for an Allele Discrimination Fluorescence Probe
experiment” on page 122
“Assign plate properties for a User Defined experiment” on page 131
To hide the Properties panel, click the arrow icon in the upper left corner
of the panel. Click the arrow again to display the Properties panel.
Additional tools for setting up a plate
Copy/Paste
To copy well information, first select the wells that contain the
information to be copied. Then, press Ctrl+c, or right- click on the plate
map and click Copy, to copy the properties of the selected wells to the
clipboard. You can later paste the properties into other wells within the
same experiment or in another open experiment.
Agilent Aria Real-Time PCR Program 76
Page 77

6 Setting Up the Plate
Overview of the Plate Setup screen
To paste well information from the clipboard to a set of wells, first select
the wells that you want to paste into. Then, press Ctrl+v, or right- click on
the plate map and click Paste, to paste the well information into a
selected set of wells. You can paste into wells within the same experiment,
or into wells of an experiment that is open in another tab of the program
(provided that the properties of the wells are compatible with the
experiment type).
See “Select and view wells in the plate map” on page 79 for instructions
on selecting sub- sets of wells on the plate map.
Undo/Redo
Click the Undo icon in the lower right corner of the screen to undo your
most recent action. You can click the icon multiple times to undo multiple,
consecutive actions.
Click the Redo icon in the lower right corner of the screen to redo the
most recent action that you reversed using the Undo tool. You can click
the icon multiple times to redo multiple, consecutive actions.
You can also access the Undo and Redo commands by right- clicking
anywhere on the plate map.
Clear Selected Well or Clear Plate
To clear all the properties assigned to a well or set of wells, select the
well(s) on the plate map, right- click, and then click Clear Selected Well.
Alternatively, select the well(s) on the plate map and press Delete to clear
the properties.
To clear all properties assigned to all wells in the plate, right- click
anywhere on the plate map and click Clear Plate.
77 Agilent Aria Real-Time PCR Program
Page 78

Import a plate setup
The Aria program allows you to set up the plate on the Plate Setup screen
by importing the plate setup of any existing experiment of the same
experiment type. After you import the plate setup, you can edit the well
properties as desired.
To open the Plate Setup screen: With an experiment or project file open,
click Plate Setup in the Experiment Area panel on the left side of the
screen.
To import a plate setup:
1 In the Properties panel of the Plate Setup screen, click the Import Plate
Setup icon.
The Open dialog box opens.
2 Browse to the folder of the existing experiment with the plate setup
that you want to import. Select the file and click Open.
The dialog box closes and the program imports the plate setup into the
currently open experiment.
Setting Up the Plate 6
Import a plate setup
Agilent Aria Real-Time PCR Program 78
Page 79

6 Setting Up the Plate
Select and view wells in the plate map
Select and view wells in the plate map
When setting up your plate on the Plate Setup screen, you may need to
select a sub- set of wells in the 96- well plate map in order to assign
properties to specific wells. You can select and unselect wells by clicking
directly on the plate map. You may also need to view certain wells of the
plate map in more detail, which can also be done from the Plate Setup
screen.
To open the Plate Setup screen: With an experiment or project file open,
click Plate Setup in the Experiment Area panel on the left side of the
screen.
Select wells in the plate map
When a new experiment is first opened, all wells on the plate are already
selected. Selected wells appear highlighted on the plate map (see wells A1
through A6 in the image below) while unselected wells appear grayed out
(see wells A7 through A12 in the image below).
To select all wells when some wells are not already selected:
1 Click the small square in the upper left- hand corner of the plate. (If all
wells on the plate are already selected, clicking this button will unselect
all wells.)
To select an entire row or column of wells:
1 Click the corresponding row header (A–H) or column header (1–12).
To select a range of adjacent wells:
1 Click and hold the left mouse button as you drag the cursor across the
wells to be selected.
A visible marking rectangle appears.
79 Agilent Aria Real-Time PCR Program
Page 80

2 When all of the required wells are included in the rectangle, release the
left mouse button.
The range of wells is selected.
To select a group of non- contiguous wells:
1 Press Ctrl as you click individually on each of the wells to be selected.
Unselect wells in the plate map
Use one of the following approaches to unselect wells:
• To unselect individual wells, press Ctrl as you click on the wells to be
unselected.
• To unselect a selected row or column, click on the header for that row
or column.
• To rapidly unselect all wells, click twice on the button in the upper
left- hand corner of the plate. This will select and then unselect all
wells.
Setting Up the Plate 6
Select and view wells in the plate map
View details of a well or wells
When the plate map is displaying all 96 wells, details such as target
names and standard quantities are not displayed. The Plate Setup screen
offers multiple ways to view the detailed properties of a single well or
multiple wells.
View details of an individual well
To view the detailed properties of an individual well:
• Hover the cursor over the well.
The program opens a larger schematic of the well that displays the
properties assigned to the well.
Agilent Aria Real-Time PCR Program 80
Page 81

6 Setting Up the Plate
Select and view wells in the plate map
Zoom in/out on the plate map
You can zoom in and zoom out on the wells of the plate map using the
commands on the plate map short- cut menu.
To zoom in on the wells of the plate map:
1 Right- click anywhere on the plate map.
The short- cut menu opens.
2 Click Zoom In.
The program zooms in on the plate map, displaying fewer wells in more
detail.
3 If desired, repeat steps 1- 2 to zoom in further.
To zoom out on the wells of the plate map:
1 Right- click anywhere on the plate map.
The short- cut menu opens.
2 Click Zoom Out.
The program zooms out on the plate map.
3 If desired, repeat steps 1- 2 to zoom out until the plate map displays all
96 wells.
View a mini plate map
The minimap tool allows you to limit the plate map to specific wells,
which enables you to view more detailed information on the properties of
those wells.
81 Agilent Aria Real-Time PCR Program
Page 82

Setting Up the Plate 6
Select and view wells in the plate map
To view a mini plate map:
1 In the Properties panel, click the Minimap icon.
The Minimap box opens. This box displays a small schematic of the
plate map.
2 In the Minimap box, click the zoom scroll bar to zoom in on the wells
in the minimap.
The red box outlines the wells to be included in the minimap.
3 Click and drag the red box to capture the wells that you want to view
in more detail.
Agilent Aria Real-Time PCR Program 82
Page 83

6 Setting Up the Plate
Select and view wells in the plate map
4 Click the X in the upper right corner of the Minimap box to close the
box.
The plate map on the Plate Setup screen displays only the wells
selected in the Minimap box.
To restore the mini plate map to the full 96 wells:
1 In the Properties panel, click the Minimap icon.
The Minimap box opens.
83 Agilent Aria Real-Time PCR Program
Page 84

Setting Up the Plate 6
Select and view wells in the plate map
2 Click the Maximize icon in the lower left corner of the Minimap box.
3 Click the X in the upper right corner of the Minimap box to close the
box.
The plate map displays all 96 wells.
Agilent Aria Real-Time PCR Program 84
Page 85

6 Setting Up the Plate
Export the plate map image
Export the plate map image
The image of the Plate Setup screen's plate map can be exported to a
Microsoft PowerPoint presentation.
To open the Plate Setup screen: With an experiment or project file open,
click Plate Setup in the Experiment Area panel on the left side of the
screen.
To export an image of the plate map to PowerPoint:
• From the Plate Setup screen, right- click anywhere on the plate map. In
the short- cut menu, click Send Image to PowerPoint.
PowerPoint opens to a new presentation file with the plate map image
on the slide.
85 Agilent Aria Real-Time PCR Program
Page 86

Setting Up the Plate 6
Assign plate properties for a Quantitative PCR DNA Binding Dye experiment
Assign plate properties for a Quantitative PCR DNA Binding Dye
experiment
The controls on Plate Setup screen's Properties panel allow you to create
a customized plate setup for experiments of the type Quantitative PCR -
DNA Binding Dye Including Standard Melt.
To open the Plate Setup screen: When you create a new Quantitative
PCR experiment, you will automatically be directed to the Plate Setup
screen. To return to the Plate Setup screen at any time before, during, or
after a run, click Plate Setup in the Experiment Area panel on the left
side of the screen.
Assign well types
Use the Well Types drop- down list to assign well types to all the wells
used in the experiment. See “Well types for Quantitative PCR experiments”
on page 62 for a description of the available well types.
To assign well types:
1 On the Plate Setup screen, select all the wells in the plate map that are
of the same type. (For instructions on well selection, see “Select and
view wells in the plate map” on page 79.)
2 Select a well type from the Well Types drop- down list in the Properties
panel.
When the Show setting on the Properties panel is set to Type, the well
type appears at the top of the selected wells.
3 Repeat steps 1- 2 for all well types to be included in the experiment.
Assign well names
After you assign wells to a well type you can, if desired, assign custom
well names. Well names can be assigned manually or they can be imported
from an Excel spreadsheet or comma-delimited text file.
Assign wells to a well type before assigning well names.
Agilent Aria Real-Time PCR Program 86
Page 87

6 Setting Up the Plate
Assign plate properties for a Quantitative PCR DNA Binding Dye experiment
To assign well names manually:
1 On the Properties panel of the Plate Setup screen, next to Show, select
Name.
The Well Name field becomes available for typing.
2 Select all the wells in the plate map that you want to assign to the
same well name. (For instructions on well selection, see “Select and
view wells in the plate map” on page 79.)
3 In the Well Name field, type the well name for the selected wells. Press
Enter.
The Well Name appears at the top of the selected wells.
Well names must not start with the number zero (0).
4 Repeat steps 2- 3 for all well names that you want to assign.
To assign well names by importing an Excel spreadsheet or
comma- delimited text file:
1 Create the Excel spreadsheet or comma- delimited text file and save it
to a location that is accessible while working in the Aria software.
The file must be formatted as shown below with well IDs on the left
and well names on the right. The well IDs may appear in any order but
must use the syntax A1—H12.
2 On the Plate Setup screen, right- click on the plate map. In the menu
that opens, click Import Well Name.
The Open dialog box opens.
3 At the bottom of the dialog box, use the drop- down list to select the
appropriate file type (Text, Excel Workbook, or Excel 97- 2003
Workbook).
87 Agilent Aria Real-Time PCR Program
Page 88

Assign plate properties for a Quantitative PCR DNA Binding Dye experiment
4 Browse to the file created in step 1. Select the file and click Open.
The software imports the well names from the file into the experiment.
A message box opens notifying you that the import was successful.
5 Click OK in the message box to close it.
The plate map displays the imported well names. For any wells that
have not yet been assigned a well type, the well name remains blanks
until a well type is assigned.
Assign dyes/targets
Use the check boxes, drop-down lists, and fields under Assign
Dyes/Targets to indicate which dyes are being used in each well and what
target each dye is detecting. Dye assignments are required, but target
name assignments are optional. If different wells will be using the same
dye to detect different targets, assigning a unique name to each target
enables the program to treat each target separately during analysis.
Setting Up the Plate 6
To assign dyes and target names:
1 On the Plate Setup screen, select all the wells in the plate map that
contain the same target. (For instructions on well selection, see “Select
and view wells in the plate map” on page 79.)
2 In the Properties panel, under Add Dyes, mark the Use check box for
the dye used for target detection in the selected wells.
3 If the fields for entering target names are not displayed, click the arrow
next to Targets.
The fields appear to the right of the dye names.
Agilent Aria Real-Time PCR Program 88
Page 89

6 Setting Up the Plate
Assign plate properties for a Quantitative PCR DNA Binding Dye experiment
4 For the marked dye, type a name into the adjacent Target Name field.
The program assigns the target name to the selected wells.
If you do not assign a target name, the program uses the dye name as
the target name.
5 Repeat steps 1- 4 for all wells included in use in the experiment.
6 (Optional) Select a new color to associate with a target:
a Click the colored dot to right of the Target Name field.
b In the selection box that opens, click the desired color, or click
Advanced for more color options.
Select a reference dye
You can include a reference dye (e.g., ROX dye) to normalize the
fluorescence signal of the reporter dye.
To assign a reference dye:
• On the Plate Setup screen, select the reference dye from the Reference
Dye drop- down list in the Properties panel.
The program assigns the target name REF to all wells in use in the
experiment and displays an R ( ) in the wells of the plate map to
indicate that the well contains a reference dye.
89 Agilent Aria Real-Time PCR Program
Page 90

Assign plate properties for a Quantitative PCR DNA Binding Dye experiment
Assign replicates
The Aria program uses replicate ID numbers to denote technical
replicates. Technical replicates are QPCR reaction tubes containing
identical reaction components and set up using a template from the exact
same biological sample source. While biological replicates measure the
variability in the experimental results due to uncontrolled biological
variation from sample to sample, technical replicates are used to measure
the variability in results that is introduced during the process of
experimental setup.
You can assign replicates using the Manual option or the Auto option.
When you designate replicate wells on the Plate Setup screen, you can set
the analysis criteria to average results from those wells or treat the wells
separately.
Setting Up the Plate 6
NOTE
When assigning replicates, if you see a flashing red warning icon in the Properties
panel next to Replicates, you have an invalid replicate set on the plate. To be valid,
all the wells of a set must be of the same well type and have the same target
assignments. Hover your cursor over the warning icon to view specific
information on why the program has called a replicate set invalid.
To assign replicates with the Auto option:
1 On the Plate Setup screen, select all the wells on the plate map that
have the same number of wells per replicate set.
2 In the Properties panel under Replicates, select Auto.
3 In the Direction of Assignment drop- down list, specify how the
replicate wells are arranged on the plate.
Agilent Aria Real-Time PCR Program 90
Page 91

6 Setting Up the Plate
Assign plate properties for a Quantitative PCR DNA Binding Dye experiment
• Select Horizontal if the replicate reactions will be arranged
horizontally in rows.
• Select Vertical if the replicate reactions will be arranged vertically in
columns.
4 In the Wells per replicate set field, type the number of replicate wells
per reaction, or click the +/- buttons to enter the desired number.
The assigned replicate number appears in each selected well.
5 If desired, make adjustment to the auto- assignments in any of the wells
of the plate by switching to the Manual option and manually assigning
replicate numbers to those wells.
To manually assign replicates:
1 On the Plate Setup screen, select a set of wells that are part of the
same replicate set. Make sure that the selected wells are of the same
well type and contain identical targets. (For instructions on well
selection, see “Select and view wells in the plate map” on page 79.)
2 In the Properties panel under Replicates, select Manual (if not already
selected).
3 In the Assign Replicate Number field, type in the desired replicate
number for the selected wells, or click the +/- buttons to enter the
desired number.
The assigned replicate number appears in each selected well.
To assign replicates using Auto Increment:
1 On the Plate Setup screen, assign well types as needed for your
experiment.
2 In the Properties panel under Replicates, select Manual (if not already
selected).
3 Click Auto Increment.
91 Agilent Aria Real-Time PCR Program
Page 92

Assign plate properties for a Quantitative PCR DNA Binding Dye experiment
When you hover your cursor anywhere on the plate map, an icon of the
number 1 appears next to the cursor.
4 With the cursor, click and drag across the group of wells that you want
to assign as replicate number 1.
The program assigns the wells to replicate number 1, and the icon next
to the cursor changes to a number 2.
5 Click and drag across the group of wells that you want to assign as
replicate number 2.
The program assigns the wells to replicate number 2, and the icon next
to the cursor changes to a number 3.
6 Continue assigning replicate numbers for the remainder of the plate.
When finished, click Auto Increment to turn off the Auto Increment
function.
Assign quantities to Standard wells
In order to generate a standard curve from your data, you need to assign
the initial template quantity to each Standard well.
Setting Up the Plate 6
To assign the standard quantities for a target in the Standard wells:
1 On the Plate Setup screen, select the Standard wells. (For instructions
on well selection, see “Select and view wells in the plate map” on
page 79.)
2 In the Properties panel under Standard Quantities, select which target
in the selected wells is the standard target (i.e., the target of known
quantity in the template).
Agilent Aria Real-Time PCR Program 92
Page 93

6 Setting Up the Plate
Assign plate properties for a Quantitative PCR DNA Binding Dye experiment
3 In the Starting Amount field, type in the quantity of the standard target
present in the first replicate set of Standard wells. You will be asked to
specify the units for this amount in step 5.
NOTE
This quantity must be either the highest quantity or the lowest quantity in the
dilution series of the standard template sample.
4 In the drop- down list labeled A factor of, select the dilution factor
used to generate the dilution series of the standard template. For
example, if each standard quantity is separated by a factor of 10, select
10x. Negative dilution factors are used to specify a decrease in quantity
from the starting amount while positive dilution factors specify an
increase from the starting amount.
5 In the drop- down list labeled Units (for Plate), select the units of the
quantity entered in the Starting Amount field. Note that all Standard
wells on the plate must use the same units.
To clear the assigned standard quantity from one or more wells:
• Select the well(s) and click Clear.
93 Agilent Aria Real-Time PCR Program
Page 94

Setting Up the Plate 6
Assign plate properties for a Quantitative PCR Fluorescence Probe experiment
Assign plate properties for a Quantitative PCR Fluorescence Probe
experiment
The controls on Plate Setup screen's Properties panel allow you to create
a customized plate setup for experiments of the type Quantitative PCR -
Fluorescence Probe.
To open the Plate Setup screen: When you create a new Quantitative
PCR experiment, you will automatically be directed to the Plate Setup
screen. To return to the Plate Setup screen at any time before, during, or
after a run, click Plate Setup in the Experiment Area panel on the left
side of the screen.
Assign well types
Use the Well Types drop- down list to assign well types to all the wells
used in the experiment. See “Well types for Quantitative PCR experiments”
on page 62 for a description of the available well types.
To assign well types:
1 On the Plate Setup screen, select all the wells in the plate map that are
of the same type. (For instructions on well selection, see “Select and
view wells in the plate map” on page 79.)
2 Select a well type from the Well Types drop- down list in the Properties
panel.
When the Show setting on the Properties panel is set to Type, the well
type appears at the top of the selected wells.
3 Repeat steps 1 and 2 for all well types to be included in the
experiment.
Assign well names
After you assign wells to a well type you can, if desired, assign custom
well names. Well names can be assigned manually or they can be imported
from an Excel spreadsheet or comma-delimited text file.
Assign wells to a well type before assigning well names.
Agilent Aria Real-Time PCR Program 94
Page 95

6 Setting Up the Plate
Assign plate properties for a Quantitative PCR Fluorescence Probe experiment
To assign well names manually:
1 On the Properties panel of the Plate Setup screen, next to Show, select
Name.
The Well Name field becomes available for typing.
2 Select all the wells in the plate map that you want to assign to the
same well name. (For instructions on well selection, see “Select and
view wells in the plate map” on page 79.)
You must assign a well to a well type before you can assign it a well
name.
3 In the Well Name field, type the well name for the selected wells. Press
Enter.
The Well Name appears at the top of the selected wells.
Well names must not start with the number zero (0).
4 Repeat steps 2- 3 for all well names that you want to assign.
To assign well names by importing an Excel spreadsheet or
comma- delimited text file:
1 Create the Excel spreadsheet or comma- delimited text file and save it
to a location that is accessible while working in the Aria software.
The file must be formatted as shown below with well IDs on the left
and well names on the right. The well IDs may appear in any order but
must use the syntax A1—H12.
2 On the Plate Setup screen, right- click on the plate map. In the menu
that opens, click Import Well Name.
The Open dialog box opens.
95 Agilent Aria Real-Time PCR Program
Page 96

Assign plate properties for a Quantitative PCR Fluorescence Probe experiment
3 At the bottom of the dialog box, use the drop- down list to select the
appropriate file type (Text, Excel Workbook, or Excel 97- 2003
Workbook).
4 Browse to the file created in step 1. Select the file and click Open.
The software imports the well names from the file into the experiment.
A message box opens notifying you that the import was successful.
5 Click OK in the message box to close it.
The plate map displays the imported well names. For any wells that
have not yet been assigned a well type, the well name remains blanks
until a well type is assigned.
Assign dyes/targets
Use the check boxes, drop-down lists, and fields under Assign
Dyes/Targets to indicate which dyes are being used in each well and what
target each dye is detecting. Dye assignments are required, but target
name assignments are optional. If different wells will be using the same
dye to detect different targets, assigning a unique name to each target
enables the program to treat each target separately during analysis.
Setting Up the Plate 6
To assign dyes and target names:
1 On the Plate Setup screen, select all the wells in the plate map that
contain the same target. (For instructions on well selection, see “Select
and view wells in the plate map” on page 79.)
2 Under Add Dyes, mark the Use check boxes for the dyes used for target
detection in the selected wells.
Agilent Aria Real-Time PCR Program 96
Page 97

6 Setting Up the Plate
Assign plate properties for a Quantitative PCR Fluorescence Probe experiment
3 If the fields for entering target names are not displayed, click the arrow
next to Targets.
The fields appear to the right of the dye names.
4 For the marked dyes, type a name into the adjacent Target Name field.
The program assigns the target names to the selected wells.
If you do not assign a target name to a marked dye, the program uses
the dye name as the target name.
5 Repeat steps 1- 4 for all wells included in use in the experiment.
6 (Optional) Select a new color to associate with a target:
a Click the colored dot to right of the Target Name field.
b In the selection box that opens, click the desired color, or click
Advanced for more color options.
Select a reference dye
You can include a reference dye (e.g., ROX dye) to normalize the
fluorescence signal of the reporter dye.
To assign a reference dye:
• On the Plate Setup screen, select the reference dye from the Reference
Dye drop- down list in the Properties panel.
The program assigns the target name REF to all wells in use in the
experiment and displays an R ( ) in the wells of the plate map to
indicate that the well contains a reference dye.
97 Agilent Aria Real-Time PCR Program
Page 98

Assign plate properties for a Quantitative PCR Fluorescence Probe experiment
Assign replicates
Replicates are wells that contain identical reaction components (repeats).
You can assign replicates using the Manual option or the Auto option.
When you designate replicate wells on the Plate Setup screen, you can set
the analysis criteria to average results from those wells or treat the wells
separately.
Setting Up the Plate 6
NOTE
When assigning replicates, if you see a flashing red warning icon in the Properties
panel next to Replicates, you have an invalid replicate set on the plate. To be valid,
all the wells of a set must be of the same well type and have the same target
assignments. Hover your cursor over the warning icon to view specific
information on why the program has called a replicate set invalid.
To assign replicates with the Auto option:
1 On the Plate Setup screen, select all the wells on the plate map that
have the same number of wells per replicate set.
2 In the Properties panel under Replicates, select Auto.
3 In the Direction of Assignment drop- down list, specify how the
replicate wells are arranged on the plate.
• Select Horizontal if the replicate reactions will be arranged
horizontally in rows.
• Select Vertical if the replicate reactions will be arranged vertically in
columns.
4 In the Wells per replicate set field, type the number of replicate wells
per reaction, or click the +/- buttons to enter the desired number.
The assigned replicate number appears in each selected well.
Agilent Aria Real-Time PCR Program 98
Page 99

6 Setting Up the Plate
Assign plate properties for a Quantitative PCR Fluorescence Probe experiment
5 If desired, make adjustment to the auto- assignments in any of the wells
of the plate by switching to the Manual option and manually assigning
replicate numbers to those wells.
To manually assign replicates:
1 On the Plate Setup screen, select a set of wells that are part of the
same replicate set. Make sure that the selected wells are of the same
well type and contain identical targets. (For instructions on well
selection, see “Select and view wells in the plate map” on page 79.)
2 In the Properties panel under Replicates, select Manual (if not already
selected).
3 In the Assign Replicate Number field, type in the desired replicate
number for the selected wells, or click the +/- buttons to enter the
desired number.
The assigned replicate number appears in each selected well.
To assign replicates using Auto Increment:
1 On the Plate Setup screen, assign well types as needed for your
experiment.
2 In the Properties panel under Replicates, select Manual (if not already
selected).
3 Click Auto Increment.
When you hover your cursor anywhere on the plate map, an icon of the
number 1 appears next to the cursor.
4 With the cursor, click and drag across the group of wells that you want
to assign as replicate number 1.
99 Agilent Aria Real-Time PCR Program
Page 100

Assign plate properties for a Quantitative PCR Fluorescence Probe experiment
The program assigns the wells to replicate number 1, and the icon next
to the cursor changes to a number 2.
5 Click and drag across the group of wells that you want to assign as
replicate number 2.
The program assigns the wells to replicate number 2, and the icon next
to the cursor changes to a number 3.
6 Continue assigning replicate numbers for the remainder of the plate.
When finished, click Auto Increment to turn off the Auto Increment
function.
Assign quantities to Standard wells
In order to generate a standard curve from your data, you need to assign
the initial template quantity to each Standard well.
Setting Up the Plate 6
To assign the standard quantities for a target in the Standard wells:
1 On the Plate Setup screen, select the Standard wells. (For instructions
on well selection, see “Select and view wells in the plate map” on
page 79.)
2 In the Properties panel under Standard Quantities, select which target
in the selected wells is the standard target (i.e., the target of known
quantity in the template).
3 In the Starting Amount field, type in the quantity of the standard target
present in the first replicate set of Standard wells. You will be asked to
specify the units for this amount in step 5.
NOTE
Agilent Aria Real-Time PCR Program 100
This quantity must be either the highest quantity or the lowest quantity in the
dilution series of the standard template sample.
 Loading...