

Page 1
Measuring High Power Waveforms
with the Agilent 86100A Digital
Communications Analyzer and the
86101A or 86103A Reference Receiver
Product Note 86100-2
Page 2
2
The Agilent 86100A Digital Communications Analyzer (DCA) with
the 86101A/103A plug-in module is designed to perform Gigabit
Ethernet and Fibre Channel compliance testing. The Agilent
86101A has a built-in optical receiver to allow direct measurements
of transmitters operating in the 750 to 860 nm range and the
Agilent 86103A measures transmitters with operating wavelengths
from 980 to 1625 nm. These receivers have been designed to test
both low and high power signals. However, there are certain cases
where signal powers cause an overload/saturation situation in the
instrument which can lead to inaccurate results. This document is
intended to identify these conditions and present methods to ensure
valid measurement results. Since current commercial transceivers
tend to have more overshoot and ringing in the 750 to 860 nm
wavelengths, this paper will focus on the 86101A. However all of the
principles and techniques are equally applicable to the 86103A.
The Agilent 86100A wide-bandwidth digitizing oscilloscope has
built-in capabilities to perform measurements on high-speed digital
communications components and systems. The oscilloscope mainframe
accommodates one or two plug-in modules that are designed for
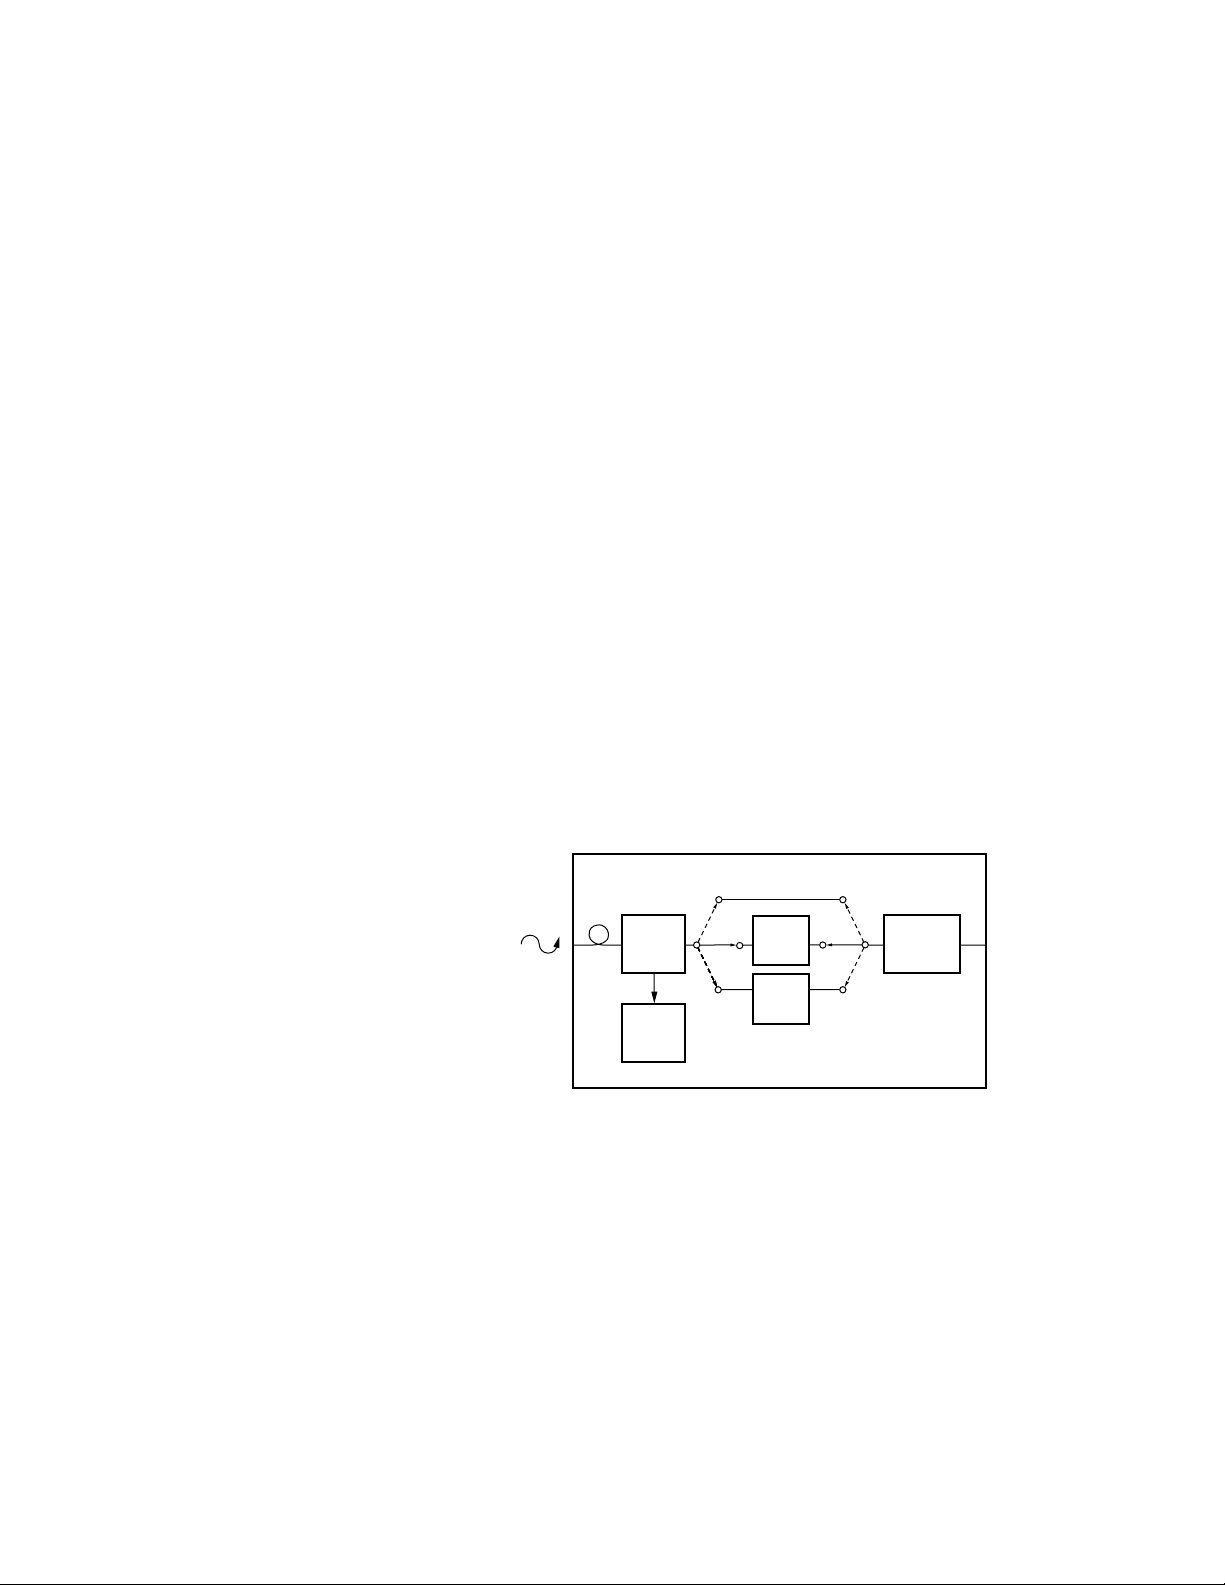
different types of signals. The Agilent 86101A plug-in module has
an electrical channel, an integrated optical receiver channel, and a
built-in average power meter. The optical receiver includes an amplified
photodiode (transimpedance amplifier) and dual switchable filters.
Figure 1. Agilent 86101A/103A block diagram
Eye-diagram tests are performed through a filtered bandwidth to
determine compliance to Gigabit Ethernet standards. The bandwidth
of the oscilloscope, including the optical receiver, is controlled to
meet a specific frequency response. This response is carefully
defined to have a fourth-order Bessel-Thomson response with the
filter’s 3 dB bandwidth being 75% of the data rate. For Gigabit
Ethernet (1.25 Gb/s) this frequency is 938 MHz. The specified
Bessel-Thomson filter provides measurement consistency between
different test systems. Without the use of Bessel-Thomson filters,
transceiver measurements and compliance test results could vary
depending upon the bandwidth and frequency response of the test
system being used.
Introduction
The Agilent 86100A/86101A
measurement configuration
Eye-diagram compliance
testing
Agilent 86101A/103A Optical Receiver
Amplified
Optical
Receiver
Average
Power
Monitor
Fibre
Channel
Filter
Gbit
Ethernet
Filter
Sampling/
Amplification
Page 3

3
For example, high-speed lasers often exhibit significant overshoot
and ringing. This ringing is a high-frequency effect that can only be
observed when the oscilloscope system has a wide bandwidth. The
overshoot usually does not impact communication system performance
because system receivers have just enough bandwidth for an optimum
Bit Error Ratio (BER) and do not respond to these higher frequencies.
The unfiltered waveform resulting from this overshoot generally
will not be compliant with an eye-diagram mask test (see Figure 2).
However, when the filter is used, the test system approximates the
response of a system level receiver. With filtering, this same laser
can be shown to be mask test compliant (see Figure 3).
Figure 2. Unfiltered transmitter waveform
Figure 3. Transmitter waveform mask test with filtering
Page 4

4
The Agilent 86101A is specified to accurately measure peak modulated
signal powers up to 400 µW (–4 dBm).1If a signal has an average
power of 200 µW (–7 dBm) with an extinction ratio of 10 dB or
higher, then the peak power may be assumed to be roughly double
the average power, or 400 µW (see Figure 4). When signal powers
exceed this 400 µW level, the photodiode amplifier of the Agilent
86101A may begin to saturate. This in turn can distort the shape of
the waveform and produce a false waveform image. A device that
has a compliant waveform may then actually fail a mask test.
Figure 4. Signal without high frequency ringing
This issue becomes more complex for devices which have a large
overshoot in the “0” to “1” transition. It is not unusual to have 100%
overshoot when working with high-speed multimode transceivers.
If the nominal ‘1’ level is 400 µW, and the overshoot is 100%, the peak
power seen by the Agilent 86101A is 800 µW (with 100% overshoot
present, peak power is roughly four times average power — see
Figure 5). This power level is likely to cause amplifier saturation
and waveform distortion. If tests are made in the Agilent 86101A
filtered mode, the overshoot is suppressed by the filtering that
takes place after the amplification. Post-amplification filtering can
hide the overshoot that may cause distortion.
Figure 5. Signal with overshoot and high frequency ringing
1
While the Agilent 86101A module is specified to receive a continuous wave peak power of up to
600 µW (–2.2 dBm), high frequency ringing in a modulated signal can cause compression at
lower levels around 400 µW peak power.
Waveform distortion through
receiver compression
Peak Power
and Nominal
'1'
≈
2x
Avg Power
= x
'1' Bit '0' Bit
Time
Peak Power
≈
4x
Nominal '1'
≈
2x
Avg Power
= x
'1'Bit '0' Bit
Time
Page 5

5
Table 1. Recommended attenuation for signals ≥–10 dBm with 100% overshoot
Average Power Peak Power (100%) Attenuator Net InputµW dBm
µW dBm dB Ave. dBm Peak dBm
100 –10.0 400 –4.0 0.0 –10.0 –4.0
125 –9.0 500 –3.0 1.0 –10.0 –4.0
200 –7.0 800 –1.0 3.0 –10.0 –4.0
316 –5.0 1265 1.0 5.0 –10.0 –4.0
400 –4.0 1600 2.0 6.0 –10.0 –4.0
500 –3.0 2000 3.0 7.0 –10.0 –4.0
800 –1.0 3200 5.1 9.1 –10.0 –4.0
1000 0.0 4000 6.0 10.0 –10.0 –4.0
In order to find out if your device under test may be exceeding the
input power requirements for the Agilent 86101A, first measure the
average power with the internal power meter, and then measure
the peak power on the eye diagram. If the average power exceeds
–10 dBm (100 µW), you may need to attenuate the signal (this
assumes there is 100% overshoot present). Insert the recommended
attenuation from the above table, and then measure the average
power again. If you are using a laboratory attenuator, then you will
have a digital readout of the attenuation. If you are using a simple
fixed attenuator, then the attenuation value will be the difference
between the average power reading with and without the attenuator.
If overshoot is present, the correct level of attenuation is the
attenuation required to reduce the average power to –10 dBm. For
example, a –3 dBm average power signal would require 7 dB of
attenuation (–3 dBm –7 dB = –10 dBm which requires a 7 dB
attenuator). This is based upon the assumption of a worst case
overshoot of 100%.2The end result is that the maximum peak signal
at the instrument input must be below 400 µW (–4 dBm). Again,
this is peak power and should not be confused with average power.
Attenuation is not required for signals that do not exceed 400 µW
peak. Table 1 shows the conversion from average power to peak
power when the overshoot is 100% (the peak power is double the “1”
level power), and the attenuation needed to make measurements
for power levels of these magnitudes. Note that the current
maximum average power allowed by the Gigabit Ethernet IEEE
802.3z standard is –5 dBm.
Achieving accurate measurement results may require limiting the
power going into the Agilent 86101A optical port. For the 100%
overshoot example above (200 µW average power, 400 µW ‘1’ level,
800 µW peak power), the signal must be attenuated by a factor of
two (3 dB). A basic rule of thumb for signals with up to 100% overshoot
is that the average power should not exceed 100 µW (–10 dBm).
Average power can be measured directly using the internal power
meter of the Agilent 86101A. Average power measurements are made
independent of the amplifier and are accurate up to an average input
power level of 500 µW or –3.0 dBm (2000 µW peak power input).
Steps to guarantee accurate
results
2
It should be noted that there may be an additional attenuation that is a result of the 3 dB rolloff
associated with the unfiltered bandwidth of the 86101A which will affect the way the overshoot of
the high frequency ringing is displayed. For example, if the signal in Figure 5 is a Gigabit Ethernet
signal with a 1.25 Gb/s transmission rate, the actual high frequency ringing is somewhere between
2.5 and 3 GHz, which is close to the 3 dB rolloff point of the receiver. In order to determine the
actual peak power, you must correct the displayed peak power for the frequency dependent rolloff.
Page 6

6
The Agilent 86100A allows the attenuation to be accounted for and
removed from the measurement. Press the appropriate channel
configuration button at the bottom of the touchscreen. Then enter
in the attenuation value which you just measured and the instrument
will then read the true signal level prior to attenuation. You can
then go back and measure the peak power on the eye diagram again.
If this measurement is the same as the original peak measurement
without the attenuator, then you do not have compression and you
are in a safe measurement power zone with or without the attenuator.
If the peak measurement was less without the attenuator, then you
had compression during the initial measurement and the second
measurement with the attenuator and associated offset adjustment
is the accurate measurement. For many signals, the easiest way to
proceed is to always use the attenuator with the correct offset.
Exceptions to this recommendation are: 1) When you are splitting
the signal for multiple tests or there is already another source of
attenuation in front of the Agilent 86101A, or 2) You know that there
is no high frequency ringing associated with the device under test
and you want to use the maximum sensitivity of the Agilent 86101A.
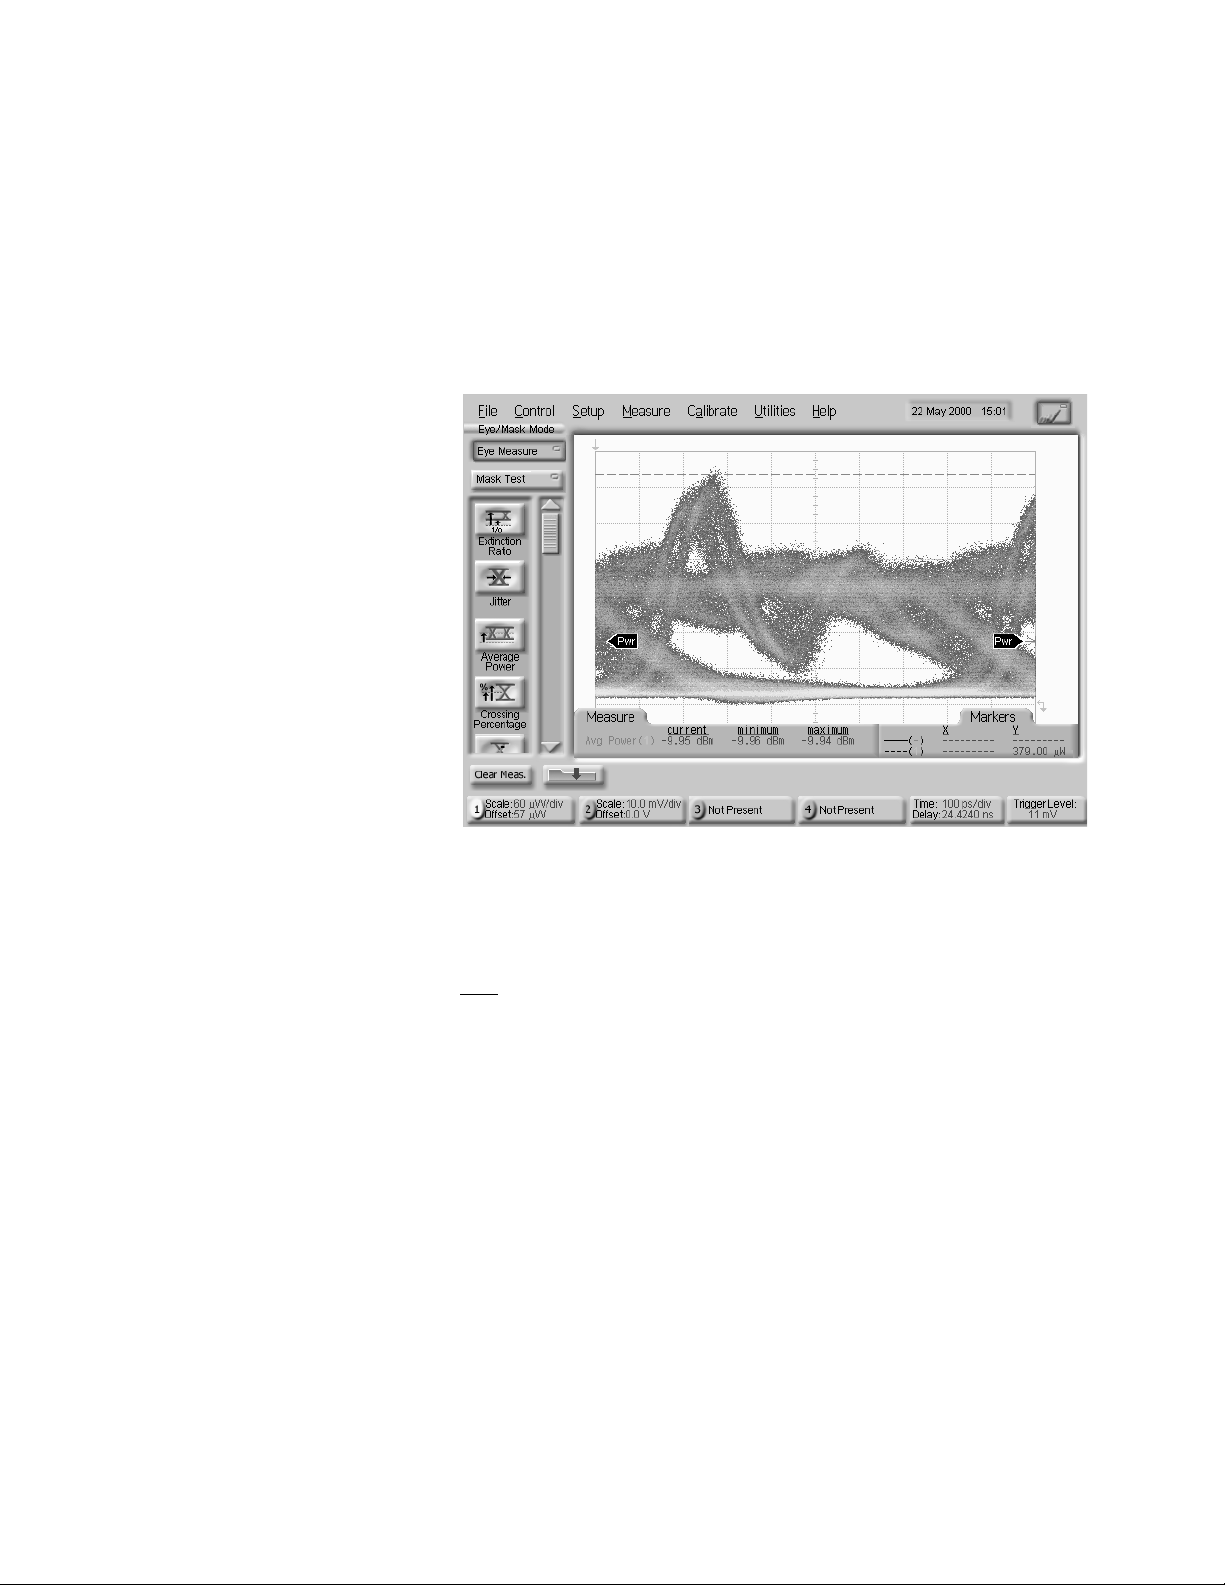
The following is an example of the above measurement procedure.
The laser under test is connected to the Agilent 86100A/86101A.
The average power measurement is enabled and the waveform is
viewed in the unfiltered mode (Figure 6). The average power is
–6.9 dBm (202 µW) and the waveform shows significant overshoot.
Figure 6. High power waveform with overshoot and ringing, unfiltered
Measurement
example
Page 7
7
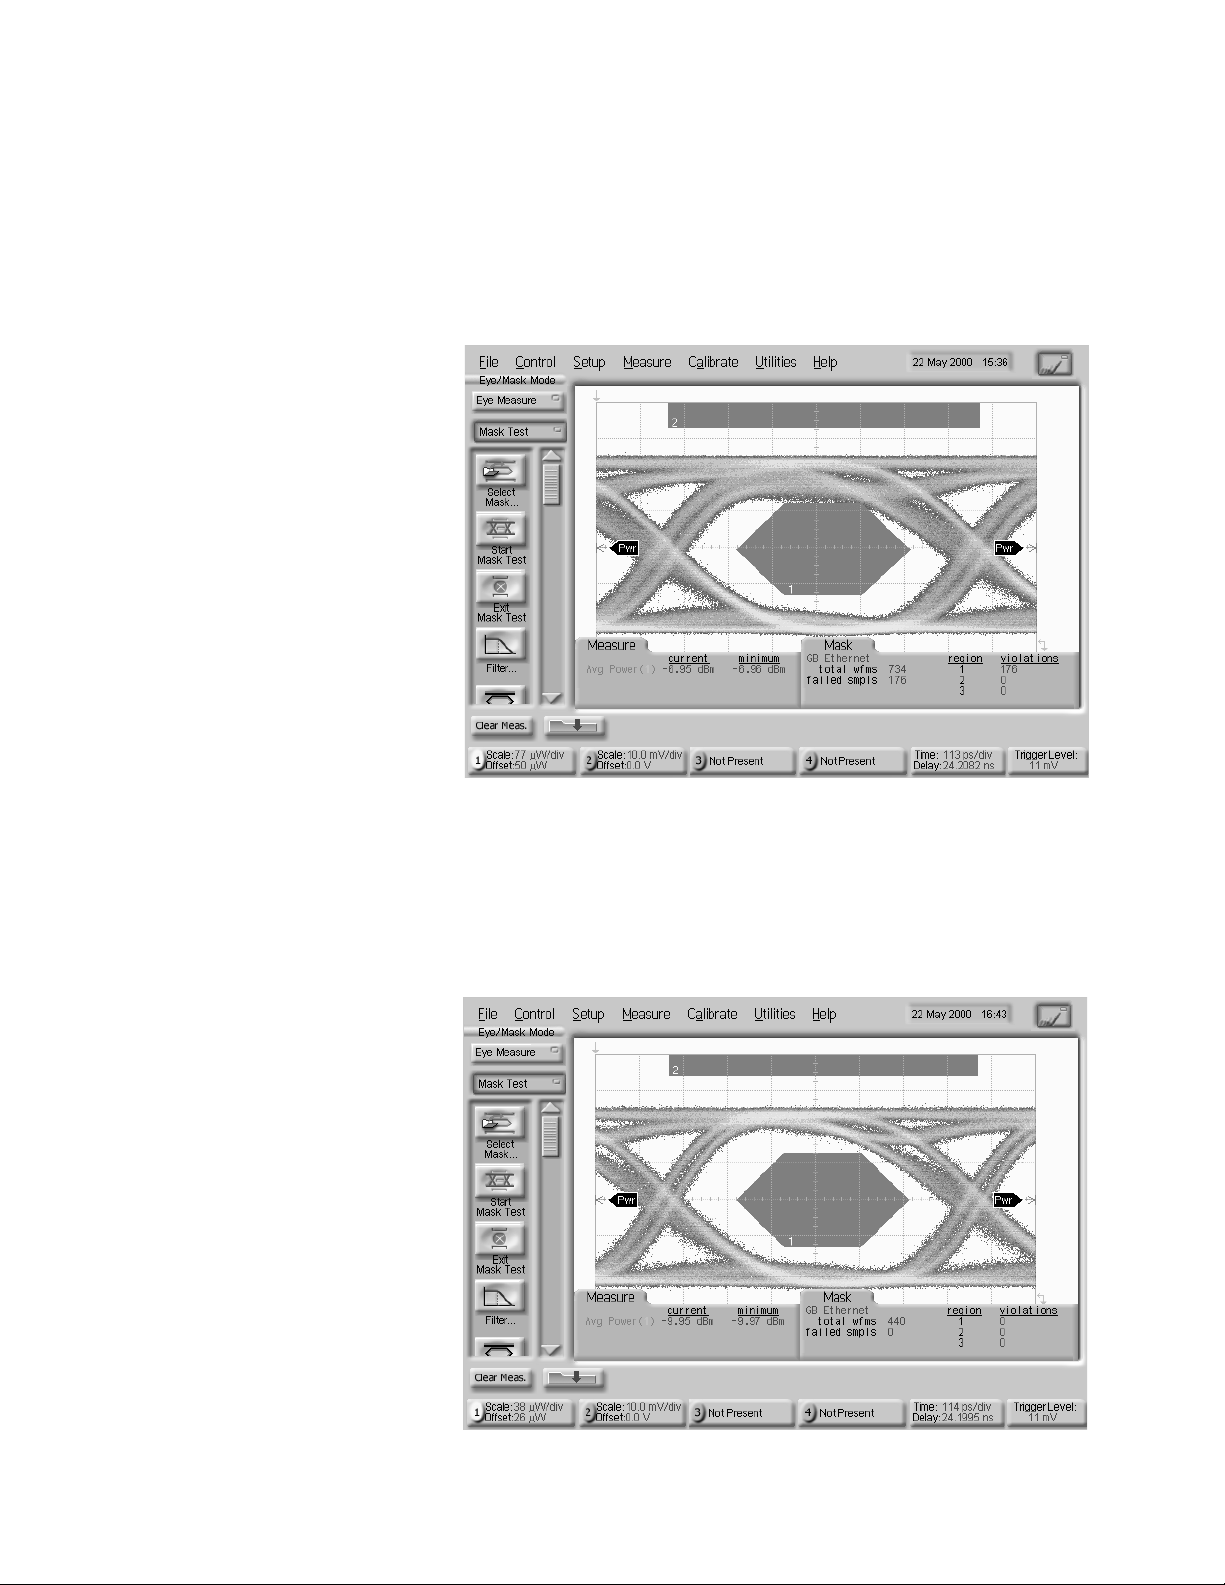
If the Gigabit Ethernet filter is enabled and a mask test is performed,
the device does not pass the compliance test (Figure 7). However,
this is likely due to the Agilent 86101A’s saturation and is not
indicative of the true laser waveform.
Figure 7. Mask test of high power waveform
Attenuation is added to the signal to reduce the average power to
–10 dBm. The waveform is then viewed again through the mask
compliance test. The waveform easily passes the compliance test in
the filtered mode now that the signal level is compatible with the
Agilent 86101A (Figure 8).
Figure 8. Mask test of high power waveform with attenuation
Page 8
8
It is useful to look again at the waveform in the unfiltered condition
(Figure 9). This allows us to see the undistorted performance of the
laser. Although the laser still exhibits significant overshoot and
ringing, the waveform appears different than when viewed without
attenuation (Figure 6). The differences are due to the instrument’s
oversaturation and compression in the Figure 6 measurement.
Figure 9. Unfiltered high power waveform after attenuation
To complete the measurement process, the external scale of the
instrument is adjusted 3 dB (Figure 11). The instrument now
displays the true signal power of the laser under test (–6.95 dBm
average power with a peak power of 740 µW–see Figure 11).
3
3
Note that the average power measurement did not change when we used the attenuator and
adjusted the offset because the unattenuated signal is within the input specifications of the
average power meter. However, the peak power measurement changed from 631 µW tp 740 µW,
when we used the attenuator and made the external scale adjustment. The 740 µW is the more
accurate measurement.
Page 9

9
Figure 10. External scale adjustment
Figure 11. Adjusting external scale to show true power levels
The Agilent 86100A with the 86101A/103A plug-in module was
designed for high sensitivity and has excellent waveform fidelity for
signals with modulated peak powers less than 400 µW (–4 dBm).
For signals with peak powers greater than 400 µW (–4 dBm), an
external multimode attenuator is used to maintain high waveform
fidelity. By using the correct attenuator, and entering the attenuation correction factor into the external scale variable, the Agilent
86100A/101A/103A makes true Fibre Channel and Gigabit Ethernet
compliance measurements throughout the entire power range
specified by the standards.
Conclusion
Page 10

For more information about Agilent Technologies
test and measurement products, applications,
services, and for a current sales office listing,
visit our web site,
www.agilent.com/comms/lightwave
You can also contact one of the
following centers and ask for a test and
measurement sales representative.
United States:
Agilent Technologies
Test and Measurement Call Center
P.O. Box 4026
Englewood, CO 80155-4026
(tel) 1 800 452 4844
Canada:
Agilent Technologies Canada Inc.
5150 Spectrum Way
Mississauga, Ontario
L4W 5G1
(tel) 1 877 894 4414
Europe:
Agilent Technologies
Test & Measurement
European Marketing Organization
P.O. Box 999
1180 AZ Amstelveen
The Netherlands
(tel) (31 20) 547 2000
Japan:
Agilent Technologies Japan Ltd.
Call Center
9-1, Takakura-Cho, Hachioji-Shi,
Tokyo 192-8510, Japan
(tel) (81) 426 56 7832
(fax) (81) 426 56 7840
Latin America:
Agilent Technologies
Latin American Region Headquarters
5200 Blue Lagoon Drive, Suite #950
Miami, Florida 33126, U.S.A.
(tel) (305) 267 4245
(fax) (305) 267 4286
Australia/New Zealand:
Agilent Technologies Australia Pty Ltd
347 Burwood Highway
Forest Hill, Victoria 3131, Australia
(tel) 1-800 629 485 (Australia)
(fax) (61 3) 9272 0749
(tel) 0 800 738 378 (New Zealand)
(fax) (64 4) 802 6881
Asia Pacific:
Agilent Technologies
24/F, Cityplaza One, 1111 King’s Road,
Taikoo Shing, Hong Kong
(tel) (852) 3197 7777
(fax) (852) 2506 9284
Technical data subject to change
Copyright © 1998
Agilent Technologies
Printed in U.S.A. 6/00
5980-1608E
 Loading...