

Page 1

DVB-C Solutions
Product Note
HP 8594Q QAM Analyzer
Page 2

2
Introduction
All cable TV network operators planning the introduction of DVB-C
(Digital Video Broadcast via Cable) services have increasing competitive pressure to install these new services - quickly. With the added
complication of migrating to a new technology, measuring new modulation types and learning how digital signals are affected through
the system, it is important to be able to quickly measure system
performance. The HP 8594Q QAM analyzer is a comprehensive
and powerful test solution for installation and maintenance test
on DVB-C systems. This product note describes the capabilities of
the HP 8594Q QAM analyzer, where it can be used and why the
measurements it performs are important.
Before describing the measurements in detail it is important to
understand the flow of data through the system from transmitter
to receiver.
The layered structure for the flow of information
Transmitter (Headend)
Video Image
Digital Compression
FEC Coding
Bit Stream Format
Pre-emphasis
Digital Modulation
RF Up-conversion
Cable Network
RF Down-conversion
Receiver (Set top)
FEC Decoding
Digital Demodulation
Adaptive Equalization
Bit Stream Deformat
Digital Decompression
Video Image
Figure 1: The layered structure for
the flow of information
Power and
Spectrum
Tests
Modulation
Quality
Tests
Data
Quality
Tests
Picture
Quality
Tests
Measurement Layers
The video image is digitized, converting the analog signal to data
bits. The data bit stream is compressed, using MPEG-2, into packet
data. These packets are then organized into the transmission format
called an MPEG-2 transport stream (TS). Forward error correction
(FEC) coding is added to protect the MPEG-2 transport stream as
it passes through the system. The digital video signal may be preemphasized to compensate for known problems in the transmission
path. Finally, the data stream is digitally modulated and upconverted to the carrier frequency.
The digital video receiver, or set top box, reverses the signal processing layers performed in the transmitter. The key advantages of a
digital receiver are the signal distortion compensation provided
in the adaptive equalizer, and the bit error correction provided
in the FEC decoder. These two signal processing blocks remove
impairments from the received signal.
Page 3

3
What measurements
are important?
Digital video signals differ from traditional analog signals in that
forward error correction and coding are designed to conceal transmission errors and linear transmission medium distortions. Therefore, different measurements are appropriate for different stages
in the transmission process.
Power and spectrum tests are applied to the RF digital video signal.
Modulation quality is assessed after digital demodulation, around
the adaptive equalizer. Data quality tests examine the integrity of
the bits recovered from the digital modulation, including the bit
correction effect of the FEC.
• Power measurements are key to adjusting levels and minimizing
inter-channel distortions throughout the cable distribution system.
• Spectrum measurements give a clear view of the RF channel
quality.
• Direct measurements on the digital modulation are useful tools
for troubleshooting the source of signal impairments.
• Data quality is the key product delivered to the subscriber.
Data quality tests are overall, end-to-end checks on the integrity
of the digital cable system.
Figure 2: A simplified view of a
cable TV system
Test from the headend through to the subscriber drop
Transport
Coax Feeder
Coax Drop
System
Hub
Headend
Amp
Amp
The HP 8594Q QAM analyzer addresses the power, modulation and
data quality measurement layers from the headend through to the
subscriber drop. Whether measuring high-level signals at the output of a modulator or measuring low-level signals in a crowded
spectrum at the subscriber drop, the HP 8594Q performs the key
RF and modulation measurements quickly and accurately.
Page 4
4
HP 8594Q
QAM Analyzer
Measurements
Qualitative and Quantitative Testing
The HP 8594Q is capable of a range of qualitative and quantitative
measurements. Qualitative measurements are an important first
step in troubleshooting.
Qualitative Measurements
When verifying modulation quality from the headend modulator
or checking signal quality throughout the distribution network,
the constellation display can provide invaluable information.
After installation or adjustment of modulators, amplifiers or
splitters, the constellation display will give a good indication
of the "health" of the signal. For example, spurious interference
will cause the constellation clusters to turn into rings and gain
compression will cause the outer clusters to be pulled in towards
the center.
When measuring the quality of the transmitted signal, it is
very useful to see a graphical representation of the constellation.
The HP 8594Q QAM analyzer carries out real-time demodulation
and adaptive equalization to provide fast updating displays of the
constellation and measurements. This fast update rate is critical
for making system adjustments.
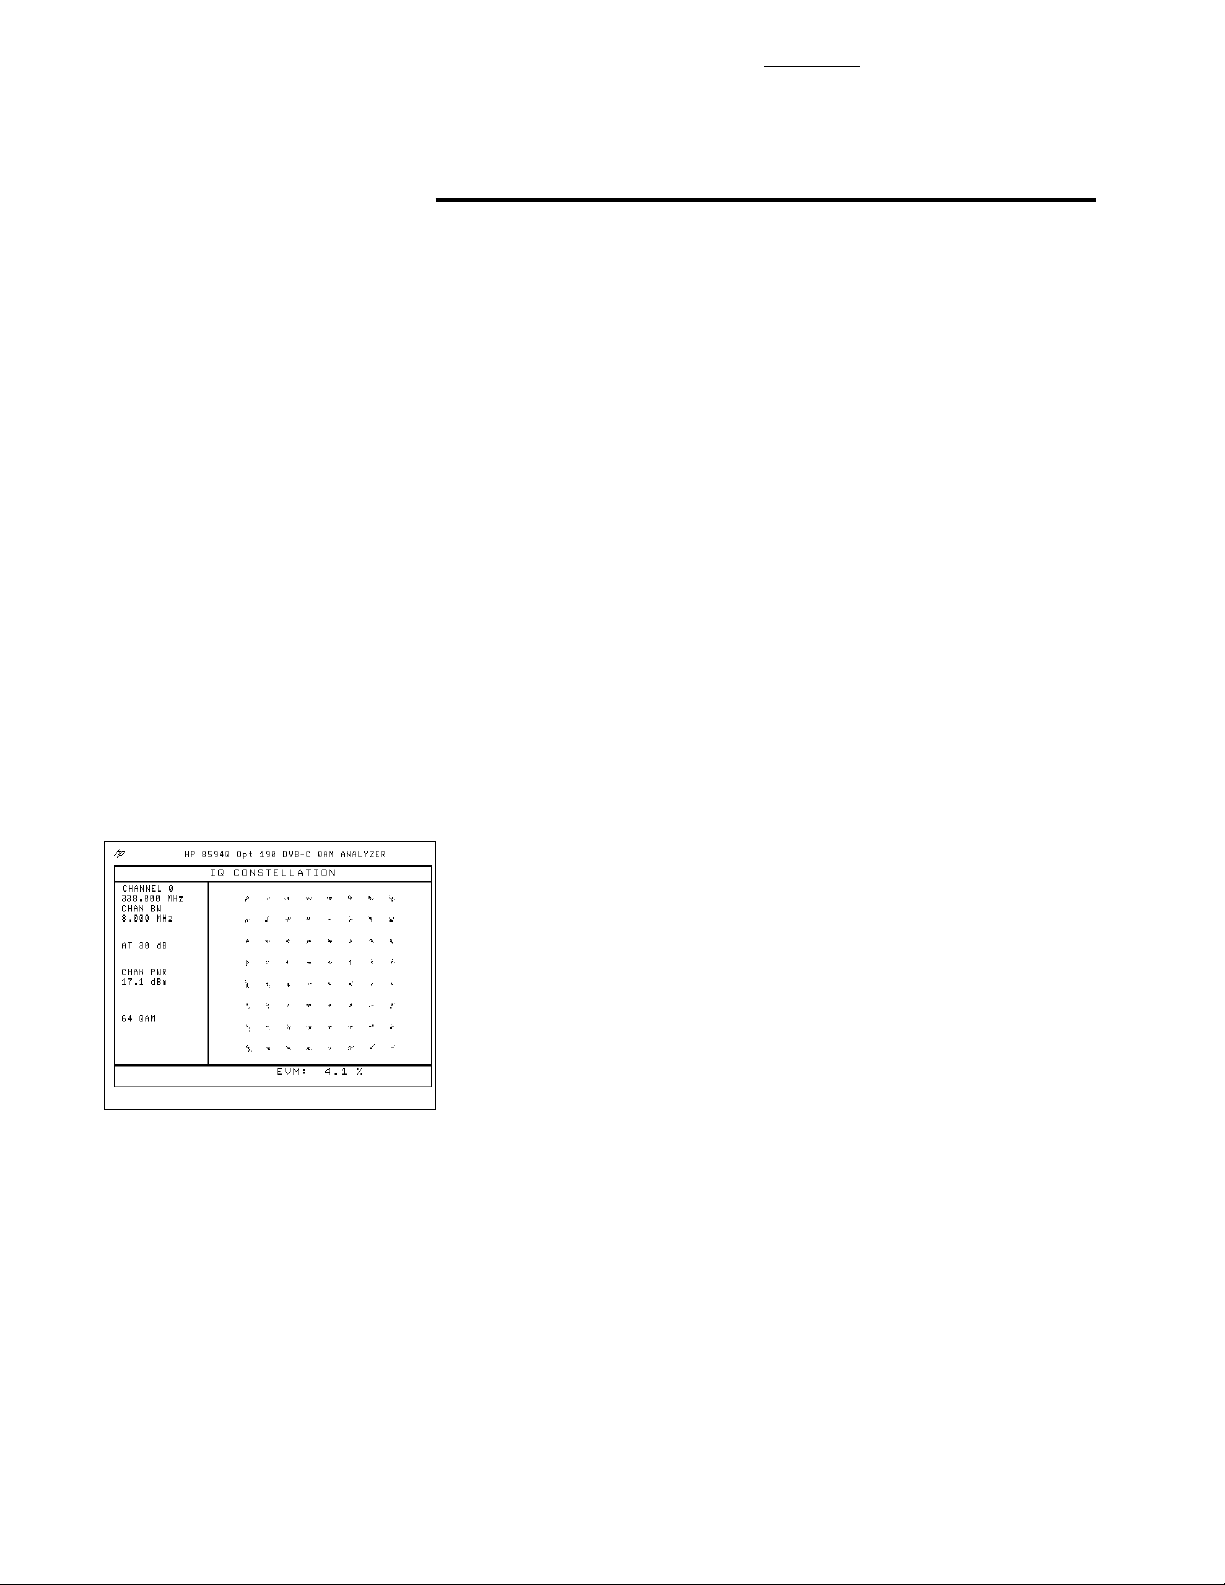
Figure 3: A QAM signal with
I/Q imbalance
When troubleshooting, the constellation can help isolate problems.
Examining the constellation will quickly show if only one or both
I and Q signals are affected. If only one signal is affected it can
indicate a problem in the
• I/Q modulators
• Baseband amplifiers and filters
These impairments can occur in either I or Q components of the
signal and can therefore create different amplitude and phase
distortions. The consequence is that the I and Q signals are
distorted by differing amounts.
Figure 3 shows a measurement of a 64 QAM signal with I/Q
imbalance using the HP 8594Q QAM analyzer.
Note how the constellation is not exactly square because the gain
in the I and Q paths are not the same.
If both I and Q are affected equally it can indicate problems in the:
Page 5
• IF amplifiers and filters
• RF amplifiers and filters
• Up/down converters
• Clock recovery circuits
• IF equalizers
5
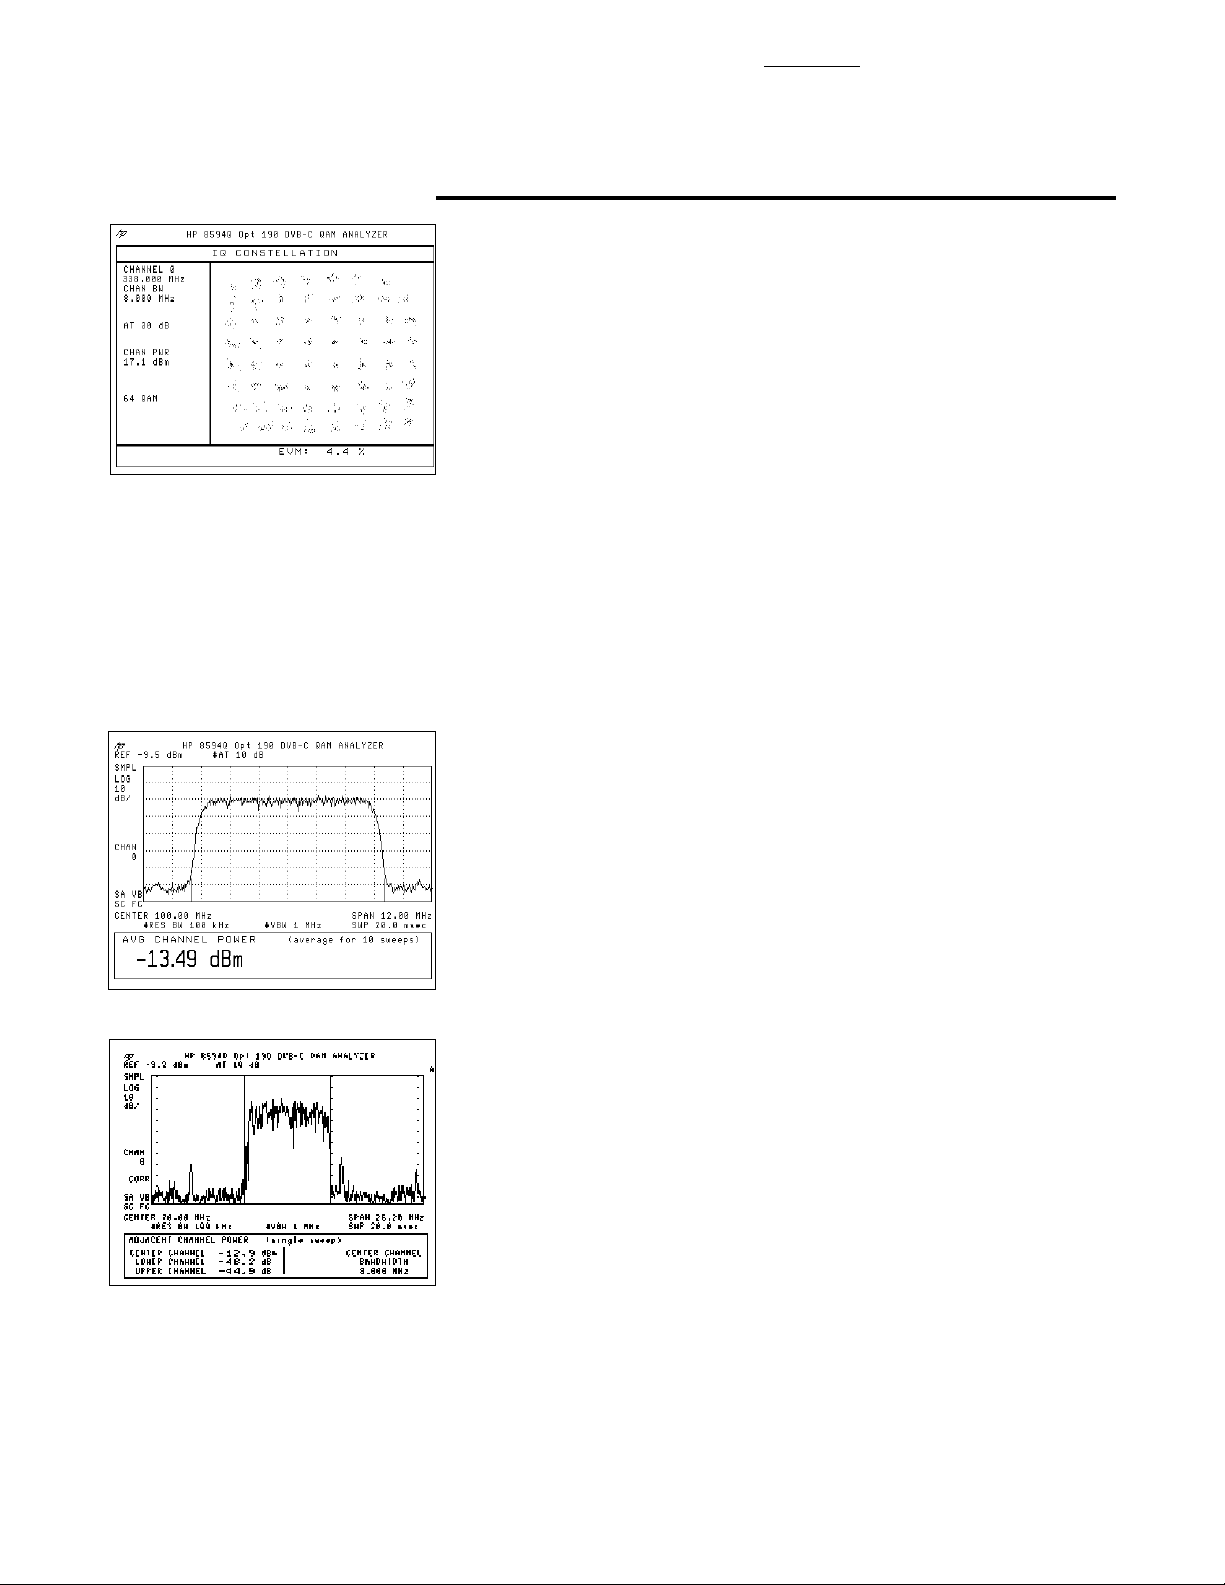
Figure 4: A QAM signal with gain
compression
Figure 5: An average channel
power measurement
Figure 4 shows the measurement of a 64 QAM signal with gain
compression affecting both I and Q signals using the HP 8594Q
QAM analyzer.
Note how the outer (higher amplitude) constellation points are
pulled in towards the center whereas the central points remain
virtually unaffected.
Armed with this qualitative information, you can start to make
more detailed measurements to quantify and isolate the problem.
Quantitative Measurements
Average channel power
Maintaining the correct carrier power levels throughout your
system is crucial in both analog and digital cable systems.
Unlike the measurement of analog visual carrier level, average
channel power in a digital system is a wide-bandwidth measurement. The HP 8594Q QAM analyzer carries out the measurement
by sweeping the channel and taking an average of the power levels
at each measurement point across the trace. When testing low-level
carriers at the subscriber drop, the HP 8594Q QAM analyzer's builtin preamplifier may be switched in to provide additional sensitivity.
Why it is important?
To verify signal levels from the headend through the network.
Figure 6: An adjacent channel
power measurement
Adjacent channel power
Transmission distortions can cause leakage of RF energy into the
adjacent channels and therefore interfere with other digital or
analog transmissions. The HP 8594Q QAM analyzer carries out
this measurement using a similar technique to the average power
measurement. An average power measurement is taken over all
of the points of the frequency sweep in the upper and lower adjacent
channels. These power levels are then compared to the average
channel power in the transmission channel. The channel set-up
can be changed to allow for adjacent 2 MHz, 4 MHz, 8 MHz or
custom channel bandwidths.
Page 6
6
Why it is important?
Measuring adjacent channel power ensures that the signal produced
by the headend modulator will not cause interference problems with
other channels.
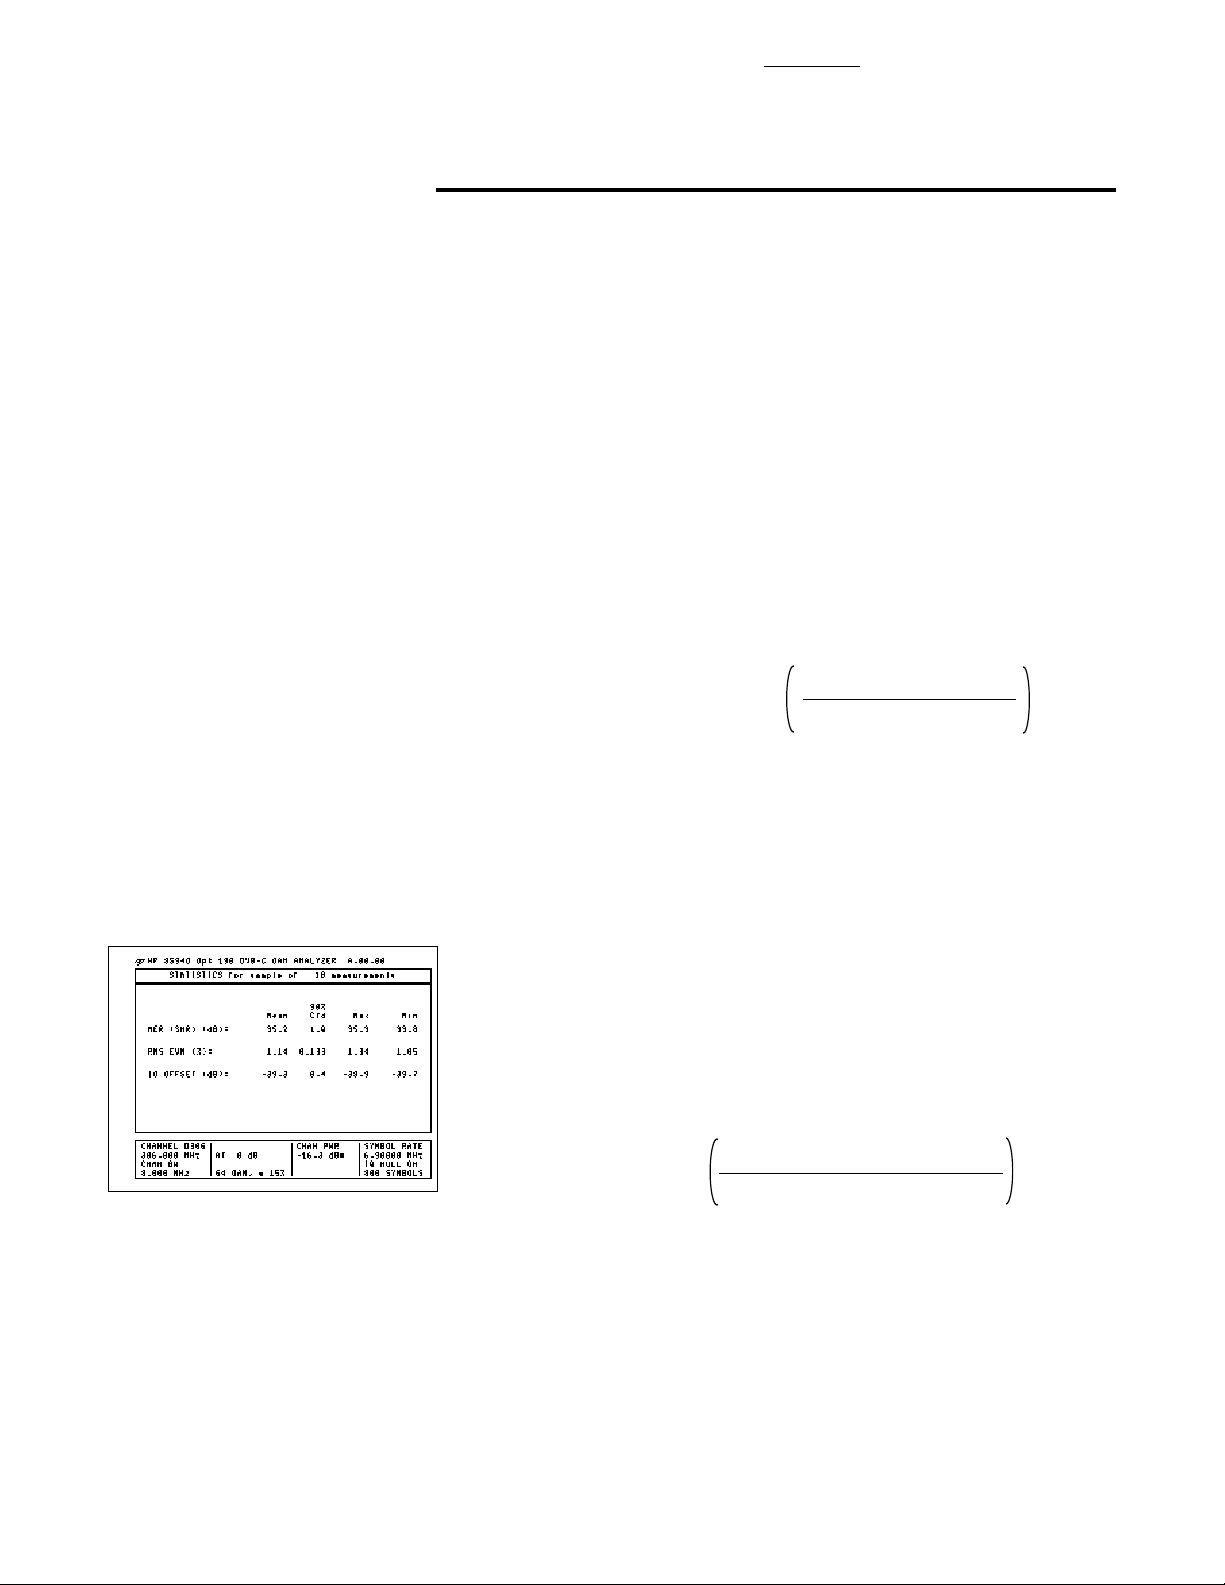
MER (in-channel signal-to-noise ratio)
MER is a measure of the modulation impairments which will affect
the ability of the receiver to recover the data bits. The measurement
was proposed by HP to the DVB Standards Committee and has
now been adopted in ETS 300-429. It is analogous to in-channel
signal-to-noise in analog cable TV measurements. The HP 8594Q
QAM analyzer compares the modulation error power to the average
transmission power in decibels. When an averaged measurement
is carried out, the HP 8594Q QAM analyzer generates a statistical
display of the measurement results. The minimum, maximum, mean,
and ninety percent confidence limit measurements are calculated and
stored. This makes it easy to identify trends over multiple measurements.
average symbol power
Modulation Error Ratio = 10 X log dB
average error power
Figure 7: A statistical view of
modulation quality measurements
Why it is important?
MER indicates the total in-channel signal-to-noise ratio. It is a quantitative measurement of the quality of the data delivered.
EVM (Error vector magnitude)
EVM is the measurement of modulation quality of the transmitted
signal before the forward error correction stage. EVM will indicate
how much interference or distortion is present on the signal. If there
is significant degradation on the signal, the constellation points will
become unclear and the decoder may not be able to reconstruct the
received signal correctly. The HP 8594Q QAM analyzer demodulates
the QAM signal, equalizes and then calculates the average size of the
error vector in relation to the maximum magnitude at a given symbol.
r.m.s. error magnitude
Error Vector Magnitude = X 100%
maximum symbol magnitude
Why it is important?
To verify the quality of the signal before it leaves the headend and
starts to be degraded by the network. It is also used to measure the
signal quality at the subscriber drop to ensure that the customer's
set-top box is able to demodulate and reconstruct the signal with
adequate margin.
Page 7
7
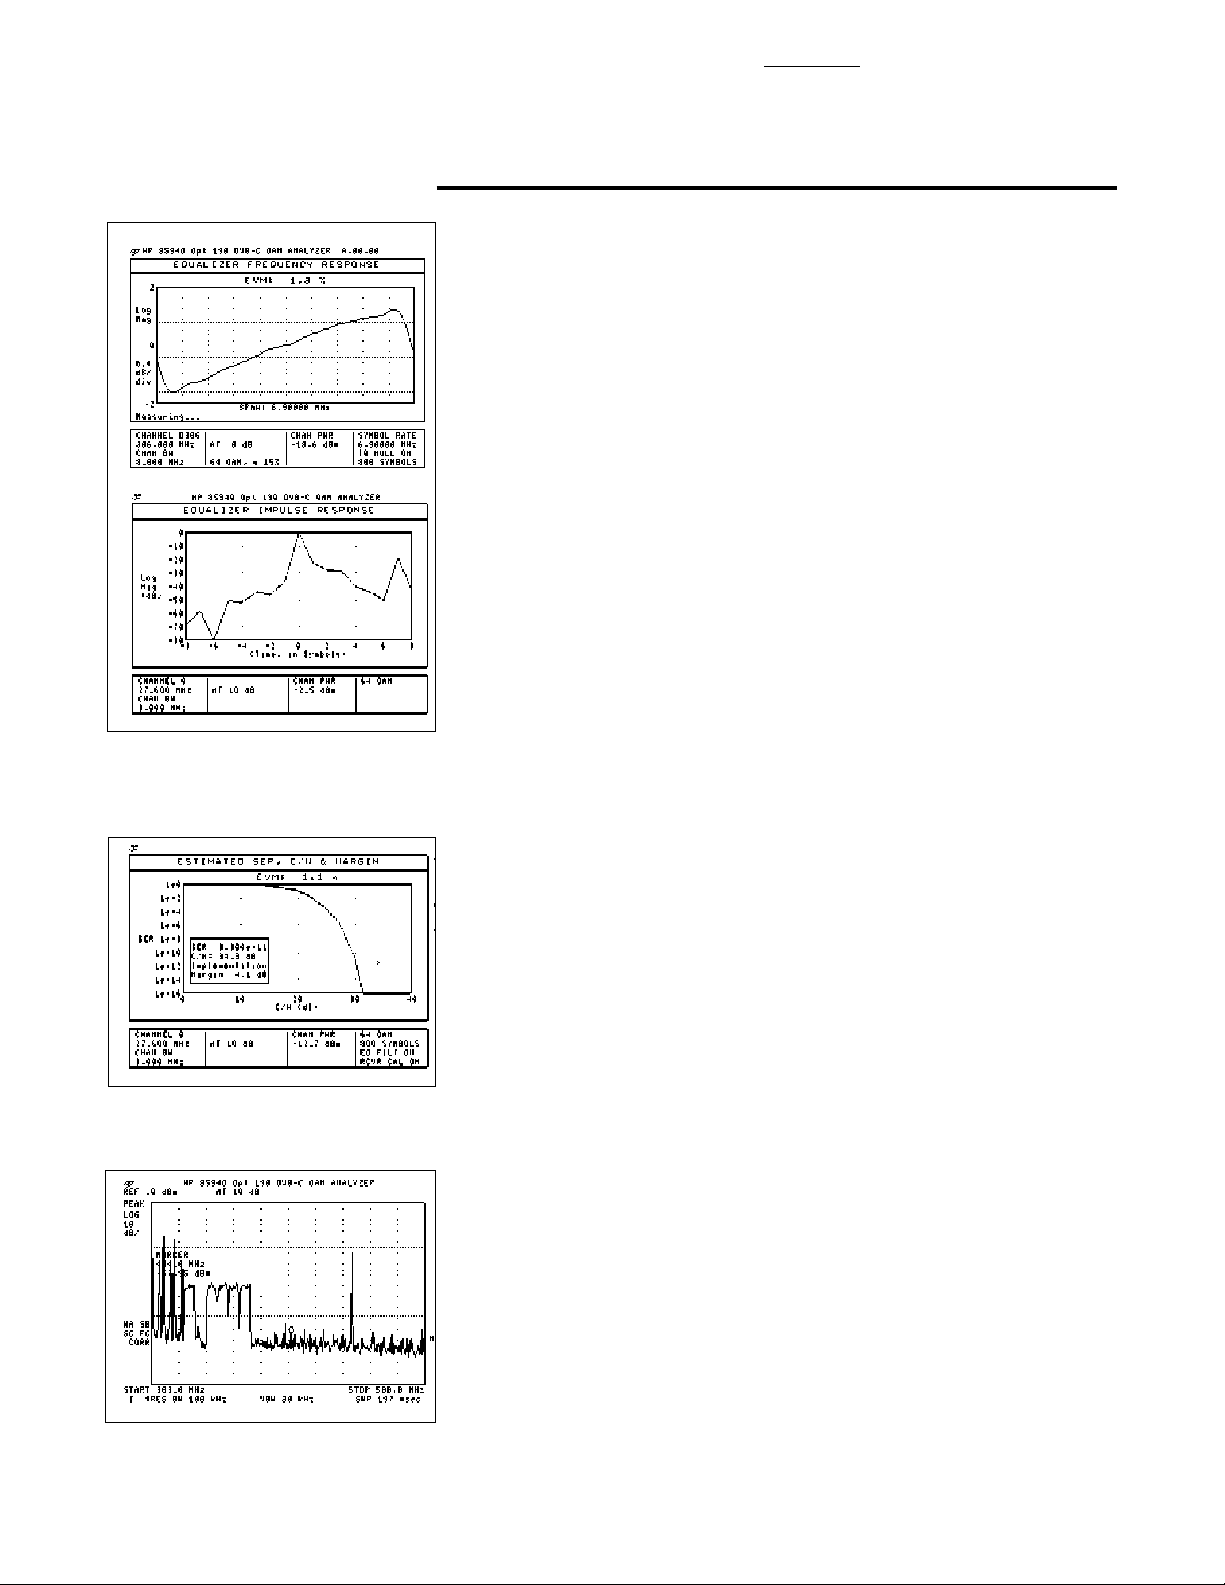
Equalizer response
The HP 8594Q QAM analyzer incorporates real time adaptive
equalization. The response of the equalization filter may be
examined in both frequency and time domains to help troubleshoot
problems in your transmission medium.
Why it is important?
The frequency response can be used to identify power "suck outs"
in the channel. The impulse response can be used to identify echoes.
Figure 8: Using the HP 8594Q to look
at the real-time equalizer response
Figure 9: An estimated SER versus
carrier-to-noise measurement
Symbol Error Rate vs Carrier to Noise
Symbol error rate versus carrier to noise is a measure of how tolerant the digital signal will be to the addition of noise. The HP 8594Q
QAM analyzer calculates the probability of the constellation points
being misinterpreted at a given noise level. The probability of
symbol error is plotted against the carrier-to-noise level. This operating point is displayed relative to the theoretical performance
curve for 64 QAM.
Why it is important?
This measurement is used to indicate how much the signal will
degrade when noise is added. It is a particularly important measurement at the subscriber drop to verify that the noise added by
the set-top box will not cause a large degradation in the signal.
Standard spectrum analyzer features
The HP 8594Q QAM analyzer contains all of the features of a standard spectrum analyzer. It can also be used for manual measurements on an analog channel or for searching for spurious signals.
The HP 8594Q may also be used as a general purpose 2.9 GHz
spectrum analyzer. For signals under 1 GHz, low level spurs may
be detected by using the built-in preamplifier.
Figure 10: Using the HP 8594Q in
spectrum analyzer mode to look at a
range of analog and digital channels
Page 8

For more information on HewlettPackard Test and Measurement
products, applications, or services in
Europe, please contact the European
Marketing Centre at P.O. Box 999,
1180 AZ Amstelveen, The Netherlands.
In the U.S. please call 800 452-4844
Ext. HPTV.
You can also visit our web site at
http://www.hp.com/info/HP8594Q_demo
Data Subject to Change
Copyright © 1996
Hewlett-Packard Company
Printed in U.S.A. 12/96
5965-4991E
 Loading...