

Page 1

Quick Start Guide
HP 71209A Microwave
Spectrum Analyzer
ABCDE
71209-90001
No.
art
P
HP
Printed
Edition
USA
in
B.0.0
October
1991
Page 2

Notice
The information contained in this document is sub ject to change
without notice.
Hewlett-Packard makes no warrantyofany kind with regard to this
material, including, but not limited to, the implied warranties of
merchantability and tness for a particular purpose. Hewlett-Packard
shall not be liable for errors contained herein or for incidental
or consequential damages in connection with the furnishing,
performance, or use of this material.
Restricted Rights Legend.
Use, duplication, or disclosure by the U.S. Government is subject to
restrictions as set forth in subparagraph (c) (1) (ii) of the Rights
in Technical Data and Computer Software clause at DFARS
252.227-7013 for DOD agencies, and subparagraphs (c) (1) and (c)
(2) of the Commercial Computer Software Restricted Rights clause at
agencies.
other
F
AR
52.227-19
for
c
Copyright Hewlett-Packard Company 1991
duction, adaptation,
Repro
Reserv
ts
Righ
All
without prior
cop
F
the
oun
taingro
under
1400
ed.
written
t
yrigh
e
v
ermission
p
ws.
la
arkw
P
a
,
y
is
Santa
prohibited,
Rosa,
except
95403-1799,
CA
translation
or
as
allo
USA
ed
w
Page 3

WARNING
Before applying power to this instrument, make sure it has been
properly grounded through the protective conductor of the ac power
cable to a socket outlet provided with protective earth contact. Any
interruption of the protective (grounding) conductor, inside or outside
the instrument, or disconnection of the protective earth terminal can
result in personal injury.
CAUTION
CAUTION
UTION
CA
Before applying p ower to this instrument, make sure its primary
power circuitry has b een adapted to the voltage of the ac power
source. Failure to set the ac power input to the correct voltage could
cause damage to the instrument when the ac power cable is plugged
in.
Total input power to the front-panel RF INPUT connector must not
exceed
instrumen
+30
t.
Electrostatic
rear-panel
rear-panel
a
connectors. Therefore,
conductors
connectors
the
that
sure
buildup
ent
prev
disc
P
harge
dBm.
connector,
cable
the
of
without
ectrum
sp
of
er
w
o
rst
static
excess
in
(ESD)
momen
together.
hing
touc
analyzer
harge.
c
can
tarily
is
dBm
+30
of
damage
before
Av
the
prop
circuits
connecting
the
short
hing
touc
oid
frame
of
erly earth-grounded
y damage
ma
asso
ter
cen
the
instrumen
the
y
an
and
rear-panel
the
ciated with
to
cable
outer
Be
t.
to
iii
Page 4

The HP 71209A - At
A Glance
eep
HP
The
100 Hz
from
capabilit
section,
71209A
to
The
.
y
HP
the
dular
mo
GHz
26.5
standard
70004A
ectrum analyzer
sp
built-in
and
system
color
consists
displa
external
the
,
y
full-band
has a
millimeter
70909A
HP
an
of
70001A mainframe,
HP
sw
mixer
RF
the HP 70900B lo cal oscillator module, the HP 70902A and HP
70903A IF sections, and an HP 70310A precision frequency reference.
Options on the standard system can add or delete mo dules.
iv
Page 5

The
INST PRESET key
(instrument preset key) sets the microwave
spectrum analyzer to a preset condition.
The
lower-level softkeys
depending on whether
execute instrument or display functions,
4
DISPLAY
5,4
MENU
5
,or
4
USER
5
was selected.
These softkeys are also dependentuponwhichmenu softkey is
selected and can haveseveral levels, each accessed by pressing the
bottom softkey.
The
menu softkeys
allow users access to all of the main functions of
the microwave sp ectrum analyzer.
The
hardkey panel
supplies quick access to commonly-used spectrum
analyzer functions. (Each of these functions can also b e accessed
us.)
men
ey
softk
the
using
and
ter
en
ually
man
to
ou
y
w
allo
knob
and
eys
alues.
v
k
The
hange
c
data entry
data
v
Page 6

In This Book
About This Book
This
HP 71209A Modular Spectrum Analyzer Quick Start Guide
provides step-by-step instructions for some of the most common tasks
for the HP 71209A modular sp ectrum analyzer.
HowTo Use This Book
Start with the quickoverview of the product on the preceding two
pages of this b ook.
Once you have a picture of what the product is and what it does,
put it to work with a few basic tasks as demonstrated in \System
MeasurementTasks."
Text Conventions
The following conventions are used throughout this quick start guide:
4
Key
5
Aword shown like this represents a key physically
located on the instrument.
N
N
N
N
N
N
N
N
N
N
N
N
N
N
N
N
N
N
N
N
N
N
N
N
N
N
Softkeys
Screen
Text
word
A
whose
rm
or
ext
T
displa
lab
w
sho
screen.
y
sho
are.
wn
wn
is
el
lik
indicates
this
e
lik
determined
indicates
this
e
ey
\softk
a
instrumen
the
y
b
yed
displa
text
a
,"
t's
on the
ey
k
soft
are
w
vi
Page 7

Contents
System Measurement Examples
HP 71209A Mo dular Spectrum Analyzer System
::::::::::::
1-3
Example 1. Set up and initalize the system
Example 2. Calibrate the system
::::::::::::: ::::::::::::
Example 3. Measure a continuous-wave signal
Example 4. Measure a CW signal using signal track
Example 5. Make a carrier-to-noise measurement
:::::::::::: ::
::::::::::::
:::::
:::::::
Example 6. Measure the dierence between two traces::1-13
Example 7. Measure the fundamental and harmonics of a
source
Do
::::::::::: :::::::::::::::::::: :::::::::::::::::::: ::
Example 8. Create a limit line
::::::::::::::: :::::::::::
Example 9. Format a memory card and save a trace
::
:
:
:
Demo
:
:
:
:
:
:
:
:
:
:
Example
wnloadable
try
ou
y
If
Execute
10.
Program
recall
to
(DLP)
asa
the
ved
HP
trace
70000
:
:
:
:
:
:
:
and
Customer
::
::
::
fails
it
::::
:
:
:
:
:
:
:
:
1-4
1-6
1-8
1-10
1-11
1-15
1-17
1-19
1-23
:
:
:
1-25
:
:
:
vii
Page 8

Page 9

System Measurement Tasks
1
Note
Hardk
ey
Functions
anel
P
Specied performance requires that the spectrum analyzer warmup
for approximately 30 minutes b efore making any measurements.
At initial power up, the HP 70310A precision frequency reference
displays an
minutes of warmup, the
pressing
oven cold
4
DISPLAY
5
, then
error message. After approximately 10
oven cold
NNNNNNNNNNNNNNNNNNNNNNNNNNNNNNNNNNNNNNNNN
REPORT ERRORS
error message can be removed by
.
The examples in this chapter are written to be done in the order
path
k
graphics
ey
hardk
v
a
are
path
The
to
panel
ailable
listed
en.
giv
ose
purp
familiar
har
The
y
displa
When
yor
displa
not
is
all
for
w.
elo
b
of
them
these
Doing
measurements
anel
p
dkey
.
this
using
HP
an
ailable.
v
a
and
ys
displa
of
out
examples
that y
ailable
v
a
is
start
k
quic
70206A
er,
ev
w
Ho
can
sequence
are
guide
system
the
accessed
e
b
ma
to pro
ou migh
only
with
graphics
hardk
require
y
vide y
normally
t
the HP
with
an HP
ey-panel
using
y
b
ou with
70205A
displa
functions
the softk
steps.
extra
aquic
use.
70004A color
the
,
y
ey
System
Measurement
asks
T
1-1
Page 10

HP 70004A
Hardkey Panel
Key
4
CENTER
4
SPAN
4
START FREQ
4
STOP FREQ
4
REF LEVEL
4
NORMAL
5
5
5
5
415
4
PEAK SEARCH
4
NEXT PEAK
4
SIGNAL TRACK
4
5
VE
SA
4
RECALL
5
All Displays
Softkey Path
NNNNNNNNNNNNN
NNNNNNNNNNNNN
NNNNNNNNNNNNN
5
NNNNNNNNNNNNN
5
NNNNNNNNNNNNNNNN
NNNNNNNNNNNNNNNNNN
NNNNNNNNNNNNNNNNNN
NNNNNNNNNNNNNNNNNN
5
NNNNNNNNNNNNNNNNNN
5
NNNNNNNNNNNNNNNNNN
5
NN
N
Freq
Freq
Freq
Freq
Amptd
Marker
Marker
Marker
Marker
Marker
N
N
N
N
N
N
N
N
N
NN
State
N
N
N
N
N
N
N
N
N
N
N
N
State
NNNNNNNNNNNNNNNNNN
,
CENTER
NNNNNNNNNNNNN
,
SPAN
NNNNNNNNNNNNNNNN
,
START
NNNNNNNNNNNNN
,
STOP
NNNNNNNNNNNNNNNNNNNNN
,
REF LVL
NNNNNNNNNNNNNNNNNNNNNNNNNNNNNNNNNNNNNNNN
,
MKR NRM On Off
NNNNNNNNNNNNNNNN
,
DELTA
NNNNNNNNNNNNNNNNNNNNNNNNNNNNNNNNNNN
,
HIGHEST PEAK
NNNNNNNNNNNNNNNNNNNNNNNNNN
,
NEXT PEAK
NNNNNNNNNNNNNNNNNNNNNNNNNNNNNNNNNNNNNNNN
,
SIG TRK On Off
N
N
N
N
N
N
N
N
NN
NN
,
save
N
N
N
N
N
N
,
recall
N
N
N
N
N
N
N
N
NN
N
N
N
N
N
N
N
N
N
1-2
System
Measurement
asks
T
Page 11

HP 71209A Modular
Spectrum Analyzer
System
Before starting the tasks in this chapter, make sure that your system
is properly connected. The standard system conguration rear-panel
connections are shown below. Refer to the
and Verication Manual
necessary.
for alternative system congurations, if
HP 70000 Instal lation
System
Measurement
asks
T
1-3
Page 12

Example 1. Set up and
initialize the system
Make sure that the spectrum analyzer is set to a known state by
setting up and initializing the system with this example. This
ensures that the lo cal-oscillator mo dule is in control and that the
menu softkeys that contain the spectrum-analyzer functions are
displayed.
1. Turn on the mo dular sp ectrum analyzer system.
The system is initialized as either a display,asshown in the gure
below, or as a sp ectrum analyzer, as shown in step 3. If the
system is initialized as a spectrum analyzer, skip to step 3.
1-4
System
Measurement
asks
T
Page 13

2. Press
4
DISPLAY
5
, then
NEXT INSTR
until the spectrum-analyzer
display appears.
This key sequence should display the HP-MSIB address of the
HP 70900B lo cal-oscillator (master) module at the bottom of the
display screen when the sp ectrum-analyzer display appears. For
example:
Row 0 Column 18: 70900B,Lo/Ctlr
3.
Press
4
5
.
MENU
NNNNNNNNNNNNNNNNNNNNNNNNNNNNNNNN
Pressing
4
MENU
5
accesses the sp ectrum analyzer softkey functions
as shown in the following gure.
System
Measurement
asks
T
1-5
Page 14

Example 2. Calibrate
the system
You will want to calibrate your signal path to eliminate the
message on the display. This ensures that your instrumentis
operating and that calibration corrections have been made.
UNCOR
1. Press
4
INSTR PRESET
5
.
The HP 71209A mo dular sp ectrum analyzer is placed in a known
state by setting all spectrum-analyzer functions to their preset
state.
2. Connect the 300 MHz CALIBRATOR output to the RF INPUT
connector on the HP 70900B front panel.
The calibrator signal will be used to calibrate the system.
Press
NNNNNNNNNNNNNNNNN
Amptd
.
3.
NNNNNNNNNNNNNNNNN
Pressing
Amptd
accesses amplitude and calibration softkeys as
shown below.
1-6
System
Measurement
asks
T
Page 15

4. Press
NNNNNNNNNNNNNNNNNNNNNNN
CAL ALL
Pressing
routines that take approximately 2 to 3 minutes to complete.
After the routines are nished, the instrument resumes the state
at which the calibration routines were initiated. In this case, the
instrument-preset state is resumed.
The
UNCOR
the gure above) will disapp ear after the calibration routine is
complete.
.
NNNNNNNNNNNNNNNNNNNNNNN
CAL ALL
message displayed in the message area (as shown in
executes all internal signal-path calibration
System
Measurement
asks
T
1-7
Page 16
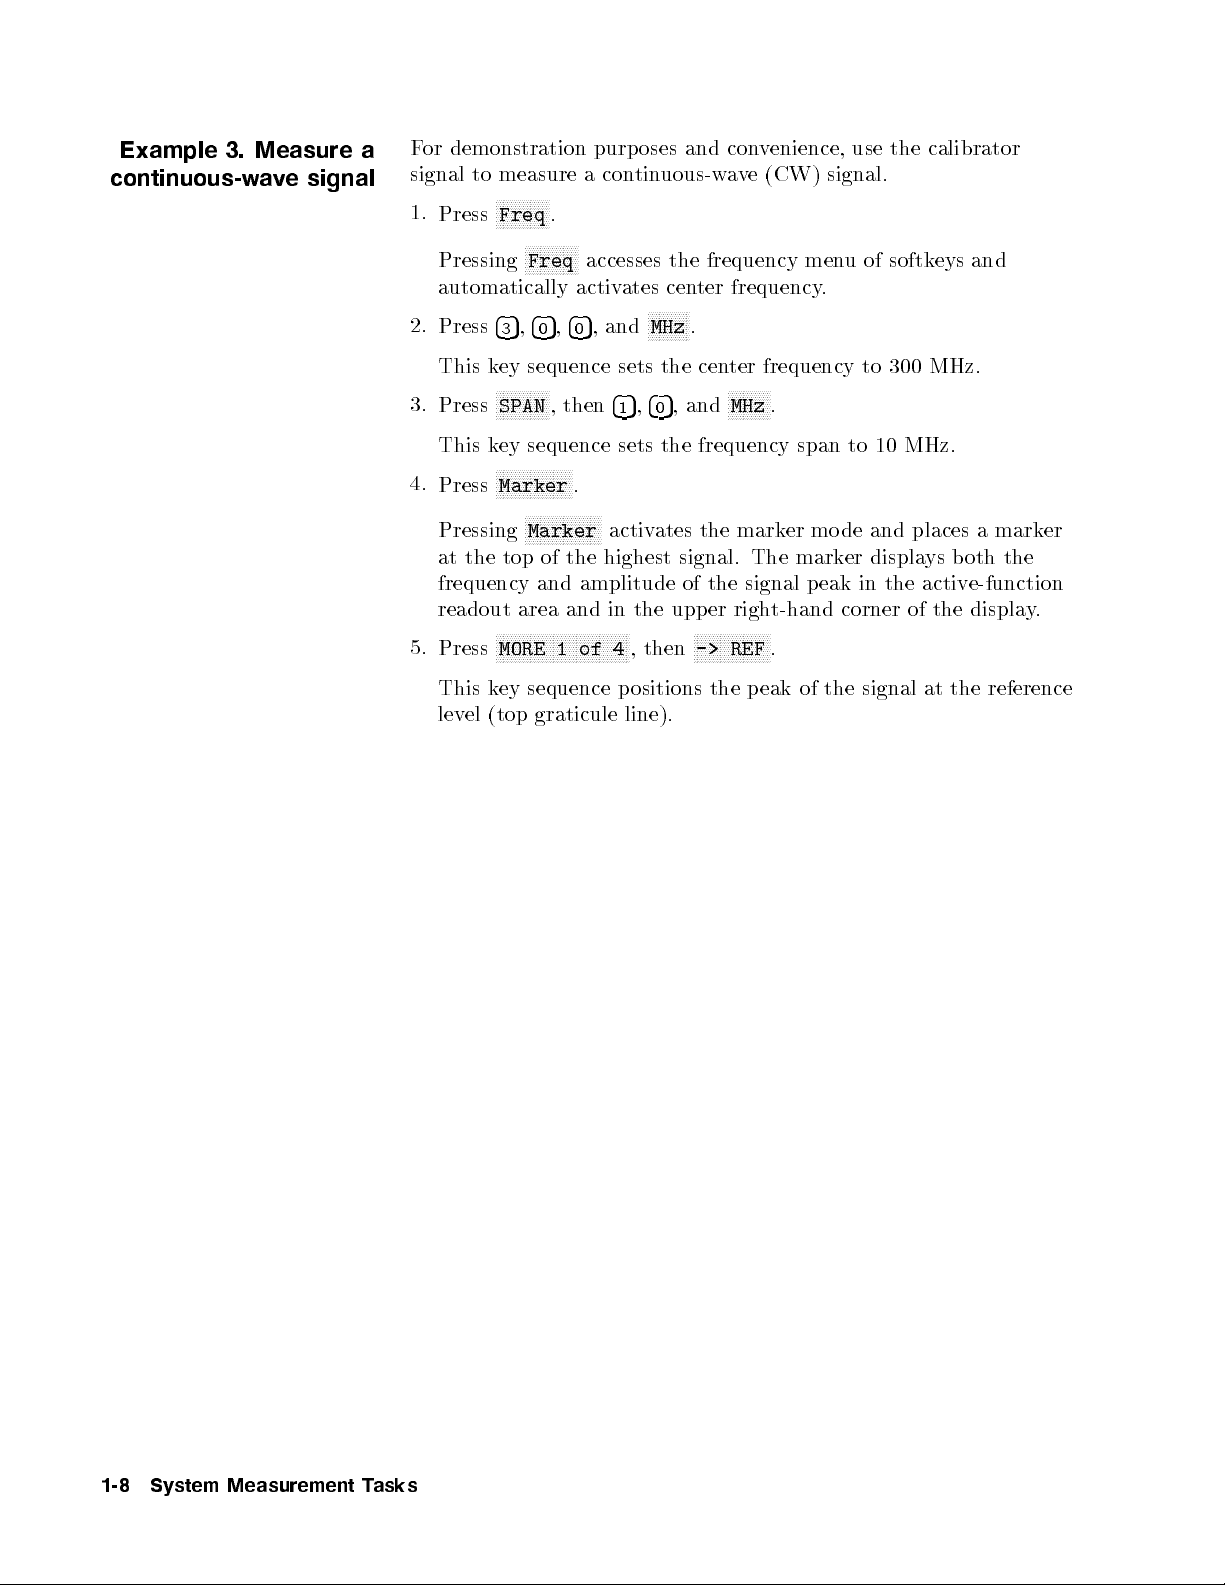
Example 3. Measure a
continuous-wave signal
For demonstration purposes and convenience, use the calibrator
signal to measure a continuous-wave (CW) signal.
Press
NNNNNNNNNNNNNN
Freq
.
1.
NNNNNNNNNNNNNN
Pressing
Freq
accesses the frequency menu of softkeys and
automatically activates center frequency.
2.
Press
435,405,405
,and
NNNNNNNNNNN
MHz
.
This key sequence sets the center frequency to 300 MHz.
3.
Press
NNNNNNNNNNNNNN
SPAN
, then
415,405
,and
NNNNNNNNNNN
MHz
.
This key sequence sets the frequency span to 10 MHz.
Press
NNNNNNNNNNNNNNNNNNNN
Marker
.
4.
NNNNNNNNNNNNNNNNNNNN
Pressing
Marker
activates the marker mode and places a marker
at the top of the highest signal. The marker displays b oth the
frequency and amplitude of the signal peak in the active-function
displa
the
signal
of
at
the
reference
readout
5.
Press
This
lev
el
N
N
N
N
N
MORE
ey
k
(top
and in
area
NN
NN
N
N
N
N
N
N
N
N
N
N
N
N
1
sequence
graticule
NN
of
N
NN
N
N
N
N
N
N
4
the upp
N
N
N
,then
ositions
p
line).
er righ
N
N
N
N
N
N
N
N
N
->
the
t-hand corner
N
NN
N
N
N
N
N
N
N
N
.
REF
eak
p
of
the
.
y
1-8
System
Measurement
asks
T
Page 17

6. Note the frequency and amplitude values of the calibrator signal.
The calibrator signal frequency and amplitude values will be
displayed in the active-function readout area on the display screen
as shown in the following gure.
System
Measurement
asks
T
1-9
Page 18

Example 4. Measure a
CW signal using signal
track
Use signal tracking as a convenient method to keep the signal
onscreen while centering it.
1. Press
4
INSTR PRESET
5
.
Pressing
4
INSTR PRESET
5
resets the system and places it in a known
state.
2. Press
NNNNNNNNNNNNNN
Freq
NNNNNNNNNNNNNNNNNNNNNNNNNNNNNNNNNNN
,
MORE 1 of 3
,then
NNNNNNNNNNNNNNNNNNNNNNNNNNNNNNNNNNNNNNNNNNNN
BNKSTRT On Off
.
This key sequence sets the blank-start frequency to ON and
blanks the local-oscillator (LO) feedthrough at the beginning of
the sweep.
3. Press
4
PEAK SEARCH
5
on the hardkey panel.
Pressing the p eak-searchkey initiates a marker to nd the highest
signal level and position the marker at its peak.
4. Press
4
SIGNAL TRACK
5
on the hardkey panel.
Pressing the signal-trackkey continuously activates a highest peak
screen
ter
cen
press
will
to
.
4
the
sta
4
,
5
5
1
0
instrumen
signal
cen
y
and
,
trac
tered
N
N
N
kHz
king
onscreen
the mark
on
automatically
5.
Press
4
Pressing
wn
do
go
enabled
the
while
AN
SP
4
to
in the
ed
5
AN
SP
a
span
signal,
hanging
c
the
on
and
5
kHz
10
previous
is
then
the
hardk
tering
en
frequency
step,
successiv
ey
ely
the
es
v
mo
frequency
ter
cen
10
then
kHz
panel,
span. Because
signal
the
w
narro
signal
instructs
ed.
y
b
N
N
N
N
N
N
N
N
.
to
t
as
w
1-10
System
Measurement
asks
T
Page 19

Example 5. Makea
carrier-to-noise
measurement
A carrier-to-noise measurement can be made very simply byusing
the delta-marker function. This can be demonstrated by using the
calibrator signal, placing a marker at the peak of the signal, then
placing a delta marker somewhere in the noise. The carrier-to-noise
measurement result is displayed in the active function area and is
normalized to a 1 Hz bandwidth.
1. Press
4
NNNNNNNNNNNNNNNNNNNNNNNNNNNNNNNNNNNNNNNNNNNN
SIGNAL TRACK
BNKSTRT On Off
5
on the hardkey panel, then the
NNNNNNNNNNNNNNNNNNNN
,
Marker
NNNNNNNNNNNNNNNNNNNNNNNNNNNNNNNNNNNNNNNNNNNN
,and
MKR NRM On Off
softkeys.
Pressing these keys at this time turns o the signal-tracking,
blank-start, and marker functions from the previous measurement
example.
2. Press
4
REF LEVEL
5
on the hardkey panel and use the
495
(down-arrow) step key to place the signal near the top graticule.
Pressing the reference-level key enables the signal reference
level to be set. The noise oor is also raised so that any noise
measurements can be made above the bottom division.
panel.
ey
N
N
,
er
ates
the
5
and
on
the
wing
hardk
places
ey
k
use
then
noise.
the
delta-mark
the delta
gure
mark
a
4
4
5
,
8
er function.
mark
an
for
er
or
5
,
9
wherev
er
example
on
the
the
knob
er
of
highest
Using
ou
y
where
to
Press
3.
Pressing
signal
4.
Press
osition
p
Pressing
step
to measure.
activ
4
PEAK
found.
N
N
N
N
N
N
N
Marker
eys
k
mark
e
SEARCH
4
the
PEAK
N
N
N
N
N
NN
NN
N
N
N
N
N
N
,
DELTA
the delta
N
N
N
N
N
N
N
N
N
N
N
N
N
N
N
N
N
DELTA
knob,
or
See the
is
er
on
5
SEARCH
NN
NN
N
N
N
N
N
N
N
N
N
mark
activ
osition
p
follo
placed.
w
the
an
t
the
5. Press
N
N
N
N
N
N
N
N
N
N
N
N
N
MORE 1
N
N
N
N
N
N
N
N
N
N
N
N
N
N
N
N
N
N
N
N
N
N
N
N
NN
then
,
4
of
N
N
N
N
N
N
N
MKNOISE On
N
N
N
N
N
N
N
N
NN
N
N
N
N
N
N
System
NN
N
N
N
N
N
N
N
N
N
N
N
N
N
N
N
Off
Measurement
.
asks
T
1-11
Page 20

Pressing
The spectrum analyzer enables sample detection mode and
performs a digital average for616 bits around the active marker.
The marker readout in the active function area on the display
reads out the dierence between the markers in dBc/1 Hz. This
is the carrier-to-noise (C/N) measurement normalized to a 1 Hz
bandwidth.
To normalize to other bandwidths, use the following formula:
mark er noise r eadout
where C/N is referenced to the new bandwidth.
NNNNNNNNNNNNNNNNNNNNNNNNNNNNNNNNNNNNNNNNNNNN
MKNOISE On Off
+10
new bandw idth
log
turns on the marker-noise function.
=
1
Hz
C=Nendeqn
1-12
System
Measurement
asks
T
Page 21

Example 6. Measure
the difference between
two traces
The dierence b etween two traces can be measured very easily
using the delta-marker function. This example demonstrates the
delta-marker function while measuring the calibrator signal when it is
connected and not connected.
1. Press
NNNNNNNNNNNNNNNNNNNN
Marker
, then
NNNNNNNNNNNNNNNNNNNNNNNNNNNNNNNNNNNNNNNNNNNN
MKR NRM On Off
twice.
This key sequence turns o the delta marker rst and then turns
o the active marker from the previous measurement example.
2. Press
4
PEAK SEARCH
Pressing the
5
on the hardkey panel.
4
PEAK SEARCH
5
key places a marker on the highest
signal.
3.
Press
NNNNNNNNNNNNNNNNNNNN
Traces
, then
NNNNNNNNNNNNNNNNNNNNNNN
STORE A
.
Pressing these softkeys stores Trace A.
4.
5.
6.
NNNNNNNNNNNNNNNNNNNNNNNNNNNNNNNNNNN
Press
NNNNNNNNNNNNNNNNNNNNNNNNNNNNNNNNNNN
trace A B C
CLEAR WRT B
sequence
key
This
Disconnect
Trace
Press
415
N
N
N
N
N
N
N
N
Marker
N
N
N
N
N
N
N
N
MRK
delta-mark
The
function
displa
is
following
the
no
Bis
follo
the
(MARKER)
N
N
N
N
N
NN
N
N
N
N
N
N
N
N
N
N
N
N
TRA
N
N
N
N
N
is
ed in
y
N
N
,
MORE 1
N
N
N
NN
N
A
activ
gure.
.
cable
displa
w
wing
NN
N
N
N
N
N
N
N
N
N
N
N
N
N
N
N
N
N
N
N
N
N
N
N
C
B
er
e,
the activ
untilBis underlined, then press
race
from
ed
y
eys:
on
ey
N
N
N
N
N
N
N
N
N
N
N
N
N
4
of
til
on
set
dierence
T
CALIBRA
the
trace
a
as
hardk
the
N
N
N
N
N
N
N
N
N
N
N
N
,
MORE 2
is underlined
B
race
T
selects
k
k
N
N
N
N
N
N
N
N
un
is
the
e function
the
as
B
without
ey
N
N
N
N
N
N
N
N
N
N
N
N
N
N
NN
N
N
N
of
Since
B.
een
w
et
b
readout area
activ
TOR
panel
N
N
N
N
N
N
4
T
e
output.
signal.
a
delta-mark
the
race
trace.
Band
sho
as
Trace
wn
er
in
A
the
System
Measurement
asks
T
1-13
Page 22

7.
Note
The
the
amplitude
the
amplitude
e-function
activ
dierence
dierence
readout
b
et
area
w
et
b
een
on
w
een
the
the
the
o
w
t
displa
o
w
t
traces
.
y
traces.
displa
is
in
ed
y
1-14
System
Measurement
asks
T
Page 23

Example 7. Measure
the fundamental and
harmonics of a source
The calibrator signal can be used to simulate a source and its
harmonics. In this case, the calibrator signal is the fundamental.
With the fundamental and harmonics all visibly displayed at the
same time, the measurement can b e made easily with the markers.
1. Press
4
INSTR PRESET
Pressing
5
4
INSTR PRESET
and reconnect the calibrator signal.
5
resets the system and places it in a known
state.
2. Press
4
STOP FREQ
5
on the hardkey panel and then
425,4.5,455
This key sequence sets the stop frequency just above the highest
harmonic frequency to be measured.
3.
Press
NNNNNNNNNNNNNNNNNNNN
BW,Swp
NNNNNNNNNNNNNNNNNNNNNNNNNNNNNNNNNNNNNNNNNNNN
,
VID BW AutoMan
, then press the
495
step key until
a video bandwidth of 10 kHz is reached.
This key sequence decreases the video ltering to 10 kHz so that
the noise o or is decreased.
4. Press
This k
5.
Press
Once
N
N
N
N
N
N
N
N
N
RIGHT
eak
p
w
et
b
the
4
PEAK
ey sequence
N
N
NN
NN
N
N
N
N
N
N
N
Marker
delta-mark
the
N
N
N
N
N
N
N
N
N
N
N
N
NN
N
N
N
N
N
PEAK
the righ
to
the
een
function
e
activ
SEARCH
N
N
N
N
N
N
N
N
N
N
N
N
N
,
MORE
N
N
N
N
will
t.
fundamen
then
5
,
sets up
N
N
N
N
N
N
N
NN
NN
N
1
er
osition
p
The
tal
readout
4
5
(MARKER)
1
the
N
of
,
4
N
NN
N
N
N
N
N
N
N
N
N
N
N
N
N
function
the
amplitude
and
area.
delta-mark
NN
N
N
N
N
N
N
N
then
RIGHT
een activ
has b
mark
delta
frequency
and
harmonic
rst
the
er
N
N
N
N
N
NN
er
the
on
function.
N
N
N
N
N
N
N
N
N
N
N
N
N
N
N
N
PEAK
ated,
the
on
.
dierence
is
hardk
pressing
next
displa
ey
highest
,
panel.
ed
y
NNNNNNNNNNN
GHz
in
.
System
Measurement
asks
T
1-15
Page 24

6. Press
NNNNNNNNNNNNNNNNNNNNNNNNNNNNNNNN
RIGHT PEAK
Successively pressing
measuring the third and higher harmonics. See the gure b elow.
.
NNNNNNNNNNNNNNNNNNNNNNNNNNNNNNNN
RIGHT PEAK
enables you to continue
1-16
System
Measurement
asks
T
Page 25

Example 8. Create a
limit line
Build a test limit line around the 300 MHz calibrator signal. By
using the limit-line editing functions and the knob, limit lines can be
created very quickly.
1. Press
4
INSTR PRESET
5,4
CENTER
5
300 MHz, and
4
SPAN
5
1 MHz.
This key sequence resets the instrument and p ositions the 300
MHz calibrator signal at center screen in a 1 MHz span.
Press
NNNNNNNNNNNNNN
Misc
2.
This key sequence accesses the limit-line editing softkey functions.
Pressing
accesses the softkey functions that dene a segment's parameters,
and automatically activates the
NNNNNNNNNNNNNNNNNNNNNNNNNNNNNNNNNNN
,
MORE 1 of 3
NNNNNNNNNNNNNNNNNNNNNNNNNNNNNNNNNNN
enter limit
NNNNNNNNNNNNNNNNNNNNNNNNNNNNNNNNNNN
,
limit lines
,then
NNNNNNNNNNNNNNNNNNNNNNNNNNNNNNNNNNN
enter limit
displays the limit-line table onscreen,
NNNNNNNNNNNNNNNNNNNNNNNNNNNNNNNN
FREQ VALUE
softkey.
NNNNNNNNNNNNNNNNNNNNNNNNNNNNNNNN
If a limit-line table already exists, the
appears in place of the
NNNNNNNNNNNNNNNNNNNNNNNNNNNNNNNNNNN
enter limit
edit limit
softkey.
softkey
3. Initially position the marker at the left-hand side of the display
is
value
knob.
very
a
of
easy and
rst
the
conv
segmen
enient
t.
metho
d
of
setting
using the
y
screen
Using
b
the
knob
the frequency
.
4. Press
ve the noise as sho
abo
Pressing
NNNNNNNNNNNNNNNNNNNNNNNNN
NNNN
AMPTD VALUE
NNNNNNNNNNNNNNNN
AMPTD VALUE
NNNNNN
,then
NNNNNNNNNNNNNNNNNNN
use the knob to position the mark
w.
belo
wn
activates the amplitude v
alue of the
segment to be set. Use the knob, or any other data entry method,
to enter in the desired amplitude value.
N
5.
Press
This
purp
N
N
TYPE
step
ose
N
N
N
N
N
N
of
N
N
N
N
N
N
then
,
necessary
is
this
select
to
example,
N
N
N
N
N
N
N
N
N
N
SLOPE
select
the
N
N
N
N
N
N
.
the
limit-line
System
limit-line
ype
t
Measurement
for
the
or
F
e.
yp
t
segmen
h
eac
asks
T
er
set
is
t
1-17
Page 26

to slope. Since slope is always set as the default type, there is
no need to make this selection at this time. Slope connects two
segments in a line.
Press
6.
through
NN
NN
N
N
N
N
NEXT
N
N
N
N
N
N
un
6
N
N
N
N
N
N
N
N
N
N
SEGMENT
all
til
then
,
segmen
ts
NN
NN
N
N
N
N
FREQ
for
N
N
N
N
N
N
N
N
our
y
N
N
N
N
N
N
N
N
N
N
N
VALUE
limit-line
N
NN
N
N
rep
and
eat
table
steps
v
ha
N
N
N
N
N
NN
NN
N
N
N
N
N
created.
3
een
b
e
Using
amplitude,
table.
and
Press
7.
3,
steps
and
The follo
line.
limit
the
NNNNNNNNNNNNNNNNNNNNNNNNNNNNNNNN
LIMIT
SAVE
4,
t
wing
and
5,
parameters
e
yp
gure
en
,
6
ter
enable
for
illustrates
register
a
ou
y
dene
to
h segmen
eac
completed
a
b
um
n
er,
frequency
of
t
limit-line
press
then
y
our
,
limit-line
table
NNNNNNNNNNNNNNNNN
ENTER
.
1-18
System
Measurement
asks
T
This k
hoice.
c
sequence
ey
sa
our
y
limit-line
the
es
v
table
register
the
in
of
Page 27

Example 9. Format a
memory card and save
atrace
This task describ es how to format and save information on a memory
card. Information from the sp ectrum analyzer is sent via the MSIB
path to the HP 70004A's display where the memory card reader is
located.
1. Check that the memory card \write protect" switch is o.
This step is necessary to ensure that the memory card can be read
and written to by the card reader.
2. Place the memory card in the HP 70004A's memory-card reader.
To ensure that the memory card is selected as the mass storage
device, a memory card must rst be present in the card reader. If
a memory card is not inserted and the
NNNNNNNNNNNNNNNNNNNNNNNNNNNNNNNNNNNNNN
HP-MSIB CARD
softkey is
activated, an error will occur in the local-oscillator module.
3. Press
4
DISPLAY
5
on the display instrumentfront panel.
This step accesses the display menus.
4.
NNNNNNNNNNNNNNNNNNNNNNNNNNNNNNNNNNNNNN
Press
This
device
\path"
mass
The
lo
comm
MASS
key
for
to
storage
follo
oscillator and
cal
unicate
STORAGE
sequence selects
displa
the
memory
the
\switc
gure
wing
prop
NNNNNNNNNNN
,
msi
instrumen
y
card
in
h"
illustrates
displa
the
with
erly
then
,
the memory
y
b
both
y
one
NNNNNNNNNNNNNNNNNNNNNNNNNNNNNNNNNNN
Memory
card
selection
This
t.
selecting
w
ust
the
b
e
70900B
\switc
set
the HP
ho
m
another.
Card
(via
as
in
.
the
softk
and
h" in
order
mass
denes
eys)
the
oth
b
for
storage
the
proper
the
displa
the
them
.
y
to
System
Measurement
asks
T
1-19
Page 28

5.
Press
4
MENU
.
5
1-20
System
Measurement
asks
T
Pressing
ectrum-analyzer functions.
sp
4
MENU
accesses
5
the
men
u
softk
eys that
contain
the
Page 29

6.
Press
and enter
NNNNNNNNNNNNNN
Misc
NNNNNNNNNNNNNNNNNNNNNNNNNNNNNNNNNNN
,
MORE 1 of 3
445
.
NNNNNNNNNNNNNNNNNNNNNNNNNNNNNNNNNNNNNNNNN
,
catalog & MSI
,then
NNNNNNNNNNNNNNNNNNNNNNNNNNNNNNNNNNNNNN
HP-MSIB CARD
This key sequence species that mass storage information for the
HP 70900B lo cal oscillator will be sent to the displayatHP-MSIB
address 4 (default address). The mass-storage device link between
the sp ectrum analyzer and the displayis now established so that
they communicate properly.
If the display address is
not
set to4, then you will get an error
when you try to access the card reader. Note that the display
address is shown in the sp ectrum-analyzer display on the display
screen as shown in the following gure.
Memory card contents, if any, will appear under \Page 1 Prex
''".
CAUTION
ormatting
F
memory
a
card
will
erase
previously-stored
all
System
Measurement
con
asks
T
ten
ts.
1-21
Page 30

7. Press
NNNNNNNNNNNNNNNNNNNNNNNNNNNNNNNNNNNNNNNNNNNN
CATALOG 1 of 2
NNNNNNNNNNNNNNNNNNNN
,
FORMAT
,then
NNNNNNNNNNNNNNNNNNNNNNNNNNNNNNNNNNNNNNNNNNNN
CONFIRM FORMAT
.
This key sequence formats the HP-MSIB card that is in the
memory-card reader.
8.
Press
NNNNNNNNNNNNNNNNN
ENTER
4
SAVE
.
5
on the hardkey panel,
NNNNNNNNNNNNNNNNNNNNNNNNNNNNNNNNNNNNNN
SAVE TRACE A,415
, then
This key sequence saves Trace A in trace register 1 on the memory
card. Once the path is selected, this step is all that you need to
do for the next save operation.
1-22
System
Measurement
asks
T
Page 31

Example 10. Execute
the HP 70000 Customer
Demo Downloadable
Program (DLP)
Downloadable programs are programs resident in the spectrum
analyzer that are executable without an external computer. These
programs can b e either one-button solutions or interactive routines.
DLPs can b e accessed using the front-panel softkeys. They can also
be accessed via an external computer by sending the appropriate
programming commands allowing distributed processing.
A set of four example DLPs are downloaded into the HP 71209A
system before it is sent out from the factory. A package containing
these DLPs is included with your shipment if these DLPs are
missing. The HP 70000 Customer Demo DLP package contains: a
oppy disk with the four programs, an operation note with complete
DLP loading instructions, and the
and DLP Toolkit Manual
1.
Press
4
5
and note if the
USER
that describ es how to create your own DLP.
Downloadable Programming Guide
NNNNNNNNNNNNNNNNNNNNNNN
DLPDEMO
softkey app ears.
This step veries that the DLPDEMO program is loaded in the
instrument. If the HP 70000 Customer Demo DLP is already
2.
step
skip
y
ma
ou
y
,
\MMS
to the
DLP"
Op
from
eration
Note instructions
pac
from
DLP
computer.
a
equipmen
on
Demo
t
the
(that
age)
k
This
t
70000
HP
instructions.
Note
pro
ere
w
loading
for
eration
Op
requiremen
Customer
vided
the
and
ts
with
Note
2.
loaded
Load
Demo
w
ollo
F
HP
the
in
DLP
vides
pro
explicit
to
in
the
DLP
the
70000
to
complete
step-b
ternal
in
program
le
disk according
Operation
Customer
instrumen
the
information
y-step
memory
loading instructions.
Press
3.
Pressing
HP
4
USER
70000
.
5
4
5
USER
Customer
accesses
Demo
the
user
DLP
softk
.
ey
men
u
that
con
tains
the
System
Measurement
asks
T
1-23
Page 32

4. Press
DLPDEMO
.
NNNNNNNNNNNNNNNNNNNNNNN
NNNNNNNNNNNNNNNNNNNNNNN
Pressing
DLPDEMO
accesses the HP 70000 Customer Demo DLP
that contains the following four programs:
NNNNNNNNNNNNNNNNNNNNNNNNNNNNNNNNNNNNNNNNN
Total HarmDis
NNNNNNNNNNNNNNNNNNNNNNNNNNNNNNNNNNNNNNNNNNNN
Monitor Signal
NNNNNNNNNNNNNNNNNNNNNNNNNNNNNNNN
Water Fall
NNNNNNNNNNNNNNNNNNNNNNNNNNNNNNNNNNN
Spur Search
The HP 70000 Customer Demo DLP is for demonstration
purposes only, but the DLPs can be used for making
measurements. Use the DLP Toolkit manual provided with this
DLP package either to mo dify the existing DLPs or to write your
own DLP.
In using the DLPs, you will nd that they are self-explanatory
the
Use
use.
to
easy
ery
v
and
information
5.
exit
o
T
Pressing
places
Pressing
and places
y
the
ou
regarding
HP
N
N
N
N
N
N
N
N
N
N
N
EXIT
bac
N
N
N
N
N
N
N
N
N
N
N
EXIT
ou
y
N
N
N
from
kat
N
NN
again
bac
70000
DLPs.
Customer
any
b
the
at
at
k
the
of
eginning
time
this
user
the
N
N
N
N
N
DLP
four
N
softk
N
N
N
N
N
N
N
Demo
of
lea
N
N
N
N
N
N
N
N
N
N
N
N
N
N
N
Intro
DLP
program
DLPDEMO
the
the
es
v
main
ey
N
to
ey
softk
NN
press
,
EXIT
demonstrations
DLPDEMO
u.
men
displa
N
N
N
N
N
N
N
N
N
program.
y
N
N
N
.
program
more
1-24
System
Measurement
asks
T
Page 33

If you try to recall a
saved trace and it fails
Check the selected mass storage device of the lo cal oscillator and
that of the display.
Tocheck the mass storage device of the HP 70900B, press the
following softkeys:
NNNNNNNNNNNNNN
Misc
NNNNNNNNNNNNNNNNNNNNNNNNNNNNNNNNNNN
MORE 1 of 3
NNNNNNNNNNNNNNNNNNNNNNNNNNNNNNNNNNNNNNNNN
catalog & MSI
Tocheck the mass storage device of the display, press the
following keys:
4
DISPLAY
NNNNNNNNNNNNNNNNNNNNNNNNNNNNNNNNNNNNNN
5
Mass Storage
For example, if the memory card is the desired mass storage
device, then set the HP 70900B mass storage device to the display
by pressing
access.
NNNNNNNNNNNNNNNNNNNNNNNNNNNNNNNNNNNNNN
HP-MSIB CARD
set
Then
the
displa
which selects the path for memory-card
memory
the
y's
mass
storage
device
to
card.
.
erly
that
the
storage
of
reader.
prop
memory
a
disk
correctly
device,
HP
the
press
this,
70004A
has
k
Chec
the
If
card
the
If
een
b
k
Chec
memory
the
If
then the
70004A
default
The
4
DISPLAY
DISPLAY
installed
mak
mak
disk
the
to
is
4
e
the
.
is
sure
e
that
sure
e.
driv
addressed
is
mass
address
card
conrm
o
T
the selected
that
memory
een
b
has
HP-IB
erly
prop
the selected
that
HP-MSIB
order
in
address
N
N
N
N
N
N
N
NN
NN
NN
5
,
Address Map
card
prop
has
disk
installed
has
card
address
y
for
NN
NN
N
N
N
N
N
N
N
N
N
N
correct
set
e
b
the
device
device
memory
mass storage
een selected,
has b
inserted.
erly
een
b
in
mass
been
access
to
ou
HP
the
of
N
N
N
N
NN
NN
selected,
the
storage
selected as
ust
m
70004A
, then scroll with the knob until
appears. Note the column number which is the same as
the address.
.
The selected MSI address and the MSIB address of the selected
same.
the
displa
address,
legal
y
an
e
b
can
y
but
System
Measurement
must
they
e
b
asks
T
1-25
Page 34

 Loading...