

Page 1

Agilent MassHunter Workstation – Data
Acquisition for 6400 Series Triple
Quadrupole LC/MS
Familiarization Guide
Before you begin 3
Prepare your system 3
Prepare to acquire data 4
Exercise 1 – Develop an acquisition method 6
Task 1. Enter acquisition parameters and acquire data 6
Task 2. Determine precursor ion masses 11
Task 3. Find optimum fragmentor voltage for maximum response 14
Task 4. Determine product ion masses 24
Task 5. Find optimum collision energy for MRM acquisition 30
Exercise 2 – Develop a Dynamic MRM acquisition method from an MRM
acquisition data file or an MRM method 33
Task 1. Create a batch file from an existing MRM data file 33
Task 2. Print a report in the Quantitative Analysis program 36
Task 3. Create a Dynamic MRM method using Update dMRM 37
Task 4. Create a Dynamic MRM method from an MRM method 39
Exercise 3 – Create a Triggered Dynamic MRM acquisition method 40
Task 1. Create a Triggered Dynamic MRM method from a Dynamic MRM
method manually 40
Task 2. Add/Modify compounds in an existing database 42
Task 3. Create a Triggered Dynamic MRM method from an existing
database 52
Exercise 4 – Optimize Acquisition parameters 56
Task 1. Use the Optimizer Software to optimize acquisition
parameters 56
Task 2. Use the “Source and iFunnel Optimizer” program to optimize
acquisition parameters 63
Page 2

Use the exercises in this guide to learn how to use the Agilent 6400 Series
NOTE
Triple Quad LC/MS. You can do these exercises with the demo data files,
SulfaDrugs, shipped with the system (in the Data folder of your Qualitative
Analysis installation disk), or with data you acquire.
In Exercise 1, you learn how to determine the best acquisition settings for
analyzing your compounds of interest. These instructions help you understand
not only how to set up a worklist to optimize instrument parameters for best
sensitivity in acquisition, but also how to use the Qualitative Analysis program
to identify parameter values producing optimum signal response. You can also
learn about the Qualitative Analysis program by using the Qualitative
Analysis Familiarization Guide or the Qualitative Analysis online Help.
In Exercise 2, you learn how to use either an acquired data file or the
Quantitative Analysis report results to update a dynamic MRM method. This
method allows you to easily set up a dynamic MRM method.
In Exercise 3, you learn how to create a triggered dynamic MRM method.
In Exercise 4, you learn how to use two programs to optimize parameters. The
Optimizer Software helps you optimize acquisition parameters. Specifically, it
automates the selection of the best precursor ion and the fragmentor voltage
for the most abundant precursor ion, selection of the best product ions, and
optimization of collision energy values for each transition for a list of
compounds you specify. The “Source and iFunnel Optimizer” program helps
you to find the optimal source and iFunnel parameters.
See the Concepts Guide to learn more about how the triple quadrupole mass spectrometer
works and why the fragmentor and collision energy voltages are important. For background
information, see Chapter 3, “Agilent Triple Quad MS and Sensitivity”, in the Concepts Guide.
See the online Help for detailed information on how the program works.
Each task is presented in a table with three columns:
• Steps – Use these general instructions to proceed on your own to explore
the program.
• Detailed Instructions – Use these if you need help or prefer to use a
step-by-step learning process.
• Comments – Read these to learn tips and additional information about each
step in the exercise.
2 Agilent 6400 Series Triple Quad LC/MS Familiarization Guide
Page 3

Before you begin
NOTE
Before you begin, you need to check that your system is ready. If you plan to
acquire data, you also need to set up the instrument.
Prepare your system
1 Check that:
• The Data Acquisition program has been installed.
• The LC modules and the 6400 Series Triple Quad LC/MS have been
• The performance has been verified.
• The system has been turned on.
If these actions have not yet been done, see the Installation Guide for your
instrument.
2 Copy the data files to your PC.
Copy the folder named SulfaDrugs in the Data folder on your Qualitative
Analysis installation disk to any location on your hard disk. This folder
contains all the data files needed for this exercise.
Do not re-use the sulfa drug data files already on your system unless you know that you
copied them from the originals on the disk and you are the only one using them. Data files
that are already on the system may contain processed results, leading to different behavior
during the exercises in this guide.
Before you begin
Prepare your system
configured.
Agilent 6400 Series Triple Quad LC/MS Familiarization Guide 3
Page 4

Before you begin
Prepare to acquire data
Prepare to acquire data
Parts List The exercise in this guide uses this equipment and materials:
If you do not intend to acquire data but want to learn how to use the
Qualitative Analysis program for method development, you can skip this step,
which tells you how to prepare the demo sample. You then do those tasks that
show you how to use the Qualitative Analysis program with the sulfa drug
data files shipped with the system.
• Agilent 1200, 1260 Infinity or 1290 Infinity LC modules: well-plate
sampler, binary pump, thermostatted column compartment, DAD
• Zorbax column (see Table 1 on page 4)
• A 1 ng/µL concentration of the sulfa mix sample (prepared in this step)
Tab l e 1 Zorbax columns
Triple Quadrupole Column Description Film
Thickness
6410B, 6420, 6430, 6460
and 6490
SB-C18 2.1mm x 50mm 1.8 µm 80Å 822700-902
Pore Size Part
Number
1 Prepare the LC solvent.
In 1-liter reservoirs of HPLC-grade water and acetonitrile (ACN), add 1 mL
of 5M ammonium formate each to make 5mM ammonium formate in water
and ACN and use for the A and B channels, respectively.
2 Prepare the sample.
a Add 10 µL of the sulfa mix from one of the ampoules (500 µL) to 990 µL
of solvent A in a 2 mL glass sample vial so that the final concentration is
1 ng/µL.
b Cap the vial and place in a sample location in the autosampler.
3 Set up the LC column.
Use the Agilent column from Table 1. Other columns and instrument
parameters may be used in these exercises, but some parameters may need
adjustment, and the results will differ.
4 Set the column temperature to 60
ο
C. Lower temperatures may be used;
however, the retention times will be longer, and the pump pressure may
exceed the limit of some LC systems.
4 Agilent 6400 Series Triple Quad LC/MS Familiarization Guide
Page 5
Before you begin
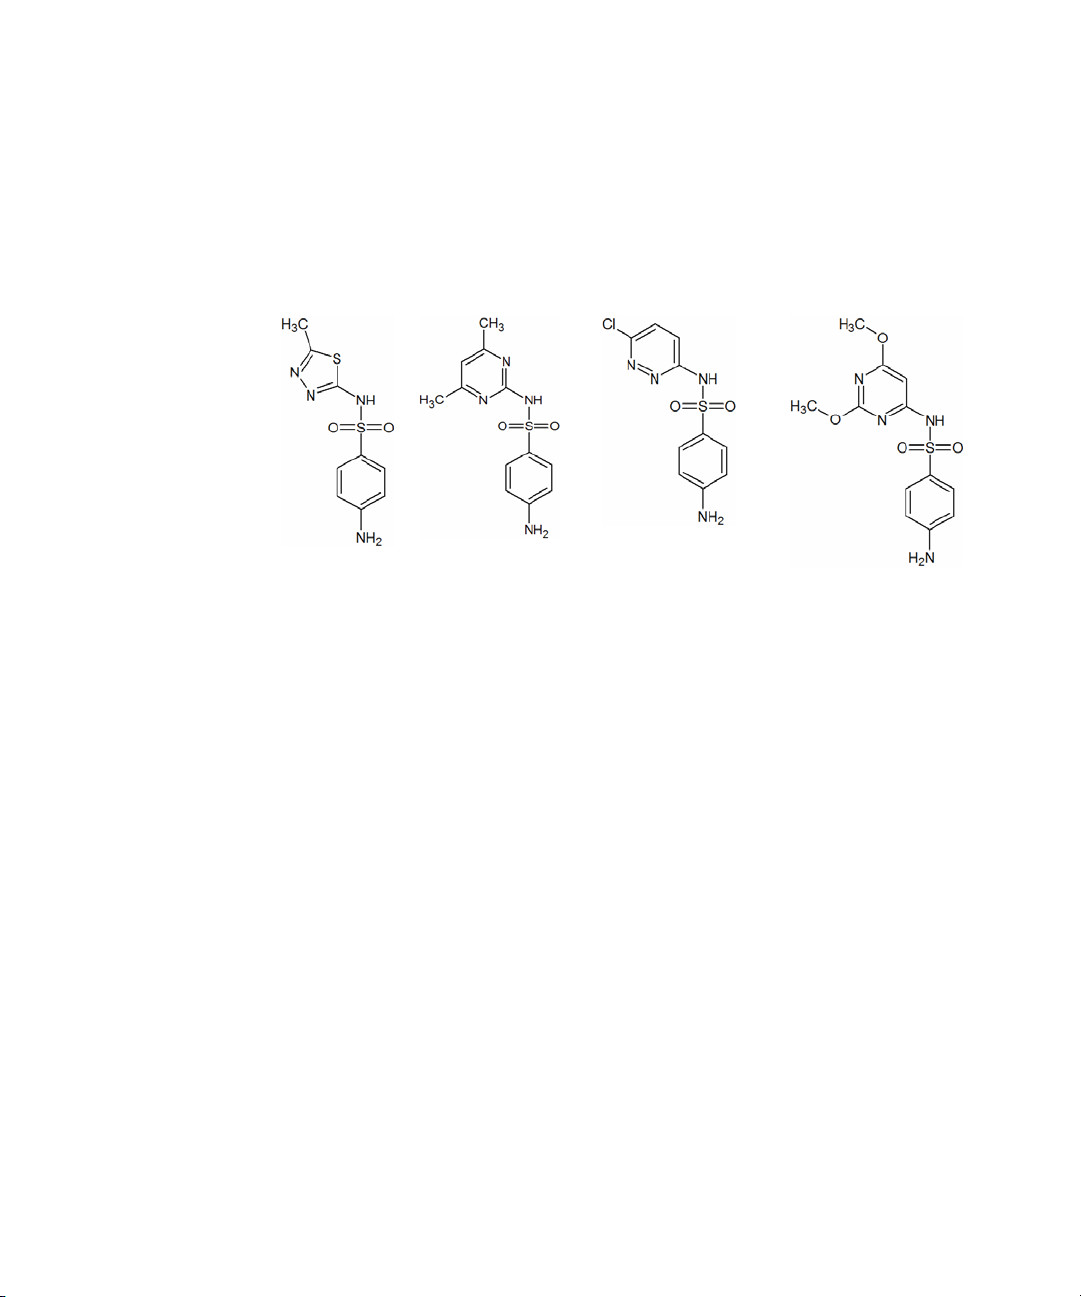
Sulfamethizole Sulfamethazine Sulfachloropyridazine Sulfadimethoxine
NOTE
Prepare to acquire data
The Electrospray LC Demo Sample (P/N 59987-20033) contains five ampoules
with 100 ng/µL each of sulfamethizole (M+H)
279, sulfachloropyridazine (M+H)
+
= 285, and sulfadimethoxine (M+H)+ = 311.
+
= 271, sulfamethazine (M+H)+ =
Determining optimal parameter values for acquiring sample compound data requires that
the Agilent Triple Quad instrument already be tuned on the Tuning Mix calibrant ions.
Before proceeding with this exercise, make sure you have used Checktune or Autotune to
verify that calibrant ions each have the proper mass assignment, peak width, and signal
intensity.
See the Quick Start Guide, Installation Guide or online Help for instructions on tuning the
instrument.
Agilent 6400 Series Triple Quad LC/MS Familiarization Guide 5
Page 6

Exercise 1 – Develop an acquisition method
Task 1. Enter acquisition parameters and acquire data
Exercise 1 – Develop an acquisition method
For this exercise you analyze a mixture of four sulfonamide compounds.
Task 1. Enter acquisition parameters and acquire data
In this exercise, you enter the conditions for the analysis of the sulfa drug mix.
l
Steps Detailed Instructions Comments
1 Enter LC parameters appropriate
for sulfa drug mix.
See Tab l e 2 .
a Double-click the Data Acquisition
icon.
b Make sure that Acquisition appears as
the selection in the Context text box.
If Tune is the selection, click
Acquisition from the Context
dropdown menu in the Combo bar.
c Enter the LC parameters listed in the
Tab l e 2.
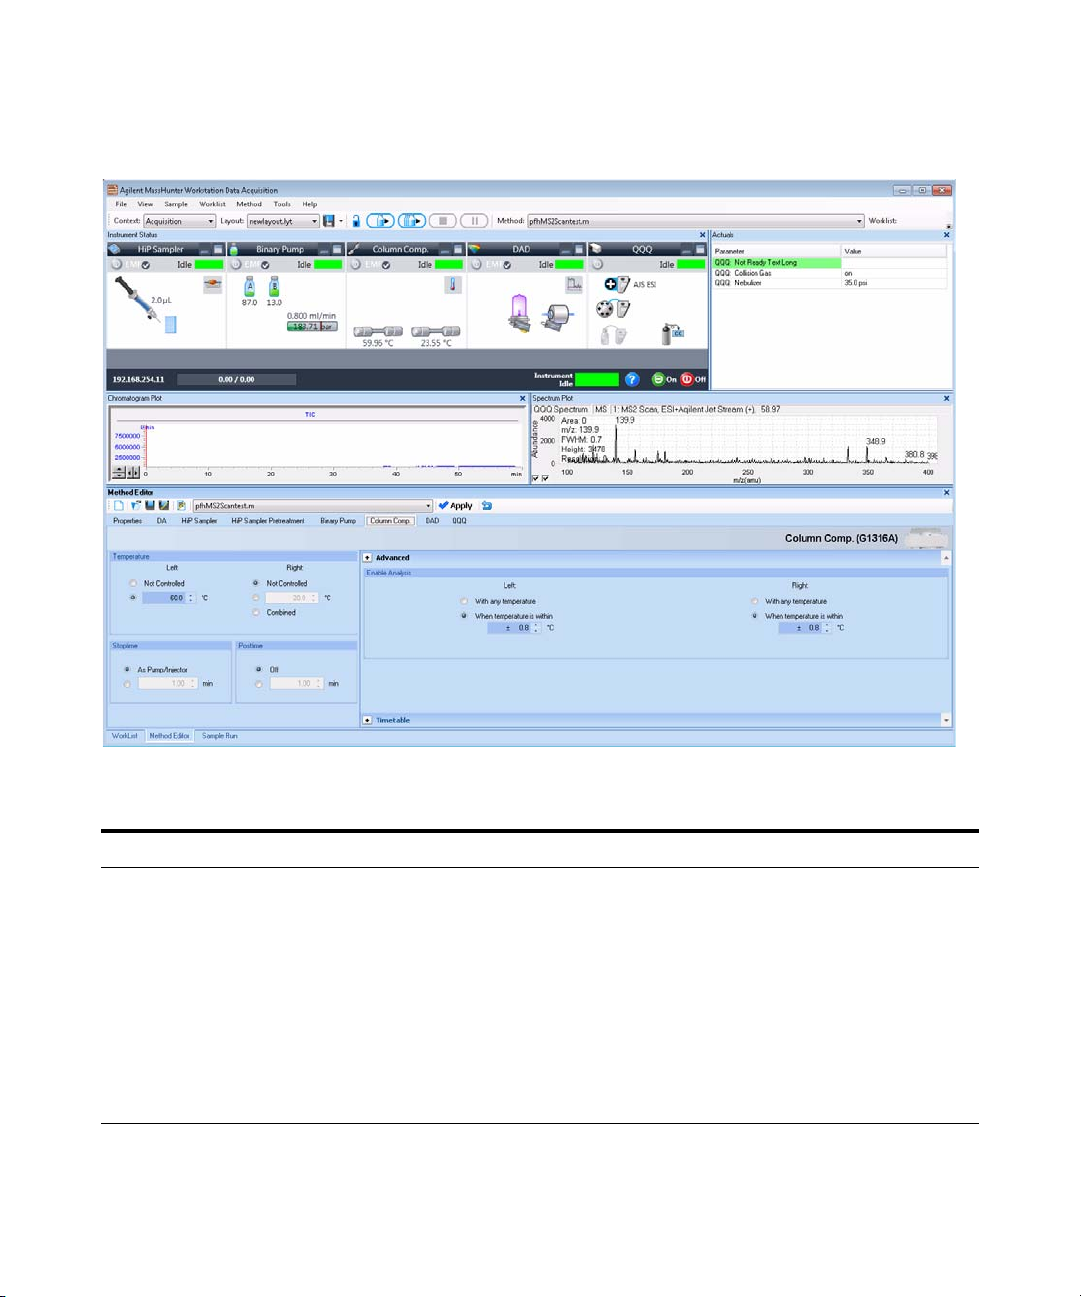
• The Data Acquisition window
appears. See Figure 1.
Tab l e 2 LC parameters for sulfa drug mix
Parameter LC Parameter
PUMP
• Flowrate 800 µL/min
• Solvent A 5 mM ammonium formate in water
• Solvent B 5 mM ammonium formate in 90:10 acetonitrile:water
• Gradient (min - %B) 0 min - 13%
1.80 min - 60%
2 min - 60%
• Stop Time 2.5 min
• Post Time 3.0 min
INJECTOR
• Inj. Vol. 2.0 µL
6 Agilent 6400 Series Triple Quad LC/MS Familiarization Guide
Page 7

Exercise 1 – Develop an acquisition method
Task 1. Enter acquisition parameters and acquire data
Tab l e 2 LC parameters for sulfa drug mix (continued)
Parameter LC Parameter
• Injection Standard
• Draw Position 0.0 mm
UV DETECTOR
• Ch A 254 nm (4 nm BW on DAD)
• REF A (DAD only) 400 nm (80 nm BW)
COL THERM
• Temp 60 °C for the 6460 and 6490 with Agilent Jet Stream Technology
40 °C for other instruments
Agilent 6400 Series Triple Quad LC/MS Familiarization Guide 7
Page 8
Exercise 1 – Develop an acquisition method
Task 1. Enter acquisition parameters and acquire data
Figure 1
Steps Detailed Instructions Comments
2 Enter MS parameters appropriate
for sulfa drug mix and save the
method as iiiMS2Scantest.m,
where iii are your initials.
See Tab l e 3 .
Agilent MassHunter Workstation Software – Data Acquisition window
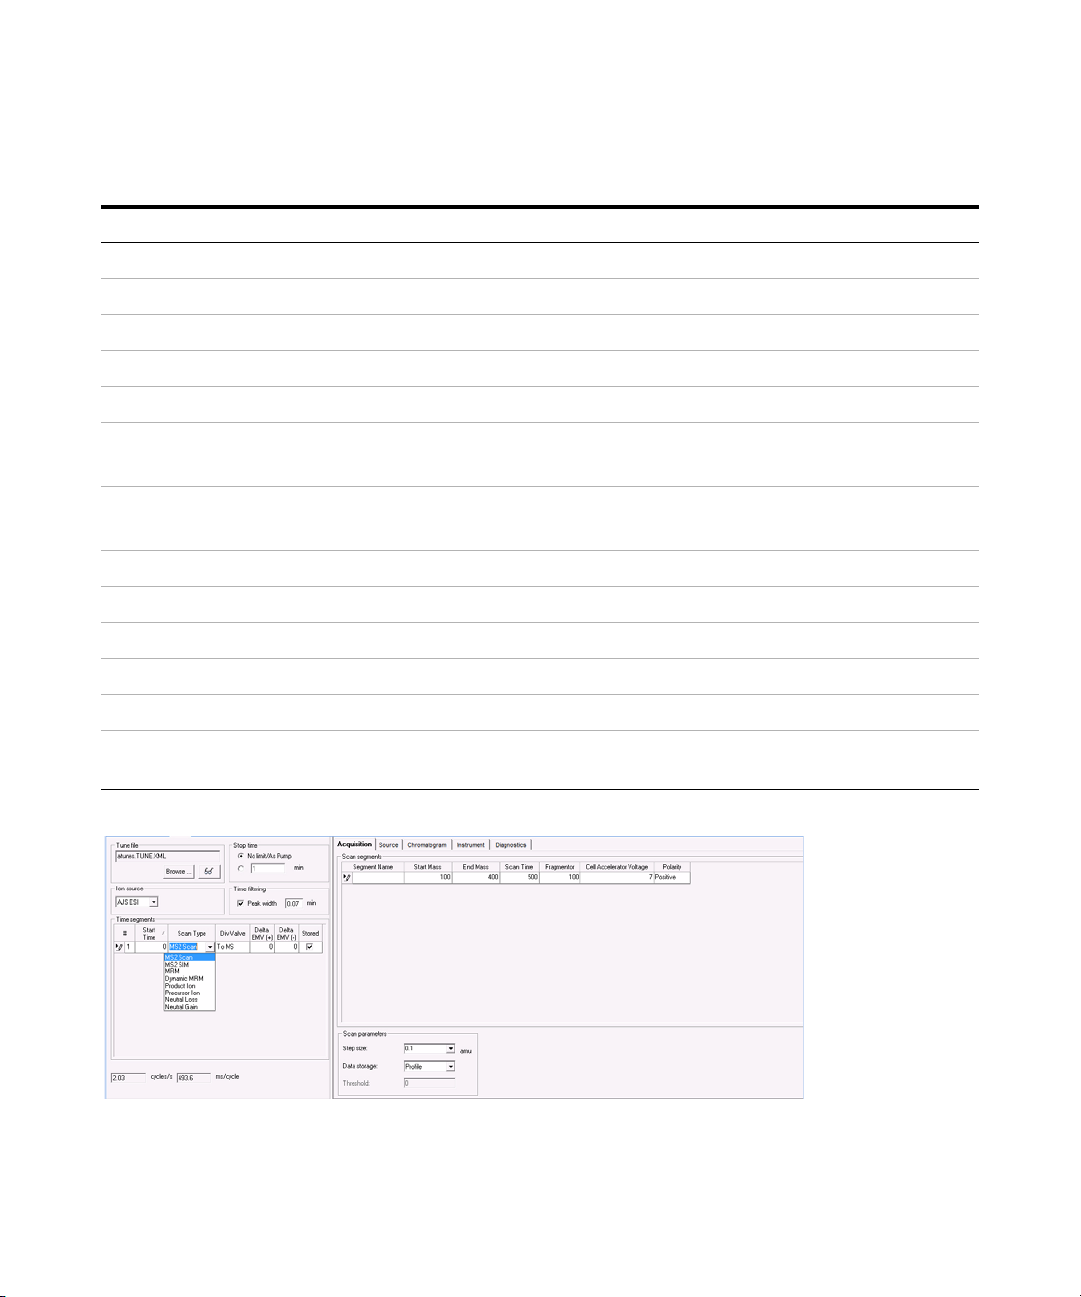
a Click the QQQ tab in the Method
Editor window.
b Select MS2Scan from the Scan Type
list in the Time Segments table.
c Enter the other MS parameters as
listed in Ta bl e 3 . These parameters are
in either the Acquisition or the Source
tabs.
d Save the method as
iiiMS2Scantest.m, where iii are your
initials.
8 Agilent 6400 Series Triple Quad LC/MS Familiarization Guide
Page 9
Exercise 1 – Develop an acquisition method
If you have an Agilent 6490, you cannot edit the
Fragmentor column. The value for the Fragmentor
for a 6490 QQQ comes from the tune file, and for the
6490 it is typically closer to 380 V.
Task 1. Enter acquisition parameters and acquire data
Tab l e 3 MS parameters for sulfa drug mix
Parameter Value (ESI) Value (AJS ESI)
• Inlet ESI (positive polarity) AJS ESI (positive polarity)
• Scan Type MS2Scan MS2Scan
• Delta EMV pos 400 V 200 V
• Mass Range 100 to 400 100 to 400
• Cell Acceleration Voltage 7 V 7 V
• Gas Temp 350 °C
250 °C for Agilent 6490
• Gas Flow 12 L/min
14 L/min for Agilent 6490
• Nebulizer 50 psi 35 psi
• Sheath Gas Temperature not applicable 400 °C
• Sheath Gas Flow not applicable 12 L/min
• Nozzle Voltage not applicable 0 V
• Capillary Voltage positive 4000 V 4000 V
• Fragmentor 100 V (not adjustable on 6490, comes
from the Tune file)
350 °C
250 °C for Agilent 6490
10 L/min
14 L/min for Agilent 6490
100 V (not adjustable on 6490, comes
from the Tune file)
Figure 2 Select Scan Type of MS2 Scan in the QQQ tab
Agilent 6400 Series Triple Quad LC/MS Familiarization Guide 9
Page 10
Exercise 1 – Develop an acquisition method
Task 1. Enter acquisition parameters and acquire data
Steps Detailed Instructions Comments
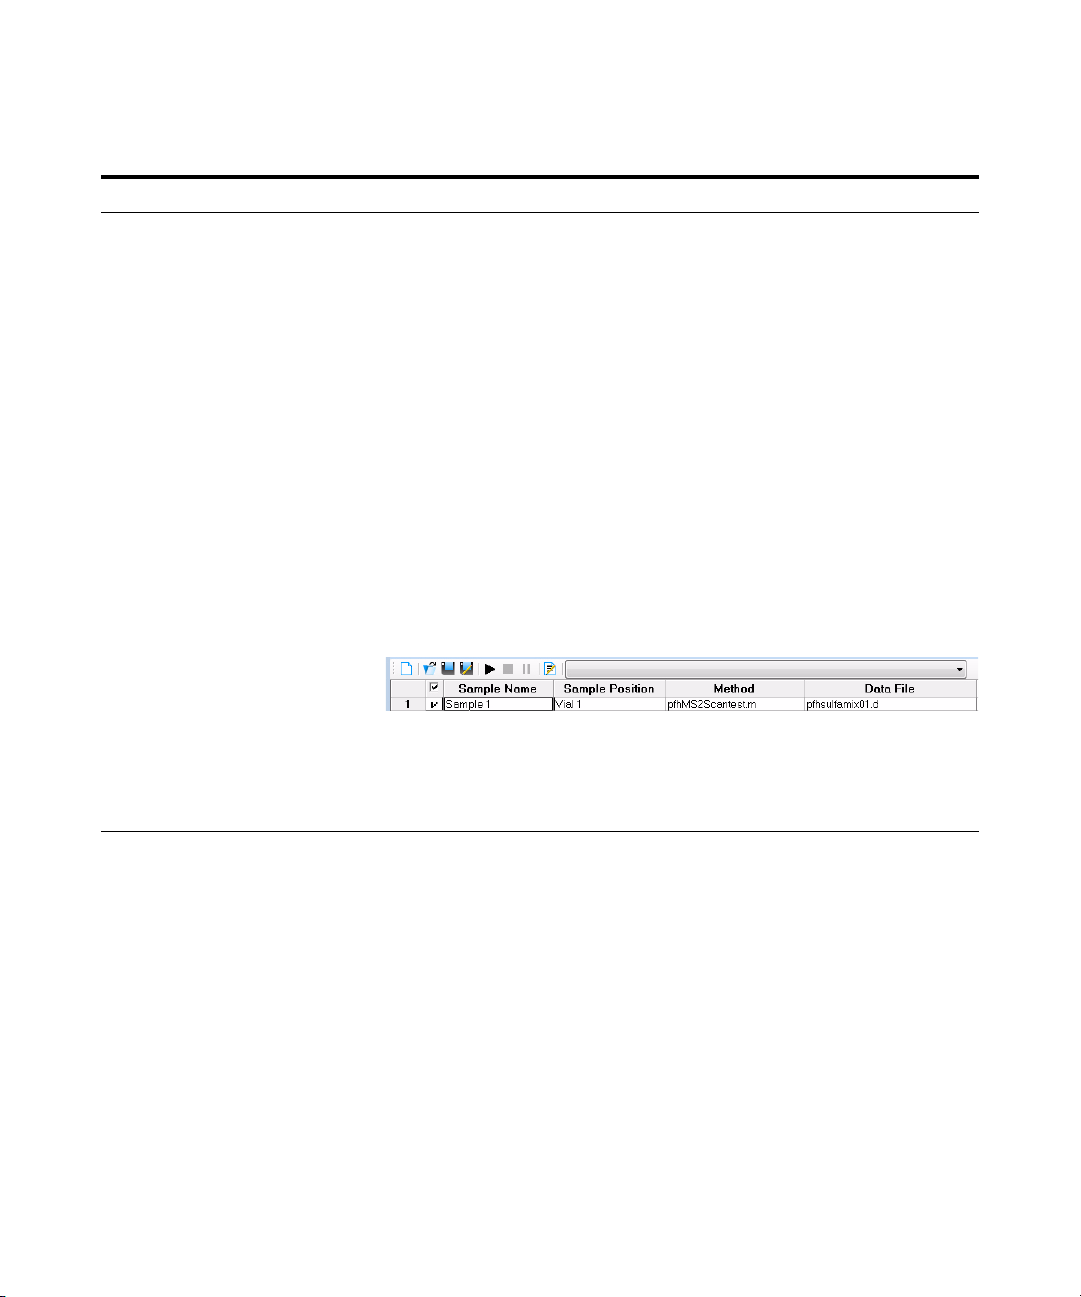
3 Acquire data (optional).
• Set up a one-line worklist with
the method you just created.
• Name the data file
iiisulfamix01.d, where iii are
your initials.
• Designate a directory path to
hold your data files and method.
a If necessary, click View > Worklist to
display the Worklist window.
b Click Worklist > Worklist Run
Parameters. Verify that the
parameters are set properly. Click OK.
c Click Worklist > Add Multiple
Samples.
d Ty p e iii
data file name
e Select iiiMS2Scantest.m as the
method name.
f Click the Sample Position tab.
g Select the Autosampler, Well-plate or
Vial Tray.
h In the graphic, select a single position.
Click OK.
i In the Worklist window, mark the
check box to the left of the sample.
j Click the Start Worklist Run icon in
the main toolbar, the Run Worklist
icon in the Worklist toolbar or click the
Worklist > Run command.
sulfamix01.d as the
• The Worklist window is tabbed with
the Method Editor window by
default. Click the Worklist tab to
show the Worklist window.
• The Number of samples is set to 1.
• You have just acquired a full scan
MS data file to see what ions are
being formed from the sample.
• This step is optional because you
can perform the next step with an
example data file that comes with
the program. If you prefer, you can
create your own data file as
described in this step.
10 Agilent 6400 Series Triple Quad LC/MS Familiarization Guide
Page 11
Exercise 1 – Develop an acquisition method
Task 2. Determine precursor ion masses
Task 2. Determine precursor ion masses
In this exercise, you determine the precursor ions for each of the sulfa drugs
in the acquired data file.
Steps Detailed Instructions Comments
1 Open the acquired data file.
• In the Qualitative Analysis
program, open either the
example file, sulfamix01.d, or
the data file you created in “Task
1. Enter acquisition parameters
and acquire data” on page 6.
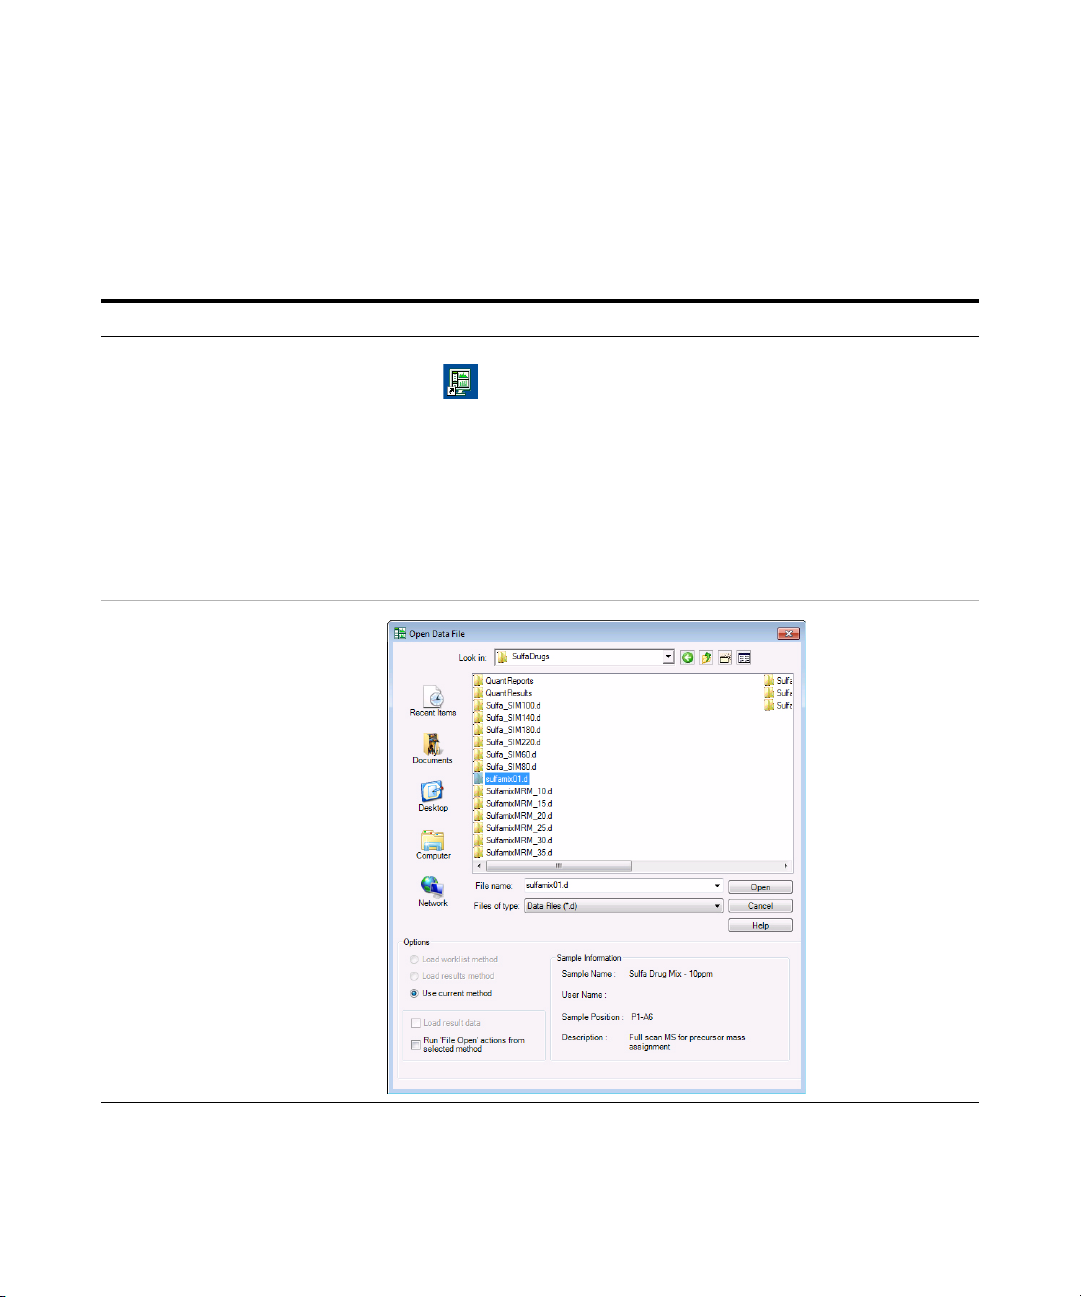
a Double-click the Qualitative Analysis
icon.
The program displays the “Open Data
File” dialog box.
• When you open the sulfa drug
directory after installation, the Load
result data (lower left corner) check
box is grayed out.
• If you see the check box marked,
this means that the data file(s)
already contains results. Clear this
check box before opening the file.
Agilent 6400 Series Triple Quad LC/MS Familiarization Guide 11
Page 12
Exercise 1 – Develop an acquisition method
Before you begin, make sure that
all previous settings are returned
to their default values:
• Restore default layouts
• Click Configuration >
Window Layouts > Restore
Default Layout.
• Make sure the method is
default.m. (see title bar)
• Click Method > Open.
• Select default.m, and click
Open.
• Return display options to default
settings.
• In the Configuration menu,
click each of the Display
Options commands.
• Click Default, and then OK.
Or...
• Restore the General layout.
• Click Configuration >
Configure for Workflow >
General.
• Click OK.
• (optional) You may be asked to
save method changes.
• Return display options to default
settings.
• In the Configuration menu,
click each of the Display
Options commands.
Task 2. Determine precursor ion masses
Steps Detailed Instructions Comments
12 Agilent 6400 Series Triple Quad LC/MS Familiarization Guide
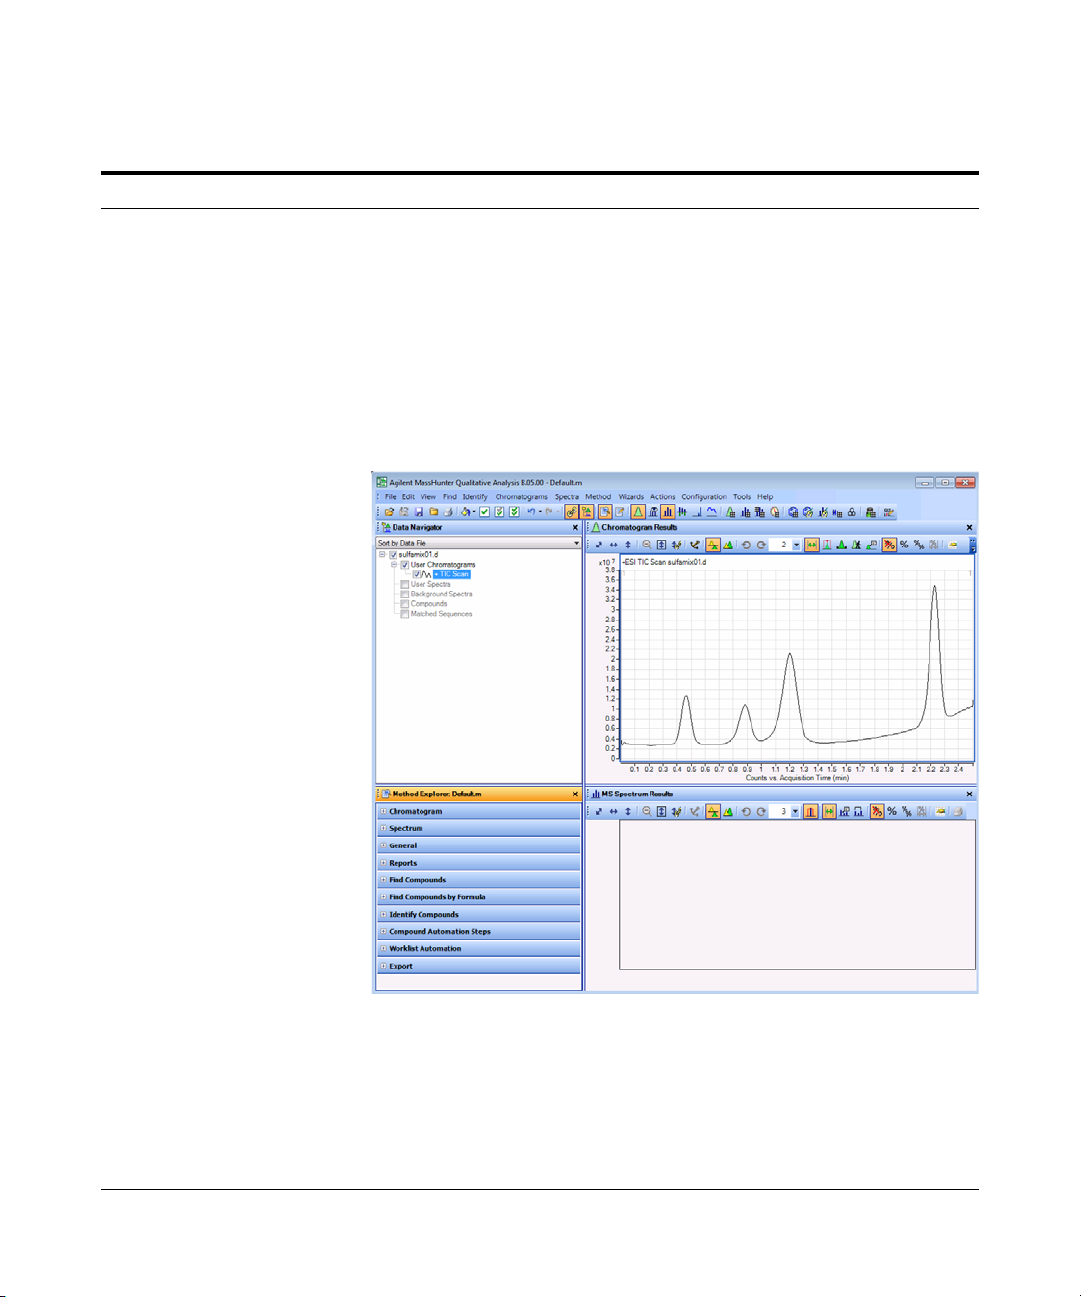
b Do one of the following:
• Select the example data file
sulfamix01.d, and click Open.
• Select the data file you created in
“Task 1. Enter acquisition
parameters and acquire data” on
page 6, and click Open.
By default, the system displays the
Total Ion Chromatogram (TIC).
• The figure below shows the default
layout.
• The Qualitative Analysis program
displays a newly opened data file
with the same layout and display
settings used for the previous data
file. Therefore, you MUST make
sure to return to the default settings
for this exercise.
Page 13
Exercise 1 – Develop an acquisition method
Task 2. Determine precursor ion masses
Steps Detailed Instructions Comments
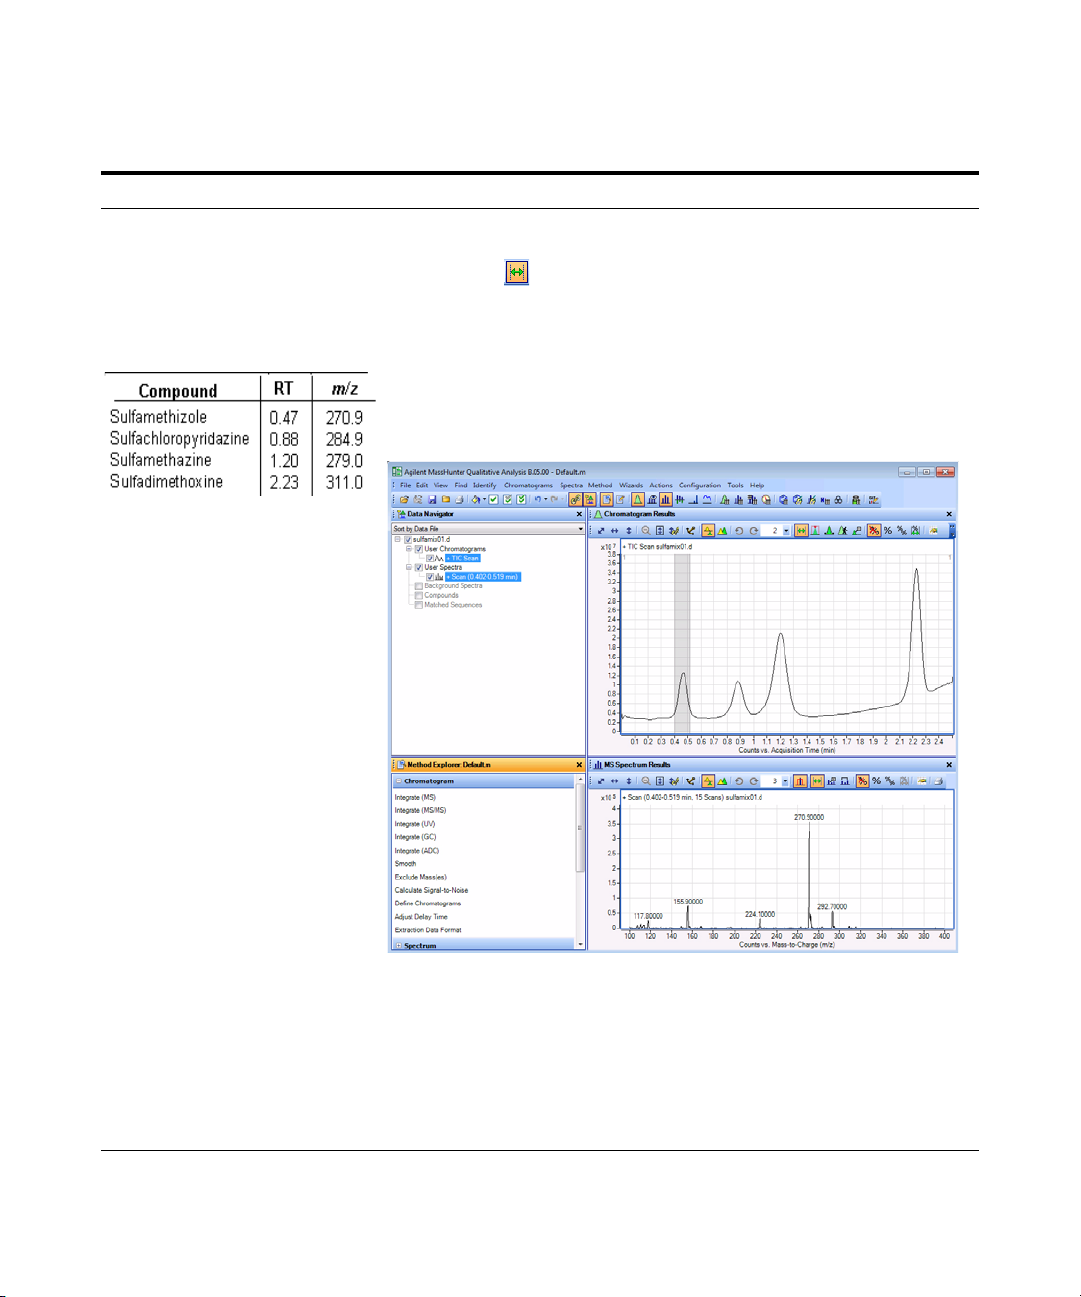
2 Determine precursor ion masses
for all four peaks.
• You have determined them
correctly if you find the values
are similar to those shown in
this table:
• If you acquired the data file using
the Agilent Jet Stream
Technology, the retention times
may be different.
• The sulfamix01.d data file was
acquired with a different column
so your retention times are
different.
• Close the data file after finding
the precursor ion masses.
a In the Chromatogram Results window,
make sure that the Range Select icon
in the toolbar is on.
b Click the left mouse button and drag
the cursor across the first peak to
produce a shaded region, as in the
figure below.
c Right-click the shaded area, and click
Extract MS Spectrum from the
shortcut menu.
.
• The system displays an averaged
spectrum across the peak in the MS
Spectrum Results window.
• The precursor mass of the first
compound, sulfamethizole, is
determined to be m/z 270.9.
• To obtain a single scan, doubleclick the apex of the peak.
d Repeat step a through step c for the
other compounds.
The precursor ion masses should
match those in the table in step 2.
e Click File > Close Data File.
f When asked if you want to save the
results, click No.
• Some compounds form sodium (Na)
and/or potassium (K) adducts as
well, corresponding to M + 23 and
M + 39 masses respectively. Seeing
these masses along with the M + H
can make for an easy confirmation
of which ion is the
pseudo-molecular ion (M + H)+.
Agilent 6400 Series Triple Quad LC/MS Familiarization Guide 13
Page 14
Exercise 1 – Develop an acquisition method
Task 3. Find optimum fragmentor voltage for maximum response
Task 3. Find optimum fragmentor voltage for maximum response
Task 3 shows you how to carry out the optimization for fragmentor voltage by
creating selected ion-monitoring experiments for each compound within a
method and setting up multiple methods with varying fragmentor voltages.
The Fragmentor Voltage for the 6490 is set automatically during Autotune, and
it cannot be set in the Data Acquisition program. If your instrument is a 6490,
skip to “Task 4. Determine product ion masses”. You can do the Qualitative
Analysis part of this task by using the data files that were shipped with the
software.
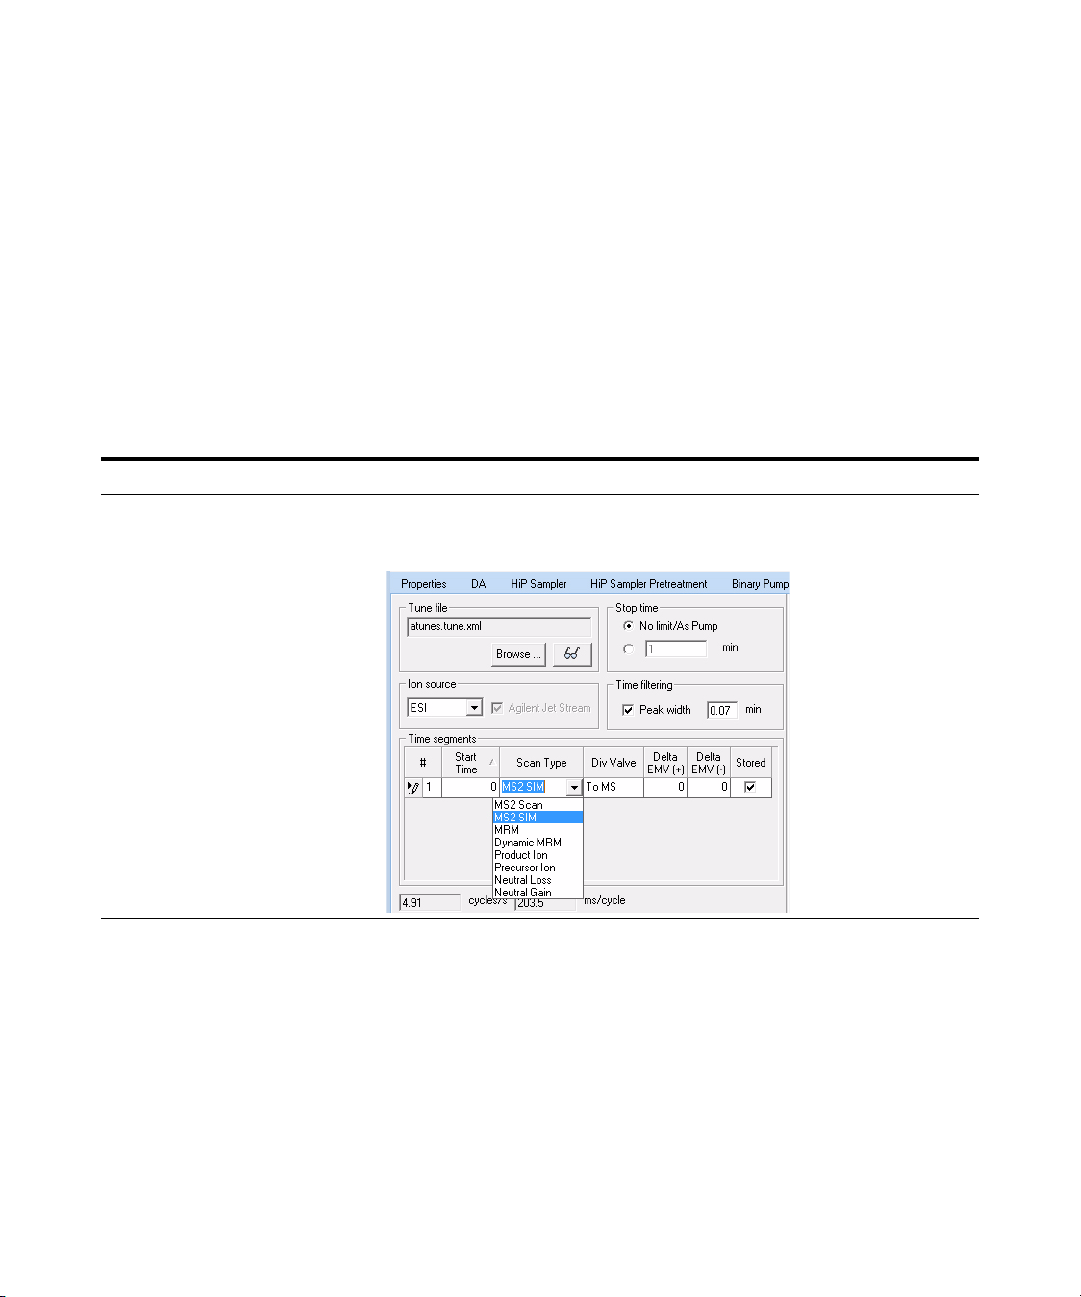
Steps Detailed Instructions Comments
1 Set up six methods for six different
fragmentor voltages.
• Change to a SIM experiment.
• Use 60, 80, 100, 140, 180 and 220
volts as the fragmentor voltages
for the six methods.
• Save the methods as
iiiMS2SIMxxx.m, where iii are
your initials and xxx is the
voltage.
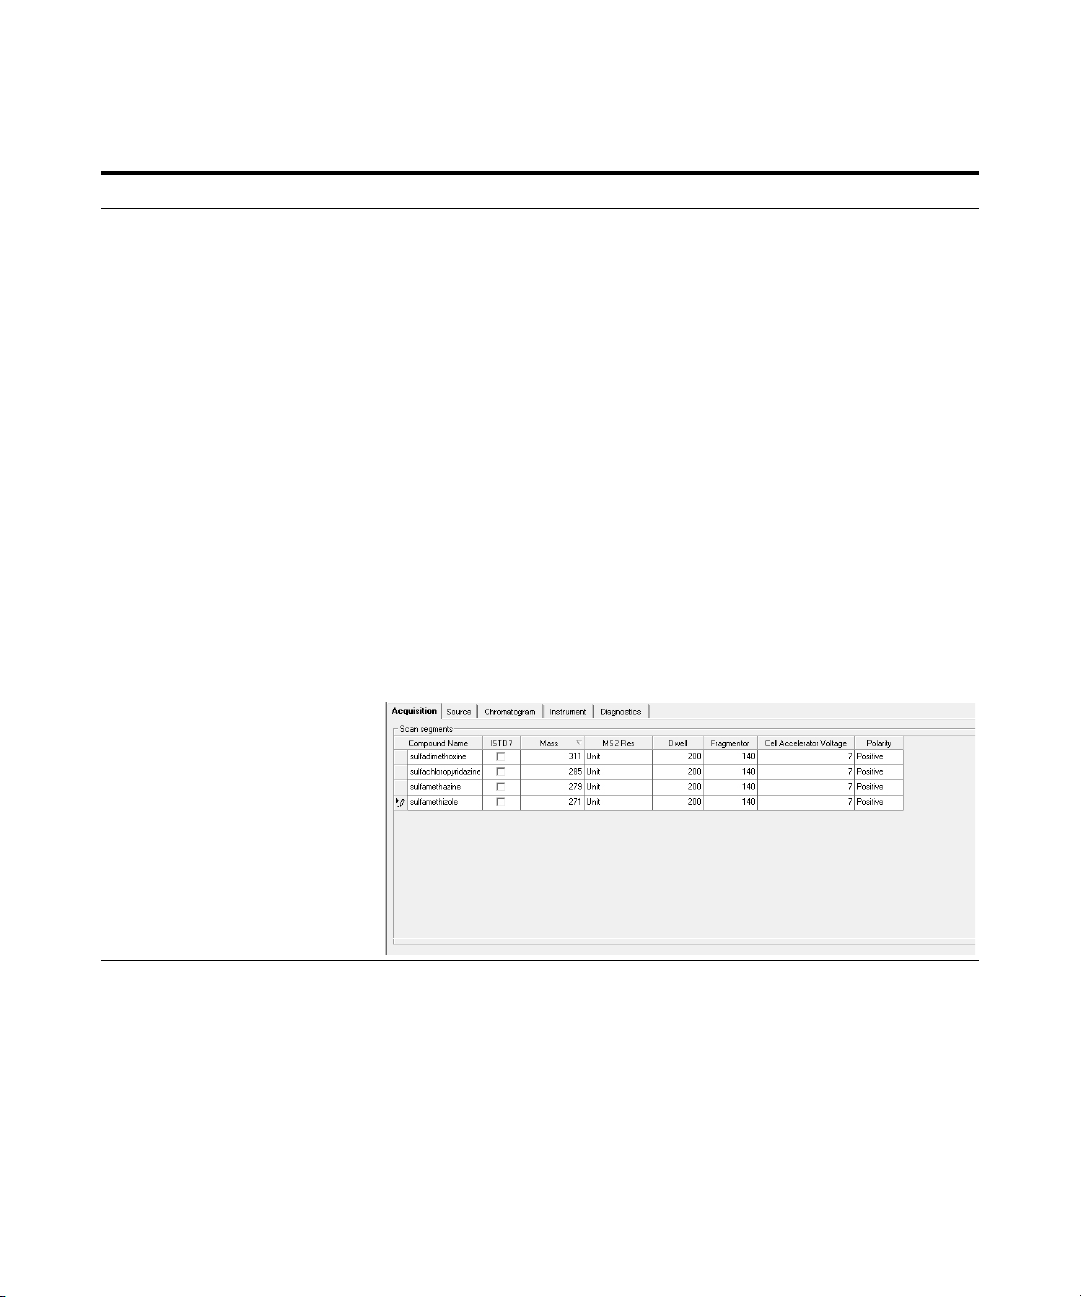
a In the Scan Type dropdown list, click
MS2 SIM.
14 Agilent 6400 Series Triple Quad LC/MS Familiarization Guide
Page 15
Exercise 1 – Develop an acquisition method
Task 3. Find optimum fragmentor voltage for maximum response
Steps Detailed Instructions Comments
b In the Acquisition tab, enter the
Compound Name and Mass
(precursor ion mass) for
sulfadimethoxine.
c Right-click anywhere in the Scan
segments section, and click Add Row.
d Type the Compound Name and the
Mass for sulfachloropyridazine.
e Repeat steps c and d for
sulfamethazine and sulfamethizole.
f Save the method as iiiMS2SIM140.m,
where iii are your initials.
g Change the fragmentor voltage to 60,
and save the method as
iiiMS2SIM060, where iii are your
initials.
h Repeat step g for voltages 80, 100, 180
and 220, saving the methods as
iiiMS2SIM080, iiiMS2SIM100,
iiiMS2SIM180 and iiiMS2SIM220,
where iii are your initials.
• With the MS2SIM Scan Type set, a
different set of columns appears in
the Acquisition window.
• The Instrument Control and Data
Acquisition program creates a SIM
experiment for each compound
mass, starting with a default
fragmentor voltage of 140. See the
example below.
• The Fragmentor column is grayed
out if the instrument type is an
Agilent 6490.
Agilent 6400 Series Triple Quad LC/MS Familiarization Guide 15
Page 16
Exercise 1 – Develop an acquisition method
Task 3. Find optimum fragmentor voltage for maximum response
Steps Detailed Instructions Comments
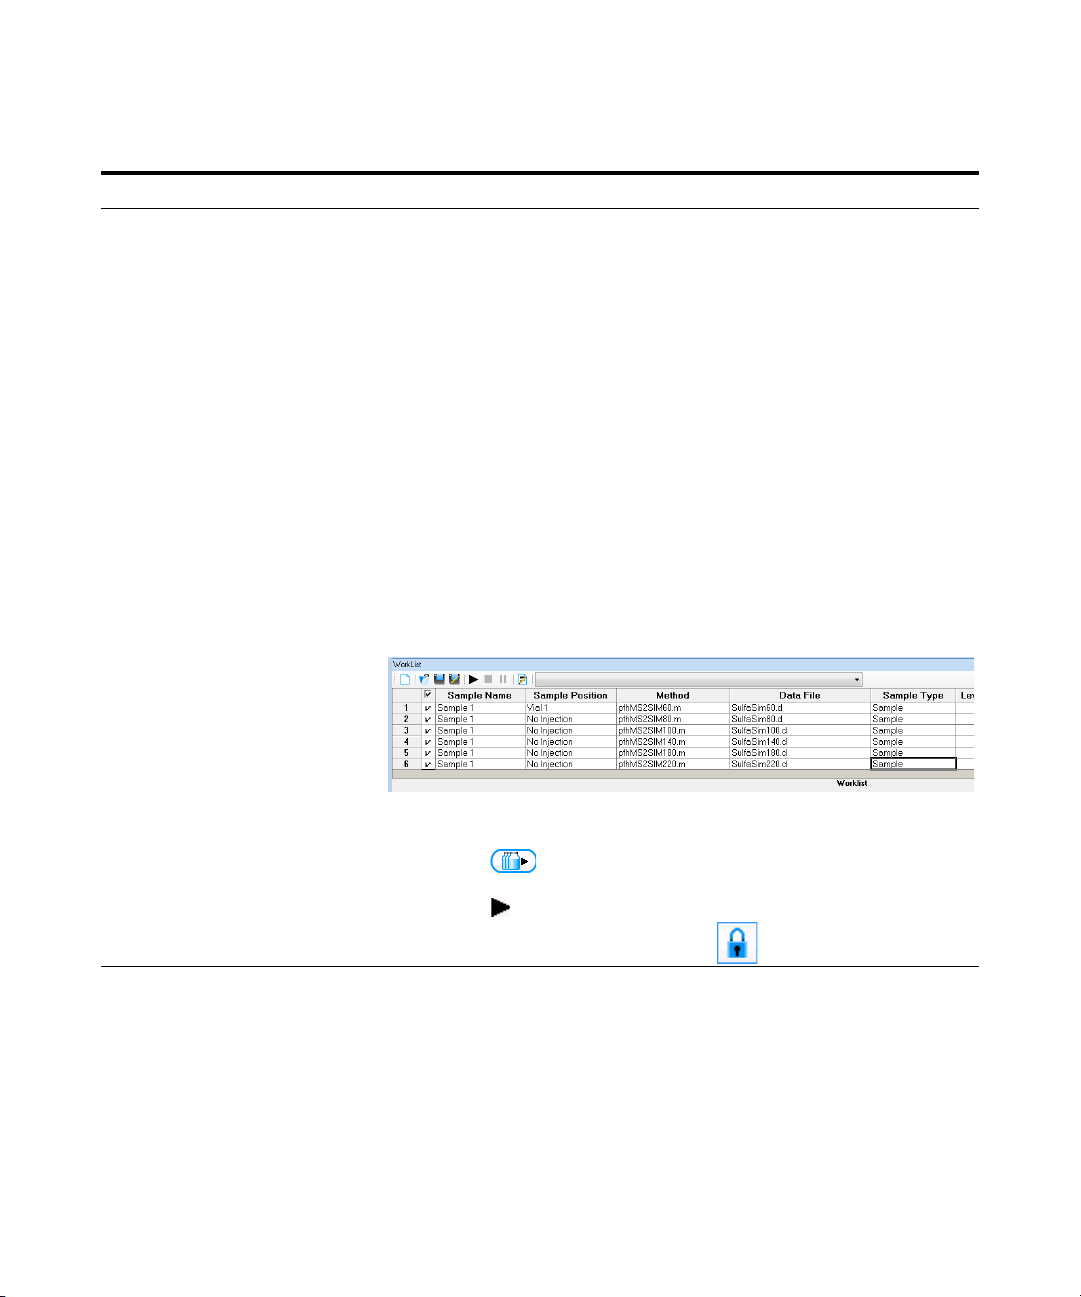
2 Set up and run the worklist
(optional).
• Set up six samples with Sample
Name SulfaDrugMix to inject 1ul
from vials 1-6 or the ones you
choose.
• Specify the data files as
iiiSulfaSIMxxx.d, where iii are
your initials and xxx is the
voltage.
a Click the Worklist icon if necessary to
make sure the worklist is visible.
b Click Worklist > New to start a new
worklist. You do not need to save the
last worklist.
c To set up the run, right-click the upper
left corner of the worklist, and click
Worklist Run Parameters.
d Type the paths for the method and data
files.
e Type the information for the 60 voltage
run.
f Click Worklist > Add Sample. Another
sample is added to the Worklist. Add
five samples to the worklist for
voltages 80-220.
g Mark the checkbox to the left of the
Sample Name for each of the six
samples.
• This step is optional because you
can use data files shipped with the
system to perform many of the
tasks in this exercise.
h Start the worklist.
• Click Worklist > Run.
• Click the icon in the main
toolbar.
• Click the icon in the worklist
toolbar.
• Note that the program only runs
those samples that are marked with
a checkmark.
• You can also run the worklist in
locked mode by clicking the
button in the main toolbar.
16 Agilent 6400 Series Triple Quad LC/MS Familiarization Guide
Page 17
Exercise 1 – Develop an acquisition method
Task 3. Find optimum fragmentor voltage for maximum response
Steps Detailed Instructions Comments
3 Set up a qualitative method to view
the EIC data automatically.
• Open the data file
Sulfa_SIM60.d or your own
iiiSulfa_SIM60.d, where iii are
your initials.
• In the Method Editor, add in the
EICs corresponding to the
precursor ion masses of 271,
279, 285, and 311.
• Save the method as iiiExercise1,
where “iii” are your initials.
a Click File > Open Data File.
The system displays the Open Data
File dialog box
b Select either Sulfa_SIM60.d or
iiiSulfa_SIM60.d, and click Open.
c Click Method > Method Editor or
View > Method Editor.
The system displays the Method Editor
window.
• The Qualitative Analysis program
should be open. If not, see
“Double-click the Qualitative
Analysis icon.” on page 11.
Agilent 6400 Series Triple Quad LC/MS Familiarization Guide 17
Page 18
Exercise 1 – Develop an acquisition method
Task 3. Find optimum fragmentor voltage for maximum response
Steps Detailed Instructions Comments
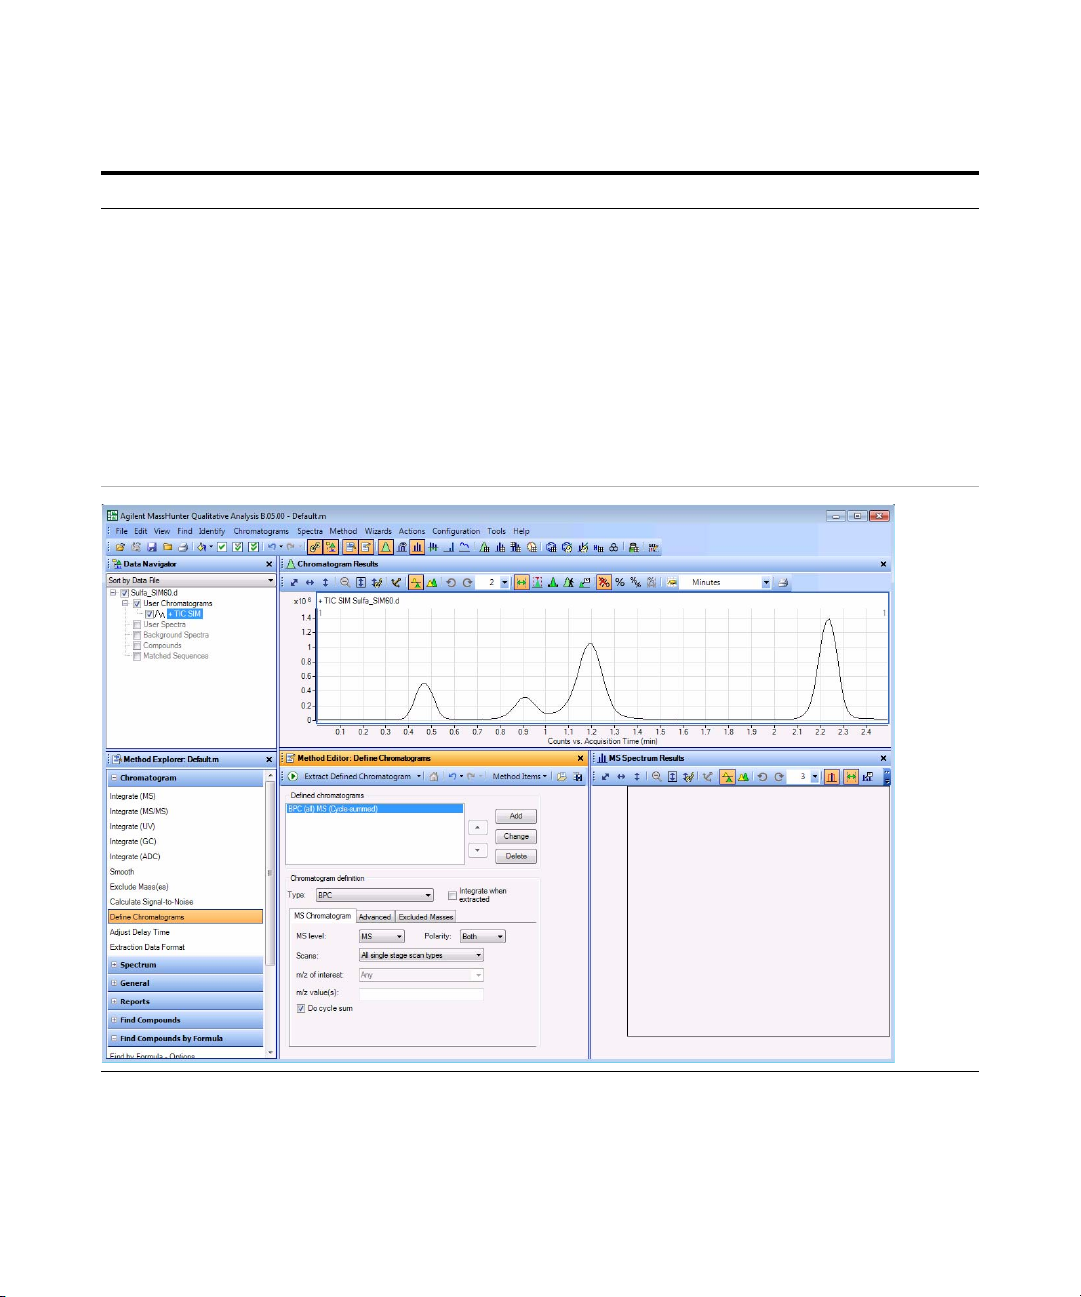
d If necessary, click Define
Chromatograms in the Chromatogram
section of the Method Explorer.
e To delete the BPC chromatogram, click
Delete.
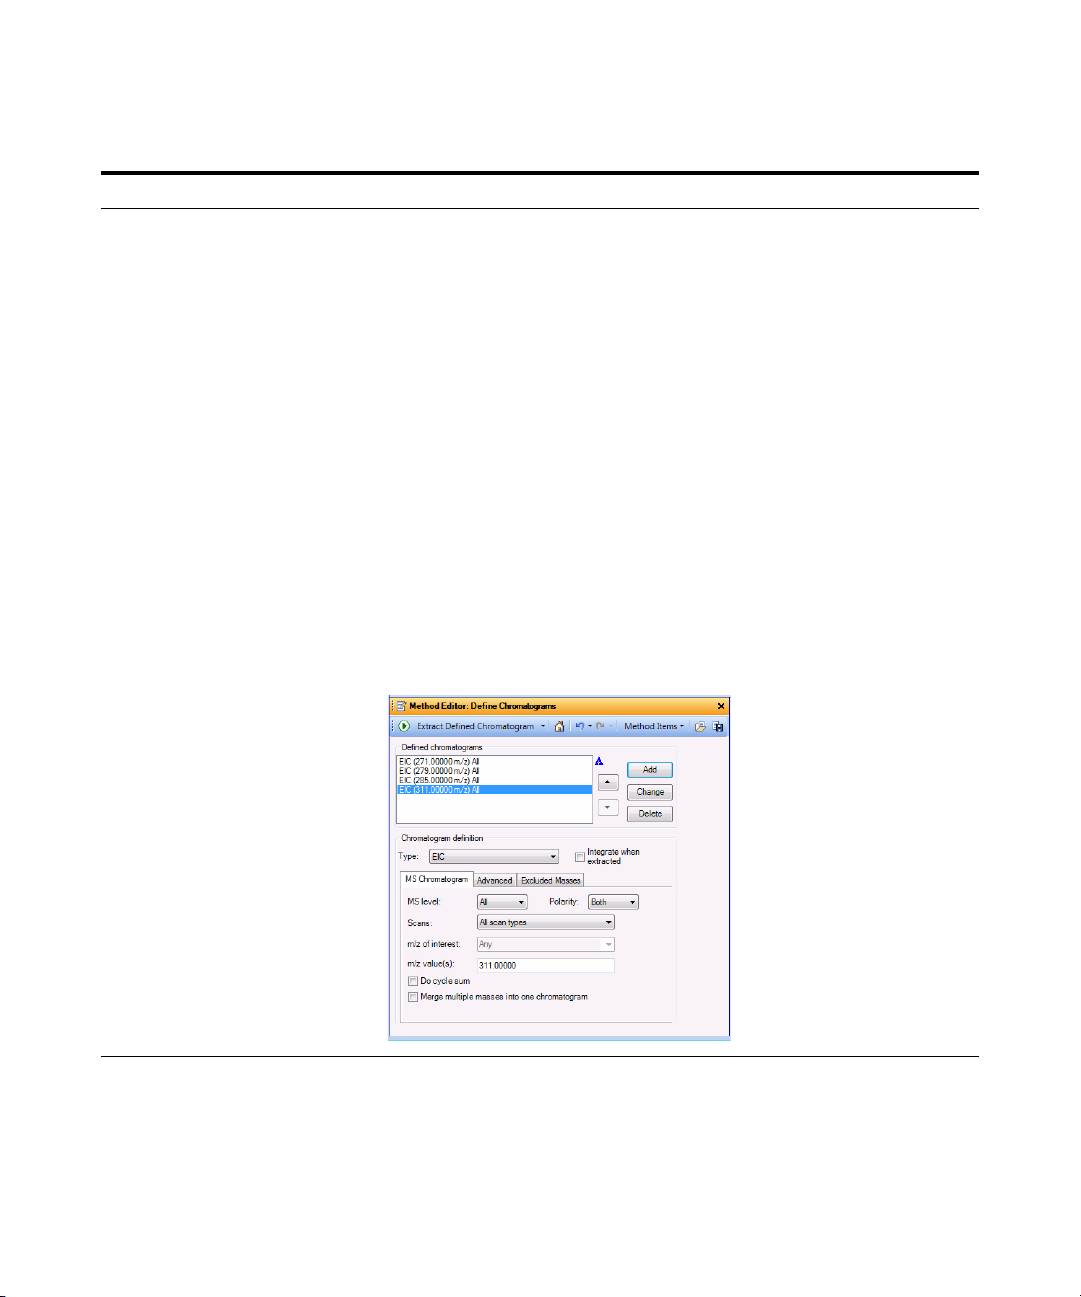
f Select EIC for the Chromatogram
Definition Type,
g In the MS Chromatogram tab, make
sure MS Level is set to All and Scans
is set to All scan types.
h Clear the Do cycle sum check box.
271 as the m/z value.
i Ty p e
j Click Add.
k Repeat steps i and j for the other
precursor ions,
279, 285 and
311.
l Click Method > Save As. The system
opens the Save As dialog box
m Save the method as iiiExercise 1.m.
n Click Save.
• The default Method Editor list
selection after installation is
Integrate (MS).
• You can also select Define
Chromatograms from the Method
Items list in the Method Editor
window.
18 Agilent 6400 Series Triple Quad LC/MS Familiarization Guide
Page 19
Exercise 1 – Develop an acquisition method
Task 3. Find optimum fragmentor voltage for maximum response
Steps Detailed Instructions Comments
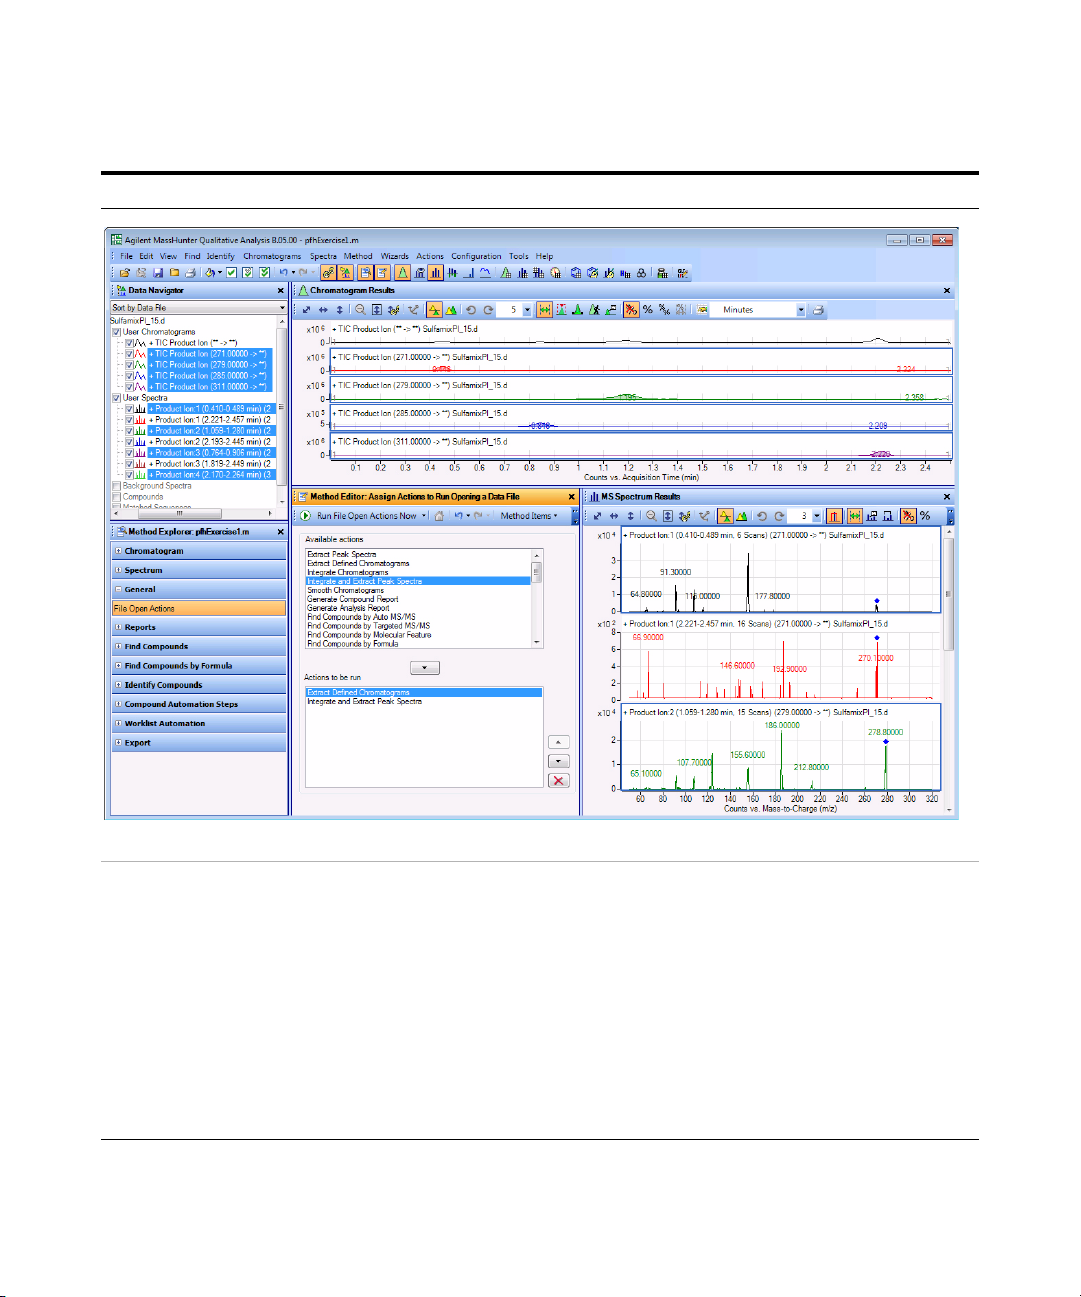
4 Extract the chromatogram for the
data file and view the results.
• Make sure you can see all five
chromatograms, the TIC and four
EICs.
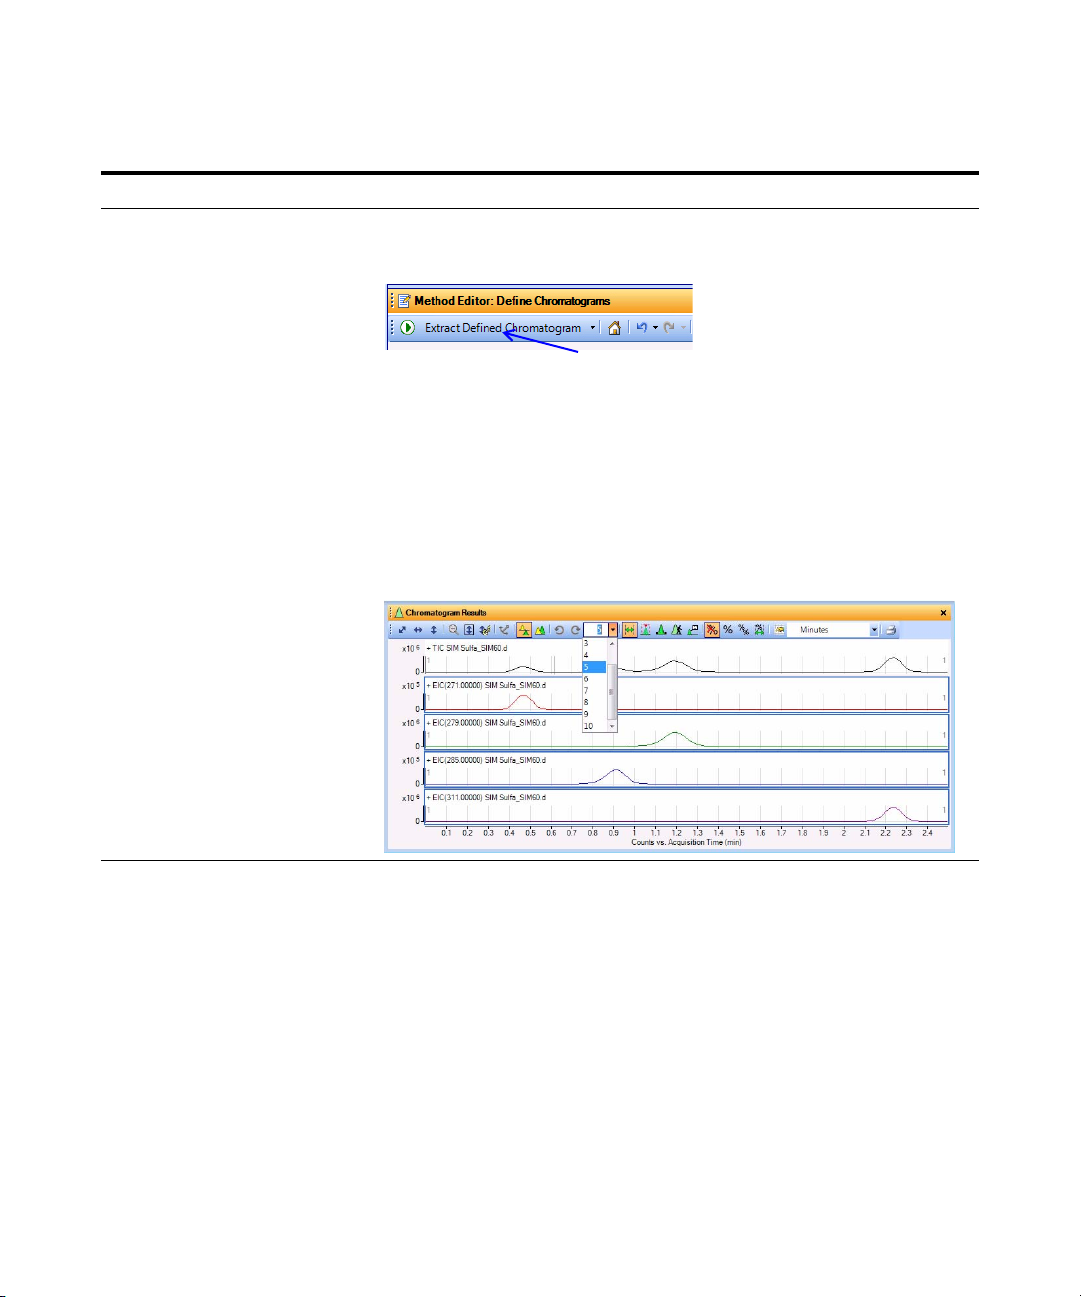
a Click the Run button on the Method
Editor toolbar.
b To see the TIC and four EICs, click the
arrow next to the Maximum Number of
List Panes icon in the Chromatogram
Results toolbar, as shown in the
example below.
c Select 5 to view five chromatograms
simultaneously.
The system displays chromatogram
results as shown below.
• You can also click the
Chromatograms > Extract Defined
Chromatograms command to
extract the defined chromatograms.
Agilent 6400 Series Triple Quad LC/MS Familiarization Guide 19
Page 20
Exercise 1 – Develop an acquisition method
Task 3. Find optimum fragmentor voltage for maximum response
Steps Detailed Instructions Comments
5 Extract the remaining ion
chromatograms automatically.
• Extract Defined Chromatograms
should be the default action for
Assign File Open Actions.
• Open the remaining data files,
Sulfa_SIM80.d through
Sulfa_SIM220.d.
• Close the Method Explorer.
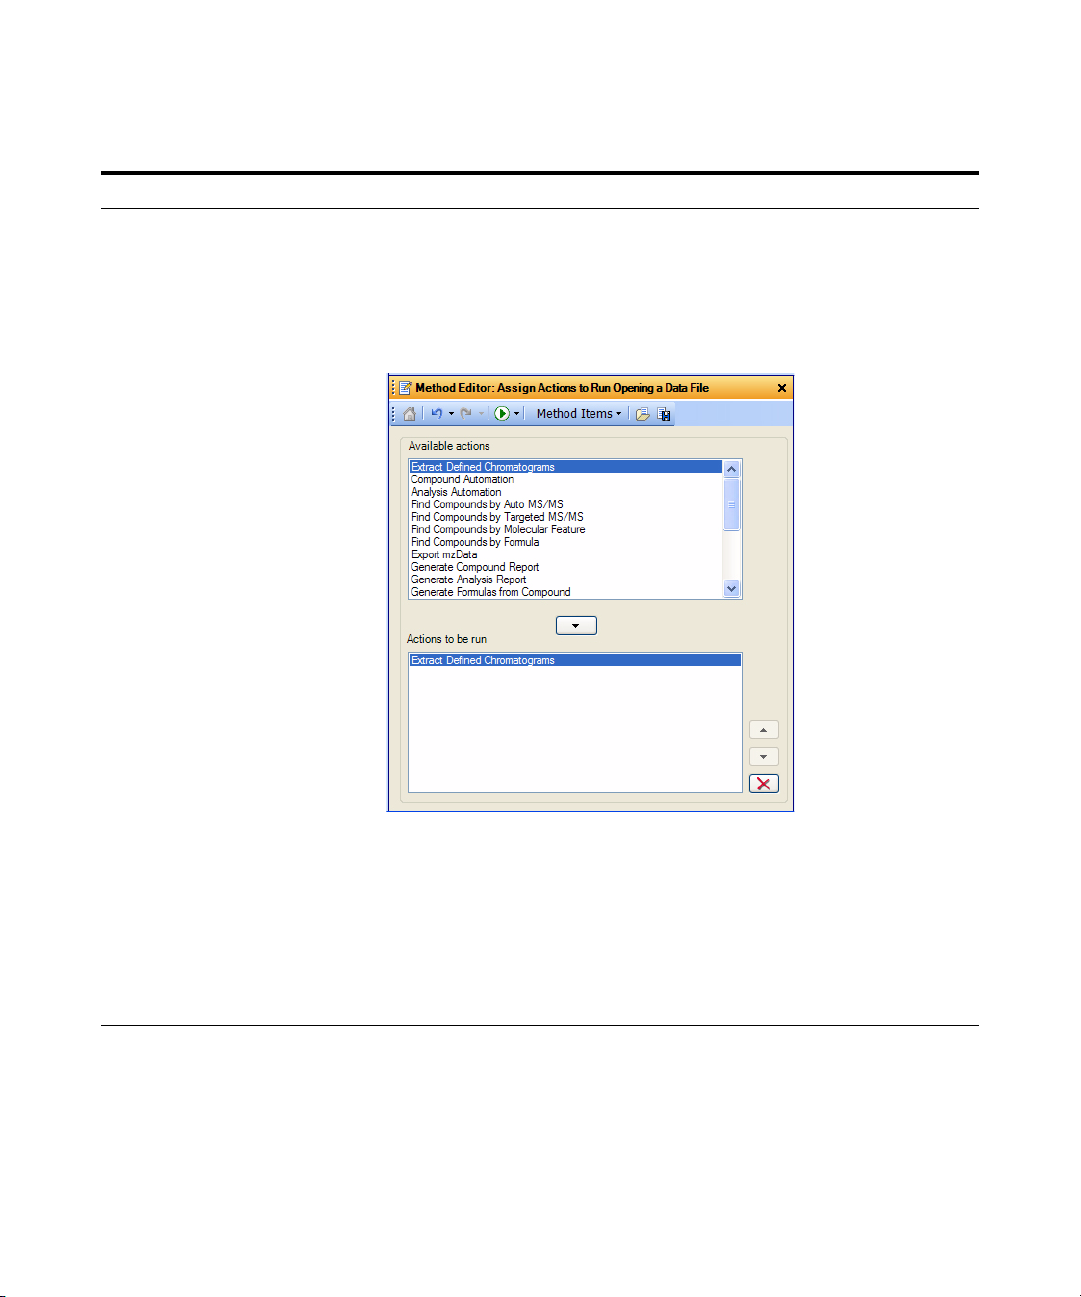
a Select File Open Actions from the
General section in the Method
Explorer.
b Make sure that Actions to be run list
only contains Extract Defined
Chromatograms.
• The Qualitative Analysis Method
Editor lets you define actions to be
performed automatically upon
opening a data file(s).
c Click File > Open Data File.
The system displays the Open Data
File dialog box.
d Select the data files to be opened,
Sulfa_SIM80.d through
Sulfa_SIM220.d.
e Mark the Run ‘File Open’ actions from
selected method check box. (lower left
corner)
20 Agilent 6400 Series Triple Quad LC/MS Familiarization Guide
Page 21

Exercise 1 – Develop an acquisition method
Mark this check box.
Task 3. Find optimum fragmentor voltage for maximum response
Steps Detailed Instructions Comments
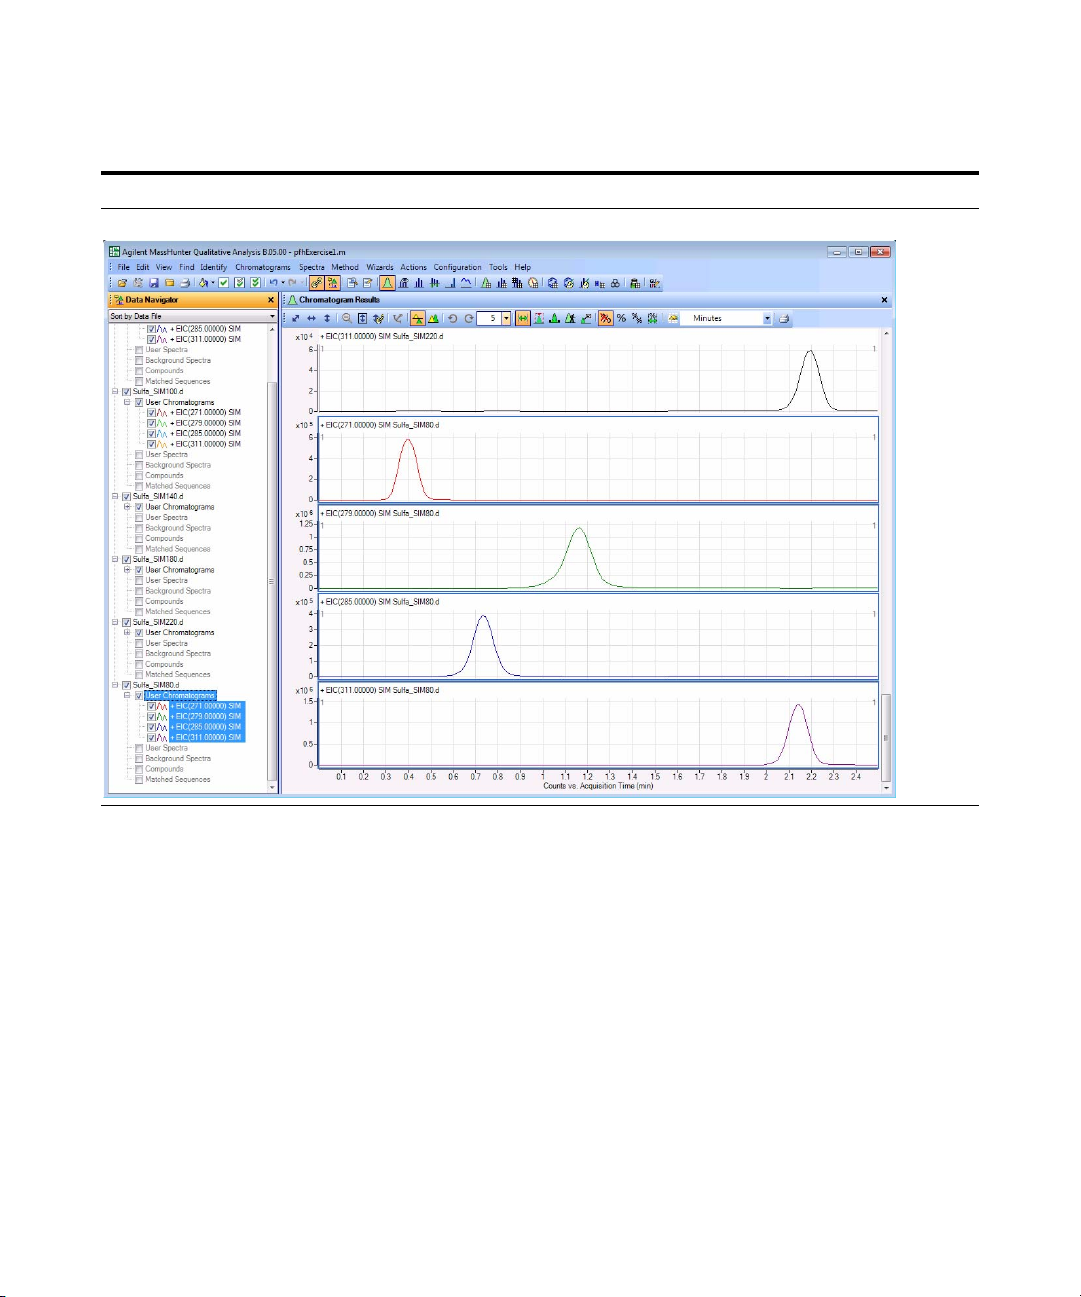
f Click Open.
The Qualitative Analysis program
displays all the EICs for all the data
files selected.
g To close the Method Explorer and
Method Editor, click the X in the upper
right corner of each window.
Agilent 6400 Series Triple Quad LC/MS Familiarization Guide 21
• You can also close the Method
Explorer and Method Editor
windows by clicking the View >
Method Explorer command and the
View > Method Editor command.
Page 22
Exercise 1 – Develop an acquisition method
Task 3. Find optimum fragmentor voltage for maximum response
Steps Detailed Instructions Comments
22 Agilent 6400 Series Triple Quad LC/MS Familiarization Guide
Page 23
Exercise 1 – Develop an acquisition method
You can overlay the
chromatograms by
clicking the Overlaid
mode icon in the
Chromatogram Results
toolbar.
Task 3. Find optimum fragmentor voltage for maximum response
Steps Detailed Instructions Comments
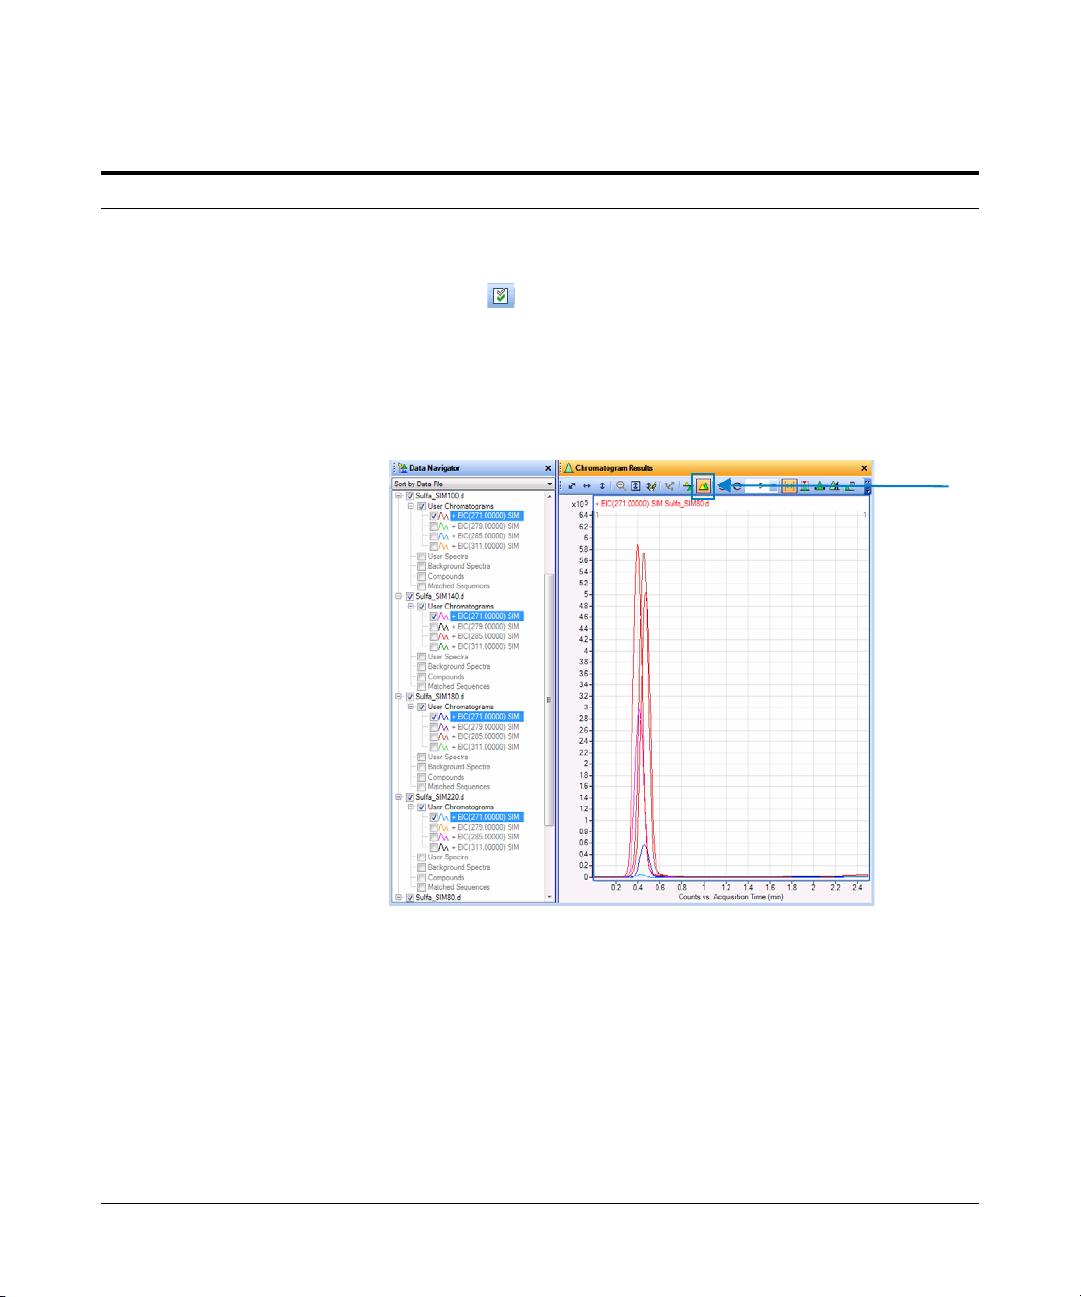
6 Select the fragmentor voltage that
produces the maximum response
for each of the precursor ions.
• Close the data files after you
determine the optimum voltage.
a In the Data Navigator window,
highlight the EICs for 271.0 m/z.
b Click the Show only the highlighted
items icon, .
Only the 271 m/z check boxes are now
marked.
c Look at the relative intensities of each
peak to determine which fragmentor
voltage setting will be best to use for
the 271 precursor.
• You press the Ctrl key to be able to
select multiple objects from the
Data Navigator window.
• You press the Shift key to be able to
select a group of objects.
• A fragmentor voltage of 100 should
be sufficient for each precursor ion.
• You can now determine the product
ions that are available for the
multiple-reaction monitoring
experiments to maximize sensitivity
for the analysis.
d Repeat step a through step c for the
other three base peaks or precursor
ions.
e Click File > Close Data File.
f Click Close when the Close Data File
dialog box appears.
•
• Click the different EICs in the Data
Navigator window to change which
chromatogram is labeled in the
Chromatogram Results window.
When the color of the label of the
chromatogram matches the color of
the chromatogram that has the
highest intensity, you use the
fragmentor voltage that was used
for that file.
Agilent 6400 Series Triple Quad LC/MS Familiarization Guide 23
Page 24

Exercise 1 – Develop an acquisition method
Task 4. Determine product ion masses
Task 4. Determine product ion masses
In this part of the method development, we will use three collision energies to
determine the best fragment ions to use for the eventual Multiple Reaction
Monitoring (MRMs) acquisition.
Steps Detailed Instructions Comments
1 Set up three product ion
acquisition methods and acquire
data.
• Use the MS parameters in the
example below, but change the
Fragmentor voltage to the
optimum voltage you determined
in the previous task.
• Save methods as iiiSulfamix
PI_xx.m, where iii are your
initials and xx is the collision
energy.
a Click the QQQ tab in the Method Editor
pane.
b Select
c Enter all MS parameters as listed in
d Save the method as iiiSulfamix
e Repeat step c and step d for collision
Product Ion in the Scan Type
combo box to scan each precursor ion
for all its product ions.
the example below, making sure the
Collision Energy is set to
Fragmentor voltage is set to the
optimum voltage determined in Task 3.
PI_15.m.
energies of 30 and 45.
15 and the
• When you change the Scan Type in
the Time Segments table, the Scan
segments table is reset. If you want
to copy the Scan segments to the
new Scan segments table, highlight
all of the lines in the Scan
segments table and then right-click
the Scan segments table and click
Copy. After you select a new Scan
Type, right-click the Scan segments
table and click Paste from
Clipboard.
• You cannot copy and paste the Scan
segments table between all Scan
Ty pe s .
2 Set up and run the worklist
(optional).
• Specify the data files as
iiiSulfamix PI_xx.d, where iii
are your initials and xx is the
collision energy.
a Click the Worklist tab.
b Add three samples to the worklist for
collision energies 15, 30 and 45.
c Mark the check box to the left of the
Sample Name for each sample you are
adding.
d Click Worklist > Run.
• This step is optional because you
can determine the product ion
masses from the data files shipped
with the system.
• Use the instructions in Step 2 of
Task 3 to set up the worklist.
24 Agilent 6400 Series Triple Quad LC/MS Familiarization Guide
Page 25

Exercise 1 – Develop an acquisition method
Task 4. Determine product ion masses
Steps Detailed Instructions Comments
3 Set up a qualitative method to
integrate and extract product ion
spectra.
• Use the data files
SulfamixPI_xx.d, where xx is
the collision energy, or your own
data files, iiiSulfamixPI_xx.d.
• Open Method Explorer and
Method Editor.
• Use TICs set up for MS/MS,
product ion and each of the
precursor ions 271, 279, 285, 311.
• Make sure the MS/MS
integrator has been selected and
the maximum number of peaks
has been limited to the largest
100 peaks.
• Add the ability to integrate and
extract peak spectra to the file
actions run upon data opening.
• Save the changes to the current
method.
a Click the Open Data File icon in the
toolbar.
b Select SulfamixPI_15.d.
c Make sure that the Run File Open
Actions from Specified Method check
box is clear, and click Open.
d Make sure the Method Explorer and
the Method Editor windows are
displayed; otherwise, click the Method
Explorer and then Method Editor
icons.
e In the Chromatogram section in the
Method Explorer window, select
Define Chromatograms.
f Delete any existing chromatograms in
the Defined Chromatograms list.
g Select TIC from the Ty p e list in the
Define chromatograms section.
h For MS level, select MS/MS.
i Mark the Do cycle sum check box.
j For Scans, select Product ion.
k For Precursor ion m/z
l Click the Add button.
m Repeat steps j and k for each ion.
, type 271.
• The Qualitative Analysis program
should already be open and contain
iiiexercise 1.m as the method.
Agilent 6400 Series Triple Quad LC/MS Familiarization Guide 25
Page 26

Exercise 1 – Develop an acquisition method
Task 4. Determine product ion masses
Steps Detailed Instructions Comments
n From the Method Explorer in the
Chromatogram section, click Integrate
(MS/MS).
o Select MS/MS as the Integrator
selection, if necessary.
• These data files contain MS/MS
data, so you need to modify the
parameters in the Integrate
(MS/MS) section. If the data file
contained only MS data, you would
need to modify the parameters in
the Integrate (MS) section.
Figure 3 Integrate (MS/MS) > Integrator Tab
p Click the Peak Filters tab. Make sure
that the Limit (by height) to the
largest check box is marked and set to
the value
100 as shown below.
Figure 4 Integrate (MS/MS) > Peak Filters tab
26 Agilent 6400 Series Triple Quad LC/MS Familiarization Guide
Page 27

Exercise 1 – Develop an acquisition method
Task 4. Determine product ion masses
Steps Detailed Instructions Comments
q Click General in Method Explorer, and
then click File Open Actions.
r Select Integrate and extract peak
spectra from the Available actions list
and click to add this to Actions
to be run.
Figure 5 General > File Open Actions tab
s To apply the changes to the current
method, iiiexercise1.m, click the Save
Method icon. You can also click
Method > Save.
4 Run the qualitative method on the
current data file.
• In the Method Editor toolbar, click the
Run button, . When the Assign
Actions to Run Opening A Data File
section is displayed, the Actions to be
run list is executed.
• The program first extracts the
product ion chromatograms for
each precursor ion in the data file.
• Next, it finds the largest peak in the
total ion chromatograms, and
integrates and extracts peak
spectra from each integrated peak.
• See Figure 6 on page 28.
Agilent 6400 Series Triple Quad LC/MS Familiarization Guide 27
Page 28
Exercise 1 – Develop an acquisition method
Task 4. Determine product ion masses
Steps Detailed Instructions Comments
Figure 6 Results for integration and extraction of peak spectra.
5 Run the ‘File Open’ actions on the
remaining product ion data files.
• Use either the example files,
Sulfamix PI_xx.d, or the data
files you acquired in step 2.
a Click File > Open Data File.
The system displays the Open Data
File dialog box.
b Hold the Ctrl key and do one of these:
• Select the two data files Sulfamix
PI_30.d, and Sulfamix PI_45.d.
• Select the data files you acquired in
step 2.
c Mark the Run ‘File Open’ actions from
selected method check box in the
Open Data File dialog box, and click
Open.
• After the data files open, the Qual
method first extracts the product
ion chromatograms for each
precursor ion.
• Next, it finds the largest peak in the
total ion chromatograms, and
integrates and extracts peak
spectra from each integrated peak.
28 Agilent 6400 Series Triple Quad LC/MS Familiarization Guide
Page 29

Exercise 1 – Develop an acquisition method
Task 4. Determine product ion masses
Steps Detailed Instructions Comments
6 Identify product ions.
• View each set of TICs and
spectra individually (e.g., 271
m/z first).
• Close the data files.
a In the Data Navigator, select the TICs
and spectra for the 271 m/z precursor
ion.
b Click the Show only the highlighted
items icon, .
c Click View > MS Spectrum Peak List 1.
d Examine the spectra to see which
fragment ions are produced at which
collision energies.
e Repeat steps a to d until all the product
ions are identified.
• The m/z 155.7 product ion is the
most abundant of any product ion
and the highest signal is recorded at
15 V. This means that a good choice
for the MRM for sulfamethizole
would be 271.0 > 155.7 when the
collision energy is around 15 V.
• The peak may not be labeled if the
peak is too wide.
f Click the Close Data File icon in the
main toolbar, and click Close when the
dialog box containing the list of data
files pops up.
• The product ions appear to be:
Sulfamethizole-271.0 > 155.7
Sulfamethazine-279.0 > 185.8
Agilent 6400 Series Triple Quad LC/MS Familiarization Guide 29
Sulfachloropyridazine-285.0 > 155.7
Sulfadimethoxine-311.0 > 155.7
Page 30

Exercise 1 – Develop an acquisition method
Task 5. Find optimum collision energy for MRM acquisition
Task 5. Find optimum collision energy for MRM acquisition
In this task, you set up MRM acquisition methods for the sulfa drugs for
different collision energies. By examining the spectra and comparing peak
intensities, you determine the optimal collision energy settings for the
compounds.
Steps Detailed Instructions Comments
1 Set up three MRM acquisition
methods.
• Use all the MS parameters in the
example below except for the
collision energy value.
• Use collision energies of 10, 15
and 20.
• Save methods as iiiSulfamix
MRM_xx.m, where iii are your
initials and xx is the collision
energy.
a Click the QQQ tab.
b Set Scan Type to MRM.
c Enter all MS parameters shown in the
example below except for the collision
energy value.
d In the collision energy column, type
10 for each compound.
e Save the method as iiiSulfamix
MRM_10.m.
f Repeat step d and step e for collision
energies of 15, 20, 25, 30 and 35 saving
the methods as iiiSulfamix
MRM_xx.m, where iii are your initials
and xx is the collision energy.
• Because the largest peaks were
produced with a collision energy of
15 in the previous exercise, you will
look at only those collision energies
to either side of 15.
2 Set up and run the worklist
(optional).
• Specify the data files as
iiiSulfamix MRM_xx.d, where
iii are your initials and xx is the
collision energy.
a Click the Worklist tab to make the
worklist visible.
b Add six samples to the worklist for
collision energies 10, 15, 20, 25, 30, 35.
c Mark the checkbox to the left of the
Sample Name for each of the three
samples.
d Click Worklist > Run.
• This step is optional because you
can use the six example data files in
the next step.
30 Agilent 6400 Series Triple Quad LC/MS Familiarization Guide
Page 31
Exercise 1 – Develop an acquisition method
Task 5. Find optimum collision energy for MRM acquisition
Steps Detailed Instructions Comments
3 Compare the compound transition
intensities at different collision
energies.
• Open the MRM data files:
SulfamixMRM_10.d
SulfamixMRM_15.d
SulfamixMRM_20.d
SulfamixMRM_25.d
SulfamixMRM_30.d
SulfamixMRM_35.d
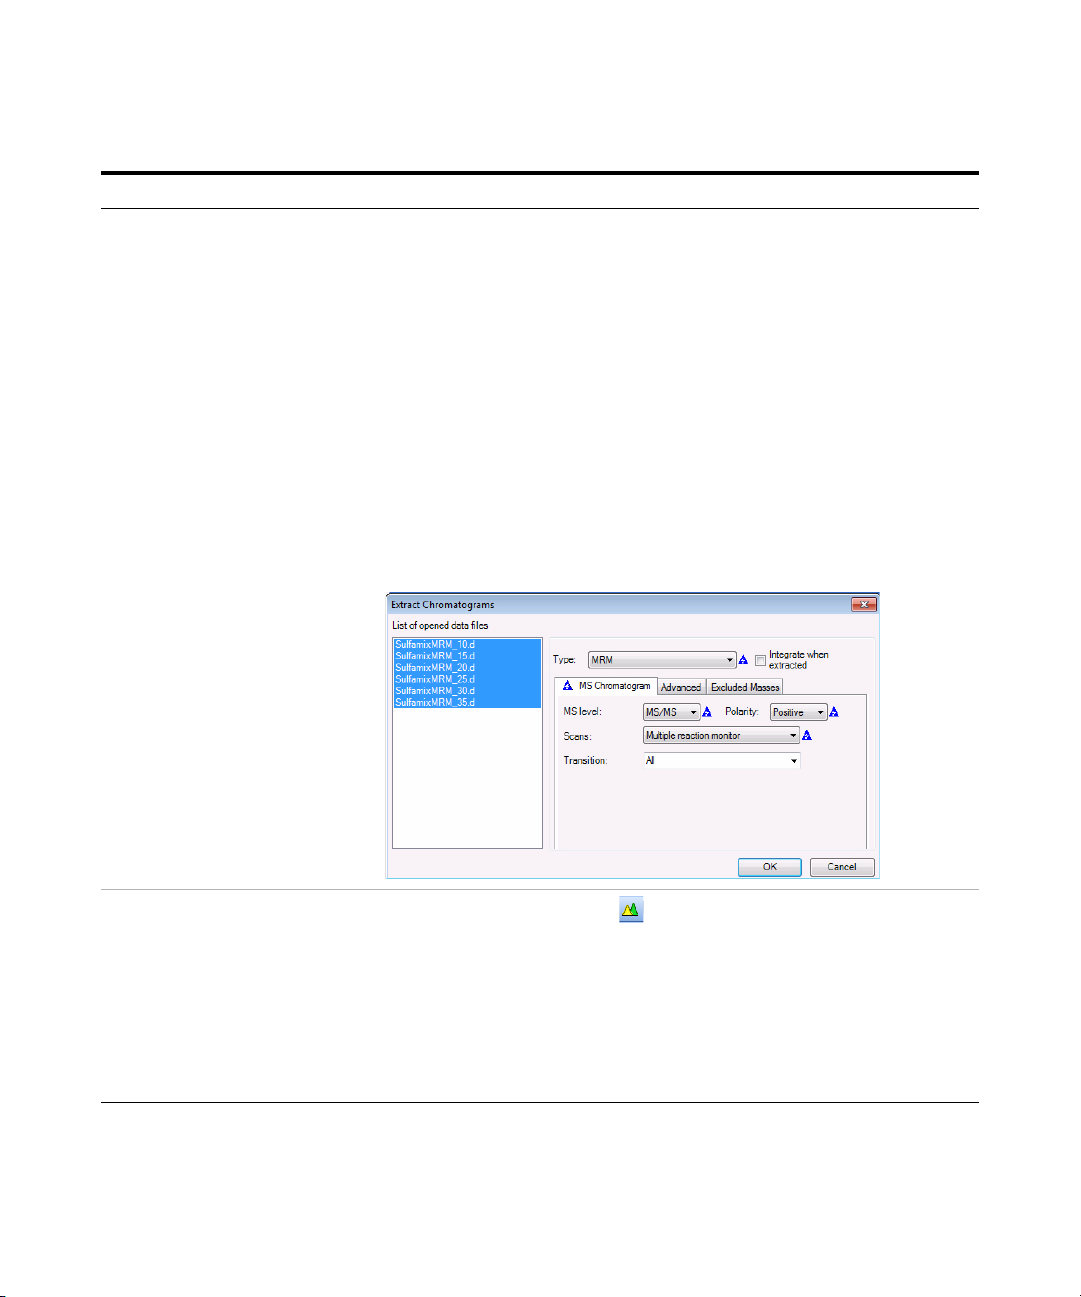
• Set the MRM chromatogram
extraction parameters as shown
at right for all transitions.
• Disable the TICs for clarity and
examine the peak intensities.
• Compare the intensities of each
compound transition obtained at
one collision energy with the
same compound transition
obtained at another collision
energy. (Do this in Overlaid
Mode with all the MRM
chromatograms.)
• Close the data files but don’t
save results.
• Refer to Tabl e 4 on page 32 for
optimal method settings for each
compound.
a Open the Qualitative Analysis
program.
b Clear the Run ‘File Open’ actions...
check box.
c Open the MRM data files in the
Qualitative Analysis program.
d Right-click the Chromatogram Results
window, and click Extract
Chromatograms from the shortcut
menu.
e To select all data files, click the last file
while holding down the Shift key.
f Enter the parameters as listed in the
example below, and click OK.
g Clear the TIC check boxes to make the
MRM chromatograms easier to view.
• Why a spectrum for MRM? It’s a
feature of the program to show
spectra even for MRM experiments
and can be quite handy for
comparing relative intensities of
product ions generated from the
same precursor.
h Click the Overlaid Mode icon, .
i Compare peak intensities for each
compound transition in each data file
in the Chromatogram Results window.
• Compare the colors shown in
Chromatogram Results with the
color next to the MRM transition
name in the Data Navigator.
• You can also right-click the
Chromatogram Results window
header and compare the colors of
the chromatograms to the colors of
the titles in the shortcut menu.
Agilent 6400 Series Triple Quad LC/MS Familiarization Guide 31
Page 32

Exercise 1 – Develop an acquisition method
Task 5. Find optimum collision energy for MRM acquisition
Steps Detailed Instructions Comments
Unless you decide to acquire MRMs at
lower collision energies, you should
find that the optimal method settings
are as shown in Tab le 4.
j Click the Close Data File icon in the
main toolbar, and click Close when the
Close Data File dialog box appears.
• You now have all the information
you need to do an MRM acquisition
experiment of the sulfa drug
mixture. Consider doing at least one
more run with those settings.
Tab l e 4 Compounds and Collision Energy
Compounds MRM Transition Collision Energy (V)
Sulfamethizole 271.0 > 155.8 10
Sulfamethazine 279.0 > 185.7 15
Sulfachloropyradizine 285.0 > 155.7 10
Sulfadimethoxine 311.0 > 155.7 15
32 Agilent 6400 Series Triple Quad LC/MS Familiarization Guide
Page 33

Exercise 2 – Develop a Dynamic MRM acquisition method from an MRM acquisition data file or an MRM
method
Task 1. Create a batch file from an existing MRM data file
Exercise 2 – Develop a Dynamic MRM acquisition method from an MRM acquisition data file or an MRM method
The purpose of this exercise is to create a Dynamic MRM method from an
acquired MRM data file for sulfamix_MRM data files with the correct retention
times for Dynamic MRM using the Quantitative Analysis program.
For this exercise, you have three main tasks:
• “Task 1. Create a batch file from an existing MRM data file” on page 33
• “Task 2. Print a report in the Quantitative Analysis program” on page 36
• “Task 3. Create a Dynamic MRM method using Update dMRM” on page 37
You can easily create a Dynamic MRM method from an existing MRM method.
• “Task 4. Create a Dynamic MRM method from an MRM method” on page 39
Task 1. Create a batch file from an existing MRM data file
In this exercise, you create a batch and a method from an existing MRM data
file.
Steps Detailed Instructions Comments
1 Open the Quantitative Analysis
program and create a batch file
with one sample file,
SulfamixMRM_35.d.
• Copy the data file
SulfamixMRM_35.d from the
installation disk to the
\MassHunter\Data\MRM_to_
DMRM folder.
a Double-click the QQQ Quantitative
Analysis icon.
b Click File > New Batch.
c Navigate to the \MassHunter\Data\
MRM_to_DMRM folder.
MRM_to_DMRM in the File
d Ty p e
Name text box.
e Click Open.
f Click File > Add Samples.
g Select the file SulfamixMRM_35.d.
h Click OK.
• The file SulfamixMRM_35.d is on
the installation disk in the
\Support\Data folder. Copy this
entire folder to the
\MassHunter\Data\
MRM_to_DMRM folder.
Agilent 6400 Series Triple Quad LC/MS Familiarization Guide 33
Page 34

Exercise 2 – Develop a Dynamic MRM acquisition method from an MRM acquisition data file or an MRM
method
Task 1. Create a batch file from an existing MRM data file
Steps Detailed Instructions Comments
2 Create a method for that batch
using MRM data.
3 Set the Concentration Setup,
Qualifier Setup, and Calibration
Curve Setup.
• Add calibration level 1 with a
concentration of 10000.
• Set the Uncertainty to Relative
for all qualifiers.
• Set the Curve Fit to Linear.
• Set the Curve Fit Origin to
Include.
• Set the Curve Fit Weight to
None.
a Click Method > New > New Method
from Acquired MRM data.
b Select the SulfamixMRM_35.d data
file.
c Click Open.
a Select Concentration Setup in the
Manual Setup Tasks section in the
Method Tasks pane.
b Select the first compound in the table.
c Right-click the compound row and
click New Calibration Level from the
shortcut menu.
d Enter
e Right-click in the Level box and click
f Click Select All. Click OK.
g Select Qualifier Setup in the Manual
h Verify that the Uncertainty is Relative.
i Select Calibration Curve Setup in the
j Set Curve Fit to Linear for all
k Set CF Origin to Include for all
l Set CF Weight to None for all
1 in the Level column and 10 in
the Conc. column.
Copy Calibration Levels To.
Setup Tasks section in the Method
Tasks pane.
Manual Setup Tasks section in the
Method Tasks pane.
compounds.
compounds.
compounds.
• Refer to the online Help in the
Quantitative Analysis program for
additional help on these tasks.
34 Agilent 6400 Series Triple Quad LC/MS Familiarization Guide
Page 35

Exercise 2 – Develop a Dynamic MRM acquisition method from an MRM acquisition data file or an MRM
method
Task 1. Create a batch file from an existing MRM data file
Steps Detailed Instructions Comments
•
4 Verify method and then save the
method and apply the method to
the batch.
5 Analyze and save the batch. a Click Analyze > Analyze Batch.
a Click Method > Validate.
b Click OK on the message box. Fix any
errors, if necessary.
c Click Method > Save As.
d Enter MRM_to_DMRM.
e Click the Save button.
f Click Method > Exit.
g Click Ye s to apply the method to the
batch.
b Click File > Save Batch.
Agilent 6400 Series Triple Quad LC/MS Familiarization Guide 35
Page 36

Exercise 2 – Develop a Dynamic MRM acquisition method from an MRM acquisition data file or an MRM
method
Task 2. Print a report in the Quantitative Analysis program
Task 2. Print a report in the Quantitative Analysis program
In this task, you print a report using any template.
You can update a Dynamic MRM method using either a data file or a
quantitation report folder, so this task creates the quantitation report folder.
Steps Detailed Instructions Comments
1 Print a report using the template
MRM_to_DMRM.xltx.
2 Check the status of the report
using the Queue Viewer program.
a Click File > Save.
b Click Report > Generate.
The system displays the Report dialog
box.
c Select the Te m pl a te file.
d Select the Report folder. This folder
name will be used in the next task.
e Click OK.
a Click Report > Queue Viewer.
b Wait for the report to finish printing.
c Close the Task Queue Viewer program.
• Copy the MRM_to_DMRM.xltx
template from the \Support\Data
folder on the installation disk.
• For this report, you do not need to
print the report. You need to click
Advanced to select a different
printer. If you don’t want to print
this report, click Advanced instead.
36 Agilent 6400 Series Triple Quad LC/MS Familiarization Guide
Page 37

Exercise 2 – Develop a Dynamic MRM acquisition method from an MRM acquisition data file or an MRM
You can update the compounds in the Scan segments
table by using a QQQ data file or a Quantitative
analysis report folder.
method
Task 3. Create a Dynamic MRM method using Update dMRM
Task 3. Create a Dynamic MRM method using Update dMRM
You can create a Dynamic MRM method from an MRM data file or a
Quantitative Analysis method. You first set the Scan Type to Dynamic MRM,
and then you use the Update MRM Method dialog box.
Steps Detailed Instructions Comments
1 Open the method iiiSulfamix
MRM_10.m and save it to a new
name with the format iiiSulfamix
dMRM.m, where iii are your
initials.
2 Change the method to a dynamic
MRM method with the same
compounds. You can either use a
data file or the report that was
generated in the last task.
a Click File > Open > Method.
b Select the iiiSulfamix MRM_10.m
method. Click OK.
c Click Method > Save As.
d Type the new method name with the
format iiiSulfamix_dMRM.m.
a Click the Acquisition tab in the QQQ
tab in the Method Editor window.
b Right-click the Scan segments table
and click Update MRM Method. The
Update MRM Editor dialog box opens.
c Select the folder containing the
report.results.xml file or the data file
iiiSulfamix MRM_10.d.
d Select Tr ue for Update Retention
Time?.
e Select Tr ue for Add new Compound.
f Click OK.
• In this example, the batch is in the
\MassHunter\Data\
MRM_to_DMRM folder.
• The Update MRM Method tool
automatically sets the Scan type to
Dynamic MRM.
• You can select either a data file that
was acquired with a Scan Type of
MRM or a Quant Report folder as
the input to this dialog box. The
Scan segments are created from
one of these two input sources.
•
Agilent 6400 Series Triple Quad LC/MS Familiarization Guide 37
Page 38

Exercise 2 – Develop a Dynamic MRM acquisition method from an MRM acquisition data file or an MRM
The compounds from the data file or quantitation report are automatically added to the Scan segments
table.
method
Task 3. Create a Dynamic MRM method using Update dMRM
Steps Detailed Instructions Comments
•
g Select the original compound in the
Scan segments table.
h Right-click the row and click Delete
Row.
i Verify that each row has a Compound
Name. A blank Compound Name is not
allowed.
j Click Method > Save.
38 Agilent 6400 Series Triple Quad LC/MS Familiarization Guide
Page 39

Exercise 2 – Develop a Dynamic MRM acquisition method from an MRM acquisition data file or an MRM
method
Task 4. Create a Dynamic MRM method from an MRM method
Task 4. Create a Dynamic MRM method from an MRM method
You can create a Dynamic MRM method directly from an MRM method by
using the Paste from Clipboard command from the shortcut menu.
Steps Detailed Instructions Comments
1 Open the method iiiSulfamix
MRM_10.m and save it to a new
name with the format iiiSulfamix
dMRM_Easy.m, where iii are your
initials.
2 Copy all compounds from the Scan
segments table in the MRM
method.
3 Change the Scan Type to Dynamic
MRM and paste the rows into the
new Scan segments table.
a Click File > Open > Method.
b Select the iiiSulfamix MRM_10.m
method.
c Click OK.
d Click Method > Save As.
e Type the new method name with the
format iiiSulfamix_dMRM2.m.
f Click the Save button.
a Click the Acquisition tab in the QQQ
tab in the Method Editor.
b Select all of the rows in the Scan
segments table.
c Right-click the Scan segments table
and click Copy.
a Select Dynamic MRM as the Scan
Ty p e .
b Right-click the Scan segments table
and click Paste from Clipboard.
c Select the original compound in the
Scan segments table.
d Right-click and click Delete Row.
e Click Method > Save.
• To select all of the rows in the Scan
segments table, you select the first
row in the table, Then, you scroll to
the last row in the Scan segments
table. Press the Shift key and select
the last row in the table.
• To combine multiple Time Segments
into one Dynamic MRM Time
Segment, you paste the Scan
segments into Excel and create one
long list. When all of the scan
segments have been pasted into
Excel, then copy all of the Scan
segments in Excel.
•
Agilent 6400 Series Triple Quad LC/MS Familiarization Guide 39
Page 40

Exercise 3 – Create a Triggered Dynamic MRM acquisition method
Task 1. Create a Triggered Dynamic MRM method from a Dynamic MRM method manually
Exercise 3 – Create a Triggered Dynamic MRM acquisition
method
For this exercise you analyze a mixture of four sulfonamide compounds.
Task 1. Create a Triggered Dynamic MRM method from a Dynamic
MRM method manually
You can create a Triggered Dynamic MRM method directly from a Dynamic
MRM method. In a Triggered Dynamic MRM method, you specify some of the
transitions to be primary transitions. These transitions are acquired for the
entire retention time window. Some of these primary transitions are also
marked as triggers. As the data is acquired, the software checks whether or
not the abundances of the trigger transitions are higher than the threshold. If
the abundances are higher than the thresholds and other additional
conditions are met, then the secondary transitions are acquired. These other
conditions are described in the Concepts guide.
Steps Detailed Instructions Comments
1 Open the method iiiSulfamix
MRM_10.m and save it to a new
name with the format iiiSulfamix
dMRM_Easy.m, where iii are your
initials.
40 Agilent 6400 Series Triple Quad LC/MS Familiarization Guide
a Click File > Open > Method.
b Select the iiiSulfamix_dMRM2.m
method.
c Click OK.
d Click Method > Save As.
e Type the new method name with the
format
iiiSulfamix_TriggeredDMRM.m.
f Click the Save button.
• A Triggered Dynamic MRM method
is a type of Dynamic MRM method.
The Scan Type for both methods is
Dynamic MRM.
• The Dynamic MRM method is the
template method for the
optimization.
Page 41

Exercise 3 – Create a Triggered Dynamic MRM acquisition method
Task 1. Create a Triggered Dynamic MRM method from a Dynamic MRM method manually
Steps Detailed Instructions Comments
2 Change the method to a triggered
dynamic MRM method.
3 Select the transitions that are the
Primary transitions.
4 Select the transitions that are the
Tr ig g er transitions and set the
trigger conditions.
a Click the Acquisition tab in the QQQ
tab in the Method Editor.
b Mark the Tri g ge r ed check box in the
Triggered MRM section. This section is
only available if the Scan Type is
Dynamic MRM.
c Select whether to automatically mark
the highest product ion as the Primary.
d Enter the value for Repeats.
a For each transition, mark the Primary
check box if it is a Primary transition.
b Verify that you have marked at least
one transition as the Primary
transition for each Compound Name.
a For each compound, mark the Trigger
check box if it is a Trigger transition.
b (optional) Mark a second Tri g g er
transition.
c (optional) Enter the Threshold value
for each Tr ig g er transition.
d (optional) Enter the Trigger Entrance
for each Tr ig g er transition.
(optional) Enter the Trigger Delay for
e
each Tr ig g er transition.
f (optional) Enter the Trigger Window
for each Tr ig g er transition.
• Several columns are added to the
Scan segments table. These
columns only apply to a triggered
dynamic MRM method.
• The value Repeats is the number of
times to acquire each of the
secondary transitions when the
triggering conditions are met.
• You can select multiple transitions
from each compound to be Primary
transitions. If a transition has the
same Compound Name, then it is
part of the same compound. You
must mark at least one transition as
a Primary transition for each
compound.
• For each compound, you can have
two Trigger transitions.
• If the Tri g ge r transition has an
abundance over the Threshold, then
that triggering condition is met.
• By default, the Trig g e r En t r a nc e ,
the Tri g g e r D ela y and the Tr i gg e r
Window are set to 0. If these values
are 0, then these triggering
conditions are not enabled.
• See the Concepts Guide for more
information on these trigger
conditions.
Agilent 6400 Series Triple Quad LC/MS Familiarization Guide 41
Page 42

Exercise 3 – Create a Triggered Dynamic MRM acquisition method
Task 2. Add/Modify compounds in an existing database
Steps Detailed Instructions Comments
•
Task 2. Add/Modify compounds in an existing database
You can also manually add compounds to a database and modify the
compounds in the database. In the next task, you create a Triggered Dynamic
MRM method from the compounds in the database.
Steps Detailed Instructions Comments
1 Review the
iiiSulfamix_dMRM2.m, where iii
are your initials.
2 Start the MassHunter Optimizer
software.
42 Agilent 6400 Series Triple Quad LC/MS Familiarization Guide
a Click File > Open > Method.
b Select the iiiSulfamix_dMRM2.m
method.
c Click OK.
d Review the parameters.
• Double-click the Optimizer icon. . • If you are optimizing peptides, use
• A Triggered Dynamic MRM method
is a type of Dynamic MRM method.
The Scan Type for both methods is
Dynamic MRM.
the Optimizer for Peptides program.
Page 43

Exercise 3 – Create a Triggered Dynamic MRM acquisition method
Task 2. Add/Modify compounds in an existing database
Steps Detailed Instructions Comments
3 Set parameters on the Optimizer
Setup tab.
4 Set parameters on the Precursor
Ion Selection tab.
5 Set parameters on the Product Ion
Selection tab.
a Click the Optimizer Setup tab.
b Click the Injection (with or without
column) button.
c Set the CE range from
d Set the Cell Accelerator Voltage to 7.
e Right-click the table and click Add
Method.
f Select the iiiSulfamix_dMRM2.m
method.
a Click the Precursor Ion Selection tab.
b Verify that +H is marked for the
Positive ions (with priorities) list.
a Click the Product Ion Selection tab.
b Click the Mass (m/z) button under
Low mass cut-off.
c Enter
60 for the low mass cut-off.
4 to 48.
• To create low mass product ions
from a precursor ion near 300 m/z,
you need fairly high collision
energies.
• On the Product Ion Selection, you
can automatically add up to 4
product ions per compound (for
instance, 2 primaries and 2
secondaries). You want 8 to 10
peaks in the composite spectrum to
prove that this is indicative of the
compound, so you need to add at
least some of the product ions
manually.
Agilent 6400 Series Triple Quad LC/MS Familiarization Guide 43
Page 44
Exercise 3 – Create a Triggered Dynamic MRM acquisition method
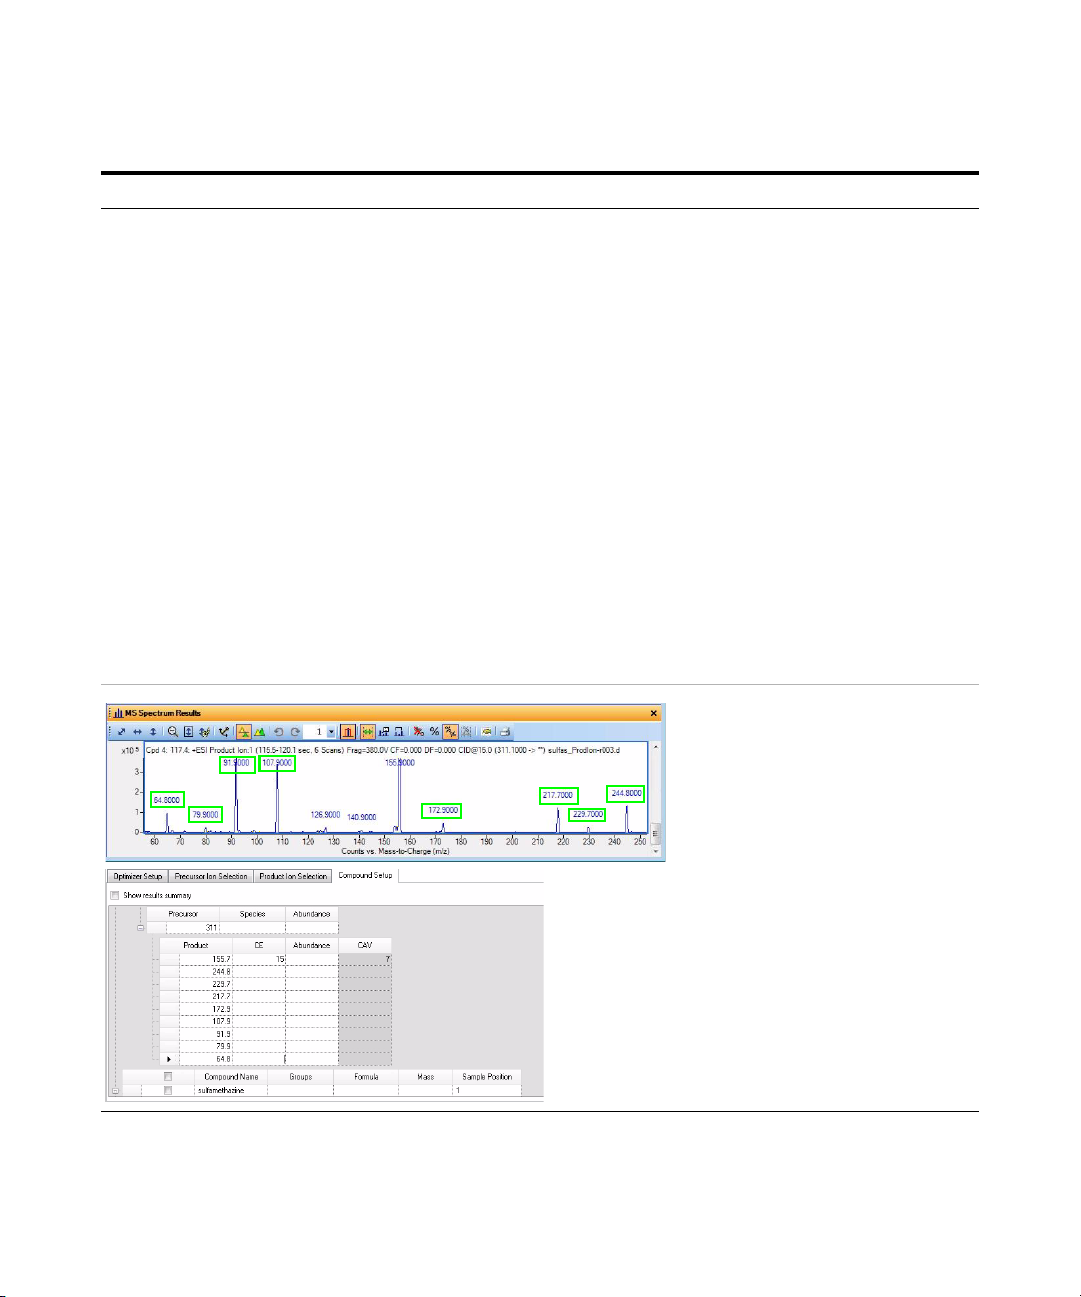
This product ion scan has a precursor
mass of 311. You examine the MS
spectrum to determine the product ions
to add to the Product ion section of the
Compound Setup table.
The product ions that are manually added as
additional Product ions in the MassHunter
Optimizer software are shown in the MS Spectrum
Results window. The green boxes were added in
this guide to show which product ions were used.
Task 2. Add/Modify compounds in an existing database
Steps Detailed Instructions Comments
6 Set parameters on the Compound
Setup tab and add additional
transitions.
• For Precursor ion 311, add the
following product ions: 244.8,
229.7, 217.7, 172.9, 107.9, 91.9,
79.9, 64.8
• For Precursor 285, add the
following product ions: 129.9,
107.9, 91.9, 79.8, 64.8
• For Precursor 279, add the
following product ions: 212.8,
155.9, 123.9, 107.9, 91.9, 79.8,
64.9
• For Precursor 271, add the
following product ions: 177.8,
115.9, 107.9, 92, 80, 64.9
a Click the Compound Setup tab.
b Click the Import/Export > Import
from Acquisition Methods command.
c Select the iiiSulfamix_dMRM2.m
method and click Open.
d (optional) Right-click the tab and click
Expand/Collapse All Rows.
e Select one of the Product rows for one
of the compounds. In this example,
select the Product row 155.7 for
Precursor 311.
f Right-click the Product row and click
Add Product Ion. In this example, you
add 8 product ion rows.
g Enter the Product in each of the
product ion rows that were added. See
“To determine product ions in the
Qualitative Analysis program:” on
page 45.
h Add product ions for compounds 1, 2
and 3.
• For each compound, we are going to
add additional transitions.
• In the Qualitative Analysis program,
you examine Product Ion data files
which you acquired previously to
determine additional transitions to
add. See “Task 4. Determine product
ion masses” on page 24.
• You can use the arrow keys to move
between rows in the Product table.
44 Agilent 6400 Series Triple Quad LC/MS Familiarization Guide
Page 45

Exercise 3 – Create a Triggered Dynamic MRM acquisition method
Task 2. Add/Modify compounds in an existing database
Steps Detailed Instructions Comments
3 Set parameters on the Optimizer
Setup tab.
4 Set parameters on the Precursor
Ion Selection tab.
5 Set parameters on the Product Ion
Selection tab.
a Click the Optimizer Setup tab.
b Click the Injection (with or without
column) button.
c Set the CE range from
d Set the Cell Accelerator Voltage to 7.
e Right-click the table and click Add
Method.
f Select the iiiSulfamix_dMRM2.m
method.
a Click the Precursor Ion Selection tab.
b Verify that +H is marked for the
Positive ions (with priorities) list.
a Click the Product Ion Selection tab.
b Click the Mass (m/z) button under
Low mass cut-off.
c Enter
60 for the low mass cut-off.
4 to 48.
• To create low mass product ions
from a precursor ion near 300 m/z,
you need fairly high collision
energies.
• On the Product Ion Selection, you
can automatically add up to 4
product ions per compound (for
instance, 2 primaries and 2
secondaries). You want 8 to 10
peaks in the composite spectrum to
prove that this is indicative of the
compound, so you need to add at
least some of the product ions
manually.
Agilent 6400 Series Triple Quad LC/MS Familiarization Guide 45
Page 46

Exercise 3 – Create a Triggered Dynamic MRM acquisition method
This product ion scan has a precursor
mass of 311. You examine the MS
spectrum to determine the product ions
to add to the Product ion section of the
Compound Setup table.
The product ions that are manually added as
additional Product ions in the MassHunter
Optimizer software are shown in the MS Spectrum
Results window. The green boxes were added in
this guide to show which product ions were used.
Task 2. Add/Modify compounds in an existing database
Steps Detailed Instructions Comments
6 Set parameters on the Compound
Setup tab and add additional
transitions.
• For Precursor ion 311, add the
following product ions: 244.8,
229.7, 217.7, 172.9, 107.9, 91.9,
79.9, 64.8
• For Precursor 285, add the
following product ions: 129.9,
107.9, 91.9, 79.8, 64.8
• For Precursor 279, add the
following product ions: 212.8,
155.9, 123.9, 107.9, 91.9, 79.8,
64.9
• For Precursor 271, add the
following product ions: 177.8,
115.9, 107.9, 92, 80, 64.9
a Click the Compound Setup tab.
b Click the Import/Export > Import
from Acquisition Methods command.
c Select the iiiSulfamix_dMRM2.m
method and click Open.
d (optional) Right-click the tab and click
Expand/Collapse All Rows.
e Select one of the Product rows for one
of the compounds. In this example,
select the Product row 155.7 for
Precursor 311.
f Right-click the Product row and click
Add Product Ion. In this example, you
add 8 product ion rows.
g Enter the Product in each of the
product ion rows that were added. See
“To determine product ions in the
Qualitative Analysis program:” on
page 45.
h Add product ions for compounds 1, 2
and 3.
• For each compound, we are going to
add additional transitions.
• In the Qualitative Analysis program,
you examine Product Ion data files
which you acquired previously to
determine additional transitions to
add. See “Task 4. Determine product
ion masses” on page 24.
• You can use the arrow keys to move
between rows in the Product table.
46 Agilent 6400 Series Triple Quad LC/MS Familiarization Guide
Page 47

Exercise 3 – Create a Triggered Dynamic MRM acquisition method
This product ion scan has a precursor
mass of 311. You examine the MS
spectrum to determine the product ions
to add to the Product ion section of the
Compound Setup table.
Task 2. Add/Modify compounds in an existing database
Steps Detailed Instructions Comments
• To determine product ions in the
Qualitative Analysis program:
7 Set other parameters in the
Compound Setup tab and start the
optimization.
• You cannot perform a
multi-compound run.
• You have to mark each row in the
table to use.
a Open the SulfamixPI_15.d from “Task
4. Determine product ion masses” on
page 24.
b Click Find > Find Compounds by
Tar g et e d M S/ M S.
c Close the Compound List window.
d Select a compound in the Data
Navigator window. For this example,
click Cpd 4.
e Click the Autoscale Y-axis in the MS
Spectrum Results toolbar.
f Right-click and drag to zoom in on the
MS spectrum.
a Mark the check box in the left column
at the top of the table. The check box
for every row in the table is marked.
b Clear the Perform multi-compound
run check box in the right column.
c Click the Start Optimization button in
the Optimizer toolbar.
• If possible, rearrange the windows
on the screen so you can see the
Optimizer program and the
Qualitative Analysis program at the
same time.
• You cannot perform a
multi-compound run with the
number of transitions that were
added. If you mark this check box,
then the Expected peak width
(base) is automatically set to almost
80 seconds wide. If you clear this
check box, then the Expected peak
width is calculated to be around 9
seconds which is more appropriate.
Agilent 6400 Series Triple Quad LC/MS Familiarization Guide 47
Page 48

Exercise 3 – Create a Triggered Dynamic MRM acquisition method
As a general rule, as the Product Ions get smaller,
the optimal Collision Energy gets larger. However,
when you also examine the abundance, you can
see that if the Collision Energy is set to 48 for the
smallest product ion, the smallest product ion can
become the dominant peak. The collision energies
are further adjusted later in this task.
Task 2. Add/Modify compounds in an existing database
Steps Detailed Instructions Comments
8 Examine the Optimizer Report. a Examine the Collision Energy for each
Product Ion.
b Print or save the report.
9 Save the compounds. • Click the File > Save Compounds
command.
10 Import compounds from a
database.
• Click the Import/Export > Import from
Database command. The Database
Browser program opens.
• You can also import compounds
that were distributed as part of a
database.
48 Agilent 6400 Series Triple Quad LC/MS Familiarization Guide
Page 49

Exercise 3 – Create a Triggered Dynamic MRM acquisition method
Task 2. Add/Modify compounds in an existing database
Steps Detailed Instructions Comments
11 In the Database Browser program,
select the transitions.
a Mark the Show All Records check
box.
b Click the Select top button under
Select Transitions.
c Type 10 for the ranked transitions.
d Click the Select Transitions button.
• All the transitions that you typed in
are visible.
• The tools to allow you to set up
Primary transitions and Secondary
transitions are available in this
program.
•
12 In the Database Browser program,
automatically select the Primary
transitions and Trigger transition.
a In the Set top ranked transitions as
primary box, enter 2.
b Click the Set Primaries and Trigger
button.
• The software automatically selects
the two most abundant transitions
as the Primary transitions.
• The software also selects the most
abundant transition as the Tr ig g er .
• You can manually select a second
Tr ig g er transition.
Agilent 6400 Series Triple Quad LC/MS Familiarization Guide 49
Page 50

Exercise 3 – Create a Triggered Dynamic MRM acquisition method
You examine the Primary column and the Trigger column to determine which transitions are selected. You can select
one or two Trigger transitions. You can select multiple Primary transitions.
Task 2. Add/Modify compounds in an existing database
Steps Detailed Instructions Comments
13 Review the Primary transitions and
Trigger transitions.
• For sulfachloropyridazine, select
285 m/z -> 156 m/z transition as
the Primary and Trigger
transition.
• For sulfadimethoxine, select
select 311 m/z -> 156 m/z
transition as the Primary and
Trigger transition.
• For sulfamethazine, select 279
m/z -> 186 m/z transition as the
Primary and Trigger transition.
• For sulfamethizole, select 271
m/z -> 156 m/z transition as the
Primary and Trigger transition.
• Review each compound. Change the
Primary and Trigger transitions to the
transitions listed in the left column.
• Change the other Primary transitions
as shown below.
• The software selected the most
abundant transitions which in this
example often had a low m/z for the
Product Ion. A very abundant low
m/z ion may be unsuitable as a
Primary transition.
• You can select two Primary
transitions as triggers for a
compound.
50 Agilent 6400 Series Triple Quad LC/MS Familiarization Guide
Page 51

Exercise 3 – Create a Triggered Dynamic MRM acquisition method
Task 2. Add/Modify compounds in an existing database
Steps Detailed Instructions Comments
14 Review the Import List table on the
Import List tab.
a Click the Add to Import List button.
b Click the Import List tab.
c Review the Import List table.
d Click the Import button.
• In this example, you are importing
from the database to the Import
List. Then, you are importing from
Database Browser to Optimizer.
Agilent 6400 Series Triple Quad LC/MS Familiarization Guide 51
Page 52

Exercise 3 – Create a Triggered Dynamic MRM acquisition method
Task 2. Add/Modify compounds in an existing database
Steps Detailed Instructions Comments
15 Review the Compound Setup table
in Optimizer. You replace all
compounds with the compounds
from the Database Browser
program.
a Click the Yes t o A ll button.
b In the Compound Setup tab in the
Optimizer program, review the
compounds.
• The compounds in the Optimizer
program are overwritten by the
compounds that you updated in the
Database Browser program.
52 Agilent 6400 Series Triple Quad LC/MS Familiarization Guide
Page 53

Exercise 3 – Create a Triggered Dynamic MRM acquisition method
Task 2. Add/Modify compounds in an existing database
Steps Detailed Instructions Comments
16 Save the new compound
parameters to the database.
• Click the File > Save Compounds
command to save all of the changes to
the database.
• You cannot see these results by
default, but the Primary and Trigger
transitions are updated in the
project.
• The Primary column, Tri g ge r
column, Trigger Entrance Delay
column, Trigg e r D ela y column,
Trigger Window column and
Trigger MRM Threshold column are
available in the Compound Setup
tab, but they are hidden by default.
Agilent 6400 Series Triple Quad LC/MS Familiarization Guide 53
Page 54

Exercise 3 – Create a Triggered Dynamic MRM acquisition method
Task 3. Create a Triggered Dynamic MRM method from an existing database
Task 3. Create a Triggered Dynamic MRM method from an existing
database
You can create a Triggered Dynamic MRM method from a database such as the
Pesticides or Forensics/Tox database. These databases can be purchased from
Agilent. You can also copy the information from an Excel spreadsheet, but that
method is not described in this guide.
Steps Detailed Instructions Comments
1 In the Data Acquisition program,
you now import the updated
compounds from the database.
These compounds have optimized
collision energies and also Primary
and Trigger transitions marked.
a Switch to the Data Acquisition
program.
b Open the iiiSulfamix_dMRM2.m
method.
c In the QQQ tab, click the Acquisition
tab. The Scan segments table contains
four rows which are deleted later.
d Right-click the Scan Segments table
and click Import from Database
Browser. The Database Browser
program opens.
e Mark the Show All Records check
box.
f Mark all of the transitions for the four
sulfa drug compounds. Clear the check
boxes next to any unwanted
compounds.
g Click the Add to Import List button.
h Click the Import List tab.
i Review the Import List table.
j Click the Import button.
k Delete the original compounds from
the Scan segments table.
l Mark the Tr i gg e re d check box under
Triggered MRM.
• Before you import compounds from
Database Browser, the Scan
segments table contains at least
one row. After importing
compounds from the Database
Browser, you need to remove any
original rows.
• The Scan segments table always
has to have at least one row.
• The triggering information is loaded
from the Database Browser
program even if the Triggered check
box is clear.
• See the online Help for the Data
Acquisition program and the QQQ
Concepts Guide for an explanation
of the other triggering conditions:
Trig g e r E ntr a n c e, Tr i g g er D e l a y,
and Trigger Window.
54 Agilent 6400 Series Triple Quad LC/MS Familiarization Guide
Page 55

Exercise 3 – Create a Triggered Dynamic MRM acquisition method
Task 3. Create a Triggered Dynamic MRM method from an existing database
Steps Detailed Instructions Comments
2 Save the method to a new method
name, iiiSulfas_TriggerOpt.m,
where iii are your initials.
a Click the Method > Save Method
command.
b Ty p e iiiSulfas_TriggerOpt.m.
c Click the Save button.
Agilent 6400 Series Triple Quad LC/MS Familiarization Guide 55
Page 56
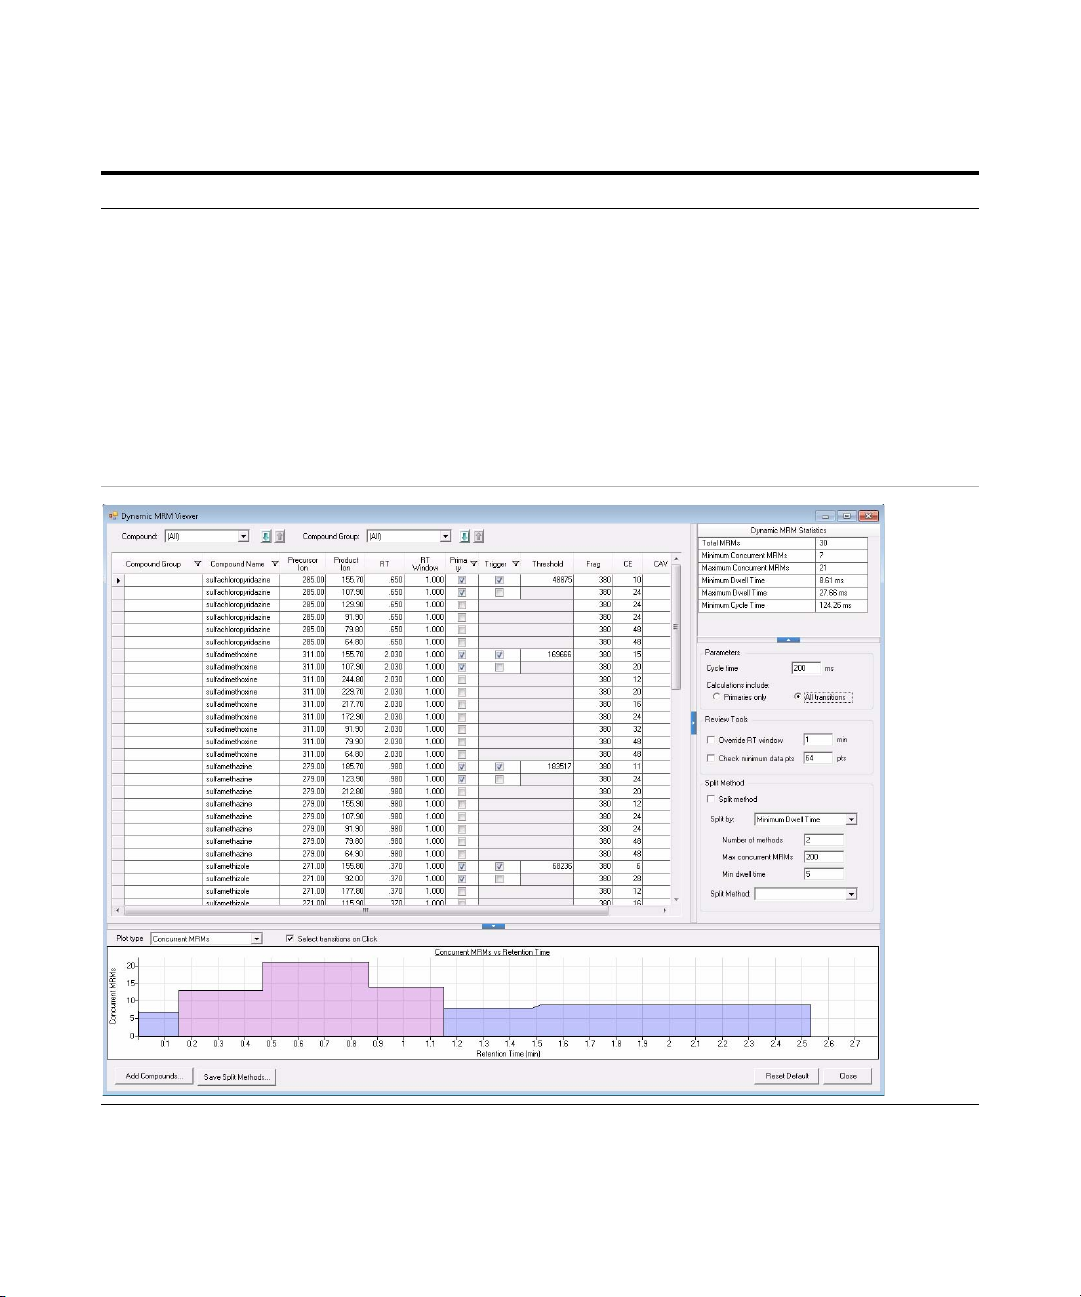
Exercise 3 – Create a Triggered Dynamic MRM acquisition method
Task 3. Create a Triggered Dynamic MRM method from an existing database
Steps Detailed Instructions Comments
3 Review the method in the Dynamic
MRM Viewer dialog box.
a Right-click the Scan segments table
and click Edit DMRM Method. The
Dynamic MRM Viewer dialog box is
opened.
200 for the Cycle time. This
b Ty p e
value is shown in the Acquisition tab.
c Click between the Primaries only
button and the All transitions button if
the Dynamic MRM Statistics
information is not updating. Then, click
the All transitions button.
• The compounds in the Optimizer
program were overwritten by the
compounds that you updated in the
Database Browser program.
• You can modify the Cycle time and
see how the Minimum Dwell Time
is changed. If the Minimum Dwell
Time is less than 5 ms, and
especially if it is less than 2 ms,
then signal-to-noise is poor.
• A Dwell Time of 8 ms per transition
is fine.
56 Agilent 6400 Series Triple Quad LC/MS Familiarization Guide
Page 57

Exercise 3 – Create a Triggered Dynamic MRM acquisition method
Task 3. Create a Triggered Dynamic MRM method from an existing database
Steps Detailed Instructions Comments
4 Review the Trigger Thresholds to
verify that they are appropriate.
a Do an injection to make sure that the
Trigger Thresholds are set properly.
b Right-click the Scan segments table
and click Update DMRM Method.
c In the MRM Update Options dialog
box, select Tr ue for Update
Threshold?.
d Enter the value for the Percent of
Height for the Trigger Threshold.
e Select the data file that you just
acquired.
f Click OK.
Agilent 6400 Series Triple Quad LC/MS Familiarization Guide 57
Page 58

Exercise 4 – Optimize Acquisition parameters
Task 1. Use the Optimizer Software to optimize acquisition parameters
Exercise 4 – Optimize Acquisition parameters
For this exercise you optimize a mixture of four sulfonamide compounds.
Task 1. Use the Optimizer Software to optimize acquisition
parameters
The Optimizer Software helps you optimize acquisition parameters.
Specifically, it automates the selection of the best precursor ions, the
optimization of the fragmentor voltage for each precursor ion, selection of the
best product ions, and optimization of collision energy values for each
transition for a list of compounds you specify.
To do this task, you first need to create the method
5. Find optimum collision energy for MRM acquisition”
acquire the data file.
The Fragmentor Voltage for the 6490 is set automatically during Autotune. The
Fragmentor voltage for a 6490 is not optimized. The Fragmentor parameters
and results will not be displayed for a 6490 instrument.
Steps Detailed Instructions Comments
1 Start the MassHunter Optimizer
software.
• Double-click the Optimizer icon. . • If you are optimizing peptides, use
on page 30. You do not need to
iiiSulfamix MRM_10.m in “Task
the Optimizer for Peptides program.
58 Agilent 6400 Series Triple Quad LC/MS Familiarization Guide
Page 59

Exercise 4 – Optimize Acquisition parameters
Task 1. Use the Optimizer Software to optimize acquisition parameters
Steps Detailed Instructions Comments
Agilent 6400 Series Triple Quad LC/MS Familiarization Guide 59
Page 60

Exercise 4 – Optimize Acquisition parameters
Task 1. Use the Optimizer Software to optimize acquisition parameters
Steps Detailed Instructions Comments
2 Set the optimization parameters. a Click the Optimizer Setup tab.
b Set the Sample introduction method
to Injection.
c Set the Fragmentor ramp parameters
as follows:
• Set the range for ramping the
Fragmentor values from 90 to 135.
• Clear the Fragmentor Fine check
box.
d Set the range for ramping the Collision
Energy from 0 to 40 V.
e Select a Path for data files to store the
optimization run data.
f Right-click the table on the right and
select Add Method from the shortcut
menu.
g Click the button on the right side of the
Acq Method cell to open the Open
Method dialog box.
h Select the method created in the
previous exercise iiiSulfamix
MRM_10.m and click OK. The Polarity
and Ion Source will be filled in from the
values set in the selected method.
i Check to make sure that the Ion
Source from the method matches the
physical configuration of your
instrument.
j Repeat step f to step i to select
additional methods.
• Fine optimization refines the coarse
ramping values and provides better
optimization but takes longer to run.
• The data can be displayed later with
Agilent MassHunter Qualitative
Analysis software.
• The Fragmentor Voltage is not
optimized for an Agilent 6490 Triple
Quadrupole. It is set automatically
when you Autotune. The
Fragmentor parameters and results
for a 6490 are not shown in the
Optimizer program.
60 Agilent 6400 Series Triple Quad LC/MS Familiarization Guide
Page 61

Exercise 4 – Optimize Acquisition parameters
Task 1. Use the Optimizer Software to optimize acquisition parameters
Steps Detailed Instructions Comments
3 Select the precursor ions a Click the Precursor Ion Selection tab.
b Select the Positive ions +H adduct.
c Select the Charge state of 1.
d Set the search priority of the precursor
ions.
e (optional) To exclude certain masses
from consideration, click Exclude
masses at the bottom of the screen.
Enter the m/z Values to exclude
separated by commas and/or enter a
Minimum abundance value in counts.
• Mark the Use most abundant
precursor ion check box to use the
most abundant precursor ion.
• Clear the Use most abundant
precursor ion check box and use
the Up and Down arrow buttons to
set the search order (ions at the top
of the list are given more priority).
• You can also enter Neutral Losses
to exclude (for example H
O).
2
Agilent 6400 Series Triple Quad LC/MS Familiarization Guide 61
Page 62

Exercise 4 – Optimize Acquisition parameters
Task 1. Use the Optimizer Software to optimize acquisition parameters
Steps Detailed Instructions Comments
4 Select the product ions a Click the Product Ion Selection tab.
b Enter a Low mass cut-off value. Select
Mass (m/z) of 60 m/z.
c To exclude certain masses from
consideration, click Exclude masses
option at the bottom of the screen.
Enter the m/z Values to exclude
separated by commas and/or enter a
Minimum abundance value in counts.
d If desired, you can also enter Neutral
Losses to exclude, for example H
Enter a formula in the box and click the
button to add it to the list.
0.
2
62 Agilent 6400 Series Triple Quad LC/MS Familiarization Guide
Page 63

Exercise 4 – Optimize Acquisition parameters
Task 1. Use the Optimizer Software to optimize acquisition parameters
Steps Detailed Instructions Comments
5 Set up a compound list. The
formula for the four Sulfa Drugs
are:
• Sulfamethizole
C
9H10O2N4S2
• Sulfamethazine
C12H14O2N4S
• Sulfachloropyridazine
C
10H9O2N4
• Sulfadimethoxine
C12H14O4N4S
SCl
a Click the Compound Setup tab.
b Clear the Show results summary
check box above the table while you
set up the compound list.
c Right-click the table and select Add
Compound from the shortcut menu to
add a row to the end of the table.
d Enter
e Enter
f Enter
g Enter the Sample Position for the new
h (optional) Enter an Optimization dwell
i Repeat the steps above to add the
j Mark the Select columns for the
k Save the compound list to the
Sulfamethizole as the
Compound Name.
Sulfa drugs as the group
name in the Groups column.
C9H10O2N4S2 as the
Formula of the compound. The mass is
calculated.
compound.
time value to set longer or shorter
cycle times.
other three sulfa drugs to the table.
compounds (rows) to use for
optimization.
database or to the current project.
• Compounds are global to all
projects. Compound information
such as name, group, formula, and
mass in one project will be reflected
in the entire database.
• If no methods or ions are specified
here, then optimization for the
compound uses the methods from
the Optimizer Setup tab and
information from the Precursor Ion
Selection and Product Ion Selection
tabs to generate the ions.
• You can also enter the monoisotopic
mass in the Mass column instead of
the Formula.
Agilent 6400 Series Triple Quad LC/MS Familiarization Guide 63
Page 64

Exercise 4 – Optimize Acquisition parameters
The Fragmentor parameters and results are not
displayed for an Agilent 6490 Triple
Quadrupole. The Fragmentor voltage for a 6490
is set automatically during Autotune.
Task 1. Use the Optimizer Software to optimize acquisition parameters
Steps Detailed Instructions Comments
6 Start the optimization process. • Click the Start Optimization button
( ) on the toolbar
or
• Click the Ion Breakdown Profile button
( ) on the toolbar.
7 Review results. a Click the Compound Setup tab.
b Mark the Show results summary
check box above the table.
c Review the following values for each
transition ion in the Compound Table:
• Fragmentor
• Collision Energy
d Review the printed optimization report.
•
• (optional) Use the Agilent
MassHunter Workstation
Qualitative Analysis program to look
at the data.
• See the online Help for the
Optimizer program or the Optimizer
Quick Start Guide to learn how to
import optimization results to
acquisition for MRM time
segments.
64 Agilent 6400 Series Triple Quad LC/MS Familiarization Guide
Page 65

Exercise 4 – Optimize Acquisition parameters
Task 2. Use the “Source and iFunnel Optimizer” program to optimize acquisition parameters
Task 2. Use the “Source and iFunnel Optimizer” program to
optimize acquisition parameters
The “Source and iFunnel Optimizer” Software helps you optimize acquisition
parameters for the source and iFunnel.
To do this task, you first need to create the method
4. Create a Dynamic MRM method from an MRM method”
iiiSulfamix_dMRM2.m in “Task
on page 39. You do not need to
acquire the data file. When you use this software, a worklist for each of the
parameters being optimized is added to the Study Manager program.
Steps Detailed Instructions Comments
1 Start the MassHunter Data
Acquisition software and load the
iiiSulfamix_dMRM2.m method.
Save this method to a new name.
2 Edit the Source parameters. a Click the QQQ tab.
a Start the Data Acquisition program.
b Make sure that Acquisition appears as
the selection in the Context text box.
If Tune is the selection, click
Acquisition from the Context
dropdown menu in the Combo bar.
c Load the iiiSulfamix_dMRM2.m
method.
d Save this method to the name
iiiSulfamix_SourceOpt.m.
e View the Method Editor window.
b Click the Source tab on the QQQ tab.
c Modify the parameters to the
recommended starting parameters for
source optimization. These parameters
are shown in the following image.
• The first step is to create a template
method. This method is used when
you are optimizing the source and
iFunnel parameters.
Agilent 6400 Series Triple Quad LC/MS Familiarization Guide 65
Page 66

Exercise 4 – Optimize Acquisition parameters
When this program starts, it automatically selects the
default.m method. This method is not set up for an Agilent
Jet Stream source, so no Agilent Jet Stream parameters
are shown in the Instrument parameters table.
Task 2. Use the “Source and iFunnel Optimizer” program to optimize acquisition parameters
Steps Detailed Instructions Comments
3 Create template method. a Click the Acquisition tab.
b Select a single ion for each compound
for the optimization.
c Save the method.
4 Start the MassHunter “Source and
iFunnel Optimizer” program.
• Double-click the Source Optimizer icon
().
• A transition for each compound is
already included in the Dynamic
MRM method.
66 Agilent 6400 Series Triple Quad LC/MS Familiarization Guide
Page 67

Exercise 4 – Optimize Acquisition parameters
The Sheath Gas Temp, Sheath Gas Flow, and Nozzle Voltage
are all specific to the Agilent Jet Stream. If you do not have
an Agilent Jet Stream source, these rows are not included in
the table.
The High Pressure RF and Low Pressure RF are only included
if the QQQ model is a 6490.
Task 2. Use the “Source and iFunnel Optimizer” program to optimize acquisition parameters
Steps Detailed Instructions Comments
5 Select the template method,
iiiSulfamix_SourceOpt.m.
a Click the Browse button. The Browse
For Folder dialog box is opened.
b Select the iiiSulfamix_SourceOpt.m
method. Click the OK button.
c If the ion source in the method is
different than the ion source in the
Instrument parameters list, a warning
message is opened. Click OK.
6 Change the order of the rows in the
Instrument parameters table to the
following:
• Ion Funnel parameters
• Sheath Gas temperature and flow
• Gas temperature and flow
• Nebulizer
• Capillary
• Nozzle Voltage
a If necessary, select the row that shows
the High Pressure RF parameter.
b Drag this row to the top of the table.
Both of the Ion Funnel parameters are
moved together.
c Verify that the order of the rows in your
table is as indicated.
• The order of the parameters in the
Instrument parameters table is the
order that the parameters are
optimized. You want to optimize the
parameters that have the greatest
effect on the source optimization
first. The Ion Funnel parameters
have the greatest effect, so you
move those parameters to the top of
the list.
• By default, the parameters are in
the optimized list.
Agilent 6400 Series Triple Quad LC/MS Familiarization Guide 67
Page 68

Exercise 4 – Optimize Acquisition parameters
The High Pressure RF and the Low Pressure RF are always
optimized together. If you move one of these rows in the
table, the other row is also moved. All possible
combinations of the High Pressure RF and Low Pressure RF
are tried to find the optimal values. For this example, the
High Pressure RF parameter has 8 different parameter
settings (70, 90, 110, etc.). The Low Pressure RF parameter
has 7 different parameter settings. So, the program
automatically creates 56 (8 * 7) different methods (1 for
each parameter combination) just for optimizing the ion
Funnel parameters.
Task 2. Use the “Source and iFunnel Optimizer” program to optimize acquisition parameters
Steps Detailed Instructions Comments
7 Review the values for each
parameter in the Instrument
parameters table.
8 Save the Instrument parameters. a Click File > Save As (*.opt).
9 Modify the Instrument parameters
table to only modify one parameter
for this task. This task only
optimizes the Capillary voltage.
68 Agilent 6400 Series Triple Quad LC/MS Familiarization Guide
For each row in the table, verify:
• PreWait (in minutes).
• Replicate.
• StepWait (in minutes).
• StartValue.
• EndValue.
• StepSize.
b Enter the name for this set of
instrument parameters.
c Click OK.
a Mark the check box next to the
Capillary.
b Clear the check boxes next to all of the
other parameters.
• When the study for each parameter
is loaded for the first time but before
you run the first run, you wait the
PreWait number of minutes before
starting the run. Some parameters
(that are electronic) stabilize almost
instantly (in milliseconds), so you
do not need to wait. For flows and
temperatures, you want to have a
PreWait before you run the study.
• You also want to wait for
temperature parameters in between
changing the parameter to a
different value, so you also set the
StepWait (in minutes).
• For this example, you optimize the
Capillary. Usually, you optimize the
parameters in the order specified in
the Instrument parameters table.
Page 69

Exercise 4 – Optimize Acquisition parameters
Task 2. Use the “Source and iFunnel Optimizer” program to optimize acquisition parameters
Steps Detailed Instructions Comments
10 Set the Project Folder and the
Project Name.
11 Set the Worklist parameters. a Type the Sample Name.
a Select the Project Folder. In this
example, select \MassHunter\Data.
b Enter a Project Name.
c (optional) Mark the Append
timestamp check box.
b Type the Sample Position.
c Type the Worklist position of data file
used for calibration.
• If you mark the Append timestamp
check box, then a time stamp is
automatically added to the Project
Name when you click the Submit
button.
• If you mark the Append timestamp
check box, then a time stamp is
automatically added to the Project
Name when you click Submit.
• For each parameter that is
optimized, a batch file is created for
Quantitative Analysis. One of the
injections is considered 100% of the
starting value. The value of
Worklist position of data file used
for calibration states which data
file to use. If you enter
data file from the first row is used.
1, then the
Agilent 6400 Series Triple Quad LC/MS Familiarization Guide 69
Page 70

Exercise 4 – Optimize Acquisition parameters
The estimated time includes the Stoptime for the method plus one minute per injection. It does not consider the
Posttime specified in the method. Also, it does not include the PreWait nor the StepWait that you entered in the
Instrument parameters table.
The name of the study is the Instrument
parameter that is being optimized. A
separate study is added for each
parameter that is being optimized.
You can examine or edit the worklist for
the study. You right-click the line in the
Pending Studies table and click Edit
Worklist from Study.
Task 2. Use the “Source and iFunnel Optimizer” program to optimize acquisition parameters
Steps Detailed Instructions Comments
12 Create the methods and submit the
study to the Study Manager.
13 Review the study (or studies)
submitted to Study Manager.
a Click Create Methods.
b Click Submit.
a Open the Study Manager program.
b Select a row in the Pending Studies
table.
c Right-click the row and click Edit
Worklist From Study.
d Review the worklist in the Edit
Worklist dialog box. Click Save.
• When you click Create Methods, a
message at the bottom of the main
window states how many Methods
were created, how many Injections
are involved, and the Estimated
time. The Estimated time is only an
approximation.
• A study is submitted for each
parameter that you marked in the
Instrument parameters table.
• Only one study is created for the
High Pressure RF and Low
Pressure RF parameters.
70 Agilent 6400 Series Triple Quad LC/MS Familiarization Guide
Page 71

Exercise 4 – Optimize Acquisition parameters
The script that is run at the end
of the worklist creates the
Quantitative Analysis batch
file.
The name of the study is the Instrument
parameter that is being optimized. A
separate study is added for each
parameter that is being optimized.
You can examine or edit the worklist for
the study. You right-click the line in the
Pending Studies table and click Edit
Worklist from Study.
Task 2. Use the “Source and iFunnel Optimizer” program to optimize acquisition parameters
Steps Detailed Instructions Comments
14 Modify the Study Manager
parameters to run a standby script
when the study completes and
then start the Study Manager.
a Click the Settings tab in the Ribbon.
b Mark the Enable standby script
execution on idle check box.
c Click the “...” button to select the
script to execute.
d Select SCP_InstrumentStandby and
click the OK button.
e Enter 1 for the Wai t for time.
f Click the Start button if necessary.
• When the Study Manager is not
running a study for the time
specified, then the script you select
is executed.
Agilent 6400 Series Triple Quad LC/MS Familiarization Guide 71
Page 72

Exercise 4 – Optimize Acquisition parameters
You specified the Project Folder and
the Project Name in the “Source
and iFunnel Optimizer” program
before you submitted the study.
The batch file is created
automatically at the end of the
study.
The “system” folder contains all of
the methods that were used in this
study.
Task 2. Use the “Source and iFunnel Optimizer” program to optimize acquisition parameters
Steps Detailed Instructions Comments
15 When the study completes, stop
the Study Manager queue and exit
from the Study Manager program.
16 Open the data in the Quantitative
Analysis program.
17 Review the Batch Table. a Switch to Multiple Compound View.
a Click the Stop > Immediately
command.
b Close the Study Manager program.
a Start the Quantitative Analysis
program.
b Click File > Open Batch.
c Navigate to the location of the study.
d Select the Batch file named
Capillary.batch.bin and click Open.
b Add the Area column to the table.
c For each compound, right-click the
Final Conc. column and click Plot this
column.
d Examine the Area column and the Final
Conc. graph to determine the best
capillary voltage.
e Close the Quantitative Analysis
program.
• Refer to the online Help for the
Quantitative Analysis program to
learn how to do these tasks.
• In this case, all four compounds
optimize at the same setting. Often,
different compounds have different
optimal settings, and you have to
compromise.
72 Agilent 6400 Series Triple Quad LC/MS Familiarization Guide
Page 73

Exercise 4 – Optimize Acquisition parameters
Task 2. Use the “Source and iFunnel Optimizer” program to optimize acquisition parameters
Steps Detailed Instructions Comments
18 (optional) Review the data files in
the Qualitative Analysis program.
a Start the Qualitative Analysis program.
b Open all of the data files in the study.
c Click Find > Find Compounds by
MRM.
d Select all of the data files and click the
Find button.
e Click the Edit > Auto-Color Mode >
Single Color per Data File menu item.
f Clear the check boxes next to the TIC
for each data file.
g Examine the results in the
Chromatogram Results window.
h Close the Qualitative Analysis
program.
• By default, the program selects
different colors for different
transitions.
• It is clear that the conditions used
for the blue chromatograms are the
best, and the blue chromatograms
are for the data file with the
capillary voltage set to 2000.
Agilent 6400 Series Triple Quad LC/MS Familiarization Guide 73
Page 74

www.agilent.com
In This Book
This exercise helps you use
the Agilent 6400 Series Triple
Quadrupole LC/MS system. In
this guide, you acquire data
and then analyze the results
using the Qualitative Analysis
program to learn how to
develop an acquisition
method.
© Agilent Technologies, Inc. 2012
Printed in USA
Revision A, November 2012
*G3335-90136*
G3335-90136
 Loading...