

Page 1

Quick Start Guide
Agilent Technologies
14565A Device
Characterization Software
for Windows 95,
Windows 98, and
Windows NT 4.0
Page 2

Contents
Description ...........................................................................................................3
System Requirements ...........................................................................................3
Installing and Running the Software.....................................................................4
Configuring the I/O ..............................................................................................4
Performing Basic Operations................................................................................5
Display Area......................................................................................................... 6
Making Triggered Measurements.........................................................................7
Performing Measurements on Waveforms............................................................8
Placing a Waveform on the Display .....................................................................9
Printing and Saving Measurement Data..............................................................10
Advanced Measurement Settings........................................................................10
Display Preferences............................................................................................10
Source Settings...................................................................................................11
Sample Waveforms.............................................................................................11
Warranty............................................................................................................. 12
2
Page 3

Description
What the
Agilent
14565A
Will Do
The Agilent Technologies 14565A Device Characterization
Software is an easy-to-use graphical user interface for the
Agilent 66300-series Dynamic Measurement DC Sources. With
it, you can:
a Control output and measurement functions from a single
screen.
a View an oscilloscope-like display of dynamic output
measurements.
a Superimpose up to two stored waveforms on active
waveform data.
a Get measurement details by zooming in on active
waveforms.
a View calculated measurements based on active waveforms.
a Save and recall waveform data.
What the
Agilent
14565A
Will Not Do
The Agilent 14565A Device Characterization Software does not:
a Control instruments other than Agilent dc sources.
a Provide drivers for other GPIB instruments.
a Operate with Windows 3.1.
System Requirements
PC
32-bit
Platforms
Supported
I/O
Supported
Dc Source
Models
a 486DX66 (minimum)
a 16 Mbytes RAM
a 4 Mbytes of disk space
a Windows 98
a Windows 95
a Windows NT 4.0
a Agilent 82340B, 82341C, 82341D, 82335B
1
a National AT GPIB/TNT, AT GP-IB/TNT PnP (Windows 95)
a RS-232
1
The Agilent 82335B is only supported for Windows 95, provided you have
either the E2094F or E2094E I/O library.
a Agilent 66309B/D
a Agilent 66311A/B/D
a Agilent 66312A/66332A
a Agilent 66319B/D; 66321B/D
3
Page 4
Installing and Running the Software
g
f
p
g
NOTE: Before running the Agilent 14565A application, you must have installed
and connected your dc source to the PC using the appropriate interface
cable. You must also have the appropriate interface card installed and
configured. If you are using an Agilent interface card, you must have
the appropriate 32-bit SICL or VISA library drivers installed.
1. Place Disk #1 in the A: drive of your computer and run SETUP.EXE.
2. Follow the directions on the screen to install the software. The
README.TXT file contains product updates or corrections that are not
documented in the help file. Use any text editor to open and read this file.
3. To run the Agilent 14565A application, click on its desktop icon.
You can also click on the Start button and select:
Programs | Agilent 4565A DCS | Agilent 14565A DCS
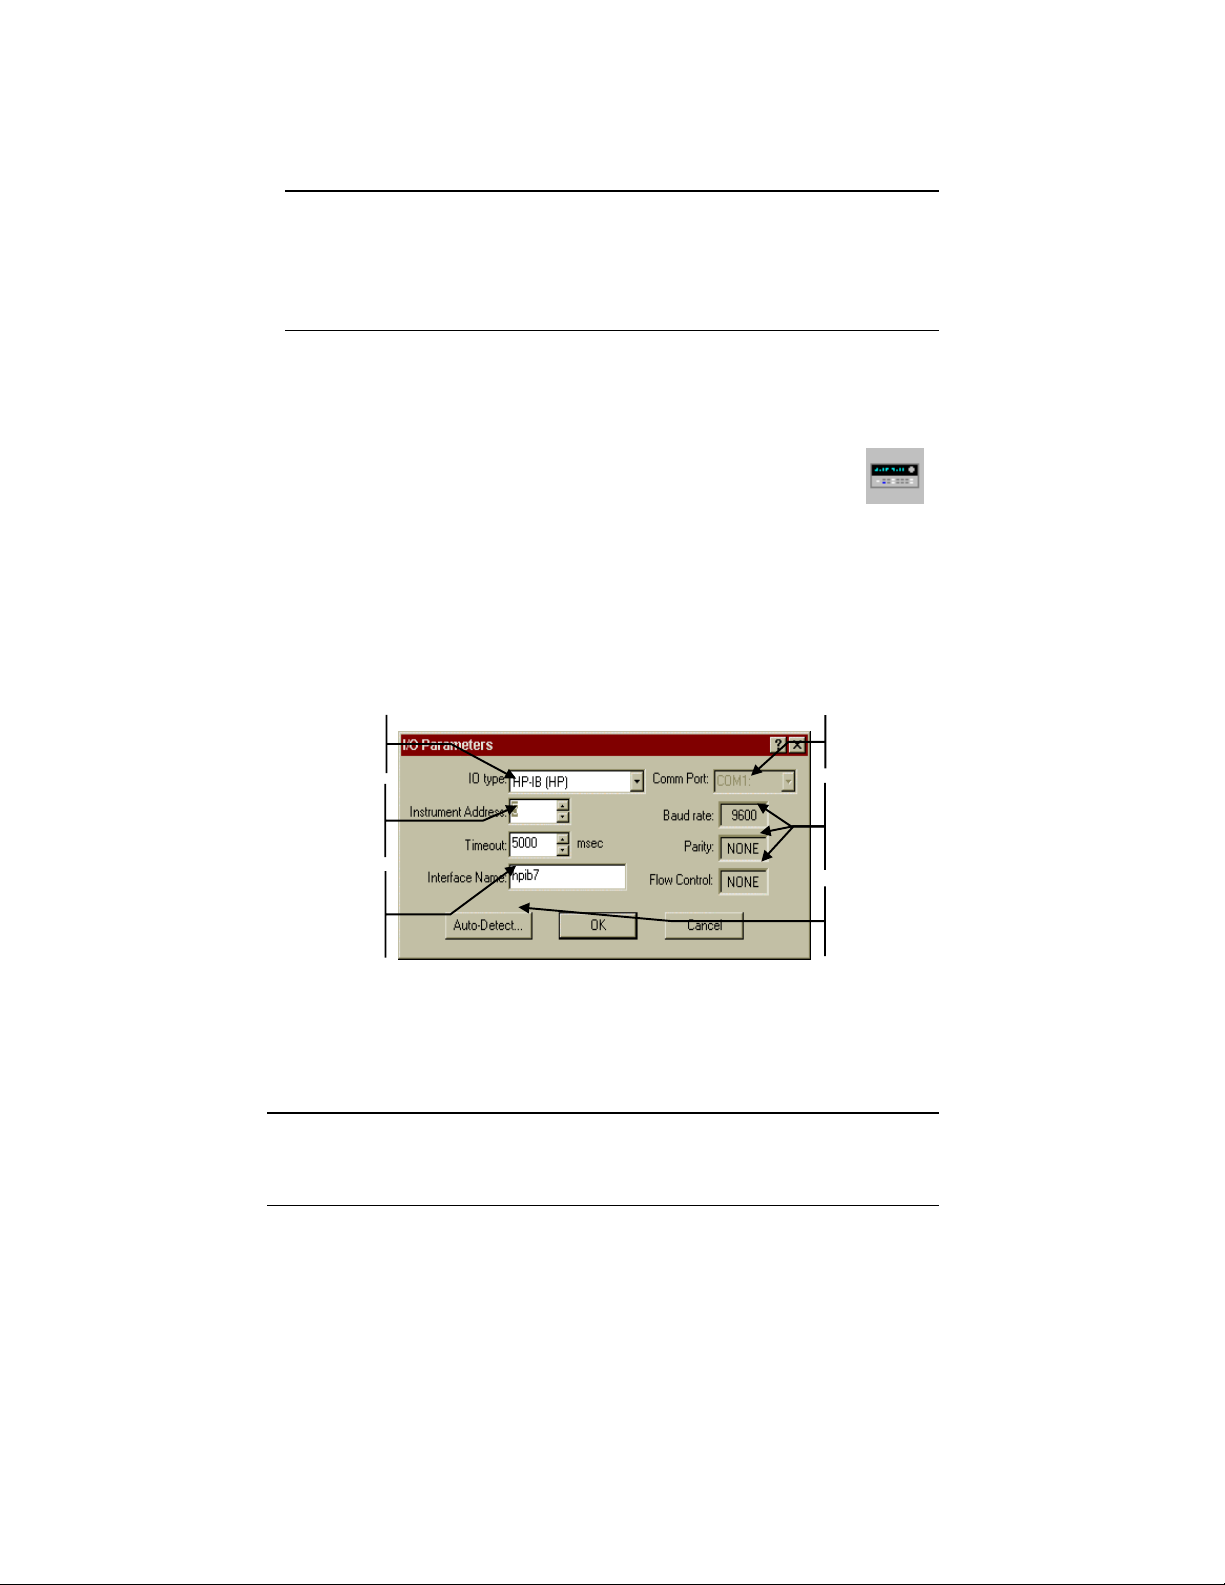
Configuring the I/O
Make sure that the dc source is turned on. To configure the I/O, select the I/O
Configuration command in the Edit menu. This step is necessary to establish
communication with the dc source. The I/O configuration screen comes up
automatically when you turn Simulation mode off in the Source menu.
Note that the serial port is much slower than the HP-IB interface.
Select I/O type.
(HPIB, GPIB,
VISA, or serial)
Serial port only.
Specifies the comm
ort on the PC.
Address must
match setting o
instrument.
(HPIB/GPIB only)
For HPIB cards
only. Must match
SICL name used
in GPIB card’s
confi
uration.
Serial port only. Dc
source must match
these Baud rate,
Parity and Flow
control settin
Click to automatically
search for any dc
source on the
interface.
If there seems to be no communication between the Agilent 14565A application
and the dc source, select Auto Detect to detect any dc sources connected to your
pc. Also, try resetting the I/O interface by clicking the red reset button. This also
resets the dc source to its default settings.
NOTE: If you program the Agilent dc source from the front panel of the unit,
you will need to refresh or update the Agilent 14565A application. Go
to the View menu and select the Reread Instrument State command.
4
s
Page 5
Performing Basic Operations
A
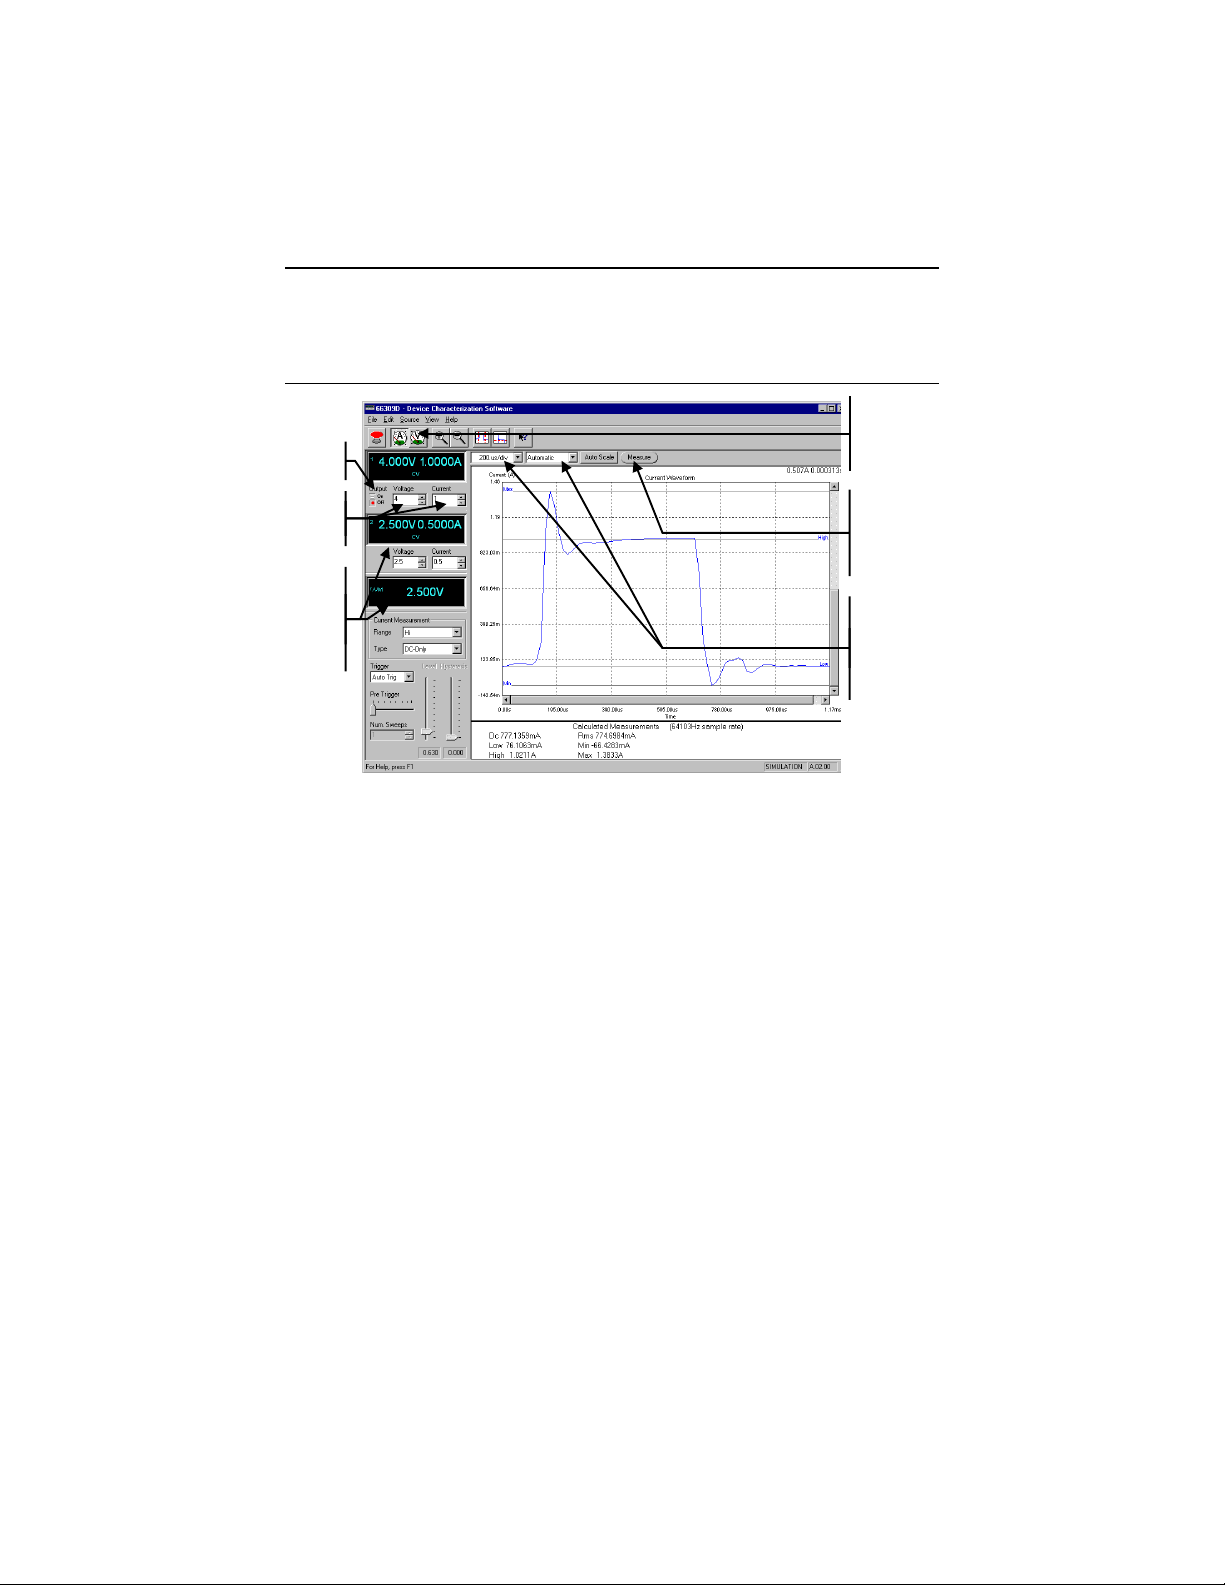
The Main window appears when you run the Agilent 14565A application. From
this window you can control the output of the dc source and view output
measurements.
NOTE: Not all controls are displayed when you initially run the Agilent
14565A application. Output 2 controls are only available on Agilent
66309B/D and 66319B/D. DVM controls are only available on
Agilent 66311D/66309D and 66319D/66321D.
Turn on
output 1.
Enter voltage
and current
for output 1.
Output 2 and
DVM controls
not available
on all models.
Use View menu
to display.
Click V to
measure voltage;
Click A to
measure current.
Click to make a
measurement.
This overwrites
the previous
waveform.
djust values to
vary sample rate
and vertical scale.
Can be done
before or after
measurement.
To display a sample waveform:
a Select the Load Waveform command in the File menu, and then select
DemoWaveform1.txt.
a Select Active Waveform in the Load Waveform Location dialog box. The
waveform should match the one shown in the above figure.
To set the voltage, current, and resistance levels:
a Click in the field labeled Voltage, type in the desired output voltage and
press Enter.
a Enter a current limit value in the field labeled Current.
a For units that have programmable output resistance, enter a resistance value
in the field labeled Resistance.
To turn on the output:
a Enable the dc source output by pressing the ON button. On some models,
each output has its own output control. If the message OVLD appears in
the display, set the Current Measurement control to the Hi Range.
5
Page 6
To make a measurement:
A
A
a Click the A button to select current measurements; click the V button to
select voltage measurements.
a Click the Measure button to make the measurement.
a Adjust the time/div and amps/div fields to adjust the sample rate and vertical
scale. Click Auto Scale to fit the display to the acquired waveform.
To view the output 2 controls and the DVM display:
a If your dc source has a second output or a DVM input, go to the View menu
and check the item that you wish to display.
✔ Second Output
✔ Digital Voltmeter
If the item is greyed out, your dc source does not have this feature.
Display Area
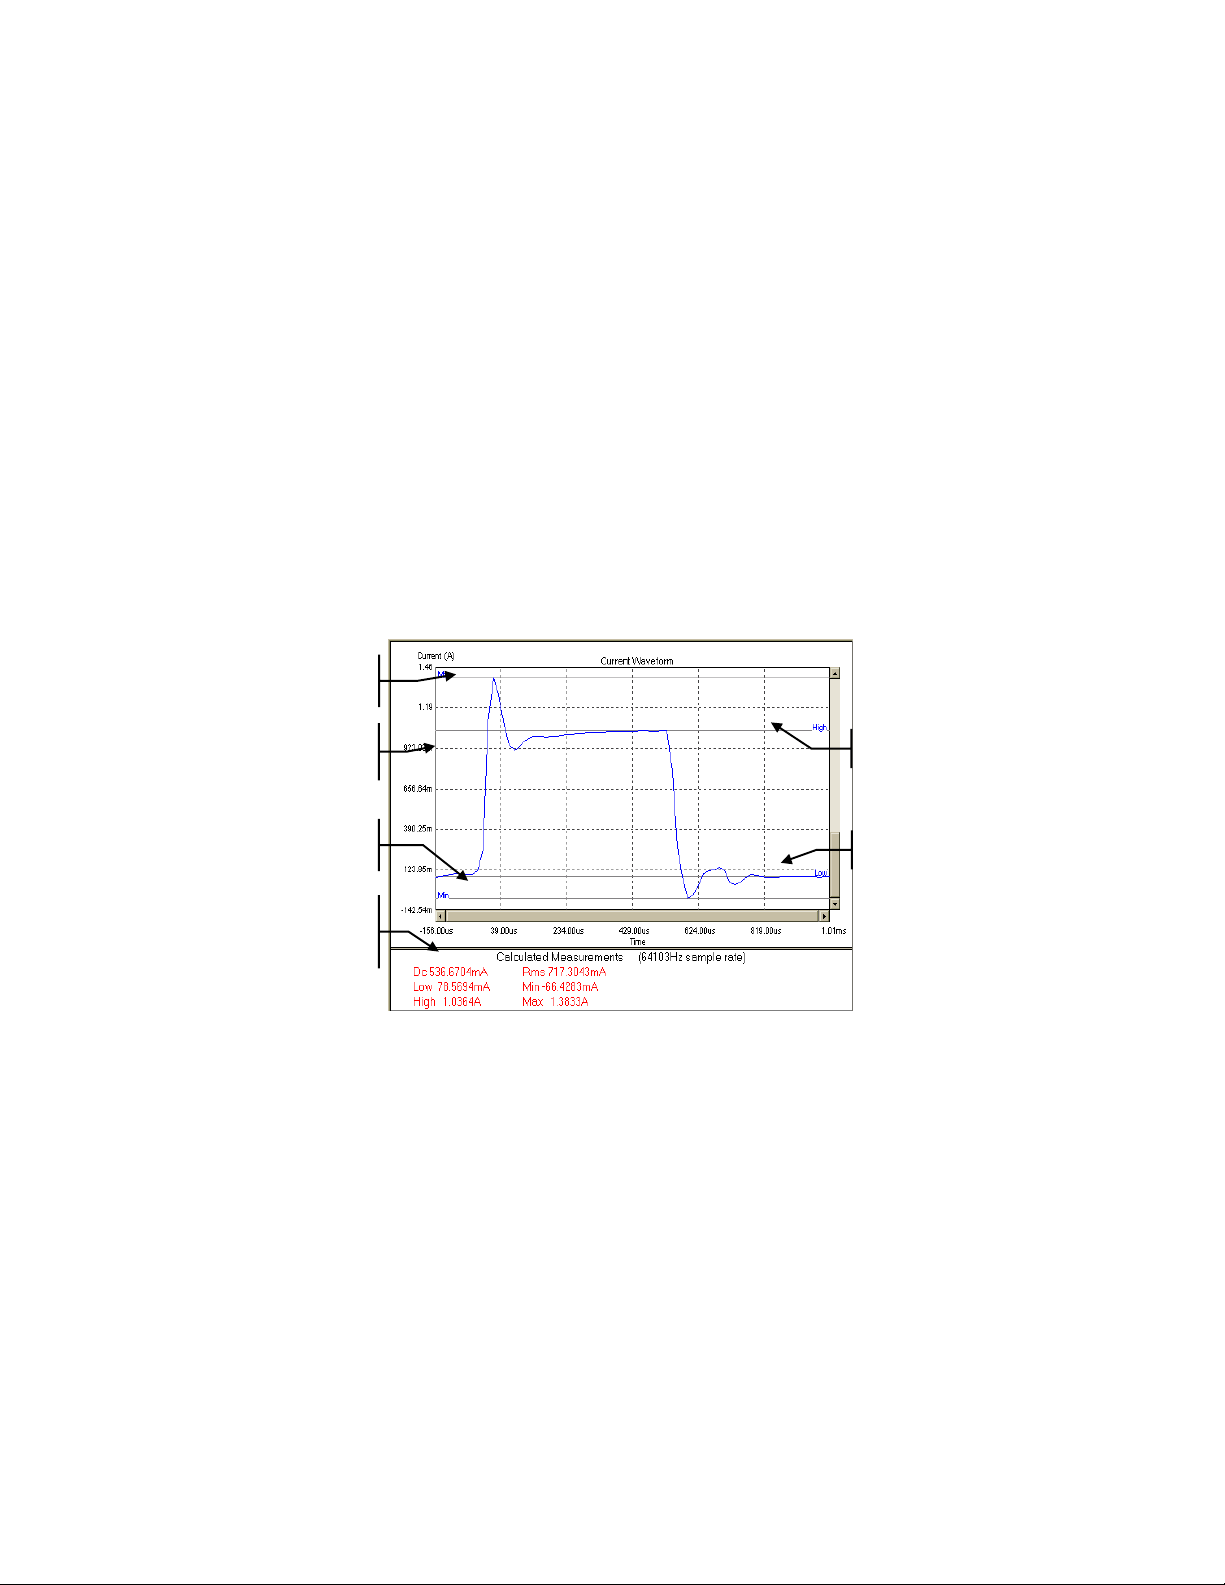
The display area displays the output measurement after the Measure button is
pressed. Only measurements from the main output can be displayed. The
following figure describes the various measurements displayed in the window.
Maximum
measured
value.
Vertical axis
displays
amplitude.
Minimum
measured
value.
Displays the
measurements
calculated from
the waveform.
verage high
level.
verage low
level.
The values in the measurement area at the bottom of the display are calculated
from the all of the data that is captured in the display. If horizontal markers have
been set, measurements are calculated only from the data between the markers.
Refer to Performing Measurements on Waveforms.
Calculated measurements at the bottom of the display may not agree exactly with
values shown on the front panel of the instrument if the sample rate of the
display differs significantly from the instrument’s front panel sample rate.
6
Page 7
Making Triggered Measurements
f
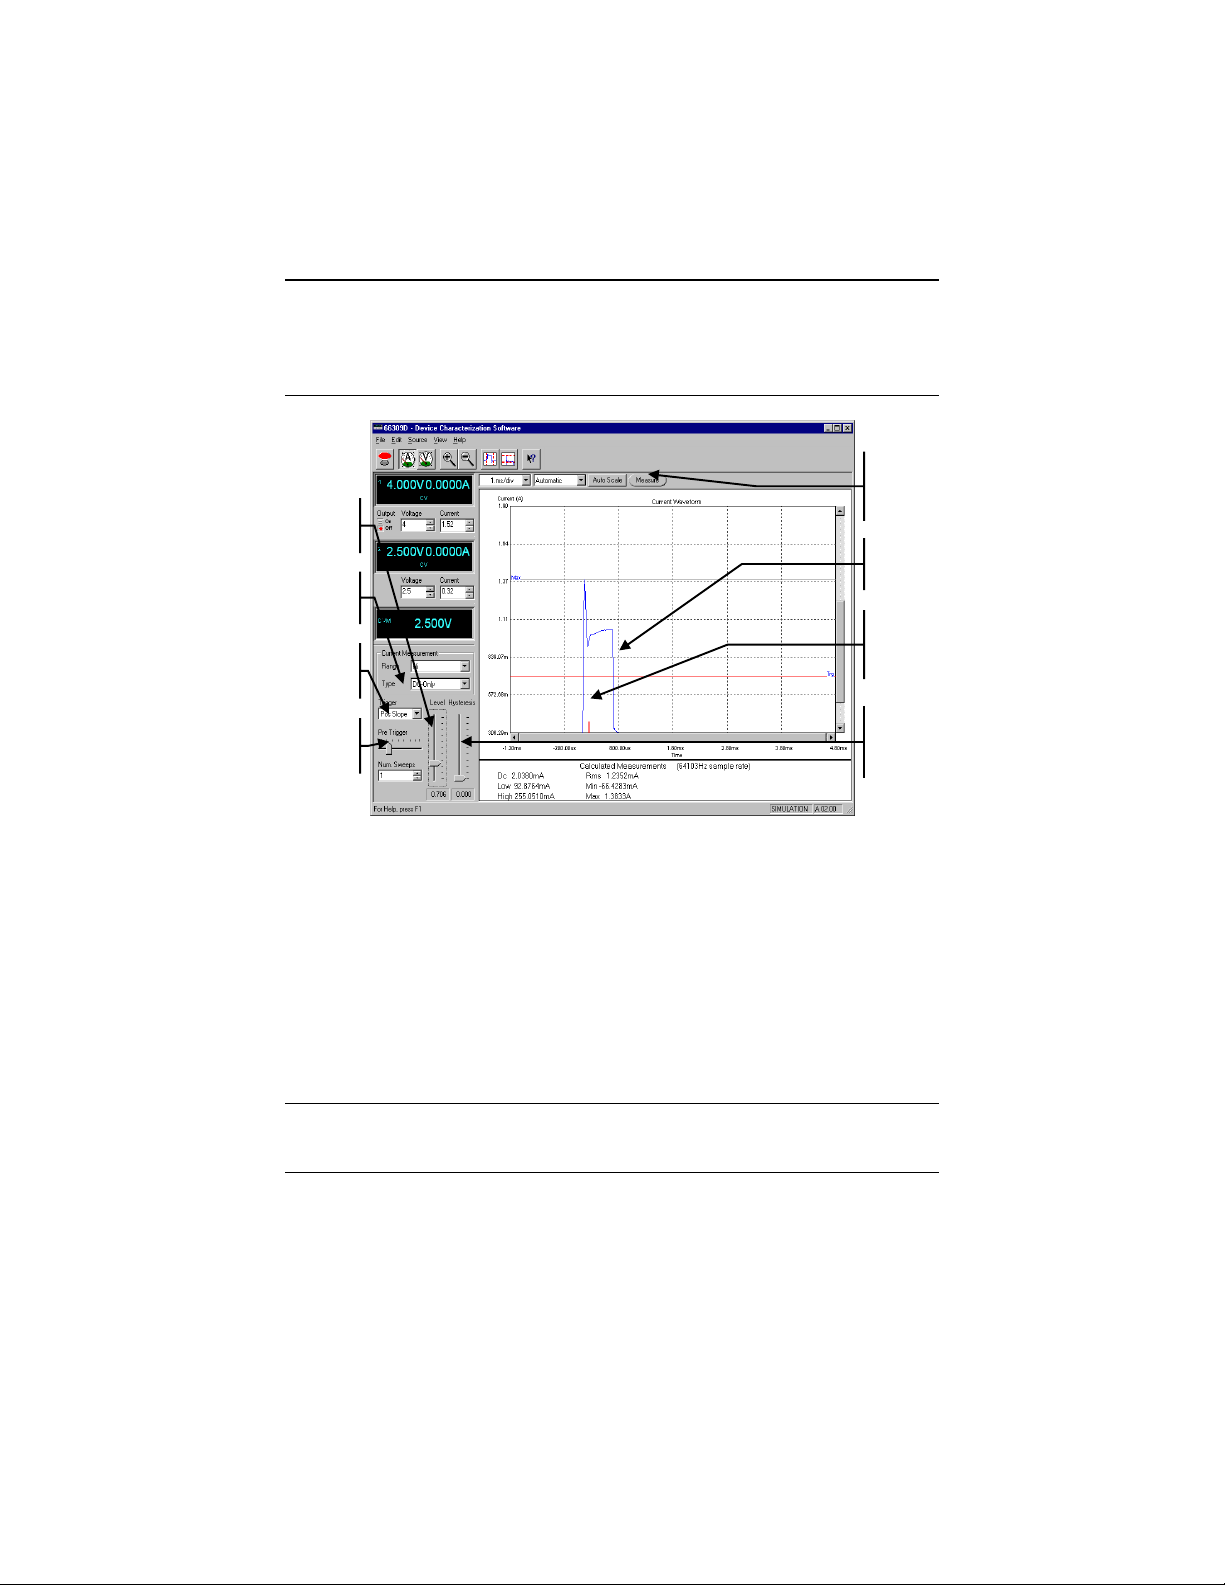
Triggered measurements let you control when the measurement trigger will
occur. The following figure describes the various trigger controls.
NOTE: If you do not know where to set the trigger level, you can make a
measurement with the trigger set to Auto Trig. Then view the
measurement to see where to place the trigger level. Set the trigger
controls and make another measurement.
Move slide to
specify the
trigger level.
Set up the
triggered
measurement
Move slide to
specify a
trigger offset.
Specify # o
sweeps. Refer
to online help.
Click to
initialize a
triggered
measurement
Trigger level
is identified by
a red line.
Trigger offset
is identified by
a vertical red
line.
Specifies a
hysteresis band
around the
trigger level.
a Click the A button to select current measurements; click the V button to
select voltage measurements.
• Set the time/div control to a value that is appropriate for the load’s transient
timing.
• Select a trigger setting. Choose from Pos Slope, Neg Slope, or Either Slope
to set up the triggered measurement.
• Adjust the Level slide control until the trigger level is at the point where the
trigger should occur. The trigger level is
displayed as a red horizontal line
on the display.
NOTE: The trigger level cannot go negative. Set the trigger control to Auto
Trig to trigger negative waveforms.
• Use the Pre-Trigger control to show pre-trigger waveform information.
When this control is used, the trigger point will be displayed as a short
vertical red line on the bottom of the waveform display graph.
7
Page 8
• To prevent signal noise from triggering a measurement, you can adjust the
Hysteresis slide control to create a hysteresis band around the trigger level.
The hysteresis band is shown in yellow. Triggers cannot occur inside the
hysteresis band.
• Use the Envelope control to more accurately average the High level of
multiple current pulses (refer to the online Help for more information).
• Click the Measure button to initiate the triggered measurement.
• The display should now show the voltage or current waveform starting at the
trigger level.
• Change the amps/div control to adjust the vertical scale or press the Auto
Scale button to maximize the displayed waveform size.
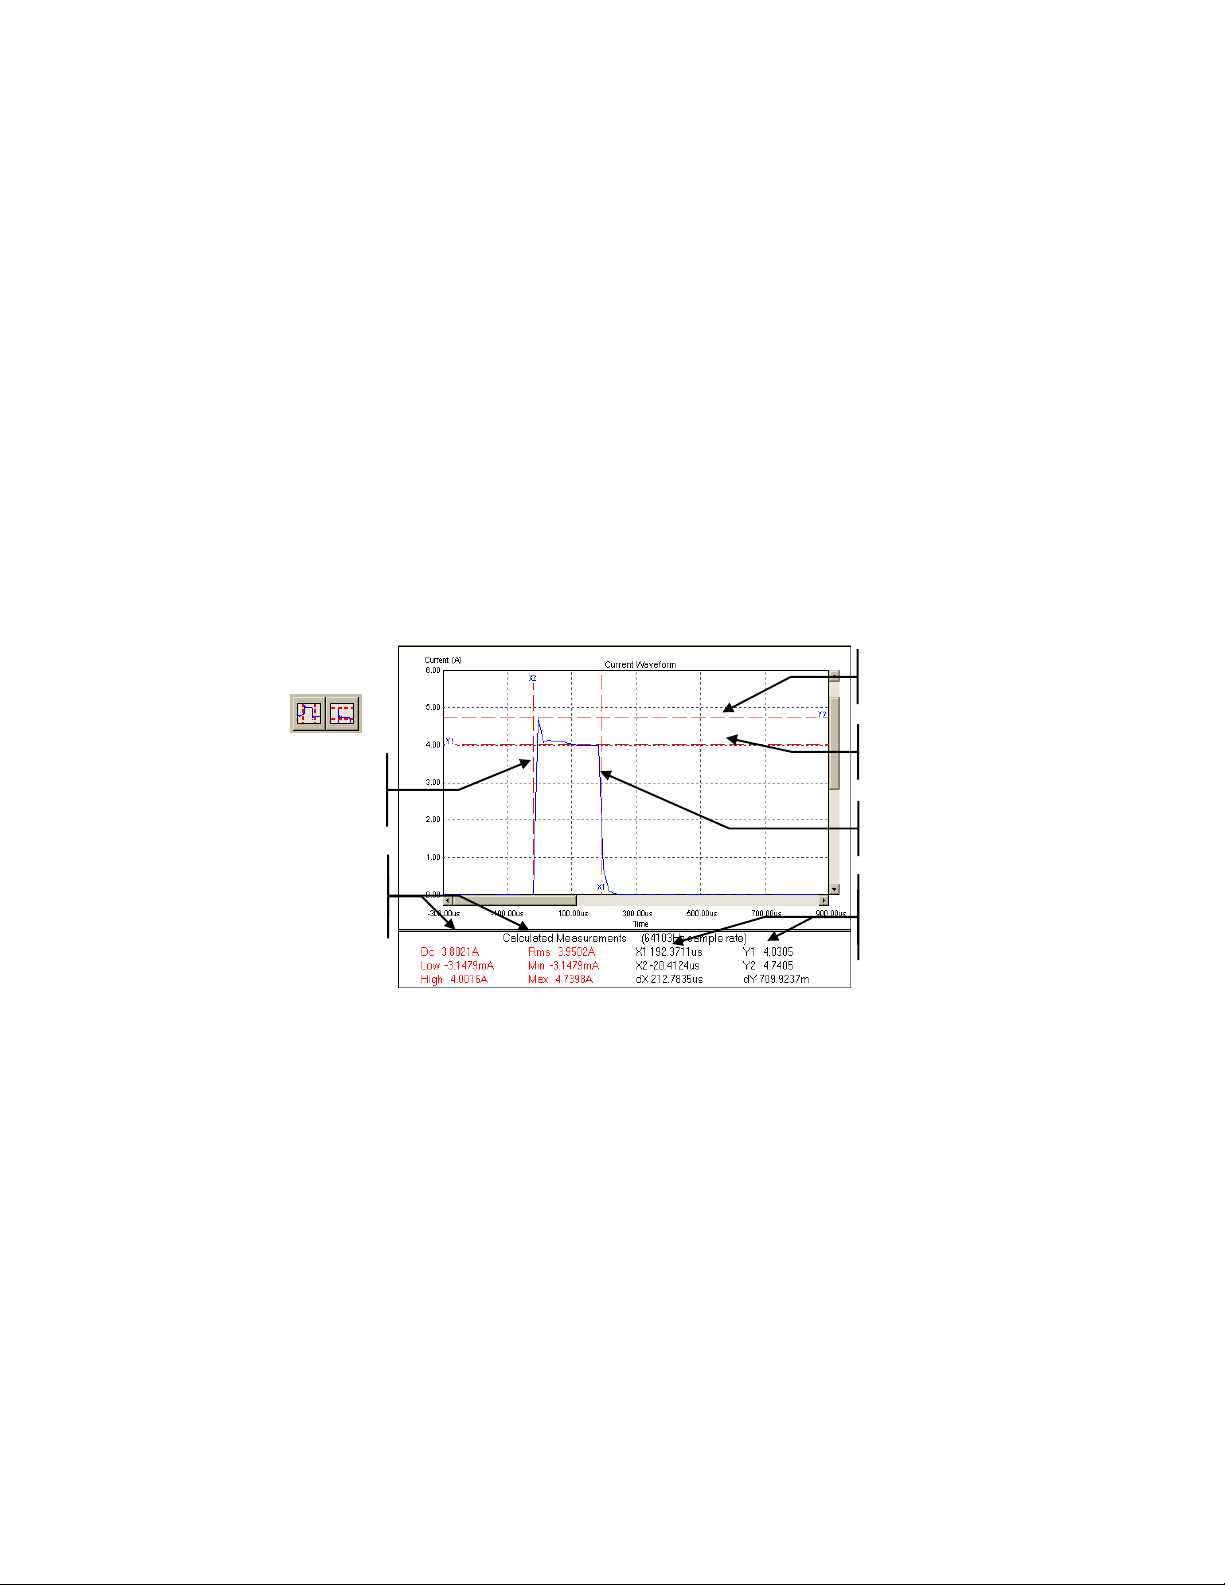
Performing Measurements on Waveforms
Use the marker controls to make precise waveform measurements.
a To view the horizontal and vertical markers, click on the marker buttons on
the toolbar. Use the mouse to position the marker.
To display
markers, click
on
Move X2
marker to left
side of area
of interest.
Calculated
values are based
on data between
X1 and X2
Move Y2
marker to top
of waveform.
Move Y1 m arker
to bottom of
waveform.
Move X1 marker
to right side of
area of interest.
Displays the
location of all
markers and
the separation
between them.
You can also zoom in on a specific area of the waveform. Zooming in only
rescales the display, no calculations are performed in the zoom area.
a To zoom in on a specific area on the display, use either the zoom in button
on the toolbar, use the mouse to draw a rectangle on the display.
a To zoom out, use either the zoom out button or place the cursor in the
display area and right-click on the mouse. Then select Zoom Out.
8
Page 9
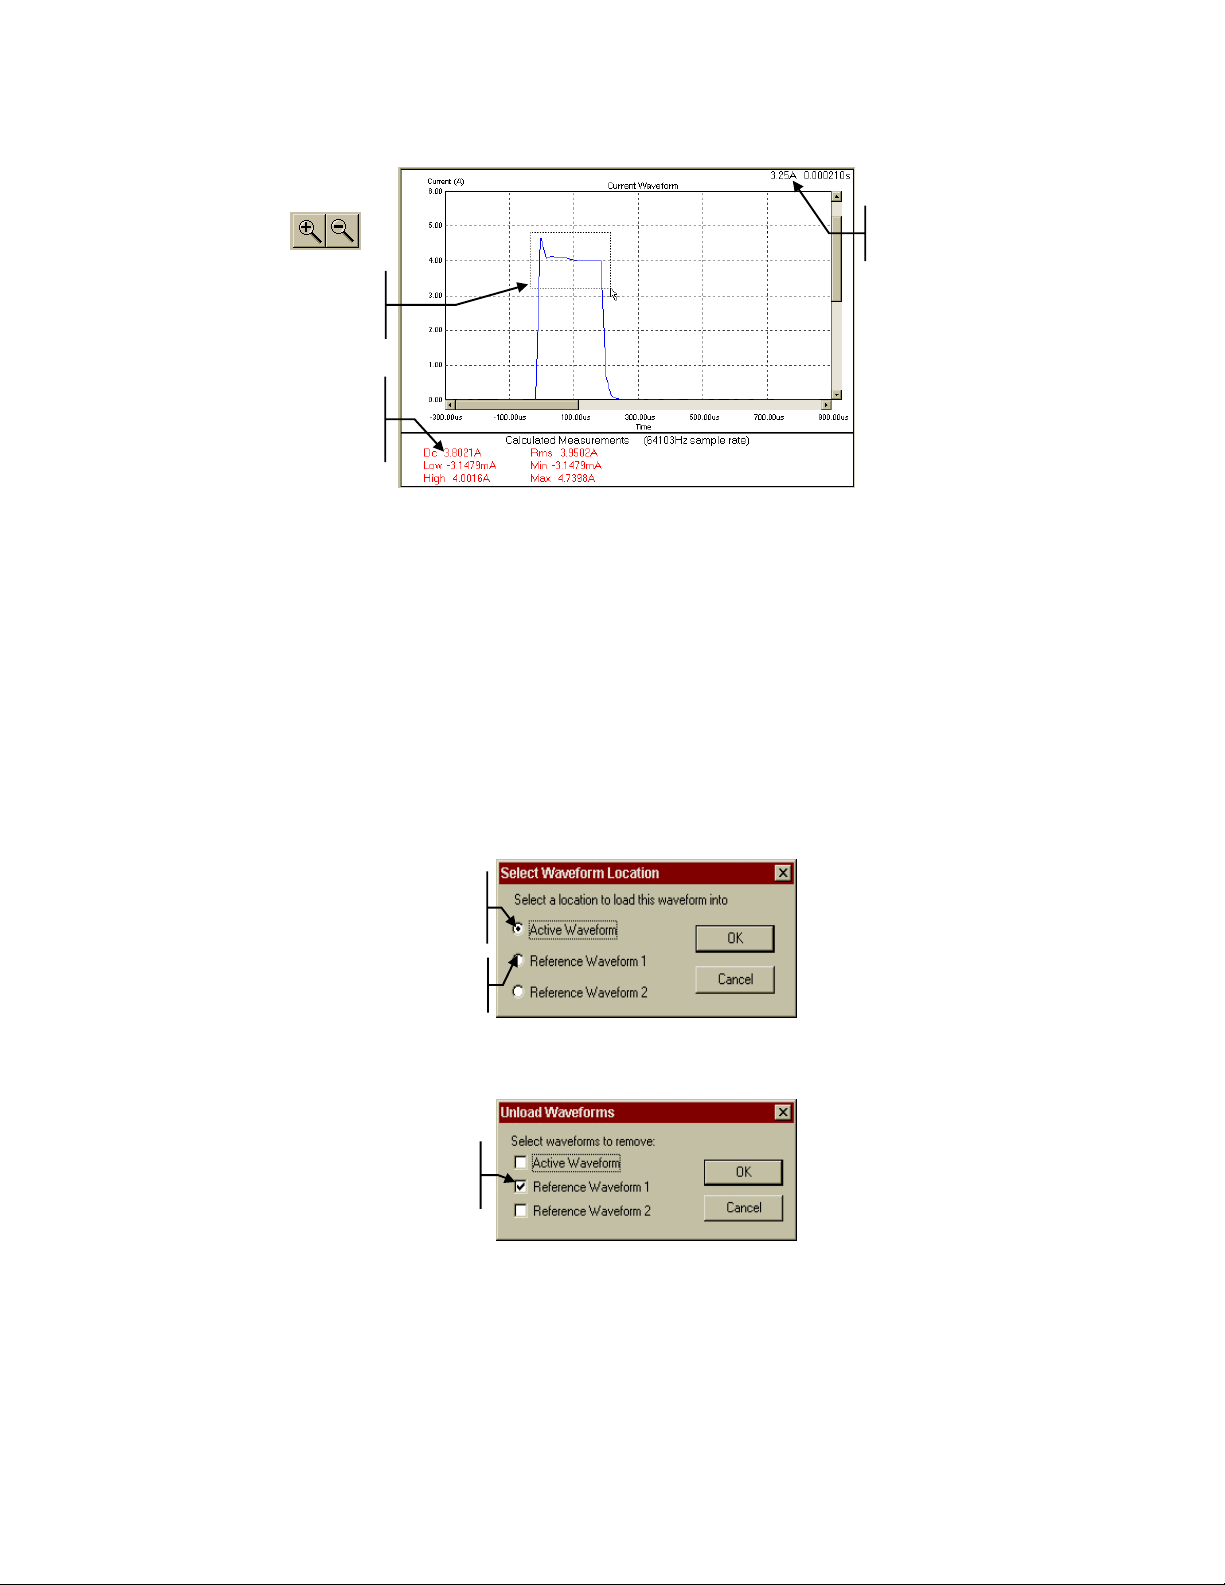
To zoom,
area o
est
either click on
or draw a
rectangle with
the mouse in the
f inter
None of these
measurements
are affected by
the zoom
controls.
.
Indicates
location of
mouse.
Placing a Waveform on the Display
Up to two reference waveforms can be shown on the display along with the
measured or active waveform. This is useful if you want to compare waveform
measurements to a “standard” or reference waveform to make a pass/fail
determination on the measurement. Waveforms are displayed in different colors,
which can be edited by selecting Edit/Preferences. Measurement calculations can
only be done on active waveforms, not reference waveforms.
a Select the Load Waveform command in the File menu to load a waveform.
a Enter the filename of the waveform in the Open dialog box. The default
location for waveforms is C:\ Program Files \ Agilent \ 14565A DCS.
a Select Active Waveform in the Select Waveform Location dialog box only
if you want to perform measurements on the loaded waveform.
Calculations may be performed
on active waveforms.
Clicking Measure overwrites
the active waveform.
Calculations cannot be
performed on reference
waveforms.
a Use the Remove Waveform command in the File menu to remove a loaded
waveform from the display.
Removing a
waveform does not
delete the waveform
9
Page 10
Printing and Saving Measurement Data
The Agilent 14565A application supports printing and print previewing of the
display. Use the Print Preview command in the File menu to preview the
display. Use the Print command to print the display to your default printer.
Use the Save Waveform command in the File menu to save the voltage or
current measurement data to an ASCII text file that you specify in the Save As
dialog box. All of the data points that comprise a waveform are logged in a 2-
column Time/Voltage or Time/Current format. The information can be imported
into a database or spreadsheet, or edited by a text editor. This is useful if you
need to create a reference waveform that you would normally not be able to
create by just taking a measurement.
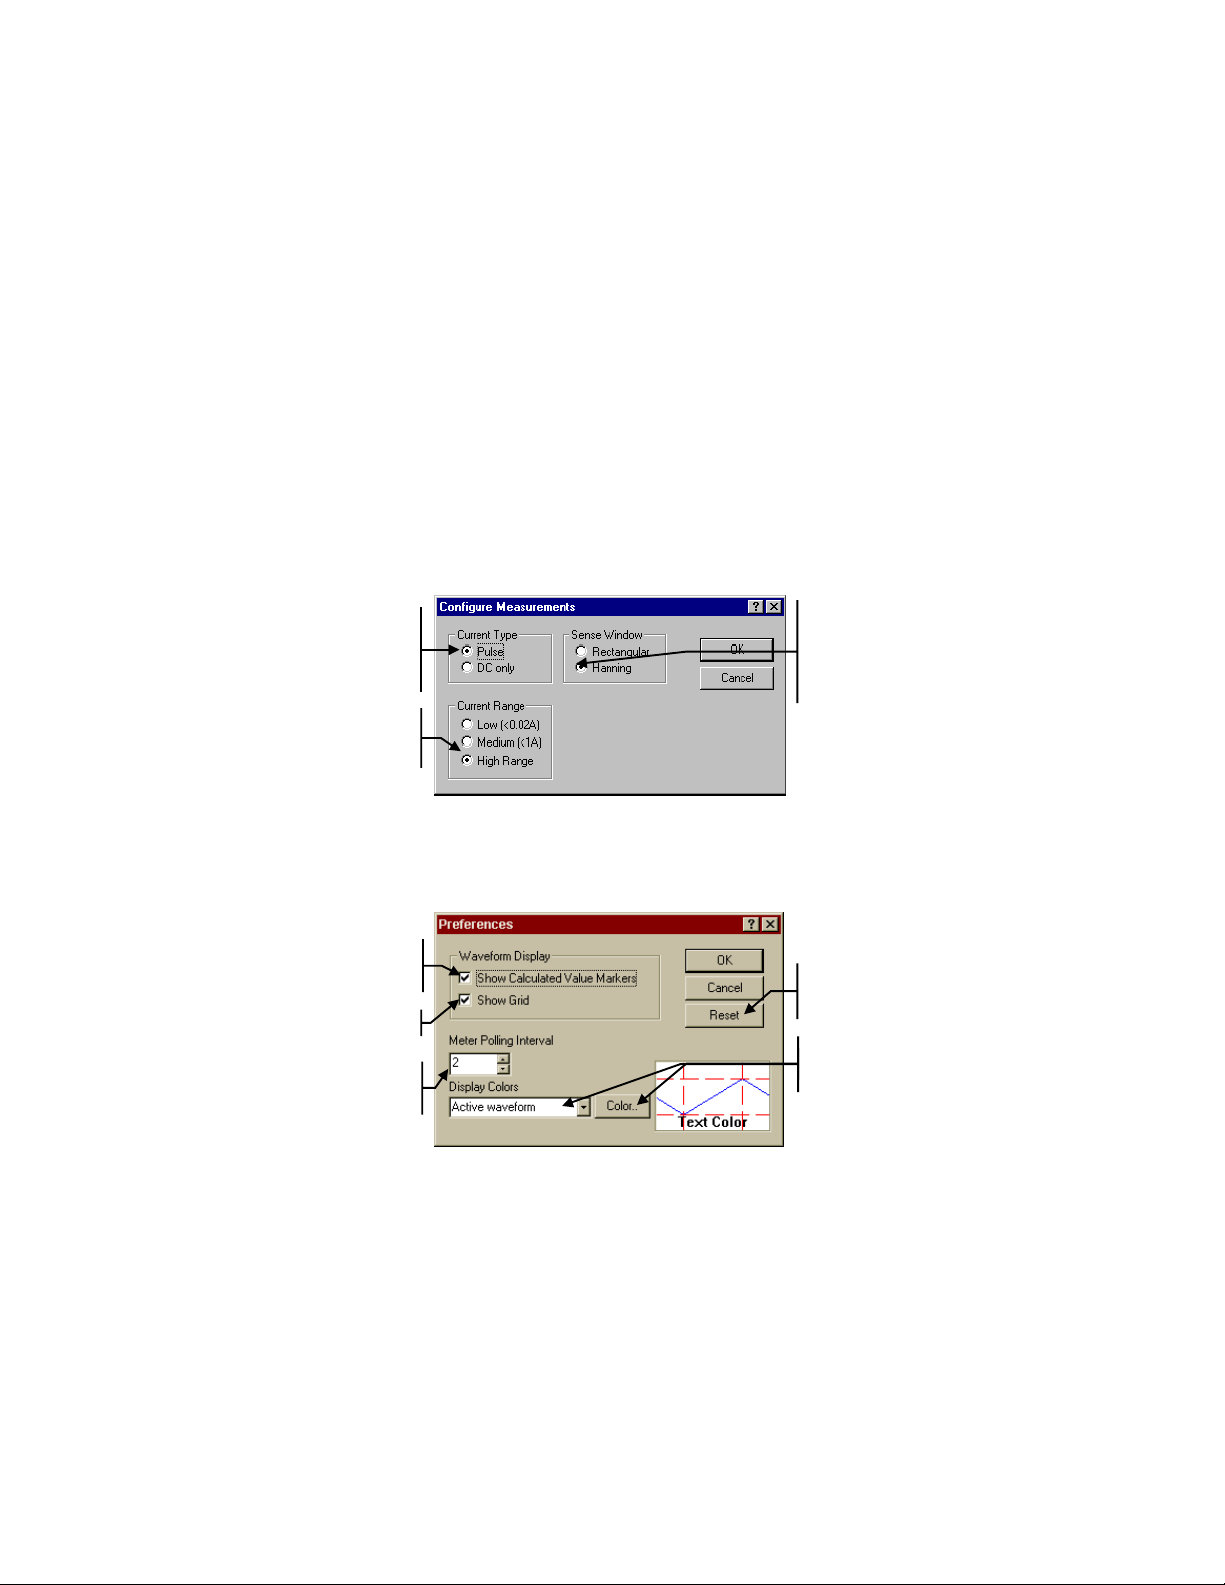
Advanced Measurement Settings
To configure output measurements, select the Measurement Settings command
in the Source menu.
Selects the current
type. Use Pulse for
waveforms. Refer to
the on-line help for
more information.
Selects low, medium,
or high current range
measurements.
Selects the
windowing function
for measurement
calculations. Refer to
the on-line help for
more information.
Display Preferences
To configure display preferences, select the Preferences command in the Edit
menu.
Displays Min, Max,
High and Low
waveform markers.
Displays gridlines.
Specify update rate
of voltage and
current meters.
Returns the
settings to the
factory default
Use these controls to
select and change
waveform colors.
10
Page 11
Source Settings
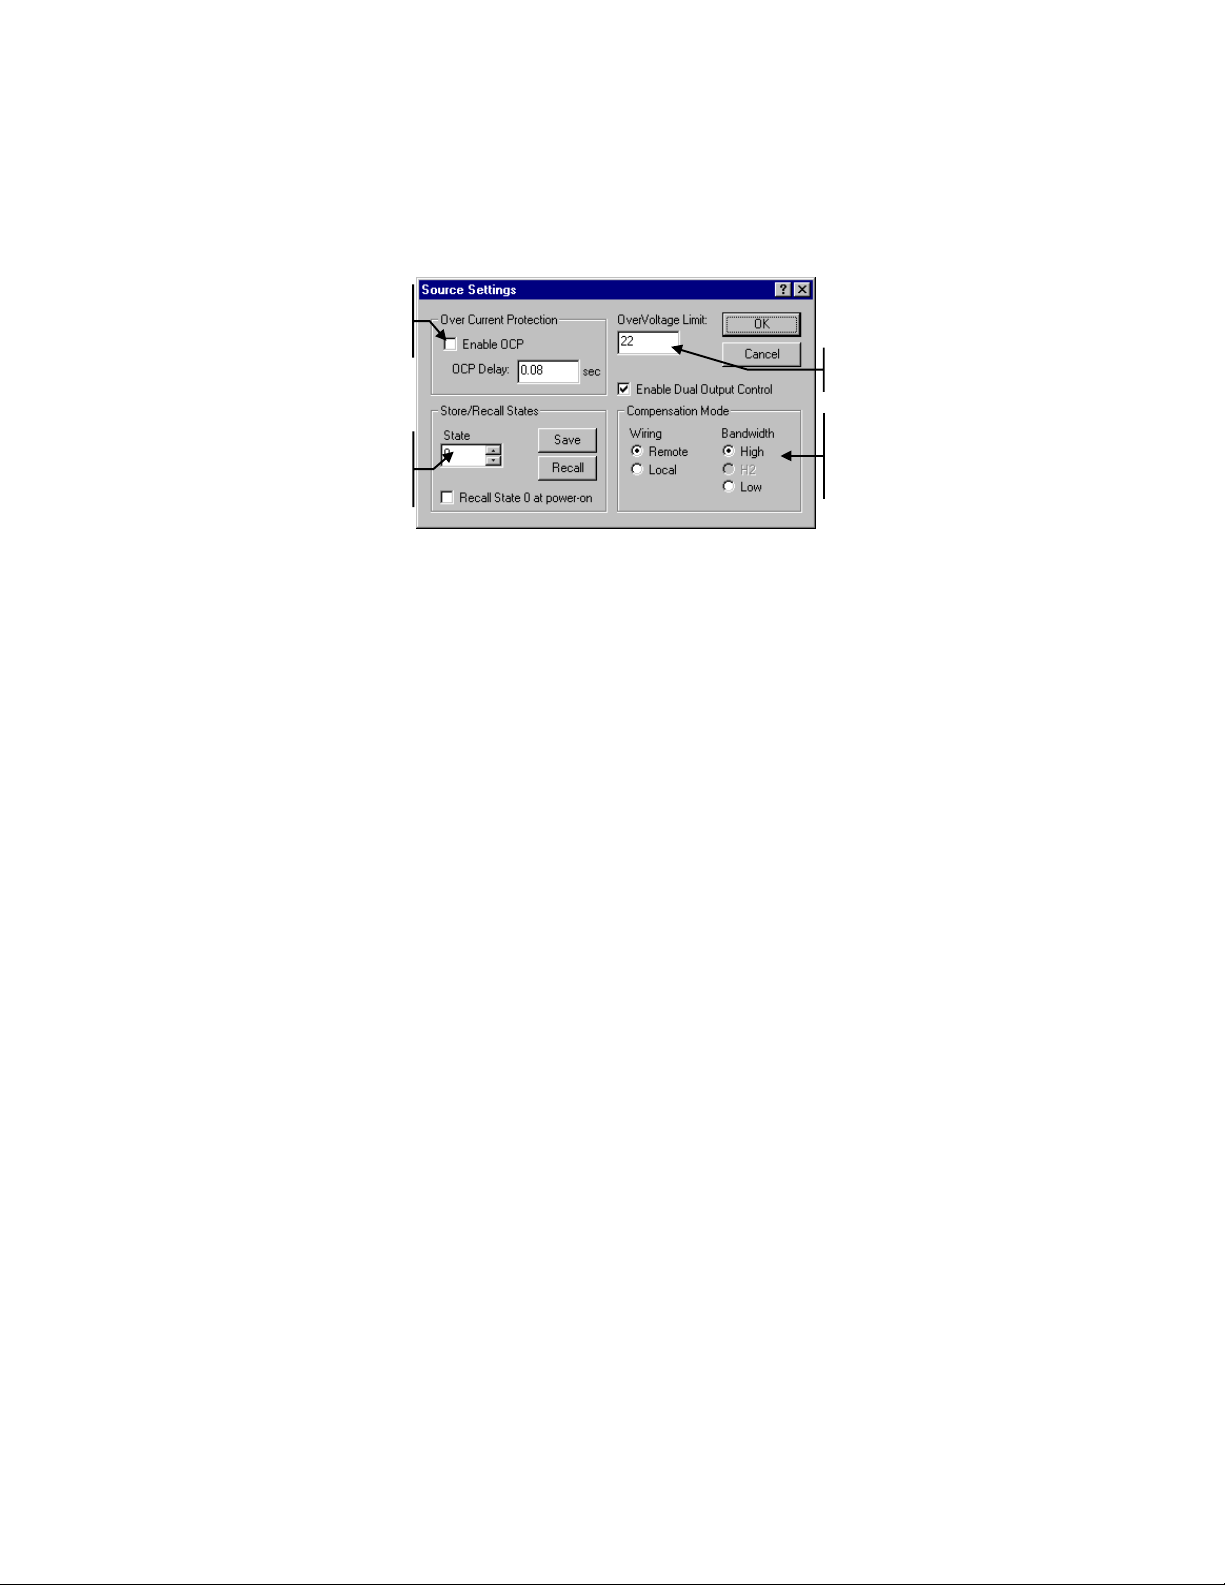
To display the protection settings of the dc source that is presently being
controlled, select the Source Settings command in the Source menu.
Enables overcurrent
protection and sets
overcurrent
protection delay.
Save or recall
instrument states
in non-volatile
memory.
Displays overvoltage
limit settings.
Specify a compensation
mode based on wiring
and output bandwidth.
Refer to the on-line help
for more information.
Sample Waveforms
Several sample waveforms are provided with the Agilent 14565A application. If
you do not have a dc source connected to your PC, you can still become familiar
with the application by trying out the various display functions using the sample
waveforms. Use the Load Waveform command in the File menu to load one of
the sample waveforms.
DemoWaveform1.txt
This waveform is a single transmit current pulse from a cellular phone. It clearly
shows the location of the Max, High, Min, and Low measurement points.
DemoWaveform2.txt
This waveform is also a single transmit current pulse from a cellular phone. Its
main features are the multiple low-level signals. Note that the High and Low
levels of the waveform are based on the two portions of the measurement (out of
a total of 1024 equally divided portions), that have the most high or low points -
and that include at least 1.25% of the total measurement points.
DemoWaveform3.txt
This waveform includes three transmit current pulses from a cellular phone. Note
that in this case, the High and Max values are the same. This is because no
portion of the measurement above the 50% point includes at least 1.25% of the
total measurement points.
11
Page 12

Warranty
This Agilent Technologies software product is warranted against defects in materials and
workmanship for a period of 90 days from date of delivery. During the warranty period,
Agilent Technologies will, at its option either repair or replace parts which prove to be
defective.
Agilent Technologies makes no express or implied warranty of any kind, including, but
not limited to the implied warranties of merchantability or fitness for a particular
purpose, with regard to the program material contained herein. Agilent Technologies
shall not be liable for incidental or consequential damages in connection with or arising
out of the furnishing, performance, or use of this software.
Use of the supplied manual and software is restricted to Agilent Technologies ac source
products only. The software is copyrighted and may not be copied except for archival
purposes, to replace a defective copy, or for program error verification. Agilent
Technologies warrants that this software designed for use with a personal computer, will
execute its programming instructions when properly installed on that personal computer.
Agilent Technologies does not warrant that the operation of the personal computer ,
software, or ac source will be uninterrupted or error free.
Limitation of Warranty
The foregoing warranty shall not apply to defects resulting from: misuse, unauthorized
modification, operation or storage outside the environmental specifications for the
product, in-transit damage, improper maintenance, or defects resulting from use of non-
Agilent Technologies software, accessories, media, or such items not designed for use
with the product.
Notice
This document contains proprietary information protected by copyright. All rights are
reserved. No part of this document may be photocopied, reproduced, or translated into
another language without the prior consent of Agilent Technologies. The information
contained in this document is subject to change without notice.
Copyright 1998, 1999, 2000 Agilent Technologies, Inc.
Windows is a registered trademark of Microsoft Corporation.
Manual part number: 5962-8293 Printed in USA, March 1999
Updated May, 2000
 Loading...