


HP 54750A
High-Bandwidth
Digitizing Oscilloscope
Product Overview
The HP 54750A is a modular
system designed to meet the
stringent demands of today’s
engineers. Up to four highbandwidth channels and time
domain reflectometry (TDR) are
supported by the mainframe. The
modular design allows for expansion to meet changing needs.
The HP 54750A high-bandwidth
digitizing oscilloscope offers the
highest throughput and richest
feature set in the industry. An
engineer’s time is maximized by
more than 50 built-in parametric
measurements. Fast acquisition
and processing provides exceptional speed in both front panel
operation and in automated test
systems controlled by computers.
The 20-GHz or 50-GHz bandwidth
and the low-noise specifications
allow very precise measurements
on low-level, high-speed signals.
Timebase stability, accuracy, and
resolution allow characterization
of jitter in the most demanding
applications.
The Features and
Speed You Expect in a
High-Bandwidth
Digitizing Oscilloscope
Time domain reflectometry
(TDR) measurement

_____________________________________________________________________________
Time Base (Horizontal)
_____________________________________________________________________________
Scale Factor (Fullscale is 10 divisions)
Minimum 10 ps/division
Maximum 1 s/division
_____________________________________________________________________________
Delay (Time offset relative to trigger)
Minimum 22 ns
Maximum 1000 screen diameters or 10 seconds,
whichever is smaller
_____________________________________________________________________________
Time Interval ≤ 10 ps ±0.1% of reading
Accuracy (Dual marker measurement)
_____________________________________________________________________________
Time Interval ≤ (screen diameter) / (record length)
Resolution or 62.5 fs, whichever is larger
_____________________________________________________________________________
Trigger-External Input Only
_____________________________________________________________________________
Sensitivity
dc to 100 MHz 40 mV peak-to-peak
100 MHz to 2.5 GHz Increasing linearly from 40 mV at 100 MHz
to 200 mV at 2.5 GHz
_____________________________________________________________________________
Pulse Width Required >200 ps
_____________________________________________________________________________
Pulse Amplitude Required >200 mV
_____________________________________________________________________________
Bandwidth Trigger bandwidth reduced to
Limit approximately 100 MHz
_____________________________________________________________________________
Jitter
(trigger and ≤ 2.5 ps + 5E-5 x delay setting
time base (Tested using a 2.5-GHz synthesized source
combined) at 200 mV)
(one standard deviation)
_____________________________________________________________________________
Trigger Input:
Maximum safe ±2 Vdc
Input Voltage
Nominal 50 Ω
Impedance
Percent Reflection ≤ 10% for 100-ps rise time [1]
Connector 3.5mm (m)
_____________________________________________________________________________
Calibrator Adjustable Output range: –2.5 V to +2.5 V
when terminated into 50 Ω
Output Delta Voltage Accuracy:
±(0.2% of settings)
_____________________________________________________________________________
[1] With non TDR plug-ins, ≤10% for 200 ps rise time with TDR plug-ins (HP 54754A and 54755A).
HP 54750A Mainframe Specifications
• 62.5-fs Resolution
• 10-ps Accuracy
______________________________
Channels (Vertical)
______________________________
Scale Factors: Adjustable from 1 mV/div to
100 mV/div in a 1-2-5-10 sequence from the
front panel knob or the INC/DEC keys. Also
adjustable over the range in 0.1-mV increments
from the numeric keypad.
Attenuation Factors: Factors may be entered to
scale the oscilloscope for external attenuators
connected to the channel inputs. The range is
from 0.0001:1 to 1,000,000:1.
Noise: Averaging reduces noise by 1/(n)
1/2
,
where nis the number of averages, until a
system limitation of approximately 25 µV (low
BW mode) or 50 µV (high BW mode) is reached.
Channel-to-channel isolation: >60 dB
Bandwidth: You may select between a high
(20 GHz/50 GHz) or low (12.4 GHz/26.5 GHz)
bandwidth mode. The sampler is biased
differently for the two modes. Typically high
and low bandwidth noise is ~1/2 the specified
maximum noise.
Time Base (Horizontal)
______________________________
Delay Between Channels: The difference in
delay between channels can be nulled out with
1-ps resolution to compensate for differences
in input cables or probe length. Up to 100 µs of
skew can be nulled out.
Reference Location: The reference point can
be located at the left edge or center of the display. The reference point is the point where the
time is offset from the trigger by the delay time.
The reference point is also the point that the
time base sensitivity expands and contracts
around as the time base is changed.
Triggered Mode: Causes the scope to trigger
synchronously to the trigger input signal.
Freerun: Causes the scope to generate its
own triggers.
HP 54750A
System Characteristics
2
Electrical Channels Optical Channels (Available with HP 83480K Firmware Upgrade)
Sensitivity
Unfiltered BW Number Data Rates Fiber (smallest power
Number Bandwidth GHz GHz (typical) of Filters Mbit/s Input Type Wavelength for mask test)
HP 54751A 2 12 or 20
HP 54752A 2 26.5 or 50
HP 54752B 1 26.5 or 50
HP 54753A 1 TDR/1 Electrical 12 or 18
1 Electrical 12 or 20
HP 54754A 2 TDR/2 Electrical 12 or 18
HP 83481A 1 12 or 20 2.5 (>3.0) 2 155 and 622 9/125 µm 1000 to 1600 nm –17 dBm
HP 83482A 1 18 or 40 30 9/125 µm 1000 to 1600 nm
HP 83485A 1 12 or 20 20 1 155/622 or 2488 9/125 µm 1000 to 1600 nm –10 dBm
HP 83485B 1 18 or 40 1 9953 9/125 µm 1000 to 1600 nm –8 dBm
HP 83486A 1 12 or 20 2.5 (≥2.7) 2 155/622 or 62.5/125 µm 1000 to 1600 nm –19 dBm
1063/1250
HP 83487A 1 12 or 20 2.5 (>2.7) 2 1063/1250 62.5/125 µm 750 to 870 nm –17 dBm
Plug-In Modules for the HP 54750A

Measurements
Vamptd freq
Vbase Tfall
Vtop Trise
preshoot Tmax
overshoot Tmin
Vp-p Tvolt
Vtime Vavg
Vmin Vupper
Vmax Vmiddle
Vrms Vlower
+width FFTfreq
-width FFTmag
duty cycle FFT delta freq
delta time FFT delta mag
period TDR min reflection
TDR max relection
TDT prop delay
TDT gain
Histograms
p-p
median
mean
std dev
µ ± 1 sigma
µ ± 2 sigma
µ ± 3 sigma
hits
peak
Limit Test
Signals can be tested by up to four automatic
parametric measurements and compared to
user-defined test boundaries. Failures tolerances can be selected independently for each
of the parametric tests.
On failure actions:
1) Save channel data to memory,
disk or printer
2) Save screen to pixel memory,
disk or printer
3) Save a text log summary of all
failures with time tagging to disk or
printer.
Limit test can be set to run continuously for a
user-selected number of waveforms, or for a
defined number of failures.
Mask Test
Acquired signals are tested for fit outside
areas defined by up to eight polygons. Any
samples that fall within the polygon boundaries result in test failures. Masks can be
loaded from disk, HP-IB, or created
automatically or manually.
HP 54750A
System Characteristics (cont’d)
Typical Timing Accuracy: The time base uses a
series of 4-ns blocks. Time base linearity and
small discontinuities across these blocks contribute to the 8-ps accuracy specification.
When operating within 4 ns blocks, the typical
accuracy is shown by the following graph. The
graph below is a result of many measurements
on multiple instruments.
Because averaging implies single-valued
waveforms, the Best Flatness control takes
advantage of this to further improve flatness.
This is done by taking a sample with the samplers turned on and then with samplers turned
off. The two results are then subtracted, thereby removing the residual nonflatness.
Display Colors: You may choose a default color
selection, or select your own colors from the
front panel, or via HP-IB. Different colors are
used for display background, channels, functions, background text, highlighted text, advisories, markers, overlapping waveforms, and
memories.
Documentation Aids
_____________________________________
Waveforms, scaling information, and measurement results can be transferred directly to
HP-IB or Centronics graphics printers.
Waveforms may also be stored on the internal
MS-DOS®compatible disk in PCX or TIFF
format. This allows moving screen data into
word processors for documentation.
Programmability
_____________________________________
Instrument settings and operating modes,
including automatic measurements, may be
remotely programmed via HP-IB (IEEE 488.2).
HP-IB programming complies with the recommendations of the IEEE 488.2 standards. The
HP 54750A can be programmed to take data
only at specified time points, or to return only
measurement results (such as, tr, tf, and frequency) to speed up data acquisition.
Data Transfer Rate: 550 Kbytes/s typical.
Measurement Times: 25 automatic measure-
ments per second typical.
Data Record Length: 4k points maximum per
channel.
Measurement Aids
_____________________________________
Markers: Dual voltage or time markers can
be used for a variety of time and voltage
measurements. Voltage markers can be
assigned to channel data, measurements, functions, FFTs, histograms, color-graded displays,
and memories.
Automatic Pulse Parameter Measurements
Functions
magnify differentiate
invert min
add max
subtract FFTmag
multiply histograms
divide measurement limit testing
versus waveform mask testing
integrate color-graded display
bw limit
Histogram of 274 Measuremets of
50 ps Time Interval that Crossed
the 4 ns Sweep Disontinuity
Mode on Five HP 54750 Systems
all at 10 ps/div
Average Error = 0.4 ps
Standard Deviation = 1.82 ps
Histogram of 236 Measurement
on Four kHP 54750 Systems of
50 ps time Interval that did not
Cross the 4 ns Discontinuity.
All at 10 ps/Div.
Average Error = 0.2 ps
Standard Deviation = 0.15 ps
Time Interval Error
10 8 6 4 2 0 -2 -4 -6 -8 -10
Trigger
_____________________________
Edge Trigger: Triggers on the positive or nega-
tive edge of the trigger input.
Hysteresis: The trigger hysteresis can be set to
two modes:
Normal— the trigger hysteresis is set so
the instrument meets the trigger sensitivity
specification.
High Sensitivity — hysteresis is turned
off to allow a best sensitivity to highfrequency signals. This mode should not
be used for noisy lower frequency
signals that may mistrigger without
hysteresis.
BW Limit: Puts the trigger signal through a
low-pass filter of approximately 100 MHz.
Display
_____________________________________
Data Display Resolution: 451 points
horizontally x 256 points vertically.
Graticules: You may choose full grid, axes with
tic marks, frame with tic marks, or no graticule.
Display Modes
_____________________________________
Averaging: The number of averages can be
specified between 1 and 4096 using the numeric keypad. The INCrement/ DECrement keys or
the knob will set averaging to 1, 2, 4, 16, 64, 256,
1024, 4096. On each acquisition, 1/ntimes the
new data is added to (n-1)/nof the previous
value at each time coordinate.
Best Flatness: The samplers used in the
HP 54750A system have a certain amount of
passive feedthrough. This feedthrough is
corrected by a compensation circuit. A small
amount of feedthrough does remain after
compensaton and this causes slight
nonflatness in the step response.
3

Data collected during test:
Total number of waveforms examined
Number of failed waveforms
Total number of samples taken
Number of failed samples
Number of hits within each polygon
boundary
Auto Mask Creation
Masks are created automatically for singlevalued voltage signals. Both delta X and delta
Y tolerances can be specified.
The failure actions are identical to those
of Limit Testing. Both mask testing and
limit testing may be used independently or
simultaneously.
FFT
Up to three fast Fourier transforms can be
run simultaneously. The three built-in filters
(Hanning, rectangular, and flattop) allow optimization of frequency resolution, transients,
and amplitude accuracy. Automatic measurements can be made on frequency, delta
frequency, magnitude, and delta magnitude.
Frequency Span = Sample rate /2 = record
length/(2 * time base range)
Frequency Resolution =
Time base range/record length
Color Graded Display
Infinite persistence display mode where color
differentiates the number of times any individual pixel has been acquired. All points
acquired are added to a database and then
displayed as one of eight colors depending
upon the frequency of acquisition.
Automatic parametric measurements may be
taken on the Color-Graded Display allowing
parametric evaluation of multivalued (eye
diagram) waveforms.
Autoscale: Can find repetitive signals:
> 50 Hz
duty cycle > 1%
amplitude > 10 mV p-p vertical
50 mV p-p trigger
Waveform Math: Two functions can be
specified and displayed. Functions may be
defined as:
magnify versus
invert integrate
add differentiate
subtract minimum
multiply maximum
divide fft magnitude
Waveform Save: Four waveforms may be
stored in four nonvolatile memories. They
may also be stored to the internal MS-DOS
compatible 1.44 Mbyte disk.
Setup Aids
_____________________________________
Autoscale: Pressing the Autoscale key
automatically adjusts the vertical of all channels, the horizontal scale factors, and the
trigger level for a display appropriate to the
applied signals.
Channel Autoscale: Autoscale can be
performed on individual channels. This mode
only sets the vertical for the channel selected,
therefore saving time and keeping the
automatic feature from changing other userselected settings.
Save/Recall: Up to 10 complete instrument
setups may be stored in the internal nonvolatile memory. Additionally, many more
setups can be stored on the internal MS-DOS
compatible disk.
Vertical Software Calibration: Changes in the
environmental conditions can be accommodated by performing a software calibration on
the plug-ins. The calibration resets the plug-in
for the current mainframe and plug-in operating temperature. Software vertical calibration
is recommended prior to taking measurements
requiring the best possible accuracy.
Digitizer Converter: 12-bit successive
approximation A/D converter.
Resolution: Up to 15 bits with averaging.
Variable IF gain assures that resolution is
≥9 bits on all ranges (11 on most).
Digitizing Rate: The signal is sampled and digitized at a rate dictated by the trigger repetition
rate and the time base range. If data acquisition is not trigger rate limited, the maximum
sample rate is 40 KHz
.
Reflection Measurements
_____________________________________
Source: Measurements are made using the
Channel step source or a user supplied
external source.
Calibration: A reference plane is defined by
calibrating the reflection channel with a short
placed at the point where the device under
test (DUT) will be connected. The short
calibration is followed with a 50-Ω calibration.
These calibrations derive the normalization
filter.
Cursor: Reads out the percent reflection,
impedance, time, and distance from the reference plane to the cursor.
Percent Reflection: Automatic measurements
provided to calculate the maximum positive
and negative percent reflections of the waveform shown onscreen.
Normalization Filter: Applies a firmware
digital filter to the measured data. The rise
time of the filter may be varied to allow the
user to simulate the edge speeds that would
be seen by the device under actual operating
conditions. Normalization uses the Bracewell
transform, which is under license from
Stanford University. See TDR output specifications for allowable rise time values.
Variable Bandwidth Limit
Changing the rise time of the normalization
filter requires that a short and 50-Ω load be
placed at the launch point. When this is not
possible or differential TDR is used then a
variable bandwidth limit filter can be used.
The variable bandwidth limit function is
located in the waveform math menu.
Percent Reflection Measurements: Used to
quantify reactive peaks and valleys of the TDR
display. Impedance measurements are valid
only for resistive, horizontal flat-line TDR
displays. Because the accuracy depends on
the measurement being made, percent reflection and impedance accuracies are not specified. Percent reflection and impedance measurements are ratios of voltage measurements
whose accuracies are specified.
Percent Reflection (ρ) = (Vcursor - Vtop)
_____________
(Vtop - Vbase)
Impedance (Z) = 50 Ω x (1 + ρ)
________
(1 - ρ)
Where Vcursor = voltage at the cursor
Vtop = high level of incident step
Vbase = low level of incident step
and is determined during the
reflection calibration
Distance measurements are subject to the
accuracy of the velocity factor or dielectric
constant that you enter. Because the
HP 54753A and 54754A have no control over
the accuracy of these numbers, distance
accuracy is not specified. Distance is derived
from time interval measurements whose accuracies are specified.
4

Distance (d) = 1/2 x ∆t x Velocity Constant,
where ∆t = time from the reference plane to
the cursor.
Dielectric constant = (3 x 10⁸m/s)
2
__________________
(Velocity Constant)
2
where you enter either a relative Dielectric
Constant or a Velocity constant.
The TDR’s ability to resolve the distance
between two discontinuities is limited to 1/2
the system rise time. Without normalization,
this is approximately 1/2 x 45 ps or 7 mm in air.
For the distance resolution in your media,
divide 7 mm by the square root of eff of your
media. With normalization, the system rise
time can be 10 ps yielding 1.5 mm of resolution
in air.
The maximum length the TDR can measure is
subject to media loss. For a lossless vacuum,
and using a 50-Hz TDR repetition rate, the
system can measure 1500 km. Actual maximum lengths will generally be limited by the
losses of the media under test.
Excess L/C
Once a calibration plane is established, the
excess L/C feature will compute the series L
or shunt C equivalent to the area between
cursors. The result is the equivalent L or C
that causes a discontinuity with equal area to
that measured.
Scaling
The vertical scaling allows scaling in either
percent reflection or ohms. Cursors will also
read in voltage or ohms. A reference plane
calibration must be performed to utilize these
scales.
Differential TDR
The differential and common stimulus are
generated by staggered rising edges from two
independent TDR step generators. Hardware
setup remains fixed and therefore the skew for
both differential and common measurements.
The response to either differential or common
mode stimulus may be viewed simultaneously
as differential or common mode.
All waveform math functions are automatic.
Both the differential and common mode
responses are computed without user
intervention.
Differential TDR Timing Deskew
For accurate differential TDR measurements it
is essential that the TDR steps are coincident
at the reference plane and the reflected steps
are coincident at the samplers. Ideally, this is
accomplished by using electrically matched
launch cables. When this is not possible, the
TDR channels must be deskewed.
To accomplish this, it is necessary to have both
TDR step time skew and channel skew capabilities. Each of the TDR steps may be moved
± 400 ps. When used in conjunction with the
channel skew control, then 1.6 ns of timing
delta can be removed. Depending upon the
cable, this equates to approximately 1 foot of
cable length difference that can be electrically
removed.
Transmission Measurements
Source: Measurements are made using the
channel step source or a user-supplied external source.
Calibration: A calibration with a straightthrough path or through your standard device
determines reference amplitude levels and
reference time and distances of the signal
path. These reference levels are used for gain
and propagation delay measurements.
Cursor: Reads out time referenced to the calibration edge and gain referenced to the transmission calibration results. (See Note 1)
Propagation Delay and Gain: Automatically
calculates the difference in time and distance
between the calibration signal path the test
signal path. Also calculates the ratio of the
test signal amplitude to the calibration signal
amplitude. (See Note 1)
Normalization Filter: Applies a firmware
digital filter to the measured data. The rise
time of the filter may be varied to allow you to
simulate the edge speeds which would be
seen by the device under actual operation.
See TDR output specifications for allowable
rise time values.
Note 1:
∆t = Time of the cursor (50%) - Time of
reference edge (50%).
Gain = (Vtop - Vbase)signal
___________________ ,
(Vtop - Vbase)reference
Prop Delay = Time of test edge (50%) - Time of
reference edge (50%).
Distance (d) = Prop delay x Velocity Constant.
where Vtop = High level of waveform and
Vbase = Low level of waveform.
5

Meets Hewlett-Packard’s environmental specification (section 750) for class B-1 products with
exceptions as described for temperature and
condensation. Contact your local HP field engineer for complete details.
_______________________________
Temperature
_______________________________
Operating +10 °C to +40 °C
_____________________________________
Non-operating –40 °C to +70 °C
_____________________________________
_______________________________
Humidity
_______________________________
Operating Up to 90% relative humidity (non-
condensing) at +35 °C
_____________________________________
Nonoperating Up to 90% relative humidity at
+65 °C
_______________________________
Vibration
_______________________________
Operating Random vibration 5 to 500 Hz,
10 minute per axis, 0.3 g(rms).
_____________________________________
Nonoperating Random vibration 5 to 500 Hz,
10 minute per axis, 2.41 g(rms);
resonant search, 5 to 500 Hz
swept sine, 1 Octave/minute
sweep rate, 0.75g, 5 minute reso
nant dwell at 4 resonances/axis.
_____________________________________
Environmental
Conditions
_______________________________
Altitude
Operating Up to 4,600 meters (15,000 ft)
Nonoperating Up to 15,300 meters (50,000 ft)
_________________________________________________________________________________
Power Requirements Voltage Power
_________________________________________________________________________________
HP 54750A 90 to 132 or 198 to 264 Vac, 1200 VA; 650 W
48 to 66 Hz
_________________________________________________________________________________
HP 54701A ±17 Vdc 110 mA
_________________________________________________________________________________
_________________________________________________________________________________
Model Number Approximate Net Weight Approximate Shipping Weight
_________________________________________________________________________________
HP 54750A 24.5 kg (54 lbs) 31.8 kg (70 lbs)
_________________________________________________________________________________
HP 54751A 1.1 kg (2.4 lbs) 2.0 kg (4.4 lbs)
_________________________________________________________________________________
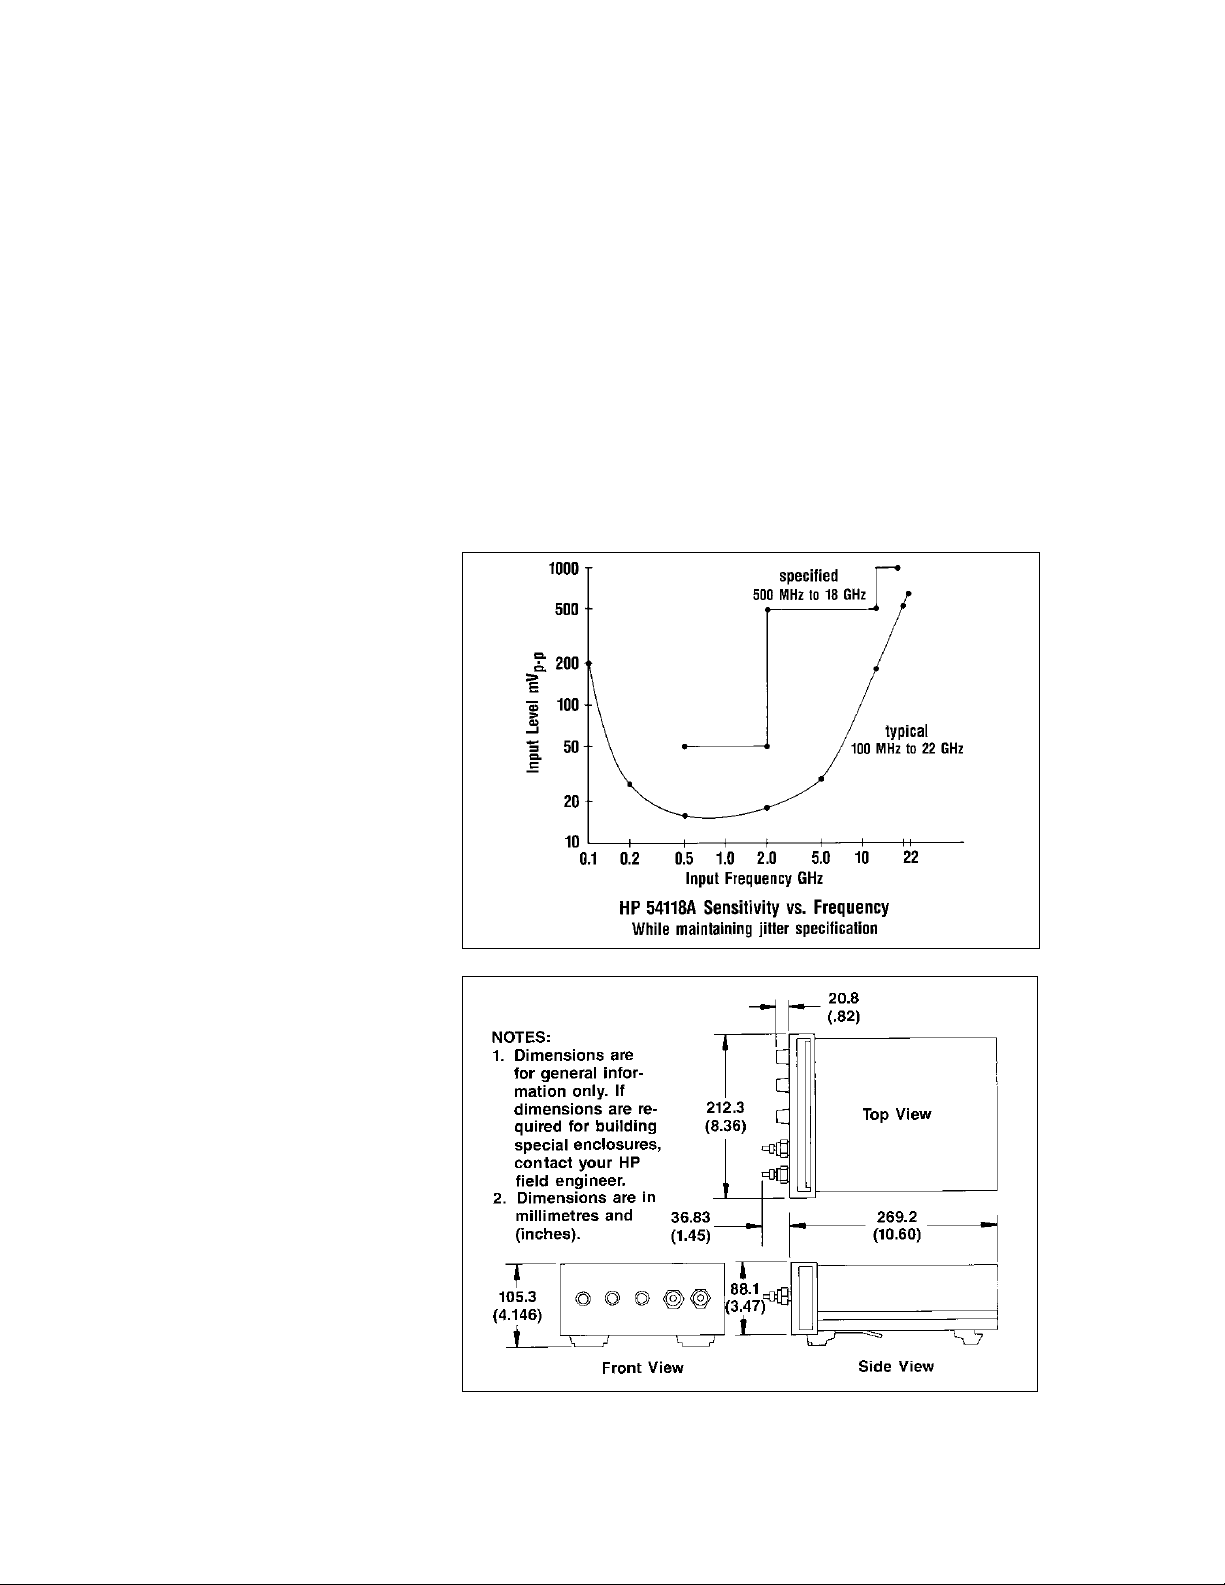
Dimensions are for general information only.
If greater accuracy is required, contact your HP field engineer.
6

Plug-in Modules for the HP 54750A
• HP 54751A Plug-in
The HP 54751A plug-in offers two 20 GHz bandwidth channels.
The two-wide configuration allows up to four channels in the
HP 54750A mainframe. The bandwidth of each channel may
be selected independently from the channel menu as either
20 GHz or 12.4 GHz. The bandwidth of the channel is altered
by changing the bias on the sampling bridge.
The low-noise characteristic of the plug-in gives an RMS noise
level of <1.0 mV in the high-bandwidth mode and <0.5 mV in
the low-bandwidth mode. With exceptionally low noise and a
minimum sensitivity of 1 mV/div, the HP 54751A is ideally
suited for evaluation of low-level signals.
The plug-in provides a single external trigger input of 2.5 GHz.
Triggering to 18 GHz is possible by using the HP 54118A.
________________________________________________________________
Channels 20-GHz Bandwidth 12.4-GHz Bandwidth
(Vertical)[1] Mode Mode
________________________________________________________________
Bandwidth dc to 20 GHz [2] dc to 12.4 GHz [2]
(–3dB)
________________________________________________________________
Transition Time ≤ 17.5 ps ≤28.2 ps
(10% to 90%)
(calculated from
Tr = .35/BW
________________________________________________________________
Maximum Noise ≤1 mV ≤0.5 mV
(RMS)
________________________________________________________________
Scale Factor (fullscale is 8 divisions) (fullscale is 8 divisions)
Minimum 1 mV/div 1 mV/div
Maximum 100 mV/div 100 mV/div
________________________________________________________________
dc Accuracy ± 0.4% of fullscale or ± 0.4% of fullscale or
Single Voltage marker reading(whichever marker reading(whichever
Marker [3] is greater) ± 2 mV ± 1.2% is greater) ± 2 mV ± 0.6%
of (reading-channel of (reading-channel
offset) [5] offset) [5]
________________________________________________________________
dc Difference ± 0.8% off fullscale ± 0.8% off fullscale
Voltage Accuracy or delta marker reading or delta marker reading
(Using Two Voltage (whichever is greater) (whichever is greater)
Markers on The ± 1.2% of delta marker ± 0.6% of delta marker
Same Channel) [3] reading [5] reading [5]
________________________________________________________________
Programmable Channel offset ± 500mV Channel offset ± 500mV
dc Offset [4]
________________________________________________________________
Inputs:
Number Two
Dynamic Range ± 400 mV relative to channel offset
Maximum Safe ± 2 Vdc
Input Voltage
Nominal Impedance 50 Ω
Percent Reflection ≤ 5% for 30-ps rise time
Connectors 3.5 mm(m) with connector saver (f-f)
________________________________________________________________
[1] When operated within ± 5 °C(± 9 °F)of the temperature
of the last plug-in calibration. See the Operating
Characteristics for additional information on vertical soft-
ware calibration.
[2] The input samples are biased differently for increased
bandwidth in the 20-GHz bandwidth mode.
[3] When driven from a 0 Ω source.
[4] An effective offset of ± 900 mV can be achieved using
the ± 500 mV of channel offset and adding ± 400 mV of off
set using the waveform math offset scaling function.
[5] When operated within ± 2 °C(± 3.6 °F) of the tempera-
ture of the last plug-in calibration. When operated within
± 5 °C(± 9 °F) of the temperature of the last plug-in
calibration, the final term in the dc accuracy specification
is 2.5 times higher.
________________________________________________________________
• HP 54752A and 54752B Plug-ins
The HP 54752A has two 50 GHz bandwidth channels and the
HP 54752B provides a single cost-effective channel. Both plug-ins
use 2.4 mm connectors to provide the highest fidelity from the DUT .
These plug-ins also feature a dual bandwidth scheme which can
be selected independently from the mainframe. The low-bandwidth
mode bandlimits the signal to 26.5 GHz. The high-bandwidth
mode RMS noise performance is <1.5 mV and the low-bandwidth
mode is <0.75 mV.
——————————————————————————————————
Channels 50-GHz Bandwidth 26.5-GHz Bandwidth
(Vertical)[1] Mode Mode
——————————————————————————————————
Bandwidth [2] dc to 50 GHz dc to 26.5 GHz
(–3db)
——————————————————————————————————
Transition Time ≤ 7.0 ps ≤ 13.2 ps
(10% to 90%)
(calculated from
Tr=0.35/BW)
——————————————————————————————————
Maximum Noise ≤1.5 mV ≤0.75 mV
(RMS)
——————————————————————————————————
Scale Factor (fullscale is 8 div) (fullscale is 8 div)
Minimum 1 mV/div 1 mV/div
Maximum 100 mV/div 100 mV/div
——————————————————————————————————
dc Accuracy ± 0.4% of fullscale or ± 0.4% of fullscale or
Single Voltage marker reading marker reading
Marker [3] (whichever is greater) (whicheveri s greater)
± 2 mV ± 2.0% of (reading- ± 2 mV ± 1.2% of (readingchannel offset) [5] channel offset) [5]
——————————————————————————————————
dc Difference ± 0.8% of fullscale ± 0.8% of fullscale
Voltage Accuracy or delta marker reading or delta marker reading
(Using Two Voltage (whichever is greater (whichever is greater)
Markers on The ± 2.0% of delta marker ± 1.2% of delta marker
Same Channel) [3] reading [5] reading [5]
——————————————————————————————————
Programmable Channel offset ± 500 mV Channel offset ± 500 mV
dc Offset [4]
——————————————————————————————————
Inputs:
Number One HP 54752B
Two HP 54752A
Dynamic Range ± 400 mV relative to channel offset
Maximum Safe ± 2 Vdc
Input Voltage
Nominal Impedance 50 Ω
Percent Reflection ≤ 5% for 20-ps rise time
Connectors 2.4 mm(m)
——————————————————————————————————
[1] When operated within ± 5 °C(± 9 °F)of the temperature of
the last plug-in calibration. See the Operating Characteristics
for additional information on vertical software calibration.
[2] The input samplers are biased differently for increased
bandwidth in the 50 GHz bandwidth mode.
[3] When driven from a 0 Ω source.
[4] An effective offset of ± 900 mV can be achieved using the
± 500 mV of channel offset and adding ± 400 mV of offset using
the waveform math offset scaling function.
[5] When operated within ± 2 °C(± 3.6 °F) of the temperature of
the last plug-in calibration. When operated within
± 5 °C(± 9 °F) of the temperature of the last plug-in calibration,
the final term in the dc accuracy specification is 2.5 times
higher.
——————————————————————————————————
7

• HP 54753A Plug-in
The HP 54754A has two independent vertical channels and two
step generators. The bandwidth of both channels is 18 GHz.
The step generators may be operated singly, simultaneously
but independently, differentially, or as common-mode stimulus.
The TDR results may be viewed as common mode or differentially and displayed simultaneously. Once selected, the display
mode is computed automatically, freeing the user from setting
up mathematical functions.
Each step may be skewed separately in time. Coupled with the
ability to skew the vertical channels, it is possible to accurately
perform differential TDR when the launch cables are not the
same electrical length.
________________________________________________________________
TDR System Combined Oscilloscope Normalized
and TDR Performance Characteristics [1]
________________________________________________________________
Rise time [1] < 45 ps [3] Adjustable: allowable
values based on time base
setting. Minimum: 10 ps
or 0.08 x Time/div,
whichever is greater.
Maximum: 5 x Time/div
________________________________________________________________
Flatness [2] < ± 1% after 1 ns <0.1%
from edge; < +5%,
–3% to 1 ns from edge
________________________________________________________________
Levels:
Low 0.00 V ± 2 mV 0.00 V ± 2 mV
High +200 mV ± 2 mV +200 mV ± 2 mV
[1] Normalized information is a characteristic, not a
specification. The information is presented here for
comparison only.
Normalization characteristics are achieved only with the
use of the normalization calibrations and firmware routines.
[2] Measured in the Averaged Display mode with best flatness on.
[3] The rise time of the generator is less than 35 ps, as
calculated by:
Tr System=√(Tr Generator) 2+ (TrScope)
2
________________________________________________________________
The HP 54753A is a two-channel vertical plug-in with a TDR step
generator built into channel one. The bandwidth of the TDR/vertical
channel is 18 GHZ. The bandwidth of channel two is 20 GHz.
The step generator provides a 200 mV TDR step with a system
rise time of <45 ps. The system has the ability to normalize the
TDR by applying a digital filter. Normalization removes errors
caused by loss or imperfect launchers or cables.
The rise time of the normalization filter may be varied to allow
you to simulate the edge speeds found in your system. You may
also push the rise time up to 10 ps. Unlike the HP 54120 series,
the normalization filter when activated processes every acquisition so you see changes as the DUT is adjusted.
The HP 54753A provides support for external step generators,
such as the PicoSecond Pulse Labs 4015C.
—————————————————————————————————
Channels 18/20 GHz Bandwidth 12.4 GHz Bandwidth
(Vertical)[1] Mode Mode
—————————————————————————————————
Bandwidth [2] HP 54753A and HP 54754A
(-3db) dc to 18 GHz TDR channel dc to 12.4 Ghz
HP 54753A non-TDR channel
dc to 20 GHz
—————————————————————————————————
Transition Time ≤ 19.4 ps ≤ 28.2 ps
(10% to 90%) HP 54753A non-TDR channel
(calculated from ≤ 17.5 ps
Tr=0.35/BW)
—————————————————————————————————
Maximum Noise ≤1 mV ≤0.5 mV
(RMS)
—————————————————————————————————
Scale Factor (fullscale is 8 div) (fullscale is 8 div)
Minimum 1 mV/div 1 mV/div
Maximum 100 mV/div 100 mV/div
—————————————————————————————————
dc Accuracy ± 0.4% of fullscale or ± 0.4% of fullscale or
Single Voltage marker reading marker reading
Marker [3] (whichever is greater) (whichever is greater)
± 2 mV ± 1.2% of (reading- ± 2 mV ± 0.6% of (readingchannel offset) [5] channel offset) [5]
—————————————————————————————————
dc Difference ± 0.8% of fullscale ± 0.8% of fullscale
Voltage Accuracy or delta marker reading or delta marker reading
Using Two Voltage (whichever is greater) (whichever is greater)
Markers on The ± 1.2% of delta marker ± 0.6% of delta marker
Same Channel [3] reading [5] reading [5]
—————————————————————————————————
Programmable Channel offset ± 500 mV Channel offset ± 500 mV
dc Offset [4]
—————————————————————————————————
Inputs:
Number Two
TDR Step Generators One 54753A
Two 54754A
Dynamic Range ± 400 mV relative to channel offset
Maximum Safe ± 2 Vdc
Input Voltage
Nominal Impedance 50 Ω
Percent Reflection ≤ 5% for 30 ps rise time
Connectors 3.5 mm(m)
—————————————————————————————————
[1] When operated within ± 5 °C(± 9 °F) of the temperature of the last plug-in calibration.
See the Operating Characteristics for additional information on vertical software calibration.
[2] The input sampler are biased differently for increased bandwidth in the 18/20 GHz
bandwidth mode.
[3] When driven from a 0 Ω source.
[4] An effective offset of ± 900 mV can be achieved using the ± 500 mV of channel
offset and adding ± 400 mV of offset using the waveform math offset scaling function.
[5] When operated within ± 2 °C(± 3.6 °F) of the temperature of the last plug-in calibration. When operated within ± 5 °C (± 9 °F) of the temperature of the last plug-in
calibration, the final term in the dc accuracy specification is 2.5 times higher.
—————————————————————————————————
8
• HP 54754A Plug-in
Operating Characteristics
______________________________________
Output
Signal (into 50 Ω) 200 mV positive pulse 5 ns wide
Delay From Trigger Edge 4 ns (approximate)
Kickout at Signal Input A single, positive pulse,
under 300 mV and 900 ps wide at the beginning of
the sweep.
Power Input Connector SMB snap-on coaxial
Voltage + 15 Vdc ± 5%
Current 150 mA max, 130 mA Typical
Power 2.4 Watts max
Environmental
______________________________________
Temperature,Operating +15 °C to +35 °C
Temperature, Storage – 40 °C to +70 °C
Humidity, Operating 90 % at 35 ° C
Humidity, Nonoperating 95 % at 65 °C
Altitude, Operating 4,600 meters
Altitude, Nonoperating 15,300 meters
Vibration, Operating 0.3 g Random 5 to 500 Hz,
10 min/axis
Vibration, Nonoperating 2.41 G (rms) Random
5-500 Hz, 10 min/axis 0.75 G (rms) Sine 5 to 500 Hz,
5 min/resonance Net weight 1.8 kg (4 lb)
HP 54118A Trigger
• 500 MHz to 18 GHz
______________________________________
The following is a list of standard accessories supplied with the HP 54118A 500-MHz to 18-GHz Trigger.
All accessories needed to use the HP 54118A with
the HP 54750-series test set alone are included
in the RF accessories kit.
Power Cable
1 each HP 54111 - 61609 Coaxial SMB, 25 cm long
Trigger Output Cable
1 each HP 54118-61607 Semirigid U SMA
(male-male) External input cable for connecting the
HP 54118A trigger output to the trigger input of the
HP 54750 - Series test set.
Trigger Input Cable
1 each HP 54118-61608 8 cm Semirigid L,
SMA (male-male)
Specifications
______________________________________
Input
Frequency Range 500 MHz to 18 GHz
Connector 3.5 mm (male)
Nominal Impedance 50 Ω
Coupling ac Input Sensitivity
500 MHz to 2.0 GHz ≤50 mVp-p (–22 dBm)
2.0 GHz to 12.4 GHz ≤500 mVp-p (–2 dBm)
12.4 GHz to 18 GHz ≤1.0 Vp-p (+4 dBm)
Maximum Safe Input 25 Vdc, 4 Vp-p ac (+16 dBm)
Percent Reflection ≤5% for 30 ps risetime
Trigger Level 0 V to 2 Vp-p (+10 dBm)
Arming Level 0 V to 2 Vp-p (+10 dBm)
Holdoff 50 µs to 200 µs
Output
Connector 3.5 mm (male)
Nominal Impedance 50 Ω
Coupling ac
Maximum Safe External Voltage ±25 Vdc
Jitter (1 sigma)
≤3 % of input signal period
≤2.5 ps at 12.4 GHz
≤1.7 ps at 18.0 GHz
RF Accessories
1 each HP 11667B dc to 26.5 GHz, 6-dB power divider
1 each HP 33340C opt 006 dc to 26.5 GHz, 6-dB
attenuator
1 each HP 54007-61602 3-cm, Semirigid L, SMA
(male-male)
1 each HP 54007-61601 6-cm, Semirigid L, SMA
(male-male)
Adapters
2 each 3.5 mm (female-female)
HP 5061-5311
Coaxial Shorts
2 each SMA (male) HP 0960-0055
9

Specifications
______________________________________
Delay: ≥ 22 ns
Frequency Range: dc to 20 GHz.
VSWR: ≤1.45:1
Insertion Loss: ≤5.70 dB at 20 GHz.
Characteristics
Risetime: ≤40 ps (20% to 70%)
Overshoot: ≤5 mV as displayed with the
HP 54754A TDR step generator.
Connectors: SMA (f)
______________________________________
Environmental
Temperature Operating: + 15 °C to + 35 °C
(+ 59 °F to + 95 °F)
Temperature NonOperating: -40 °C to + 70 °C
(– 40 °F to + 158 °F)
Humidity Operating: Up to 90 % relative humidity
at +35 °C (+ 95 °F)
Humidity Nonoperating: Up to 95 % relative
humidity at +65 °C (+ 149 °F)
Altitude Operating: 4,600 m (15,000 feet)
Altitude Nonoperating: 15,300 m (50,000 feet)
Vibration Operating: Random
Vibrations
5 to 500 Hz, 10 minutes per axis, appx 0.3 g
(RMS)
Vibrations Nonoperating: Random vibration
5 to 500 Hz, 10 minutes per axis, appx 2.41 g (RMS);
and swept sine resonant search, 5 to 500 Hz, 0.75 g
(0-peak), 5 minute resonant dwell at 4 resonances
per axis.
Weight: Net Approximately 1.53 kg (3.4 lb)
Dimensions
Width: 212.60 millimeters (8.37 inches)
Heighth: 68.58 millimeters (2.7 inches)
Depth: 222.25 millimeters (8.75 inches)
The HP 54008A is a 22-ns delay
line whose primary application
is to view the trigger event on
an HP 54750-series digitizing
oscilloscope. The delay line has
a frequency range which extends
from dc to 20 GHz and has less
than 5.70 dB of attenuation at
20 GHz.
Each delay line is shipped from
the factory with a VSWR versus
frequency plot and an insertion
loss versus frequency plot for that
particular delay line.
The HP 54750 family of digitizing oscilloscopes are sequential
sampling digitizing oscilloscopes
and contain about 22 ns of delay
between trigger point and the
first sampling point. Using the
HP 54008, a trigger point can be
displayed on the screen of any
HP 54750-series oscilloscope.
HP 54008A 22-ns Delay Line
• View the Trigger Event
When using an HP 54750-series
oscilloscope with the HP 54118A
trigger, the delay between the
trigger event and the first sample
point is increased by about 4 ns.
Because the HP 54008A delay
line's electrical timing length is
greater than 22 ns long , the
HP 54008A will work in this
application also.
HP 54007A Accessory Kit
The HP 54007A accessory Kit
contains precision terminations,
adapters, and other devices.
These devices have been specifically designed for precision, lowloss time domain network analysis
(TDNA) calibration and analysis,
using the HP 54750-series digitizing oscilloscope.
Contents of HP 54007A Acessory Kit
_______________________________________________________________________________
1 17 inch Coaxial Cable, APC 3.5 mm (f-f) HP 8120-4941
1 17 inch Coaxial Cable, APC 3.5 mm (m-f) HP 8120-4942
1 Coaxial Short, APC 3.5 mm (f) HP 1250-2127
1 Coaxial Short, APC 3.5 mm (m) HP 1250-2128
1 50 Ω Termination, APC 3.5 mm (m) HP 909D
1 50 Ω Termination, APC 3.5 mm(f) HP 909D opt 011
1 7.5 cm Airline, APC 3.5 mm (m-f) HP 1250-1869
1 Power Splitter, APC 3.5 mm (f) HP 11667B
1 2.6 cm. Semi-rigid Coax-”L”, SMA (m-m) HP 54007-61601
1 3 cm. Semi-rigid Coax-”L”, SMA (m-m) HP 54001-61602
1 6dB attenuator,APC 3.5 mm (m-f) HP 33340C Option 006
1 40dB attenuator, APC 3.5 mm (m-f) HP 33340C OPtion 040
1 Adapter, APC 3.5 mm (m-m) HP 1250-1748
1 Foam Box Liner HP 54007-29301
1 Walnut Box HP 54007-85501
1 54007A Accessory Operating Note HP 54007-90901
A 15cm Beadless Airline is available under HP part number 1250-1876
_______________________________________________________________________________
Hewlett-Packard recommends using the following items to properly care for your precision
APC 3.5, 2.4-mm and SMA connectors. (See the HP 54007A Operating note for complete details on
precision connector care.)
_______________________________________________________________________________
5 inch-lbs torque wrench HP P/N 8710-1582
8 inch-lbs torque wrench HP P/N 8710-1765
Compressed Air Canister HP 92193Y
Liquid Freon HP P/N 8500-1914
Plastic Foam Swabs HP P/N 9300-0468
10

_____________________________
HP 33340C 26.5 GHz APC 3.5 mm attenuators (left)
HP 33340D 50 GHz 2.4 mm attenuators (right)
tains a SMA(f) to BNC(m) adapter (HP 1250-2015)
_____________________________
Using the Proper Attenuator
HP offers two families of ultrahigh bandwidth fixed attenuators. The HP 33340C Series are
dc to 26.5-GHz attenuators and
use 3.5-mm connectors. The
HP 33340D Series are dc to
50-GHz attenuators with
2.4-mm connectors. Use the
26.5-GHz attenuator family to
attenuate input signals with
rise times as fast as 30 ps for
minimum time domain distortion.
If the signals being analyzed are
faster than this, the HP 33340D
Series is recommended. When
using the HP 33340D Series
atenuators, use 2.4-mm to a
3.5-mm connector adapters.
______________________________________________________________________________
HP 54701A 2.5-GHz Active Probe Specifications
______________________________________________________________________________
Bandwidth Flatness <3 ns from rising edge: ±6%
(–3 dB) >2.5 GHz ≥3 ns from rising edge: ±1%
_____________________________________ ______________________________________
Rise Time Dynamic
(calculated Range
from Tr = (<1.5% gain
0.35/BW) <140 ps compression) 5 V peak ac ±50 Vdc
_____________________________________ ______________________________________
Attenuation Offset
Factor 10:1 Adjustment ±50 V at the probe tip
_____________________________________ ______________________________________
dc Input RMS Output (dc to 2.5 GHz with input
Resistance 100 kΩ±1% Noise loaded in 50-ΩTerminator)
_____________________________________ ______________________________________
dc Gain Maximum
Accuracy ±0.5% Input Voltage ±200 V[dc + peak ac (<20 MHz)
_____________________________________ ______________________________________
Input ESD Tolerance
Capacitance <0.6 pF (typical) (150 Ω/150 pF) ±12 kV
_____________________________________ ______________________________________
Option 001
______________________________________________________________________________
Type N (f) to 3.5 mm (f) adaptor
External thread 3.5 mm adaptor to securely
connect HP 54701A probe to HP 54750 series
plug-ins.
HP 54701A Active Probe
Specifications
HP 33340
Attenuators
11

Application Description
ECL signals are normally offset
from ground, while high frequency test equipment generally provides 50-Ω termination to ground.
Attempting to connect an ECL
signal directly to the test equipment could result in either
damage to the ECL output or to
the test equipment.
The HP 10086A ECL terminator
provides an excellent interface
between ECL outputs and test
and measurement equipment.
The terminator offsets and
attenuates the signal sufficiently
to protect the test equipment,
while providing the proper termination voltage between the
ECL circuit and the test equipment. The HP 10086A can also
be used alone to properly load an
ECL output. The ECL terminator is a precision adapter that is
dc-coupled to the instrumentation. This allow direct measurement of your ECL signal. Power
supply adjustment and capacitive or transformer coupling are
no longer necessary with the
ECL terminator . In addition, it is
no longer necessary to float the
instrumentation ground to –2 V,
thereby reducing the hazards of
power supply shorting and electrical shock or damage to the circuit.
HP 10086A
ECL Terminator
____________________________________
The following is a list of accessories needed to
assemble the configuration shown above:
HP 1250-1857 SMB (f) to BNC (m) adapter
HP 1250-0080 BNC (f) to BNC (f) adapter
HP 10503A 48 inch BNC (m) cable
HP 1251-2277 BNC (f) to dual banana jack
HP 1250-1236 Panel Mount SMB (f) to BNC (f)
____________________________________
HP 10086A Specifications
Attenuation : 10X ± 1.0 % at dc or 20 db ± 3 db,
dc to 10 GHz
Abberations : ± 3 % maximum, with 100 ps
rise time
Maximum Input Voltage : ± 5 V on all inputs
Connectors :
ECL input SMA (m)
ECL output SMA (f)
Bias input SMB (m)
The following table indicates the typical bias
voltage required to set the proper termination
voltage.
Bias Table
Vcc Vee Vterm Vbias
0.00 V –5.20 V –2.00 V –2.45 V
2.00 V –3.20 V 0.00 V 0.00 V
5.20 V 0.00 V 3.20 V 3.92 V
Dimensions (including connectors) :
1.50 x 1.10 x 0.45 inches or 3.81 x 2.79 x 1.14 cm
HP 54006A
6 GHz Hand-held Probe
HP 54006A
6 GHz Hand-held Probe
The HP 54006A is a high frequency passive probe designed for
probing high-speed logic and low
impedance circuits. The probe
has two tips that allow either
10:1, 500-Ω performance or 20:1,
1000-Ω performance. The capacitive loading at the probe tip is a
small 0.25 pF.
The HP 54006A is shipped with a dc Blocking
Capacitor (HP 11742A) which can be used to remove
a dc offset from a signal. The HP 54006A also
contains an SMA(f) to BNC(m) adapter (HP 1250-
2015). The two different tips included with each
HP 54006A can be distinguished by their length. The
20:1 probe tip is longer than the 10:1 tip by about
0.2 inches.
________________________________________
The tips of the HP 54006A are replaceable.
Kits of each tip can be obtained from HP under the
following part numbers :
HP 54006-68701 Pack of 4, 450 Ωresistors probe
tips for 10:1 probing and an extra sleeve.
HP 54006-68702 Pack of 4, 950 Ωresistors probe
tips for 20:1 probing and an extra sleeve.
______________________________________
12

The HP 11898A module extender
can be used with plug-in modules
compatible with the HP 83480A
and 54750A mainframes. The
extender allows the plug-in to be
placed up to 1.5 meters away
from the mainframe. This allows
users to make measurements on
devices where the test device
cannot be physically located close
to the instrument mainframe.
Examples include testing of very
high-frequency electrical circuits
where lengths of electrical cabling
can degrade signal performance
or for measurements where
isolation from the mainframe is
required to reduce vibration of
the test device.
HP 11898A
Module Extender
HP 11898A
Module Extender
1.2 meters
Plug-in
Module
13
HP 11898A specifications and characteristics:
There are no specifications for the HP 11898A
extender module. Performance is characterized
in terms of how it will affect operation of the
mainframe and plug-in.
Operating temperature range: 15°C to 35°C
Warm-up time: 2 Hours
Time Base Delay: Minimum delay will be
increased from a 22ns minimum to typically 40 ns
when triggering at the remote module, 30 ns
when triggering at the mainframe.
Trigger Sensitivity: Trigger sensitivity will be
reduced by 4 dB at 2.5 GHz
Static Protection Unit from
Picosecond ATE Inc.
The Picosecond ATE Inc. Static
Protection Unit model 1202 offers
static damage protection for TDR
measurements. A foot switch or
TTL signal allows connection of
the device under test after static
charge is removed. Risetime is
<40 ps. In North America, contact
Stu McNaughton at Picosecond
ATE Inc. (503) 641-3295.
Picosecond
ATE Inc. 1202
PicoSecond Pulse Labs
4015C
15-ps, 9 V External TDR
or TDT Source
The PicoSecond Pulse Labs model
4015C pulse generator extends
the TDR/TDT performance of
the HP 54750 series oscilloscopes.
The pulse generator produces a
15-ps fall time with an amplitude
of 9 V, which can be triggered by
any HP 54750 series TDR step
generator . The HP 11667C power
splitter is not included. Contact
Dr. Jim Andrews at PSPL, P.O.
Box 44, Boulder, CO 80306;
(303) 443-1249.

Step Attenuators
HP 8494B opt 002 Manual Step Atten, 0-11 dB 1 dB steps SMA(f)
HP 8495B opt 002 Manual Step Atten, 0-70 dB 10 dB steps SMA(f)
HP 33320H programmable Step Atten, 0-11 dB 1 dB steps SMA(f)
HP 33321H programmable Step Atten, 0-70 dB 10 dB steps SMA(f)
Connector Care
HP 8710-1582 5 in-lbs Torque Wrench
HP 8710-1765 8 in-lbs Torque Wrench
HP 5061-5311 Connector Saver
Power Splitter/Directional Coupler
HP 11667B Power Divider
HP 773D Directional Coupler
Preamp
HP 8447F Preamp - Power Amp (BNC)
Extending Your Oscilloscope’s Channel Count
HP 3488A Switch/Control Unit
HP 44476A Microwave Switch Module incl. 3 HP 333111B switches
HP 33311B 2x1 18 GHz Switch, 50 ohms on unswitched inputs
HP 34531R Rack Mount Faceplate for HP 34531B switches
HP 6269B 40V, 50A Power Supply
HP 44471A 10 Channel General Purpose Relay Module
HP 44476B Microwave Switch Module
HP 34531B 6x1 18 GHz Switch, 50 ohms on unswitched inputs
HP 54750A Sampling Oscilloscope Mainframe
HP 54751A 2 channel 20 GHz plug-in
HP 54752A 2 channel 50-GHz plug-in
HP 54752B 1 channel 50-GHz plug-in
HP 54753A 2 channel plug-in w/ single-ended TDR
HP 54754A 2 channel plug-in w/ differential TDR
Options
0B1 Extra manual set
1CM Rack mount kit w/o handles
1CP Rack mount kit w/ handles
Accessories
HP 54006A 6 GHz divider probe
HP 54008A 22 ns delay line
HP 54118A 500 MHz to 18 GHz trigger
HP 10086A ECL terminator
HP 54007A Accessories Kit
HP 54121-68701 Mini accessories kit
Miscellaneous Connection Devices
HP 1250-1864 APC 3.5 (m-m) adapter
HP 1250-1747 APC 7 to APC 3.5(f) adapter
HP 1250-1468 APC 7 to SMA (f) adapter
HP 1250-1748 APC 3.5(m) to APC 3.5 (m) adapter
HP 1250-1744 N-type (m) to APC 3.5 (f) adapter
HP 1250-1250 N-type to SMA (f) adapter
HP 1250-1158 SMA (f-f) adapter
HP 1250-1159 SMA (m-m) adapter
HP 1250-1857 SMB (f) to BNC (m) adapter
HP 1250-0080 BNC (f) to BNC (f) adapter
HP 10503A 48 inch BNC male cable
HP 1250-2277 BNC (f) to dual banana jack
HP 1250-1236 Panel mount SMB (f) to BNC (f)
HP 1250-1876 15 cm beadless Airline
HP 11901A APC 3.5(m) to 2.4(m) Adapter
HP 11901D APC 3.5(m) to 2.4(f) Adapter
HP 11901C APC 3.5(f) to 2.4(m) Adapter
HP 11901B APC 3.5(f) to 2.4(f) Adapter
HP 909D APC 3.5(f) Precision 50Ω Termination
Miscellaneous 2.4 mm Accessories
HP 84904L 40 GHz Programmable Step Attain., 0-11 dB in 10 dB steps,
2.4 mm .(f)
HP 84906L 40 GHz Programmable Step Atten., 0-70 dB in 10 dB steps,
2.4 mm (f)
HP 84907L 40 GHz Programmabble Step Atten., 0-70 dB in 10 dB steps
2.4 mm (f)
HP 11667C 50 GHz power splitter
Gore GD501501-012 40 GHz Cable (SMA connectors)*
Gore GDOAJOAJ-012 GHz cable (2.4mm connectors)*
See HP publications #11900-90003 and #5953-2346 for additional 2.4-mm accessories
* Contact W.L. Gore and Assosiates Inc.
Fixed Attenuators
HP 33340C opt 003 3 dB fixed attenuator (APC 3.5)
HP 33340C opt 006 6 dB fixed attenuator (APC 3.5)
HP 33340C opt 010 10 dB fixed attenuator (APC 3.5)
HP 33340C opt 020 20 dB fixed attenuator (APC 3.5)
HP 33340C opt 030 30 dB fixed attenuator (APC 3.5)
HP 33340C opt 040 40 dB fixed attenuator (APC 3.5)
HP 33340D opt 003 3 db 50 GHz fixed attenuator (2.4mm)
HP 33340D opt 006 6 db 50 GHz fixed attenuator (2.4mm)
HP 33340D opt 010 10 db 50 GHz fixed attenuator (2.4mm)
HP 33340D opt 020 20 db 50 GHz fixed attenuator (2.4mm)
HP 33340D opt 030 30 db 50 GHz fixed attenuator (2.4mm)
HP 33340D opt 040 40 db 50 GHz fixed attenuator (2.4mm)
Ordering
Information
14

For more information about
Hewlett-Packard test and measurement products, applications, services, and for a current sales
office listing, visit our web site,
http://www.hp.com/go/tmdir. You
can also contact one of the following
centers and ask for a test and measurement sales representative.
United States:
Hewlett-Packard Company
Test and Measurement Call Center
P.O. Box 4026
Englewood, CO 80155-4026
1 800 452 4844
Canada:
Hewlett-Packard Canada Ltd.
5150 Spectrum Way
Mississauga, Ontario
L4W 5G1
(905) 206 4725
Europe:
Hewlett-Packard
European Marketing Centre
P.O. Box 999
1180 AZ Amstelveen
The Netherlands
(31 20) 547 9900
Japan:
Hewlett-Packard Japan Ltd.
Measurement Assistance Center
9-1, Takakura-Cho, Hachioji-Shi,
Tokyo 192-8510, Japan
Tel: (81) 426 56 7832
Fax: (81) 426 56 7840
Latin America:
Hewlett-Packard
Latin American Region Headquarters
5200 Blue Lagoon Drive, 9th Floor
Miami, Florida 33126, U.S.A.
Tel: (305) 267-4245
(305) 267-4220
Fax: (305) 267-4288
Australia/New Zealand:
Hewlett-Packard Australia Ltd.
31-41 Joseph Street
Blackburn, Victoria 3130, Australia
Tel: 1 800 629 485 (Australia)
0800 738 378 (New Zealand)
Fax: (61 3) 9210 5489
Asia Pacific:
Hewlett-Packard Asia Pacific Ltd.
17-21/F Shell Tower, Times Square,
1 Matheson Street, Causeway Bay,
Hong Kong
Tel: (852) 2599 7777
Fax: (852) 2506 9285
MS-DOS®is a U.S. registered
trademark of Microsoft Corp.
Data Subject to Change
Copyright © 1995
Hewlett-Packard Company
Printed in U.S.A. 10/98
5962-0097E
 Loading...