

Page 1

User’s Guide
Publication Number 54657-97010
October 1996 (pdf version Dec 1998)
For Safety information, Warranties, and Regulatory
information, see the pages behind the index
© Copyright Hewlett-Packard Company 1992-1996
All Rights Reserved
HP 54657A, HP 54658A,
and HP 54659B
Measurement/Storage Modules
Page 2

Measurement/Storage Modules
The HP 54657A, HP 54658A, and HP 54659B Measurement/Storage
Modules provide additional measurement and storage capabilities to
the HP 54600–Series oscilloscopes. The HP 54657A has an HP-IB
interface and the HP 54658A has a RS-232 interface. The HP 54659B
has a RS-232 interface plus an additional parallel output connector
which allows the module to be connected to both an RS-232 controller
and a parallel printer at the same time. The main features are:
Full Programmability.
•
Hardcopy output.
•
Three additional automatic voltage measurements (amplitude,
•
preshoot, and overshoot).
Two additional automatic time measurements (delay and phase
•
angle). User defined measurement thresholds of 10%/90%,
20%/80%, or selected voltage levels.
Two additional cursor measurements (voltage in percent and time
•
in degrees).
Two additional cursor measurement sources (math function 1
•
and 2).
Waveform math functions (addition, subtraction, multiplication,
•
differentiation, integration, and FFT)
Time and date tagging of hard copy and and nonvolatile memories.
•
Three uncompressed nonvolatile trace memories.
Additional 64K of nonvolatile trace memory (with data
•
compression) for up to 97 more trace memories..
Unattended waveform monitoring by use of mask templates.
•
Built-in automatic mask generation and mask editing capabilities.
•
ii
Page 3

Accessories available
HP 34810B BenchLink/Scope software package.
•
HP 10833A 1 meter (3.3 feet) HP-IB cable.
•
HP 10833B 2 meter (6.6 feet) HP-IB cable.
•
HP 10833C 4 meter (13.2 feet) HP-IB cable.
•
HP 10833D 0.5 meter (1.6 feet) HP-IB cable.
•
HP 13242G 5 meter (16.7 feet) RS-232 cable for printer/plotter and
•
HP Vectra 25-pin serial port.
HP 17255M 1.2 meter (3.9 feet) RS-232 cable for printer/plotter
•
and HP Vectra 25-pin serial port.
HP 17255D 1.2 meter (3.9 feet) RS-232 cable for IBM PC/XT 25-pin
•
serial port.
HP 92219J 5 meter (16.7 feet) RS-232 cable for IBM PC/XT 25-pin
•
serial port.
HP 24542G 3 meter (9.9 feet) RS-232 cable for 9-pin serial port.
•
HP 34398A 2.5 meter (8.2 feet) RS-232 cable.
•
HP 34399A RS-232 Adapter Kit.
•
iii
Page 4

In This Book
This book is the user’s guide for the HP 54657A, HP 54658A, and HP 54659B
Measurement/Storage Modules, and contains three chapters.
Installation
interconnection of the Measurement/ Storage Modules.
Operating the Measurement/Storage Module
series of exercises that guide you through the operation of the
Measurement/Storage Modules.
Reference Information
concerning the Measurement/Storage Modules.
Chapter 1 contains information concerning installation and
Chapter 2 contains a
Chapter 3 lists the reference information
iv
Page 5

1
Installation
Operating the Measurement/
2
Storage Mo dule
3
Reference Information
Index
v
Page 6

vi
Page 7

Contents
1 Installation
Oscilloscope Compatibility 1–2
To install the Measurement/Storage Module 1–3
To configure the interface 1–4
2 Operating the Measurement/Storage Module
Math Functions 2–3
Function 1 2–4
Function 2 2–5
FFT Measurement 2–8
Automatic Measurements 2–14
Setting Thresholds 2–15
To make delay measurements automatically 2–19
To make phase measurements automatically 2–21
To make additional voltage measurements automatically 2–23
To make additional cursor measurements 2–25
Unattended Waveform Monitoring 2–29
To create a mask template using Automask 2–30
To create a mask template using Autostore 2–31
To create or edit a mask using line segments 2–33
To edit an individual pixel of a mask 2–35
To edit the mask to test only a portion of a waveform 2–36
To start waveform monitoring 2–38
To automatically save test violations 2–40
Creating a delay testing mask 2–42
Creating a frequency testing mask 2–44
Creating an overshoot testing mask 2–46
Creating a rise time testing mask 2–48
Testing the eye opening of an eye-pattern signal 2–50
To save or recall traces 2–52
To create a label for a trace memory 2–54
To set real-time clock 2–55
Contents–1
Page 8

Contents
3 Reference Information
Operating Characteristics 3–3
Index
Contents–2
Page 9

1
Installation
Page 10

Installation
This chapter provides you with the information necessary to install
the Measurement/Storage Module on the oscilloscope. Information
required to connect and configure the module to the desired external
devices (such as printer, plotter, computer) prior to local or remote
operation is given in the Interface Modules for HP 54600-Series
Instruments I/O Function Guide shipped with your module.
Oscilloscope Compatibility
HP 54657A and HP 54658A
HP 54600-series oscilloscopes except HP 54600A, HP 54601A, and
HP 54602A oscilloscopes with an operating system version lower than
2.2. If your 54600A, HP 54601A, or HP 54602A oscilloscope has an
earlier operating system, it can be updated using upgrade kit HP part
number 54601-68702. The version is briefly displayed on screen when
Print/ Utilit y
the
HP 54659B
HP 54601A, HP 54602A, or HP 54610A Oscilloscope. This module is
compatible with all other HP 54600-series oscilloscopes with an operating
system version 1.2 or higher or with an operating system version number
in the form of
HP 54603B Oscilloscope has an earlier operating system, it can be
updated using upgrade kit HP part number 54601-68704. If your 54610B
Oscilloscope has an earlier operating system, it can be updated using
upgrade kit HP part number 54610-68704. The version number is briefly
displayed on screen when the
The HP 54659B in
A.XX.XX
. If your HP 54600B, HP 54601B, HP 54602B, or
These modules are compatible with all
key is pressed.
NOT
compatible with the HP 54600A,
Print/ Utilit y
key is pressed.
1–2
Page 11

Figure 1–1
Installation
To install th e Measurement/ S torage Module
To install the Measurement/Storage Module
1
Turn off the oscilloscope.
2
Install the module as shown below.
The oscilloscope is reset after installation. The installed module is reflected
in the message displayed when you turn on the oscilloscope.
Installi ng t he Measurement/Storage Modul e
1–3
Page 12

Interface Cabl es
Instal latio n
To configure t he interface
To configure the interface
The Measurement/Storage Module can be connected to a printer, a plotter, or
a computer through the interface. The HP 54657A has an HP-IB interface
and the HP 54658A has an RS-232 interface. The HP 54659B has an RS-232
interface plus an additional parallel output connector which allows the
module to be connected to both an RS-232 controller and a parallel printer at
the same time.
Connect the Measurement/Storage Module to a printer, plotter, or computer
through a suitable cable. The following table shows the HP part numbers of
the proper cables.
Interface
module
HP 54657A
(HP-IB)
HP 54658A
(RS-232)
HP 54659B
(RS-232 and
parallel output)
1
The HP 54659B is not comp at ible with t he HP 54600A, HP 54601A, HP 54602A, and HP 54610A.
1
Cable funct i on
(Instrument to ..)
Printer/plotter/
controller
Printer/plotter/
controller
Controller 25-pin F 25-pin M HP 92219J
Controller 25-pin F 9-pin M HP 24542G 3 m (9.9 ft)
RS-232 cont roller 9-pin M 25-pin M HP 34398A 2.5 m (8.2 ft)
RS-232 cont roller 9-pin M 9-pin M HP 343 98A 2.5 m (8.2 ft )
RS-232 printer/plotter/
controller
Parallel prin ter parallel parallel C2950A
Module
connector
HP-IB HP-IB HP 10833A
25-pin F 25-pin F HP 13242G
9-pin M 25-pin F HP 34398A + HP 34399A
Printer/plotter/
controller
connector
HP part number Cable
HP 10833B
HP 10833C
HP 10833D
HP 17255M
HP 17255D
adapter kit
C2951A
Length
1 m (3.3 ft)
2 m (6.6 ft)
4 m (13.2 ft)
0.5 m (1.6 ft)
5 m (16.7 ft)
1.5 m (4.9 ft)
5 m (16.7 ft
1.5 m (4.9 ft)
2.5 m (8.2 ft)
2 m (6.6 ft)
3 m (9.9 ft)
1–4
Page 13

Figure 1–2
Installation
To configure the interface
HP 54658A Serial Connections
The signals for the RS-232 port on the HP 54658A are listed below.
Pin Number Signal
2 Transmit Data
3 Receive Data
4 Request to Send
5 Clear to Send
6 Data Set Ready
7 Signal Ground
8 Data Carrier Det ect
20 Data Terminal Ready
SHELL Protective Ground
Pin out of HP 54 658A RS-232 port looking into DB25 female connect or
The following figures show the pin outs of the suggested HP RS-232 interface
cables used with the HP 54658A 25-pin connector.
1–5
Page 14

Figure 1–3
Figure 1– 4
Installation
To configure t he interface
Pin out of HP 13242G /HP 17255M R S-232 cable
Figure 1–5
Pin out of HP 24 542G RS-2 32 cable
Pin out of HP 92 219J/ HP 17255D RS-232 cable
1–6
Page 15

Figure 1–6
Installation
To configure the interface
HP 54659B Serial Connections
The signals for the 9-pin RS-232 port on the HP 54659B are listed below.
Pin Number Signal
1 Data Carrier Detect
2 Receive Data
3 Transmit Data
4 Data Terminal Ready
5 Signal Ground
6 Data Set Ready
7 Request to Send
8 Clear to Send
9Ring
SHELL Protective Ground
Figure 1–7
Pin out of HP 54659B RS-232 port looking into DB9 male connector
The following figure shows the pin out of the suggested HP RS-232 interface
cable used with the HP 54659B 9-pin connector.
1
2
3
4
5
6
7
8
9
9-pin
HP 54659B
Module
DCD
RX
TX
DTR
GND
DSR
RTS
CTS
RI
9-pin
male
54657b07.cdr
Printer/Plotter/
Controller
DCD
RX
TX
DTR
GND
DSR
RTS
CTS
RI
9-pin
male
HP 34398A
Cable
1
2
3
4
5
6
7
8
9
9-pin
female
Pin out of HP 34398A RS-232 cable
female
Refer to the "Programming over RS-232-C" chapter in the HP 54600–Series
Oscilloscopes Programmer’s Guide for additional information.
1–7
Page 16

1–8
Page 17

2
Operating the
Measurement/Storage Module
Page 18

Operating the Measurement/Storage
Module
This chapter provides you with the information necessary to use the
additional, or enhanced features that the Measurement/Storage
Module provides. Basic operation for the oscilloscope is covered in
the User and Service Guide for your oscilloscope.
This chapter provides you with practical exercises and detailed
information designed to guide you through operation of the following
functions:
• Math Functions
• Automatic Measurements
• Cursor Measurements
• Mask generation and waveform monitoring
• Trace Storage
2–2
Page 19

Operating the Measurement /Storage Module
Math Funct ions
Math Functions
Without the Measurement/Storage module installed, addition and subtraction
are the only math operations provided. In addition to the limited selections,
the single function is performed on the pixel position of the data on the
screen.
With the Measurement/Storage module installed, two functions define up to
six operations that create mathematically altered waveforms (not pixel math.)
Function 1 will add (+), subtract (–), or multiply (*) the signals acquired
•
on vertical inputs 1 and 2, then it will display the result as F1.
Function 2 will integrate, differentiate, or perform an FFT on the signal
•
acquired on input 1, input 2, or the result in F1; then it will display the
result in F2.
The vertical range and offset of each function can be adjusted for ease of
viewing and measurement considerations. Each function can be displayed,
measured (with cursors), stored in trace memory, or output over the
interface.
2–3
Page 20

Operating the Measurement/Storage Module
Function 1
Function 1
1
Press
±
.
2
Toggle the
3
Press the
A softkey menu with four softkey choices appears. Three of them are related
to the math functions.
4
Toggle the
Function 1 On Off
Function 1 Menu
+ – *
softkey until the desired operation is selected.
softkey to enable math function number 1.
softkey
Results (F1) are displayed on the screen.
All operations are calculated on a point-by-point basis.
plus (+)
•
•
•
5
Press the
Cursor s
algebraically sum input 1 and input 2 (input 1 + input 2).
minus (–)
multiply (*)
algebraically subtract input 2 from input 1 (input 1 – input 2).
algebraically multiply input 1 with input 2 (input 1 * input 2).
Units/div
softkey and rotate the knob closest to the
key to set the vertical sensitivity of the resulting
waveform.
6
Press the
Cursor s
Offset
softkey and rotate the knob closest to the
key to set the offset (from the center graticule) of the
resulting waveform.
Function waveform (F1) is available for viewing, measurement, or storage.
7
Press the
Funct io n 1 Operating Hints
If channel 1 or 2 are clipped ( not fully displayed on scr een, ) the resulti ng
displayed function will als o be clipped. Once the f unction is displayed, channel
1 and 2 may be t urned off for bett er viewing.
Previous Menu
softkey.
When multiply i s the operati on selected, the value displayed for unit s per
division and offset is (V
Offset is the value (in V or V
Normal screen position is 0 V offset, or at the center graticule (unt i l changed).
See "Making Cursor Measurements", and "S aving and Recalling Traces" in this
chapter for more i nformation.
2–4
2
).
2
) assigned to the center grati cul e for function 1.
Page 21

Operating the Measurement /Storage Module
Function 2
Function 2 will plot differential or integral waveforms, or perform an FFT
using the input signals connected to the vertical inputs (1 and 2), or using
the function 1 waveform.
1
Press
±
.
Function 2
2
Toggle the
3
Press the
4
Toggle the
Function 2 On Off
Function 2 Menu
Operand
softkey until the desired source is selected.
softkey to enable math function number 2.
softkey.
F1 uses the result waveform in function 1.
5
Press the
Operation
softkey until the desired operation is selected.
Results (F2) are displayed on the screen.
dV/dt
•
•
(differentiate) plots the derivative of the selected source using the
"Central Difference" formula. Equation is as follows:
c
c
–
2
+
n
n+1
=
d
n
+
i
∆
t(2i+1
i
)
Where
d = differential waveform
c = input 1, 2, or function 1
i = data point step size
∆
t = point-to-point time difference
∫dt
(integrate) plots the integral of the source using the "Trapezoidal Rule".
Equation is as follows:
∆
t
(
+
=
I
n
c
∑
2
)
c
n
n
+
1
Where
∆
t = point-to-point time difference
c = input 1, 2, or function 1
2–5
Page 22

Figure 2–1
Operating the Measurement/Storage Module
Function 2
The integrate calculation is relative to the currently selected source’s
input offset. The following examples illustrate any changes in offset
level.
0V
0V
Integrate and Of fset
FFT
(Fast Fourier Transform)
•
and transforms it to the frequency domain. The FFT spectrum is plotted
on the oscilloscope display as dBV (dBV or dBm for HP 54610 and
HP 54615/54616) versus frequency. Selecting this function also adds the
FFT Menu. See "FFT Measurement" later in this chapter for more
information.
6
Press the
Cursor s
Units/div
softkey and rotate the knob closest to the
key to set the vertical sensitivity of the resulting
inputs the digitized time record of the source
waveform.
Units per division changes from volts to dB when FFT is selected.
2–6
Page 23

Operating the Measurement /Storage Module
Function 2
7
Press the
Offset
(differentiate and integrate) or
and rotate the knob closest to the
Cursor s
Ref Levl
(FFT) softkey
key to set the offset
(from the center graticule) or reference level (top graticule) of
the resulting waveform.
Function waveform (F2) is available for viewing, measurement, or storage.
8
Press the
For FFT functions, an additional menu is available to set additional
parameters. See "FFT Measurement" later in this chapter for more
information.
Funct io n 2 Operating Hints
Timebase must be set to Ma i n (and input channels 3 and 4 to Off on 4-cha nnel
oscilloscopes) when using function 2.
When differen tial i s the operati on selected, the value displayed for un i ts per
division and offset is vol ts per second (V/s). When integral is the operation
selected, the value displ ayed for units per divisi on and offset is v ol t seconds
(Vs).
Offset is the value (in volts per second or v ol t seconds) assigned to the center
graticule for function 2. Normal screen position is 0 offset, or at the center
graticule (un til changed).
Previous Menu
softkey.
See "Making Cursor Measurements", and "S aving and Recalling Traces" in this
chapter for more i nformation.
2–7
Page 24

Operating the Measurement/Storage Module
FFT Measu rem ent
FFT Measurement
Operating Sy st em R equirements
Refer to "Oscilloscope Compatibility" on page 1-2 for operating system
requirements for FFT operation.
FFT (Function 2) is used to compute the fast Fourier transform using
vertical inputs (1 and 2), or the Function 1 waveform. This function takes
the digitized time record of the specified source and transforms it to the
frequency domain. When the function is selected, the FFT spectrum is
plotted on the oscilloscope display as dBV (dBV or dBm for HP 54610 and
HP 54615/54616) versus frequency. The readout for the horizontal axis
changes from time to Hertz and the vertical readout changes from volts to
dBV (dBV or dBm for HP 54610 and HP 54615/54616). For the HP 54610 and
HP 54615/54616, when 50Ω input is selected, readout is in dBm; when 1M
input is selected, readout is in dBV. dBV is a unit of measure that is
referenced to 1 Vrms. If the display of the HP 54600, HP 54601, HP 54602,
HP 54603, or HP 54645 is needed to be in dBm, the operator must apply an
external 50Ω load (HP 10100C or equivalent), and then perform the following
conversion:
dBm = dBV + 13.01
Ω
DC Value
It does not take the offset at center screen into account and is 1.41421
times greater than its actual value. The DC value is not corrected in
order to accurately represent frequency components near DC. All DC
measurements should be performed in normal oscilloscope mode.
2–8
The FFT computation produces a DC value that is incorrect.
Page 25

Operating the Measurement /Storage Module
FFT Meas urement
Figure 2–2
Aliasing
When using FFT’s, it is important to be aware of aliasing. This
requires that the operator have some knowledge as to what the
frequency domain should contain, and also consider the effective
sampling rate, frequency span, and oscilloscope vertical bandwidth when
making FFT measurements. Effective sample rate is briefly displayed
±
when the
key is pressed.
Aliasing happens when there are insufficient samples acquired on each cycle
of the input signal to recognize the signal. This occurs whenever the
frequency of the input signal is greater than the Nyquist frequency (sample
frequency divided by 2). When a signal is aliased, the higher frequency
components show up in the FFT spectrum at a lower frequency.
The following figure illustrates aliasing. In waveform A, the sample rate is set
to 200 kSa/s, and the oscilloscope displays the correct spectrum. In
waveform B, the sample rate is reduced by one-half (100 kSa/s), causing the
components of the input signal above the Nyquist frequency to be mirrored
(aliased) on the display.
Aliasing
Since the frequency span goes from ≈ 0 to the Nyquist frequency, the best
way to prevent aliasing is to make sure that the frequency span is greater
than the frequencies present in the input signal.
2–9
Page 26

Operating the Measurement/Storage Module
FFT Measu rem ent
Spectral Leakage
repeats. Unless there is an integral number of cycles of the sampled
waveform in the record, a discontinuity is created at the end of the
record. This is referred to as leakage. In order to minimize spectral
leakage, windows that approach zero smoothly at the beginning and end
of the signal are employed as filters to the FFT. The
Measurement/Storage Module provides four windows: rectangular,
exponential, hanning, and flattop. For more information on leakage, see
HP Application Note 243, "The Fundamentals of Signal Analysis" (HP
part number 5952-8898.)
FFT Operation
1
Press
2
Toggle the
3
Press the
4
Toggle the
F1 uses the result waveform in function 1.
5
Press the
±
.
Funct io n 2 On Off
Function 2 Menu
Operand
Operation
The FFT operation assumes that the time record
softkey to enable math function number 2.
softkey.
softkey until the desired source is selected.
softkey until FFT is selected. Results (F2) are
displayed on the screen.
6
Press the
Cursor s
Units/div
softkey and rotate the knob closest to the
key to set the vertical sensitivity of the resulting
waveform.
7
Press the
Cursor s
Ref Levl
softkey and rotate the knob closest to the
key to set the reference level (top graticule line) of
the resulting waveform.
The Autoscale F FT softkey will automatically set Units/div and Ref Levl to bring
the FFT data on screen. Frequency Span is set to maxim um . S teps 6 and 7 could
be replaced to say:
6 Press FFT Menu softkey.
7 Press Autoscale F FT softkey. R otate Time/Div knob until freq span is aro und
the frequencies of intere st .
8
Press the
A softkey menu with six softkey choices appears. Five of them are related to
FFT.
2–10
FFT Menu
softkey.
Page 27

Operating the Measurement /Storage Module
FFT Meas urement
Cent Freq
•
Select and rotate the knob closest to the
center frequency to the desired value.
Freq Span
•
right graticule). Select and rotate the knob closest to the
key to set the center frequency to the desired value. See FFT
Measurement Hints (next page) for information on using frequency
span to magnify the display.
Move 0Hz To Left
•
the left most graticule represents 0 Hz.
Autoscale FFT
•
and Ref Levl to bring the FFT data on screen. Frequency Span is set to
maximum.
Window
•
knob closest to the
rectangular window is useful for transients signals and signals where
there are an integral number of cycles in the time record. The hanning
window is useful for frequency resolution and general purpose use. It
is good for resolving two frequencies that are close together or for
making frequency measurements. The flattop window is the best
window for making accurate amplitude measurements of frequency
peaks. The exponential window is the best window for transients
analysis.
Previous Menu
•
FFT spectrum (F2) is available for viewing, measurement, or storage.
9
The
used to measure or move the FFT spectrum. Press
then set the
Find Peaks
peak with the highest amplitude and sets Vmarker2 and the stop marker (f2)
on the peak with the next highest amplitude. Marker values in dBV/dBm or
frequency (dependent on the active cursor)are automatically displayed at the
bottom of the oscilloscope screen. The difference in dBV/dBm (∆V) or
frequency (∆f) between the two peaks is also displayed.
Move f1 To Center
frequency) to the current f1 marker frequency. If f1 cannot be found, a
message is displayed on the screen.
Allows centering of the FFT spectrum to the desired frequency.
Cursor s
Sets the overall width of the FFT spectrum (left graticule to
Pressing this key changes the center frequency so that
The AAutoscale FFT softkey will automatically set Units/div
Allows one of four windows to be selected. Select and rotate the
Cursor s
Returns you to the previous softkey menu.
Cursor s
Pressing this key sets Vmarker1 and the start marker (f1) on the
key contains two additional selections that can be
Source
softkey to F2.
Pressing this key changes the center graticule (or center
key to set the desired window. The
key to set the
Cursor s
Cursor s
,
2–11
Page 28

Operating the Measurement/Storage Module
FFT Measu rem ent
The following FFT spectrum was obtained by connecting the front panel
probe adjustment signal to input 1. Set Time/Div to 500 s/div, Volts/Div to
100 mV/div, Units/div to 10.00 dB, Ref Level to –10.00 dBV, Center Freq to
6.055 kHz, Freq Span to 12.21 kHz, and window to Hanning.
Figure 2–3
fft(1) 6.05kHz 12.2kHz 1 STOP
f1(F2) = 1.221kHz f2(F2) = 3.662kHz f(F2) = 2.441kHz
Cent Freq Freq Span Move 0Hz Autoscale Window Previous
6.055kHz 12.21kHz To Left FFT Hanning Menu
FFT Measurements
FFT Measur em ent Hints
It is easies t t o view FFT’s wi th Vectors set to On. The Vector display m ode is set
in the Displ ay menu. Note that on the HP 54615/54616, when Vectors is set from
Off to On, the f requency span i s halved, and w hen Vectors is set from On t o Off,
the frequency span is doubled.
The number of p oi nts acquired f or the FFT record i s normally 1024 (see FFT
"Operating Characterist i cs" in Chapter 3 for specifics , ) and when frequency span
is at maximum, all points are displayed. Once the FFT s pectrum is di splayed, the
frequency sp an and center fre quency controls are used much l i ke the control s
of a spectrum analyzer to ex am i ne the frequen cy of interest in greater deta i l .
Place the des i red part of the wa veform at the center of the screen and decreas e
frequency sp an to increase t he di splay res ol ution. As fre quency span is
decreased, the number of poi nts shown is reduced, and the di splay is magnified.
2–12
Page 29

Operating the Measurement /Storage Module
FFT Meas urement
FFT Measur em ent Hints – Cont inued
While the FF T spectrum is displayed, use the and Curs or keys to sw i tch between
measurement functions and frequency domai n controls in FFT menu. S ee the
end of the manual for display menus.
Decreasing the effective sampling rate by selecting a sl ower sweep speed will
increase the l ow frequency re solution of the FF T display and also incre ase the
chance that an alia s will b e dis play ed. The resolution of the FFT is one-half o f
the effective sample rate di vided by the n um ber of points in the FFT. The actual
resolution of the display will not be this fine as the shape of the window will be
the actual limiting factor in t he FFT’s ability to resolve two closely space
frequencies. A good way to test the ability of the F FT to r es olv e two closely
spaced frequencies is to e xamine the sidebands of an a m pl i tude modulated sine
wave. For exam ple, at 2 MS a/sec effectiv e sampling rat e, a 1 MHz AM signal
can be resolved to 2 kHz. Increasing the eff ective sampli ng rate to 4 MS a/sec
reduces the res ol ution to 5 kHz.
For the best vertical accuracy on peak measurements:
• Make sure the sour ce i m pedance and probe attenuati on i s set correctly.
The impedance and p robe attenuatio n are set from the C hannel menu if
the operand is a cha nnel .
• Set the source sensitivity so t hat the input si gnal i s near full screen, but
not clipped.
• Use the flattop window.
• Set the FFT sensiti vity to a sens i tive range, such as 2 dB/d i vision.
For best frequency accuracy on peaks:
• Use the Hanning w i ndow .
• Use cursors to pla ce f1 cursor on the frequency of interest.
• Press Move f1 to Center softkey.
• Adjust frequency span for bette r cursor placement.
• Return to the Curso rs m enu to fine tune t he f1 cursor.
For more info rm ation on the us e of window please refer to HP Applicatio n Note
243," The Fundamentals of S i gnal Analysis" Chapter II I, S ection 5 (HP part
number 5952 -8898.) Ad di tional information can be obt ai ned from "Spect rum and
Network Measurements" by R obert A Witte, in Chapter 4 ( HP part number
5960-5718.)
2–13
Page 30

Figure 2–4
Operating the Measurement/Storage Module
Automatic M easurements
Automatic Measurements
With the Measurement/Storage Module installed, the oscilloscope is capable
of making five additional automatic voltage and time measurements.
Delay Measurements
•
Phase Measurements
•
Voltage Amplitude
•
Voltage Overshoot
•
Voltage Preshoot
•
In addition to the measurements, the thresholds used for automatic time
measurements are user-selectable.
Automatic M easurements
2–14
Page 31

Operating the Measurement /Storage Module
Setting Thres holds
Setting Thresholds
Without the Measurement/Storage module installed, rise time and fall time
measurements are performed at the 10%/90% threshold levels. The
remaining five time measurements (frequency, period, duty cycle, positive
pulse width, and negative pulse width) are all performed at the 50%
transition point. Refer to the User and Service Guide for your oscilloscope
for more information.
With the Measurement/Storage module installed, the thresholds are user
selectable. Rise time and fall time measurements are performed at 10%/90%,
20%/80%, or at a user defined threshold level. The remaining five time
measurements are performed at the center point of the currently selected
upper and lower threshold values.
If 10%/90% is selected, the center is 50%.
•
If 20%/80% is selected, the center is 50%.
•
If voltage is selected, the center is dependent on the current lower and
•
upper values.
As an example, if the lower value is set to 0 V, and the upper value is set to
50 mV, then the 50% level is 25 mV. 25 mV is the point that frequency,
period, duty cycle, positive pulse width, and negative pulse width will be
measured. The point of measurement is dependent on the amplitude of the
input signal.
2–15
Page 32

Figure 2–5
Operating the Measurement/Storage Module
Setting Thres holds
User Threshol ds
1
Press
2
Press the
Time
Next Menu
.
softkey until the
Define Thre sholds
softkey is
displayed on the far left side.
3
Press the
4
Press the desired
A softkey menu with six softkey choices appears. Five of them are related to
selecting thresholds.
10% 90%
•
and 90% (upper) levels. Frequency, period, duty cycle, positive pulse
width, and negative pulse width measurements will be performed at the
50% level.
20% 80%
•
and 80% (upper) levels. Frequency, period, duty cycle, positive pulse
width, and negative pulse width measurements will be performed at the
50% level.
2–16
Define Thresholds
Thresholds
Rise time/fall time measurements performed at the 10% (lower)
Rise time/fall time measurements performed at the 20% (lower)
softkey.
softkey.
Page 33

Operating the Measurement /Storage Module
Setting Thres holds
Voltage
•
upper levels specified by you. Frequency, period, duty cycle, positive
pulse width, and negative pulse width measurements will be performed at
the center of both entered levels.
Lower
•
Select and rotate the knob closest to the
lower threshold to the desired value.
Upper
•
Select and rotate the knob closest to the
upper threshold to the desired value.
Previous Menu
•
Selecting User Threshold Hints
Lower threshold level ca nnot be set to a v al ue higher than the current upp er
threshold le vel.
Upper thresh ol d l evel cannot be set to a value lower than the current lower
threshold le vel.
If the upper and l ow er thresholds are set to level s greater to, or l ess than, the
current displ ayed wavefor m , then the automati c ri se time, fal l tim e, frequency,
period, duty cycle, positi ve pulse wid th, and negative pulse width m easurements
will not be performed. This is b ecause the measurement point is not on the
waveform.
Rise time/fall time measurements performed at the lower and
This softkey is displayed only when
This softkey is displayed only when
Returns you to the previous softkey menu.
Voltage
Cursor s
Voltage
Cursor s
softkey is selected.
softkey is selected.
key to set the
key to set the
Cursors can be used to set t he threshold v ol tage levels as follows:
• Select an automati c tim e measurem ent with Show Meas set to On, and
thresholds set to 10%/90%. Once initiated, the cursors will dis play on the
waveform.
• Press Cursors key and record the current cursor voltage levels.
• Select Define Meas urement Voltage, and adju st the upper and low er levels
to the previously recorded valu es.
• Slowly rotate the k nob closest to the Cursors key to fine tune the upper and
lower threshold to the desired v alues. Cursor will track a s long as the
measurement is valid.
2–17
Page 34

Figure 2–6
Operating the Measurement/Storage Module
Setting Thres holds
User Threshol d Ri se Time Measu rement
2–18
Page 35

Operating the Measurement /Storage Module
To make delay m easurements automatically
To make delay measurements automatically
You can measure the delay of signals connected to the oscilloscope’s input 1
and input 2 connectors when the Measurement/Storage Module is connected
to the oscilloscope.
Delay is measured from the user-defined slope and edge count of the signal
connected to input 1, to the defined slope and edge count of the signal
connected to input 2.
1
Adjust controls so that a minimum of 6 full cycles of the signals
connected to inputs 1 and 2 are displayed.
Press
Time
.
2
3
Press the
Next Menu
softkey until the
Define Thresholds
softkey is
displayed on the far left side.
4
Press the
A softkey menu with five softkey choices appears. Four of them are related
to defining the delay measurement.
Chan 1
•
measurement will START. Threshold level is always 50%.
Edge
•
will START.
Chan 2
•
measurement will STOP. Threshold level is always 50%.
Edge
•
will STOP.
Previous Menu
•
5
Use the displayed softkeys to specify the starting (from) and stopping
Define Delay
Selects the channel 1 slope (rising or falling) where the delay
Selects the edge count (from 1 to 5) where the delay measurement
Selects the channel 2 slope (rising or falling) where the delay
Selects the edge (from 1 to 5) count where the delay measurement
softkey.
Returns you to the previous softkey menu.
(to) slope and edge count. Transition point (measurement threshold
level) is fixed at 50%.
6
Press the
Previous Menu
softkey.
2–19
Page 36

Operating the Measurement/Storage Module
To make delay m easurements automatically
Figure 2–7
7
Press the
Measure Del ay
softkey. Delay is measured and displayed on
the screen.
Negative delay values indicate the defined edge on channel 1 occurred after
the defined edge on channel 2.
Automatic Delay Measurem ent Hints
If an edge is selected t hat is not displayed o n th e s creen, delay will not be
measured.
User threshol ds have no effect on automati c delay measurements. Delay is
always meas ured at the 50% transition point (measure m ent threshold le vel).
Automatic D elay Measurement
2–20
Page 37

Operating the Measurement /Storage Module
To make phas e m easurements automatically
To make phase measurements automatically
Phase shift between two signals can be measured using the Lissajous method.
Refer to the User and Service Guide for your oscilloscope for more
information.
With the Measurement/Storage Module installed, phase is automatically
measured and displayed. Measurement is made from the rising edge of the
first full cycle on the input 1 signal, to the rising edge of the first full cycle on
the input 2 signal. The method used to determine phase is to measure delay
and period, then calculate phase as follows:
Phase =
1
Adjust controls so that a minimum of one full cycle of the signal
period
delay
of input 1
connected to input 1 is displayed.
Press
Time
.
2
x 360
3
Press the
Next Menu
softkey until the
Define Thresholds
softkey is
displayed on the far left side.
4
Press the
Measure Ph ase
softkey. Phase is measured and displayed on
the screen.
Negative phase values indicate the displayed signal on channel 2 is leading
the signal on channel 1.
Automatic Phas e Measurement Hints
If one full cycle of the signal connected to input 1 is not displayed , phas e will not
be measured.
User threshol ds has no effect on automati c phase measurements. Phase is
always meas ured at the 50% transition point (threshold level).
When using the delaye d time base, the instrument will attempt to perform the
measurement using the delayed window. If the selected c hannel 1 edge,
channel 2 edg e, and channel 1 period cannot be found in the delayed wind ow ,
the main wind ow i s used. See "Time Measurem ents" in the
Guide
for your oscilloscope for more information.
User and Service
2–21
Page 38

Figure 2–8
Operating the Measurement/Storage Module
To make phas e m easurements automatically
Automatic Phase Measurem ent
2–22
Page 39

Operating the Measurement /Storage Module
To make additional voltage measurements automatically
To make additional voltage measurements
automatically
With the Measurement/Storage Module is installed, the following additional
automatic voltage measurements can be performed.
Vamplitude
•
waveform. When performing a measurement on a particular cycle, set the
controls to display only that cycle is displayed. The method used to
determine voltage amplitude is to measure Vtop and Vbase, then calculate
voltage amplitude as follows:
voltage amplitude = Vtop – Vbase
Vovershoot
•
an Overshoot measurement. If more than one waveform, edge, or pulse is
present, the measurement is made on the first edge acquired. The method
used to determine overshoot is to make three different voltage
measurements, then calculate overshoot as follows:
Amplitude Voltage measurement is made using the entire
A minimum of one edge must be displayed in order to perform
percent overshoot =
Vpreshoot
•
a Preshoot measurement. If more than one waveform, edge, or pulse is
present, the measurement is made on the first edge acquired. The method
used to determine preshoot is to make three different voltage
measurements, then calculate preshoot as follows:
A minimum of one edge must be displayed in order to perform
percent preshoot =
Vmax–Vtop
Vtop–Vbase
Vmin–Vbase
Vbase–Vtop
x 100
x 100
2–23
Page 40

Operating the Measurement/Storage Module
To make additional voltage measurements automatically
1
Adjust controls until the desired signal is displayed.
2
Press
Voltag e
.
Figure 2–9
3
Press the
4
Press the
Source
Next Menu
far left side.
5
Press the desired
Vamp
•
•
•
Select to perform a voltage amplitude measurement.
Vover
Vpre
Select to perform an overshoot measurement.
Select to perform a preshoot measurement.
softkey until the desired source is selected.
softkey until the
Voltage Measurement
Vamp
softkey is displayed on the
softkey.
Automatic Overshoot Measurement
2–24
Page 41

Operating the Measurement /Storage Module
To make addi ti onal cursor meas urements
To make additional cursor measurements
Without the Measurement/Storage Module installed, cursor measurements
can be performed on channels 1 through 4, and are displayed in volts (V1/V2)
and time (t1/t2). Refer to the User and Service Guide for your oscilloscope
for more information.
With the Measurement/Storage Module installed, additional cursor
measurement features include:
Measurements can now be performed on functions 1 and 2.
•
You can define voltage marker units as either volts or relative percent.
•
You can define the time units as either seconds or relative degrees.
•
1
Adjust controls until the desired signal is displayed.
Press
Cursor s
.
2
3
Toggle the
Source
softkey until the desired source is selected
(channels 1 through 4, functions 1 and 2).
4
Press the
5
Toggle the
If Readout Volts is selected, cursor measurements are displayed in volts (V1,
V2, and ∆V), and operation is identical as when the module is not installed.
Refer to the User and Service Guide for your oscilloscope for more
information.
6
Toggle the
Active Cursor V1 V2
Readout
Active Cursor V1 V2
softkey to select voltage markers in percent.
softkey.
softkey until the desired marker(s) (V1,
V2, or both) are selected, and rotate the knob closest to the
Cursor s
When both V1/V2 markers are selected, rotating the knob closest to the
Cursor s
7
Press the
key to set the marker(s) to the desired position.
key moves both markers.
Set 100%
softkey to set the V1 marker to 0% and the V2
marker to 100%. All readings are now relative to the established
V1/V2 marker positions.
V1 reads the percentage the V1 marker has moved from the established
•
0% position. Negative readings indicate marker has moved away from the
V2 marker.
2–25
Page 42

Figure 2–10
Operating the Measurement/Storage Module
To make additional cursor m easurements
V2 reads the percentage the V2 marker has moved from the established
•
100% position. Negative readings indicate marker has moved through the
established V1 marker position.
∆
V reads the percentage difference between the V1 and V2 marker
•
repetitive to the established positions. Negative readings indicate markers
have crossed.
Voltage Cursor Measurements in Percent
8
Press the
9
Toggle the
If Readout Time is selected, cursor measurements are displayed in seconds
(t1, t2, and ∆t), and Hz (1/∆t). Operation is identical as when the module is
not installed. Refer to the User and Service Guide for your oscillosocpe for
more information.
10
Toggle the
Active Curs o r t1 t2
Readout
Active Cursor t1 t2
softkey to select time markers in degrees.
softkey.
softkey until the desired marker(s) (t1, t2,
or both) are selected, and rotate the knob closest to the
Cursor s
When both t1/t2 markers are selected, rotating the knob closest to the
Cursor s
2–26
key to set the marker(s) to the desired position.
key moves both markers.
Page 43

Operating the Measurement /Storage Module
To make addi ti onal cursor meas urements
11
Press the
Set 100%
softkey to set the t1 marker to 0° and the t2 marker
to 360°. All readings (except second ∆t display in seconds) are now
relative to the established t1/t2 marker positions.
t1 reads the phase the t1 marker has moved from established 0° position.
•
Negative readings indicate marker has moved away from the t2 marker.
t2 reads the phase the t2 marker has moved from established 360
•
position. Negative readings indicate marker has moved through the
established t1 marker position.
∆
t in degrees reads the phase difference between the t1 and t2 marker
•
repetitive to the established positions. Negative readings indicate markers
have crossed.
∆
t in seconds reads the time difference between the t1 and t2 marker
•
positions. Negative readings indicate markers have crossed.
Additional FFT Function Ke ys
When the FFT f unction is selected (refer to Math Functions ), two addit i onal k eys
are available as follows:
Find Peaks Pressing this key s ets V m arker1 and the start marker (f1) on the FFT
trace peak wi th t he highest ampl i tude and sets Vm arker2 and the stop marker
(f2) on the peak w i th the next highest amplitude. Marker va l ues in dBV or
frequency (de pendent on the ac tive cursor)are automatical l y displayed at the
bottom of the oscilloscope screen. The diffe rence in dBV (∆V) or frequency ( ∆f)
between the two peaks is als o displayed.
°
Move f1 To Center Pressing this key changes the center grati cul e (or center
frequency) to the current f1 marker freque ncy. If f1 cannot be found, a mess age
is display ed on the screen .
2–27
Page 44

Figure 2–11
Operating the Measurement/Storage Module
To make additional cursor m easurements
Cursor Measurement Hints
If cursors are po sit i oned too closely t oget her, an error will be dis play ed when
the SET softk ey is select ed.
Displayed m arker readings in percent ( %) and degrees (°) are always relative
measurement s, w i th the curren t reading dependent on the previ ously
established 100% or 360 reference setting.
Time Cursor M easurements in Degrees
2–28
Page 45

Operating the Measurement /Storage Module
Unattende d W aveform Moni toring
Unattended Waveform Monitoring
The Measurement/Storage Module simplifies circuit debugging by comparing
an active channel (not functions) trace on the display to one of two test
templates.
When a failure is detected, the oscilloscope can be instructed to take one of
several actions.
The test can be set to stop after the first failure, or to continue regardless
•
of the number of failures found.
The failed trace(s) can be stamped with the date and time of the failure,
•
and stored in trace memory or output to a hardcopy device. When trace
memory is selected, the user has the option of saving all failures, or saving
only the last failure that occurred.
The test can continue with statistics on the number of failures (reported
•
as a percentage of the number of tests performed) being displayed.
The mask templates can be defined one of two ways. Once a mask is created,
it is stored in nonvolatile RAM.
Automask
•
data. You are allowed to select the mask tolerance prior to creating the
template.
Editor
•
areas of specific interest, or to create a complete new mask. Mask editor
allows pixel-by-pixel editing, and smoothing of the mask by using a
running average of three pixels.
Failures can be specified one of two ways.
Inside
•
and minimum limit lines of the mask template.
Outside
•
maximum and minimum limit lines of the mask template.
Quickly generates a mask template from currently displayed
Used to adjust the tolerances of a previously created template in
Test fails if signal falls inside the region defined by the maximum
Test fails if signal falls outside the region defined by the
2–29
Page 46

Operating the Measurement/Storage Module
To create a ma sk template usi ng Automask
To create a mask template using Automask
A mask template contains two limit lines: minimum and maximum.
Automask allows you to easily generate a mask with tolerances from a
displayed waveform on the screen.
1
Connect a known good signal to the oscilloscope.
2
Set up the oscilloscope with the settings that are required to test the
signal.
3
Press
±
.
4
Press the
5
Toggle the
Mask Test
Use Ma sk
softkey.
softkey to select the desired mask number
(1 or 2).
6
Press the
7
Press the
Cursor s
Pressing the softkey increases the tolerance value by 0.2%.
8
Press the
Define Mask Automask
Tolerance
softkey, then turn the knob closest to the
softkey.
key to set the tolerance.
Create Mask
softkey to create the mask with the specified
tolerance.
Tolerance Operating Hint
The tolerance used in Automas k is express ed as a percent age of the full-s cal e
time and volt age of the lowest num ber of all ac tive channels. It does not
represent the tolerance of the actual size of the input signal. To speci fy the
tolerance as a percentage of the actual size of the input si gnal requires some
additional cal culations.
For example , a signal of 1 v ol t peak-to-peak is tested at a v ertical sensitivity of
500 mV/div. The full-scal e voltage equals the vol ts /div times th e num ber of
full-scale divisions ( 50 0 mV * 8 = 4 V) . To s pecify a 4% tolerance on a 1 V
peak-to-peak signal requires a 40 mV tol erance, but to specify a 40 m V tolerance
on a full-sca l e voltage of 4 volts requires a 1% toleran ce. Therefore, a 1%
tolerance shoul d be specified to generate the mask template.
2–30
Page 47

Operating the Measurement /Storage Module
To create a mask template using Autostore
To create a mask template using Autostore
An envelope of the passing region can be generated using the Autostore
function. Then the Automask function can read the Autostore screen
information and take the maximum and minimum limits of it as the limit lines
of the mask template. This process allows you to create a mask template
from a known good signal, allowing certain tolerance margins.
1
Connect a known good signal to the oscilloscope.
2
Set up the oscilloscope with the settings that are required to test the
signal.
Press
Displa y
, then toggle the
3
position.
Press
Autost or e
Make sure that STORE is displayed in the status line. If STORE is not
displayed, press Autostore again.
.
Set the voltage tolerance by moving the waveform up and down with
4
5
the vertical position knob, creating a vertical envelope.
6
Set the time tolerance by moving the waveform back and forth with
the horizontal delay knob, creating a horizontal envelope.
You may need to repeat steps 5 and 6 to fine tune the envelope. Cursors can
be used to accurately measure the margins.
An alternative method is to vary the input signal amplitude (level) and
frequency (time) by the desired amount.
7
Press
±
.
Grid
softkey to the None
8
Press the
9
Press the
10
Press the
Mask Test
Use Mask
Define Mask Automask
softkey.
softkey to select the desired mask number (1 or 2).
softkey.
2–31
Page 48

Operating the Measurement/Storage Module
To create a ma sk template usi ng Autostore
11
Press the
Cursor s
If additional tolerance is desired, set the tolerance to the appropriate level.
This will be the amount "added on" to the previously created envelope.
12
Press the
Tolerance
softkey, then turn the knob closest to the
key to set the tolerance to ±0.0%.
Create Mask
softkey to create the mask from the autostore
information.
Automask Using Autostor e Operating Hin t
The Automask function takes all the inform ation displ ayed in half bri ght to create
the mask. However, the display grid and the autostore information shares the
same half-br i ght display. If the grid is turned on, and Aut ostore information is on
the screen when the Create Mask softkey i s pressed, a w arni ng message is
displayed: "Grid must be None to generate mask wit h Autostore." T he Display
Grid must be turned to None p ri or to creating t he autostore data in order to us e
Automask function. Turning the grid to N one after the autos tore data is c reated
erases both the grid and the autostore data. Use of cursors does not af fect the
Automask function and is hi ghly recommended to ensure the proper te st i ng
margin in the autostore inform ation.
If there is noise rising on the limit lines, you can use the smooth function in the
mask editor to smooth out the noise.
2–32
Page 49

Operating the Measurement /Storage Module
To create or edit a mask using line segments
To create or edit a mask using line segments
The Measurement/Storage Module has a built-in Mask Editor for creating or
editing masks. It provides two editing tools: pixel editing and line drawing
editing. The line drawing editing tool can also be used to create a mask using
line segments.
To create the mask, you may want to first draw the mask on a piece of paper
and mark the coordinates of the end points of each straight line.
1
Press
±
.
2
Press the
3
Press the
4
Press the
A softkey menu with five softkey choices appears. Four of them are related
to the mask editing functions.
If a mask has been previously created, it will be displayed.
Edit Line
•
the bottom limit line, and maximum is selected to edit the top limit line.
Line Drawing - Mark and Connect
•
straight lines in the mask. Their operation is explained later in this
paragraph.
Smooth Mas k
•
mask. It is especially useful for smoothing a mask created by Automask,
which may contain noise on the mask.
Each time Smooth Mask is selected, the entire mask is updated.
Selecting smoothing numerous times can alter the desired mask
pattern.
Previous Menu
•
Mask Test
Use Mask
Define Mask Editor
Selects the limit line to be edited. Minimum is selected to edit
softkey.
softkey to select the desired mask number (1 or 2).
softkey.
Mark and Connect are used for drawing
A running average of three pixels is used to smooth the
Returns you to the previous softkey menu.
2–33
Page 50

Operating the Measurement/Storage Module
To create or edit a mask using line segments
5
Toggle the
6
Turn the Delay knob to move the X-coordinate of the cursor to the
Edit Line
softkey to select the limit line you want to edit.
time corresponding to the first point.
If a mask has been previously created, both the X and Y coordinate of the
cursor will track the selected limit line.
7
Turn the knob closest to the
Cursor s
key to move the
Y-coordinate of the cursor to the voltage corresponding to the
first point.
8
Press the
Mark
softkey to mark this point as the first point of a line
draw.
9
Turn the delay knob to move the X-coordinate of the cursor to the
time corresponding to the second point.
10
Turn the knob closest to the
Cursor s
key to move the
Y-coordinate of the cursor to the voltage corresponding to the
second point of the line.
11
Press the
12
Repeat procedures 5 through 11 until the desired mask is created.
Mask Editor Operating Hint
When you want to move the cursor to a particular location , i t is essential to first
move the X-co ordi nate of the cursor then the Y-coordinate. Ot herwise, the
movement of the Y-coordinate changes the position of a pixel at an undesired
location.
Connect
softkey to draw the line between both points.
After you press the Connec t s oftkey, the two points are c onnected by a str ai ght
line. Points between the two end points ar e i nterpolated. However, if the
voltage of a particular poi nt during interpol ation viol ates the rule of the voltage
at the maximum limit ≥ the voltage at the minimum limit, the voltage is set to the
same value as the other limit.
After you have marked the fi rst point, pres sing the Mark s oftkey again cancels
the previously marked point and starts the procedure ov er.
After you have connected the two points, pressing the C onnect softkey again
will undo the connect operation.
2–34
Page 51

Operating the Measurement /Storage Module
To edit an ind iv idual pixel of a mask
To edit an individual pixel of a mask
Previously created masks can be edited pixel-by-pixel using the line drawing
editing tool. The Delay knob selects the column to be edited, and the
Cursors knob moves the mask vertically.
1
Press
±
.
2
Press the
3
Press the
4
Press the
5
Toggle the
Mask Test
Use Mask
Define Mask Editor
Edit Line
softkey.
softkey to select the desired mask number (1 or 2).
softkey to select the limit line that you want to
softkey.
edit.
6
Turn the Delay knob to move the cursor to the pixel (column) that
you want to modify.
7
Turn the knob closest to the
Cursor s
key to edit the vertical
position of the pixel.
It is possible to repeat steps 6 and 7 (simultaneously) using two hands to
create a nice smooth mask.
Pixel Editing Operating Hint
The time and v ol tage shown at the bottom of the screen corres ponds to the
current time b ase and vertic al setting of lowest number of al l active channels. If
the mask is v ol tage and time dependent, ma ke sure that the current time base
and vertical setting are the same as the on e that you are goi ng to use during the
actual testing.
Once the Cursor knob is mov ed, the selected pixel is edited. To re m ove
undesired ed i ts , use the mark a nd connect softk eys (previous l y discussed).
2–35
Page 52

Operating the Measurement/Storage Module
To edit the mas k to test only a portion of a wav eform
To edit the mask to test only a portion of a waveform
In certain circumstances, not all the points on the waveform need to be
tested. Only the area of interest needs to be tested. For example, to test the
amount of overshoot of a pulse, you only need to test the portion of the
waveform after the rising edge. You can select the test region by editing the
shape of the mask template.
1
Press
±
.
2
Press the
3
Press the
4
Press the
5
Toggle the
Mask Test
Use Mask
Define Mask Editor
Edit Line
softkey.
softkey to select the desired mask number (1 or 2).
softkey to select the limit line that you want to
softkey.
edit.
6
Turn the Delay knob to move the cursor to the starting location that
you do not want to test.
7
Turn the knob closest to the
Cursor s
key to move the voltage
cursor until it reads "Don’t Care".
8
Press the
9
Turn the Delay knob to move the cursor to the ending location of the
Mark
softkey.
region that you do not want to test.
10
Turn the knob closest to the
Cursor s
key to move the voltage
cursor until it reads "Don’t Care".
11
Press the
This region of this particular limit line is not tested during the mask testing.
Connect
softkey.
2–36
Page 53

Figure 2–12
Operating the Measurement /Storage Module
To edit the mask to test only a portion of a waveform
Mask Editing Operating Hin t
Each limit line can have its own se lect able test region.
The figure below shows a mask that tests the overshoot o f t he w aveform. Note
that only the p art you are inte rested in is te st ed. The test regi on can be set
individually for the maximum and minimum limit.
Example mask template with selectable test region
2–37
Page 54

Operating the Measurement/Storage Module
To start waveform monitor ing
To start waveform monitoring
Before using a testing mask to monitor a waveform, the mask must be
created. Once created, the mask is automatically stored in one of the two
nonvolatile mask memories. Procedures for creating a mask template are
provided in this chapter.
1
Press
±
.
2
Press the
3
Press the
Mask Test
Use Mask
softkey.
softkey to select the previously created mask
number (1 or 2).
4
Press the
A softkey menu with six softkey choices appears. Five of them are related to
the mask testing functions.
Fail When – In or Out
•
out of, or in to the mask template.
On Fail - Stop or Run
•
after a test violation has occurred.
Auto Save – Off or On
•
recorded. When On is selected, an additional softkey appears. See
"Automatically Saving Test Violations" later in this chapter for more
information.
Save To
•
Toggle softkey to direct test failure data to the Trace memory, or to the
Printer. When Trace is selected, an additional softkey appears.
Test Options
When stop is selected, the current acquisitions stop when the first
violation of the mask occurs. The test can be restarted by pressing
the RUN key.
When run is selected, the oscilloscope continues to acquire data
and display the most recent trace.
This softkey is displayed only when
softkey.
Selects if a test failure occurs when the signal moves
Used to select what state the oscilloscope will be in
Used to select if a test violation waveform is
Auto Save On
is selected.
2–38
Page 55

Operating the Measurement /Storage Module
To start waveform monitor ing
Increment
•
Previous Menu
•
5
Toggle the softkeys to select the desired testing options.
6
Press the
7
Press the
Selecting on immediately starts the test using the test options specified. Test
indications are displayed on the display line as follows.
Pass
•
Fail
•
and disposition of the failed data is dependent on the testing options
selected.
Acquisitions
•
Failures
•
occurred during the test.
This softkey is displayed only when
When On, all test violations are saved by incrementing the trace
number. The starting trace number is the one that is currently
selected. When the 64K compressed memory is full, the oldest
trace memory is overwritten, and the trace count continues
incrementing. When the trace count reaches 100, the number
resets to 1 (wraps around).
When Off, only the last test violation is saved, as test failure data is
written over previously stored data.
Returns you to the previous softkey menu.
Previous Menu
Mask Test
Indicates the displayed waveform passed the test.
Indicates the displayed waveform failed the test. Further testing,
Indicates the total acquisitions made during the test.
Indicates the total number (and percentage) of test failures that
softkey.
softkey until On is selected.
Save To Tra ce
is selected.
Waveform Mo nit oring Operating Hint
Mask template testing can only be used in the Main Horizontal M ode, and when
Functions 1 and 2 are set to of f.
The trace review softkey ca n be used to revi ew al l saved failures. See "To S ave
or Recall Tra ces" in this c hapter for more information.
2–39
Page 56

Operating the Measurement/Storage Module
To automatical ly save test violations
To automatically save test violations
The signals that fail the waveform monitoring test can be saved, then
viewed/measured at a later time. Provisions are provided to save the
violations in trace memory, or print a hardcopy of the data. When trace is
selected, the option of saving only the last violation, or saving all violations
are provided.
1
Setup for waveform monitoring as described previously.
2
Press
±
.
3
Press the
4
Press the
5
Press the
Determine how the test violations are being saved, and proceed as follows:
To print test violation data on an externally connected printer, toggle the
•
Save To
To save test violation data in trace memory, toggle the
•
until
To save only the last test violation waveform in trace memory, toggle the
•
Increment
To save all test violation waveforms in trace memory, toggle the
•
softkey until On is selected.
6
Press the
7
Press the
Mask Test
Test Options
Auto Save
softkey until
Trace
is selected. This causes the
softkey until
Previous Menu
Mask Test
softkey.
softkey.
softkey to ON. This causes the
Print
is selected.
Off
is selected.
softkey.
softkey until On is selected.
Increment
Save To
softkey to appear.
Save To
softkey to appear.
softkey
Increment
2–40
Page 57

Operating the Measurement /Storage Module
To automatical ly save test violations
Saving Test Vi olation Data Operating Hint
When Increment On is select ed, traces ≥3 to 1 00 are stored in the compres sed
state. During the compres sion and stora ge of data, new signals are not
acquired or te st ed. The time it takes to compr ess and store data is less than 10
seconds.
When Increment On is select ed, and multiple violations are desired, the On Fail
softkey must be set to Run (i n the Test Options menu). The s tarting trace num ber
is the one that i s currently sel ected. When the 64K compressed memory is full,
the oldest tra ce m em ory is ove rw ri tten, and the trace count cont i nues
incrementing. W hen the trace c ount reaches 100, the number resets to 1 (wraps
around).
2–41
Page 58

Figure 2–13
Operating the Measurement/Storage Module
Creating a delay testing ma sk
Creating a delay testing mask
A mask can be used to test the channel to channel delay of two input signals.
The shape of the mask varies depending on the channel 2 edge selected (stop
edge). Different masks are needed for different edge selections.
To test the channel to channel delay of the signal connected to channel 2, the
stop edge of the signal is tested instead of actually measuring the delay. The
test can be conducted by triggering on the start edge (channel 1), and testing
for the location of the stop edge (channel 2). An example mask is shown in
the following figure.
Example of a ma sk t em plate used in channel to channel del ay
2–42
Page 59

Operating the Measurement /Storage Module
Creating a delay testing ma sk
The following procedure can be used to setup a mask template for testing
channel to channel delay.
In the oscilloscope setup, the controls should be selected to display the start
edge (channel 1) as the first edge on the display, and the stop edge
(channel 2) as the last edge on the display. The trigger source should be set
to trigger from channel 1. The mask template can be created by using an
external signal source to generate the signals identical to the ones that are
going to be tested.
1
Connect the desired signals to the oscilloscope.
2
Set the signal source(s) to generate a waveform identical to the ones
that you are going to test.
3
Press
±
on the oscilloscope, then press the
softkey when finished.
Define Mask Editor
Edit Line
Connect
softkeys to edit the minimum line so only the last edge is
softkey to select the Min limit line. Use the
softkey.
4
Create a mask (at the desired tolerance) using Automask. Press
Previous Menu
Refer to "Create a Mask Template Using Automask" for more information on
using automask.
5
Press the
6
Toggle the
and
Mask Test
softkey.
present (refer to previous figure).
Refer to "Create or Edit a Mask Using Line Segments" for additional
information.
7
Toggle the
Connect
and
present (refer to previous figure). Press
Edit Line
softkey to select the Max limit line. Use the
softkeys to edit the minimum line so only the first edge is
Previous Menu
softkey when
finished.
Mark
Mark
2–43
Page 60
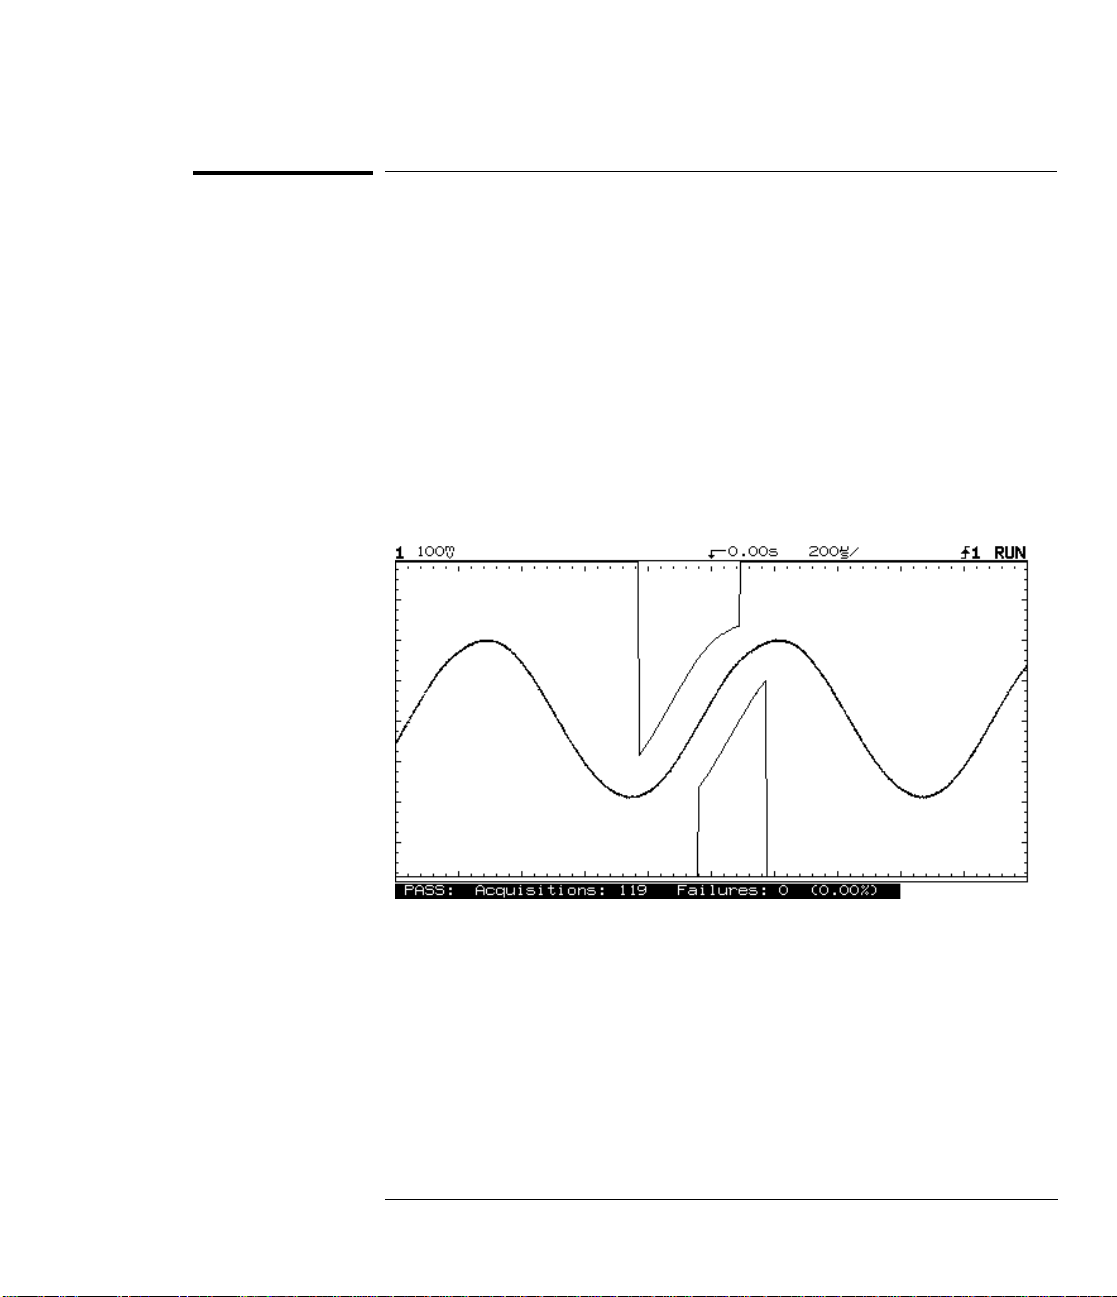
Figure 2– 14
Operating the Measurement/Storage Module
Creating a frequency testing m ask
Creating a frequency testing mask
A mask can be used to test the frequency of the input signal. The shape of
the mask varies depending on the shape of the signal to be tested. A mask
designed for testing a sine wave cannot be used to test a square wave.
Different masks are needed for different shapes of signals. Using the
calibrated vertical vernier, position, and time base of the HP 54600–Series
oscilloscope, a mask can be re-used to test signals of similar shapes but
different frequencies and amplitudes.
To test the frequency of the signal, the period of the signal is tested instead
of actually measuring the frequency. The test can be conducted by triggering
on an edge of the signal and testing for the location of the second edge. An
example mask is shown in the following figure.
Example mask for testi ng t he frequency of a sine wave
2–44
Page 61

Operating the Measurement /Storage Module
Creating a frequency testing m ask
The following procedure can be used to setup a mask template for testing the
frequency of a sine wave or a square wave. Similar methods can be used to
generate masks for testing the frequency of signals of other shapes.
In the oscilloscope setup, the vertical sensitivity and position should be
adjusted so that the amplitude is almost full scale. The trigger level should
be adjusted to the middle of the input signal. The mask template can be
created by using a function generator to generate a signal of variable
frequency but of similar shape and amplitude to the one that is going to be
tested.
1
Connect the output of a function generator to the oscilloscope.
2
Set the function generator to generate a waveform with a similar
shape to the one that you are going to test.
3
Adjust the amplitude of the output until it is similar to the signal that
you are going to test.
4
Press
Time
on the oscilloscope, then press the
Freq
softkey to
turn on the automatic measurement for frequency.
5
Adjust the frequency of the output of the function generator to the
lower test limit.
The frequency can be verified by the automatic measurement.
Press
Autost or e
.
6
7
Adjust the frequency of the output of the function generator to the upper test
limit.
An envelope of the test limit is generated.
8
Create a mask in the Define Automask menu with a tolerance of 0.0%.
For more information, refer to "To Create a Mask Template Using Autostore"
in this chapter.
9
Specify your test region in the Mask Editor menu.
2–45
Page 62

Figure 2–15
Operating the Measurement/Storage Module
Creating an overshoot tes ti ng m ask
Creating an overshoot testing mask
There are two parameters associated with the overshoot of a signal: the
percentage of overshoot and the settling time of the overshoot. A mask
template can be created to test the upper limit of these two parameters at
the same time. The following figure shows an example of a mask template for
testing overshoot.
Example of a ma sk t em plate for test ing overshoot
2–46
Page 63

Operating the Measurement /Storage Module
Creating an overshoot tes ti ng m ask
The critical factors for creating the mask template are:
The vertical window of the middle region of the mask template determines
•
the upper limit of the overshoot.
The horizontal window of the middle region determines the upper limit of
•
the settling time.
The vertical window of the rightmost region determines the settling
•
window. Normally, the settling window is ±5% or ±10% of the V top
voltage.
2–47
Page 64

Figure 2–16
Operating the Measurement/Storage Module
Creating a ris e time testing mask
Creating a rise time testing mask
Mask template testing can be used to test the rise time of a signal, including
specifying an upper limit for rise time. For example, you can specify that the
rise time must be 15 ns or faster to pass the test.
Use the voltage and time readouts of the mask editor to ensure the correct
settings. In the following figure, T1 and T2 are the critical points for
determining the maximum rise time limit (rise time limit = T2 – T1).
Example of a def inition of a rise ti m e t esting mask
2–48
Page 65

Figure 2–17
Operating the Measurement /Storage Module
Creating a ris e time testing mask
1
Determine the top and base of the signal.
Use the automatic measurement
determine these values.
2
Calculate the 10% and 90% points.
3
Determine the upper limit for the rise time.
4
Draw the mask template using the mask editor.
The mask should look similar to the one in the following figure.
Vtop
and
Vbase
of the oscilloscope to
Example of a mask template for testing rise time
2–49
Page 66

Figure 2–18
Operating the Measurement/Storage Module
Testing the eye opening of an eye-pattern signal
Testing the eye opening of an eye-pattern signal
There are generally two tests that you want to perform on an eye-pattern
signal: an eye boundary test and an eye opening test. Since the eye
boundary can be easily tested by using the normal mask template testing, this
section mainly focuses on how to create the mask for testing the eye opening.
A fail region in the shape of a hexagon is usually used to test the eye opening.
An example of the shape of the mask is shown below.
Example of the definition of an ey e-pattern test ing mask
2–50
Page 67

Figure 2–19
Operating the Measurement /Storage Module
Testing the eye opening of an eye-pattern signal
1
Set up the oscilloscope for proper viewing of the eye-pattern signal.
2
Determine the fail region.
3
Create the mask using the line drawing capabilities of the mask
editor.
The voltage and time readouts in the mask editor can be used to ensure the
correct shape and position of the mask. An example of how the mask
template looks during testing is shown below.
4
Select the fail region as Inside of the mask template.
Example of a ma sk t em plate used for eye- opening testi ng
2–51
Page 68

Operating the Measurement/Storage Module
To save or recall traces
To save or recall traces
With the Measurement/Storage Module installed, the two volatile pixel
memories are replaced with four high-speed non-volatile memories.
In addition, 64 Kbytes of nonvolatile trace memory with data compression is
also provided. A data compression algorithm maximizes the number of traces
and front-panel setups that can be stored into this memory.
The total number of traces that can be saved depends on the complexity of
each trace. At least 4 highly complex traces, or up to 96 simple traces, can
be saved in this 64 Kbytes of memory. Storage time is less than 10 seconds.
1
Adjust Oscilloscope controls for desired stable display.
2
Press
A softkey menu with six choices appears. All of them are related to the trace
memories of the module.
•
•
•
•
Trace
Trace
Selects the trace memory (ALL, 1 to 100). When ALL is selected,
four additional softkeys are displayed.
All Off
a
All On
b
Clear All
c
one time.
Review Traces
d
(with stored data) one at a time. View time is approximately 3
seconds. When selected, two additional softkeys are displayed.
Pause Review
pressed again, and
Trace X Off O n
is selected, trace status is temporarily displayed on the screen.
Save to Trace X
setup to the selected trace memory location.
Clear Trace X
from the selected trace memory location.
.
Used to turn all 100 trace memories to off.
Used to turn all 100 trace memories to on.
Used to clear the contents of all 100 trace memories at
Used to view the contents of all trace memories
pauses review cycle on current trace until key is
Cancel Rev iew cancels
Turns the selected memory number to on or off. When on
Saves the currently displayed waveform and front-panel
Erases a previously stored waveform and front-panel setup
the review cycle.
2–52
Page 69

Operating the Measurement /Storage Module
To save or recall traces
Recall Setup
•
saved with the waveform for the trace selected.
Edit Label
•
waveform. See "Create a Label for Trace Memory" later in this chapter for
more information.
3
Turn the knob closest to the
Recalls the previously stored front-panel setup that was
Used to enter a 20 character label that identifies the stored
Cursor s
key to move the cursor in
the character area to select the desired trace location (from 1 to
100).
Trace status is displayed on the screen. Information includes the edit label
(or trace number if label has not been entered), and the time and date the
memory was saved or cleared.
4
Select the desired softkey (
Saving Traces Hint
For traces 1 to 3, the trace i s saved in the non-compressed state. For traces
greater than 3 , the trace is saved in 64 Kbytes of nonvolatile trace me m ory with
data compression. After a com pressed trace i s saved, the available area (in
percent) is displayed.
The number of traces that can be saved in 6 4 Kbytes of nonv ol atile trace
memory is depende nt o n the trace complexit y a nd the current oscilloscope
configuratio n. For example:
Save, Clear
, or
Recall
).
Up to 97 simple traces (e. g. , square wave) can be stored.
As few as four com pl ex traces (A M m odulated sine wave) can be stored.
Saving a trace wi th autostore information or the grid tak es more memory .
In most cases , i f t he i nformation i s not needed, tu rn i t off to save m em ory.
The data compr ession algori thm uses run length encoding to compress the data.
Where possi bl e, runs of ident i cal bi ts are stored as a single word
(1 identification bit and 15 l ength bits).
The Review Traces feature i s useful when observing test failures.
To store only t he front-panel s etup, blank the screen prior to saving the trace.
The edit label function can be used to iden tify the setup.
2–53
Page 70

Operating the Measurement/Storage Module
To create a label for a trace mem ory
To create a label for a trace memory
Each trace stored in Measurement/Storage Module can have a label up to 20
characters long to identify the stored waveform.
1
Press
Trace
.
2
Press the
A softkey menu with six softkey choices appears. Five of them are related to
editing the message.
Enter
•
message area under the cursor position.
Space
•
Delete
•
position.
Insert
•
Enter or Space inserts the character or space into the message before the
character at the cursor position. The rest of the message is shifted to the
right by one character. With insert off, pressing Enter or Space replaces
the character highlighted in the character area.
Clear To End
•
the message including the one under the cursor.
Done
•
3
Turn the Delay knob to move the cursor in the label to the position
Edit Label
Enters the highlighted character in the character area into the
Enters a space in the message area under the cursor position.
Deletes the character in the message area under the cursor
Toggles the insert function on or off. With insert on, pressing
Exits the editing of the message.
softkey.
Clears the characters from the cursor position to the end of
that you want to edit.
4
Turn the knob closest to the
Cursor s
key to move the cursor in
the character area to select the character that you want to enter.
5
Press the
message, or press the
Enter
softkey to enter the highlighted character into the user
Space
softkey to enter a space into the user
message.
6
Repeat procedures 3 through 5 until finished editing the message.
The maximum length of the label is 20 characters.
7
Press the
Your message is displayed when you execute the various trace functions.
Done
softkey.
2–54
Page 71

Operating the Measurement /Storage Module
To set real -ti m e clock
To set real-time clock
Time (24-hour format) and date tagging of hard copy and nonvolatile trace
memories is provided using a built in, battery backed up real-time clock. To
set time and date, or view current contents:
Press
Print/ Ut il it y
.
1
2
Press the
3
Press the
A softkey menu with five choices appears. Four of them are related to setting
the real-time clock time.
Hour
•
be changed using the knob closest to the
repeatedly pressing the softkey.
Minute
•
using the knob closest to the
pressing the softkey.
Second
•
using the knob closest to the
pressing the softkey.
Enter Time
•
the softkey area.
Previous Menu
•
Set Clock
Set Time
Selects the hours digits (in 24 hour format). Current selection can
Selects the minutes digits. Current selection can be changed
Selects the seconds digits. Current selection can be changed
softkey.
softkey.
Cursor s
Cursor s
Cursor s
Press to set the real-time clock time to the values displayed in
Returns you to the previous softkey menu.
key, or by repeatedly
key, or by repeatedly
key, or by
2–55
Page 72

Operating the Measurement/Storage Module
To set real-time clock
4
Press the
A softkey menu with six choices appears. Five of them are related to setting
the real-time clock date.
Day
•
closest to the
Month
•
knob closest to the
softkey.
Date
•
using the knob closest to the
pressing the softkey.
Year
•
closest to the
Enter Date
•
the softkey area.
Previous Menu
•
5
Press the
Set Date
Selects the day. Current selection can be changed using the knob
Selects the month. Current selection can be changed using the
Selects the day of the month. Current selection can be changed
Selects the year. Current selection can be changed using the knob
Current Time /D ate
softkey.
Cursor s
Cursor s
Press to set the real-time clock date to the values displayed in
Returns you to the previous softkey menu.
key, or by repeatedly pressing the softkey.
Cursor s
key, or by repeatedly pressing the
Cursor s
key, or by repeatedly pressing the softkey.
key, or by repeatedly
softkey to display current real-time clock
time and date information.
Real-time Clock Hint
The real-time cl ock only all ow s selection of valid dat es. If a day is s el ected and
the month or year is changed s o the day is n ow i nvalid, the d ay is automatically
adjusted (e.g. Feb 29).
2–56
Page 73

3
Reference Information
Page 74

Reference Information
This chapter contains reference information for the
Measurement/Storage Modules including its operating characteristics.
3–2
Page 75

Reference Inf orm ation
Operating Characteristics
Operating Characteristics
Operating Characteristics are specified with the Measurement/Storage
Module installed on an HP 54600–Series Oscilloscope.
Measurements
Voltage
Time
Thresholds
Cursor Readout
Waveform Math Funct io n s
Fast Fourier Transforms
Test Region
Inputs
Freq Cursor Re sol ut i on
Points
Peak Find:
Variable Sensi t iv i ty and
Offset
Time Record Length
Horizontal M agnification
and Center Frequency
Control
Vamp, Vavg, Vrms, Vpp, Vpre, Vovr, Vtop, Vbase, Vmin & Vmax
Delay, Duty Cy cl e, Fre quency, Period, Phas e A ngle, Rise Time,
Fall Time, +Width, & –Width
User-sele ctable among, 10% /90%, 20 %/80% or volt age levels
Voltage, tim e, perc ent age, and phase ang le .
Addition, subtraction, multiplication, differentiation,
integration, and FFT.
Each pixel is selectable to be t ested or not.
On either ch1, ch 2, or F 1
From 1.22 mHz (milliHz) to 9.766 MHz (1.22 mHz to 48.828 MHz
for HP 54615/546 16)
Fixed at 10 24 for all models except HP 54615/54616
Fixed at 10 24 for HP 54615/546 16 with vect ors off
Fixed at 51 2 for HP 54615/5461 6 w i th vectors on
Find Peak automatically snaps cursor to t he t wo largest pea ks
located anywhere in the dis pl ayed frequency span.
Measurement in formation is automatically di spl ayed at the
bottom of the screen together wit h the difference i n
frequency bet w een the two sel ect ed peaks.
Sensitivity and vertical offset (position) ar e cont rolled from
the front panel to display an opti m um vi ew of the spectrum.
Sensitivity is calibrated in dB per divisions; vertical offset is
calibrated in dBV.
10x main s w eep speed.
As the frequency span is changed, the display is magnified
about center frequency so that you get a closer view.
3–3
Page 76

Reference Information
Operating Characteristics
Selectable
Windows
Window
Characteristics
FFT Freq Range
Freq Span Control
Center Freq
Control
Move 0 Hz to Left
FFT Vector
display
Display
Units/Div
Reference Level
Programmability
Four windows are selectable: Hanning, for best frequency resolution and
general purpose use; flattop, for best amplitude accuracy; rectangular, for
single-shot signals such as transients and signals where there are an
integral number of cycles in the time record, and exponential for best
transient analysis.
Window Highest
Side Lobe
(dB)
Rectangular –13 0.89 1.21 3.92
Hanning −32 1.44 2.00 1.42
Flattop –70 3.38 4.17 0.005
dc to 100 MHz HP 54600/54601/54645
dc to 150 MHz HP54602
dc to 60 MHz HP54603
dc to 500 MHz HP54610/54615/54616
This control allows you to specify the frequency span of the FFT display.
When the Span is adjusted the display will expand or contract about the
center frequency as set by the Center Frequency control. Refer to Figure
3-1 for the limits of the Frequency Span control.
This control allows you to specify the frequency at the center of the FFT
display. When the Frequency Span is changed, the FFT display will
expand or contract about the frequency at the center of the display.
Refer to Figure 3-1 for the limits of this control.
Pressing this soft key will move the FFT display so that the left hand edge
of the display will be 0Hz.
When the time domain display is turned off the FFT display will be
displayed in vector drawing mode. The time domain display can be
turned off by pressing the Channel # key twice
FFT vertical units in dB.
This control allows you to adjust the vertical scaling of the FFT display in
a 1-2-5 sequence from 1 dB/div to 50 dB/div.
This control allows adjustment of the reference level of the FFT display
across a range of 400 dBV. The minimum setting is -196 dB at 1 dBV/div
decreasing to 0 dBV at 50 dBV/div. The maximum setting is 400 dBV at 50
dB/div, decreasing to 204 dB at 1 dBV/div.
All front-panel controls are fully programmable over HP-IB (HP 54657A)
or RS-232 (HP 54658A and HP 54659B)
3dB
Bandwidth(b
ins)
6dB
Bandwidth(b
ins)
Scallop
Loss
(dB)
3–4
Page 77

Figure 3–1
5.E+10
5.E+09
5.E+08
5.E+07
5.E+06
5 GSa/s
500 MSa/s
50 MSa/s
5 MSa/s
Effective Sample Rate Frequency Span
FFT operation limited by bandwidth of scope
Reference Inf orm ation
Operating Characteristics
5 GHz
500 MHz
50 MHz
5 MHz
5.E+05
Samples/s
5.E+04
5.E+03
5.E+02
5.E+01
0.5E+01
500 kSa/s
5 s/div
200 ms/div
10 ms/div
500 us/div
Sweep Speed
Sweep
Speed
5 s/div
2 s/div
1 s/div
500 ms/div
200 ms/div
100 ms/div
50 ms/div
20 ms/div
10 ms/div
5 ms/div
2 ms/div
1 ms/div
500 µs/div
200 µs/div
100 µs/div
* 2 ns/div FFT valid only on HP 54615/54616
Effective
Sample
Rate
20 Hz
50 Hz
100 Hz
200 Hz
500 Hz
1 kHz
2 kHz
5 kHz
10 kHz
20 kHz
50 kHz
100 kHz
200 kHz
500 kHz
1 MHz
Maximum
Frequency
Span
9.75 Hz
24.4 Hz
48.85 Hz
97.5 Hz
244 Hz
488.5 Hz
975 Hz
2.44 kH z
4.885 kH z
9.75k Hz
24.4 kH z
48.85 kH z
97.5 kH z
244 kHz
488.5 kHz
20 us/div 1 us/div
Sweep
Speed
50 µs/div
20 µs/div
10 µs/div
5 µs/div
2 µs/div
1 µs/div
500 ns/di v
200 ns/di v
100 ns/di v
50 ns/div
20 ns/div
10 ns/div
5 ns/div
2 ns/div*
Effective
Sample
Rate
2 MHz
5 MHz
10 MHz
20 MHz
50 MHz
100 MHz
200 MHz
500 MHz
1 GHz
2 GHz
5 GHz
10 GHz
20 GHz
50 GHz
50 ns/div
Maximum
Frequency
Span
975k kHz
2.44 MHz
4.885 MH z
9.75 MHz
24.4 MHz
48.85 MHz
97.5 MHz
244 MHz
488.5 MHz
975 MHz
2.44 GHz
4.885 GHz
9.75 GHz
24.41 GHz
500 kHz
50 kHz
5 kHz
500 Hz
50 Hz
Frequency Span in Hz
FFT Operati on
Frequency Span and Effective Sampling Rat e vs Sweep Speed
3–5
Page 78

Reference Information
Operating Characteristics
Mask Template Testing
Number of mask
templates
Mask template
generation
Test Region
Fail Region
Failure indication
Failure mode
2, nonvolatile
Automask generates a mask from waveform data with variable
tolerances.
Mask editor al lo w s pi xel-by-pixel edi ting and line drawing edi ting.
Smooth mask function pe rforms a running average of 3 pixels.
Each pixel is selectable to be tested or not
Inside-si gnal fails if it falls i nside the region bounded by the
maximum and minimum limit lines.
Outside-si gnal fails if it fa lls outside the regi on bounded by the
maximum and minimum limit lines.
Failure zone indicator shows where the signal fails the mask
template.
Failure modes are stop or cont in ue on f ai l ure. Failure(s) can be
saved to trace memory or print ed
Trace Memory (all nonvolatil e)
1 through 3
4 through 100
High-spee d storage without com pression.
Storage with compressio n, num ber of traces is a funct i on of
complexity. Storage time is le ss than 10 seconds.
Real Time Cloc k
Can be set from
front panel.
24-hour format with batt ery back-up.
Hardcopy Ou tput
Printer/Plotter
Supported
HP 54658A and
HP 54659B only
HP ThinkJet, HP QuietJet, HP PaintJet, HP DeskJet, and
HP Laser Jet printer. HP-GL com patible plotter s.
Epson FX-80 or compatibl e print er.
3–6
Page 79

Reference Inf orm ation
Operating Characteristics
RS-232 Co nfi gurations
Connector Typ e
Protocols
Data Bits
Stop Bits
Parity:
Baud Rates
With the adapter cable conne ct ed, at the end of the cable i s a
9 pin/25 pin D TE por t; a printer cable is required to connec t it to
hardcopy devices or a compu te r.
XON/XOF F, har dw are.
8
1
none.
1200, 2400, 960 0, 19200.
Programmab ilit y
All instrument settings and operating m odes may be remotely progra m m ed vi a RS-232 and
HP-IB (IEE E-4 88).
3–7
Page 80

3–8
Page 81

Index
!
∫dt, 2–5
A
aliasing, 2–9
Automask, 2–30
automatic measurements, 2–14
delay, 2–19
phase, 2–21
Vamplitude, 2–23
voltage, 2–23
Vovershoot, 2–23
Vpreshoot, 2–23
Autostore, 2–31
C
cable, 1–4
HP-IB, 1–4
parallel, 1–4
RS-232, 1–4, 1–6 to 1–7
center frequency, 2–11
clock, set, 2–55
compatibility, 1– 2
configure module, 1–4
connector
DB25, 1–5
DB9, 1–7
create a mask
Automask, 2–30
Autostore, 2–31
delay, 2–42
eye-pattern, 2–50
frequency, 2–44
line se gments, 2–3 3
overshoot, 2–46
rise time, 2–48
create a trace memory label, 2–54
cursor measurements, 2–25
time (degrees), 2–26
voltage (percent), 2–25
D
DB25 connector, 1–5
DB9 connector, 1–7
dBm, 2–8
DC Value, 2–8
delay measurements, 2–19
delay testing mask, 2–42
differentiate, 2–5
dV/dt, 2–5
E
edit a mask
line se gments, 2–3 3
pixel, 2–35
waveform portion, 2–36
exponential window, 2–11
eye-pattern testing mask, 2–50
F
FFT, 2–6, 2–8
aliasing, 2–9
center frequency, 2–11
DC Value, 2–8
Find Peaks, 2–11
frequency span, 2–11
measurement, 2–8
measurement hints, 2–12
Move 0Hz To Left, 2–11
Move f1 To Center, 2–11
operating characteristics, 3–3
operation, 2–10
spectral leakage, 2–10
window, 2–11
Find Peaks, 2–11
flattop window, 2–11
frequency span, 2–11
frequency testing mask, 2–44
Function 1, 2–4
Function 2, 2–5
H
hanning window, 2–11
hardcopy output, operating
characteristics, 3–6
HP-IB
cable, 1–4
I
installation, 1–3
integrate, 2–5
interface cables, 1–4
L
label, trace memory, 2–54
leakage, spectral, 2–10
line segments, 2–33
Lissajous, 2–21
M
mask template testing, characteristics, 3–6
mask,creating
eye-pattern, 2–50
frequency, 2–44
overshoot, 2–46
rise time, 2–48
mask,editing
line se gments, 2–3 3
pixel, 2–35
waveform portion, 2–36
math functions, 2–3
measurements, automatic, 2–14
delay, 2–19
phase, 2–21
Vamplitude, 2–23
voltage, 2–23
Vovershoot, 2–23
Vpreshoot, 2–23
measurements, cursor, 2–25
measurements, operating characteristics,
3–3
minus (-), 2–4
monitoring, waveform, 2–29
Move 0Hz To Left, 2–11
Move f1 To Center, 2–11
multiply, 2–4
Index–1
Page 82

Index
N
Nyquist frequency, 2–9
O
operating characteristics, 3–3
FFT, 3–3
hardcopy output, 3–6
mask template testing, 3–6
measurments, 3–3
programmability, 3–7
real-time clock, 3–6
RS-232 configurations, 3–7
trace memory, 3–6
operating system, 1–2
oscilloscope compatibility, 1–2
overshoot testing mask, 2–46
P
parallel cable, 1–4
phase measurements, 2–21
phase shift, 2–21
pixel editing, 2–35
plus (+), 2–4
programmability, operating characteristics,
3–7
R
real time clock, operating characteristics,
3–6
real-time clock, set, 2–55
recall traces, 2–52
rectangular window, 2–11
rise time testing mask, 2–48
RS-232
cable, 1–4, 1–6 to 1–7
configurations, characteristics, 3–7
port, 1–5, 1–7
S
save traces, 2–52
saving test violations, 2–40
set real-time clock, 2–55
settin g thresholds, 2–15
spectral leakage, 2–10
subtract, 2–4
T
test violations, saving, 2–40
testing mask, creating
delay, 2–42
eye-pattern, 2–50
frequency, 2–44
overshoot, 2–46
rise time, 2–48
thresholds, 2–15
time cursor measurements, 2–26
trace memory label, 2–54
trace memory, operating characteristics,
3–6
traces
non-volatile memorie s, 2–52
recall, 2–52
save, 2–52
U
unattended waveform monitoring, 2–29
upgrade kit, 1–2
V
Vamplitude, 2–23
voltage cursor measurements, 2–25
voltage measurements, 2–23
Vovershoot, 2–23
Vpreshoot, 2–23
W
waveform mask edit, 2–36
waveform monitoring, 2–29
starting, 2–38
test violations, 2–40
window
exponential, 2–11
FFT, 2–11
flattop, 2–11
hanning, 2–11
rectangular, 2–11
Index–2
Page 83

© Copyright HewlettPackard Company 1992-1996
All Rights Reserved.
Reproduction, adaptation, or
translation without prior
written permission is
prohibited, except as allowed
under the copyright laws.
Document Warranty
The information contained in
this document is subject to
change without notice.
Hewlett-Packard makes
no warranty of any k ind
with regard to this
material, including, but
not limited to, the implied
warranties of
merchantability or fitness
for a particular purpose.
Hewlett-Packard shall not be
liable for errors contained
herein or for damages in
conne ction with the
furnishing, performance, or
use of th is mate rial.
Safety
This apparatus has been
design ed and tested in
accordance with IEC
Publication 348, Safety
Requirement s for Measuring
Apparatus, an d has been
supplied in a safe condition.
This is a S afety Class I
instrument (provided with
terminal for protective
earthing). Before applying
power, verify that the correct
safety precautions are taken
(see the following warnings).
In addition, note the external
markings on the instrument
that are described under
"Safety Symbols."
Warning
Before turning on the
•
instrument, you must connect
the protective earth terminal
of the instrument to th e
protective conductor of the
(mains) power cord. The
mains plug shall only be
inserted in a socket outlet
provided with a prot ective
earth contact. You must not
negate the protective action
by using an extension cord
(power cable) without a
protective conductor
(grounding). Grounding one
conductor of a two-conductor
outlet is not sufficient
protection.
Only fuses with the
•
required rated current,
voltage, and specified type
(normal blow, time delay,
etc.) should be used. Do not
use repaired fuses or
short-circuited fuseholders.
To do so could cause a shock
or fire hazard.
Service instructions are for
•
trained service personnel. To
avoid dangerous electric
shock, do not perform any
service unless qualif ied to do
so. Do not attempt internal
service or adjustment unless
another person, capable of
rendering first aid and
resuscitation, is present.
If you energize this
•
instrument by an auto
transformer (for voltage
reduction), make sure the
common terminal is
connect ed to the earth
terminal of the power source.
Whenever it is likely that
•
the ground p rotection is
impaired, yo u must make the
instrument inoperative and
secure it against any
uninte nded operation.
Do not operate the
•
instrument in the presence of
flammable gasses or fumes.
Operation of any electrical
instrument in such an
environment constitutes a
definite safety hazard.
Do not install substitute
•
parts or perform any
unauthorized modification to
the instrument.
Capacitors inside the
•
instrument may retain a
charge even if the instrument
is disconnected from its
source of supply.
Use caution when exposing
•
or handling the CRT.
Handling or replacing the
CRT shall be do ne only by
qualified maintenance
personnel.
Safety Symbols
Instruction manual symbol:
the product is marked with
this symbol when it is
necessary for you to refer to
the instruction manual in
order to protect against
damage to the product.
Hazardous voltage symbol.
Earth terminal symbol: Used
to indicate a circuit common
connected to ground ed
chassis.
WARNING
The Warning sign denotes a
hazard. It calls attention to a
procedure, practice, or the
like, which, if not co rrectly
performed or adhered to,
could result in personal
injury. Do not proceed
beyond a Warning sign until
the indicated conditions are
fully understood and met.
CAUTIO N
The Cautio n sign denotes a
hazard. It calls attention to
an operating procedure,
practice, or the like, which, if
not correctly performed or
adhered to, could result in
damage to or destruction of
part or all of the product. Do
not proceed beyond a
Caution symbol until the
indicated conditions are fully
understoo d or met.
Hewlett-Packard
P.O. Box 2197
1900 Garden of the Gods Road
Colorado Springs, CO 80901
Page 84

Product Warranty
This Hewlett-Packard
product has a warranty
against defects in material
and workmanship for a period
of three years from date of
shipment. During the
warranty period,
Hewlett-Packard Company
will, at its opti on, either
repair or replace products
that prove to be defective.
For warranty service or
repair, this product must be
returned to a service facility
designated by
Hewlett-Packard.
For products returned to
Hewlett-Packard for warranty
service, the Buyer shall
prepay shipping charges to
Hewlett-Packard and
Hewlett-Packard shall pay
shipping charges to return
the product to the Buyer.
However, the Buyer shall pay
all shipping charges, duties,
and taxes fo r products
returned to Hewlett-Packard
from another country.
Hewlett-Packard warrants
that its software and firmware
designated by
Hewlett-Packard for use with
an instrument will execute its
programming instructions
when properly installe d on
that instrument.
Hewlett-Packard does not
warrant that the operation of
the instrument software, or
firmware will be
uninterrupted or error free.
Limitation of Warranty
The foregoing warranty shall
not apply to defects resulting
from improper or inadequate
maintenance by the Buyer,
Buyer-supplied software or
interfacing, unauthorized
modification or misuse,
operation o utside of the
environmental spe cification s
for the product, or improper
site preparation or
maintenance.
No other warranty is
expressed or im plied.
Hewlett-Packard
specifically disclaims the
implied warranties of
merchantability or fitness
for a particular purpose.
Exclusive Remedies
The remedies provided herein
are the buyer’s sole and
exclusive remedies.
Hewlett-Packard shall not be
liable for any direct, indirect,
special, incidental, or
consequential damages,
whether based on contract,
tort, or any other legal theory.
Assistance
Product maintenance
agreements and other
customer assistance
agreements are available for
Hewlett-Packard prod ucts.
For any assistance, contact
your nearest Hewlett-Packard
Sales Office.
Certification
Hewlett-Packard Company
certif ies that this product met
its published specifications at
the time of ship ment from the
factory. Hewlett-Packard
further certifies that its
calibration measurements are
traceable to the United States
National Institute of
Standards and Technology, to
the extent allowed by the
Institute’s calibration facility,
and to the calibration
facilities of other
International Standards
Organization members.
About this edition
This is the first edition of the
HP 54657A, HP 54658A,
and HP 54659B
Measurement/Storage
Modules User’s Guide.
Publication number
54657-97010
Printed in USA.
Edition dates are as follows:
First edition, October 1996
New editions are complete
revisions of the manual.
Update packages, which are
issued between editions,
contain additional and
replaceme nt pages to be
merged into the manual by
you. The dates on the title
page change only when a new
edition is published.
A software or firmware code
may be printed befo re the
date. This code indicates the
version level of the so ftware
or firmware of this product at
the time the manual or
update was issued. Many
product updates do not
require manual changes; and,
conversely, manual
corrections may be done
without accompanying
product changes. Therefore,
do not expect a one-to-o ne
correspondence between
product updates and manual
updates.
The following li st of page s
gives the date of the current
edition and of any changed
pages to that edition .
All pages original edition
Page 85

DECLARATION OF CONFORMITY
according to I S O/IEC Guide 22 and EN 45014
Manufacturer’s Name:
Manufacturer’s Address:
declares, th at t he product
Product Name:
Model Number(s):
Product Option(s):
conforms to th e following Pr oduct Specific ations:
Safety:
EMC:
IEC 1010-1:1990+A1 / EN 61010-1:1993
UL 3111
CSA-C22.2 No. 1010.1:1993
CISPR 11:1990 / EN 55011:1991 Group 1 Class A
IEC 555-2:1982 + A1:1985 / EN 60555-2:1987
IEC 555-3:1982 + A1:1990 / EN 60555-3:1987 + A1:1991
IEC 801-2:1991 / EN 50082-1:1992 4 kV CD, 8 kV AD
IEC 801-3:1984 / EN 50082-1:1992 3 V/m, {1kHz 80% AM, 27-1000 MHz}
IEC 801-4:1988 / EN 50082-1:1992 0.5 kV Sig. Lines, 1 kV Power Lines
Hewlett-Pac kard Company
Colorado Spr i ngs Division
1900 Garden of the Gods Road
Colorado Springs, CO 80907 USA
Digitizing Oscilloscope
HP 54657A, HP 54658A, and HP 54659B
All
Supplementar y I nformation:
The product herew i th complies w i th the requirements of the Lo w V ol tage Directiv e 73/23/EEC and the
EMC Directive 89/336/EEC and carries the CE m arking accordi ngl y.
This product w as tested in a ty pi cal configu ration with Hew l ett-Packard test systems.
Colorado Spr i ngs, 01/12/95
John Strathman, Quality Manager
European Contact: Your local Hewlett-Packard Sales and Service Office or Hewlett-Packard GmbH, Department ZQ / Standards
Europe, Herrenber ger Strasse 130, D-71034 B öblingen Germany (FAX: +49-7031- 14-3143)
Page 86

Product Regulations
Safety
EMC
Sound Press ure
Level
IEC 1010-1:1990+A1 / EN 61010-1:1993
UL 3111
CSA-C22.2 No.1010.1:1993
This Product m eets the requi rem ent of the European Communi ties (EC)
EMC Directive 89/336/EEC.
Emissions
Immunity
EN55011/CISPR 11 (ISM, Group 1, Class A equipment)
EN50082-1 Code
IEC 555-2
IEC 555-3
IEC 801-2 (ESD) 4kV CD, 8kV AD
IEC 801-3 (Rad.) 3 V/m
IEC 801-4 (EFT) 0.5 kV, 1kV
1
Performance Co des:
1 PASS - Normal operati on, no ef fect.
2 PASS - Temporary degradation, sel f recoverable.
3 PASS - Temporary degradation, operator interventi on required.
4 F A I L - Not recoverable, com ponent damage.
2
Notes:
* Code 1 for HP 54616C
Code 2 for HP 54615B and HP 5461 6B
1
1
1
1,2
2
1,2
Notes
*
*
2
Less than 60 dBA
Page 87

Press this key . . .
Voltage
Time
. . . to obtain this menu
Cursors
Page 88

Press this key . . .
Print
Utility
. . . to obtain this menu
Trace
Trace
Page 89

Press this key . . .
±
. . . to obtain this menu
Setup
 Loading...