

Page 1

Installation, Verification, and Operation
Manual
11974 Series Preselected Millimeter Mixers
Manufacturing Part Number: 11974-90010
Supersedes April 1999
Printed in USA
September 2001
© Copyright 1992, 1999, 2001 Agilent Technologies, Inc.
Page 2

Notice
The information contained in this document is subject to change without notice.
Agilent Technologies makes no warranty of any kind with regard to this material,
including but not limited to, the implied warranties of merchantability and fitness for a
particular purpose. Agilent Technologies shall not be liable for errors contained herein or
for incidental or consequential damages in connection with the furnishing, performance, or
use of this material.
Certification
Agilent Technologies certifies that this product met its published specifications at the time
of shipment from the factory. Agilent Technologies further certifies that its calibration
measurements are traceable to the United States National Institute of Standards and
Technology, to the extent allowed by the Institute's calibration facility, and to the
calibration facilities of other International Standards Organization members.
Warranty
This Agilent Technologies instrument product is warranted against defects in material
and workmanship for a period of one year from date of shipment. During the warranty
period, Agilent Technologies will, at its option, either repair or replace products which
prove to be defective.
For warranty service or repair, this product must be returned to a service facility
designated by Agilent Technologies. Buyer shall prepay shipping charges to Agilent
Technologies and Agilent Technologies shall pay shipping charges to return the product to
Buyer. However, Buyer shall pay all shipping charges, duties, and taxes for products
returned to Agilent Technologies from another country.
Agilent Technologies warrants that its software and firmware designated by Agilent
Technologies for use with an instrument will execute its programming instructions when
properly installed on that instrument. Agilent Technologies does not warrant that the
operation of the instrument, or software, or firmware will be uninterrupted or error-free.
2
Page 3

LIMITATION OF WARRANTY
The foregoing warranty shall not apply to defects resulting from improper or inadequate
maintenance by Buyer, Buyer-supplied software or interfacing, unauthorized modification
or misuse, operation outside of the environmental specifications for the product, or
improper site preparation or maintenance.
NO OTHER WARRANTY IS EXPRESSED OR IMPLIED. AGILENT TECHNOLOGIES
SPECIFICALLY DISCLAIMS THE IMPLIED WARRANTIES OF MERCHANTABILITY
AND FITNESS FOR A PARTICULAR PURPOSE.
EXCLUSIVE REMEDIES
THE REMEDIES PROVIDED HEREIN ARE BUYER’S SOLE AND EXCLUSIVE
REMEDIES. AGILENT TECHNOLOGIES SHALL NOT BE LIABLE FOR ANY DIRECT,
INDIRECT, SPECIAL, INCIDENTAL, OR CONSEQUENTIAL DAMAGES, WHETHER
BASED ON CONTRACT, TORT, OR ANY OTHER LEGAL THEORY.
Assistance
Product maintenance agreements and other customer assistance agreements are available
for Agilent Technologies products.
For any assistance, contact your nearest Agilent Technologies Sales and Service Office
listed on page 49.
This guide uses the following conventions:
Front-Panel Key This represents a key physically located on the instrument.
Softkey This indicates a “softkey,” a key whose label is determined by the
instrument firmware.
Screen Text This indicates text displayed on the spectrum analyzer screen.
3
Page 4

Contents
1. General Information
Introduction . . . . . . . . . . . . . . . . . . . . . . . . . . . . . . . . . . . . . . . . . . . . . . . . . . . . . . . . . . . . . . . . 12
What You'll Find in this Chapter . . . . . . . . . . . . . . . . . . . . . . . . . . . . . . . . . . . . . . . . . . . . . . . 13
11974 Series Preselected Millimeter Mixers Overview . . . . . . . . . . . . . . . . . . . . . . . . . . . . . . 14
Options Available . . . . . . . . . . . . . . . . . . . . . . . . . . . . . . . . . . . . . . . . . . . . . . . . . . . . . . . . . . 15
Accessories Supplied . . . . . . . . . . . . . . . . . . . . . . . . . . . . . . . . . . . . . . . . . . . . . . . . . . . . . . . 15
Serial Numbers Covered by This Manual . . . . . . . . . . . . . . . . . . . . . . . . . . . . . . . . . . . . . . . . 16
Calibration Cycle . . . . . . . . . . . . . . . . . . . . . . . . . . . . . . . . . . . . . . . . . . . . . . . . . . . . . . . . . . . . 17
Specifications and Characteristics . . . . . . . . . . . . . . . . . . . . . . . . . . . . . . . . . . . . . . . . . . . . . . 18
2. Installation
What You'll Find in This Chapter . . . . . . . . . . . . . . . . . . . . . . . . . . . . . . . . . . . . . . . . . . . . . . 32
Spectrum Analyzer Compatibility . . . . . . . . . . . . . . . . . . . . . . . . . . . . . . . . . . . . . . . . . . . . . . 33
Initial Inspection . . . . . . . . . . . . . . . . . . . . . . . . . . . . . . . . . . . . . . . . . . . . . . . . . . . . . . . . . . . . 36
Preparing the 11974 for Use . . . . . . . . . . . . . . . . . . . . . . . . . . . . . . . . . . . . . . . . . . . . . . . . . . .37
Power Requirements . . . . . . . . . . . . . . . . . . . . . . . . . . . . . . . . . . . . . . . . . . . . . . . . . . . . . . .38
Setting the Line-Voltage Selector Switch . . . . . . . . . . . . . . . . . . . . . . . . . . . . . . . . . . . . . . . 38
Checking the Fuse . . . . . . . . . . . . . . . . . . . . . . . . . . . . . . . . . . . . . . . . . . . . . . . . . . . . . . . . . 39
Power Cable . . . . . . . . . . . . . . . . . . . . . . . . . . . . . . . . . . . . . . . . . . . . . . . . . . . . . . . . . . . . . . 40
Electrostatic Discharge Information . . . . . . . . . . . . . . . . . . . . . . . . . . . . . . . . . . . . . . . . . . . . 43
Reducing ESD Damage . . . . . . . . . . . . . . . . . . . . . . . . . . . . . . . . . . . . . . . . . . . . . . . . . . . . . 44
Static-Safe Accessories . . . . . . . . . . . . . . . . . . . . . . . . . . . . . . . . . . . . . . . . . . . . . . . . . . . . . . 45
Returning Equipment for Service . . . . . . . . . . . . . . . . . . . . . . . . . . . . . . . . . . . . . . . . . . . . . . . 46
Sales and Service Offices . . . . . . . . . . . . . . . . . . . . . . . . . . . . . . . . . . . . . . . . . . . . . . . . . . . . 48
3. Operation
What You'll Learn in this Chapter . . . . . . . . . . . . . . . . . . . . . . . . . . . . . . . . . . . . . . . . . . . . . . 52
11974Q Front-Panel Features . . . . . . . . . . . . . . . . . . . . . . . . . . . . . . . . . . . . . . . . . . . . . . . . . . 53
11974Q Rear-Panel Features . . . . . . . . . . . . . . . . . . . . . . . . . . . . . . . . . . . . . . . . . . . . . . . . . . 54
11974-60028 Front-Panel Features . . . . . . . . . . . . . . . . . . . . . . . . . . . . . . . . . . . . . . . . . . . . . 55
Operating Precautions . . . . . . . . . . . . . . . . . . . . . . . . . . . . . . . . . . . . . . . . . . . . . . . . . . . . . . . 56
Maximum RF Input Level . . . . . . . . . . . . . . . . . . . . . . . . . . . . . . . . . . . . . . . . . . . . . . . . . . . 56
Maximum LO Input Level . . . . . . . . . . . . . . . . . . . . . . . . . . . . . . . . . . . . . . . . . . . . . . . . . . . 56
Electrostatic Discharge . . . . . . . . . . . . . . . . . . . . . . . . . . . . . . . . . . . . . . . . . . . . . . . . . . . . .56
Operating Hints . . . . . . . . . . . . . . . . . . . . . . . . . . . . . . . . . . . . . . . . . . . . . . . . . . . . . . . . . . . . . 57
Preventing Erroneous Preselector Peaking During Spur Searches . . . . . . . . . . . . . . . . . . 57
Remote Location of an 11974 . . . . . . . . . . . . . . . . . . . . . . . . . . . . . . . . . . . . . . . . . . . . . . . . . 57
. . . . . . . . . . . . . . . . . . . . . . . . . . . . . . . . . . . . . . . . . . . . . . . . . . . . . . . . . . . . . . . . . . . . . . . . . 58
Dynamic Range Optimization . . . . . . . . . . . . . . . . . . . . . . . . . . . . . . . . . . . . . . . . . . . . . . . . 59
Operation Using an 8566B Spectrum Analyzer . . . . . . . . . . . . . . . . . . . . . . . . . . . . . . . . . . . 60
Preliminary Operation . . . . . . . . . . . . . . . . . . . . . . . . . . . . . . . . . . . . . . . . . . . . . . . . . . . . . .60
Operation . . . . . . . . . . . . . . . . . . . . . . . . . . . . . . . . . . . . . . . . . . . . . . . . . . . . . . . . . . . . . . . . 63
General Descriptions of 8566B External-Mixing Functions . . . . . . . . . . . . . . . . . . . . . . . . 64
Operation Using an 71000 Series Spectrum Analyzer
with an 70907B, 70909A, or 70910A . . . . . . . . . . . . . . . . . . . . . . . . . . . . . . . . . . . . . . . . . . . 65
Preliminary Operation . . . . . . . . . . . . . . . . . . . . . . . . . . . . . . . . . . . . . . . . . . . . . . . . . . . . . .65
Operation . . . . . . . . . . . . . . . . . . . . . . . . . . . . . . . . . . . . . . . . . . . . . . . . . . . . . . . . . . . . . . . . 68
General Descriptions of 71000 Series Spectrum Analyzer External-Mixing Functions . . 70
5
Page 5

Contents
Conversion Loss Versus Frequency Correction . . . . . . . . . . . . . . . . . . . . . . . . . . . . . . . . . . .71
Using 8563A, 8561B, 8560A, or 8560 E-Series Spectrum Analyzers . . . . . . . . . . . . . . . . . . .74
Preliminary Operation . . . . . . . . . . . . . . . . . . . . . . . . . . . . . . . . . . . . . . . . . . . . . . . . . . . . . .74
Operation . . . . . . . . . . . . . . . . . . . . . . . . . . . . . . . . . . . . . . . . . . . . . . . . . . . . . . . . . . . . . . . . .77
General Description of External-Mixing Functions . . . . . . . . . . . . . . . . . . . . . . . . . . . . . . .79
Operation Using 8561A/62A/62B Spectrum Analyzers . . . . . . . . . . . . . . . . . . . . . . . . . . . . . .83
Preliminary Operation . . . . . . . . . . . . . . . . . . . . . . . . . . . . . . . . . . . . . . . . . . . . . . . . . . . . . .83
Operation . . . . . . . . . . . . . . . . . . . . . . . . . . . . . . . . . . . . . . . . . . . . . . . . . . . . . . . . . . . . . . . . .85
General Description of 8561A/62A/62B External-Mixing Functions . . . . . . . . . . . . . . . . . .87
4. Performance Tests
Introduction . . . . . . . . . . . . . . . . . . . . . . . . . . . . . . . . . . . . . . . . . . . . . . . . . . . . . . . . . . . . . . . .90
Test Record Summary . . . . . . . . . . . . . . . . . . . . . . . . . . . . . . . . . . . . . . . . . . . . . . . . . . . . . . . .91
Performance Test Procedures . . . . . . . . . . . . . . . . . . . . . . . . . . . . . . . . . . . . . . . . . . . . . . . . . . .92
Frequency Tracking Calibration with an 8566B Spectrum Analyzer . . . . . . . . . . . . . . . . . . .99
1. Conversion Loss . . . . . . . . . . . . . . . . . . . . . . . . . . . . . . . . . . . . . . . . . . . . . . . . . . . . . . . . . .101
Description . . . . . . . . . . . . . . . . . . . . . . . . . . . . . . . . . . . . . . . . . . . . . . . . . . . . . . . . . . . . . . .101
Procedure . . . . . . . . . . . . . . . . . . . . . . . . . . . . . . . . . . . . . . . . . . . . . . . . . . . . . . . . . . . . . . . .101
2. Image Rejection Test . . . . . . . . . . . . . . . . . . . . . . . . . . . . . . . . . . . . . . . . . . . . . . . . . . . . . .106
Description . . . . . . . . . . . . . . . . . . . . . . . . . . . . . . . . . . . . . . . . . . . . . . . . . . . . . . . . . . . . . . .106
Procedure . . . . . . . . . . . . . . . . . . . . . . . . . . . . . . . . . . . . . . . . . . . . . . . . . . . . . . . . . . . . . . . .106
3. Multiple Response Rejection Test . . . . . . . . . . . . . . . . . . . . . . . . . . . . . . . . . . . . . . . . . . . .110
Description . . . . . . . . . . . . . . . . . . . . . . . . . . . . . . . . . . . . . . . . . . . . . . . . . . . . . . . . . . . . . . .110
Procedure . . . . . . . . . . . . . . . . . . . . . . . . . . . . . . . . . . . . . . . . . . . . . . . . . . . . . . . . . . . . . . . .110
4. Displayed Average Noise Level . . . . . . . . . . . . . . . . . . . . . . . . . . . . . . . . . . . . . . . . . . . . . .118
Description . . . . . . . . . . . . . . . . . . . . . . . . . . . . . . . . . . . . . . . . . . . . . . . . . . . . . . . . . . . . . . .118
Procedure . . . . . . . . . . . . . . . . . . . . . . . . . . . . . . . . . . . . . . . . . . . . . . . . . . . . . . . . . . . . . . . .118
5. 3 dB Bandwidth . . . . . . . . . . . . . . . . . . . . . . . . . . . . . . . . . . . . . . . . . . . . . . . . . . . . . . . . . .122
Description . . . . . . . . . . . . . . . . . . . . . . . . . . . . . . . . . . . . . . . . . . . . . . . . . . . . . . . . . . . . . . .122
Procedure . . . . . . . . . . . . . . . . . . . . . . . . . . . . . . . . . . . . . . . . . . . . . . . . . . . . . . . . . . . . . . . .122
5. Safety and Regulatory Information
Safety Symbols. . . . . . . . . . . . . . . . . . . . . . . . . . . . . . . . . . . . . . . . . . . . . . . . . . . . . . . . . . . . . .138
General Safety Considerations. . . . . . . . . . . . . . . . . . . . . . . . . . . . . . . . . . . . . . . . . . . . . . . . .139
Declaration of Conformity. . . . . . . . . . . . . . . . . . . . . . . . . . . . . . . . . . . . . . . . . . . . . . . . . . . . .142
6
Page 6

Figures
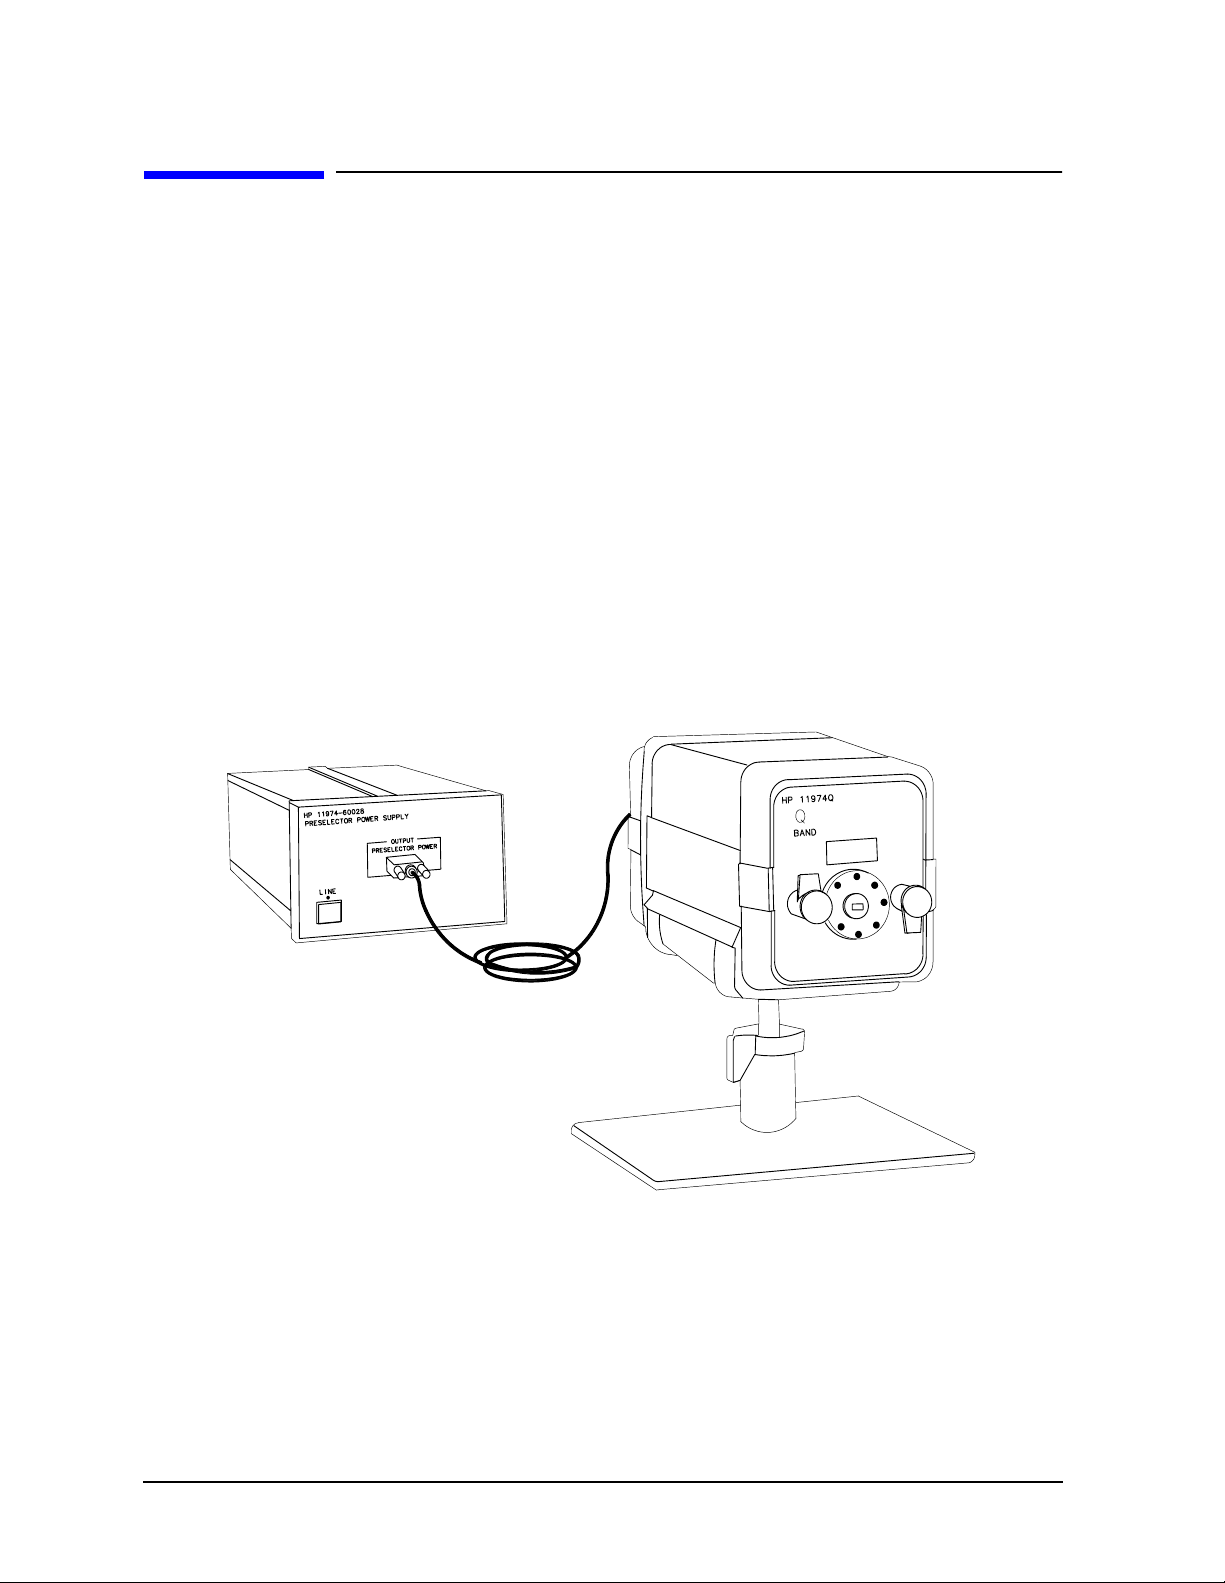
Figure 1-1 . 11974 Series with 11974-60028 Power Supply . . . . . . . . . . . . . . . . . . . . . . . . . . . . . . . . . . . . . . . . . . 14
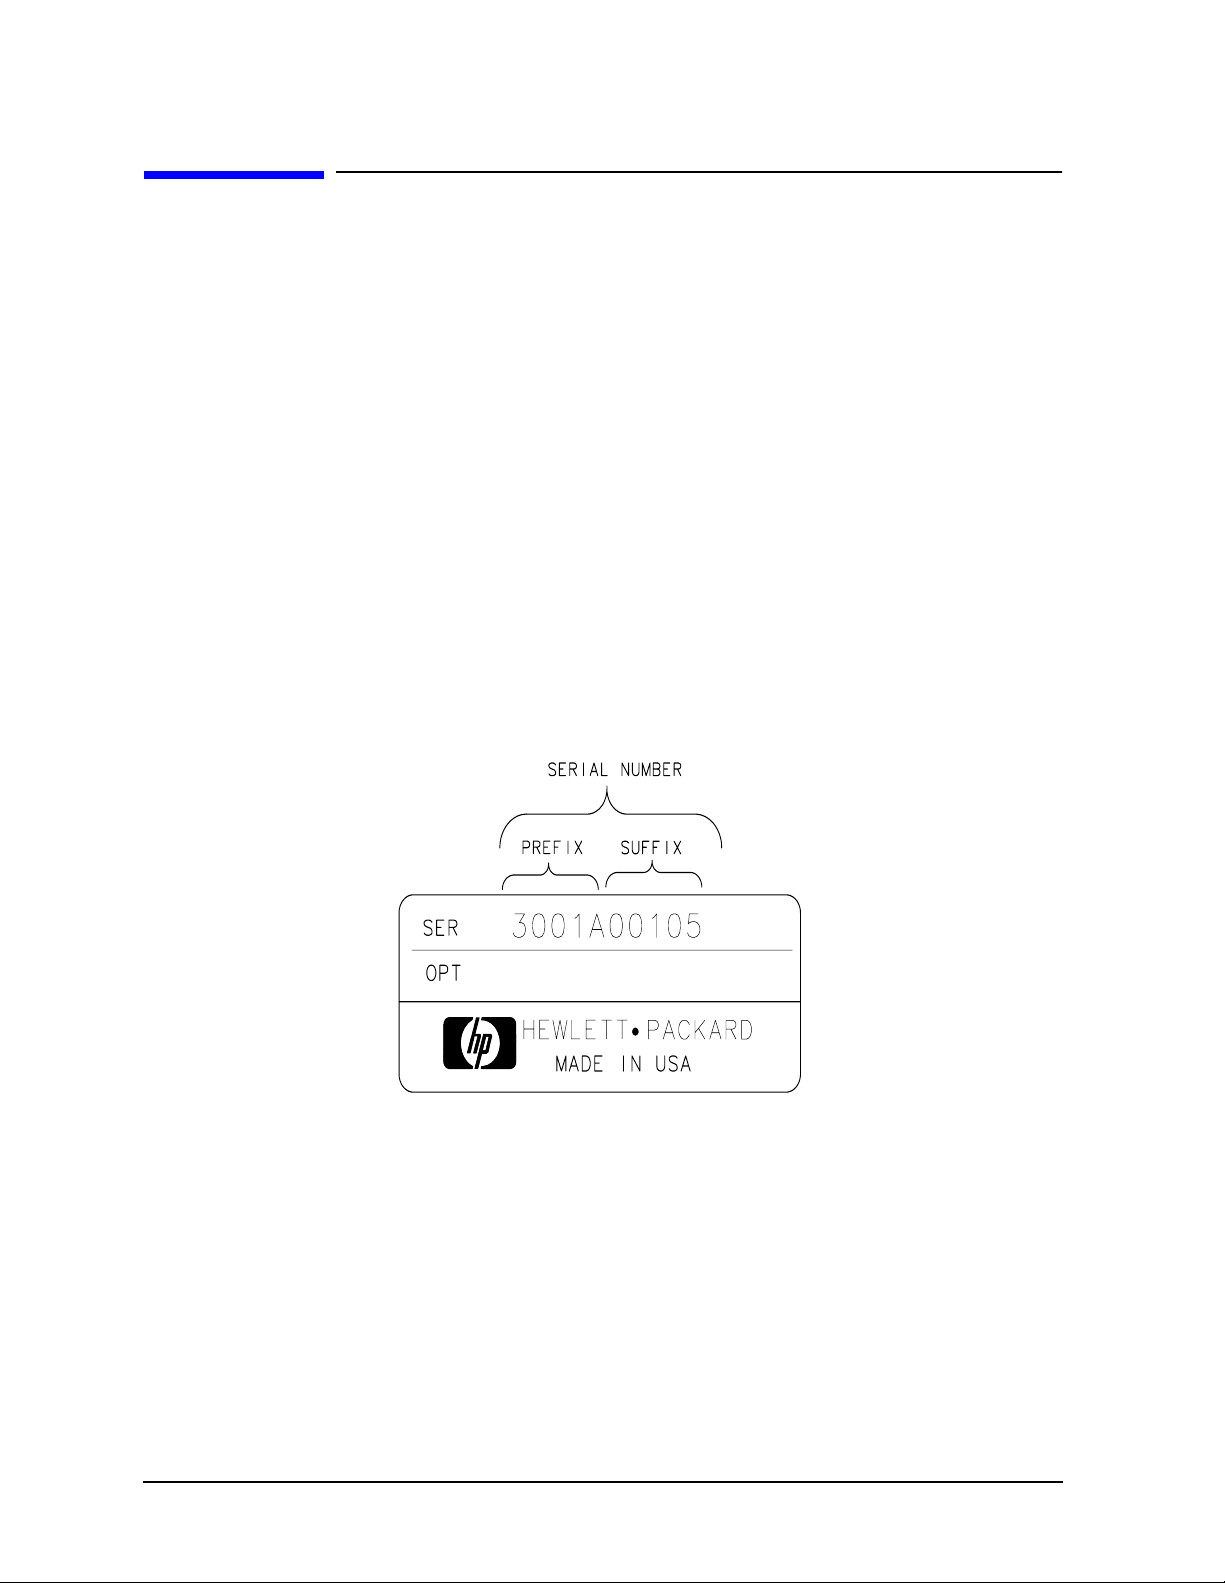
Figure 1-2 . Typical Serial Number Label . . . . . . . . . . . . . . . . . . . . . . . . . . . . . . . . . . . . . . . . . . . . . . . . . . . . . . . . 16
Figure 1-3 . 11974A Minimum System Dynamic Range . . . . . . . . . . . . . . . . . . . . . . . . . . . . . . . . . . . . . . . . . . . . 27
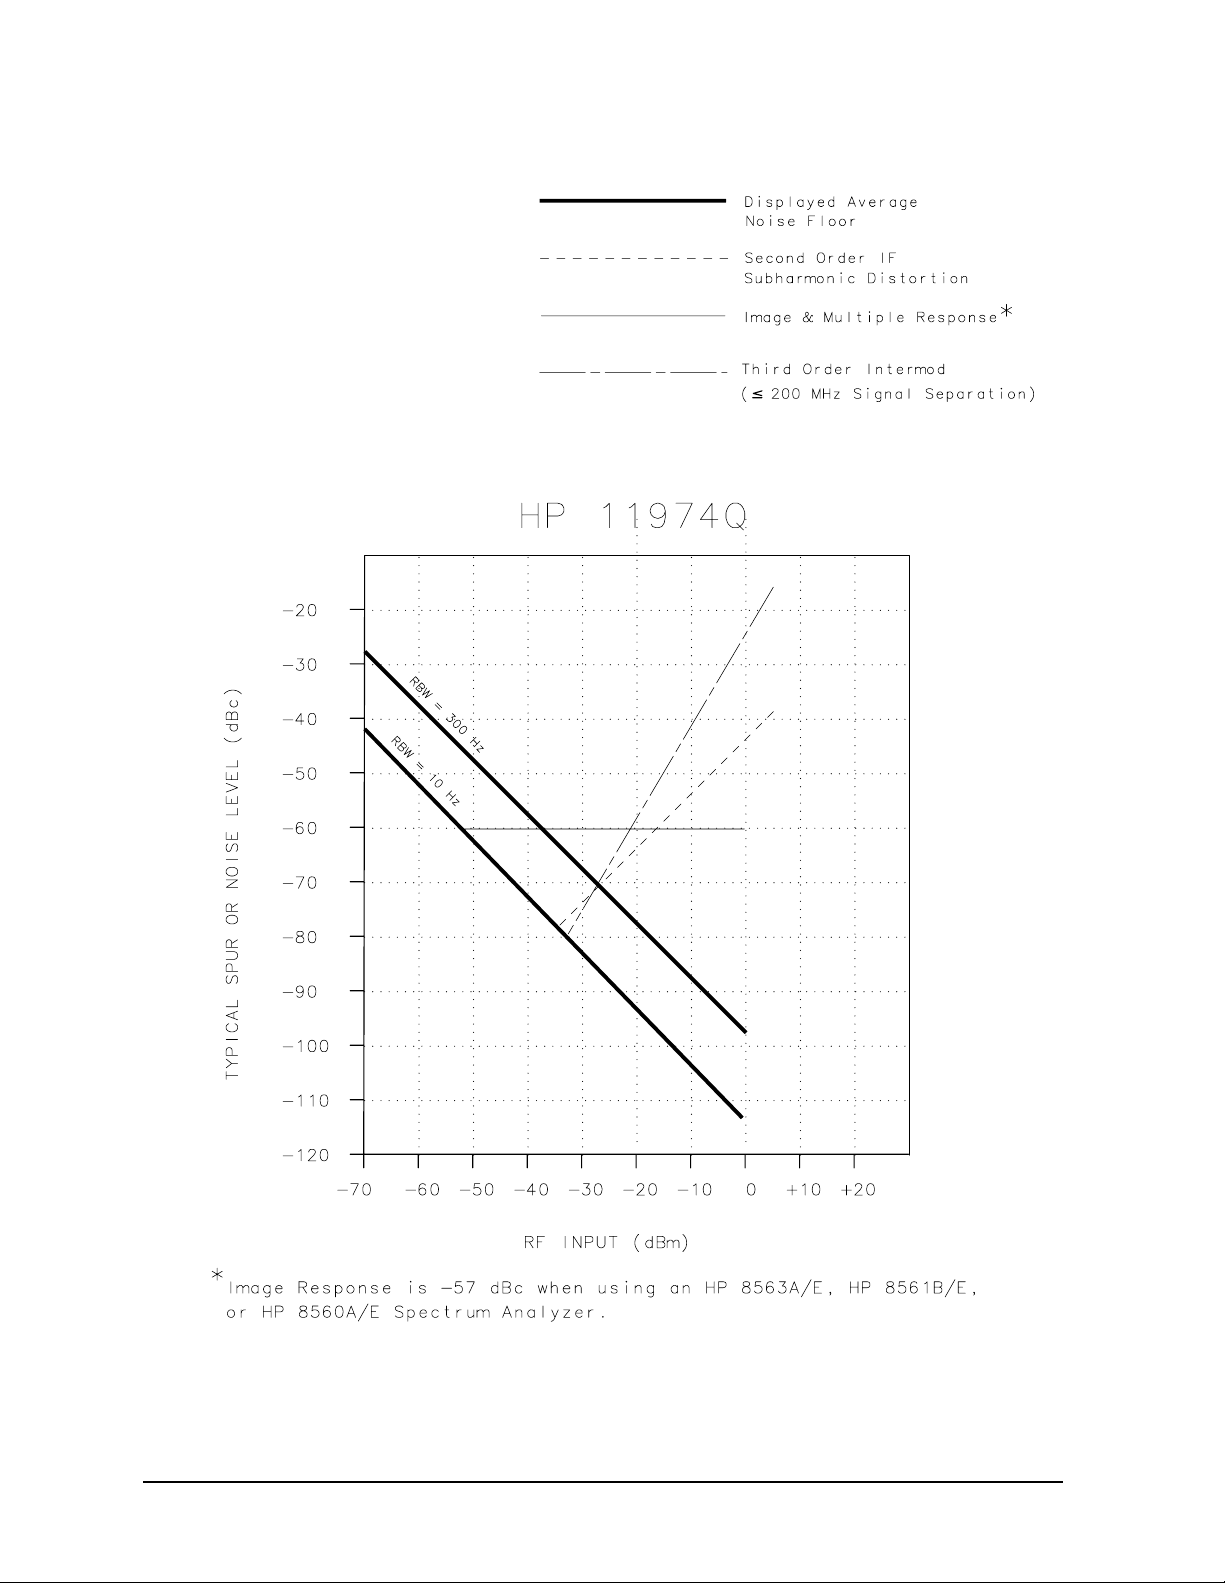
Figure 1-4 . 11974Q Minimum System Dynamic Range . . . . . . . . . . . . . . . . . . . . . . . . . . . . . . . . . . . . . . . . . . . . 28
Figure 1-5 . 11974U Minimum System Dynamic Range . . . . . . . . . . . . . . . . . . . . . . . . . . . . . . . . . . . . . . . . . . . . 29
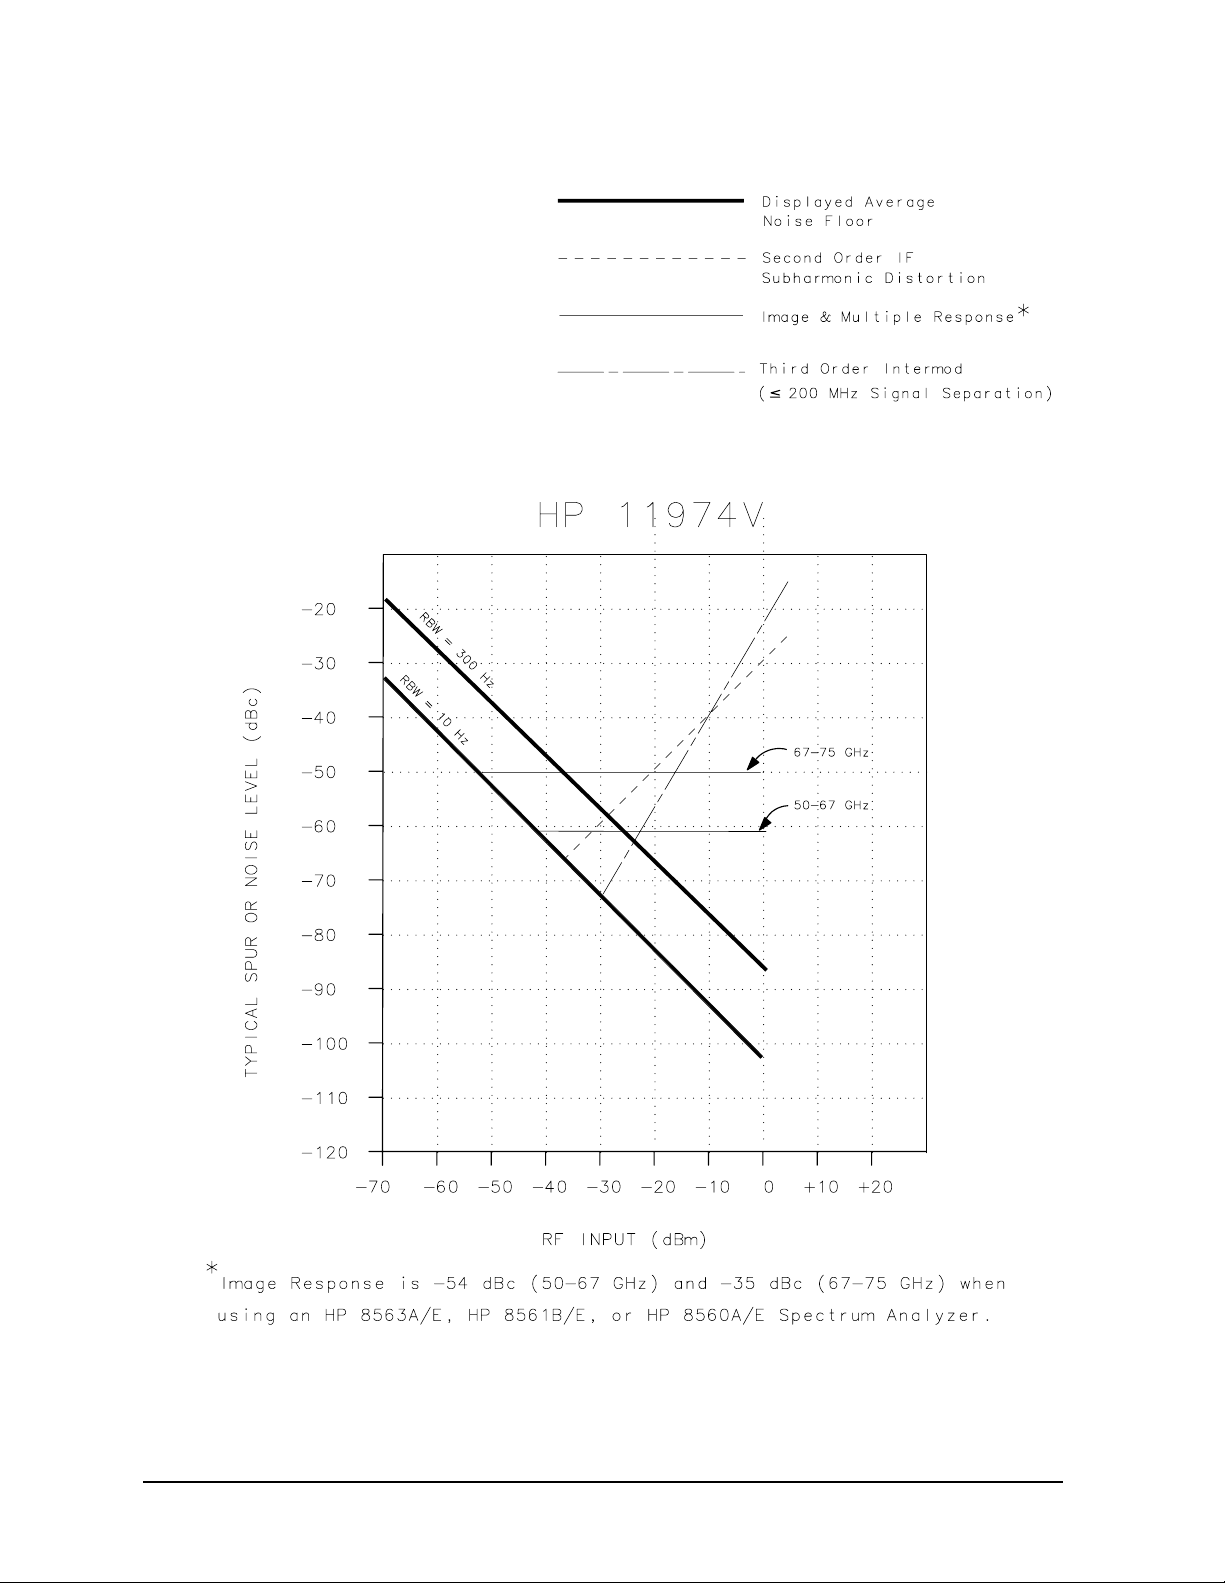
Figure 1-6 . 11974V Minimum System Dynamic Range . . . . . . . . . . . . . . . . . . . . . . . . . . . . . . . . . . . . . . . . . . . . 30
Figure 2-1 . Voltage Selection Switch and Line Fuse Locations . . . . . . . . . . . . . . . . . . . . . . . . . . . . . . . . . . . . . . 39
Figure 2-2 . Static-Safe Workstation . . . . . . . . . . . . . . . . . . . . . . . . . . . . . . . . . . . . . . . . . . . . . . . . . . . . . . . . . . . . 43
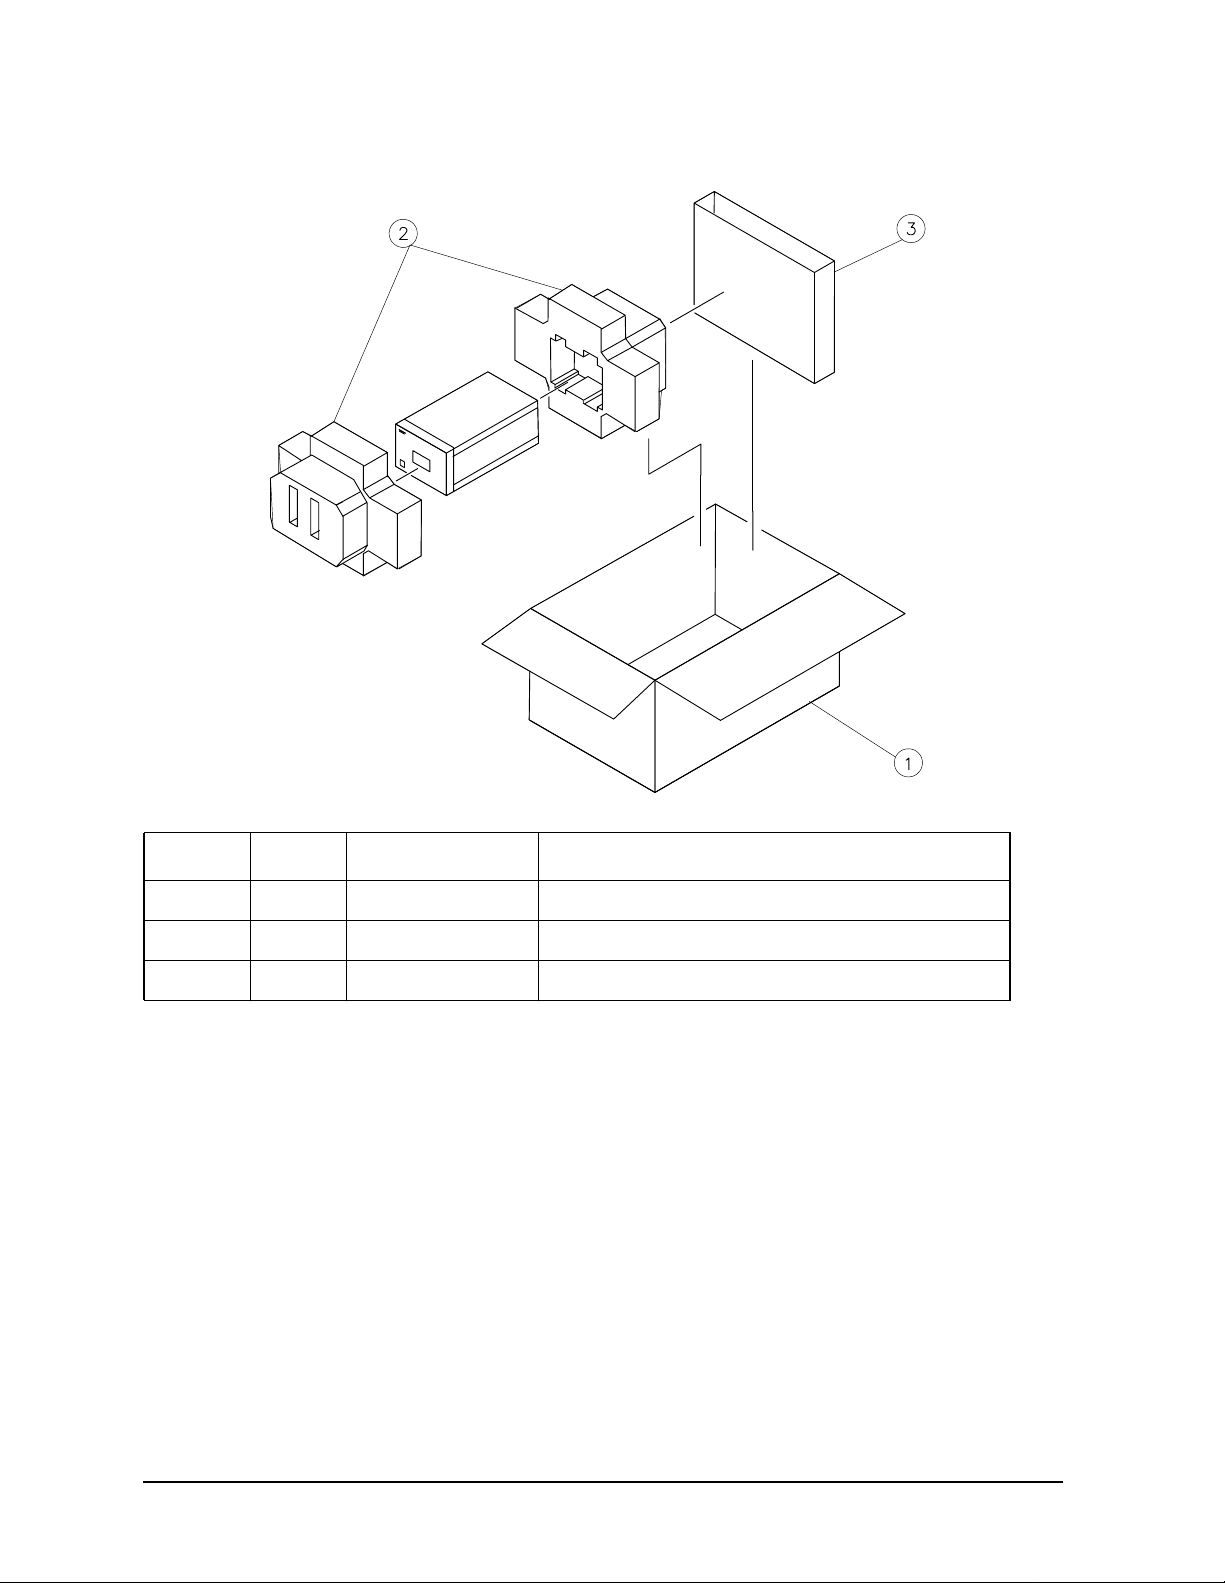
Figure 2-3 . Packaging Materials for 11974 Series . . . . . . . . . . . . . . . . . . . . . . . . . . . . . . . . . . . . . . . . . . . . . . . . . 47
Figure 2-4 . Packaging Materials for 11974-60028 Power Supply . . . . . . . . . . . . . . . . . . . . . . . . . . . . . . . . . . . . . 48
Figure 3-1 . 11974Q Front Panel . . . . . . . . . . . . . . . . . . . . . . . . . . . . . . . . . . . . . . . . . . . . . . . . . . . . . . . . . . . . . . . 53
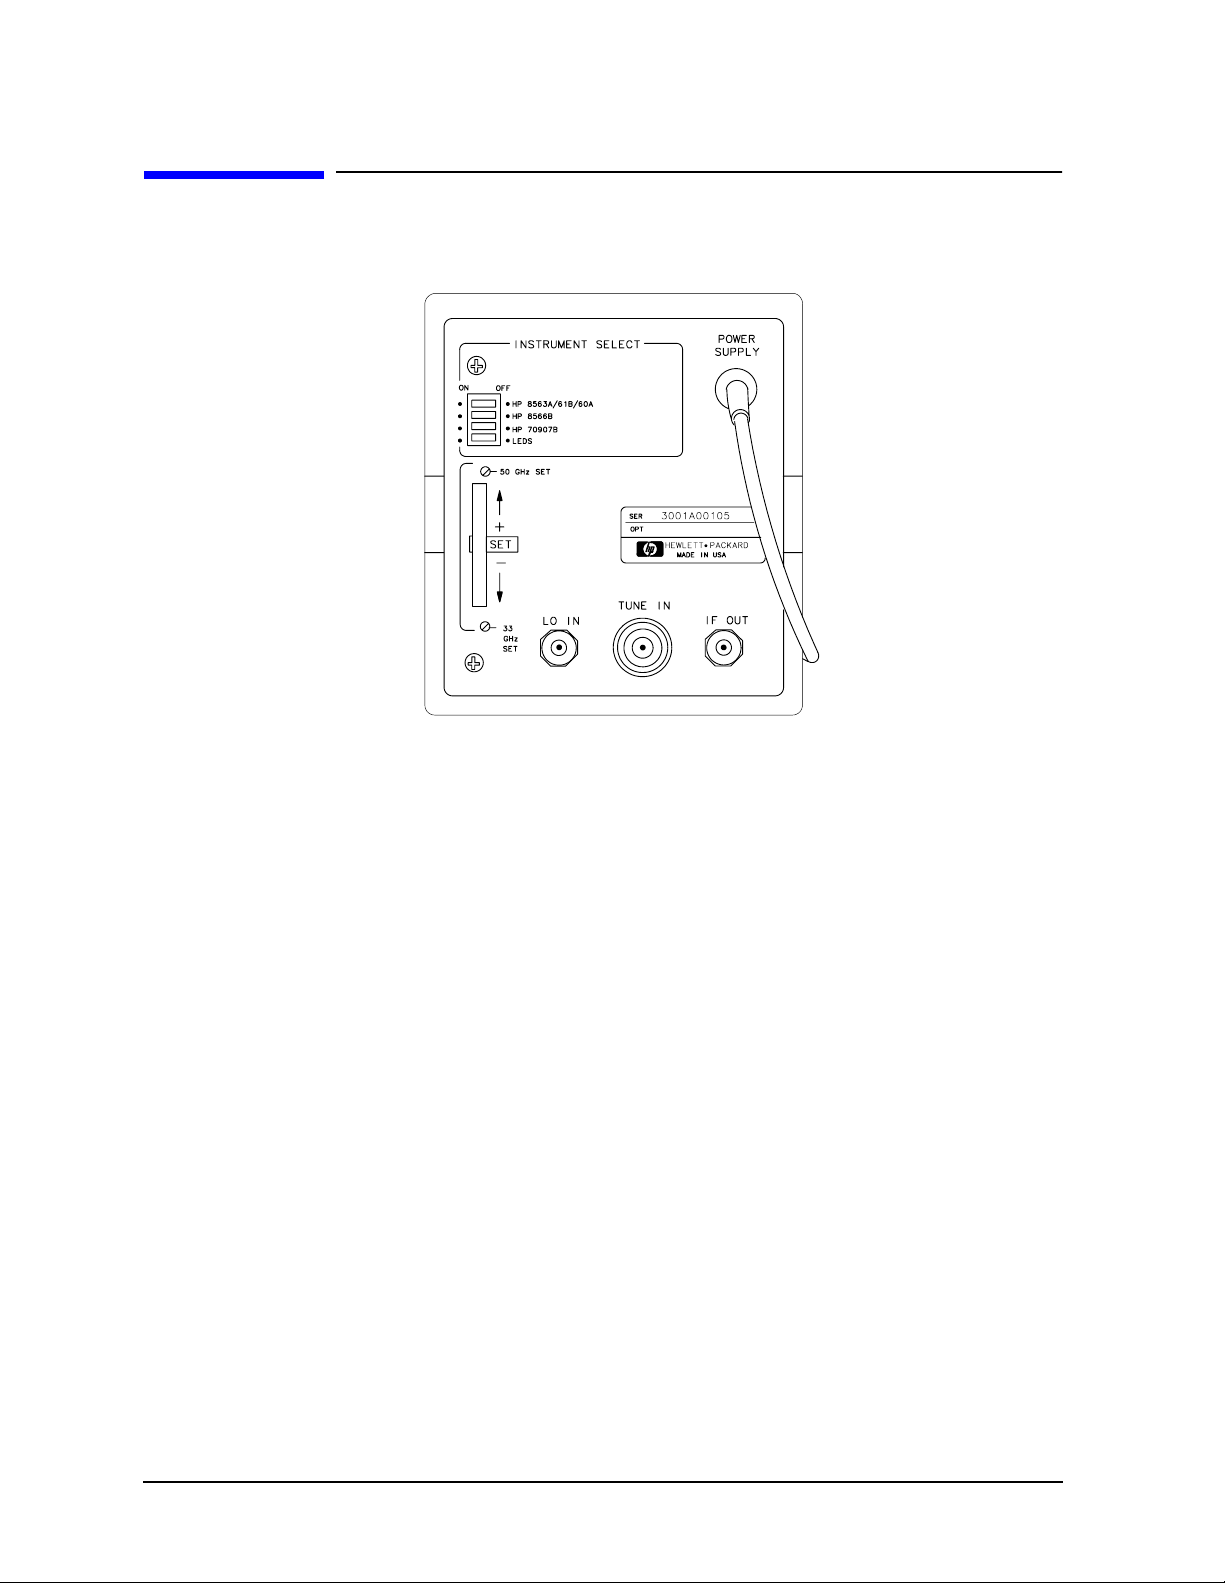
Figure 3-2 . 11974Q Rear Panel . . . . . . . . . . . . . . . . . . . . . . . . . . . . . . . . . . . . . . . . . . . . . . . . . . . . . . . . . . . . . . . 54
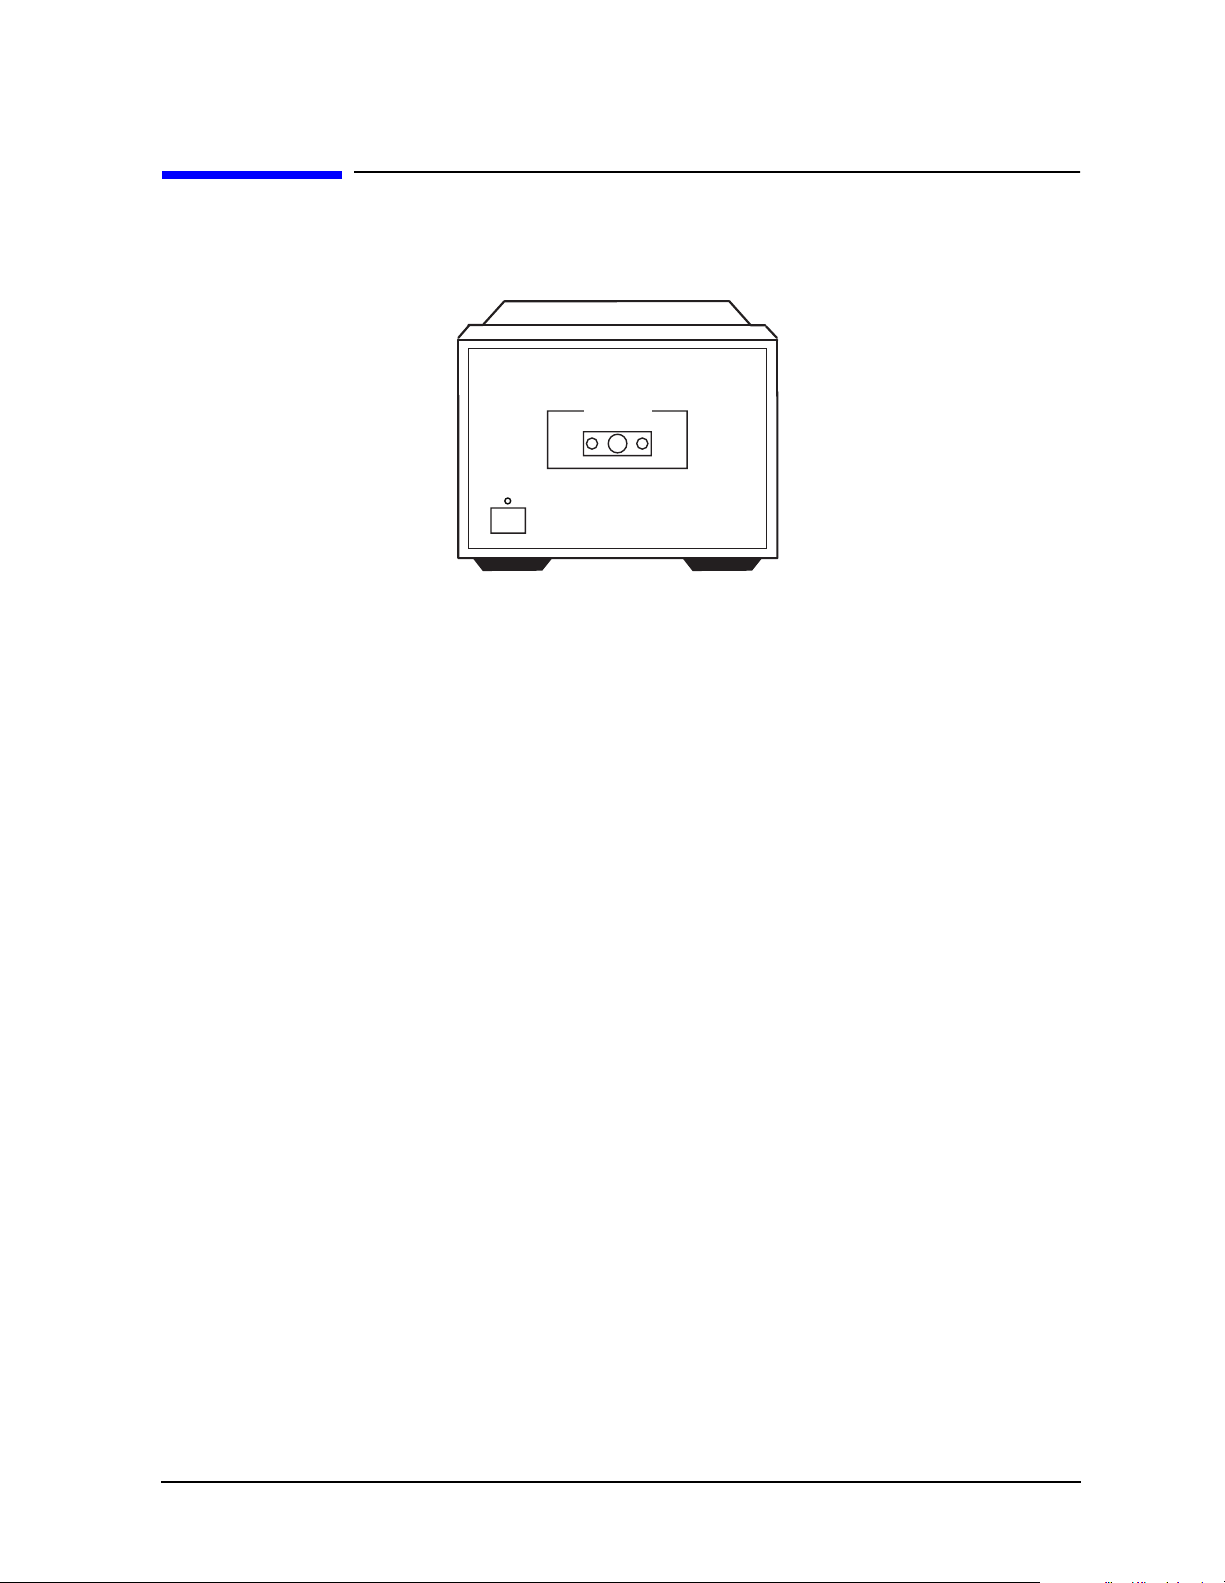
Figure 3-3 . 11974-60028 Front Panel . . . . . . . . . . . . . . . . . . . . . . . . . . . . . . . . . . . . . . . . . . . . . . . . . . . . . . . . . . 55
Figure 3-4 . Setup Configuration for Remote Location of an 11974 . . . . . . . . . . . . . . . . . . . . . . . . . . . . . . . . . . . 58
Figure 3-5 . 11974 Connections Using an 8566B . . . . . . . . . . . . . . . . . . . . . . . . . . . . . . . . . . . . . . . . . . . . . . . . . . 61
Figure 3-6 . 11974 Connections to the 71000 Series Spectrum Analyzer . . . . . . . . . . . . . . . . . . . . . . . . . . . . . . . . 65
Figure 3-7 . 11974 Connections Using an 8563A, 8561B,
8560A, or 8560E-Series Spectrum Analyzers . . . . . . . . . . . . . . . . . . . . . . . . . . . . . . . . . . . . . . . . . . . . . . . . . . 74
Figure 3-8 . 11974 Connections Using an 8561A/62A/62B . . . . . . . . . . . . . . . . . . . . . . . . . . . . . . . . . . . . . . . . . . 83
Figure 4-1 . Performance Tests Setup . . . . . . . . . . . . . . . . . . . . . . . . . . . . . . . . . . . . . . . . . . . . . . . . . . . . . . . . . . . 98
7
Page 7

Tables
Table 1-1 . 11974 Specifications . . . . . . . . . . . . . . . . . . . . . . . . . . . . . . . . . . . . . . . . . . . . . . . . . . . . . . . . . . . . . . 19
Table 1-2 . 11974 Characteristics . . . . . . . . . . . . . . . . . . . . . . . . . . . . . . . . . . . . . . . . . . . . . . . . . . . . . . . . . . . . . . 23
Table 2-1 . 11974 Compatibility with Spectrum Analyzers . . . . . . . . . . . . . . . . . . . . . . . . . . . . . . . . . . . . . . . . . . 33
Table 2-2 . Operating Power Requirements. . . . . . . . . . . . . . . . . . . . . . . . . . . . . . . . . . . . . . . . . . . . . . . . . . . . . . . 38
Table 2-3. . Power Cables . . . . . . . . . . . . . . . . . . . . . . . . . . . . . . . . . . . . . . . . . . . . . . . . . . . . . . . . . . . . . . . . . . . . 41
Table 2-4 . Static-Safe Accessories . . . . . . . . . . . . . . . . . . . . . . . . . . . . . . . . . . . . . . . . . . . . . . . . . . . . . . . . . . . . . 45
Table 2-5. . Contacting Agilent . . . . . . . . . . . . . . . . . . . . . . . . . . . . . . . . . . . . . . . . . . . . . . . . . . . . . . . . . . . . . . . . 49
Table 3-1 . RF Input Port Flange Types. . . . . . . . . . . . . . . . . . . . . . . . . . . . . . . . . . . . . . . . . . . . . . . . . . . . . . . . . . 53
Table 3-2 . External Mixing Bands and Associated Mixing Harmonics . . . . . . . . . . . . . . . . . . . . . . . . . . . . . . . . . 70
Table 3-3 . Flatness Points and Conversion Losses for Frequencies above 18 GHz . . . . . . . . . . . . . . . . . . . . . . . 80
Table 3-4 . Minimum Sweep Time. . . . . . . . . . . . . . . . . . . . . . . . . . . . . . . . . . . . . . . . . . . . . . . . . . . . . . . . . . . . . . 87
Table 3-5 . Flatness Points and Conversion Losses for Frequencies above 18 GHz . . . . . . . . . . . . . . . . . . . . . . . . 88
Table 4-1 . Recommended Test Equipment for 11974A . . . . . . . . . . . . . . . . . . . . . . . . . . . . . . . . . . . . . . . . . . . . 93
Table 4-2 . Recommended Test Equipment for 11974Q . . . . . . . . . . . . . . . . . . . . . . . . . . . . . . . . . . . . . . . . . . . . . 94
Table 4-3 . Recommended Test Equipment for 11974U . . . . . . . . . . . . . . . . . . . . . . . . . . . . . . . . . . . . . . . . . . . . . 95
Table 4-4 . Recommended Test Equipment for 11974V . . . . . . . . . . . . . . . . . . . . . . . . . . . . . . . . . . . . . . . . . . . . . 96
Table 4-5 . Recommended Accessories for All Bands. . . . . . . . . . . . . . . . . . . . . . . . . . . . . . . . . . . . . . . . . . . . . . . 97
Table 4-6 . Performance Test Record Summary (1 of 2) for 11974A, Q, U, and V . . . . . . . . . . . . . . . . . . . . . . . 126
Table 4-6 . Performance Test Record Summary (2 of 2) for 11974A . . . . . . . . . . . . . . . . . . . . . . . . . . . . . . . . . . 127
Table 4-6 . Performance Test Record Summary (2 of 2) for 11974Q . . . . . . . . . . . . . . . . . . . . . . . . . . . . . . . . . . 128
Table 4-6 . Performance Test Record Summary (2 of 2) for 11974U . . . . . . . . . . . . . . . . . . . . . . . . . . . . . . . . . . 129
Table 4-6 . Performance Test Record Summary (2 of 2) for 11974V . . . . . . . . . . . . . . . . . . . . . . . . . . . . . . . . . . 130
Table 4-7 . Conversion Loss Test Data (1 of 3). . . . . . . . . . . . . . . . . . . . . . . . . . . . . . . . . . . . . . . . . . . . . . . . . . . 131
Table 4-7 . Conversion Loss Test Data (2 of 3). . . . . . . . . . . . . . . . . . . . . . . . . . . . . . . . . . . . . . . . . . . . . . . . . . . 132
Table 4-7 . Conversion Loss Test Data (3 of 3). . . . . . . . . . . . . . . . . . . . . . . . . . . . . . . . . . . . . . . . . . . . . . . . . . . 133
Table 4-8 . Image Rejection Test Data. . . . . . . . . . . . . . . . . . . . . . . . . . . . . . . . . . . . . . . . . . . . . . . . . . . . . . . . . . 134
Table 4-9 . Multiple Response Rejection Test Data. . . . . . . . . . . . . . . . . . . . . . . . . . . . . . . . . . . . . . . . . . . . . . . . 135
Table 4-10 . Displayed Average Noise Level Data . . . . . . . . . . . . . . . . . . . . . . . . . . . . . . . . . . . . . . . . . . . . . . . . 136
Table 4-11 . 3 dB Bandwidth Data. . . . . . . . . . . . . . . . . . . . . . . . . . . . . . . . . . . . . . . . . . . . . . . . . . . . . . . . . . . . . 136
9
Page 8

1 General Information
11
Page 9

General Information
Introduction
Introduction
The 11974 Series Preselected Millimeter Mixers Installation, Verification, and Operation
Manual describes how to configure an 11974 in a system, what to do to verify its
performance, and how to operate an 11974.
This manual contains the following chapters:
• Chapter 1, “General Information,” provides a quick overview of the 11974 Series
Preselected Millimeter Mixer and all operating specifications and characteristics tables.
• Chapter 2, “Installation,” describes power requirements, spectrum-analyzer
compatibility, installation requirements, packaging information, and the Agilent
Technologies Sales and Service Office listing.
• Chapter 3, “Operation,” describes operating precautions, operating hints, and complete
operating procedures with the most commonly-used spectrum analyzers.
• Chapter 4, “Performance Tests,” provides the tests to verify the electrical performance
of the 11974 Series mixers.
• Chapter 5, “Safety and Regulatory Information,” provides safety warnings and
cautions, explanations of the various symbols appearing on the instrument, regulatory
compliance information.
12 Chapter1
Page 10

General Information
What You'll Find in this Chapter
What You'll Find in this Chapter
This chapter introduces you to the 11974 Series Preselected Millimeter Mixers and
provides other general information regarding the 11974 Series. This chapter contains the
following topics:
• “11974 Series Preselected Millimeter Mixers Overview” on page 14.
• “Accessories Supplied” on page 15.
• “Specifications and Characteristics” on page 18.
• “Calibration Cycle” on page 17.
Chapter 1 13
Page 11
General Information
11974 Series Preselected Millimeter Mixers Overview
11974 Series Preselected Millimeter Mixers Overview
The 11974 Series Preselected Millimeter Mixers are preselected RF front-end sections
used to extend the frequency range of the Agilent Technologieshigh performance, portable,
and modular spectrum analyzers. The 11974 Series are fully calibrated, system
compatible, and cover a frequency range from 26.5 to 75 GHz in four waveguide bands —
A, Q, U, and V. Control of the 11974 is provided by the host spectrum analyzer's sweep
ramp and first local-oscillator output. The 11974 is packaged as an external module with
flexible cables to the spectrum analyzer in order to facilitate connection to the waveguide
device under test.
The tracking preselector of the 11974, based on barium hexa-ferrite technology, eliminates
the image and multiple harmonic responses that clutter the spectrum display. The
tracking preselector in front of the harmonic mixer eliminates the need for the
time-consuming process of signal identification.
A stand-alone power supply provides the tuning current for the filter. The included
accessory kit contains the cables and tools necessary to make connections to the host
spectrum analyzer.
Figure 1-1 11974 Series with 11974-60028 Power Supply
14 Chapter1
Page 12

Options Available
General Information
11974 Series Preselected Millimeter Mixers Overview
Input Isolator
(Option 001)
This option provides an 11974 Series Preselected Millimeter Mixer that has
been calibrated with an isolator attached to the RF input. The addition of
the isolator improves input match, reducing measurement uncertainties
and protects the device under test (DUT) from off-resonant reflections from
the input tracking filter.
Accessories Supplied
The following is a list of all accessories, and their part numbers, supplied at shipment.
Accessory Description Part Number
Ball Driver, 3/32 inch 8710-1539
Wrench, 5/16 inch 8710-0510
Alignment Tool 8710-0630
Four Standard #4-40 Screws for A band 3030-0221
Captive Screws for Q, U, and V bands, 4 each 1390-0671
3 Cables with SMA (m) Connectors (1.0 m) 5061-5458
1 Cable with BNC (m) Connectors (24 inches) 8120-1839
1 Cable with BNC (m) Connectors (48 inches) 8120-2582
1 Adapter with BNC (f) Connectors 1250-0080
1 Stand for the 11974 83556-60010
Other related accessories available from Agilent Technologies are:
Accessory Description Part Number
Waveguide with 2.4 mm coax adapters 281C
Attenuators for R, Q, and U bands only 382A
20/50 dB Fixed Attenuators 373D/G
3 dB, 6 dB, and 10 dB Fixed Attenuators for Q and U bands only 370A/B/C
Waveguide bends, twists, and straight sections 800 Series
Waveguide isolators for R, Q, U, and V bands 365A Series
Rack mounting flange for power supply 5062-3957
Chapter 1 15
Page 13
General Information
Serial Numbers Covered by This Manual
Serial Numbers Covered by This Manual
This manual applies to 11974 Series Preselected Millimeter Mixers with the serial number
prefixes 3001A and above.
Agilent Technologies makes frequent improvements to its products to enhance their
performance, usability, or reliability. Agilent Technologiesservice personnel have access to
complete records of design changes to each type of equipment, based on the equipment's
serial number. Whenever you contact Agilent Technologies about your 11974, have the
complete serial number available to ensure that you are obtaining the most complete and
accurate information possible.
The serial number label is attached to the rear of the 11974. The serial number has two
parts: the prefix (the first four numbers and a letter), and the suffix (the last five numbers).
See Figure 1-2.
The first four numbers of the prefix are a code identifying the date of the last major design
change incorporated in your unit. The letter identifies the country in which the unit was
manufactured. The five-digit suffix is a sequential number and is different for each unit.
Whenever you list the serial number or refer to it in obtaining information about your
11974, be sure to use the complete number, including the full prefix and the suffix.
Figure 1-2 Typical Serial Number Label
16 Chapter1
Page 14

General Information
Calibration Cycle
Calibration Cycle
Use the performance tests in Chapter 4 every 12 months to check the unit against the
specifications listed in Table 1-1 on page 19.
Chapter 1 17
Page 15

General Information
Specifications and Characteristics
Specifications and Characteristics
Table 1-1 lists the specifications for the 11974 Series Preselected Millimeter Mixers.
Unless stated otherwise, all specifications describe the warranted performance of the
11974 under the following conditions:
• Five minute warm-up for ambient conditions.
• Ambient temperature 0°C to 55°C.
• One year calibration cycle.
• Environmental requirements met.
• Connections to the host spectrum analyzer are made with one length of coax cable, part
number 5061-5458.
• The 11974 is used with one of the following spectrum analyzers:
❏ 8566B with 11975A Amplifier
❏ 8560 Series Portable Spectrum Analyzers
❏ 71000C with 70907B External Mixer Interface Module.
Characteristics provide useful, but nonwarranted, information in the form of typical,
nominal, or approximate values for band performance. Refer to Table 1-2 on page 23 for a
list of band characteristics.
18 Chapter1
Page 16

Table 1-1 11974 Specifications
Frequency Range
(LO Harmonic Number)
General Information
Specifications and Characteristics
FREQUENCY
11974A (n = 8)
11974Q (n = 10)
11974U (n = 10)
11974V (n = 14)
RF Preselector Bandwidth (3 dB points)
11974A
11974Q
11974U
11974V
AMPLITUDE MEASUREMENT RANGE
Displayed Average Noise Level
Host Spectrum Analyzers: 8566B/11975A,
71000C/70907B
(RBW = 10 Hz)
11974A
11974Q
11974U
11974V
Option 001
26.5 GHz
33 GHz
40 GHz
50 GHz
Typical
130 MHz
150 MHz
150 MHz
200 MHz
−111 dBm max.
−106 dBm max.
−109 dBm max.
−100 dBm max.
to
to
to
to
40 GHz
50 GHz
60 GHz
75 GHz
Min.
80 MHz
100 MHz
100 MHz
100 MHz
11974A
11974Q
11974U
11974V
Host Spectrum Analyzers: 8560 Series Portable
Spectrum Analyzers
(RBW = 300 Hz)
11974A
11974Q
11974U
11974V
Option 001
11974A
11974Q
11974U
11974V
−109 dBm max.
−104 dBm max.
−107 dBm max.
−97 dBm max.
−96 dBm max.
−91 dBm max.
−94 dBm max.
−85 dBm max.
−94 dBm max.
−89 dBm max.
−92 dBm max.
−82 dBm max.
Chapter 1 19
Page 17

General Information
Specifications and Characteristics
Table 1-1 11974 Specifications (Continued)
Conversion Loss
RF to IF port
(includes 1 m IF cable, part number 5061-5458)
11974A
11974Q
11974U
11974V
RF Input Match (across full waveguide band)
Option 001 only
11974A, Q, U
11974V
Conversion Loss Chart Accuracy
20C to 30C: RSS of calibration equipment errors
(Add 0.7 dB if used with 8560 Series Portable
Spectrum Analyzers.)
0C to 55C: RSS of calibration equipment errors plus
worst-case temperature effects of 11974 (Add
0.7 dB if used with 8560 Series Portable Spectrum
Analyzers.)
11974A
11974Q
11974U
11974V
Image Rejection
44 dB max.
46 dB max.
43 dB max.
57 dB max.
<1.6:1
<2.3:1
0°C to 55°C
±2.3 dB max.
±2.3 dB max.
±2.6 dB max.
±4.5 dB max.
20°C to 30°C
±1.0 dB max.
±1.0 dB max.
±1.1 dB max.
±2.0 dB max.
(Image positioned 2x fIF above tuned response)
Host Spectrum Analyzers: 8566B/11975A
71000C/70907B
11974A
11974Q
11974U
11974V (50 to 67 GHz)
11974V (67 to 75 GHz)
Host Spectrum Analyzers: 8560 Series Portable
0°C to 55°C
−54 dBc max.
−50 dBc max.
−50 dBc max.
−50 dBc max.
−40 dBc max.
20°C to 30°C
−59 dBc max.
−55 dBc max.
−55 dBc max.
−55 dBc max.
−45 dBc max.
Spectrum Analyzers
11974A
11974Q
11974U
11974V (50 to 67 GHz)
11974V (67 to 75 GHz)
20 Chapter1
−50 dBc max.
−45 dBc max.
−45 dBc max.
−45 dBc max.
−35 dBc max.
−55 dBc max.
−50 dBc max.
−50 dBc max.
−50 dBc max.
−40 dBc max.
Page 18

Table 1-1 11974 Specifications (Continued)
General Information
Specifications and Characteristics
Multiple Response
(Due to in-range applied signals mixing with LO
harmonics other than order N)
11974A (N = 8)
11974Q (N = 10)
11974U (N = 10)
11974V (N = 14) (applied signal: 50 to 67 GHz)
11974V (N = 14) (applied signal: 67 to 75 GHz)
a. Multiple response displayed frequency, f ′RF, due to input signal fRF.
where:
N = Band Harmonic number
N′ = Unwanted Harmonic
= …N−2, N−1, N+1, N+2,…
fIF = 321.4 MHz for 8566B and 71000C Spectrum Analyzers
= 310.7 MHz for 8560 Series Portable Spectrum Analyzers
a
−63 dBc max.
−60 dBc max.
−60 dBc max.
−60 dBc max.
−55 dBc max.
N
----- -
f′
RF
f
N′
RFfIF
N′ N±
--------------
+=
N′
Chapter 1 21
Page 19

General Information
Specifications and Characteristics
Table 1-1 11974 Specifications (Continued)
GENERAL SPECIFICATIONS
Environmental Specifications Type tested to MIL-T-28800C, Class 5
environmental conditions as listed below:
Temperature
Non-operating
Operating
−40°C to +75°C
0°C to +55°C
Relative Humidity
Altitude
Non-operating
Operating
Maximum Vibration Level
5 Hz to 55 Hz
Maximum Shock
Electromagnetic Compatibility Meets radiated and conducted emissions
95% ±5% up to +30°C
<12,195 m (<40,000 feet)
<3,048 m (<10,000 feet)
2 g
30 g
of MIL-STD-461B, Part 7, methods CE03
(Air Force) and RE02, FTZ 26/527/79
22 Chapter1
Page 20

General Information
Specifications and Characteristics
Table 1-2 11974 Characteristics
Note: These are not specifications. Characteristics provide useful, but nonwarranted
information about instrument performance.
FREQUENCY
Center Frequency Accuracy
Residual FM
Span Accuracy
AMPLITUDE MEASUREMENT RANGE
Frequency Response (uncorrected)
(With respect to mean value of
Conversion Loss chart)
11974A
11974Q
11974U
11974V
1 dB Gain Compression
Using Table 1-1, “11974 Specifications,” for the
spectrum analyzer being used, evaluate these
characteristics with reference to the harmonic
numbers listed below.
11974A (n = 8)
11974Q (n = 10)
11974U (n = 10)
11974V (n = 14)
±4.5 dB max.
±4.0 dB max.
±4.0 dB max.
±4.0 dB max.
26.5 GHz to 40 GHz
33 GHz to 50 GHz
40 GHz to 60 GHz
50 GHz to 75 GHz
(RF Input for 1 dB increase in conversion
loss)
11974A
11974Q
11974U
11974V
Third Order Intercept (TOI)
(For two signals spaced less than 200 MHz
apart)
11974A
11974Q
11974U
11974V
+6 dBm min.
0 dBm min.
0 dBm min.
+3 dBm min.
+13 dBm min.
+13 dBm min.
+13 dBm min.
+13 dBm min.
Chapter 1 23
Page 21

General Information
Specifications and Characteristics
Table 1-2 11974 Characteristics (Continued)
AMPLITUDE MEASUREMENT RANGE (continued)
IF Subharmonic Response
Intercept (2nd Order)
(Response at fIF/2 above input signal)
fIF/2 = 160.7 MHz (8566B, 71000C)
= 155.35 MHz (8560 Series
Portable Spectrum
Analyzer)
11974A
11974Q
11974U
11974V
Dynamic Range
Refer to Figure 1-3 on page 27, Figure 1-4 on page 28, Figure 1-5 on page 29, and
Figure 1-6 on page 30.
INPUTS AND OUTPUTS
RF Input
Waveguide Size, Flange Type
11974A
11974Q
11974U
11974V
Maximum RF Input Level
(CW, Peak, or Average)
Match (at peak of preselector)
LO Input
+45 dBm min.
+45 dBm min.
+45 dBm min.
+30 dBm min.
Size
WR-28
WR-22
WR-19
WR-15
+25 dBm
<3.0:1
Flange
UG 599/U
UG 383/U
UG 383/U-M
UG 385/U
Connector Type
Frequency Range
11974A
11974Q
11974U
11974V
Optimal LO Input Level
Match
24 Chapter1
SMA (f)
3.3 GHz to 5.0 GHz
3.3 GHz to 5.0 GHz
4.0 GHz to 6.0 GHz
3.5 GHz to 5.3 GHz
+14.5 dBm to 16 dBm
<2.0:1 (50Ω)
Page 22

Table 1-2 11974 Characteristics (Continued)
INPUTS AND OUTPUTS (continued)
IF Output
General Information
Specifications and Characteristics
Connector Type
Match
Bandwidth
(Total 11974 BW limited by preselector.)
Tune + Span Input
Connector Type
Sensitivity (Spectrum Analyzer Type)
(PSEL PK DAC at mid-value)
8566B/11975A
8560 Series Portable Spectrum
Analyzer
71000/70907B
Input Impedance
Power Supply (11974-60028)
Output
Input
SMA (f)
<1.6:1 (50Ω)
Nominal >100 MHz
Typical >150 MHz
BNC (f)
−2 V/GHz × fLO− 0.32 V
+1.5 V/GHz × fLO− 0.21 V
+1.5 V/GHz × fLO V
20 kΩ min.
+50 V, 0.6 A
±15 V, 0.2 A
100/110/220/240 V ac
47 Hz to 63 Hz
Power Consumption
130 VA max.
Chapter 1 25
Page 23
General Information
Specifications and Characteristics
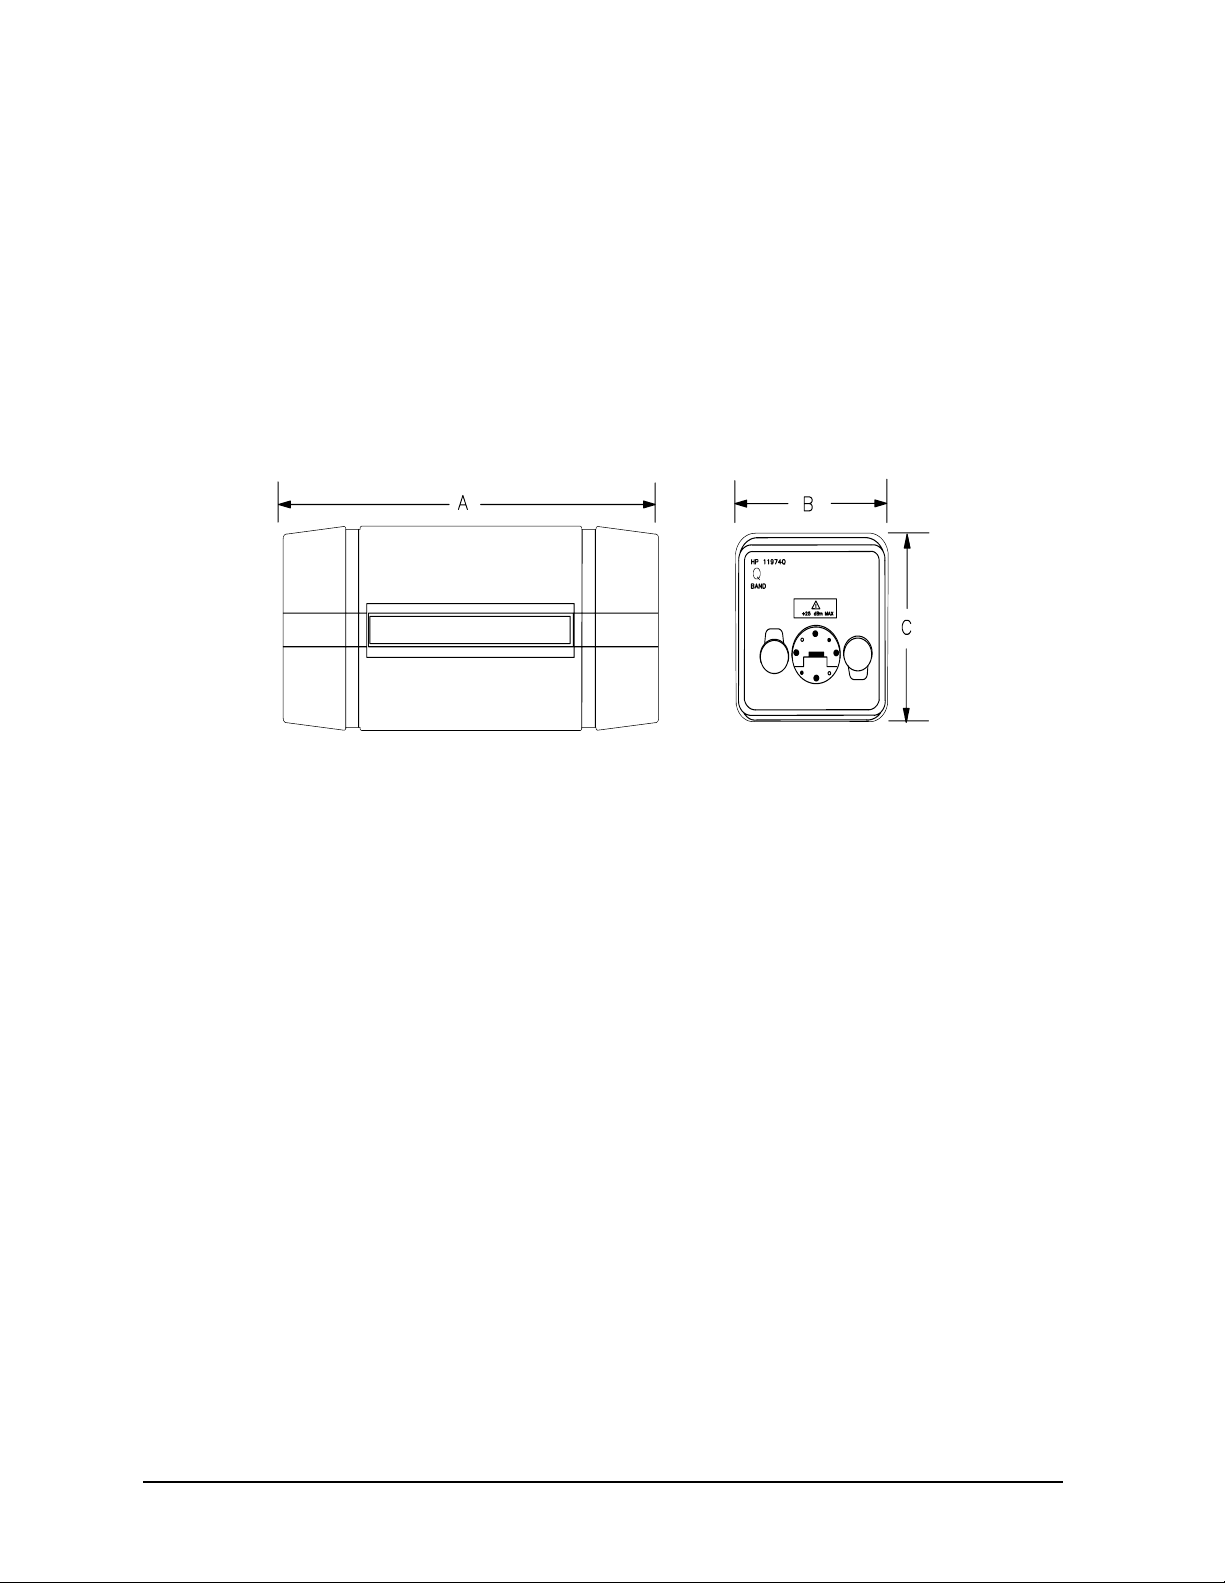
Weight
GENERAL CHARACTERISTICS
11974 Series
11974-60028 Preselector Power Supply
Size
11974 Series
11974-60028 Preselector Power Supply
14.3 kg (6.5 lb)
26.2 kg (11.9 lb)
Length (A) × Width (B) × Height (C)
210.2 mm × 84.7 mm × 101.5 mm
346.1 mm × 212.7 mm × 133.4 mm
26 Chapter1
Page 24
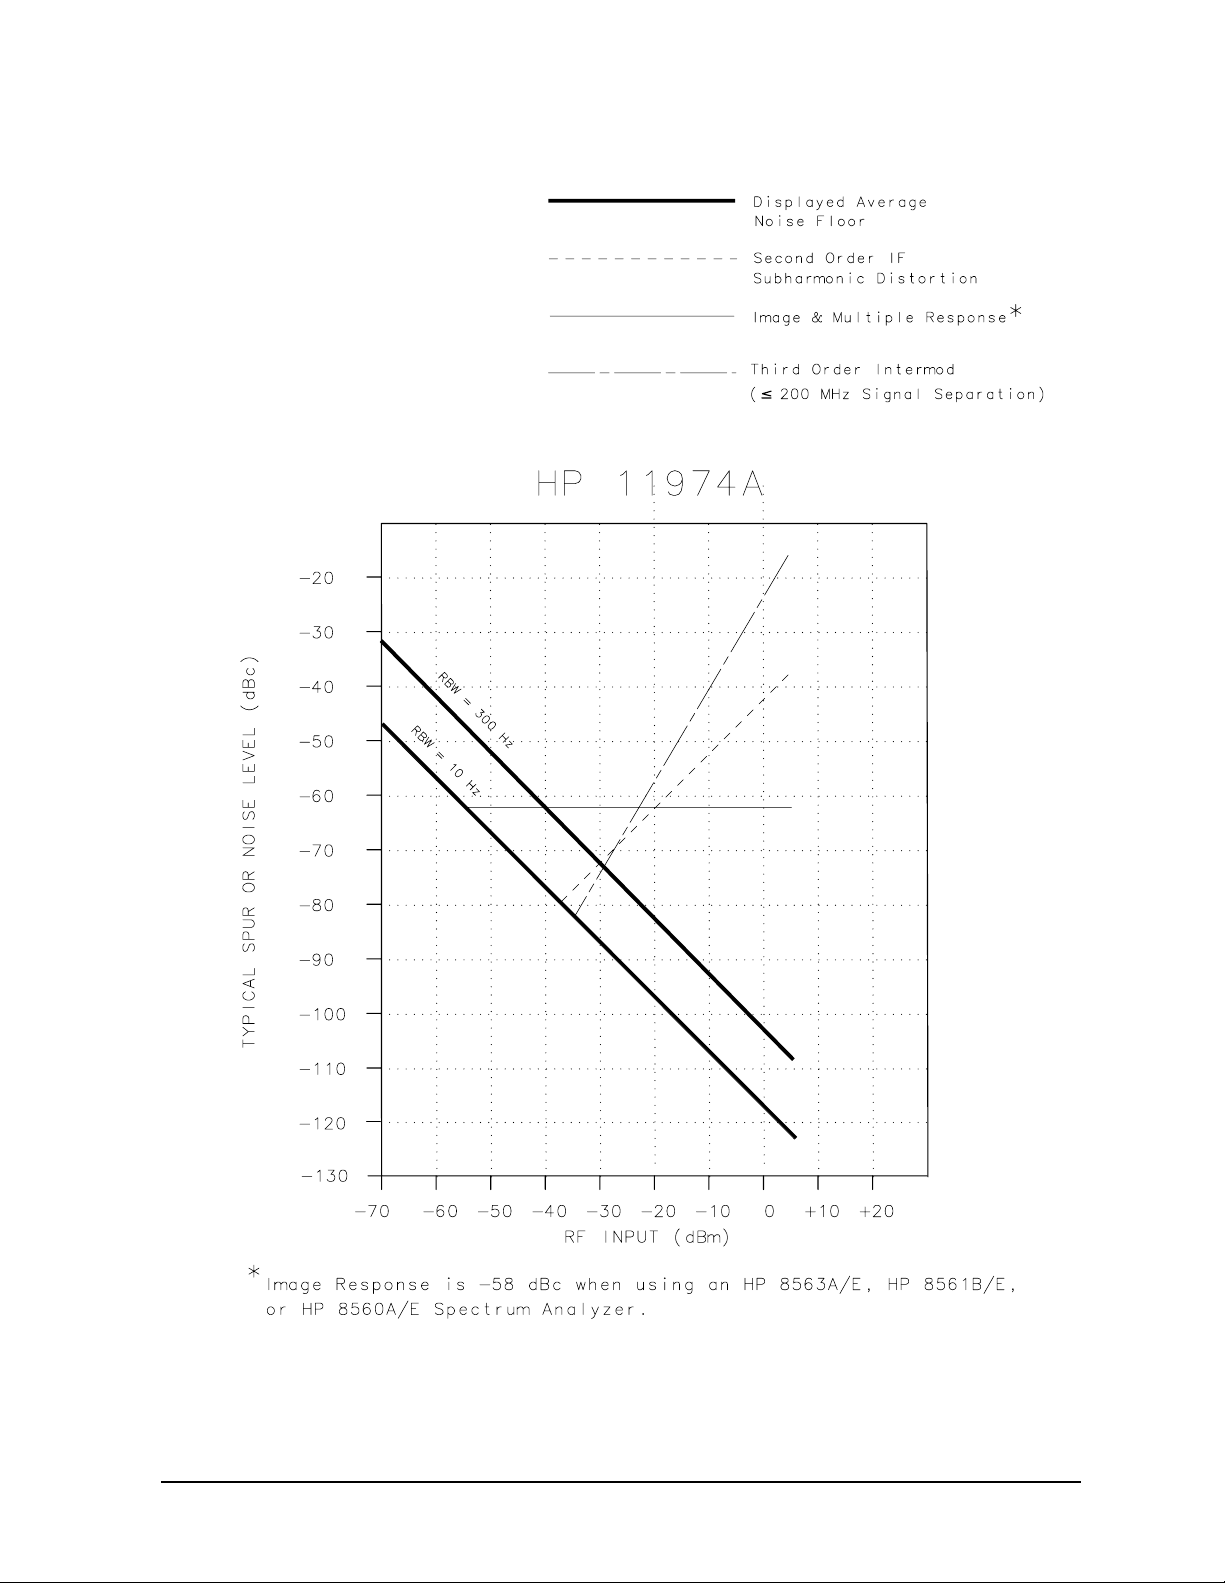
Figure 1-3 11974A Minimum System Dynamic Range
General Information
Specifications and Characteristics
Chapter 1 27
Page 25
General Information
Specifications and Characteristics
Figure 1-4 11974Q Minimum System Dynamic Range
28 Chapter1
Page 26
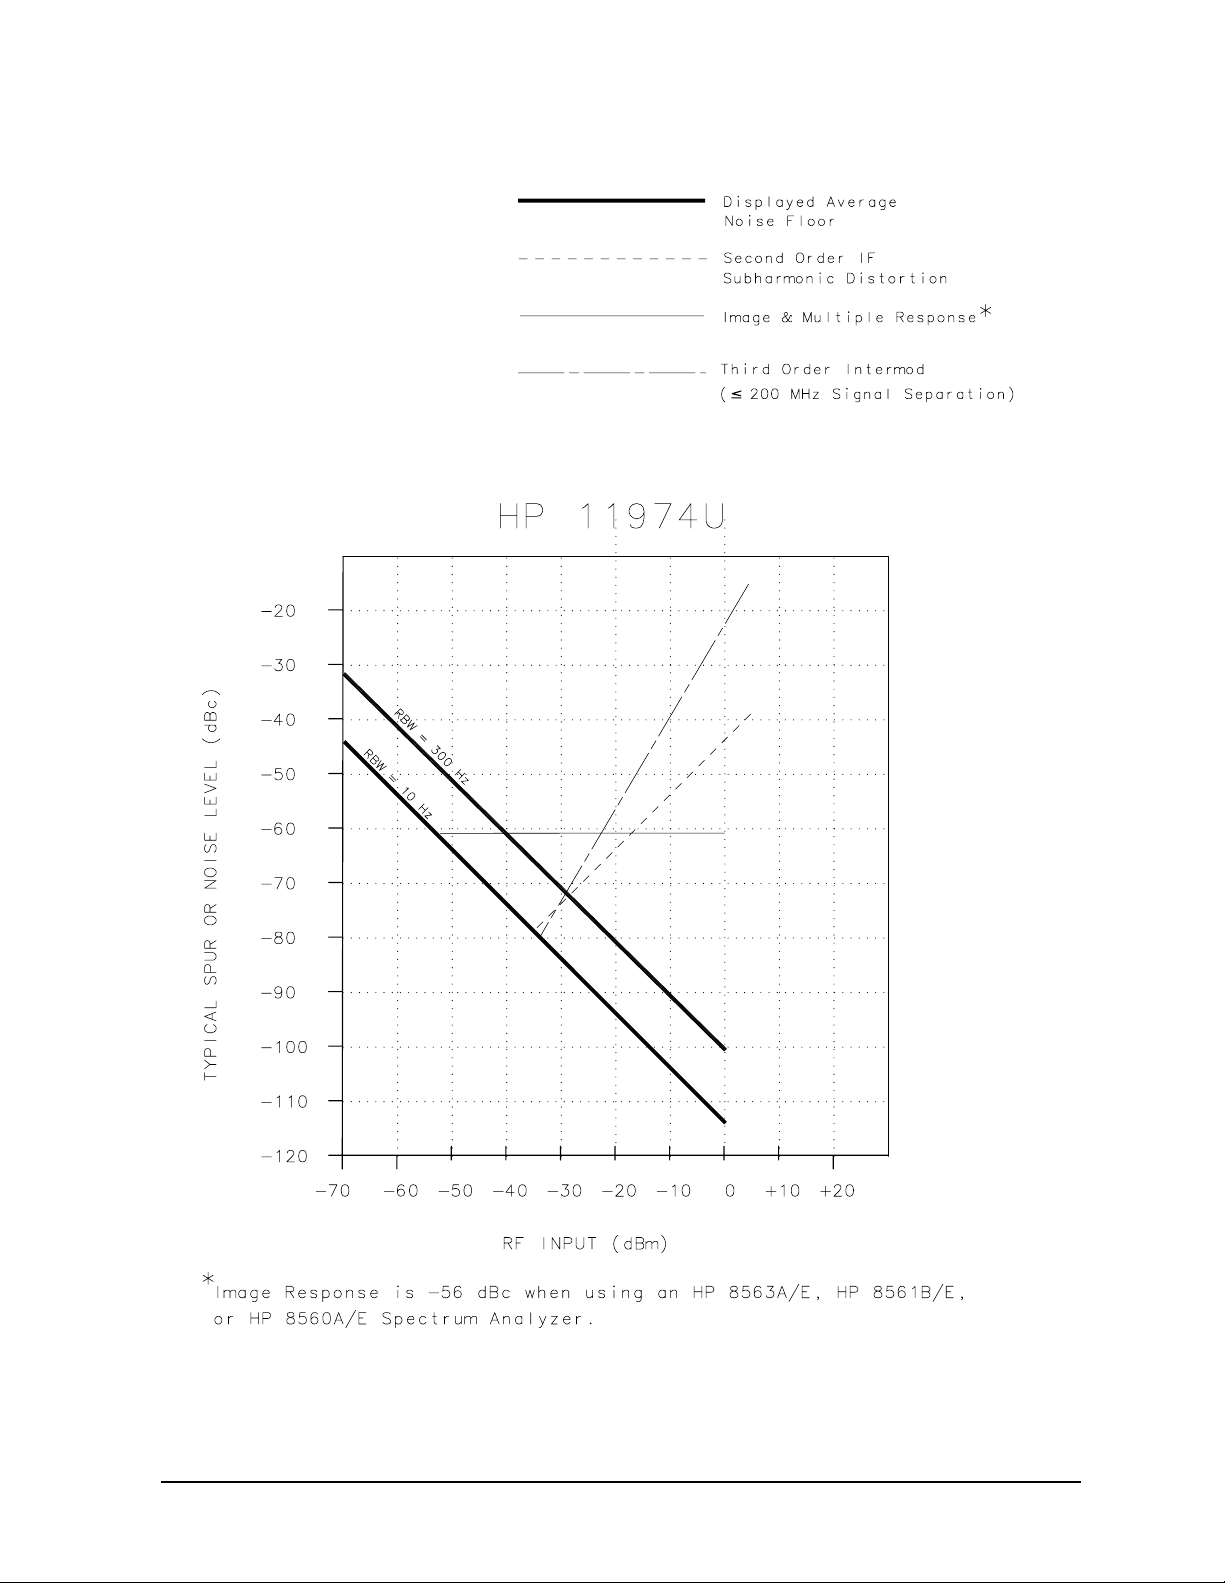
Figure 1-5 11974U Minimum System Dynamic Range
General Information
Specifications and Characteristics
Chapter 1 29
Page 27
General Information
Specifications and Characteristics
Figure 1-6 11974V Minimum System Dynamic Range
30 Chapter1
Page 28

2 Installation
31
Page 29

Installation
What You'll Find in This Chapter
What You'll Find in This Chapter
This chapter describes how to set up an 11974 Series Preselected Millimeter Mixer for
operation. This chapter contains the following topics.
“Spectrum Analyzer Compatibility” on page 33
“Initial Inspection” on page 36
“Preparing the 11974 for Use” on page 37
“Power Requirements” on page 38
“Setting the Line-Voltage Selector Switch” on page 38
“Electrostatic Discharge Information” on page 43
“Returning Equipment for Service” on page 46
32 Chapter2
Page 30

Spectrum Analyzer Compatibility
Spectrum Analyzer Compatibility
The 11974 Series mixers are compatible with the spectrum analyzers listed in the
following table.
Table 2-1 11974 Compatibility with Spectrum Analyzers
71000 MODULAR SPECTRUM ANALYZER WITH
70907 EXTERNAL MIXER INTERFACE MODULE
Model S/N Prefix Compatibility
Installation
70907A all
70907B all
70907-K74 Upgrade Kit required
Fully compatible
(3)
(1) (2)
8560 SERIES PORTABLE SPECTRUM ANALYZER
Model S/N Prefix Compatibility
8560A <3003A
8560A-K74 Upgrade Kit required
(4)
(cannot be used with option 002)
8560A ≥3003A Fully compatible with non-option 002
8560E all Fully compatible with non-option 002
8561A all
8561B <3003A
8561A-K74 Upgrade Kit required
8561B-K74 Upgrade Kit required
(1) (5)
(4)
8561B ≥3003A Fully compatible
8561E all Fully compatible
8562A/B all
8562A-K74 Upgrade Kit required
(1) (5)
8562E all Fully compatible
8563A/E all Fully compatible
8564E all Fully compatible
8565E all Fully compatible
Chapter 2 33
Page 31

Installation
Spectrum Analyzer Compatibility
Table 2-1 11974 Compatibility with Spectrum Analyzers (Continued)
R&D BENCH HIGH PERFORMANCE SPECTRUM ANALYZER
WITH 11975A LO AMPLIFIER
Model S/N Prefix Compatibility
8566A
8566A
<2007A
≥2007A
(6)
(6)
No upgrade kit available
8566AB Conversion Kit previously installed:
1) Firmware Date <89.10.10
8566B-K74 Upgrade Kit required
(7)
2) Firmware Date ≥89.10.10
8566B-K75 Upgrade Kit required
(8)
8566AB Conversion Kit Not previously
installed: (two kits required)
8566AB Conversion Kit
(8)
(7)
8566B
8566B
<2948A
≥2948A
(6)
(6)
8566B-K75 Upgrade Kit
8566B-K74 Upgrade Kit required
Fully compatible
(1) Retrofit kit contains materials and instructions for hardware modifications and an
operating procedure update for the 11974.
(2) Mixer bias capability is converted to preselector peak, resulting in activation of a
preselector peaking with the BIAS PEAK function. Sweep times must be manually
controlled in wide spans to avoid over sweeping the preselector.
(3) 70900 Local Oscillator firmware/hardware requirements:
Firmware Date Code
LO Upgrade Kit Required
(YYMMDD)
850730 70907B-Option 098
860203 (Firmware and CPU board)
861015 70907B-Option 099
870501 (Firmware on RAM/ROM card)
880314
880901
890606 Fully compatible, no kit required
34 Chapter2
Page 32

Installation
Spectrum Analyzer Compatibility
(4) Retrofit kit contains firmware update and new operation manual.
(5) Operation with 11974s will require entry of a frequency offset. Preselector peaking
is performed manually with a screwdriver adjustment. Sweep times must be
manually controlled in wide spans to avoid over sweeping the preselector.
(6) The serial number prefix on the 8566A/B refers to the RF section.
(7) Retrofit kit contains materials and instructions for hardware modifications and
new firmware.
(8) Retrofit kit contains materials and instructions for hardware modifications.
Chapter 2 35
Page 33

Installation
Initial Inspection
Initial Inspection
Inspect the shipping container upon receipt. Retain it and the cushioning materials. If the
container or cushioning material is damaged, verify that the contents are complete and
that the unit functions correctly both mechanically and electrically.
If the contents are incomplete or the 11974 fails the performance tests in Chapter 4,
“Performance Tests,” on page 89, notify one of the Agilent Technologies Sales and Service
Offices listed on page 49. Show any container or cushioning materials damages to the
carrier. The Agilent Technologies Sales and Service Office will arrange for repair or
replacement without waiting for a claim settlement.
The shipping container and cushioning materials are shown in Figure 2-3 on page 47 and
Figure 2-4 on page 48. Instructions for repackaging the 11974 are included under
“Returning Equipment for Service” on page 46.
WARNING To prevent electrical shock, disconnect the 11674 Series equipment
from mains before cleaning. Use a dry cloth or one slightly
dampened with water to clean the external case parts. Do not
attempt to clean internally.
36 Chapter2
Page 34

Installation
Preparing the 11974 for Use
Preparing the 11974 for Use
When installing equipment, ensure that the 11974-60028 Power Supply ac power switch
and the power cord are easily accessible to allow for disconnecting the equipment from the
mains power supply. The power switch will remove power from the 11974, but the power
must be disconnected to remove the 11974-60028 from the mains power supply.
Position the equipment to protect it from moisture because the instrument case does not
protect against the ingress of water. (The case will protect against finger access to
hazardous parts within the enclosure.)
WARNING The front panel LINE switch disconnects the mains circuits from the
mains supply after the EMC filters and before other parts of the
instrument.
CAUTION Ventilation Requirements: When installing the product in a cabinet, the
air flow into and out of the product must not be restricted. The ambient
temperature (outside the cabinet) must be less than the maximum operating
temperature of the product by 4 °C for every 100 watts dissipated in the
cabinet. If the total power dissipated in the cabinet is greater than 800 watts,
then forced convection must be used.
The 11974 must be properly connected to one of the compatible spectrum analyzers listed
in Table 2-1 on page 33. Use the next four sections of this chapter to:
• Select the appropriate power source.
• Set the line-voltage selector switch correctly.
• Check the fuse.
• Select the appropriate power cable.
After preparing the 11974 for use, refer to Chapter 3, for complete operation procedures for
the most commonly-used compatible spectrum analyzers. These procedures include
configuration setups listing all connections and giving step-by-step procedures describing
how to operate an 11974.
CAUTION Before this instrument is switched on, make sure that:
•the line voltage selector is set to the voltage of the mains supply;
•the correct fuse is installed;
•the supply voltage is in the specified range.
Chapter 2 37
Page 35

Installation
Preparing the 11974 for Use
Power Requirements
The power requirements for the 11974 are listed below.
Table 2-2 Operating Power Requirements
Line Input Power Requirements
100/120 V ac Operation 220/240 V ac Operation
Line Voltage 100 V to 120 V, ±10% 220 V to 240 V, ±10%
Line Current 1 A rms max. 0.5 A rms max.
Line Frequency 47 Hz to 66 Hz 47 Hz to 66 Hz
WARNING This is a Safety Class I product (provided with a protective earthing
ground incorporated in the power cord). The mains plug shall only
be inserted in a socket outlet provided with a protective earth
contact. Any interruption of the protective conductor, inside or
outside the instrument, is likely to make the instrument dangerous.
Intentional interruption is prohibited.
Setting the Line-Voltage Selector Switch
The 11974-60028 Preselector Power Supply contains the voltage-selector switch for the
11974. Set the power supply's rear-panel voltage-selector switch to the line-voltage range
(100, 120, 220, or 240 V) corresponding to the available ac voltage. Refer to Figure 2-1 on
page 39.
38 Chapter2
Page 36
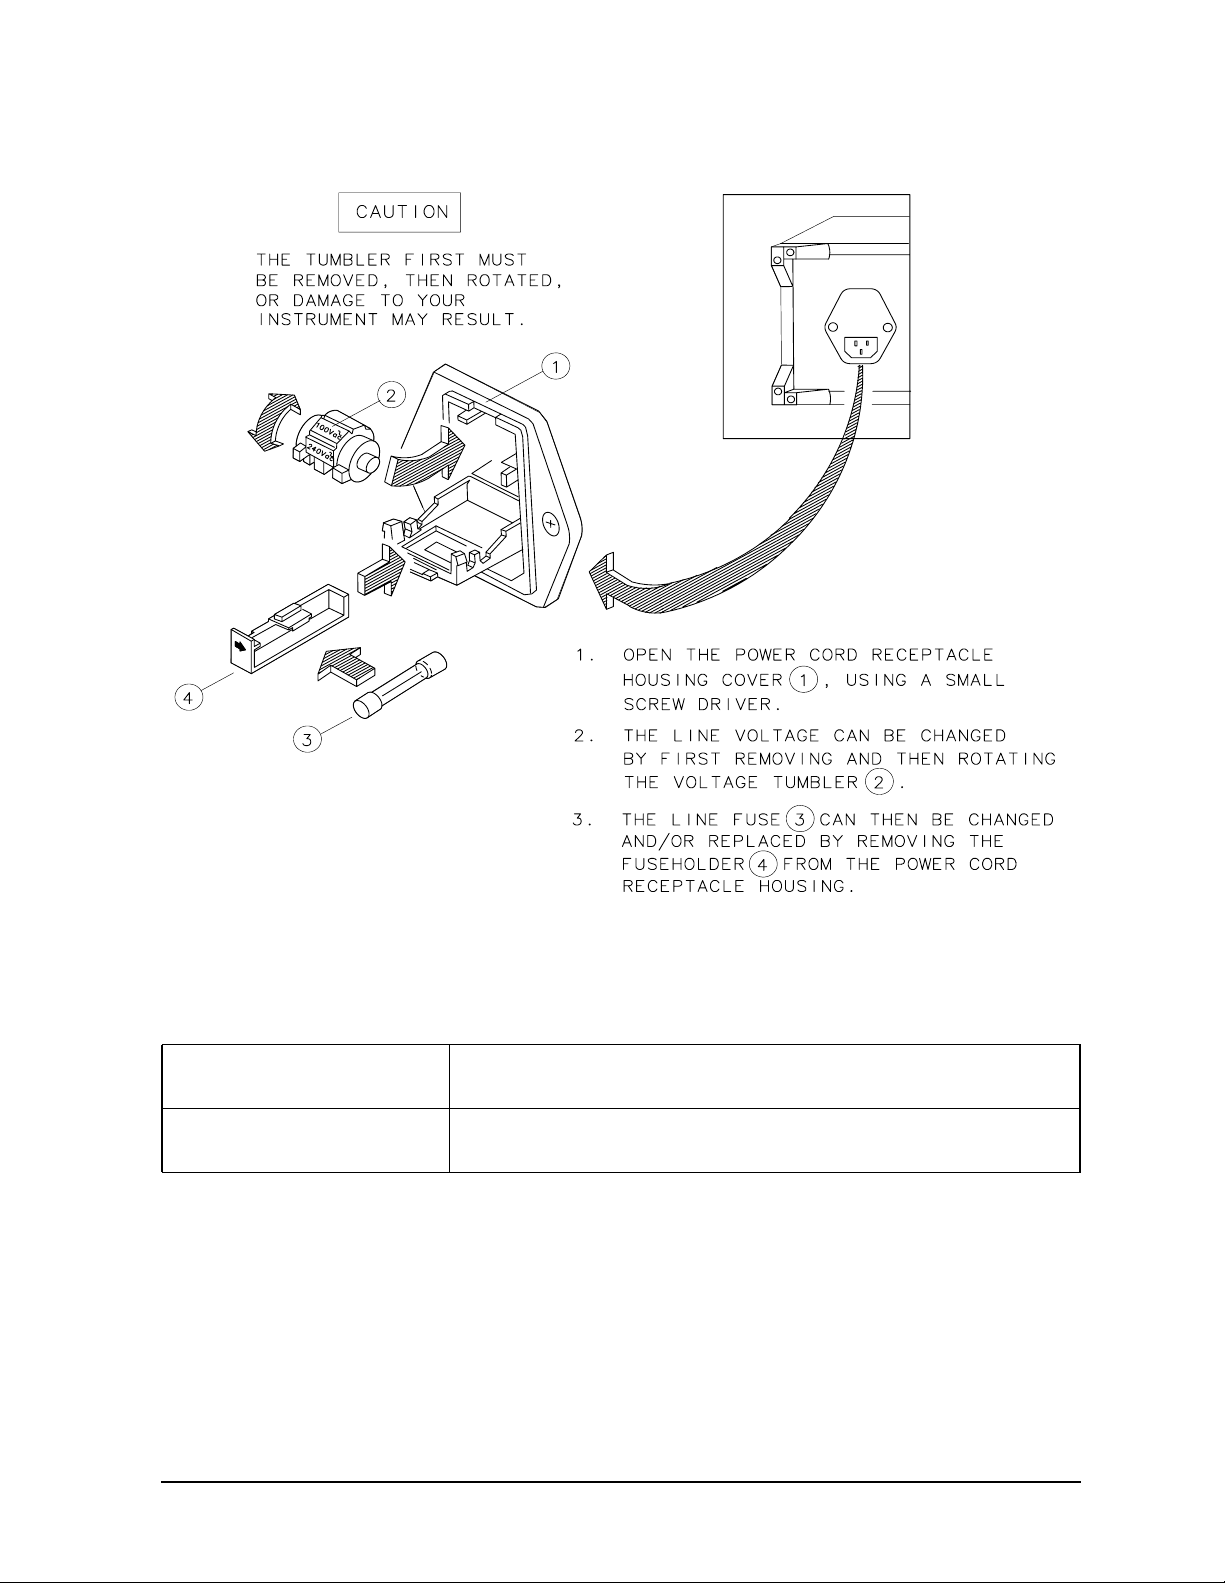
Figure 2-1 Voltage Selection Switch and Line Fuse Locations
Installation
Preparing the 11974 for Use
Checking the Fuse
The type of ac-line input fuse depends on the input-line voltage. Use the following fuses:
100 V to 120 V Operation: 1 A 250 V UL/CSA (TIME DELAY) (part number 2110-0674) (for
use in the United States)
220 V to 240 V Operation: 0.5 A 250 V IEC (TIME DELAY) (part number 2110-0458)
(for use in other countries)
The line fuse is housed in a small container located inside the rear-panel power-connector
module of the 11974-60028 Preselector Power Supply. When replacing a fuse, be sure that
the arrows on the container match the direction of the arrows on the power-connector door.
Refer to Figure 2-1 on page 39.
Chapter 2 39
Page 37

Installation
Preparing the 11974 for Use
Power Cable
The 11974-60028 Preselector Power Supply is equipped with a three-wire power cable, in
accordance with international safety standards. When connected to an appropriate
power-source outlet, this cable grounds the instrument cabinet.
WARNING Failure to ground the instrument properly can result in personal
injury. Before turning on the preselector power supply, you must
connect its protective earth terminals to the protective conductor of
the main power cable. Insert the main power-cable plug only into a
socket outlet that has a protective earth contact. Do not defeat the
earth-grounding protection by using an extension cable, power
cable, or auto transformer. Make sure its common terminal is
connected to the protective earth contact of the power source socket.
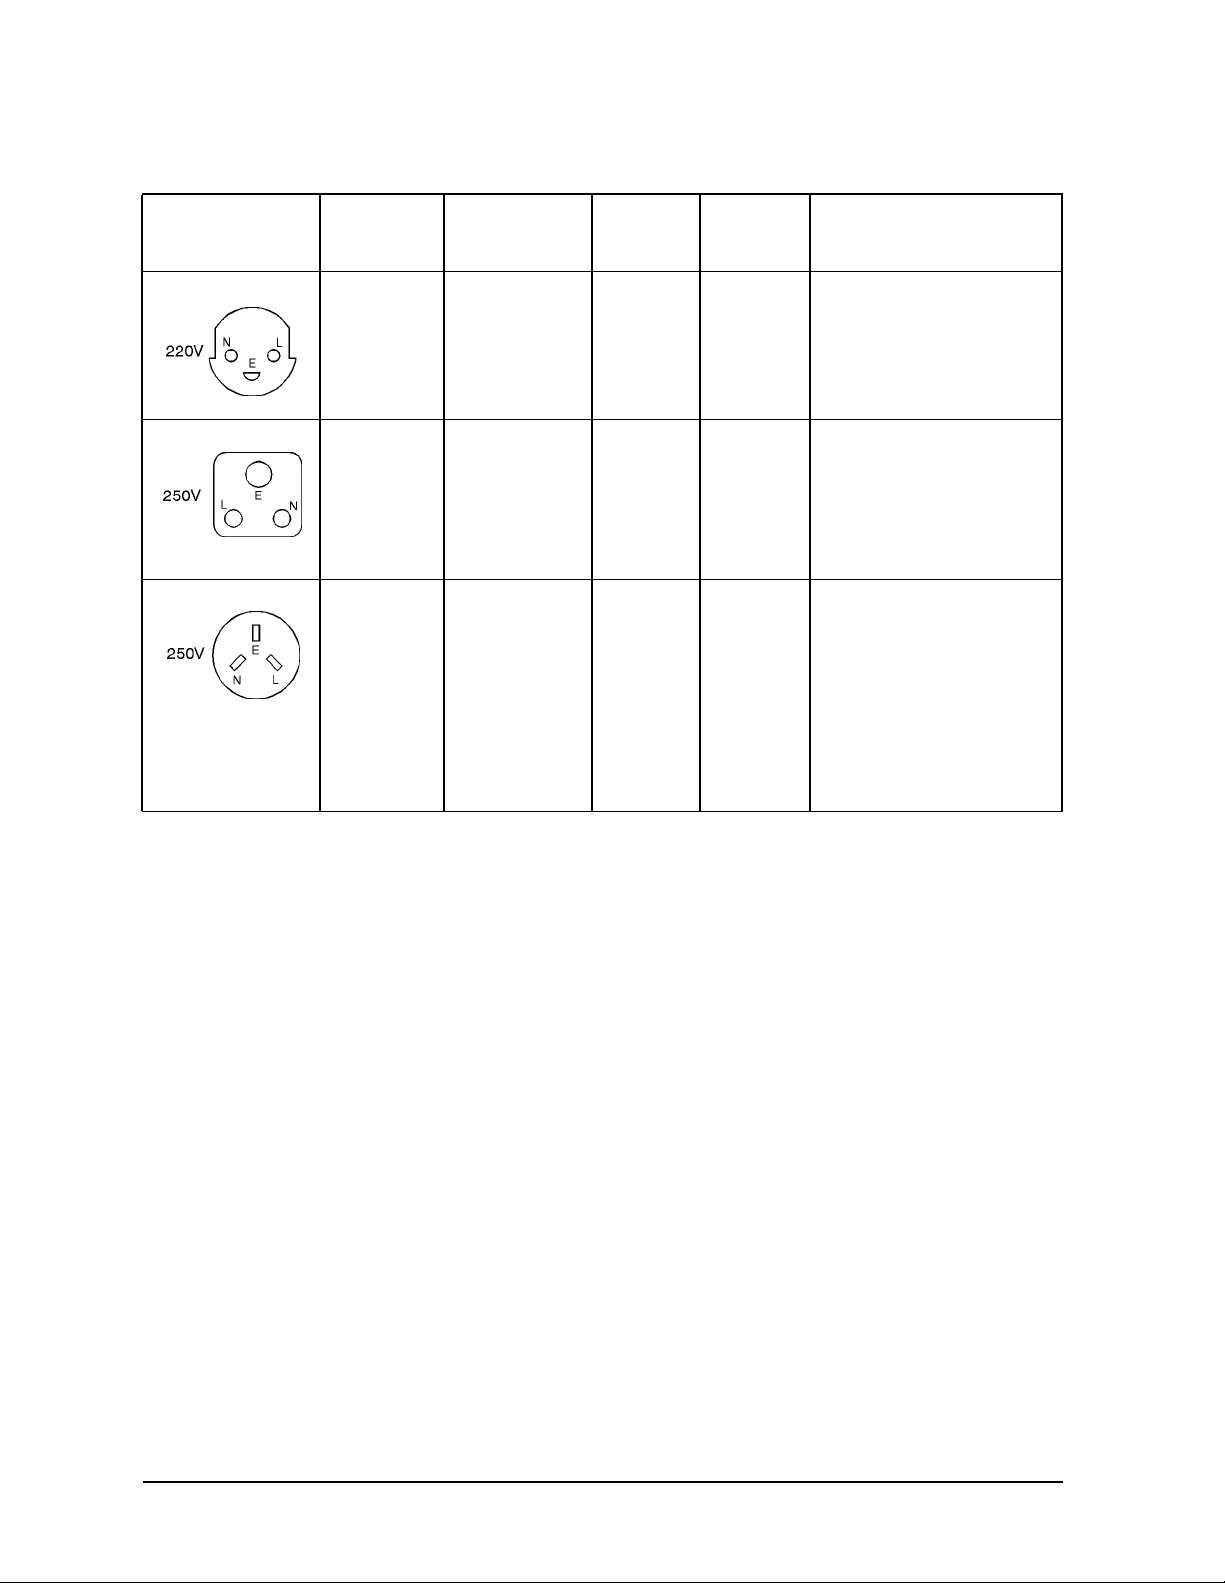
Various power cables are available to connect the spectrum analyzer to the types of ac
power outlets unique to specific geographic areas. The cable appropriate for the area to
which the spectrum analyzer is originally shipped is included with the unit. You can order
additional ac power cables for use in different areas. The following table lists the available
ac power cables, illustrates the plug configurations, and identifies the geographic area in
which each cable is appropriate.
40 Chapter2
Page 38
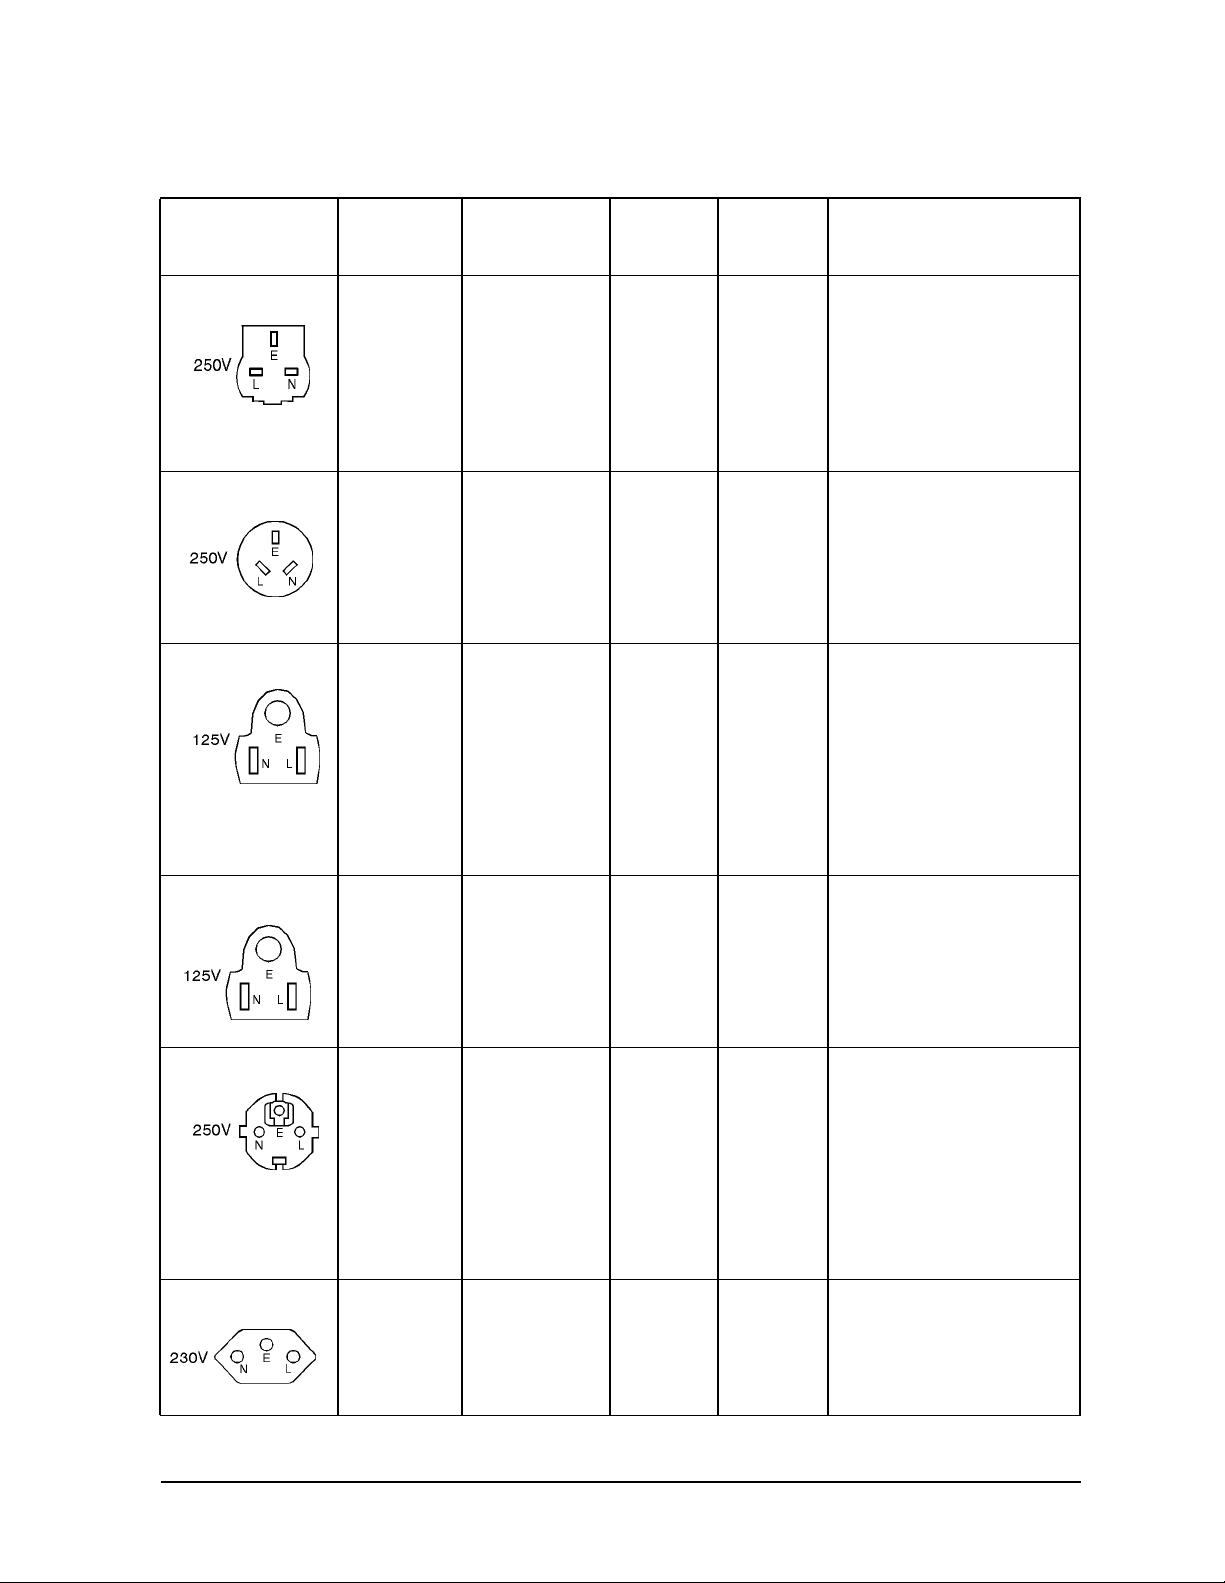
Table 2-3. Power Cables
Installation
Preparing the 11974 for Use
Plug Type
a
Cable Part
Number
8120-8705
8120-8709
8120-1369
8120-0696
8120-1378
b
Plug
Description
Straight
BS 1363A
90˚
Straight
AS 3112
90˚
Straight
NEMA 5-15P
Length
cm (in.)
229 (90)
229 (90)
210 (79)
200 (78)
203 (80)
Cable
Color
Mint
Gray
Mint
Gray
Gray
Gray
Jade
Gray
For Use in Country
Option 900
United Kingdom, Hong
Kong, Cyprus, Nigeria,
Singapore, Zimbabwe
Option 901
Argentina, Australia,
New Zealand, Mainland
China
Option 903
United States, Canada,
Brazil, Colombia,
Mexico, Philippines,
Saudi Arabia, Taiwan
8120-1521
8120-4753
8120-4754
8120-1689
8120-1692
8120-2104
8120-2296
90˚
Straight
NEMA 5-15P
90˚
Straight
CEE 7/VII
90˚
Straight
SEV Type 12
90˚
203 (80)
229 (90)
229 (90)
200 (78)
200 (78)
200 (78)
200 (78)
Jade
Gray
Gray
Gray
Mint
Gray
Mint
Gray
Gray
Gray
Option 918
Japan
Option 902
Continental Europe,
Central African
Republic, United Arab
Republic
Option 906
Switzerland
Chapter 2 41
Page 39
Installation
Preparing the 11974 for Use
Table 2-3. Power Cables (Continued)
Plug Type
a
Cable Part
Number
8120-2956
Description
Straight
SR 107-2-D
8120-2957
8120-4211
90˚
Straight
IEC 83-B1
8120-4600
90˚
Plug
b
Length
cm (in.)
200 (78)
Cable
Color
Gray
For Use in Country
Option 912
Denmark
200 (78)
200 (78)
200 (78)
Gray
Mint
Gray
Mint
Option 917
South Africa, India
Gray
8120-5182
8120-5181
Straight
SI 32
90˚
200 (78)
200 (78)
Jade
Gray
Option 919
Israel
Jade
Gray
a. E = earth ground, L = line, and N = neutral.
b. Plug identifier numbers describe the plug only. The part number is for the complete cable
assembly.
42 Chapter2
Page 40
Installation
Electrostatic Discharge Information
Electrostatic Discharge Information
Electrostatic discharge (ESD) can damage or destroy electronic components. Therefore, all
work performed on assemblies consisting of electronic components should be done at a
static-safe workstation.
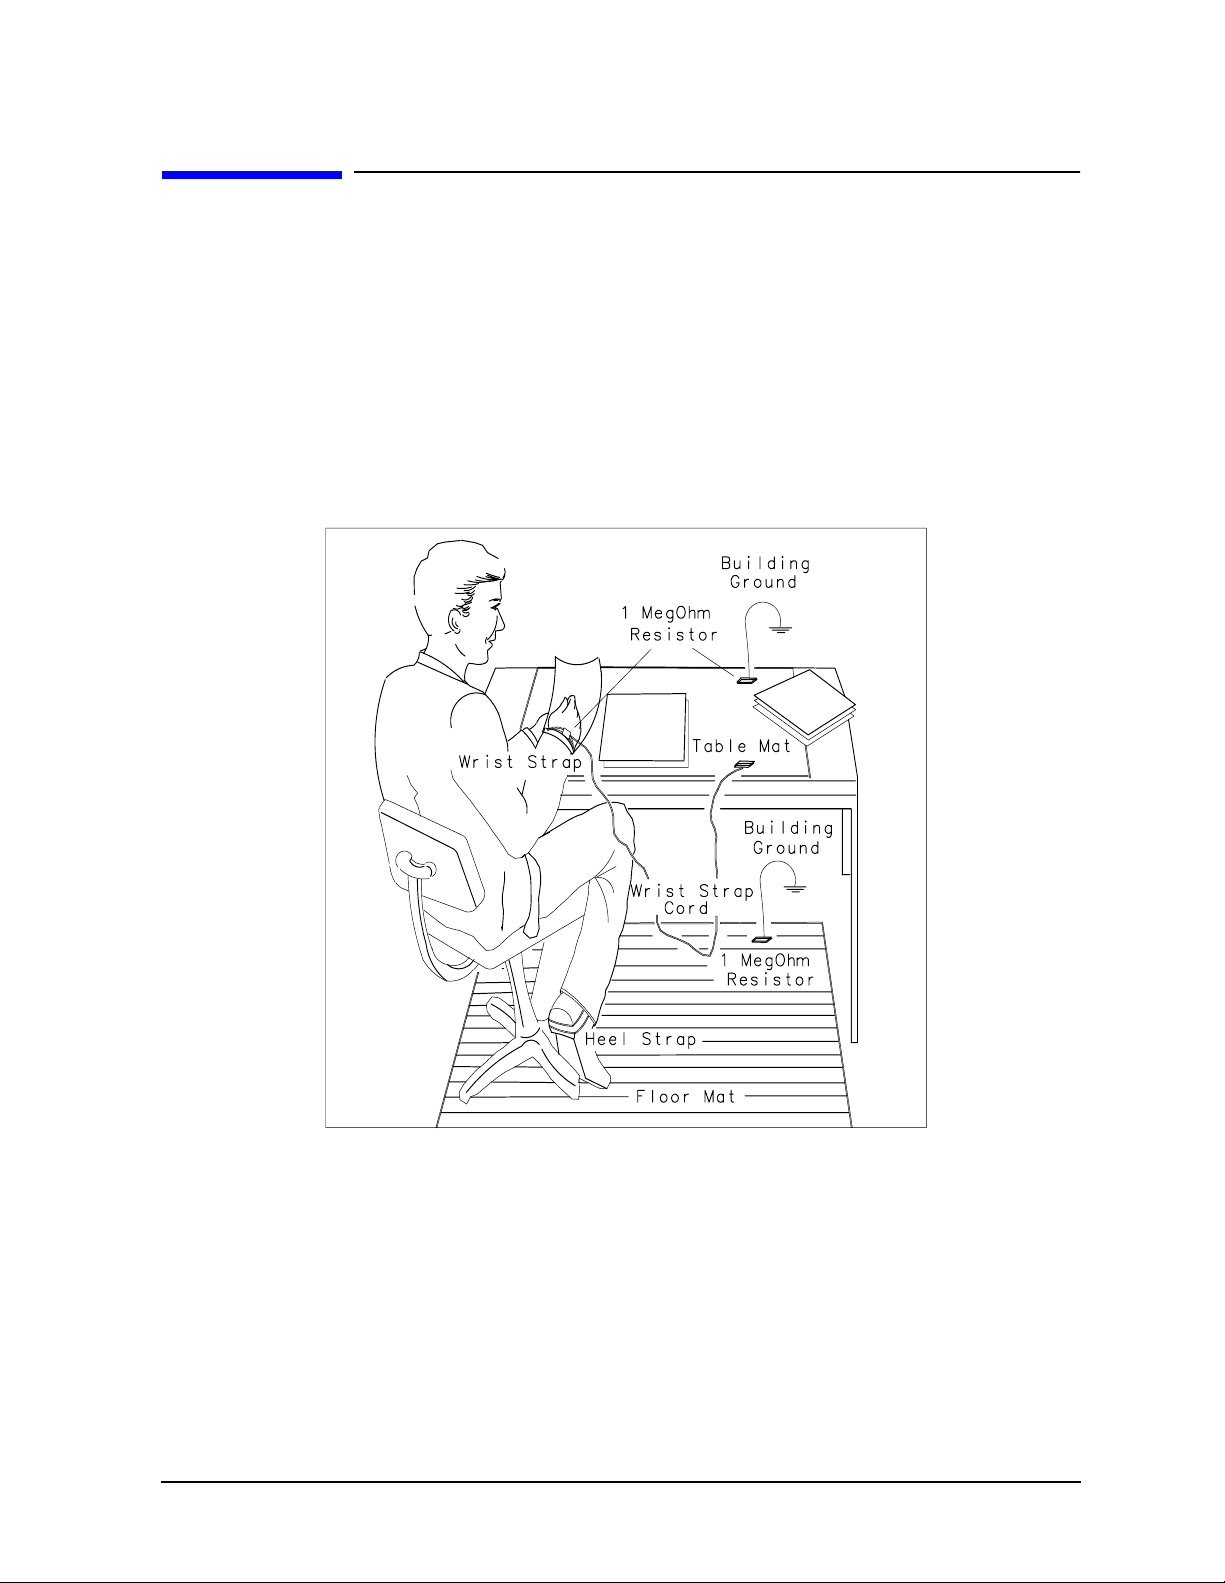
Figure 2-2 shows an example of a static-safe workstation. Two types of ESD protection are
shown: (a) conductive table mat and wrist strap combination, and (b) conductive floor mat
and heel strap combination. The two types must be used together to ensure adequate ESD
protection. Refer to Table 2-4 on page 45 for a list of static-safe accessories and their part
numbers.
Figure 2-2 Static-Safe Workstation
Chapter 2 43
Page 41

Installation
Electrostatic Discharge Information
Reducing ESD Damage
The following are suggestions that may help reduce the amount of ESD damage that can
occur during testing and servicing instruments.
PC Board Assemblies and Electronic Components
• Handle these items at a static-safe workstation.
• Store or transport these items in static-shielding containers.
CAUTION Do not use erasers to clean the edge-connector contacts. Erasers generate
static electricity and degrade the electrical quality of the contacts by
removing the thin gold plating.
Do not use paper of any kind to clean the edge-connector contacts. Paper or
lint particles left on the contact surface can cause intermittent electrical
connections.
Do not touch the edge-connector contacts or trace surfaces with bare hands.
Always handle board assemblies by the edges.
PC board assembly edge-connector contacts may be cleaned by using a lint-free cloth with
a solution of 80 percent electronics-grade isopropyl alcohol and 20 percent deionized water.
This procedure should be performed at a static-safe workstation.
WARNING Isopropyl alcohol is extremely flammable, causes irritation, may
cause eye damage, and is harmful if swallowed or inhaled. It may be
harmful if absorbed through the skin. Keep away from heat, sparks,
and flame. Avoid contact with eyes, skin, clothing. Avoid breathing
vapor. Keep in tightly closed container. Use with adequate
ventilation. Wash thoroughly after handling. In case of fire, use
alcohol foam, dry chemical, or carbon dioxide: water may be
ineffective. In case of spill, soak up with sand or earth. Flush spill
area with water.
Disposal Instructions: Dispose in accordance with all applicable
federal, state, and local environmental regulations.
Test Equipment
• Before connecting any coaxial cable to an instrument connector for the first time each
day, momentarily short together the center and outer conductors of the cable.
• Before touching the center pin of any connector and before removing any assembly from
the instrument, ensure proper use of a grounded, resistor-isolated, wrist strap.
• To prevent buildup of static charge, ensure that all instruments are properly
earth-grounded.
44 Chapter2
Page 42

Installation
Electrostatic Discharge Information
Static-Safe Accessories
Table 2-4 Static-Safe Accessories
Part Number Description
9300-0797 Set includes: 3M static control mat 0.6 m × 1.2 m (2 ft × 4 ft) and 4.6 cm (15 ft)
ground wire. (The wrist-strap and wrist-strap cord are not included. They must
be ordered separately.)
9300-0980 Wrist-strap cord 1.5 m (5 ft)
9300-1383 Wrist-strap, color black, stainless steel, without cord, has four adjustable links
and a 7 mm post-type connection.
9300-1169 ESD heel-strap (reusable 6 to 12 months).
Chapter 2 45
Page 43

Installation
Returning Equipment for Service
Returning Equipment for Service
Repackaging equipment requires original shipping containers and materials or their
equivalents. Agilent Technologies offices can provide packaging materials identical to the
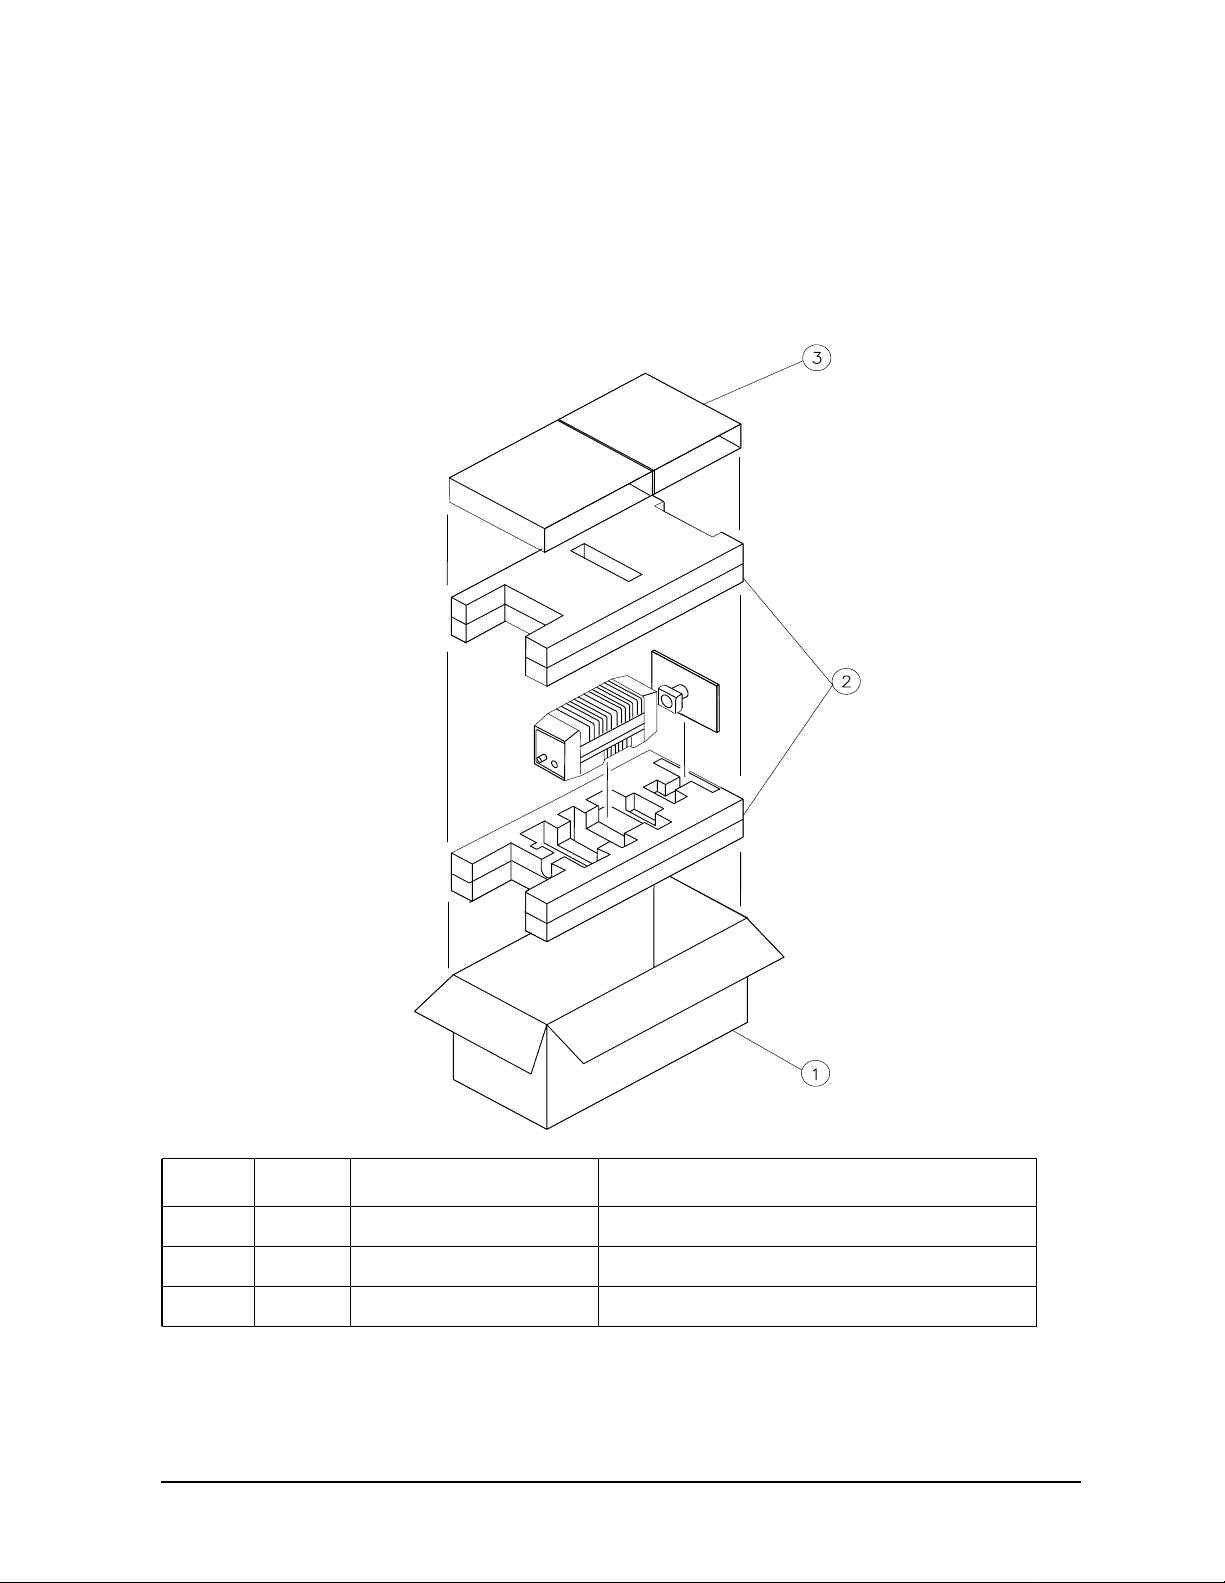
original. Figure 2-3 on page 47 and Figure 2-4 on page 48 identify the original packaging
materials and their part numbers. When ordering packaging materials, it is necessary to
order the proper number of foam inserts.
CAUTION Packaging materials not specified can result in instrument damage. Never
use styrene pellets to package electronic equipment. The pellets do not
adequately cushion the equipment, do not prevent all equipment movement,
and can generate static electricity.
Use the following procedure to prepare equipment for shipment:
1. Fill out a blue repair card (located at the end of this chapter) and attach it to the
equipment. Send a copy of any noted error messages or other helpful performance data.
If a blue repair card is not available, include at least the following information:
a. Type of service required
b. Description of the problem and whether it is constant or intermittent
c. Name and telephone number of technical contact person
d. Return address
e. Model number of returned equipment
f. Full serial number of returned equipment
g. List of any accessories returned with equipment
2. To help prevent damage during transit, pack the equipment in the appropriate
packaging materials as shown in Figure 2-3 on page 47 and Figure 2-4 on page 48.
Original shipping materials or equivalents are best; however, compliance with the
following instructions will result in acceptable packaging.
a. Wrap equipment in anti-static plastic to reduce the possibility of ESD damage.
b. For equipment that weighs less than 54 kg (120 lb), use a double-walled, corrugated
cardboard carton of 159 kg (350 lb) test strength. The carton must be both large
enough and strong enough to accommodate the equipment. Allow at least three to
four inches on all sides of the equipment for packing material.
c. Surround the equipment with 3 to 4 inches of packing material to protect the
equipment and to prevent movement in the carton. If packing foam is not available,
the best alternative is S.D.-240 Air Cap™ from Sealed Air Corporation, Commerce,
California 90001. Air Cap is plastic sheeting filled with 1-1/4 inch air bubbles. Use
pink anti-static Air Cap. Wrapping the equipment several times in this material
should provide sufficient protection and also prevent movement in the carton.
46 Chapter2
Page 44
Installation
Returning Equipment for Service
3. Seal the shipping container securely with strong nylon adhesive tape.
4. Mark the shipping container “FRAGILE, HANDLE WITH CARE” to ensure careful
handling.
5. Retain copies of all shipping papers.
Figure 2-3 Packaging Materials for 11974 Series
Item Qty Part Number Description
1 1 9211-5594 Corrugated Outer Carton
2 1 5180-7865 Foam Pads (set)
3 1 5180-7885 Corrugated Pad
Chapter 2 47
Page 45
Installation
Returning Equipment for Service
Figure 2-4 Packaging Materials for 11974-60028 Power Supply
Item Qty Part Number Description
1 1 9211-4893 Corrugated Outer Carton
2 1 5180-7809 Foam Pads (set)
3 1 9220-4421 Corrugated Sleeve
Sales and Service Offices
Agilent Technologies Sales and Service Offices provide worldwide support for Agilent
Technologies products. To obtain servicing information or to order replacement parts,
contact the nearest office listed on page 49.
In any correspondence, always provide essential information, which includes model
numbers, serial numbers, or assembly part numbers.
.
48 Chapter2
Page 46

Table 2-5. Contacting Agilent
Online assistance: www.agilent.com/find/assist
Installation
Returning Equipment for Service
United States
(tel) 1 800 452 4844
New Zealand
(tel) 0 800 738 378
(fax) (+64) 4 495 8950
Malaysia
(tel) 1 800 828 848
(fax) 1 800 801 664
Taiwan
(tel) 0800-047-866
(fax) (886) 2 25456723
Latin America
(tel) (305) 269 7500
(fax) (305) 269 7599
Japan
(tel) (+81) 426 56 7832
(fax) (+81) 426 56 7840
Philippines
(tel) (632) 8426802
(tel) (
PLDT subscriber only):
1 800 16510170
(fax) (632) 8426809
(fax) (
PLDT subscriber only):
1 800 16510288
People’s Republic of
China
(tel) (preferred):
800-810-0189
(tel) (alternate):
10800-650-0021
(fax) 10800-650-0121
Canada
(tel) 1 877 894 4414
(fax) (905) 282-6495
Australia
(tel) 1 800 629 485
(fax) (+61) 3 9210 5947
Thailand
(tel) outside Bangkok:
(088) 226 008
(tel) within Bangkok:
(662) 661 3999
(fax) (66) 1 661 3714
India
(tel) 1-600-11-2929
(fax) 000-800-650-1101
Europe
(tel) (+31) 20 547 2323
(fax) (+31) 20 547 2390
Singapore
(tel) 1 800 375 8100
(fax) (65) 836 0252
Hong Kong
(tel) 800 930 871
(fax) (852) 2506 9233
Chapter 2 49
Page 47

3 Operation
51
Page 48

Operation
What You'll Learn in this Chapter
What You'll Learn in this Chapter
This chapter introduces you to basic preselected external-mixing functions available using
an 11974 Series Preselected Millimeter Mixer. After a brief discussion of operating
precautions and hints, operation procedures using the most commonly-used “host”
spectrum analyzers are described. This chapter contains the following topics:
• “11974Q Front-Panel Features” on page 53
• “11974Q Rear-Panel Features” on page 54
• “Operating Precautions” on page 56
“Maximum RF Input Level” on page 56
“Maximum LO Input Level” on page 56
“Electrostatic Discharge” on page 56
• “Operating Hints” on page 57
“Preventing Erroneous Preselector Peaking During Spur Searches” on page 57
“Remote Location of an 11974” on page 57
“” on page 58
“Dynamic Range Optimization” on page 59
• Preliminary Operation for Each Spectrum Analyzer
Compatibility Reference lists all compatible spectrum analyzers with the 11974
Series and defines any requirements necessary.
Equipment Connection lists all input and output connections for operation.
Frequency Tracking Calibration mates the 11974 Series to the spectrum
analyzer. This part of the preliminary operation aligns the frequency of the 11974
tracking filter to the tuned frequency of the spectrum analyzer.
NOTE Once the Frequency Tracking Calibration has been performed on a
designated setup (that is, a specific 11974 band matched to a specific
spectrum analyzer), and as long as the equipment remains connected, this
calibration procedure only needs to be performed occasionally to keep the
setup matched properly.
Operation for Each Spectrum Analyzer
Band Selection describes how to select the desired millimeter band for operation.
Amplitude Calibration allows you to enter in conversion-loss values for your
specific operating frequency. Each 11974 band is individually characterized and
labeled at the factory with a calibration chart of its conversion loss versus frequency.
Preselector Peaking quickly maximizes the amplitude accuracy of a signal of
interest.
52 Chapter3
Page 49
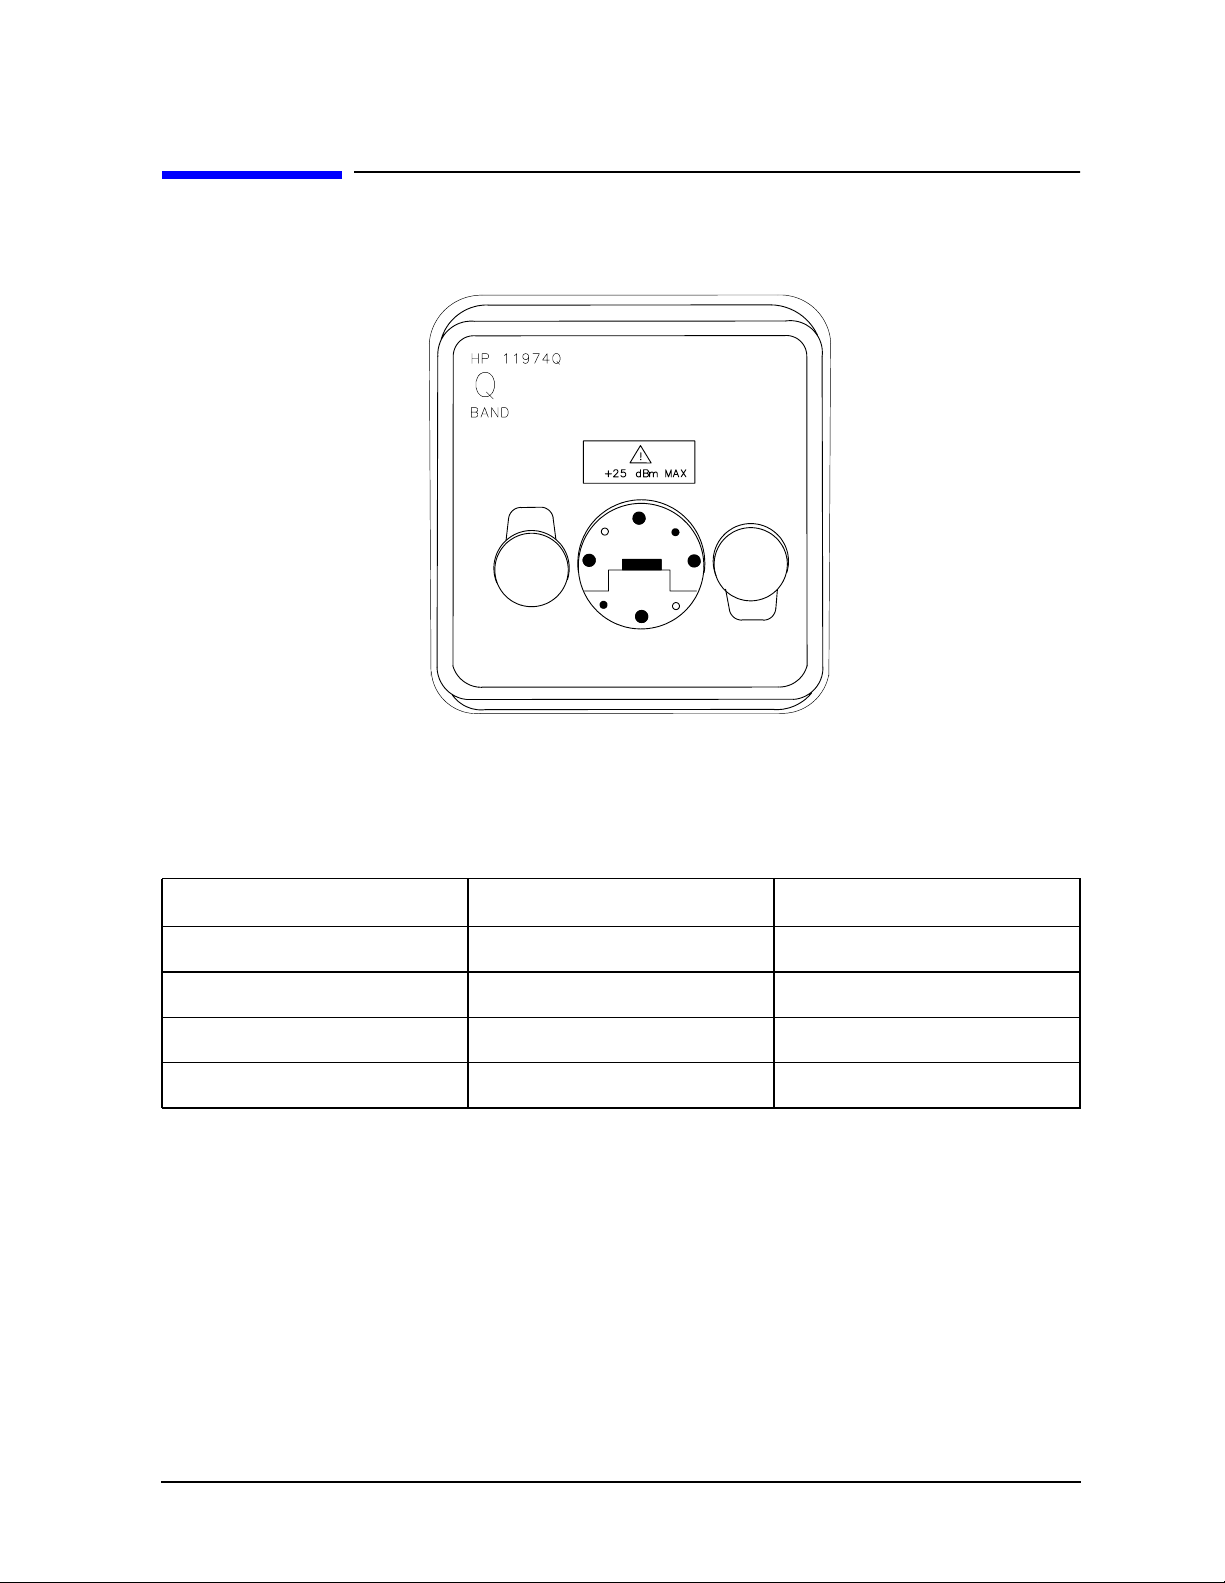
11974Q Front-Panel Features
Figure 3-1 11974Q Front Panel
Operation
11974Q Front-Panel Features
The front panel of an 11974 Series mixer consists of an RF input port flange and two flange
clamps. The following table lists the RF input port flange types.
Table 3-1 RF Input Port Flange Types
Model Size Flange Type
11974A
11974Q
11974U
11974V
a. Refer to Table 1-2 for the ratings of these input and output connectors.
a
a
a
a
WR-28 UG599/U
WR-22 UG383U
WR-19 UG383/U-M
WR-15 UG385U
Chapter 3 53
Page 50
Operation
11974Q Rear-Panel Features
11974Q Rear-Panel Features
Figure 3-2 11974Q Rear Panel
POWER SUPPLY
INSTRUMENT
SELECT
receives power from the 11974-60028 Preselector Power Supply.
switches allow the 11974 to properly scale the tune ramp of the specified
spectrum analyzer.
a
IF OUT requires an SMA type cable and supplies the IF INPUT for the spectrum
analyzer.
a
TUNE IN requires a BNC type cable and receives the TUNE + SPAN sweep output
from the spectrum analyzer.
a
LO IN requires an SMA type cable and receives the first LO output from the
spectrum analyzer.
a
33 GHz SET is the low-end of the band adjustment for mating the 11974 to the
spectrum analyzer. This adjustment frequency directly corresponds to the
low-end frequency of each band.
50 GHz SET is the high-end of the band adjustment for mating the 11974 to the
spectrum analyzer. This adjustment frequency directly corresponds to the
high-end frequency of each band.
LED SET
are the LEDs used to adjust the low-end and high-end of each band so that
the 11974 is mated properly to the spectrum analyzer.
a. Refer to Table 1-2 for the ratings of these input and output connectors.
54 Chapter3
Page 51
11974-60028 Front-Panel Features
11974-60028 Front-Panel Features
Figure 3-3 11974-60028 Front Panel
HP 11974-60028
PRESELECTOR POWER SUPPLY
OUTPUT
PRESELECTOR POWER
LINE
yg35_1
OUTPUT PRESELECTOR POWER provides power for the 11974 Preselector RF Mixer.
Operation
LINE
switch applies power to the OUTPUT
PRESELECTOR POWER jack.
Chapter 3 55
Page 52

Operation
Operating Precautions
Operating Precautions
CAUTION Toavoid damaging your 11974 and to assure accurate measurements, be sure
to follow the recommendations in this section.
Maximum RF Input Level
The maximum RF input level, as stated in Table 1-2 on page 23, is +25 dBm CW, Peak, or
Average. However, since the 1 dB compression point at the RF input is between 0 and
+6 dBm depending on the band, meaningful measurements will end long before the
damage level is reached. Therefore, for amplitude accuracy and protection against damage,
limit the input power to the 1 dB compression point level.
Maximum LO Input Level
The maximum LO input level is +18 dBm. Care should be taken when using the 11975A
MicrowaveAmplifier as an LO booster for the 8566B Spectrum Analyzer or when using the
11975A for remote-location connections with the 11974 Series.
CAUTION When using an 11975A Amplifier with an 11974, the rear-panel ALC switch
must be set to the ON position and the OUTPUT POWER LEVEL set to the
stop at +16 dBm before connecting the amplifier. If the ALC switch is left in
the OFF position, the amplifier output power is high enough to destroy the
mixer diodes.
Electrostatic Discharge
CAUTION When configuring the 11974 with a spectrum analyzer, always connect the
SMA cables to the spectrum analyzer BEFORE connecting them to the 11974.
This will minimize the danger of electrostatic discharge damaging the 11974.
56 Chapter3
Page 53

Operation
Operating Hints
Operating Hints
The following operating hints are provided for your convenience.
Preventing Erroneous Preselector Peaking During Spur Searches
When performing spurious response tests on a device under test (DUT), the spectrum to be
measured typically contains both large and small signals. If the spurs are smaller than −60
to −65 dBc, they may be confused with the image or multiple response of the large signal.
In this type of test, activate the preselector-peak routine only on the larger signals. This
will avoid attempting to peak on small unwanted 11974 responses of the large signals
which can result in amplitude errors. Another way to avoid this potential problem is to
calculate the frequency of the image or multiple response and avoid measurements at
these precise frequencies.
The frequency of the image response can be found in Table 1-1 on page 19, and the
frequencies of the multiple responses can be found in Table 1-2 on page 23.
Listed below are the symptoms of errors caused by peaking on image or multiple
responses:
• Large amplitude errors for the large signals after peaking on a suspected small DUT
spur which is actually an unwanted 11974 response,
• Preselector peak DAC numbers consistently at or near one extreme of range (due to
peaking on an image response of a large signal),
DAC Number After Peaking Spectrum Analyzer
0 71000C with 70907B
255 8560 Series Portable
63 with message “Peak Not Found” displayed 8566B
• Random DAC numbers over a wide range when peaking is repeated (due to peaking on
a multiple response of a large signal).
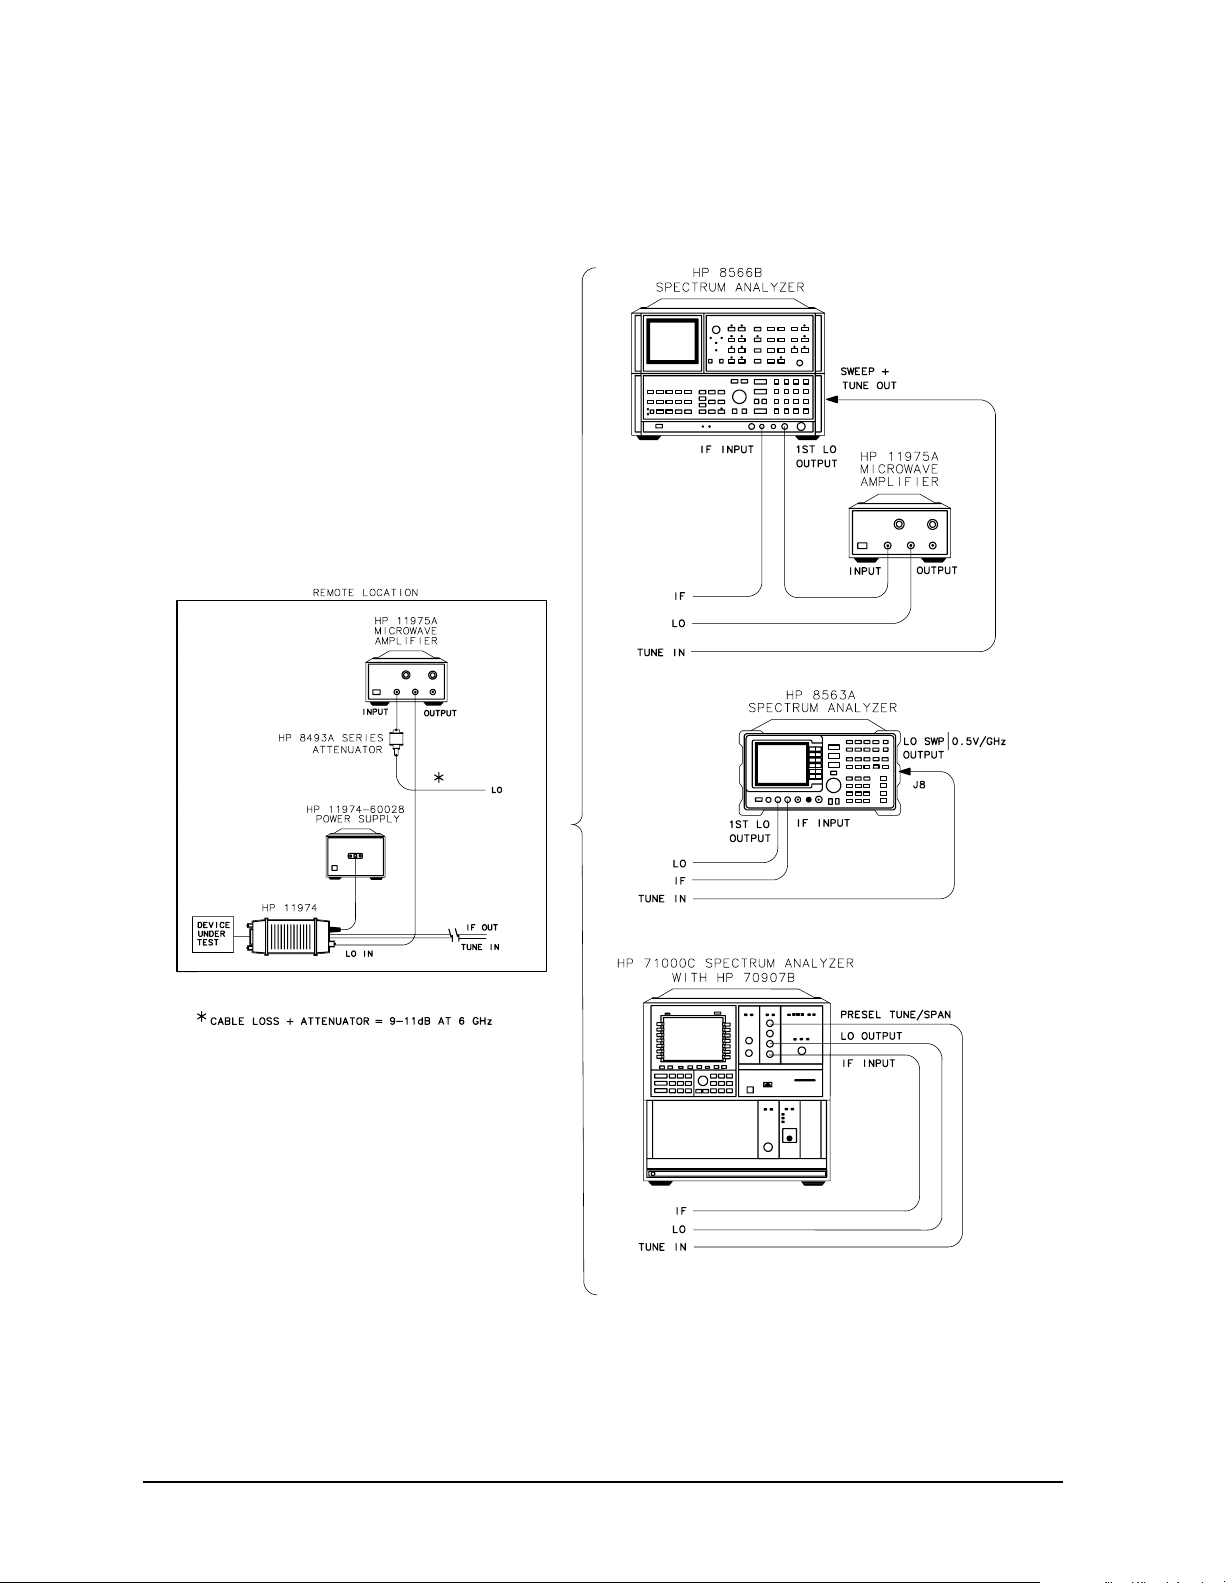
Remote Location of an 11974
In cases where the device-under-test (DUT) is farther away than the 1 meter LO and IF
cables can accommodate, place the 11974 close to the DUT, but place the host spectrum
analyzer the desired distance away. In order to preserve the excellent amplitude accuracy
of the 11974, the +14.5 to 16 dBm LO power must be supplied even though the LO cables
may become quite long.
Tosupply the LO power, insert an 11975A Amplifier at the 11974 location. (Refer to Figure
3-4 on page 58.) To provide the proper input power level for the 11975A Amplifier, a coax
attenuator is also required at the input of the 11975A such that the sum of the loss of the
extended LO cable and the attenuator value add up to a range of 9–11 dB at 6 GHz. Set
the OUTPUT POWER LEVEL on the 11975A for +16 dBm. The extra IF cable loss at
Chapter 3 57
Page 54
Operation
Operating Hints
321 MHz should be added to the conversion loss value of the 11974. Perform the Frequency
Tracking Calibration procedure after connection of all cables.
Figure 3-4 Setup Configuration for Remote Location of an 11974
58 Chapter3
Page 55

Operation
Operating Hints
RF Port Voltage Standing Wave Ratio (VSWR) Effects
As with most bandpass filters, the magnetically tunable Barrium-Ferritebandpass filter of
the 11974 is reflective out of its passband. In addition, the 11974 does not have a
programmable RF port attenuator to improve the VSWR in band or out of band. This may
cause measurement errors when testing VSWR sensitive DUTs outside of their operating
frequency range. One measurement example in which VSWR effects should be minimized
is when searching for spurious signals in an oscillator. To improve the accuracy of the
measurement, use an 365 Series waveguide isolator (included in Option 001) or an
attenuator at the RF port of the 11974 to reduce this particular VSWR effect.
Dynamic Range Optimization
An attenuator at the RF port of the 11974 can be used to set the RF input power level for
maximum dynamic range, approximately −30 dBm, as shown in Figure 1-3 on page 27,
Figure 1-4 on page 28, Figure 1-5 on page 29, and Figure 1-6 on page 30.
Chapter 3 59
Page 56

Operation
Operation Using an 8566B Spectrum Analyzer
Operation Using an 8566B Spectrum Analyzer
Preliminary Operation
Compatibility Reference
Refer to Chapter 2, “Installation,” on page 31 for information relating to retrofit
requirements for 8566A and older 8566B Spectrum Analyzers.
Equipment Connection
Connect the equipment as shown in Figure 3-5 on page 61 and use the following checklist
to verify the connections.
• 11974 LO IN to 11975A OUTPUT (SMA cable, 5061-5458)
• 11974 IF OUT to 8566B IF INPUT (SMA cable, 5061-5458)
• 11974 TUNE IN to 8566B SWEEP + TUNE OUT (BNC cable, 8120-1839; BNC f–f
adapter, 1250-0080; BNC cable, 8120-2582)
• 11974 POWER SUPPLY to 11974-60028 PRESELECTOR POWER
• 8566B 1ST LO OUTPUT to 11975A INPUT (SMA cable, 5061-5458)
CAUTION When you are using an 11975A Amplifier with an 11974, you must set the
amplifier rear-panel ALC switch to ON before you connect the amplifier into
the test setup. If the ALC switch is left in the OFF position, the amplifier
output power is high enough to destroy the mixer diodes.
Set the 11975A output power to +16 dBm and verify that the amplifier's front-panel
unleveled indicator is not lit.
60 Chapter3
Page 57
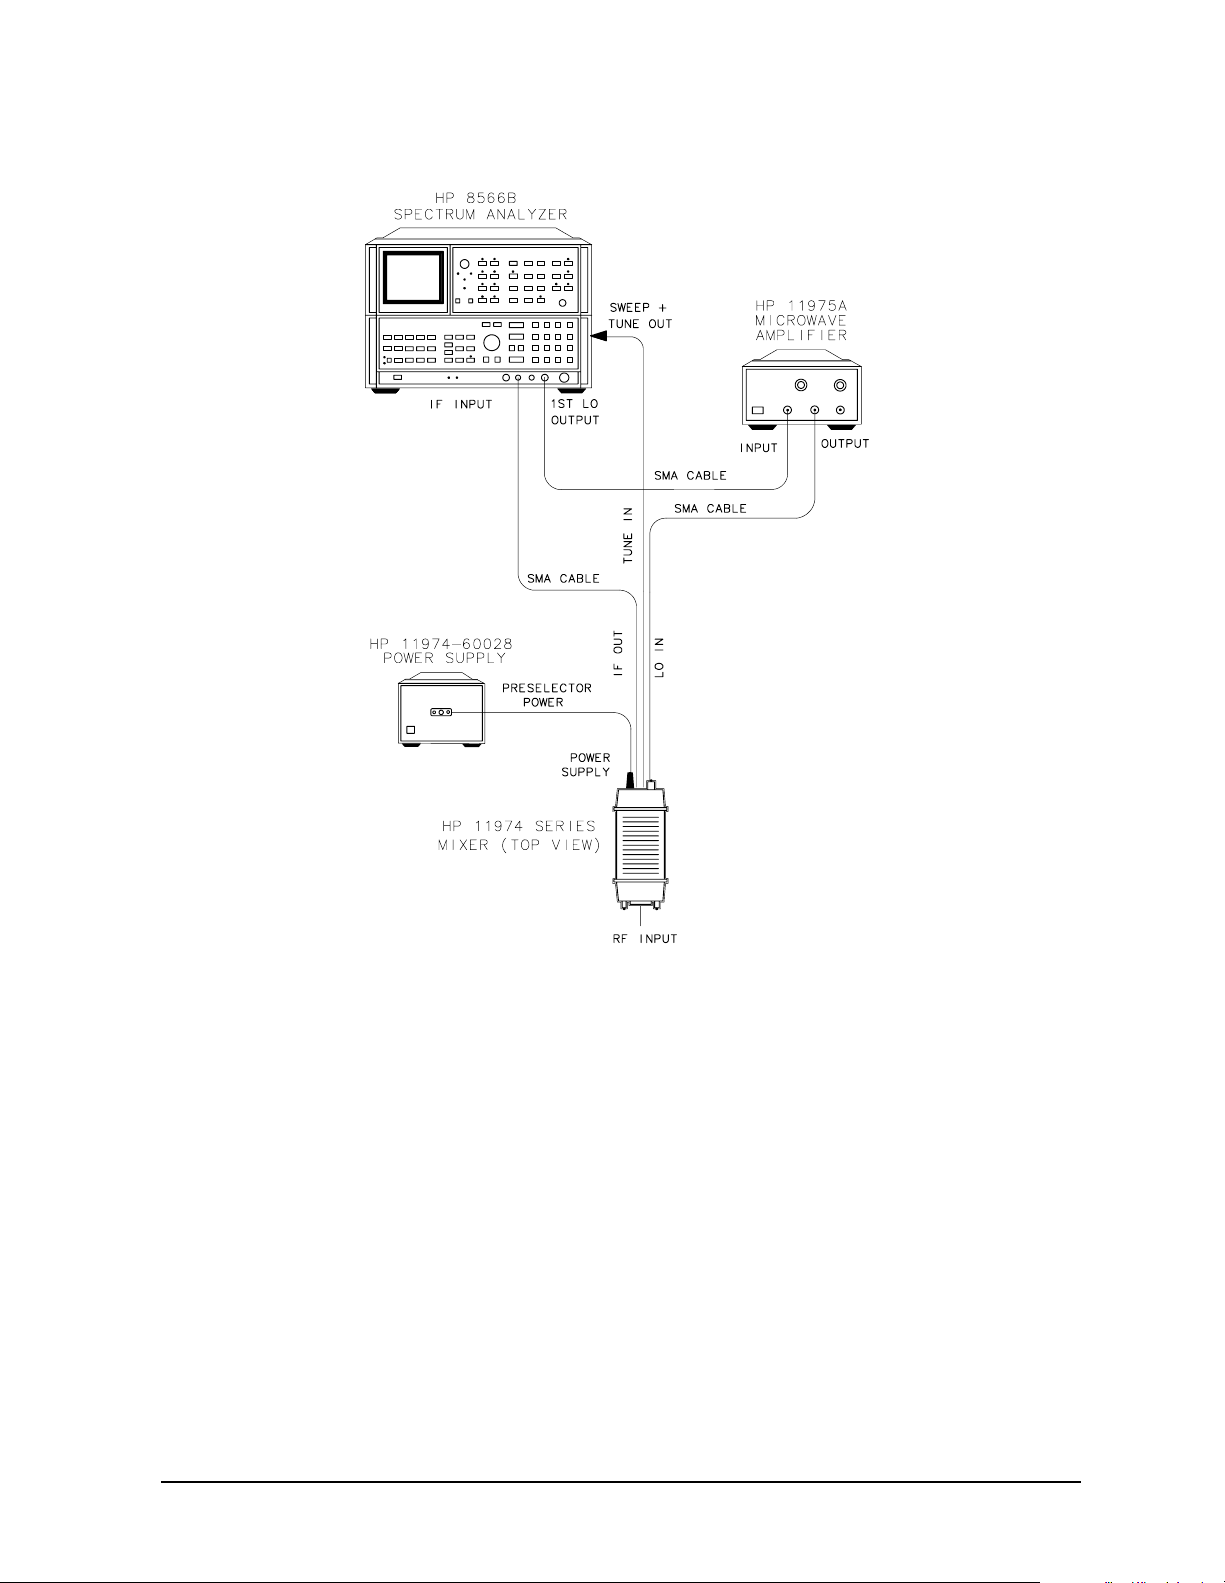
Figure 3-5 11974 Connections Using an 8566B
Operation
Operation Using an 8566B Spectrum Analyzer
Frequency Tracking Calibration
Use this procedure to align the frequency of the 11974 tracking filter to the tuned
frequency of the 8566B. Fo0llow this procedure anytime the 11974 is connected to a
different spectrum analyzer. Periodically check the calibration.
1. Set the 11974 rear-panel switches
8566B and LEDS to the ON position, and the other
two switches to the OFF position, to properly scale the tune ramp of the analyzer.
2. Set the spectrum analyzer to the appropriate millimeter band by using the following
key sequence for the appropriate mixer:
for an 11974A: SHIFT ⇑⇑
for an 11974Q: SHIFT ⇑⇑⇑
for an 11974U: SHIFT ⇑⇑⇑⇑
for an 11974V: SHIFT ⇑⇑⇑⇑⇑
Chapter 3 61
Page 58

Operation
Operation Using an 8566B Spectrum Analyzer
3. On the spectrum analyzer, set the preselector DAC to 32 (the center of its 0–63 range)
by pressing
SHIFT, GHz, 32, and Hz.
4. Set the spectrum analyzer to a frequency span of 0 Hz by pressing
0, and
Hz.
FREQUENCY, SPAN ,
NOTE Due to the repetitive nature of this procedure, it may be helpful to save the
center-frequency settings as indicated in steps 5 and 7 in unused state
registers.
5. Set the spectrum analyzer center frequency to the low end of the band by pressing
CENTER FREQUENCY and entering the corresponding value for the mixer listed below,
then save this setting in an unused register.
for an 11974A: 26.5 GHz
for an 11974Q: 33.0 GHz
for an 11974U: 40.0 GHz
for an 11974V: 50.0 GHz
6. On the rear panel of the 11974, adjust the corresponding potentiometer for the mixer
listed below until one or both of the green LEDs are lit.
• for an 11974A: “26.5 GHz SET”
• for an 11974Q: “33.0 GHz SET”
• for an 11974U: “40.0 GHz SET”
• for an 11974V: “50.0 GHz SET”
7. Change the spectrum analyzer center frequency to the high end of the band as indicated
below; then save this setting in an unused register:
• for an 11974A: 40 GHz
• for an 11974Q: 50 GHz
• for an 11974U: 60 GHz
• for an 11974V: 75 GHz
8. On the rear-panel of the 11974, adjust the corresponding potentiometer for the mixer
listed below until one or both of the green LEDs are lit.
• for an 11974A: “40 GHz SET”
• for an 11974Q: “50 GHz SET”
• for an 11974U: “60 GHz SET”
• for an 11974V: “75 GHz SET”
9. Repeat step 5 through step 8 until green lights are lit at both frequencies without any
additional adjustments.
62 Chapter3
Page 59

Operation Using an 8566B Spectrum Analyzer
Operation
Band Selection
1. If necessary, mate the 11974 to the spectrum analyzer being used for preselected
external mixing by using the Frequency Tracking Calibration procedure above.
2. Set the spectrum analyzer to the appropriate millimeter band by using the key
sequence listed below:
Operation
for an 11974A:
SHIFT ⇑⇑
for an 11974Q: SHIFT ⇑⇑⇑
for an 11974U: SHIFT ⇑⇑⇑⇑
for an 11974V: SHIFT ⇑⇑⇑⇑⇑
NOTE The above band selection key sequence must be used to enter the external
mixing band of operation. Do not enter in the center frequency of the band
directly.
Amplitude Calibration
The 8566B uses a single-point conversion-loss factor per band. The conversion-loss number
is saved with an instrument preset, when the band is exited, and with the SAVE and
RECALL functions.
Enter the conversion loss at the desired frequency from either the calibration label on the
bottom of the 11974 or the supplied calibration sheet using the following key sequence.
SHIFT, 5, and MHz
•
• Enter the conversion loss value of the desired frequency, then terminate the entry with
dB.
Preselector Peaking
1. Place the active marker on the desired signal to be peaked using
MARKER
NORMAL.
PEAK SEARCH or
TIP To complete the preselector-peaking routine more quickly, place the signal at
center screen and reduce the frequency span until the sweep time is
approximately 200 ms.
2. Peak the desired signal by pressing
Chapter 3 63
PRESEL PEAK.
Page 60

Operation
Operation Using an 8566B Spectrum Analyzer
General Descriptions of 8566B External-Mixing Functions
SHIFT, ⇑ selects the first millimeter frequency “lettered” band, K-band
(18 – 26.5 GHz). (Note: K-band is not available in the 11974 Series.)
Each succeeding press of the ⇑ key advances to the next lettered
band. For example, A band can be displayed by pressing SHIFT ⇑⇑.
The lettered bands are paired with harmonic numbers. Due to some
overlap between bands, always enter the millimeter band by using
the SHIFT ⇑ keys to select the lettered band. Do not enter in the
center frequency of the band directly.
SHIFT, GHz calls the preselector-peak DAC number to the active function. The
DAC provides a vernier offset to the TUNE + SPAN to account for
slight preselector mistracking with time, temperature, and so on. For
the 0 to 63 DAC number range, the frequency range is approximately
n times 46 MHz, where n is the harmonic number. The DAC number
is saved with instrument preset (IP), but it is not saved using the
SAVE/RECALL function or with a learn string.
SHIFT, 5, MHz calls CONVERSION LOSS to the active function. This is a
single-point amplitude correction for each millimeter band, and each
band's conversion loss is saved with IP, when the band is exited, and
with the SAVE/RECALL functions.
SHIFT, 2, MHz calls the FULBAND number to the active function. This is an
alternative function to SHIFT, ⇑, ⇑ in which each millimeter lettered
band can be entered by a FULBAND number. For example, A band is
equivalent to FULBAND 7, Q band is equivalent to FULBAND 8,
and so on.
SHIFT, 1, MHz displays the MHz key menu on the display screen for reference
purposes.
NOTE SHIFT 3, 4, 6, 7, and 8 MHz keys are NOT used with the 11974 Series.
64 Chapter3
Page 61
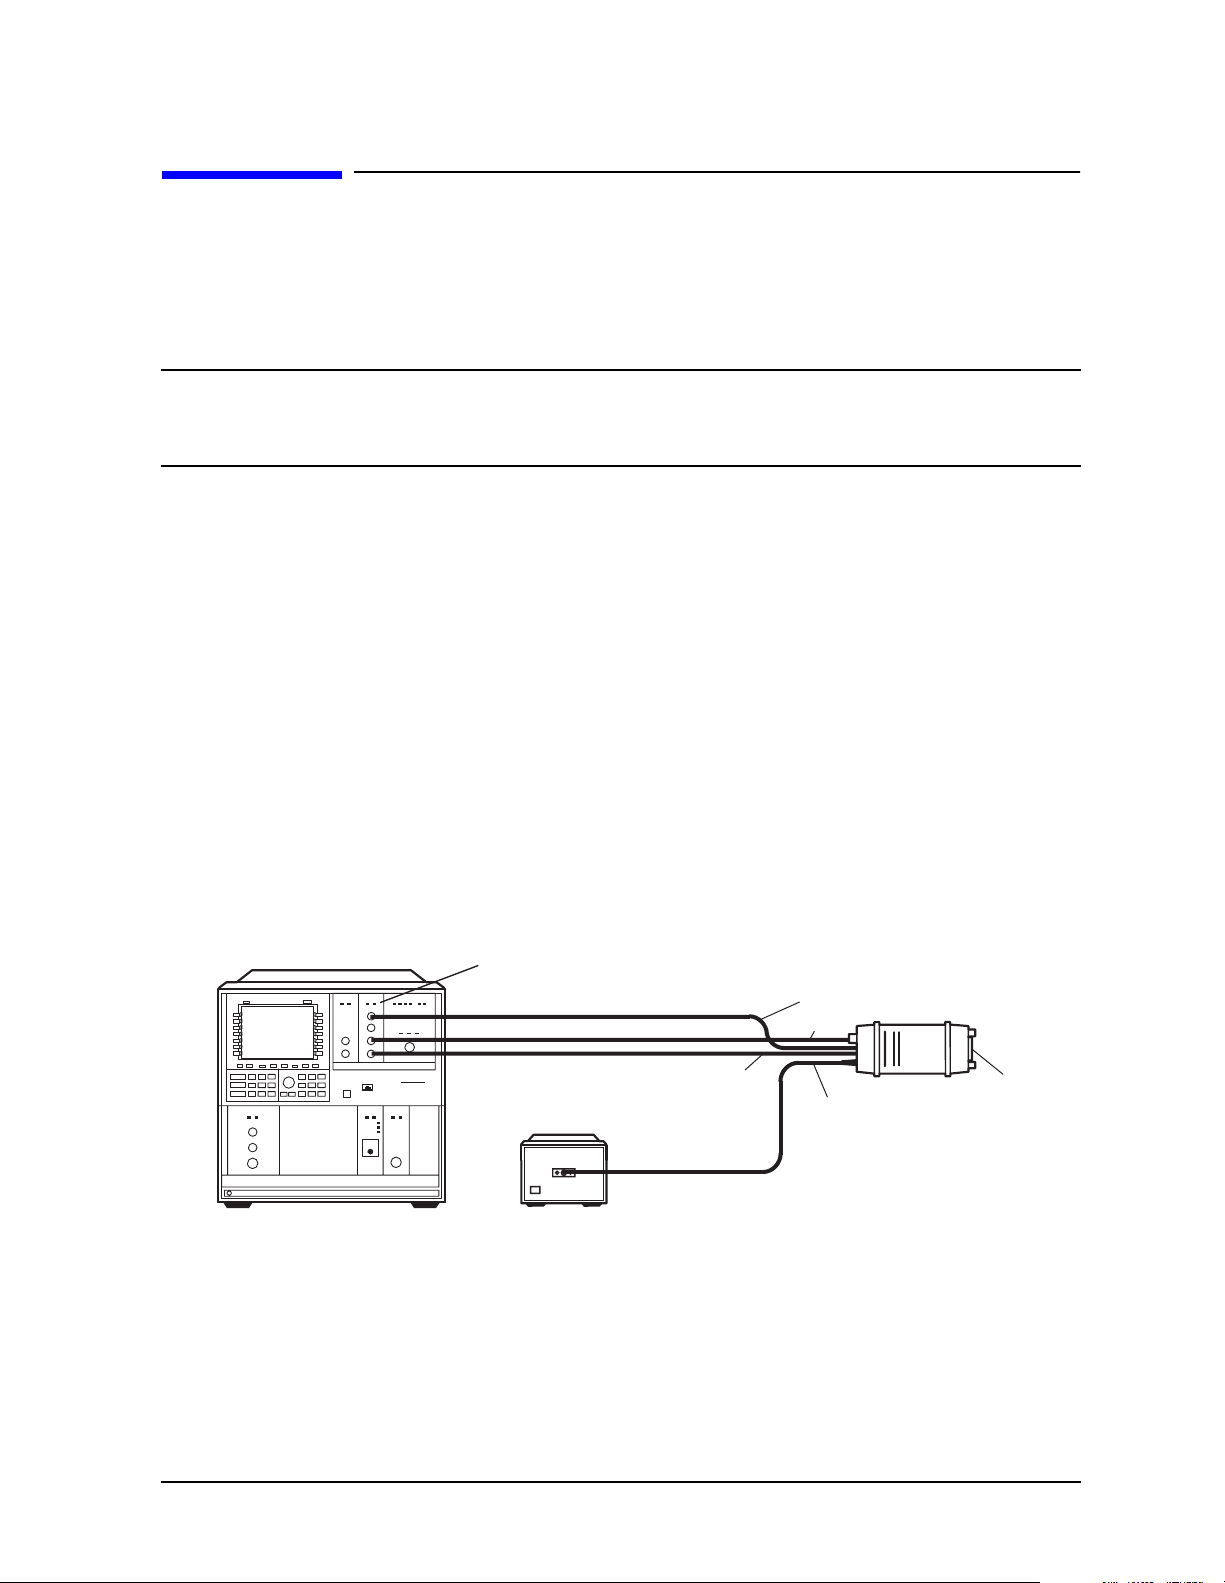
Operation
Operation Using an 71000 Series Spectrum Analyzer with an 70907B, 70909A, or 70910A
Operation Using an 71000 Series Spectrum Analyzer
with an 70907B, 70909A, or 70910A
Preliminary Operation
NOTE This section provides information for the 70907B, however the operation of
the 70909A and 70910A is similar. Minor differences may be noted, but the
necessary deviations from these exact instructions will be obvious.
Compatibility Reference
Refer to Chapter 2, “Installation,” on page 31 for information relating to 71000 Series
Modular Spectrum Analyzer System compatibility with the 11974 Series.
Equipment Connection
Connect the equipment as shown in Figure 3-6 and use the following checklist to verify the
connections.
• 11974 LO IN to 70907B LO OUTPUT (SMA cable, 5061-5458)
• 11974 IF OUT to 70907B IF INPUT (SMA cable, 5061-5458)
• 11974 TUNE IN to 70907B PRESEL TUNE/SPAN (BNC cable, 8120-1839)
• 11974 POWER SUPPLY to 11974-60028
Figure 3-6 11974 Connections to the 71000 Series Spectrum Analyzer
HP 71000 SERIES
SPECTRUM ANALYZER
70907B External Mixer
Interface Module
Presel Tune/Span
LO Output
IF Input
HP 11974-60028
POWER SUPPLY
IF Out
Preselector
Power
Tune In
LO In
Power
Supply
HP 11974 SERIES
MIXER (TOP VIEW)
RF Input
yg35_3
Chapter 3 65
Page 62

Operation
Operation Using an 71000 Series Spectrum Analyzer with an 70907B, 70909A, or 70910A
Frequency Tracking Calibration
Use this procedure to align the frequency of the 11974 tracking filter to the tuned
frequency of the spectrum analyzer. Follow this procedure whenever the 11974 is
connected to a different spectrum analyzer. Periodically check the calibration.
1. Set the 11974 rear-panel switches 70907B (this switch also applies to the 70909 and
70910A) and
LEDS to the ON position, and the other two switches to the OFF position,
to properly scale the tune ramp of the spectrum analyzer.
2. When the 71000 is set up with multiple active input ports available, configure the
analyzer for a preselected external mixer by using the following key sequence:
MENU
State
select input
IN “n” EM “Model Number”
1
NOTE If the State key is not available when you press MENU, skip configuration
step 2.
3. Select the frequency band of operation by using the following key sequence:
State
ext mixer
fulband KAQUVE
Press the softkey for the appropriate frequency band. (INSTR PRESET will reset this
to the default active input, see INSTR PRESET on page 71.)
4. Initialize the preselector-peak DAC to the center of its range by pressing
pre-select, PRESEL DAC, and 128, then terminate the entry with the ENTER softkey.
5. Set the analyzer to zero span by pressing
Freq and SPAN and entering 0 Hz.
State,
NOTE Due to the repetitive nature of this procedure, it may be helpful to save the
center-frequency settings in unused state registers after performing step a
and step c.
1. “Model Number” will be either 70907A, 70909A, or 70910A; “n” is a number indicating the order in
which the input devices were found by the input device search.
66 Chapter3
Page 63

Operation
Operation Using an 71000 Series Spectrum Analyzer with an 70907B, 70909A, or 70910A
6. To adjust the tracking between the 71000 and the 11974, perform the following steps:
a. Set the spectrum analyzer center frequency by pressing
Freq and CENTER and
entering the corresponding start frequency value for the mixer listed below, then
save this setting in an unused register.
for an 11974A: 26.5 GHz
for an 11974Q: 33.0 GHz
for an 11974U: 40.0 GHz
for an 11974V: 50.0 GHz
b. On the rear-panel of the 11974, adjust the corresponding potentiometer for the mixer
listed below until one or both of the green LEDs are lit.
for an 11974A: “26.5 GHz SET”
for an 11974Q: “33.0 GHz SET”
for an 11974U: “40.0 GHz SET”
for an 11974V: “50.0 GHz SET”
c. Change the spectrum analyzer center frequency to the stop frequency value
indicated below, then save this setting in an unused register:
for an 11974A: 40 GHz
for an 11974Q: 50 GHz
for an 11974U: 60 GHz
for an 11974V: 75 GHz
d. On the rear-panel of the 11974, adjust the corresponding potentiometer for the mixer
listed below until one or both of the green LEDs are lit.
for an 11974A: “40 GHz SET”
for an 11974Q: “50 GHz SET”
for an 11974U: “60 GHz SET”
for an 11974V: “75 GHz SET”
e. Repeat step a through step d until green lights are lit at both frequencies without
additional adjustments.
Chapter 3 67
Page 64

Operation
Operation Using an 71000 Series Spectrum Analyzer with an 70907B, 70909A, or 70910A
Operation
Band Selection
1. If necessary, mate the 11974 to the spectrum analyzer being used for preselected
external mixing by using the procedure “Frequency Tracking Calibration” on page 66.
2. Use the following key sequence to enter the external mixing mode and to select the
desired band of operation.
MENU
State
ext mixer
fulband KAQUVE
Press the softkey for the desired band.
NOTE The above band selection key sequence must be used to enter the external
mixing band of operation. Do not enter in the center frequency of the band
directly.
Amplitude Calibration for a Single Frequency
Enter the conversion loss at the desired frequency from either the calibration label on the
bottom of the 11974 or the supplied calibration sheet by using the following key sequence.
State
ext mixer
CONV LOSS
Enter the conversion loss value of the desired frequency, then terminate the entry with
dB.
NOTE The above procedure is a single-point conversion-loss correction. For an
alternative procedure, available by remote programming only, refer to
“Conversion Loss Versus Frequency Correction” on page 71.
68 Chapter3
Page 65

Operation Using an 71000 Series Spectrum Analyzer with an 70907B, 70909A, or 70910A
Preselector Peaking
1. Place the active marker on the desired signal to be peaked.
Hint: To complete the preselector-peaking routine more quickly, place the signal at
center screen and reduce the frequency span until the sweep time is approximately
100 ms.
2. Peak the desired signal by using the following key sequence.
State
pre-select
PRESEL PEAK
Operation
Chapter 3 69
Page 66

Operation
Operation Using an 71000 Series Spectrum Analyzer with an 70907B, 70909A, or 70910A
General Descriptions of 71000 Series Spectrum Analyzer External-Mixing Functions
ext mixer allows access to the following softkey functions that control the
measurement range when an external mixer extends the
spectrum-analyzer frequency range. The ext mixer softkey can be
found under the State firmkey.
fulband KAQUVE PRESEL PEAK
fulband WFDGYJ PRESEL DAC
CONV LOSS
fulband KAQUVE
and
fulband WFDGYJ
specify the frequency range for measurements made with external
mixers. Twelve frequency bands are available. Table 3-2 lists the
start and stop frequencies of each band and also shows which
local-oscillator harmonic (N) is used for the mixing process. Once a
band is selected, the frequency range is locked and the spectrum
analyzer tunes with the local-oscillator harmonic for that band only.
(Selecting a new band presets the instrument in that band.)
Table 3-2 External Mixing Bands and Associated Mixing Harmonics
Band Harmonic Number (N) Frequency Range (GHz)
K6− 18.0 to 26.5
A 8+ 26.5 to 40.0
Q 10+ 33.0 to 50.0
U 10+ 40.0 to 60.0
V 14+ 50.0 to 75.0
E 16+ 60.0 to 90.0
W 18+ 75.0 to 110.0
F 24+ 90.0 to 140.0
D 30+ 110.0 to 170.0
G 36+ 140.0 to 220.0
Y 42+ 170.0 to 260.0
J 50+ 220.0 to 330.0
70 Chapter3
Page 67

Operation
Operation Using an 71000 Series Spectrum Analyzer with an 70907B, 70909A, or 70910A
CONV LOSS (conversion loss) offsets the reference level to compensate for
amplitude losses at the active input port. If necessary, use
select input to activate the desired input port before specifying its
conversion-loss offset.
To clear the offset, enter a conversion loss of zero.
After instrument preset, a default value of 30 dB is activated
automatically for the input port of the external-mixer-interface
module.
PRESEL PEAK (preselector peak) adjusts the tracking of the preselector filter to
yield maximum amplitude accuracy at the active marker position. If
a marker is not present, PRESEL PEAK places a marker at the
highest signal level.
Whenever a measurement is made, the current preselector DAC
value corresponding to the selected measurement range determines
the preselector tracking. Press PRESEL PEAK to repeak the
preselector and store a new value in the preselector DAC. When
measuring frequency spans greater than 0 Hz, the analyzer must be
swept several times to peak the preselector. Thus, the analyzer
requires several minutes to peak the preselector when measuring
with slow sweep times. To execute the peaking function quickly,
change the span to either 0 Hz or such that the sweep time is
approximately 100 ms, before pressing PRESEL PEAK.
PRESEL DAC (preselector DAC) enters a value into the preselector DAC for the
frequency range corresponding to the frequency at the marker. If a
marker is not present, PRESEL DAC places a marker at the center of
the display.
pre-select allows access to the preselector functions when a preselector module
is in the system. The pre-select softkey can be accessed by pressing
State.
preset input sets which active input port will be selected when the INSTR
PRESET is pressed. The preset input softkey can be accessed by
pressing State, then MORE.
INSTR PRESET resets to the preset input and to the lowest full frequency range
available. (For an external mixer, this is band A.) This is a front
panel hardkey.
Conversion Loss Versus Frequency Correction
The 71000 Series Spectrum Analyzers with the 70907B External Mixer Interface Module
installed has the amplitude-correction function (AMPCOR) available by remote
programming.
Use AMPCOR to compensate for the 11974 frequency-dependent conversion-loss
variations. Up to 200 pairs of frequency-amplitude correction points can be entered,
depending on the amount of available internal memory. The frequency values entered
must be in increasing order, or an error condition results. Whenever AMPCOR is on, the
correction values are added to all measurement results.
Chapter 3 71
Page 68

Operation
Operation Using an 71000 Series Spectrum Analyzer with an 70907B, 70909A, or 70910A
The values of the correction points are applied across the active measurement range.
Between points, the correction values are interpolated. When measuring at frequencies
outside the first and last correction points, these values are used as the correction value.
When AMPCOR is executed, the frequency pairs are stored in internal memory. The
remote commands DISPOSE ALL, FORMAT, PERASE, and
DISPOSE AMP COR erase the
amplitude-correction pairs from memory.
NOTE DISPOSE ALL, FORMAT, and PERASE erases much more then the
amplitude-correction pairs from memory. Do not use these commands without
referring to the programmer’s manual for the 70000 and 70900B to determine
their effect on instrument programming.
Because AMPCOR adjusts IF gain and attenuation, AMPCOR should be used with care
when measuring signals near the compression level that are also at a frequency that is
corrected by the AMPCOR command.
To use AMPCOR for the 11974 conversion loss correction, first set the single-point
conversion-loss function to zero with the following command:
OUTPUT 718; "CNVLOSS 0DB;"
Then build the AMPCOR table with frequency conversion loss pairs. The following
example program line shows three pairs of frequency conversion-loss values for a typical
11974V.
OUTPUT 718; "AMPCOR 50GHZ, 49.6DB, 51GHZ, 49.1DB, 52GHZ,48.6DB;"
The conversion loss corrections are activated by the AMPCOR ON command; use AMPCOR OFF
to deactivate the function. (Be sure to manually enter a single-point conversion-loss value
if AMPCOR has been used.)
To print out an existing AMPCOR table, use the program listed below.
10 DIM A$(1:20)[30]
20 OUTPUT 718;"CNVLOSS 0DB;"
30 OUTPUT 718;"AMPCOR 50GHZ, 46.1DB, 52GHZ, 46.7DB, 53GHZ,47.2DB;"
40 !
50 OUTPUT 718;"AMPCOR?;"
60 ENTER 718 USING "%,K";A$(*)
70 !
80 FOR I=1 TO 10
90 PRINT "Point ";I,A$(I)
100 NEXT I
110 END
Line 30: Generates an AMPCOR table.
Line 60: % specifies that an EOI terminates the entire statement. K specifies that
an L
terminates the individual string entry.
F
Returned values are in the format where the frequency in Hz is listed first, followed by the
conversion loss in dB. See the following example.
72 Chapter3
Page 69

Operation
Operation Using an 71000 Series Spectrum Analyzer with an 70907B, 70909A, or 70910A
Point 1 50.00000000E+9,46.1
Point 2 52.00000000E+9,46.7
Point 3 53.00000000E+9,47.2
Point 4
Point 5
Point 6
Point 7
Point 8
Point 9
Point 10
Returned values are 0,0 when AMPCOR is set to OFF.
To dispose of an AMPCOR table, use the following command:
OUTPUT 718; "DISPOSE AMP COR;"
NOTE Be sure that there is a space between AMP and COR when using the DISPOSE
command.
For further information, consult the 70900B Local-Oscillator-Controlled Modules
Programming Manual, part number 70900-90137.
Chapter 3 73
Page 70
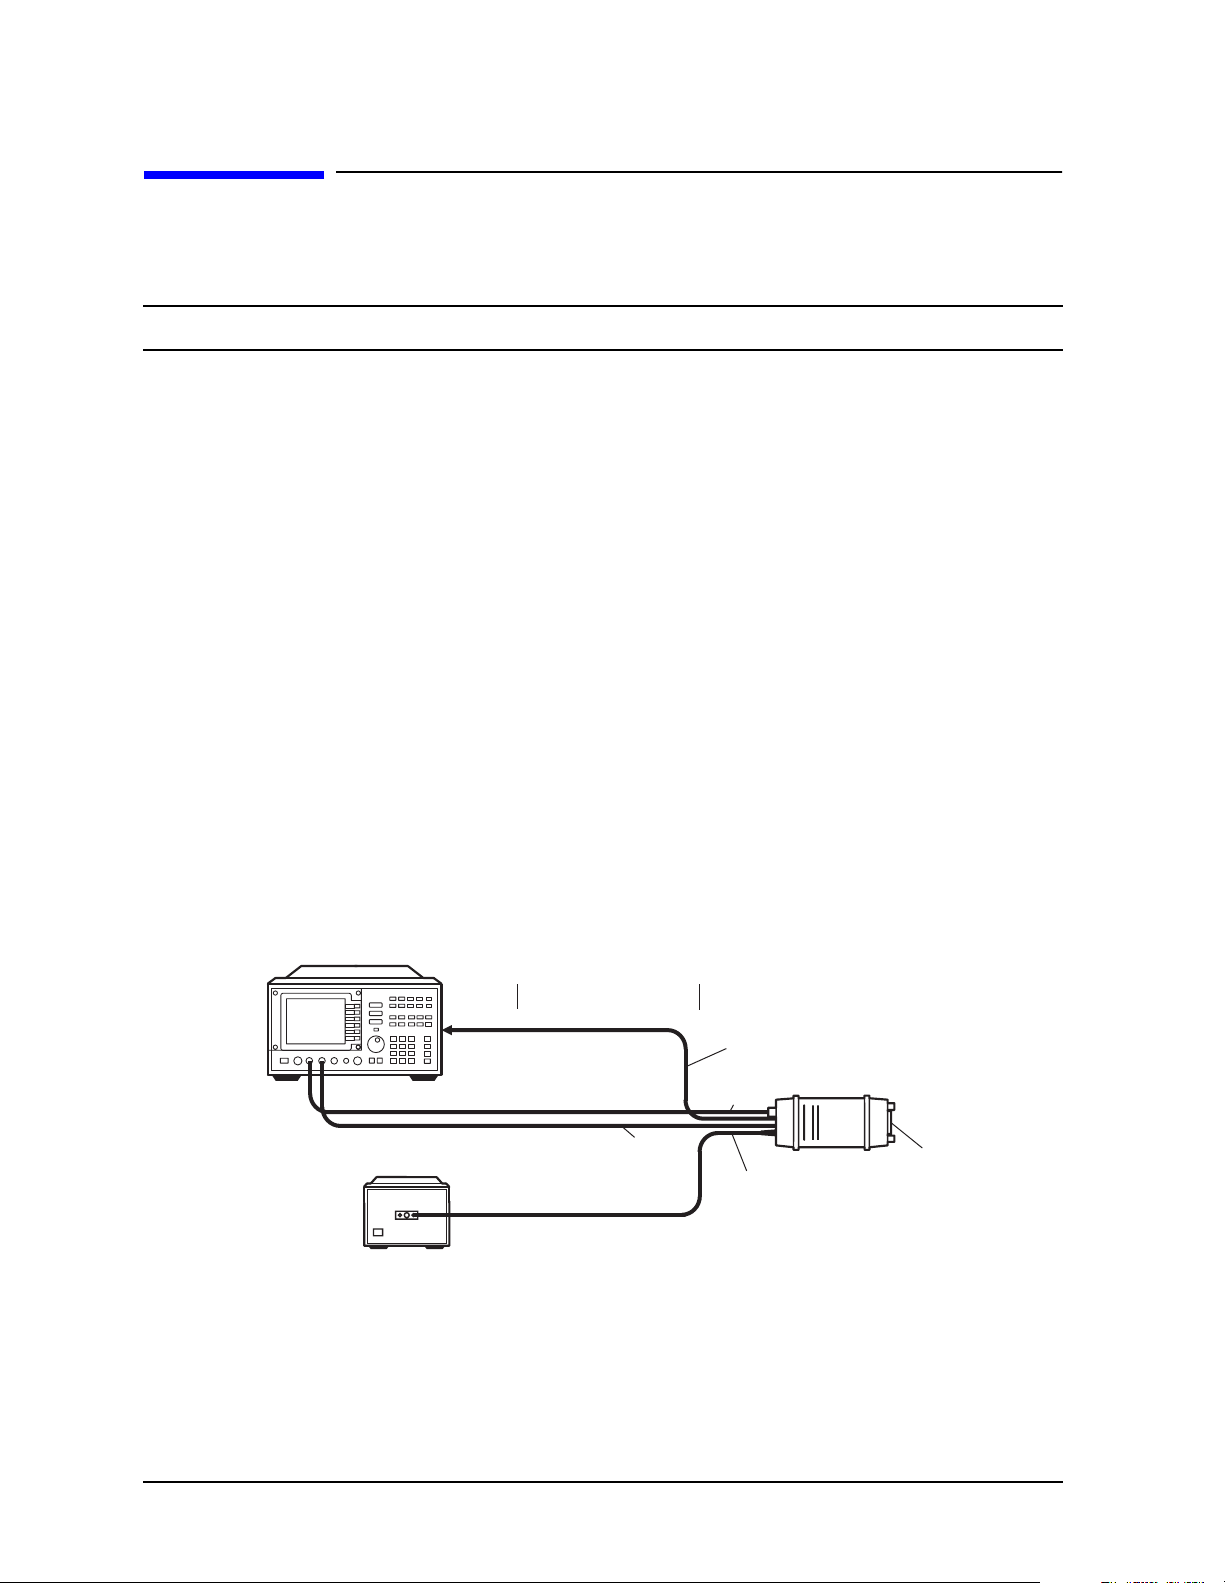
Operation
Using 8563A, 8561B, 8560A, or 8560 E-Series Spectrum Analyzers
Using 8563A, 8561B, 8560A, or 8560 E-Series Spectrum
Analyzers
NOTE External mixing cannot be performed on instruments with Option 002.
Preliminary Operation
Compatibility Reference
Refer to Chapter 1, “General Information,” on page 11 for information relating to retrofit
requirements for 8561B and 8560A Spectrum Analyzers.
Equipment Connections
Connect the equipment as shown in Figure 3-7 on page 74 and use the following checklist
to verify the connections.
• 11974 LO IN to the analyzer 1ST LO OUTPUT (SMA, 5061-5458)
• 11974 IF OUT to the analyzer IF INPUT (SMA, 5061-5458)
• 11974 TUNE IN to the analyzer J8, LO SWP|0.5V/GHz OUTPUT (BNC, 8120-1839;
BNC f-f adapter, 1250-0080; BNC, 8120-2582)
• 11974 POWER SUPPLY to 11974-60028 PRESELECTOR POWER
Figure 3-7 11974 Connections Using an 8563A, 8561B,
8560A, or 8560E-Series Spectrum Analyzers
HP 8563E
SPECTRUM ANALYZER
or
LO SWP FAV
Output
IF Out
Preselector
Power
Tune In
LO In
Power
Supply
HP 11974 SERIES
MIXER (TOP VIEW)
RF Input
1st LO
Output
LO SWP 0.5V/GHz
Output
J8J8
IF Input
HP 11974-60028
POWER SUPPLY
SMA Cable
SMA Cable
yg35_2
74 Chapter3
Page 71

Operation
Using 8563A, 8561B, 8560A, or 8560 E-Series Spectrum Analyzers
Frequency Tracking Calibration
Use this procedure to align the frequency of the 11974 tracking filter to the tuned
frequency of the spectrum analyzer Follow this procedure anytime the 11974 is connected
to a different spectrum analyzer. Periodically check the calibration.
1. Set the 11974 rear-panel switches “8563/61/60” and “LEDS” to the ON position, and the
other two switches to the OFF position, in order for the 11974 to properly scale the tune
ramp of the spectrum analyzer.
2. Configure the analyzer for a preselected external mixer by pressing
EXT MXR PRE UNPR to PRE.
CONFIG and setting
3. Set the LO tuning sensitivity as follows:
For the 8564E or 8565E, press
AUX CTRL, REAR PANEL, and setting V/GHz .25 .50
to .50
For all other analyzers, press AUX CTRL, REAR PANEL, and .5 V/GHz (FAV)
4. Enter the full-band selection mode by using the following key sequence:
AUX CTRL
EXTERNAL MIXER
FULL BAND
Use the ⇑ or ⇓ key until the desired band is reached.
5. Set the spectrum analyzer to zero span by pressing
6. Set the spectrum analyzer center frequency by pressing
SPAN, ZERO SPAN.
FREQUENCY, CENTER FREQ and
entering the corresponding value for the mixer listed below:
for an 11974A: 26.5 GHz
for an 11974Q: 33.0 GHz
for an 11974U: 40.0 GHz
for an 11974V: 50.0 GHz
7. Initialize the preselector-peak DAC at the start of the band by using the following key
sequence:
AUX CTRL
EXTERNAL MIXER
PRESEL PEAK
PRESEL MAN ADJ
128 Hz
8. Set the spectrum analyzer center frequency by pressing FREQUENCY, CENTER FREQ and
entering the corresponding value for the mixer listed below:
for an 11974A: 40 GHz
for an 11974Q: 50 GHz
Chapter 3 75
Page 72

Operation
Using 8563A, 8561B, 8560A, or 8560 E-Series Spectrum Analyzers
for an 11974U: 60 GHz
for an 11974V: 75 GHz
9. Initialize the preselector-peak DAC at the end of the band by using the following key
sequence:
AUX CTRL
EXTERNAL MIXER
PRESEL PEAK
PRESEL MAN ADJ
128 Hz
NOTE Due to the repetitive nature of this procedure, it may be helpful to save the
center-frequency settings in unused state registers as indicated in step 9 and
step 11.
10.Set the spectrum analyzer center frequency by pressing
FREQUENCY, CENTER FREQ
and entering the corresponding value for the mixer listed below, then save this setting
in an unused register.
for an 11974A: 26.5 GHz
for an 11974Q: 33.0 GHz
for an 11974U: 40.0 GHz
for an 11974V: 50.0 GHz
11.On the rear-panel of the 11974, adjust the corresponding potentiometer for the mixer
listed below until one or both of the green LEDs are lit.
for an 11974A: “26.5 GHz SET”
for an 11974Q: “33.0 GHz SET”
for an 11974U: “40.0 GHz SET”
for an 11974V: “50.0 GHz SET”
12.Change the spectrum analyzer center frequency to the value indicated below, then save
this setting in an unused register:
for an 11974A: 40 GHz
for an 11974Q: 50 GHz
for an 11974U: 60 GHz
for an 11974V: 75 GHz
76 Chapter3
Page 73

Operation
Using 8563A, 8561B, 8560A, or 8560 E-Series Spectrum Analyzers
13.On the rear-panel of the 11974, adjust the corresponding potentiometer for the mixer
listed below until one or both of the green LEDs are lit.
for an 11974A: “40 GHz SET”
for an 11974Q: “50 GHz SET”
for an 11974U: “60 GHz SET”
for an 11974V: “75 GHz SET”
14.Repeat step 10 through step 13 until green lights are lit at both frequencies without any
additional adjustments.
Operation
Band Selection
1. If necessary, configure the analyzer for a preselected external mixer by pressing
CONFIG
and setting EXT MXR PRE UNPR to PRE.
2. Set the LO tuning sensitivity as follows:
For the 8564E or 8565G, press
AUX CTRL, REAR PANEL, and setting V/GHz .25 .50
to .50
For all other analyzers, press AUX CTRL, REAR PANEL, and .5 V/GHz (FAV)
3. If necessary, mate the 11974 to the spectrum analyzer being used for preselected
external mixing by using the Frequency Tracking Calibration procedure above.
4. Use the following key sequence to enter the external mixing mode and to select the
desired band of operation.
AUX CTRL
EXTERNAL MIXER
FULL BAND
Use the ⇑ or ⇓ key until the desired band is reached.
NOTE The above band-selection key sequence must be used to enter the external
mixing band of operation. Do not enter in the center frequency of the band
directly.
Chapter 3 77
Page 74

Operation
Using 8563A, 8561B, 8560A, or 8560 E-Series Spectrum Analyzers
Amplitude Calibration
Enter the conversion loss table at the preset frequencies from either the calibration label
on the bottom of the 11974 or the supplied calibration sheet by using the following key
sequence. (Note: the analyzer automatically interpolates between the preset frequencies.)
AUX CTRL
EXTERNAL MIXER
AMPTD CORRECT
CNV LOSS VS FREQ
Enter the conversion loss value of the indicated preset frequency, then terminate the
entry with
dB.
Advance to the next preset frequency by pressing
indicated frequency. Continue until the highest frequency is reached, then use the
⇓ keys to scan through the frequencies to verify or edit the conversion-loss values
⇑ and enter the conversion loss of the
⇑ and
entered.
NOTE For V band, it may be necessary to first use the following key sequence to
initialize the average of the conversion loss versus frequency table near the
values for this band.
•
AUX CTRL
• EXTERNAL MIXER
• AMPTD CORRECT
• AVERAGE CNV LOSS
• Enter in 47 and terminate with dB.
Preselector Peaking
1. Access the preselector-peak functions by pressing the following keys:
AUX CTRL
EXTERNAL MIXER
PRESEL PEAK
2. Place the active marker on the desired signal to be peaked.
3. Peak the desired signal by pressing
78 Chapter3
PRESEL AUTO PK.
Page 75

Using 8563A, 8561B, 8560A, or 8560 E-Series Spectrum Analyzers
General Description of External-Mixing Functions
Operation
CONFIG,
EXT MXR PRE UNPR
selects either preselected external mixing mode or unpreselected
external mixing mode. This softkey sets the external mixer
configuration used by the softkey menu found under the
EXTERNAL MIXER softkey under AUX CTRL.
If the preselected external mixer mode is selected, rear-panel output
J8 of the analyzer is automatically switched to provide an output of
1.5 V/GHz of the LO frequency, when 0.5V/GHz (FAV) is selected.
The 1.5 V/GHz of the LO frequency definition is required for the
11974 Series preselected external mixers.
NOTE There are two different types of external mixers available, preselected and
unpreselected. The EXT MXR PRE UNPR softkey function applies only to the
selection of the type of external mixer to be used. It does not switch the analyzer from
internal to external mixing.
EXTERNAL MIXER
accesses a menu of functions that allow you to extend the frequency
range using external mixers. These functions are described below.
NOTE No external mixing capabilities are available with an 8560A/E Option 002.
Resolution bandwidths less than or equal to 100 Hz are not available with
external mixers.
FULL BAND
AMPTD CORRECT
AVERAGE CNV LOSS
allows you to select a commonly-used frequency band above 18 GHz.
These bands are shown in Table 3-3 on page 80. Use the step keys or
the knob to select a desired frequency band; the selected band
appears in the active function block. Activating FULL BAND also
activates the harmonic-lock function.
displays a menu of functions that set conversion losses and flatness
data.
displays the mean conversion loss for the current harmonic and
allows you to enter new conversion loss data. In a full frequency band
(such as A band), the mean conversion loss is defined as the
minimum loss plus the maximum loss for that band divided by two.
To change the maximum and minimum values, use the
CNV LOSS VS FREQ softkey. Any change to the average conversion
loss also affects the flatness data, which is described below.
The default conversion loss value for each band is 30 dB.
Chapter 3 79
Page 76

Operation
Using 8563A, 8561B, 8560A, or 8560 E-Series Spectrum Analyzers
CNV LOSS VS FREQ
displays the stored conversion loss for a specific frequency in the
current band. This allows amplitude correction to be entered to
compensate for changes in conversion loss with frequency. Toenter a
new value, use the data keys. To change the displayed frequency, use
the step keys. Any changes to the data also affect the mean
conversion loss stored under AVERAGE CNV LOSS. Table 3-3 on
page 80 shows the number of flatness points for each band and the
default flatness values. To view the correction, connect a 310.7 MHz
signal of a known amplitude (approximately −30 dBm) to the IF
input and set the analyzer to sweep the associated band.
Table 3-3 Flatness Points and Conversion Losses for Frequencies above 18 GHz
Frequency
Band
K 18.0 to 26.5 6 2 GHz 30 dB
A 26.5 to 40.0 8 2 GHz 30 dB
Q 33.0 to 50.0 7 3 GHz 30 dB
U 40.0 to 60.0 6 4 GHz 30 dB
V 50.0 to 75.0 6 5 GHz 30 dB
Frequency Range (GHz) Number of
Flatness Points
Point
Spacing
Default Conversion
Loss
E 60.0 to 90.0 7 5 GHz 30 dB
W 75.0 to 110.0 8 5 GHz 30 dB
F 90.0 to 140.0 6 10 GHz 30 dB
D 110.0 to 170.0 7 10 GHz 30 dB
G 140.0 to 220.0 9 10 GHz 30 dB
Y 170.0 to 260.0 7 15 GHz 30 dB
J 220.0 to 325.0 8 15 GHz 30 dB
PRESEL PEAK
(available only with preselected external mixing) displays the
preselected external mixer softkey menu, which is described below.
This softkey menu is only available when the EXT MXR PRE UNPR
softkey under CONFIG is set to “preselected” mode.
NOTE The PRESEL PEAK softkey and its lower-level softkeys are only for use with
preselected external mixers. The preselected configuration must initially be
set up using the EXT MXR PRE UNPR softkey under CONFIG.
80 Chapter3
Page 77

Operation
Using 8563A, 8561B, 8560A, or 8560 E-Series Spectrum Analyzers
PRESEL AUTO PK
PRESEL MAN ADJ
automatically peaks the preselector of the external mixer on a
desired signal on a trace. Set the trace to clear-write mode, place a
marker on the desired point, then press PRESEL AUTO PK. The
peaking routine zooms to zero span, peaks the preselector tracking,
then returns to the original span. To read the new preselector
peaking number, press PRESEL MAN ADJ.
The PRESEL AUTO PK softkey appears under three different
menus—AMPLITUDE, INTERNAL MIXER, and EXTERNAL MIXER. This
PRESEL AUTO PK softkey is only available for use with preselected
external mixing. Refer to the PRESEL AUTO PK softkey under
AMPLITUDE or the INTERNAL MIXER menu of functions for use with
internal mixers.
allows the user to adjust the external preselector tracking. Pressing
PRESEL MAN ADJ causes the preselector tracking number that
applies to the marker frequency to be displayed in the active function
block. If no marker is active, pressing PRESEL MAN ADJ
automatically activates a marker at the peak.
When the tracking number is displayed in the active function block,
it can be changed using the data keys, the step keys, or the knob.
This tracking number ranges from 0 to 255. It is initialized to 128
when entering the external mixer mode of operation or whenever the
band number is changed. Changing the tracking number affects the
data in the current data table, which may be a previously saved user
data table. The resulting value, after changing this function, is only
valid for the current band. Tosave this data, use the SAVE PRSEL PK
softkey found under SAVE. This overwrites any previously saved
preselector data regardless of whether that data was generated while
using internal or external preselectors.
The PRESEL MAN ADJ softkey appears under three different
menus—AMPLITUDE, INTERNAL MIXER, and EXTERNAL MIXER. This
PRESEL MAN ADJ softkey is only available for use with preselected
external mixing. Refer to the PRESEL MAN ADJ softkey under
AMPLITUDE or the INTERNAL MIXER menu of functions for use with
internal mixers.
Chapter 3 81
Page 78

Operation
Using 8563A, 8561B, 8560A, or 8560 E-Series Spectrum Analyzers
MARKER NORMAL u
PEAK SEARCH
NEXT PEAK
activates a single marker and places it at the center of the trace. This
softkey is also annotated as MARKER DELTA, if delta-marker mode
has been previously activated by the MARKER DELTA softkey under
the MKR menus.
If one marker is already on, no operation takes place. If two markers
are on (as in MARKER DELTA mode), pressing MARKER DELTA deletes
the anchor marker and makes the active one the new, single marker.
The marker reads the amplitude and the frequency (or relative time,
when the frequency span equals 0 Hz), and displays these values in
the active function block and in the upper-right corner of the display.
To move the marker, use either the knob, the step keys, or the data
keys.
The marker reads data from the currently active trace. (An active
trace is one in either the clear-write or max-hold mode; this may be
either trace A or trace B.) If both traces are active, or if both traces
are in view mode, the marker reads data from trace A.
places a marker on the highest point on a trace. The frequency and
amplitude of the marker are displayed in the upper-right corner of
the screen; PEAK SEARCH does not alter the active function.
moves the active marker to the next highest trace point relative to
the current marker position. This function finds successively lower
peaks when the key is pressed repeatedly. The peak excursion and
the peak threshold criteria are applied to determine the next highest
peak.
82 Chapter3
Page 79
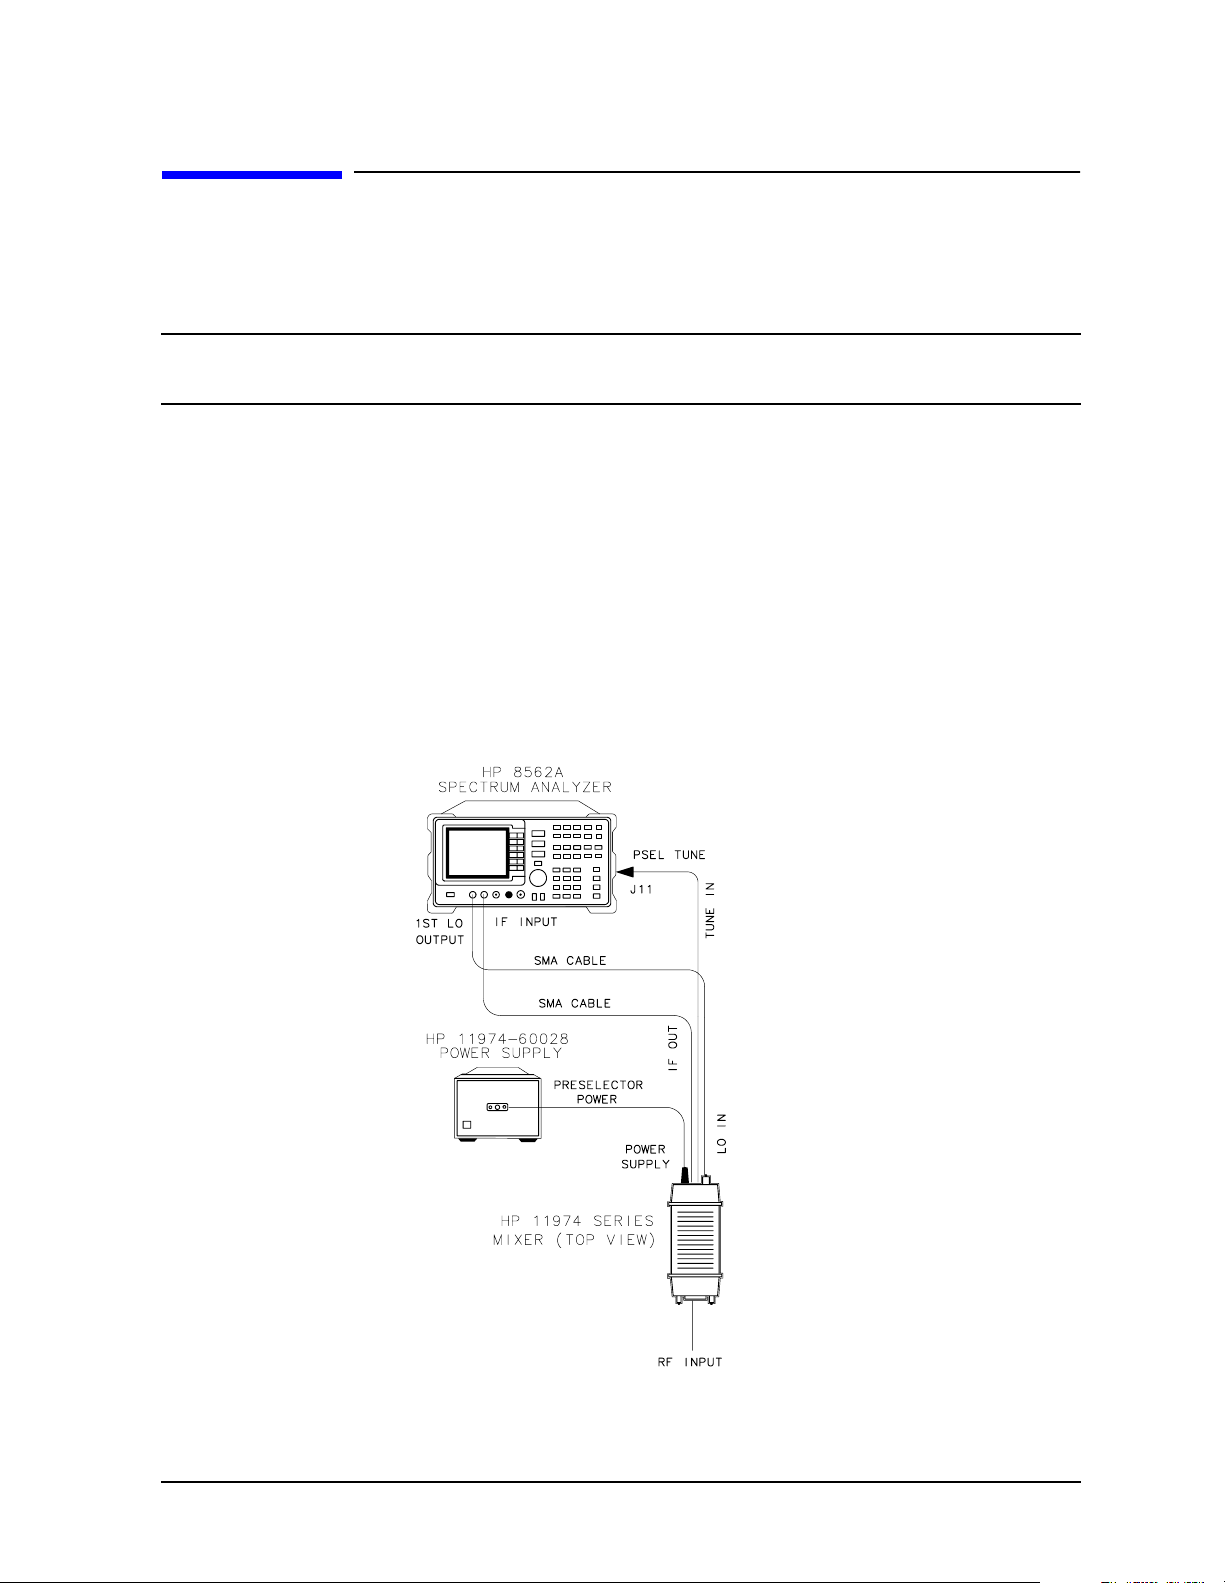
Operation
Operation Using 8561A/62A/62B Spectrum Analyzers
Operation Using 8561A/62A/62B Spectrum Analyzers
Preliminary Operation
NOTE For compatibility using an 8561A/62A/62B Spectrum Analyzer as a host to
the 11974, the appropriate Option K74 retrofit kit must be installed.
Equipment Connections
Connect the equipment as shown in Figure 3-8 on page 83 and use the following checklist
to verify the connections.
• 11974 LO IN to the analyzer 1ST LO OUTPUT (SMA, 5061-5458)
• 11974 IF OUT to the analyzer IF INPUT (SMA, 5061-5458)
• 11974 TUNE IN to the analyzer J11, PSEL TUNE (BNC, 8120-1839; BNC f-f adapter,
1250-0080; BNC, 8120-2582)
• 11974 POWER SUPPLY to 11974-60028 PRESELECTOR POWER
Figure 3-8 11974 Connections Using an 8561A/62A/62B
Chapter 3 83
Page 80

Operation
Operation Using 8561A/62A/62B Spectrum Analyzers
Frequency Tracking Calibration
Use this procedure to align the frequency of the 11974 tracking filter to the tuned
frequency of the spectrum analyzer. Follow this procedure anytime that the 11974 is
connected to a different spectrum analyzer. Periodically check the calibration.
1. Set the 11974 rear-panel switches 8563/61/60 and LEDS to the ON position, and the
other two switches to the OFF position, in order for the 11974 to properly scale the tune
ramp of the spectrum analyzer.
2. Enter the full-band selection mode by using the following key sequence:
EXT
FULL BAND
Use the ⇑ or ⇓ key until the desired band is reached.
3. Apply a frequency offset of 621.4 MHz by using the following key sequence:
FREQUENCY
OFFSET
Enter 621.4 and terminate with MHz. (An F should appear at the left side of the
display screen to indicate that an offset is applied.)
4. Set the spectrum analyzer to zero span by pressing
SPAN ZERO SPAN.
NOTE Due to the repetitive nature of this procedure, it may be helpful to save the
center-frequency settings in unused state registers as indicated in step 5 and
step 7.
5. Set the spectrum analyzer center frequency by pressing
FREQUENCY CENTER FREQ and
entering the corresponding value for the mixer listed below, then save this setting in an
unused register.
for an 11974A: 26.5 GHz
for an 11974Q: 33.0 GHz
for an 11974U: 40.0 GHz
for an 11974V: 50.0 GHz
6. On the rear-panel of the 11974, adjust the corresponding potentiometer for the mixer
listed below until one or both of the green LEDs are lit.
for an 11974A: “26.5 GHz SET”
for an 11974Q: “33.0 GHz SET”
for an 11974U: “40.0 GHz SET”
for an 11974V: “50.0 GHz SET”
84 Chapter3
Page 81

Operation
Operation Using 8561A/62A/62B Spectrum Analyzers
7. Change the spectrum analyzer center frequency to the value indicated below, then save
this setting in an unused register:
for an 11974A: 40 GHz
for an 11974Q: 50 GHz
for an 11974U: 60 GHz
for an 11974V: 75 GHz
8. On the rear-panel of the 11974, adjust the corresponding potentiometer for the mixer
listed below until one or both of the green LEDs are lit.
for an 11974A: “40 GHz SET”
for an 11974Q: “50 GHz SET”
for an 11974U: “60 GHz SET”
for an 11974V: “75 GHz SET”
9. Repeat step 5 through step 8 until green lights are lit at both frequencies without any
additional adjustments.
Operation
Band Selection
1. If necessary, mate the 11974 to the spectrum analyzer being used for preselected
external mixing by using the Frequency Tracking Calibration procedure above.
2. Use the following key sequence to enter the external mixing mode and to select the
desired band of operation.
EXT
FULL BAND
Use the ⇑ or ⇓ key until the desired band is reached.
NOTE The above band-selection key sequence must be used to enter the external
mixing band of operation. Do not enter in the center frequency of the band
directly.
3. Apply a frequency offset of 621.4 MHz by using the following key sequence:
FREQUENCY
OFFSET
Enter 621.4 and terminate with MHz. (An F should appear at the left side of the
display screen to indicate that an offset is applied.)
Chapter 3 85
Page 82

Operation
Operation Using 8561A/62A/62B Spectrum Analyzers
Amplitude Calibration
Enter the conversion loss table at the preset frequencies from either the calibration label
on the bottom of the 11974 or the supplied calibration sheet, by using the following key
sequence. (Note: the analyzer automatically interpolates between the preset frequencies.)
EXT
AMPTD CORRECT
CNV LOSS VS FREQ
Enter the conversion loss value of the indicated preset frequency, then terminate the
entry with
dB.
Advance to the next preset frequency by pressing
indicated frequency. Continue until the highest frequency is reached, then use the
⇓ keys to scan through the frequencies to verify or edit the conversion-loss values
⇑ and enter the conversion loss of the
⇑ and
entered.
NOTE For V band, it may be necessary to first use the following key sequence to
initialize the average of the conversion loss versus frequency table near the
values for this band.
•
EXT
• AMPTD CORRECT
• AVERAGE CNV LOSS
• Enter 47 and terminate with dB.
Preselector Peaking
There is no
PRESEL AUTO PK or PRESEL MAN ADJ softkey function for the 8561A/62A/62B,
when in the external mixing mode. Therefore, to maximize the amplitude of the desired
signal, use an adjustment tool to vary the corresponding low-frequency potentiometer
located on the rear panel. The low-frequency potentiometer for mixer bands are listed
below:
for an 11974A: “26.5 GHz SET”
for an 11974Q: “33.0 GHz SET”
for an 11974U: “40.0 GHz SET”
for an 11974V: “50.0 GHz SET”
86 Chapter3
Page 83

Operation
Operation Using 8561A/62A/62B Spectrum Analyzers
Sweep Time Considerations
For optimum amplitude accuracy, the sweep rate must be less than 40 MHz/ms, according
to the table below.
Table 3-4 Minimum Sweep Time
Frequency Span (GHz) Minimum Sweep Time (ms)
25 625
20 500
17 425
15 375
13.5 338
10 250
5 125
< 2 50
General Description of 8561A/62A/62B External-Mixing Functions
FULL BAND allows you to select a commonly-used frequency band above 18 GHz.
These bands are shown in Table 3-5 on page 88. Use the step keys or
the knob to select a desired frequency band; the selected band
appears in the active function block. Activating FULL BAND also
activates the harmonic-lock function.
AMPTD CORRECT
AVERAGE CNV LOSS
CNV LOSS VS FREQ
displays a menu of functions that set conversion losses and flatness
data.
displays the mean conversion loss for the current harmonic and
allows you to enter new conversion loss data. In a full frequency band
(such as A band), the mean conversion loss is defined as the
minimum loss plus the maximum loss for that band divided by two.
To change the maximum and minimum values, use the
CNV LOSS VS FREQ softkey. Any change to the average conversion
loss also affects the flatness data, which is described below.
The default conversion loss value for each band is 30 dB.
displays the stored conversion loss for a specific frequency in the
current band. This allows amplitude correction to be entered to
compensate for changes in conversion loss with frequency. Toenter a
new value, use the data keys. To change the displayed frequency, use
the step keys. Any changes to the data also affect the mean
conversion loss stored under AVERAGE CNV LOSS. Table 3-5 on
page 88 shows the number of flatness points for each band and the
default flatness values. To view the correction, connect a 310.7 MHz
signal of a known amplitude (approximately −30 dBm) to the IF
input and set the analyzer to sweep the associated band.
Chapter 3 87
Page 84

Operation
Operation Using 8561A/62A/62B Spectrum Analyzers
Table 3-5 Flatness Points and Conversion Losses for Frequencies above 18 GHz
Frequency
Band
Frequency Range (GHz) Number of
Flatness Points
Point
Spacing
K 18.0 to 26.5 6 2 GHz 30 dB
A 26.5 to 40.0 8 2 GHz 30 dB
Q 33.0 to 50.0 7 3 GHz 30 dB
U 40.0 to 60.0 6 4 GHz 30 dB
V 50.0 to 75.0 6 5 GHz 30 dB
E 60.0 to 90.0 7 5 GHz 30 dB
W 75.0 to 110.0 8 5 GHz 30 dB
F 90.0 to 140.0 6 10 GHz 30 dB
D 110.0 to 170.0 7 10 GHz 30 dB
G 140.0 to 220.0 9 10 GHz 30 dB
Y 170.0 to 260.0 7 15 GHz 30 dB
J 220.0 to 325.0 8 15 GHz 30 dB
MARKER NORMAL
activates a single marker and places it at the center of the trace. This
softkey is also annotated as MARKER DELTA, if delta-marker mode
has been previously activated by the MARKER DELTA softkey under
the Marker menus.
Default Conversion
Loss
PEAK SEARCH
If one marker is already on, no operation takes place. If two markers
are on (as in MARKER DELTA mode), pressing MARKER DELTA deletes
the anchor marker and makes the active one the new, single marker.
The marker reads the amplitude and the frequency (or relative time,
when the frequency span equals 0 Hz), and displays these values in
the active function block and in the upper-right corner of the display.
To move the marker, use either the knob, the step keys, or the data
keys.
The marker reads data from the currently active trace. (An active
trace is one that is in either the clear-write or max-hold mode; this
may be either trace A or trace B.) If both traces are active, or if both
traces are in view mode, the marker reads data from trace A.
places a marker on the highest point on a trace. The frequency and
amplitude of the marker are displayed in the upper-right corner of
the screen; PEAK SEARCH does not alter the active function.
88 Chapter3
Page 85

4 Performance Tests
89
Page 86

Performance Tests
Introduction
Introduction
This section contains instructions for testing the performance of the 11974 Series
Preselected Millimeter Mixers. Performance tests are used to check the mixers at incoming
inspection and for periodic evaluation. The tests verify the specifications listed for the
11974 Series in Table 1-1 on page 19.
Test equipment required for the performance tests is listed in the following tables:
11974A—Table 4-1 on page 93,
11974Q—Table 4-2 on page 94,
11974U—Table 4-3 on page 95,
11974V—Table 4-4 on page 96.
You may use test instruments other than those listed, provided their performance equals
or exceeds the critical specifications in these tables.
90 Chapter4
Page 87

Performance Tests
Test Record Summary
Test Record Summary
The performance test record summary (Table 4-6 on page 126), which is used for recording
and summarizing the performance test data, at the end of this chapter. The test record
summary includes the measurement uncertainty for each band, calculated as the root sum
square of the error terms. A test record summary has been provided for each band,
therefore use the appropriate pages in Table 4-6 for your band.
Data tables (Table 4-7 on page 131, Table 4-8 on page 134, Table 4-9 on page 135,
Table 4-10 on page 136, and Table 4-11 on page 136) immediately follow the performance
test record summary. Make copies of these tables and use them as worksheets when
performing the tests. The data tables can then be used to summarize the results for the
performance test record summary.
Chapter 4 91
Page 88

Performance Tests
Performance Test Procedures
Performance Test Procedures
Each performance test is contained in a single paragraph. All specifications for the
parameters being measured are described in Table 1-1 on page 19. This is followed by a
general description of the test and any special instructions or problem areas. Appropriate
test setup illustrations are included in this section and are referenced in the test
procedures.
NOTE The performance test procedures must be performed in the order that they
appear.
“1. Conversion Loss” on page 101
“2. Image Rejection Test” on page 106
“3. Multiple Response Rejection Test” on page 110
“4. Displayed Average Noise Level” on page 118
“5. 3 dB Bandwidth” on page 122
92 Chapter4
Page 89

Performance Tests
Performance Test Procedures
Table 4-1 Recommended Test Equipment for 11974A
Instrument Critical Specifications Recommended
Model
Spectrum Analyzer LO and IF ranges compatible with 11974A
SWEEP + TUNE voltage compatible with
11974A.
Synthesized Sweeper Frequency: 13.25 to 20 GHz
8566B
w/serialprefix 2948
or later
8340B
External leveling capability
Subharmonics and multiples thereof: <−25 dBc
Amplifier Frequency Range: 3 to 5 GHz
11975A
Output Level: +16 dBm leveled
Amplifier 15 dB gain from 13.25 to 20 GHz
8349B
Compatible with mm-wave source module
Non-harmonic spurious: <−50 dBc
Power Meter Compatible with thermistor mount 432A
Thermistor Mount SWR: <2.0 from 26.5 to 40 GHz R486A
Power Sensor SWR: <1.2 at 5 GHz 8481A
Power Meter Compatible with power sensor 436A
Directional Coupler Coupling: 10 dB
R752CS
a
Directivity: >40 dB
Primary line SWR: 1.04
Auxiliary arm SWR: 1.05
Isolator Insertion Loss: <1.5 dB
R365A
Isolation: >25 dB
SWR: <1.4
Millimeter-Wave
Source Module
Output power: +2 dBm leveled
Output SWR: <2.0
83554A
Harmonically related spurious signals: <−20 dBc
Waveguide Straights 5 cm minimum
R896B
SWR: <1.016
a. If an 8340A is used, the 1.0 V/GHz output will have to be modified to a 0.5 V/GHz output
for proper display accuracy, leveling flatness, and harmonic suppression. Provided with
your mm-wave source module is a set of modification instructions. This modification
procedure will enable you to properly convert your 8340A to a 0.5 V/GHz output.
Chapter 4 93
Page 90

Performance Tests
Performance Test Procedures
Table 4-2 Recommended Test Equipment for 11974Q
Instrument Critical Specifications Recommended
Model
Spectrum Analyzer LO and IF ranges compatible with 11974Q
SWEEP + TUNE voltage compatible with
11974Q.
Synthesized Sweeper Frequency: 11 to 17 GHz
8566B
w/serialprefix2948
or later
8340B
External leveling capability
Subharmonics and multiples thereof: <−25 dBc
Amplifier Frequency Range: 3 to 5 GHz
11975A
Output level: +16 dBm leveled
Amplifier 15 dB gain from 11 to 17 GHz
8349B
Compatible with mm-wave source module
Non-harmonic spurious: <−50 dBc
Power Meter Compatible with thermistor mount 432A
Thermistor Mount SWR: <2.0 from 33 to 50 GHz Hughes
45772H-1100
Power Sensor SWR: <1.2 at 5 GHz 8481A
Power Meter Compatible with power sensor 436A
a
Directional Coupler Coupling: 10 dB
Q752C
Directivity: >40 dB
Primary line SWR: <1.05
Auxiliary arm SWR: <1.1
Isolator Insertion Loss: <1.6 dB
Q365A
Isolation: >25 dB
SWR: <1.4
Millimeter-Wave
Source Module
Output power: +2 dBm leveled
Output SWR: <2.0
83555A
Harmonically related spurious signals: <−20 dBc
Waveguide Straights 5 cm minimum
Q896B
SWR: <1.016
a. If an 8340A is used, the 1.0 V/GHz output will have to be modified to a 0.5 V/GHz output
for proper display accuracy, leveling flatness, and harmonic suppression. Provided with
your mm-wave source module is a set of modification instructions. This modification
procedure will enable you to properly convert your 8340A to a 0.5 V/GHz output.
94 Chapter4
Page 91

Performance Tests
Performance Test Procedures
Table 4-3 Recommended Test Equipment for 11974U
Instrument Critical Specifications Recommended
Model
Spectrum Analyzer LO and IF ranges compatible with 11974U
SWEEP + TUNE voltage compatible with
11974U.
Synthesized Sweeper Frequency: 13 to 20 GHz
8566B
w/serialprefix2948
or later
8340B
External leveling capability
Subharmonics and multiples thereof: <−25 dBc
Amplifier Frequency Range: 4 to 6 GHz
11975A
Output Level: +16 dBm leveled
Amplifier 15 dB gain from 13 to 20 GHz
8349B
Compatible with mm-wave source module
Non-harmonic spurious: <−50 dBc
Power Meter Compatible with thermistor mount 432A
Thermistor mount SWR: <2.0 from 40 to 60 GHz Hughes
45773H-1100
Power Sensor SWR: <1.2 at 5 GHz 8481A
Power Meter Compatible with power sensor 436A
a
Directional Coupler Coupling: 10 dB
U752C
Directivity: >39 dB
Primary line SWR: 1.06
Auxiliary arm SWR: 1.1
Isolator Insertion Loss: <1.8 dB
U365A
Isolation: >25 dB
SWR: <1.4
Millimeter-Wave
Source Module
Output power: +2 dBm leveled
Output SWR: <2.0
83556A
Harmonically related spurious signals: <−20 dBc
Waveguide Straights 5 cm minimum
U896B
SWR: <1.016
a. If an 8340A is used, the 1.0 V/GHz output will have to be modified to a 0.5 V/GHz output
for proper display accuracy, leveling flatness, and harmonic suppression. Provided with
your mm-wave source module is a set of modification instructions. This modification
procedure will enable you to properly convert your 8340A to a 0.5 V/GHz output.
Chapter 4 95
Page 92

Performance Tests
Performance Test Procedures
Table 4-4 Recommended Test Equipment for 11974V
Instrument Critical Specifications Recommended
Model
Spectrum Analyzer LO and IF ranges compatible with 11974V
SWEEP + TUNE voltage compatible with
11974V.
Synthesized Sweeper Frequency: 12.5 to 19 GHz
External leveling capability
Subharmonics and multiples thereof: <−25 dBc
Amplifier Frequency Range: 4 to 6 GHz
Output level: +16 dBm leveled
Amplifier 15 dB gain from 13 to 20 GHz
Compatible with mm-wave source module
Non-harmonic spurious: <−50 dBc
Power Meter Compatible with thermistor mount 432A
Thermistor Mount SWR: <2.0 from 50 to 75 GHz Hughes
Power Sensor SWR: <1.2 at 5 GHz 8481A
Power Meter Compatible with power sensor 436A
8566B
w/serialprefix 2948
or later
8341B
Option 003
11975A
8349B
45774H-1100
Directional Coupler Coupling: 10 dB
Directivity: >36 dB
Primary line SWR: 1.08
Auxiliary arm SWR: 1.14
Isolator Insertion Loss: <2.0 dB
Isolation: >25 dB
SWR: <1.5
Millimeter-Wave
Source Module
Waveguide Straights 5 cm minimum
Output power: +2 dBm leveled
Output SWR: <2.0
Harmonically related spurious signals: <−20 dBc
SWR: <1.02
V752C
V365A
83557A
V896B
96 Chapter4
Page 93
Performance Tests
Performance Test Procedures
Table 4-5 Recommended Accessories for All Bands
Accessory Critical Specifications Recommended
Model
Adapter (1 required) SMA (f) to Type N (f) 1250-1772
Adapter (1 required) Type N (m) to APC 3.5 (f) 1250-1744
Cables (3 required) Connectors: SMA (m) 5061-5458
Cable (1 required) Connectors: APC 3.5 (m) 11500E
Cables (5 required) Connectors: BNC (m) 10503A
Chapter 4 97
Page 94
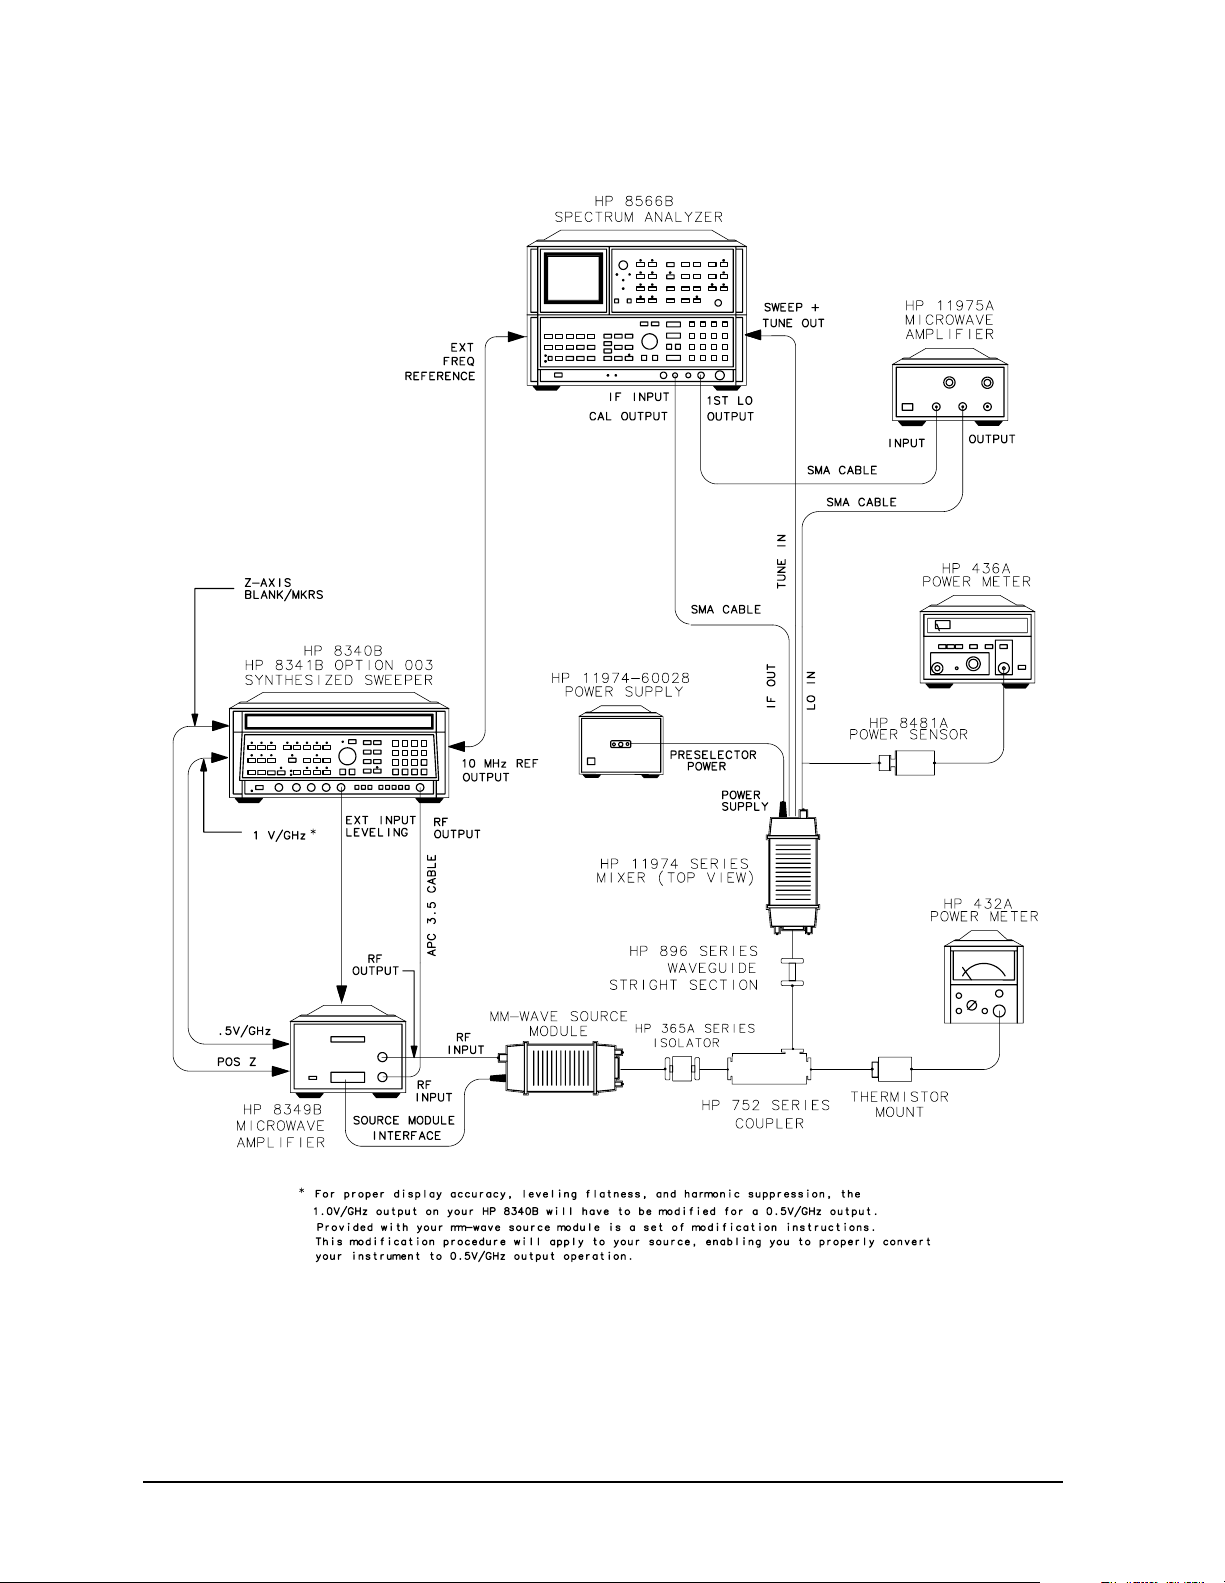
Performance Tests
Performance Test Procedures
Figure 4-1 Performance Tests Setup
98 Chapter4
Page 95

Performance Tests
Frequency Tracking Calibration with an 8566B Spectrum Analyzer
Frequency Tracking Calibration with an 8566B Spectrum
Analyzer
NOTE In order for the 8566B to be compatible with the 11974 Series Preselected
Millimeter Mixer, it must have a serial prefix of 2948 or later. If not, retrofit
kit 8566B K74 must be installed before using an 8566B for the testing of the
11974.
1. Connect the IF OUT of the 11974 to the IF INPUT of the spectrum analyzer, the
spectrum analyzer 1ST LO OUTPUT to the INPUT of the 11975A Amplifier, and the
11975A Amplifier OUTPUT to the LO IN of the 11974.
CAUTION When you are using an 11975A Amplifier with an 11974, you must set the
amplifier rear-panelALC switch to ON before you connect the amplifier to the
test setup. If the ALC switch is left in the OFF position, the amplifier output
power is high enough to destroy the mixer diodes.
2. Connect the SWEEP + TUNE OUT of the spectrum analyzer to the TUNE IN of the
11974.
3. Set the 11974 rear-panel switches
8563A/61B/60A and 70907B switches to the OFF position, for the 11974 to properly scale
the tune ramp of the analyzer.
4. Set the spectrum analyzer to the correct millimeter band using the following key
sequence for the appropriate mixer:
for an 11974A: SHIFT ⇑⇑
for an 11974Q: SHIFT ⇑⇑⇑
for an 11974U: SHIFT ⇑⇑⇑⇑
for an 11974V: SHIFT ⇑⇑⇑⇑⇑
5. On the spectrum analyzer, set the preselector DAC to 32 (the center of its 0–63 range)
by pressing
6. Set the spectrum analyzer to a frequency span of 0 Hz by pressing
FREQUENCY SPAN 0 Hz.
NOTE Due to the repetitive nature of this procedure, it may be helpful to save the
SHIFT GHz 32 Hz.
center-frequency settings as indicated in step 7 and step 9 in unused state
registers.
8566B and LEDS to the ON position, and the
Chapter 4 99
Page 96

Performance Tests
Frequency Tracking Calibration with an 8566B Spectrum Analyzer
7. Set the spectrum analyzer center frequency to the low end of the band by pressing
CENTER FREQUENCY and entering the corresponding value for the mixer listed below.
Save this setting in an unused register.
for an 11974A: 26.5 GHz
for an 11974Q: 33.0 GHz
for an 11974U: 40.0 GHz
for an 11974V: 50.0 GHz
8. On the rear panel of the 11974, adjust the corresponding potentiometer for the mixer
listed below, until one or both of the green LEDs are lit.
for an 11974A: “26.5 GHz Set”
for an 11974Q: “33.0 GHz Set”
for an 11974U: “40.0 GHz Set”
for an 11974V: “50.0 GHz Set”
9. Change the spectrum analyzer center frequency to the high end of the band as indicated
below, then save this setting in an unused register:
for an 11974A: 40 GHz
for an 11974Q: 50 GHz
for an 11974U: 60 GHz
for an 11974V: 75 GHz
10.On the rear panel of the 11974, adjust the corresponding potentiometer for the mixer
listed below, until one or both of the green LEDs are lit.
for an 11974A: “40 GHz Set”
for an 11974Q: “50 GHz Set”
for an 11974U: “60 GHz Set”
for an 11974V: “75 GHz Set”
11.Repeat step 7 through step 10 until the green LEDs are lit at both frequencies without
additional adjustments.
NOTE Upon completion of this adjustment procedure, and before taking data, use
the spectrum analyzer preselector-peak function to peak the 11974 filter on
signals to be measured.
100 Chapter4
Page 97

Performance Tests
1. Conversion Loss
1. Conversion Loss
Description
The conversion loss is checked at a nominal local-oscillator power level. A known input
power is applied to the input of the 11974. The IF output power is measured on an 8566B
Spectrum Analyzer. From the measurements, the conversion loss is calculated. The
calibration factors versus frequency of the millimeter-wave power-meter sensor and the
coupling factors versus frequency of the coupler are needed in this measurement.
Procedure
1. Connect an SMA cable from the 1ST LO OUTPUT of the spectrum analyzer to the
INPUT of the 11975A Amplifier. Connect a second SMA cable to the OUTPUT of the
amplifier.
2. Connect the 8481A Power Sensor to the power-meter sensor cable, then zero and
calibrate the 436A Power Meter.
3. Set the spectrum analyzer controls as follows:
SHIFT ⇑⇑⇑⇑ (selects U Band)
FREQUENCY SPAN. . . . . . . . . . . . . . . . . . . . . . . . . . . . . . . . . . . . . . . . . . .0 Hz
CENTER FREQUENCY (sets the LO frequency to 5.0 GHz). . . . . . .50.3 GHz
CAUTION When you are using an 11975A Amplifier with an 11974, you must set the
amplifier rear-panelALC switch to ON before you connect the amplifier to the
test setup. If the ALC switch is left in the OFF position, the amplifier output
power is high enough to destroy the mixer diodes.
4. On the 11975A Amplifier, set the rear-panel ALC switch to ON. Connect the 8481A
Power Sensor to the free end of the cable installed on the OUTPUT connector of the
amplifier listed in step 1. Set the 436A Power-Meter Cal Factor % to the appropriate
value for a frequency of 5 GHz.
5. Adjust the amplifier OUTPUT POWER LEVEL for a reading of +15.2 dBm ±0.1 dBm on
the power meter.
6. Set the 432A Power Meter Cal Factor % to 100 percent.
7. Connect the equipment as shown in Figure 4-1 on page 98.
Chapter 4 101
Page 98

Performance Tests
1. Conversion Loss
CAUTION Turn off the ac power on the 8349B Amplifier prior to connecting or
disconnecting the source module interface cable.
Turn off the ac power on the 11974-60028 Preselector Power Supply when
either connecting or disconnecting the 11974 from it.
On the 11974 rear panel, set the instrument select switches to the
appropriate settings before applying power to the 11974.
8. Turn off the RF power on the synthesized sweeper and zero the 432A Power Meter.
9. Enter the appropriate millimeter-wave source module frequency multiplication factor
into the synthesized sweeper by pressing
SHIFT START FREQ and then press the
following keys (on the synthesized sweeper) for the appropriate band listed below:
for an 11974A:
2Hz
for an 11974Q: 3Hz
for an 11974U: 3Hz
for an 11974V: 4Hz
10.Set the synthesized sweeper for a CW signal at the frequency listed below:
for an 11974A: 26.5 GHz
for an 11974Q: 33.0 GHz
for an 11974U: 40.0 GHz
for an 11974V: 50.0 GHz
11.Set the synthesized sweeper frequency step to 500 MHz by pressing
12.Activate external leveling on the synthesized sweeper by pressing
SHIFT CF 500 MHz.
XTAL.
13.Adjust the output power of the synthesized sweeper for a reading of approximately
0 dBm on the 8349B display.
14.Set the spectrum analyzer to the appropriate millimeter band by using the appropriate
key sequence listed below:
for an 11974A:
SHIFT ⇑⇑
for an 11974Q: SHIFT ⇑⇑⇑
for an 11974U: SHIFT ⇑⇑⇑⇑
for an 11974V: SHIFT ⇑⇑⇑⇑⇑
15.Set the spectrum analyzer controls as follows:
SHIFT, 5, MHz, 0, and dB (sets external mixer conversion loss to 0 dB)
FREQUENCY SPAN . . . . . . . . . . . . . . . . . . . . . . . . . . . . . . . . . . . . . . . . 5 MHz
ENTER dB/DIV. . . . . . . . . . . . . . . . . . . . . . . . . . . . . . . . . . . . . . . . . . . . . . . 5 dB
CF STEP SIZE . . . . . . . . . . . . . . . . . . . . . . . . . . . . . . . . . . . . . . . . . . . 500 MHz
102 Chapter4
Page 99

Performance Tests
1. Conversion Loss
16.Set the reference level of the spectrum analyzer by pressing REFERENCE LEVEL and
entering the corresponding value for the appropriate band listed below:
for an 11974A: −40 dBm
for an 11974Q: −40 dBm
for an 11974U: −40 dBm
for an 11974V: −55 dBm
17.Set the center frequency of the spectrum analyzer by pressing
CENTER FREQUENCY and
entering the corresponding value for the appropriate band listed below:
for an 11974A: 26.5 GHz
for an 11974Q: 33 GHz
for an 11974U: 40 GHz
for an 11974V: 50 GHz
18.On the spectrum analyzer, press MARKER
PEAK SEARCH and PRESEL PEAK.
19.Record the following values in Table 4-7 on page 131.
Marker Frequency
Marker Amplitude
Power Meter Reading
Cal Factor % or Correction Factor (dB)
Directional Coupler Coupling Factor
NOTE For the purpose of this measurement, the directional coupler coupling factor
is defined as the ratio of the power at the output flange to the power at the
coupled flange.
Chapter 4 103
Page 100

Performance Tests
1. Conversion Loss
20.Calculate the conversion loss (CL) of the 11974 with the equations given below.
If the power meter calibration factor is given in % or decimal form, for example, 93% or
0.93, then:
CL = Power Meter Reading − 10 × log (Cal Factor) − SA Marker Amplitude − Coupling Factor
If the power meter correction factor is given in dB, then:
CL = Pwr Mtr Reading + Pwr Mtr Correction Factor − SA Marker Amplitude − Coupling Factor
For Example:
Power Meter Reading = −0.03 dBm
Cal Factor = 94.8%
or
Correction Factor = 0.23 dB
Spectrum Analyzer Reading = −44.78 dBm
Coupling Factor = 8.93 dB
then:
Conversion Loss = (−0.03) − 10 × log(.948) − (−44.78 dBm) −8.93 dB = 36.05 dB
or
Conversion Loss = (−0.03) + (0.23 dB) − (−44.78 dBm) −8.93 dB = 36.05 dB.
Record the conversion loss in Table 4-7 on page 131.
NOTE The conversion loss indicated on the 11974 calibration label includes the loss
in the IF cable. If another cable other than the specified cable is used, then
the loss in that cable must be compensated for when making amplitude
measurements.
21.Increase the frequency of the synthesized sweeper 500 MHz by pressing
22.Turn off the RF power on the synthesized sweeper by pressing
RF and zero the 432A
CW ⇑.
Power Meter, then turn the synthesized sweeper RF power back on again.
23.On the spectrum analyzer, press
CENTER FREQUENCY ⇑ to increase the spectrum
analyzer frequency.
24.On the spectrum analyzer, press MARKER
104 Chapter4
PEAK SEARCH and PRESEL PEAK.
 Loading...