

Page 1

HP 37718A
Communications
Performance Analyzer
User’s Guide
DSn/SONET
Operation
Page 2

Copyright HewlettPackard Ltd.1998
All rights reserved.
Reproduction,
adaption, or
translation without
prior written
permission is
prohibited, except as
allowed under the
copyright laws.
HP Part No.
37718-90004
First edition, 09/98
Printed in U.K.
Warranty
The information
contained in this
document is subject to
change without notice.
Hewlett-Packardmakes
no warranty of any
kindwithregardto this
material, including,
but not limited to, the
implied warranties or
merchantability and
fitness for a particular
purpose.
Hewlett-Packard shall
not be liable for errors
contained herein or for
incidental or
consequentialdamages
in connection with the
furnishing,
performance, or use of
this material.
WARNING
WarningSymbols Used
on the Product
!
The product is marked
with this symbol when
the usershould refer to
the instruction manual
in order to protect the
apparatus against
damage.
The product is marked
with this symbol to
indicate that
hazardous voltages are
present
The product is marked
with this symbol to
indicate that a laser is
fitted. The user should
refer tothe laser safety
information in the
Calibration Manual.
Hewlett-Packard Limited
Telecommunications Networks Test Division
South Queensferry
West Lothian, Scotland EH30 9TG
Page 3

User’s Guide DSn/SONET Operation
HP 37718A Communications
Performance Analyzer
Page 4

About This Book
This book tells you how to select the features that you want to use for your test.
The selections available are presented in the following groups:
• Transmit and receive interfaces
• Testfeatures,forexample,theaddition oferrors andalarmsto thetest
signal
• Measurements including test timing
• Storing, logging and printing results with general printer information
• Using instrument and disk storage
• Using the “Other” features.
The selections available will depend on the options fitted to your
instrument. The examples given in this book cover all options and
therefore may include selections which are not available on your
instrument.
iv
Page 5

Contents
1 Setting the Interfaces
Setting DSn Transmit Interface 10
Setting SONET Transmit Interface 12
Setting SONET THRU Mode 15
Using Smart Test 17
Setting DSn Receive Interface 19
Setting SONET Receive Interface 21
2 Selecting Test Features
Using Transmit Overhead Setup 24
Using Receive Overhead Monitor 26
Setting Overhead Trace Messages 28
Generating Overhead Sequences 29
Using Receive Overhead Capture 31
Adding Frequency Offset to SONET Signal 33
Adding Frequency Offset to the DSn Signal 35
Setting up Signaling Bits 36
Setting Transmit Structured Payload/Test Signal 39
Setting Receive Structured Payload/Test Signal 41
Setting Transmit N x 64 kb/s/N x 56 kb/s
Structured Payload/Test Signal 42
Setting Receive N x 64 kb/s/N x 56 kb/s
Structured Payload/Test Signal 44
Inserting an External DSn Payload/Test Signal 45
Dropping an External Payload/Test Signal 48
Adding Errors & Alarms at the SONET Interface 51
Adding Errors & Alarms to the DSn Interface/DSn Payload 52
Using FEAC Codes 53
v
Page 6

Contents
Setting DSn Spare Bits 55
Adding Pointer Adjustments 56
Using Pointer Graph Test Function 63
Stressing Optical Clock Recovery Circuits 65
Generating Automatic Protection Switch Messages 66
Inserting & Dropping Data Communications Channel 67
3 Making Measurements
Using Overhead BER Test Function 70
Test Timing 71
Making SONET Analysis Measurements 72
Making DSn Analysis Measurements 73
Measuring Frequency 74
Measuring Optical Power 75
Measuring Round Trip Delay 76
Monitoring Signaling Bits 78
Measuring Service Disruption Time 79
Performing a SONET Tributary Scan 82
Performing an SONET Alarm Scan 84
Performing a DSn Alarm Scan 85
4 Storing, Logging and Printing
Saving Graphics Results to Instrument Store 88
Recalling Stored Graph Results 89
Viewing the Bar Graph Display 91
Viewing the Graphics Error and Alarm Summaries 93
vi
Page 7

Contents
Logging Graph Displays 95
Logging Results 97
Logging on Demand 100
Logging Results to Parallel (Centronics) Printer 102
Logging Results to HP-IB Printer 103
Logging Results to Internal Printer 104
Logging Results to RS-232-C Printer 105
Printing Results from Disk 106
Connecting an HP DeskJet Printer to a Parallel Port 107
Changing Internal Printer Paper 108
Cleaning Internal Printer Print Head 111
5 Using Instrument and Disk Storage
Storing Configurations in Instrument Store 114
Titling Configuration in Instrument Store 115
Recalling Configurations from Instrument Store 116
Formatting a Disk 117
Labeling a Disk 118
Managing Files and Directories on Disk 119
Saving Graphics Results to Disk 126
Saving Data Logging to Disk 128
Saving Configurations to Disk 129
Recalling Configuration from Disk 130
Recalling Graphics Results from Disk 131
Copying Configuration from Instrument Store to Disk 132
Copying Configuration from Disk to Instrument Store 134
Copying Graphics Results from Instrument Store to Disk 136
vii
Page 8

Contents
6 Selecting and Using "Other" Features
Coupling Transmit and Receive Settings 140
Setting Time & Date 141
Enabling Keyboard Lock 142
Enabling Beep on Received Error 143
Suspending Test on Signal Loss 144
Setting Error Threshold Indication 145
Setting Screen Brightness and Color 146
Dumping Display to Disk 147
Running Self Test 149
7 STS-1 SPE Background Patterns
8 ETSI/ANSI Terminology
ETSI/ANSI Conversion and Equivalent Terms 156
viii
Page 9

1
1 Setting the Interfaces
This chapter tells you how to set the instrument
interfaces to match the network being tested.
Page 10

Setting the Interfaces
Setting DSn Transmit Interface
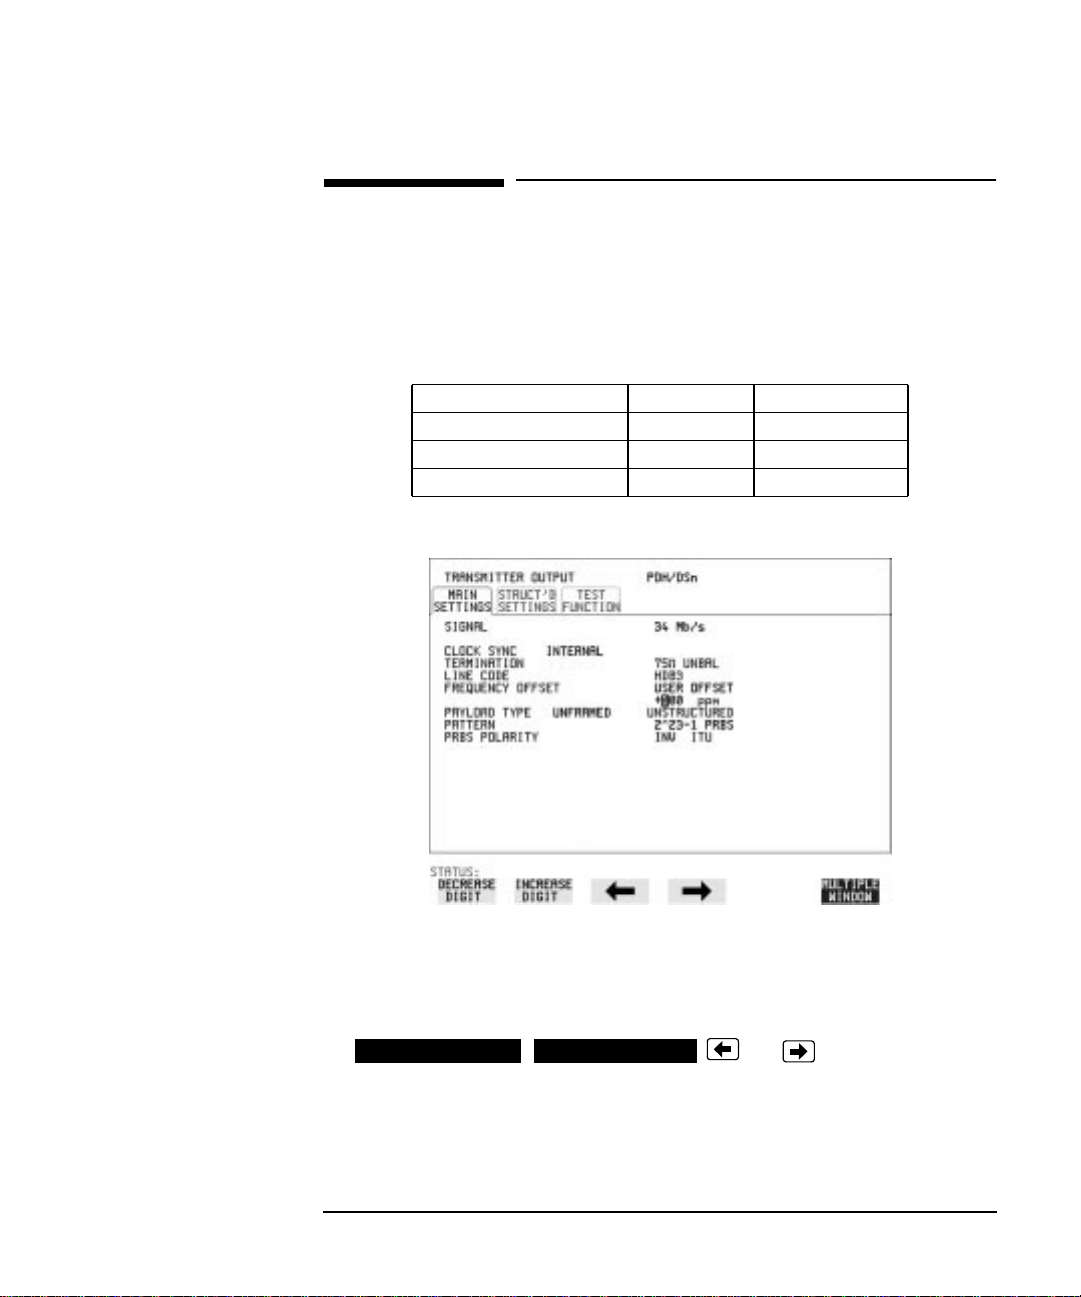
Description DSn transmit interface settings should match network equipment
settings of Rate, Termination and Line Code and determine the Payload
to be tested.
TIP: To set the Transmitter and Receiver to the same interface settings
choose .
OTHER
SETTINGS CONTROL COUPLED
HOW TO: 1 Choose the required SIGNAL rate.
Rates of DS1, DS3, 2 Mb/s and 34 Mb/s are available.
2 Choose the required CLOCK SYNC (clock synchronization source).
3 If DS1 or DS3 is chosen, choose the required interface level.
4 If you have chosen 2 Mb/s as the SIGNAL rate, choose the required
TERMINATION. (At all other signal rates the impedance is fixed).
5 If you have chosen 2 Mb/s or DS1 as the SIGNAL rate, choose the
required LINE CODE. (At 34 Mb/s and DS3 coding is fixed.)
10
Page 11

Setting the Interfaces
Setting DSn Transmit Interface
6 If required, choose the FREQUENCY OFFSET value.
See “Adding Frequency Offset to SONET Signal” page 33.
7 Choose the required PAYLOAD TYPE.
If STRUCTURED is required FRAMED must be chosen.
IfStructuredis chosenthe DSntest signalmustbe setup. See“Setting
Transmit Structured Payload/Test Signal” page 39.
If you have chosen 2 Mb/s, DS1 or DS3 as the DSn signal rate, the
Framed choice is expanded to provide a menu of framing types.
8 Choose the PATTERN type and the PRBS POLARITY.
11
Page 12
Setting the Interfaces
Setting SONET Transmit Interface
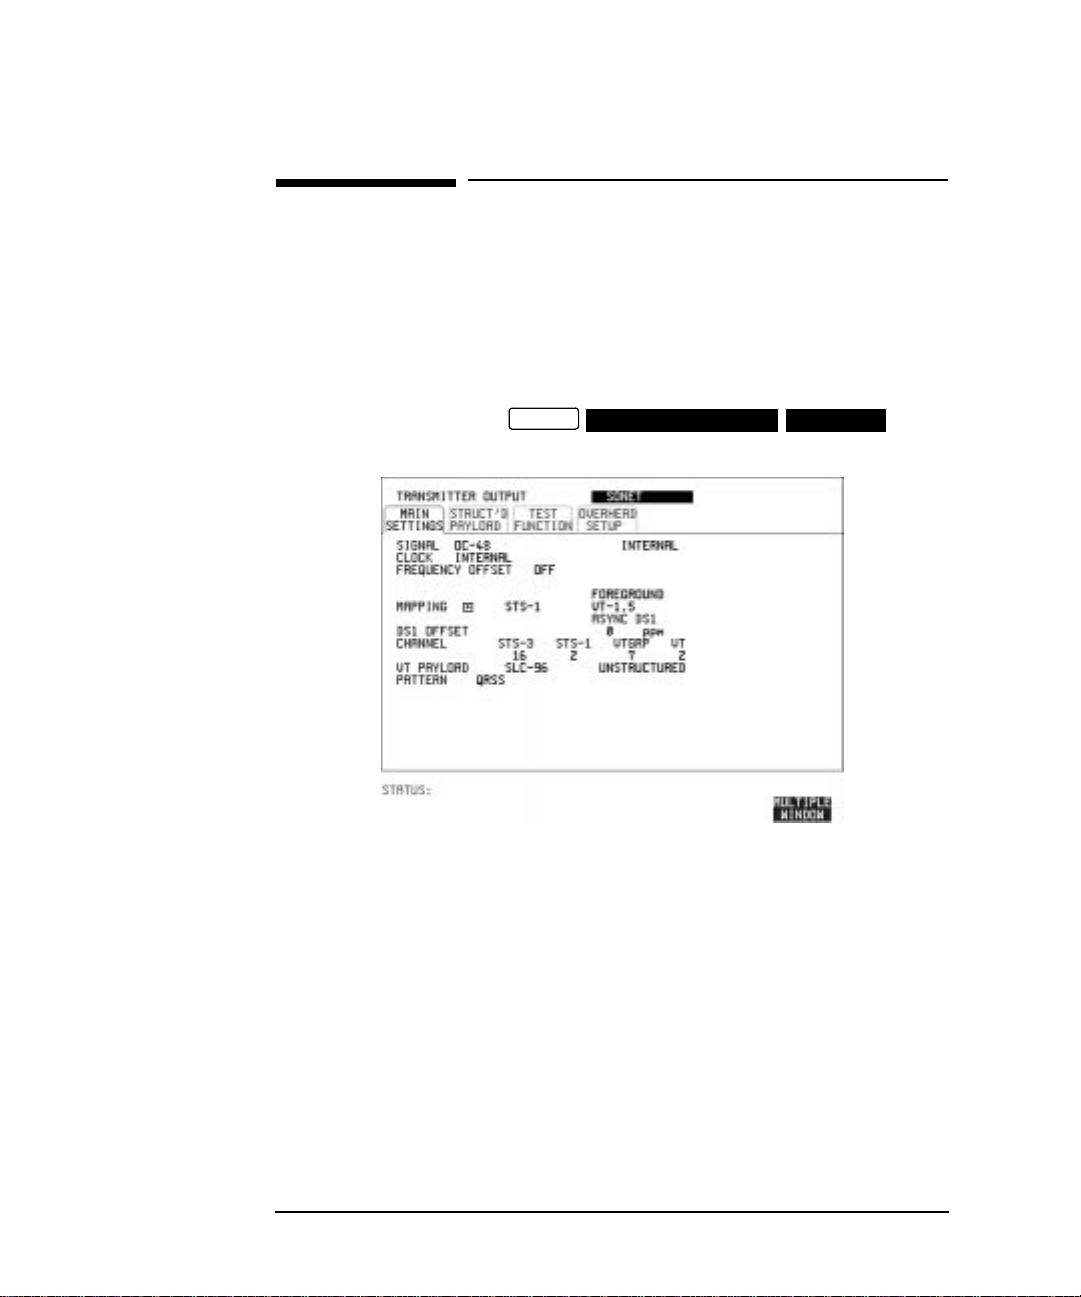
Setting SONET Transmit Interface
Description SONET transmit interface settings should match the network
equipment settings of Rate, Wavelength and Mapping, determine the
payload to be tested and set background conditions to prevent alarms
while testing.
TIP: If you wish to set the HP 37718A transmitter and receiver to the same
interface settings choose .
OTHER
SETTINGS CONTROL COUPLED
HOW TO: 1 Make your choice of SIGNAL rate.
If Option106, Dual Wavelengthopticalmodule, isfittedand anoptical
rate is chosen, choose the required wavelength (1550) or (1310).
If STS-1 is chosen, choose the required interface level.
ChooseINTERNALunless THRUMODEis required.If THRU MODE
is chosen, see "Setting SONET THRU Mode " page 15.
2 Make your choice of CLOCK synchronization source. The RECEIVE
clock sync choice depends on the SONET Receive Interface choice.
EXTERNAL allows a choice of MTS, BITS or 10 MHz clocks.
3 If required choose the FREQUENCY OFFSET value. See “Adding
Frequency Offset to SONET Signal” page 33.
12
Page 13

Setting the Interfaces
Setting SONET Transmit Interface
4 Choose FOREGROUND , BACKGROUND
B/G MAPPING
MAPPING and type of payload.
F/G MAPPING
Mapping may beselectedfroma pictorial display by moving the cursor to
MAPPING and pressing .
SET
Use and to move betweenSTSLayer choice, VTLayerchoice and
Payload Layer choice. Use and to choose the mapping.
SET
Use to confirm your choice and return to the
MAIN SETTINGS
display.
SONET
5 If VT-6 mapping is chosen, VT CONCATENATION selection is
enabled, choose OFF or the tributary at which the concatenation
begins, VT6-2C through VT6-6C.
The BACKGROUND, PATTERN IN OTHER VT-6’s is fixed at
NUMBERED, that is, each VT-6 contains a unique number to allow
identification in case of routing problems.
6 If required, choose DS1/2M/34M/DS3 OFFSET value. See “Adding
Frequency Offset to SONET Signal” page 33
7 If FULL SPE, VT-6, VT-2orVT-1.5mapping is chosen, choose the test
tributary CHANNEL,including the STS-3foran OC-12/OC-48 signal.
8 Choose the payloadframingunder PAYLOAD TYPE or VTPAYLOAD.
If STRUCTURED is required FRAMED must be chosen.
If STRUCTURED is chosen, the Payload test signal must be set up.
See “Setting Transmit Structured Payload/Test Signal” page 39.
If INSERT is chosen, see “Inserting an External DSn Payload/Test
Signal” page 45.
13
Page 14

Setting the Interfaces
Setting SONET Transmit Interface
If you have chosen 2 Mb/s, DS1 or DS3 under Mapping, the Framed
choice is expanded to provide a menu of framing types.
9 Choose the PATTERN type and PRBS polarity.
10 Choose the mapping required in the background (non-test) STS’s.
11 If VT mapping is chosen for the test STS, choose the PATTERN IN
OTHER VT’s.
14
Page 15

Setting the Interfaces
Setting SONET THRU Mode
Setting SONET THRU Mode
Description THRU mode is used to non-intrusively monitor SONET lines where no
protected monitor points are available.
As THRU mode locks some user settings, you must set SIGNAL RATE,
STS rate, STS-1 SPE CHANNEL (if appropriate) before selecting THRU
mode.
The entire frame can be errorred at a user defined rate if PAYLOAD
OVERWRITE and TOH+POH CHANNEL OVERWRITE are both set to
OFF. If either overwrite is enabled the ENTIRE FRAME ERROR RATE
function is disabled.
OC-1/STS-1, OC-3/STS-3
You can substituteanewpayload, Section and Line Overhead (TOH) and
Path overhead (POH) in the received OC-1/STS-1 or OC-3/STS-3 signal
for testing.
OC-12, OC-48
The overhead and payload may be overwritten for STS-3c SPE and AU3.
PAYLOAD OVERWRITE is not available for STS-12C or STS-48C.
TOH+POH CHANNEL overwrite is available for STS-12C and STS-48C.
HOW TO:
1 Make the required SIGNAL RATE, MAPPING and CHANNEL
choices on the SONET and displays, See
"Setting SONET Transmit Interface " page 12 and "Setting SONET
Receive Interface " page 21.
TRANSMIT
RECEIVE
15
Page 16

Setting the Interfaces
Setting SONET THRU Mode
2 Make the PAYLOAD OVERWRITE choice required.
If STS-3cSPE, STS-1 SPE,VT-6,VT-2or VT-1.5ischosen, the Section,
Line and Path CVs are recalculated before transmission and the
Mapping, Selected VT, VT Payload, Pattern, Tributary Offset and
Pattern in other VT’s settings are displayed. To choose the settings in
these, See "Setting SONET Transmit Interface " page 12, steps 4
through 10.
3 Make the TOH+POH CHANNEL OVERWRITE choice required.
You canonlymodify those overhead bytes available under
SONET TEST FUNCTION SONET
: Errors & Alarms, Sequences,
TRANSMIT
Overhead BER, APS Messages and DCC Insert.
The Section, Line and PathCVs are recalculated before transmission.
16
Page 17

Setting the Interfaces
Using Smart Test
Using Smart Test
Description The SmartTest functioncanhelp speed-up configuring the instrument in
two ways.
1 A Smartsetup feature that will attempt to configure the instrument
to receive the incoming signal.
2 A series of “links” that provide quick access to some of the most
frequently used features of the instrument. Note that these tests are
run with the instrument in its current configuration, no attempt is
made to set the instrument to the requirements of the test.
Smartsetup can help the user by attempting to identify the incoming
signal structure and detect mixed payload signal structures.
HOW TO USE
SMARTSETUP:
1 Connect the HP 37718A to the network and choose if necessary the
SET
RECEIVE
SELECT
required SONET interface on the HP 37718A (Smartsetup
will select DSn or SONET/SDH, but can not select between SONET
and SDH).
2 Press .
The display will show the Smart Test menu above.
3 Press either or .
SMART TEST
17
Page 18

Setting the Interfaces
Using Smart Test
4 In SONET mode the incoming signal will be identified on the top line
of the display,andunder this the payload mappings, the J1 Trace and
C2 byte indicators are displayed on the bottom lines.
5 Use the and keys to display the J1 Trace informationforeach
STS SPE. When the STS SPE of interest has been identified choose
either or .
VIEW PAYLOAD PRBS SEARCH
6 Choosing will identify and display the payload
VIEW PAYLOAD
mapping of the TUG structured signal, as shown below.
Choose the required tributary using and .
7 There are four choices available at this point:
SETUP RX
TROUBLE SCAN
tributary,exits tothe displayandstarts
which sets the receiver to receive the selected tributary.
which sets the receiver to receive the selected
RESULTS
TROUBLE SCAN
gating.
VIEW LABELS
which displaystheC2/V5/J1/J2 trace information for
the selected tributary.
TOP LEVEL
which returns the display to the STS SPE selection
window.
8 Choosing at Step 5 will prompt you for additional
PRBS SEARCH
information about patterns and which mapping to search. When the
required data has been entered press .
GO
9 When the search is complete a tributary display appears, with any
tributariescontainingthe required PRBSindicated with a“P”. Choose
the required tributary using and .
18
Page 19

Setting the Interfaces
Setting DSn Receive Interface
Setting DSn Receive Interface
Description DSn Receive interface settings should match the network equipment
settings of Rate, Termination and Line Code and determine the Payload
to be tested.
TIP: To set the transmitter and receiver to the same interface settings choose
OTHER
SETTINGS CONTROL COUPLED
.
HOW TO: 1 Choose the required SIGNAL rate.
2 If you have chosen 2 Mb/s as the SIGNAL rate, choose the required
TERMINATION. (At all other rates the impedance is fixed.)
3 If you have chosen 2 Mb/s or DS1 as the SIGNAL rate, choose the
required LINE CODE. (At 34Mb/s and DS3 coding is fixed.)
4 If you are measuring at the networkequipmentmonitorpoint,set the
LEVEL field to MONITOR. In this case the received signal will be 20
to 30 dB below the normal level.
Choose the GAIN required to return the received signal to normal.
Choose EQUALIZATION to compensate for cable losses if required.
19
Page 20

Setting the Interfaces
Setting DSn Receive Interface
5 Choose the PAYLOAD TYPE.
If STRUCTURED is required FRAMED must be chosen.
If STRUCTURED is chosen, the DSn test signal must be set up. See
“Setting Transmit Structured Payload/Test Signal” page 39.
If you chose 2 Mb/s, DS1 or DS3 as the DSn/DSn SIGNAL rate, the
FRAMED choice is expanded to provide a menu of framing types.
6 Choose the PATTERN type and the PRBS POLARITY required.
20
Page 21

Setting the Interfaces
Setting SONET Receive Interface
Setting SONET Receive Interface
Description SONET Receive interface settings should match the network equipment
settings of Rate and Mapping, and determine the payload to be tested.
TIP: If you wish to set the HP 37718A transmitter and receiver to the same
interface settings, choose .
OTHER
SETTINGS CONTROL COUPLED
HOW TO: 1 Choose the required SIGNAL source.
If STS-1 or STS-3 is chosen, choose the required LEVEL.
If the LEVEL chosen is MONITOR choose the required GAIN.
2 Choose mapping and type of payload.
3 If VT-6mapping is chosen, andCONCATENATIONisenabled, choose
the tributary at which the concatenation begins.
If VT-6, VT-2 or VT-1.5 mapping is chosen, choose the test tributary
under CHANNEL.
4 Choose the payloadframingunder PAYLOAD TYPE or VTPAYLOAD.
If STRUCTURED is required FRAMED must be chosen.
IfSTRUCTUREDis chosenthePayloadtest signal mustbe set up.See
“Setting Receive Structured Payload/Test Signal” page 41.
If DROP is chosen, see “Dropping an External Payload/Test Signal”
page 48.
5 Choose the PATTERN type and PRBS polarity.
21
Page 22

Setting the Interfaces
Setting SONET Receive Interface
22
Page 23

2
2 Selecting Test Features
Page 24

Selecting Test Features
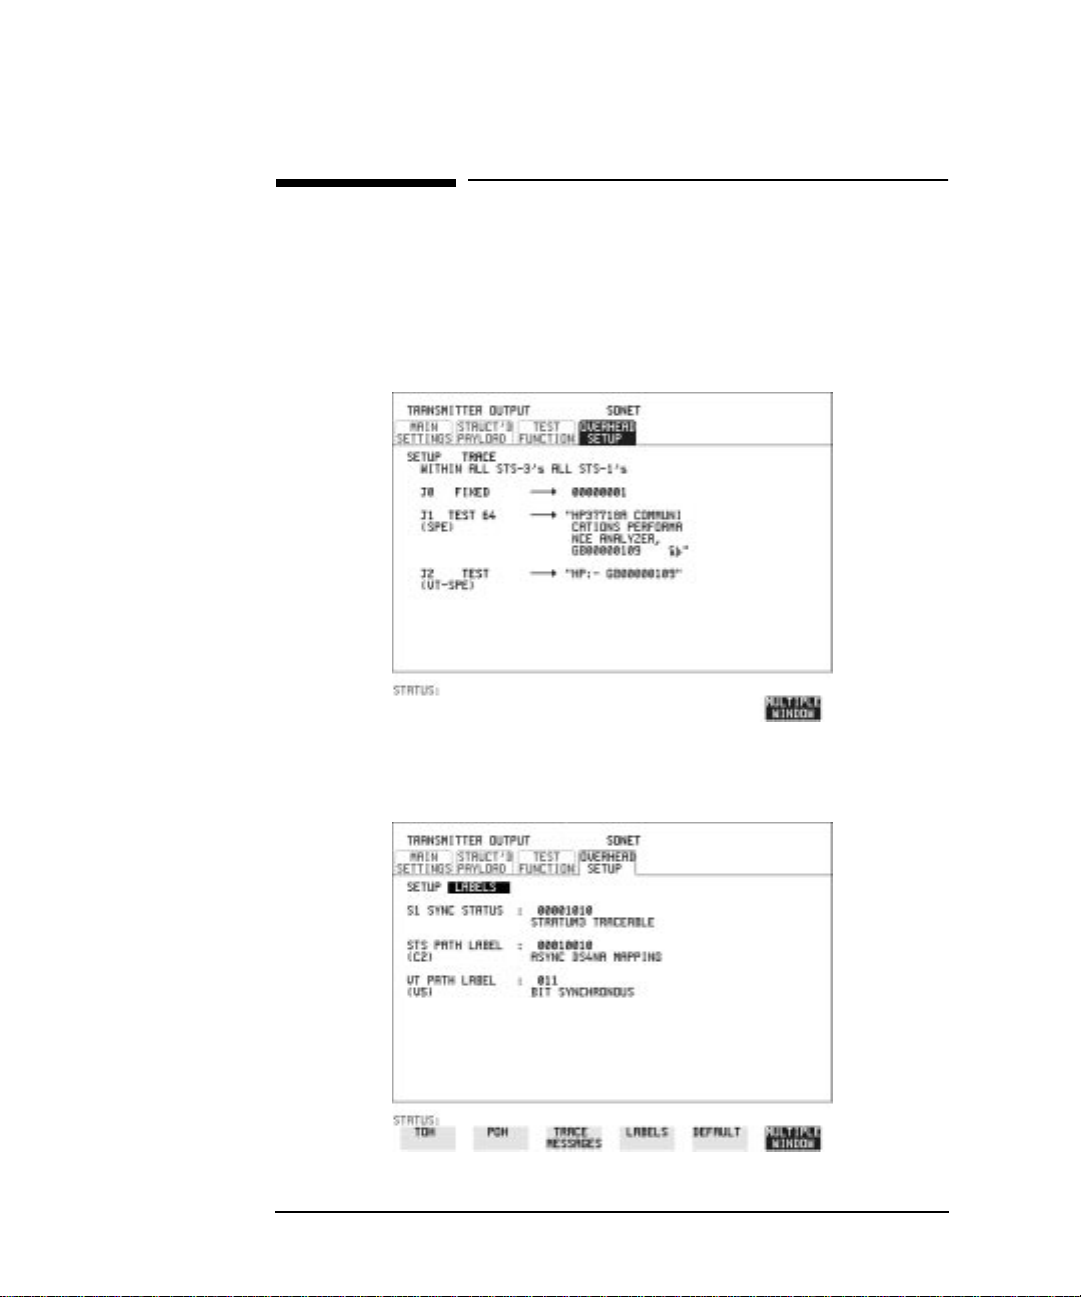
Using Transmit Overhead Setup
Description You can set an overhead byte to a known static state to aid
troubleshooting, for example to quickly check for "stuck bits" in path
overhead bytes. Transport Overhead, Path Overhead, Trace Messages
and Labels can be set using this feature.
HOW TO: 1 Set up the SONET transmit interface and payload required. See
"Setting SONET Transmit Interface " page 12.
2 Choose the type of overhead to SETUP.
If OC-12 or OC-48 is chosen as the SONET interface, choose the STS3# and STS-1# you wish to set up.
If STS-3 is chosen as the SONET interface, choose the STS-1# you
wish to set up.
DEFAULT - Use to set all overhead bytes to the standard values
defined by ITU-T.
If a test function is active then the overhead byte value is determined
by the choices made in the Test Function. If APS Messages is chosen,
for example, K1K2 value is set by the APS Messages setup.
24
Page 25

Selecting Test Features
Using Transmit Overhead Setup
If (Transport Overhead) is chosen, choose the STS-1 to be
TOH
displayed.Manybytes in and areunlabeledas the
STS-1# 2 STS-1#3
other overhead functions have not yet been defined.
If is chosen, the hexadecimal value of all 81 bytes of the
STS-1# 1,2,3
STS-3 section & line overhead selected are displayed (all 324 bytes of
an OC-12 or 1,296 bytes ofanOC-48are displayed 81 bytes at a time
by selecting each STS-3 in turn). The value of the bytes can be set
using .
DECREASE DIGIT INCREASE DIGIT
If BYTE NAMES is chosen, the labels for the overhead
STS-1# 1,2,3
bytes are displayed.
3 If POH (Path Overhead) is chosen, choose the TYPE of overhead
within STS-1 under test to be setup.
J1 and J2 bytes can be set under Path Overhead or Trace Messages.
H4 byte has a choice of sequences for VT-2, VT-1.5 and VT-6 mapping:
Full Sequence - 48 byte binary sequence.
Reduced Sequence - Binary count sequence of 0 to 3 i.e. 111111(00
to 11).
COC1 Sequence - Binary count sequence of 0 to 3 i.e. 110000(00 to
11).
H4 byte is transmitted as all zero’s for 34 Mb/s and DS3.
4 If TRACE MESSAGES is chosen, see "Setting Overhead Trace
Messages " page 28.
NOTE Any bit of an overhead byte which is displayed as x or s cannot be set at
any time. All other bits can be set to 0 or 1.
TIP: You can set all overhead bytes to the default state by selecting SETUP
DEFAULT
.
You can set all overhead bytes and test functions to the default state by
recalling Stored Settings [0] on the display.
OTHER
25
Page 26

Selecting Test Features
Using Receive Overhead Monitor
Using Receive Overhead Monitor
Description When first connecting to a SONET network, a start up confidence check
can be made by viewing the behavior of all the overhead bytes. If the
SONET network shows alarm indications,somediagnosisoftheproblem
may be gained from viewing all the overhead bytes.The OVERHEAD
MONITOR display is updated once per second (once per 8000 frames)
approximately.
TIP: A snapshot of the received overhead can be logged to the chosen logging
device. See "Logging on Demand " page 100.
HOW TO: 1 Set up the receive SONET interface and payload as required. See
“Setting SONET Receive Interface” page 21.
2 Choose the type of overhead to MONITOR.
3 If (Transport Overhead) is chosen, choose the STS-3 # and
TOH
STS-1# to be displayed.
Manybytes in and areunlabeled becausethe other
overhead functions have not yet been defined.
If is chosen, the hexadecimal value of all 81 bytes of
STS-1# 1,2,3
section overhead isdisplayed(all 324 bytes of anOC-12or1,296 bytes
of an OC-48 are displayed 81 bytes at a time by selecting eachSTS-3
in turn).The value of the bytes can be set using
INCREASE DIGIT
26
STS-1# 2 STS-1#3
DECREASE DIGIT
.
Page 27

Selecting Test Features
Using Receive Overhead Monitor
If BYTE NAMES is chosen, the labels for the overhead
STS-1# 1,2,3
bytes are displayed.
4 If POH (Path Overhead) is chosen, choose the source of the overhead,
SPE or VTSPE.
J1 and J2 bytes can be monitored under Path Overhead or Trace
Messages
5 If TRACE MESSAGES is chosen, you can monitor a data message to
verify portions of the network.
If the 16 byte CRC7 message structure is detected, the 15 characters
within the message are displayed.
If the CRC7 structure is not detected in J1, the 64 byte message
format is assumed and displayed.
If the CRC7 structure is not detected for J0 or J2, all 16 bytes are
displayed.
6 If LABELS is chosen, the S1 sync status, STS path label (C2) and the
VT Path label (V5) are monitored.
7 If APS MESSAGES is chosen, choose the TOPOLOGY, (GR-
253) or (GR-1230). The K1 and K2 bits are monitored.
RING
LINEAR
TIP: If any abnormal behavior is observed on a particular path or section
overhead byte, or an associated group of bytes (3XA1,3XA2; D1 - D3), the
RECEIVE
TEST FUNCTION
display of can be
OVERHEAD CAPTURE
used to "Zoom" in on the suspect byte or bytes on a frame by frame basis.
See "Using Receive Overhead Capture " page 31.
27
Page 28
Selecting Test Features
Setting Overhead Trace Messages
Setting Overhead Trace Messages
Description You can insert a data message to verify portions of the network:
J0 verifies the section overhead.
J1 verifies the STS-1 SPE or STS-3c SPE path connection.
J2 verifies the VT SPE path connection.
HOW TO: 1 Choose the message for insertion in the chosen trace channel.
ChoosingLABELSin TRACE MESSAGESallows the settingof the S1
SYNC STATUS, STS PATH LABEL (C2) and VT PATH LABEL (V5).
28
Page 29

Selecting Test Features
Generating Overhead Sequences
Generating Overhead Sequences
Description You may insert a pattern into a functional group of overhead bytes for
testing or troubleshooting purposes.
HOW TO: 1 Set up the SONET transmit interface and payload required. See
“Setting SONET Transmit Interface” page 12.
2 Choose the type of sequence required.
SINGLE RUN - runs the sequence once and then stops.
REPEAT RUN - runs the sequence repeatedly until STOPPED is
chosen.
3 Choose the overhead type as required.
SOH- Section Overhead
LOH- Line Overhead
POH - Path Overhead
4 Choose the byte or bytes of overhead required.
5 Set up the required number of data patterns and the number of
frames in which each data pattern should appear.
Yoursequence isderivedfrom upto 5blocksof hexadecimaldata. Each
block can be transmitted in up to 64,000 frames.
The data and the number of frames are set using
INCREASE DIGIT
.
DECREASE DIGIT
29
Page 30

Selecting Test Features
Generating Overhead Sequences
6 Start the sequence by choosing .
START
NOTE Whenyou start thesequenceillustrated, one Outof Frame alarmandone
Loss of Frame alarm should occur every eight seconds.
30
Page 31

Selecting Test Features
Using Receive Overhead Capture
Using Receive Overhead Capture
Description Section, Line and Path overhead provide network support functions,
responding dynamically to network conditions and needs. It is therefore
useful to capture overhead activity on a frame by frame basis.
TIP: The Overhead Capture display can be logged to the chosen logging
device. See "Logging on Demand " page 100.
HOW TO: 1 Set up the receive SONET interface and payload as required. See
“Setting SONET Receive Interface” page 21.
2 Choose the overhead type as required.
SOH- Section Overhead
LOH- Line Overhead
POH- Path Overhead
3 Choose the Byte or bytes of overhead to be captured.
Choose the TRIGGER to determine the start point of the capture.
- starts immediately the capture is initiated. Can be used to
OFF
provide a frame by frame monitor of the chosen byte or bytes.
-captures activity after your specified overhead state has occurred.
ON
Can be used for transient detection from a specified expected state.
31
Page 32

Selecting Test Features
Using Receive Overhead Capture
ON NOT
- captures activityafterthe first occurrence of adeviationfrom
your specified overhead state. Can be used for transient detection from a
specified expected state.
4 Up to 16 records of overhead state are provided. Each record will
represent between 1 and 64,000 frames. A capture is started by
pressing CAPTURE and terminates when up to 16 records
START
havebeen captured.Thecapture canbe terminatedearlierby pressing
CAPTURE .
STOP
32
Page 33

Selecting Test Features
Adding Frequency Offset to SONET Signal
Adding Frequency Offset to SONET Signal
Description Frequency offset can be added to the SONET interface rate signal and to
the payload signal.
HOW TO: SONET Line Rate Offset
1 Choose the amount of frequency offset required.
You can set the Frequency Offset in the range -999 ppm to +999 ppm
in1ppm stepsusing and .
The amount of applied Frequency Offset can be varied while
measurements are taking place.
If the value of the SONET line rate offset chosen is sufficient to cause
the maximum stuff rate to be exceeded, the asynchronous payload is
offset to prevent bit errors occurring and the maximum stuff rate is
maintained. WhenFloatingByte 2 Mb/sischosen, in conjunction with
SONET line rate offset, the chosen tributary will be offset as the line
rate is offset. (No pointer movements).
DECREASE DIGIT INCREASE DIGIT
33
Page 34

Selecting Test Features
Adding Frequency Offset to SONET Signal
Tributary Offset ±100 ppm
1 Choose the amount of tributary offset required.
You can set the Offset in the range -100 ppm to +100 ppm in 1 ppm
steps using and .
DECREASE DIGIT INCREASE DIGIT
The amount of applied Frequency Offset can be varied while
measurements are taking place.
Tributary offset affects the stuff rate but does not cause pointer
movements and can be used to test mapping jitter. If the combined
valueofSONETlinerate offsetand tributaryoffset chosenis sufficient
to causethe maximum stuff ratetobe exceeded thepayloadis offset to
prevent bit errors occurring and the maximum stuff rate is
maintained.
34
Page 35
Selecting Test Features
Adding Frequency Offset to the DSn Signal
Adding Frequency Offset to the DSn Signal
Description You can add frequency offset to the interface DSn SIGNAL at all rates.
Frequency Offset can be added at preset ITU values or as User defined
values in the range ±100 ppm. The preset values change with the
SIGNAL rate chosen as shown:
DS-1 (1.544 Mb/s) + 32 ppm −32 ppm
2 Mb/s (E1) + 50 ppm −50 ppm
34 Mb/s (E3) + 20 ppm −20 ppm
DS-3 (44.736 Mb/s) + 20 ppm −20 ppm
HOW TO: 1 Choose the FREQUENCY OFFSET required.
2 If you choose USER OFFSET, you can set the frequency offset to be
between -100 ppm and +100 ppm in 1 ppm steps.
Select the field immediately below USER OFFSET and use
DECREASE DIGIT INCREASE DIGIT
frequency offset.(The amount of frequency offset can be varied while
measurements are taking place.)
, , and to set the
35
Page 36

Selecting Test Features
Setting up Signaling Bits
Setting up Signaling Bits
Description When transmitting 2.048 Mb/s signals with timeslot-16 CAS (PCM30 or
PCM30CRC) multiframing the state of A,B,C,D signaling bits can be set.
The signaling bits of all timeslots are set to the user-defined 4 bit value.
When transmitting a DS1 framed, structured signal the values of the
A,B signaling bits for D4 and SLC-96 payloads, and A,B,C,D signaling
bits for ESF payloads can be defined.
HOW TO Transmit a 2 Mb/s signal with user-defined signaling bits
DSn Operation
1 Choose on the display.
2 Choose SIGNAL and PAYLOAD TYPE or
PCM30CRC
PDH/DSn
2 Mb/s PCM30
on the display.
TRANSMIT
MAIN SETTINGS
3 If UNSTRUCTURED is chosen set the 2M CAS ABCD bits value on
the display.
MAIN SETTINGS
If STRUCTURED is chosen set the 2M CAS ABCD bits value on the
STRUCTURED SETTINGS
display.
36
Page 37

Selecting Test Features
Setting up Signaling Bits
SONET Operation
1 Choose on the display
SONET
2 Choose MAPPING or and VT
PAYLOAD or on the display.
PCM30 PCM30CRC
TRANSMIT
ASYNC 2Mb/s FL BYTE 2Mb/s
MAIN SETTINGS
3 If UNSTRUCTURED is chosen set the 2M CAS ABCD bits value on
the display.
MAIN SETTINGS
If STRUCTURED is chosen set the 2M CAS ABCD bits value on the
STRUCTURED SETTINGS
display.
HOW TO Transmit a DS1 payload signal with user-defined signaling bits
DSn Operation
1 Choose on the display.
PDH/DSn
TRANSMIT
37
Page 38

Selecting Test Features
Setting up Signaling Bits
2 Choose SIGNAL or , and PAYLOAD TYPE
on the display
MAIN SETTINGS
3 Choose TEST SIGNAL or on the
SETTINGS
DS1 DS3
56 kb/s Nx56 kb/s
display.
STRUCTURED
STRUCTURED
4 Set the A,B bits (for D4 and SLC-96) and A,B,C,D bits (for ESF) as
required.
SONET Operation
1 Choose on the display.
SONET
2 Choose MAPPING or and VT PAYLOAD
STRUCTURED MAIN SETTINGS
on the display
3 Choose TEST SIGNAL or on the
SETTINGS
display .
TRANSMIT
ASYNC DS1
56 kb/s Nx56 kb/s
DS3
STRUCTURED
4 Set the A,B bits (for D4 and SLC-96) and A,B,C,D bits (for ESF) as
required.
38
Page 39

Selecting Test Features
Setting Transmit Structured Payload/Test Signal
Setting Transmit Structured Payload/Test Signal
Description Structured DSn Payload/Test Signal settings determine the SONET
payload or the DSn test signal to be tested and set any background (non
test) conditions to prevent alarms while testing.
TIP: If you wish to set the HP 37718A transmitter and receiver to the same
Payload settings, choose .
OTHER
SETTINGS CONTROL COUPLED
HOW TO: 1 Choose the required TEST SIGNAL rate. If Nx64 kb/s or N X 56 kb/s
is chosen, see "Setting Transmit N x 64 kb/s/N x 56 kb/s Structured
Payload/Test Signal " page 42.
2 Choose the PAYLOAD framing pattern.
If TEST SIGNAL 2Mb/s is chosen is added to the
PAYLOAD menu.See "Insertingan External DSnPayload/TestSignal
" page 45.
If TEST SIGNAL DS1 is chosen is added to the menu.
See "Inserting an External DSn Payload/Test Signal " page 45.
3 Choosethetest tributaryin the structuredpayload, under34Mb, 8Mb,
2Mb, 64 kb/s or DS2, DS1, 56 kb/s.
4 Choose the PATTERN type and PRBS POLARITY.
INSERT 2 Mb/s
INSERT DS1
39
Page 40

Selecting Test Features
Setting Transmit Structured Payload/Test Signal
5 Choose the B/G PATTERN.
The B/G PATTERN in the non test 56/64 kb/s timeslots is fixed as
NUMBERED,that is,each timeslotcontains auniquenumber toallow
identification in case of routing problems.
Signaling
6 If a 2 Mb/s PAYLOAD with PCM30 or PCM30CRC framing,or 56 kb/s
or Nx56kb/s Test Signal is chosen. See, "Setting up Signaling Bits "
page 36.
40
Page 41

Selecting Test Features
Setting Receive Structured Payload/Test Signal
Setting Receive StructuredPayload/Test Signal
Description Structured DSn Payload/Test Signal settings determine the SONET
payload or the DSn test signal to be tested.
TIP: If you wish to set the HP 37718A transmitter and receiver to the same
Payload settings, choose .
OTHER
STORED SETTINGS COUPLED
HOW TO: 1 Choose the required Test Signal rate. If N x 64 kb/s or N x 56 kb/s is
chosen, see "Setting Receive N x 64 kb/s/N x 56 kb/s Structured
Payload/Test Signal " page 44.
2 Choose the Framing pattern of the PAYLOAD.
If TEST SIGNAL 2 Mb/s is chosen, is added to the
menu. See "Dropping an External Payload/Test Signal " page 48.
If TEST SIGNAL DS1 is chosen, is added to the menu.
See "Dropping an External Payload/Test Signal " page 48.
3 Choose the test tributary within the structured payload,under34Mb,
8Mb, 2Mb, 64 kb or DS2, DS1, 56 kb/s.
4 Choose the PATTERN type and PRBS polarity.
DROP 2 Mb/s
DROP DS1
41
Page 42

Selecting Test Features
Setting TransmitNx64kb/s/N x 56 kb/s Structured Payload/Test Signal
Setting Transmit N x 64 kb/s/N x 56 kb/s
Structured Payload/Test Signal
Description Wideband services such as high speed data links and LAN
interconnection require a bandwidth greater than 56/64 kb/s but less
than DS1/2 Mb/s for example 112 kb/s or 336 kb/s. These wideband
signals are sent in a DS1/2 Mb/s frame by sharing the signal between
multiple timeslots.
N x 64kb/s/N x 56 kb/s structured payload allows a test pattern to be
inserted across a number of timeslots even if the chosen timeslots are
non-contiguous.
HOW TO: 1 Choose the required Test Signal rate.
2 Choose the Framing pattern of the 2M or DS1 PAYLOAD.
3 Choose the test timeslots within the structured payload using
DESELECT ALL DESELECT SELECT
timeslot is selected, an * marks the chosen timeslot. In the example
above Timeslots 3, 5, 9, 21, 22, 23 are selected for test.
4 Choose the PATTERN type and PRBS polarity.
5 Choose the B/G PATTERN.
42
and softkeys. As each
Page 43

Selecting Test Features
Setting TransmitNx64kb/s/N x 56 kb/s Structured Payload/Test Signal
6 The B/G PATTERN in the non-test 56/64 kb/s timeslots is fixed as
NUMBERED, that is, each timeslot contains a unique identification
number.
Signaling
7 If a 2 Mb/s PAYLOAD with PCM30 or PCM30CRC framing,or 56 kb/s
or Nx56kb/s Test Signal is chosen. See, "Setting up Signaling Bits "
page 36.
43
Page 44

Selecting Test Features
Setting Receive N x 64 kb/s/N x 56 kb/s Structured Payload/Test Signal
Setting Receive N x 64 kb/s/N x 56 kb/s
Structured Payload/Test Signal
Description Wideband services such as high speed data links and LAN
interconnection require a bandwidth greater than 56/64 kb/s but less
than DS1/2 Mb/s e.g. 112 kb/s or 336 kb/s. These wideband signals are
sent in a DS1/2 Mb/s frame by sharing the signal between multiple
timeslots.
N x 64kb/s andNx56kb/s structured payload/test signal allows the test
Timeslots to be chosen for error measurement even when the Timeslots
are non contiguous.
HOW TO: 1 Choose the required Test Signal rate.
2 Choose the Framing pattern of the 2M or DS1 PAYLOAD.
3 Choose the test timeslots within the structured payload using
DESELECT ALL DESELECT SELECT
timeslot is chosen an * marks the chosen timeslot. In the example
above Timeslots 3, 5, 9, 21, 22, 23 are chosen for test.
4 Choose the PATTERN type and PRBS polarity.
44
and softkeys. As each
Page 45

Selecting Test Features
Inserting an External DSn Payload/Test Signal
Inserting an External DSn Payload/Test Signal
Description You can insert a DSn signal from external equipment into the SONET
signal, or you can insert2Mb/sor DS1 into the structured DSn signal, as
shown in the table below. DS3 and 34 Mb/s can only be inserted if
SONET is chosen as the receive interface. 2 Mb/s or DS1 can be inserted
from a structured or non-structured SONET payload and from a
structured DSn signal.
RATE Availability Option
DS3 SONET 011 Only
34Mb/s SONET 010 and 011
2Mb/s DSn & SONET 010 and 011
DS1 DSn & SONET 011 Only
HOW TO: Insert 34 Mb/s & DS3
1 Connect the external payload to the 75Ω IN port of the PDH/DSn
receive module.
2 Set up the required transmit SONET interface, and choose VT
PAYLOAD or as required.
INSERT 34 Mb/s
INSERT DS3
45
Page 46

Selecting Test Features
Inserting an External DSn Payload/Test Signal
Insert 2 Mb/s or DS1 (Unstructured SONET Payload)
1 Connect the external payload to the MUX port of the PDH/DSn
Transmit module.
If 2 Mb/s connect to 75ΩMUX port. If DS1 connect to 100Ω MUX port.
2 Set up the required transmit SONET interface, and choose VT-2 or
VT-1.5 MAPPING and VT PAYLOAD or .
INSERT 2 Mb/s
INSERT DS1
Insert 2 Mb/s or DS1 (Structured SONET Payload or Structured DSn)
1 Connect the external payload to the MUX port of the DSn Transmit
module.
If 2 Mb/s connect to 75ΩMUX port. If DS1 connect to 100Ω MUX port.
46
Page 47

Selecting Test Features
Inserting an External DSn Payload/Test Signal
Structured SONET Payload
2 Set up the required transmit SONET interface. See "Setting SONET
Transmit Interface " page 12.
3 Set up the SONET structured payload. See "Setting Transmit
Structured Payload/Test Signal " page 39.
4 Choose 2M PAYLOAD/DS1 PAYLOAD or
INSERT DS1
.
INSERT 2 Mb/s
5 Choose the LINE CODE.
Structured DSn
6 Set up, the required transmit DSn interface, See "Setting DSn
Transmit Interface " page 10.
7 Set up the DSn Test Signal interface. See "Setting Transmit
Structured Payload/Test Signal " page 39
8 Choose 2M PAYLOAD/DS1 PAYLOAD or
INSERT DS1
.
INSERT 2 Mb/s
9 Choose the LINE CODE.
47
Page 48

Selecting Test Features
Dropping an External Payload/Test Signal
Dropping an External Payload/Test Signal
Description You can drop a DSn signal from the received payload or drop 2 Mb/s or
DS1 from the structured DSn signal to external equipment as shown in
the table below. DS3 and 34 Mb/s can only be dropped if SONET is
chosen as the receive interface. 2 Mb/s or DS1 can be dropped from a
structured ornon-structuredSONETpayload and from astructuredDSn
signal.
RATE Availability Option
DS3 SONET 011 Only
34Mb/s SONET 010 and 011
2Mb/s DSn & SONET 010 and 011
DS1 DSn & SONET 011 Only
HOW TO: Drop 34 Mb/s & DS3
1 Connect the 75Ω OUT port of the DSn Transmit module to the
external equipment.
2 Set up the receive SONET interface, and choose VT PAYLOAD,
DROP 34 Mb/s
If is chosen, choose the DS3 output level.
DROP DS3
48
or .
DROP DS3
Page 49

Selecting Test Features
Dropping an External Payload/Test Signal
Drop 2 Mb/s /DS1 (Unstructured SONET Payload)
1 Connect the DEMUX port of the DSn module to the external
equipment.
2 Set up the required receive SONET interface, and choose VT-2 or
VT-1.5 MAPPING and VT PAYLOAD or .
DROP 2 Mb/s
DROP DS1
3 Choose the required LINE CODE.
Drop 2 Mb/s/DS1 (Structured SONET Payload or Structured DSn
1 Connect the DEMUX port of the Receive DSn module to the external
equipment.
If 2 Mb/s connect to 75Ω DEMUX port. If DS1 connect to 100Ω
DEMUX port.
49
Page 50

Selecting Test Features
Dropping an External Payload/Test Signal
Structured SONET Payload
2 Set up the required receive SONET interface. See "Setting SONET
Receive Interface " page 21.
3 Set up the SONET structured payload. See "Setting Receive
Structured Payload/Test Signal " page 41.
4 Choose 2M PAYLOAD or DS1 PAYLOAD .
DROP 2 Mb/s
DROP DS1
5 Choose the LINE CODE.
Structured DSn
6 Set up, the required receive DSn interface, See "Setting DSn Receive
Interface " page 19.
7 Set upthe DSn TestSignal interface.See "Setting ReceiveStructured
Payload/Test Signal " page 41
8 Choose 2M PAYLOAD or DS1 PAYLOAD .
DROP 2 Mb/s
DROP DS1
9 Choose the LINE CODE.
50
Page 51

Selecting Test Features
Adding Errors & Alarms at the SONET Interface
Adding Errors & Alarms at the SONET
Interface
Description Errors and alarms can be added to the SONET interface signal during
testing.
HOW TO: 1 Set up the SONET transmit interface and payload required. See
"Setting SONET Transmit Interface " page 12.
2 Choose the ERROR ADD TYPE and RATE required.
Errors can be added at preset rates and at USER programmable rate.
With theexceptionof ENTIRE FRAME and A1A2FRAME,errors can
be added at ERROR ALL rate.
If CV-L errors are chosen errors can be added to trigger an APS
THRESHOLD.This takes the form ofN errors in T timeperiod. N and
T are both selectable.
3 Choose the ALARM TYPE
Errors and Alarms can be added at the same time.
51
Page 52

Selecting Test Features
Adding Errors & Alarms to the DSn Interface/DSn Payload
Adding Errors & Alarms to the DSn Interface/
DSn Payload
Description Errors and alarms can be added to the DSn interface/payload signal
during testing.
HOW TO: 1 If SONET interface is chosen, set up the SONET transmit interface
and payload required. See “Setting SONET Transmit Interface”
page 12.
If DSn interface is chosen, set up the DSn interface and payload
required. See “Setting DSn Transmit Interface” page 10.
2 Choose the ERROR ADD TYPE and RATE on the Transmitter
TEST FUNCTION
The RATEcan be selected from afixedvalue or is userprogrammable.
If you select USER PROGRAM you can select the error rate before
enabling the errors. This feature is useful for error threshold testing.
3 Choose the ALARM TYPE.
Errors and Alarms can be added at the same time.
52
display.
Page 53

Selecting Test Features
Using FEAC Codes
Using FEAC Codes
Description The third C-Bit in subframe 1 is used as a FEAC channel, where alarm
or status information from the far-end terminal can be sent back to the
near-end terminal. The channel is also used to initiate DS3 and DS1 line
loopbacks at the far-end terminal from the near-end terminal.
The codes are six digits long and are embedded in a 16 bit code word; the
format is 0XXXXXX011111111.
There are two types of code, Loopback and Alarm Status.
Loopback provides a choice of two DS1 messages and two DS3 Messages.
The DS1 Messages can be sent in ALL DS1 channels or in a SINGLE
channel. The message can be repeated up to 15 times.
Alarm Status provides 13 preset codes and a USER programmable code
function. These codes can be transmitted continuously or in bursts.
The new code is transmitted by choosing or .
HOW TO: Transmit an FEAC code
1 Choose SIGNAL and PAYLOADTYPE on the
MAIN SETTINGS
2 Choose and ALARM TYPE .
TRANSMIT
DS3 CBIT
display.
TEST FUNCTION DS3 FEAC
When a FEAC code is not being transmitted, an all ones pattern is
transmitted.
BURST ON
TRANSMIT
53
Page 54

Selecting Test Features
Using FEAC Codes
3 Choose the FEAC CODE TYPE.
4 Choose the MESSAGE from the choices displayed.
If you chose a DS1 message an additional field to the right of the DS1
MESSAGE is displayed. Position the cursor on this field and choose
or .
ALL
If youchoose use theEDIT keys toselecta channel
from 1 to 28. Press when finished.
5 If is chosen, choose the REPEAT (TIMES) LOOP and
LOOPBACK
SINGLE CHANNEL
SINGLE CHANNEL
END EDIT
MESS, in the range 1 to 15.
6 If is chosen, choose the BURST LENGTH (TIMES).
ALARM/ STATUS
7 Choose TRANSMIT NEW CODE or to transmit the
selected FEAC message.
TIP: To View FEAC Messages
The received FEAC message can be viewed on the display.
BURST
ON
RESULTS
54
Page 55

Selecting Test Features
Setting DSn Spare Bits
Setting DSn Spare Bits
Description Certain Spare Bits will cause the occurrence of a minor alarm when
received as a logical "0".:
8 Mb/s & 34 Mb/s - FAS Bit 12
2 Mb/s - NFAS Timeslot (timeslot 0 of NFAS frame) Bit 0
HOW TO: 1 If SONET interface is chosen, set up the SONET transmit interface
and payload required. See "Setting SONET Transmit Interface "
page 12.
If DSn interface is chosen, set up the DSn transmit interface and
payload required. See "Setting DSn Transmit Interface " page 10.
2 Set the value of the spare bits required for testing.
If a BIT SEQUENCE is required, choose SEND SEQUENCE to
transmit the sequence.
ON
55
Page 56

Selecting Test Features
Adding Pointer Adjustments
Adding Pointer Adjustments
Description The transmitted SPE or VT pointer value can be adjusted for testing
purposes.
HOW TO: 1 Set up the SONET transmit interface and payload required. See
"Setting SONET Transmit Interface " page 12.
2 Choose the POINTER TYPE.
3 Choose the ADJUSTMENT TYPE required.
BURST - You determine the size of the burst by the number of
PLACES chosen. If, for example, you choose 5 PLACES the pointer
value will be stepped 5 times in unit steps e.g. 0 (start value), 1, 2, 3,
4, 5 (final value). The interval between steps is as follows:
For AU and TU-3, the minimum spacing between adjustments is
500 us. For VT the minimum spacing between adjustments is 2 ms.
Choose ADJUST POINTER [ON] to add the chosen burst.
NEW POINTER- Youcanchoose apointer value inthe range 0to 782
with or without a New Data Flag.
The current pointer value is displayed for information purposes.
Choose ADJUST POINTER [ON] to transmit the new pointer value.
56
Page 57

Selecting Test Features
Adding Pointer Adjustments
OFFSET - You can frequency offset the line rate or the SPE/VT rate,
relative toeachother,thus producing pointer movements.If you offset
the SPE pointer, an87:3sequenceofpointer movements is generated.
The available configurations are listed in the following table.
If you are currently adding Frequency Offset to the SONET interface
or payload, pointer OFFSET is not available.
Pointer Type Line Rate SPE Rate VT Rate
SPE Constant Offset Tracks AU Payload
SPE Offset Constant Constant
VT Constant Constant Offset
VT Offset Tracks Line Rate Constant
T1.105/GR-253 - Provides pointer movements according to T1.105 and
GR-253:
4 Choose the T1.105/GR-253 ADJUSTMENT TYPE.
5 ChoosethePOLARITY,INTERVAL andPATTERN(where applicable)
for the selected sequence.
6 Choose POINTERSEQUENCES to generatetheselected
G.783 sequence and to stop the pointer sequences.
STOP INIT
START INIT
T1.105/GR-253 Pointer Sequences Explained
In addition to the BURST, NEW POINTER and OFFSET pointer
movements described, the HP 37718A can also generate pointer
sequences (pointer movements) according to T1.105.03 and GR-253.
Before running a pointer sequence you can elect to run an initialization
sequence, followed by a cool down period, and then run the chosen
sequence. This is selected using the START INIT softkey shown in the
display on the previous page. Initialized pointer sequences are made up
of three periods: the Initialization Period, the Cool Down Period, and the
Sequence (Measurement) Period, an example is given in the following
figure:
57
Page 58

Selecting Test Features
Adding Pointer Adjustments
Non Periodic Sequence
Periodic Sequence
Initialization Sequence
Initialization
No Pointer Activity
Continuous Sequence
Cool Down
Sequence
Time
Measurement
Period
Note: SINGLE (A1), BURST (A2) and PHASE TRANSIENT(A3) are Non
Periodic Sequences.
Initialization Period
ForSINGLEA1,BURSTA2and PHASE TRANSIENT A3 sequences the
initialization sequence consists of 60 seconds of pointer adjustments
applied at a rate of 2 adjustments per second and in the same direction
as the specified pointer sequence.
Cool Down Period
A period following the initialization periodwhichforSINGLE e), BURST
f) and PHASE TRANSIENT sequences is 30 seconds long when no
pointer activity is present.
Sequence (Measurement) Period
The period following the Cool Down period where the specified pointer
sequence runs continuously.
Periodic Test Sequences
For periodic test sequences (for example PERIODIC ADD) both the 60
second initialization and 30 second cool down periods consist of the same
sequence as used for the subsequent measurement sequence. If the
product of the period T and the selected Optional background pattern
(87+3 or 26+1) exceeds 60 seconds then the longer period is used for the
initialization. For example, if T is set for 10 seconds then the
initialization period may be extended to 900 seconds.
The HP 37718A displays a message indicating which phase
(initialization, cool down or measurement) the transmitter is currently
generating.
58
Page 59

Selecting Test Features
Adding Pointer Adjustments
NOTE The following conditions apply for pointer sequence generation:
The sequences can onlybeappliedto the SPE pointer when the SPE does
not contain a VT structure, otherwise it is applied to the VT pointer.
Pointer sequence generation is not available when a frequency offset is
being applied to the Line Rate.
The following figure gives an example of a T1.105/GR-253, 87-3 Pointer
Sequence.
T1.105 A4 and A5, 87-3 Pattern
No Pointer
Adjustment
Pointer Adjustment
Start of Next
87-3 Pattern
Pointer Sequence
T1.105 A1 SINGLE
GR-253 5-29
T1.105 A2 BURST OF 3
GR-253 5-30
87
3
An Example of a Pointer Sequence
Description
Periodic Single adjustments, all of the same polarity which is
selectable. Separation between pointer adjustments is fixed at
approximately 30 seconds.
Periodic bursts of 3 adjustments, all of the same polarity which is
selectable. The interval between bursts is fixed at approximately 30
seconds. The interval between adjustments within a burst is set to
the minimum.
59
Page 60

Selecting Test Features
Adding Pointer Adjustments
Pointer Sequence
T1.105 A3 PHASE
TRANSIENT
GR-253 5031
T1.105 A4 PERIODIC
NORMAL (87-3 Pattern)
GR-253 5-33(b)
T1.105 A4 PERIODIC
NORMAL (Continuous
Pattern) GR-253 5-34(b)
GR-253 5-32(b)
PERIODIC NORMAL (26-1
Pattern)
T1.105 A5 PERIODIC ADD
(87-3 Pattern)
GR-253 5-33(c)
Phase transient pointer adjustment burst test sequence. All
adjustments are of the same polarity, which is selectable. The
interval between bursts is fixed at 30 seconds. Each burst consists
of 7 pointer movement. The first 3 in each burst are 0.25 s apart,
and the interval between the 3 and 4 movement, and each
remaining movement 0.5 seconds.
An 87-3 pattern is selected. The sequence pattern is 87 pointer
movements followed by 3 missing pointer movements. Pointer
polarity is selectable and the time interval between pointer
adjustments settable.
Provides a continuous sequence of pointer adjustments. The
polarity of the adjustments is selectable, and the time interval
between adjustments can be set (see Note 1).
This selection is only available if you have selected VT1.5 mapping.
The sequence pattern is 26 pointer movements followed by 1
missing pointer movement. Pointer polarity is selectable and the
time interval between pointer adjustments programmable to 200
ms, 500 ms, 1 s, 2 s, 5 s or 10 seconds.
An 87-3 pattern is selected. The sequence pattern is 87 pointer
movements followedby3missing pointer movements with anadded
pointer movement after the 43rd pointer. The spacing between the
added adjustment and the previous adjustment is set to the
minimum. Pointerpolarity is selectable. Thetimeinterval between
pointer adjustments can be set (see Note 1). Added adjustments
occur every 30 seconds or every repeat of the 87-3 pattern,
whichever is longer.
Description
T1.105 A5 PERIODIC ADD
(Continuous Pattern)
GR-253 5-34(c)
Periodic Single adjustments, with selectable polarity and added
adjustment (1 extra). The spacing between the added adjustment
and the previous adjustment is set to the minimum, (see Note 2).
The time interval between pointer adjustments can be set (see Note
1). Added adjustments occur every 30 seconds or every repeat of the
87-3 pattern, whichever is longer.
60
Page 61

Selecting Test Features
Adding Pointer Adjustments
Pointer Sequence
GR-253 5-32(c)
PERIODIC ADD (26-1
Pattern)
T1.105 A5 PERIODIC
CANCEL (87-3 pattern)
GR-253 5-33(d)
T1.105 A5 PERIODIC
CANCEL (Continuous
Pattern)
GR-253 5-34(d)
GR-253 5-32(d)
PERIODIC CANCEL (26-1
pattern)
This selection is only available if you have selected VT1.5 mapping.
The sequence pattern is 26 pointer movements followed by 1
missing pointer movement. Theaddedadjustmentoccurs 2 ms after
the 13th pointer adjustment. Pointer polarity is selectable and the
time interval between pointer adjustments programmable to 200
ms, 500 ms, 1 s, 2 s, 5 s or 10 s. Added adjustments occur every 30
seconds or every repeat of the 26-1 pattern, whichever is longer.
An 87-3 pattern is selected. The sequence pattern is 87 pointer
movements followed by 3 missing pointer movements with a
cancelled pointer movement at the 87th pointer. Pointer polarity is
selectable, and the time interval between pointer adjustments can
be set (see Note1).Cancelledadjustments occur every 30 seconds or
every repeat of the 87-3 pattern, whichever is longer.
Periodic Single adjustments, with selectable polarity and cancelled
adjustment (1 less). The time interval between pointer adjustments
can be set (see Note 1). Cancelled adjustments occur every 30
seconds or every repeat of the 87-3 pattern, whichever is longer.
This selection is only available if you have selected VT1.5 mapping.
The sequence pattern is 26 pointer movements followed by 1
missing pointer movement. The cancelled adjustment is the 26th
pointer adjustment, that is the one before the regular gap of 1.
Pointer polarity is selectable and the time interval between pointer
adjustments programmable to 200 ms, 500 ms, 1 s, 2 s, 5 s or 10s.
Cancelled adjustments occur every30secondsor every repeat of the
26-1 pattern, whichever is longer.
Description
NOTE For SPE pointers the sequence interval is selectable from 7.5 ms, 10, 20,
30, 34 ms; 40 to 100 ms in 10 ms steps, 100 to 1000 ms in 100 ms steps
1, 2, 5, 10 seconds.
ForVTpointers the sequence interval is selectable from: 200 ms, 500 ms,
1, 2, 5 and 10 seconds.
ForSPEpointerstheminimumspacingbetweenadjustmentsis500us.
For VT pointers the minimum spacing between adjustments is 2 ms.
61
Page 62

Selecting Test Features
Adding Pointer Adjustments
Table 1 Pointer Sequences Available with Selected Mapping
MAPPING
POINTER SEQUENCE
A1 SINGLE
A2 BURST OF 3
A3 PHASE TRANSIENT
A4 PERIODIC NORMAL(87-3)
A4 PERIODIC NORMAL (Continuous)
PERIODIC NORMAL (26-1)
A5 PERIODIC ADD (87-3)
A5 PERIODIC ADD (Continuous)
PERIODIC ADD (26-1)
A5 PERIODIC CANCEL (g) 87-3
A5 PERIODIC CANCEL (Continuous)
PERIODIC CANCEL 26-1
SPE VT6, VT2 VT1.5
✓✓✓
✓✓✓
✓✓✓
✓
✓✓✓
✓
✓
✓✓✓
✓
✓
✓✓✓
✓
62
Page 63

Selecting Test Features
Using Pointer Graph Test Function
Using Pointer Graph Test Function
Pointer Graph shows the relative offset during the measurement period.
This allows the time relationship of SPE or VT pointer movements to be
observed. Up to4days of storage allows long termeffectssuchas Wander
to be observed. If an alarm occursduringthemeasurementperiod, a new
graph starts at the centre of the display (offset zero) after recovery from
the alarm.
TIP: The Pointer Graph display can be logged to the chosen logging device.
See "Logging on Demand " page 100.
TIP: The graph can also beviewedonthe display
at the end of the measurement.
HOW TO: 1 Set up the receive SONET interface and payload as required. See
“Setting SONET Receive Interface” page 21.
2 Choose the CAPTURE INTERVAL required.
The capture interval determines the time between captures. Low
values of capture interval should be chosen when a high degree of
pointer movements is expected.
High values ofcaptureinterval should be chosen when alowdegree of
pointer movements is expected, for example Wander over 1 day, use 5
MINS and Wander over 4 days, use 20 MINS.
RESULTS
SONET RESULTS
63
Page 64

Selecting Test Features
Using Pointer Graph Test Function
If, during a long term measurement (4 days), an event occurs at a
particular time each day, a short term measurement can be made at
the identified time to gain more detail of the event.
3 Choose the POINTER UNDER TEST type.
4 Press to start the measurement.
RUN/STOP
TIP: If the event occurs outside normal working hours, a Timed Start
measurement can be made.
1 SEC - display window of approximately 5 minutes.
5 SECS - display window of approximately 25 minutes.
20 SECS - display window of approximately 1 hour 40 minutes.
1 MIN - display window of approximately 5 hours.
5 MIN - display window of approximately 1 day.
20 MIN - display window of approximately 4 days.
64
Page 65

Selecting Test Features
Stressing Optical Clock Recovery Circuits
Stressing Optical Clock Recovery
Circuits
Description Ideally clock recovery circuits in the network equipment optical
interfaces should recover the clock even in the presence of long strings of
0’s. You can check the performance of your optical clock recovery circuits
using the STRESS TEST test function.
The stress test is available at all optical rates.
HOW TO: 1 Set up the SONET transmit interface and payload required. See
"Setting SONET Transmit Interface " page 12.
Choose the required STRESSING PATTERN.
The G.958 test pattern consists of 7 consecutive blocks of data as
follows:
the first row of section overhead bytes, ALL ONES, a PRBS, the first
row of section overhead bytes,ALL ZEROS, a PRBS and the first row
of section overhead bytes.
2 If you choose ALL ONES or ALL ZEROS as the stressing pattern,
choose the number of bytes in the BLOCK LENGTH.
65
Page 66

Selecting Test Features
Generating Automatic Protection Switch Messages
Generating Automatic Protection
Switch Messages
Description You can program the K1 and K2 bytes to exercise the APS functions for
Both LINEAR (ITU-T G.783) and RING (ITU-T G.841) topologies.
HOW TO: 1 Set up the SONET transmit interface and payload required. See
"Setting SONET Transmit Interface " page 12.
2 Choose the ITU-T TOPOLOGY required.
3 Choose the message to be transmitted.
If LINEAR topology is chosen, choose the CHANNEL, the BRIDGED
CHANNEL NO., the ARCHITECTURE and the RESERVED bits you
require.
If RING topology is chosen, choosetheDESTINATIONNODE ID, the
SOURCE NODE ID, the type of PATH and the status code (K2 Bits 6>8)
The currentTXand RX, K1 and K2,valuesare displayed for reference
only.
4 Choose to transmit the new K1/K2 values.
66
DOWNLOAD
Page 67

Selecting Test Features
Inserting & Dropping Data Communications Channel
Inserting & Dropping Data
Communications Channel
Description The Data Communications Channel (DCC) of the regenerator and
multiplexer section overhead can be verified by protocol testing. The
Insert and Drop capability provides access to the DCC via the RS-449
connector on the front panel of the Multirate Analyser module.
DCC INSERT is available on the , ,
display.
DCC DROP is available on the
display.
HOW TO: 1 Connect the Protocol Analyzer to the DCC port on the Multirate
Analyzer module.
2 Choose the required DCC.
TRANSMIT
RECEIVE
SONET TEST FUNCTION
SONET TEST FUNCTION
67
Page 68

Selecting Test Features
Inserting & Dropping Data Communications Channel
68
Page 69

3
3 Making Measurements
Page 70

Making Measurements
Using Overhead BER Test Function
Using Overhead BER Test Function
Description You can perform a Bit Error Rate test on chosen bytes of the section, line
and path overhead bytes.
You can access the transmit Overhead BER on the
TEST FUNCTION
display.
TRANSMIT
SONET
HOW TO: 1 Set up the SONET transmit interface and payload required. See
"Setting SONET Transmit Interface " page 12.
2 Set up the receive SONET interface and payload as required. See
"Setting SONET Receive Interface " page 21.
3 Choose the overhead byte to be tested on the
TEST FUNCTION
display.
RECEIVE
SONET
4 Choose the overhead byte to be tested on the
TEST FUNCTION
5 Press to start the test.
RUN/STOP
display.
6 The PRBS pattern can be errored by pressing .
TRANSMIT
SINGLE
70
SONET
Page 71
Making Measurements
Test Timing
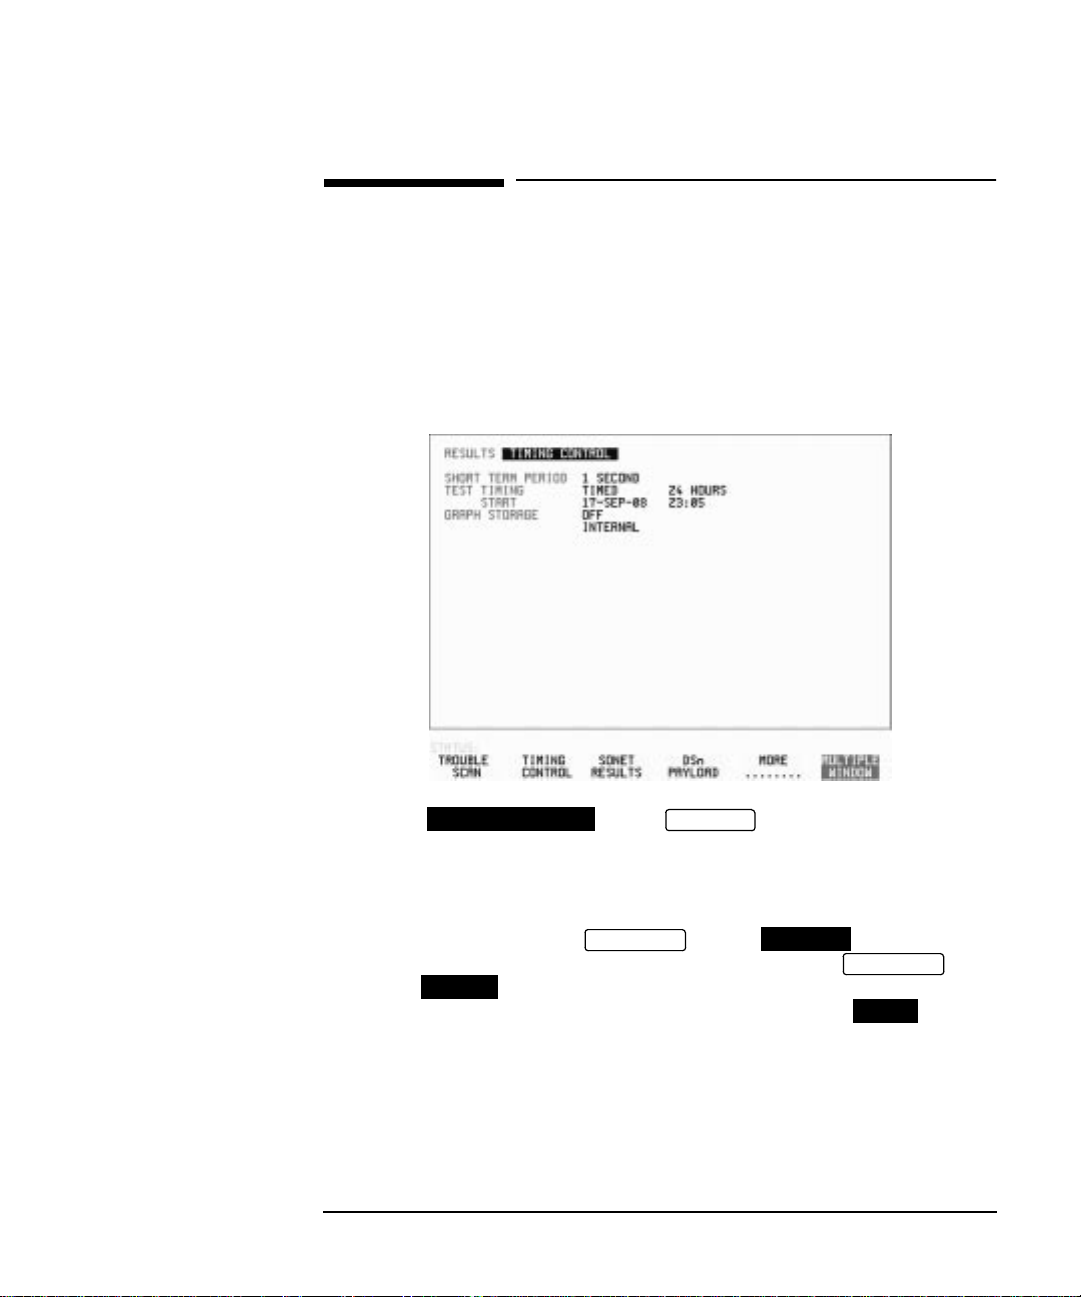
Test Timing
Description There are two aspects to test timing:
• Error results may be displayed as short term or cumulative over the
measurement period.If short term error measurements are required,
the short term period may be selected.
• The period of the test may be defined or controlled manually.
HOW TO: 1 Choose on the display.
TIMING CONTROL
RESULTS
2 Choose the SHORT TERM PERIOD to the timing required for short
term results.
3 Choose the type of TEST TIMING required:
For manual control with choose .
RUN/STOP
MANUAL
For a single timed measurement period started with ,
choose and choose the Test duration.
SINGLE
Fora timed period starting at a specified time, choose , choose
the Test duration and the test START date and time.
RUN/STOP
TIMED
71
Page 72

Making Measurements
Making SONET Analysis Measurements
MakingSONETAnalysisMeasurements
Description G.826 analysis results are provided for all relevant SONET error
sources.
In addition the following results are provided:
Cumulative error count and error ratio
Short Term error count and error ratio
Alarm Seconds
Frequency
Pointer Values
Pointer Graph
HOW TO: 1 Set up the receive SONET interface and payload required. See
"Setting SONET Receive Interface " page 21.
2 If required set up the SONET transmit interface and payload. See
"Setting SONET Transmit Interface " page 12.
3 Press to start the measurement.
4 You can view the analysis results on the
TIP: The measurement will not be affected if you switchbetweenthedifferent
results provided.
72
RUN/STOP
ANALYSIS
display.
RESULTS
SONET
Page 73

Making Measurements
Making DSn Analysis Measurements
Making DSn Analysis Measurements
Description G.821, G.826, M.2100, M.2110 and M.2120 analysis results are provided
for all relevant DSn and DSn Payload error sources.
In addition the following results are provided:
Cumulative error count and error ratio
Short Term error count and error ratio
Alarm Seconds
SIG/BIT Monitor. See "Monitoring Signaling Bits " page 78.
HOW TO: 1 If SONET is chosen as the interface, set up the Receive Interface and
Payloadrequired. See "Setting SONETReceive Interface" page 21. If
required set up the Transmit Interface and Payload. See "Setting
SONET Transmit Interface " page 12.
2 If DSn ischosenas the interface, set up the DSnreceiveinterface. See
"Setting DSn Receive Interface " page 19. If required set up the DSn
transmit interface. See "Setting DSn Transmit Interface " page 10.
3 Press to start the measurement.
RUN/STOP
4 If SONET is chosenasthe interface, you can view the analysis results
on the display
RESULTS
DSn PAYLOAD
ERROR ANALYSIS
If DSn is chosen as the interface, you can view the analysis results on
the display.
RESULTS
DSn ERROR ANALYSIS
73
Page 74

Making Measurements
Measuring Frequency
Measuring Frequency
Description The signal frequencyandthe amount of offset from thestandardrate can
be measured to give an indication of probability of errors.
HOW TO: 1 Connect the signal to be measured to the IN port of the DSN Receive
module or the IN port of the Multirate Analyzer module (SONET
electrical) or the IN port of the Optical Interface module (SONET
optical).
NOTE Frequency measurement is always available even if test timing is off.
74
Page 75

Making Measurements
Measuring Optical Power
Measuring Optical Power
Description Optical power measurement can be performed on the SONET signal
connected to the Optical module IN port.
HOW TO: 1 Connect the SONET optical signal to the IN port of the Optical
Interface module.
2 Choose the received input signal rate on the
display.
NOTE Optical power measurement is always available even if test timing is off.
RECEIVE
SONET
75
Page 76

Making Measurements
Measuring Round Trip Delay
Measuring Round Trip Delay
Description: The time taken for voice traffic to pass through the network is very
important. Excessive delay can make speech difficult to understand.
The Round Trip Delay feature of the HP 37718A measures the delay in a
64 kb/s timeslot.
A test pattern is transmitted in the 64 kb/s timeslot and a timer is set
running. A loopback is applied to the network equipment to return the
test signal. The received pattern stops the timer and the Round Trip
Delay is calculated.
NOTE You can only measure Round Trip Delay on a 64 kb/s test signal obtained
from a 34 Mb/s or 2 Mb/s DSn interface or DSn payload signal.
HOW TO: 1 If measuringonan SONET interface, set uptheSONET transmit and
receive interfaces and payloads required. See "Setting SONET
Transmit Interface" page 12 and “SettingSONET Receive Interface”
page 21.
2 If measuring on a DSn interface, set up the DSn transmit and receive
interfaces and payloads required. See “Setting DSn Transmit
Interface” page 10 and “Setting DSn Receive Interface” page 19.
3 Connect a loopback to the network equipment.
76
Page 77

Making Measurements
Measuring Round Trip Delay
4 Choose ACTION to start the measurement.
ON
If measuring on an SONET interface, the results are available on the
RESULTS
DSn PAYLOAD
display.
If measuring on a DSn interface, the results are available on the
display.
RESULTS
DSn
The Round Trip delay measurement range is up to 2 seconds. The
resolution varies with the received interface signal rate:
2 Mb/s 1 microsecond
34 Mb/s 110 microseconds
STS-1,STS-3 0.5 milliseconds
OC-12, OC-48 0.5 milliseconds
77
Page 78

Making Measurements
Monitoring Signaling Bits
Monitoring Signaling Bits
Description The HP 37718A receiver can be used to monitor the state of signaling
bits in received 2 Mb/s signals with timeslot-16 CAS multiframing
(PCM30 or PCM30CRC) and DS1 structured signals.
2.048 Mb/s
Results
DS1 Results D4 and SLC-96 payloads
For 2 Mb/s signals with timeslot-16 CAS multiframing a table showing
the values of A,B,C,D signaling bits in all 30 channels is given.
A table simultaneously showing the state of the A and B signaling bits in
the 6th and 12th frames of a superframe is given. Each frame contains
24 timeslots. In SLC-96 mode A and B choices are 0, 1 or alternating. If
you set bit A or B to alternate, the displayed bit changes to an A, to
indicate that the bit is alternating from 1 to 0. The same signaling is
transmitted in all channels.
ESF Payloads
A table simultaneously showing the state of the A, B, C and D signaling
bits in the 6th, 12th, 18th and 24th frames of a superframe is given.
Each frame contains 24 timeslots.
78
Page 79

Making Measurements
Measuring Service Disruption Time
Measuring Service Disruption Time
Description: Protection switching ensures that data integrity is maintained and
revenue protectedwhenequipment failure occurs. The speedofoperation
of the protection switch can be measured.
The sequence of events involved in measuring the switching time is:
• Pattern Synchronization (no errors) is achieved.
• The protection switch is invoked - Pattern Synchronization is lost.
• The standby line is in place - Pattern Synchronization is regained.
The time interval between pattern sync loss and pattern sync gain is a
measure of the disruption of service due to protection switching.
Service Disruption is chosen on the page except for the
following configuration:
• If you choose a DSn or SONET interface and an ANSI (DS1, DS3)
framed, unstructured payload you must select Service Disruption on
the Transmitter and Receiver display.
RESULTS
TEST FUNCTION
79
Page 80

Making Measurements
Measuring Service Disruption Time
NOTE At DS1 and DS3 Service Disruption results are only available for
Unstructured payloads.
Error Burst Definition
Error bursts start and finish with an error. Bursts of less than 10 us are
ignored.
Bursts are assumed to have completed when >2000ms elapses without
any errors being received.
The longest burst detected is 2 seconds.
Accuracy
300 us for DS1, 2Mb/s and 34Mb/s signals.
60 us for DS3 signals.
HOW TO: 1 If interfacing at SONET set up the SONET transmit and receive
interfaces and payloads required. See "Setting SONET Transmit
Interface " page 12 and "Setting SONET Receive Interface " page 21.
2 If interfacing at DSn set up the DSn transmit and receive interfaces
and payloads as required. See "Setting DSn Transmit Interface "
page 10 and "Setting DSn Receive Interface " page 19.
3 If you choose a DS1 or DS3 framed unstructured payload, choose
SERVICE DISRUPT
on the and
TRANSMIT
RECEIVE
TEST FUNCTION
displays.
80
Page 81

Making Measurements
Measuring Service Disruption Time
4 Press to start the measurement.
RUN/STOP
5 Invoke the protection switch.
6 View the results on the display.
RESULTS
SRVC DISRUPT
Results Displayed
LONGEST - Longest burst of errors during measurement.
SHORTEST - Shortest burst of errors during measurement.
LAST - Length of last burst of errors detected during measurement.
81
Page 82

Making Measurements
Performing a SONET Tributary Scan
Performing a SONET Tributary Scan
Description Tributary Scan tests each tributary for error free operation and no
occurrence of Pattern Loss. A failure is indicated by highlighting the
tributary in which the failure occurred. The
MAIN SETTINGS
, mapping setup determines the tributary structure.
TRANSMIT
The HP 37718A will configure the Transmitter to the Receiver and the
PATTERN is forced to the payload it will fill.
TIP: The SONET Tributary Scan display can be logged to the chosen logging
device. See "Logging on Demand " page 100.
SONET
HOW TO: 1 Set up the transmit and receive SONET interfaces and payload as
required. See "Setting SONET Transmit Interface " page 12 and
"Setting SONET Receive Interface " page 21.
2 Choose the required BIT ERROR THRESHOLD.
This determines the error rate above which a failure is declared.
3 Choose the required TEST TIMING.
The valueyouchoose is the testtimefor each individual tributary and
not the total test time.
For example, 28 VT-1.5 tributaries in an STS-1 SPE - the time taken
to complete the Tributary Scan will be 28 X TEST TIMING choice.
82
Page 83

Making Measurements
Performing a SONET Tributary Scan
4 The Tributary Scan results can be viewed on the
SONET TRIBSCAN
The Scancanbe started on the
display or the display by choosing START.
If the Scan is started on the
display, the HP 37718A changes to the display.
display.
RESULTS
TRANSMIT
TRANSMIT
SONET TEST FUNCTION
RESULTS
If a single path, for example, MAPPING is chosen, then
Tributary Scan is disabled.
NOTE The keyboard is locked during tributary scan.
RESULTS
SONET TEST FUNCTION
STS-3c SPE
83
Page 84

Making Measurements
Performing an SONET Alarm Scan
Performing an SONET Alarm Scan
Description SONET Alarm Scan tests each channel for alarm free operation and
identifies and indicates any Unequipped channels.
You can configure the Scan to check for the occurrence of any Path layer
CV errors above a chosen threshold.
The channel in which an alarm occurred is highlighted if any of the
following alarms occur:
STS SPE: LOP-P, RDI-P, AIS-P,
VT-1.5: LOP-P, AIS-P, RDI-P, H4 LOM, LOP-V, AIS-V, RDI-V
TIP: The SONET Alarm Scan display can be logged to the chosen logging
device. See "Logging on Demand " page 100.
HOW TO: 1 Set up the receive SONET interface and payload as required. See
“Setting SONET Receive Interface” page 21.
2 Choose on the display.
SONET ALM SCAN
RESULTS
3 Choose AUTO or RX SETTINGS.
RX SETTINGS: The scan checks the structure set on the
SONET
display.
RECEIVE
AUTO: The scan checks the structure being received. This can be
particularly useful when receiving mixed payloads.
4 Choose the CV error threshold.
5 Choose to start the Alarm Scan.
START
84
Page 85

Making Measurements
Performing a DSn Alarm Scan
Performing a DSn Alarm Scan
Description DSn Alarm Scan tests each channel for the following alarms:
Frame Loss
RAI
AIS
The channel in which an alarm occurs is highlighted.
HOW TO: 1 Setupthe receiveDSn interfaceasrequired. See“Setting DSnReceive
Interface” page 19.
2 Choose to start the Alarm Scan.
ON
85
Page 86

Making Measurements
Performing a DSn Alarm Scan
86
Page 87

4
4 Storing, Logging and Printing
Page 88

Storing, Logging and Printing
Saving Graphics Results to Instrument Store
Saving Graphics Results to Instrument
Store
Description Graphical representation of measurement results is very useful
particularly during a long measurement period. It provides an overview
of the results and can be printed for record keeping.
Graphics results can be stored in instrument graph storage or on floppy
disk.
HOW TO: 1 Before starting your measurement, choose the GRAPH STORAGE
resolution and location.
The resolution chosen affects the ZOOM capability when viewing the
bar graphs. If 1 MIN is selected, 1 MIN/BAR, 15 MINS/BAR and 60
MINS/BAR are available. If 15 MINS is selected, 15 MINS/BAR and
60 MINS/BAR are available. If 1 HOUR is selected, 60 MINS/BAR is
available.
The graphics results can be stored in the instrument - INTERNAL or
stored on DISK. Storage to disk will use a default file name unless a
file name is specified on the display. See
“Saving Graphics Results to Disk” page 126.
2 Press to start the measurement. Graphical results will be
stored in the chosen location.
88
RUN/STOP
OTHER
FLOPPY DISK
Page 89

Storing, Logging and Printing
Recalling Stored Graph Results
Recalling Stored Graph Results
Description Results stored from a previous measurement can be recalled to the
graphics displays for viewing and printing.
HOW TO: 1 If currently viewingthebar graph display, select then
STORE STATUS
select .
STORE STATUS
. If currently viewing the error or alarm summary,
TEXT RESULTS
2 Using and , move the highlighted cursor to the store location
which contains the required results.
If therequiredresults are stored onDisk,move the highlighted cursor
to DISK and choose RECALL GRAPHICS on the FLOPPY DISK
display. See “Recalling Graphics Results from Disk” page 131.
3 Choose if you wish to view the bar graphs.
GRAPH RESULTS
The display will change to the bar graph display of the highlighted
results.
4 Choose if you wish to view the error and alarm
TEXT RESULTS
Summaries.
The display will change to the text results display of the highlighted
results.
DELETE STORE
If is chosen, a ;
DELETE ALL
deletes the results in the highlighted store.
CONFIRM DELETE ABORT DELETE
choice prevents accidental deletion of all the stored results.
89
Page 90

Storing, Logging and Printing
Recalling Stored Graph Results
The top row of the display comprises five fields:
Store Memory location in whichthedisplayedbar graph data
is stored. Move the highlighted cursor, to the STORE
location desired, using and .
Start Date The start date of the test, which produced the stored
results.
Start Time The start time of the test, which produced the stored
results.
Test Duration The duration of the test, which produced the stored
results.
Store Use The percentage (%) of the overall storage capacity
occupied by each set of stored results. The TOTAL
percentage used and the percentage still FREE is
provided at the bottom of the STORE USE column.
90
Page 91

Storing, Logging and Printing
Viewing the Bar Graph Display
Viewing the Bar Graph Display
Description All the graphic results obtained during the measurement are available
for viewing. Identify a period of interest and zoom in for more detailed
examination.
HOW TO: 1 To view the current bar graphs, press and use
CHANGE UPPER
and to obtain the bar graphs
CHANGE LOWER
GRAPH
required.
2 To view previously stored graphs, see "Recalling Stored Graph
Results " page 89.
3 For more detailed inspection of the bar graph, position the cursor
centrally within the area of interest using , and select
ZOOM IN
to reduce the time axis to 15 MINS/BAR. This is only
possible if the graphics results were stored with a STORAGE
resolution of 1 SEC,1 MINS or 15 MINS.
For further reduction of the time axis to 01 MINS/BAR or 01 SECS/
BAR, position the cursor centrally within the area of interest and
select until the required time axis is obtained.
ZOOM IN
The top row of the display comprises three fields:
Store Memory location in whichthedisplayedbar graph data
is stored. Store can only be changed when the status of
stored results is displayed. See "Recalling Stored
Graph Results " page 89.
91
Page 92

Storing, Logging and Printing
Viewing the Bar Graph Display
Zoom The width, in minutes, of each "bar" in the bar graph,
controlled by / .
ZOOM IN ZOOM OUT
Cursor The cursor position in terms of time and date,
controlled by and . The cursor position changes
in steps of 1 second, 1 minute, 15 minutes or 60
minutes dependentupontheZOOM setting. The cursor
is physically located between the two graphs.
92
Page 93

Storing, Logging and Printing
Viewing the Graphics Error and Alarm Summaries
Viewing the Graphics Error and Alarm
Summaries
Description The error and alarm summaries of the measurement chosen are
displayed on the display. The error summary or alarm
summary can be viewed at any time.
TEXT RESULTS
HOW TO: 1 To view the error or alarm summary associated with the current bar
graphs, press then .
2 Toview the errororalarm summary associatedwithpreviously stored
bar graphs, see "Recalling Stored Graph Results " page 89.
3 To view the Alarms which have occurred during the measurement,
select .Use toviewthe DSn/DSn;
and SONET Alarm Summaries in turn if applicable.
4 To view the Errors which have occurred during the measurement
select .Use toviewthe DSn/DSn;
and SONET Error Summaries in turn if applicable.
The top row of the display comprises three fields:
Store Memory location in which the bar graphs, error
ALARM SUMMARY NEXT SUMMARY
ERROR SUMMARY NEXT SUMMARY
GRAPH
summary and alarm summary are stored.
Store can only be changed when the status of stored
results is displayed. See "Recalling Stored Graph
Results " page 89.
TEXT RESULTS
93
Page 94

Storing, Logging and Printing
Viewing the Graphics Error and Alarm Summaries
Start The start time and date of the test, that produced the
displayed results.
Stop The stop time and date of the test, that produced the
displayed results.
94
Page 95

Storing, Logging and Printing
Logging Graph Displays
Logging Graph Displays
Description The bar graphs and error and alarm summariescanbeloggedtothe disk
for printing at a later date.
If Option 601, Remote Control, is fitted, the bar graphs and error and
alarm summary can be logged to an external HP DeskJet printer at the
end of the test period. If a printer is not immediately available, the
graphics results remain in memory and can be logged at a later time
when a printer becomes available.
HOW TO: Log to an External Printer
1 Connect an external RS-232-C HP DeskJet printer to the HP 37718A
RS232 port. See "Logging Results to RS-232-C Printer " page 105 or
connect an external HP-IB HP DeskJet printer to the HP 37718A HPIB port. See "Logging Results to HP-IB Printer " page 103 or connect
a Parallel DeskJet printer to the HP 37718A Parallel port. See
"Logging Results to Parallel (Centronics) Printer " page 102.
2 Make the required selections on the display:
LOGGING PORT [HPIB] or [RS232] or [PARALLEL] and LOGGING
[ON].
3 TologtheErrorandAlarmsummaries, the displayed Bar graphs and
the Alarm graph to the printer, choose on the bar graph
display.
OTHER
PRINT
LOGGING
95
Page 96

Storing, Logging and Printing
Logging Graph Displays
4 Choose to confirm or abort the print.
Toconfirmthe print and only print the portion of the graph displayed
and the summaries choose .
To confirm the print and print the graph for the whole measurement
period and the summaries choose .
To abort the print choose .
5 To log the selected Error and Alarm summaries to the printer, choose
PRINT
on the Text Results display.
HOW TO: Log to the Disk Drive
1 Insert a floppy disk in the disk drive.
THIS SCREEN
CURSOR TO END
ABORT
2 Choose LOGGING PORT on the display.
Enter a filename on the display. See "Saving
DISK
OTHER
OTHER
FLOPPY DISK
LOGGING
Data Logging to Disk " page 128.
3 TologtheErrorandAlarmsummaries, the displayed Bar graphs and
the Alarm graph to the disk, choose on the bar graph display.
PRINT
4 Choose to confirm or abort the print.
Toconfirmthe print and only print the portion of the graph displayed
and the summaries choose .
THIS SCREEN
To confirm the print and print the graph for the whole measurement
period and the summaries choose .
To abort the print choose .
ABORT
CURSOR TO END
5 To log the selected Error and Alarm summaries to the disk, choose
PRINT
on the Text Results display.
96
Page 97

Storing, Logging and Printing
Logging Results
Logging Results
Description Test Period Logging
If degradations in system performance can be observed at an early stage,
then the appropriate remedial action can be taken to maximize circuit
availability and avoid system crashes. Test period logging allows you to
monitor the error performance of your circuit. At the end of the test
period the selected results are logged. Results can be logged at regular
intervals during the test period by selecting a LOGGING PERIOD of
shorter duration than the test period. An instant summary of the results
can be demanded by pressing without affecting the test in
progress.
Error Event Logging
Manual tracing of intermittent faults is time consuming. Error event
logging allows you to carry out unattended long term monitoring of the
circuit. Each occurrence of the selected error event is logged.
PRINT NOW
The results obtained during the test are retained in memory until they
are overwritten by the next set of results. The results can be logged at
any time during the test period and at the end of the test period. The
results required are selected using LOGGING
SETUP .
CONTROL
OTHER
LOGGING
Any Alarm occurrence results in a timed and dated message being
logged.
BER and Analysis results can be selected by the user.
Cumulative and Period versions of the results are calculated and can be
selected by the user.
Period The results obtained over a set period of time during
the test. The Period is defined by the LOGGING
PERIOD selection.
Cumulative The results obtained over the time elapsed since the
start of the test.
The results can be logged to the following devices, selectable using
OTHER
LOGGING DEVICE
LOGGING SETUP :
97
Page 98

Storing, Logging and Printing
Logging Results
• Optional Internal printer fitted into the instrument front cover
(Option 602)
• External HP-IB printer (option 601)
• External RS-232-C printer (option 601)
• External Parallel Port printer (option 601)
• Disk Drive
HOW TO: 1 Choose LOGGING [ON] - enables the logging of results and alarms.
2 Choose LOGGING PERIOD - determines how regularly the results
and alarms are logged.
USER PROGRAM provides a choice of 10 minutes to 99 hours.
3 Choose RESULT LOGGED - allows you to log all results to or choose
only those results you require.
4 Choose WHEN - allows you to choose to only log when the error count
for the logging period isgreaterthan0. If the error count is 0 then the
message NO BIT ERRORS is displayed.
5 Choose CONTENT - allows you a choice of error results to be logged.
Error Results, Analysis or Error and Analysis (ER & ANAL)
and
Period, Cumulative or Period and Cumulative (PER & CUMUL).
6 If LOG ERRORSECONDS[ON] is chosen a timedanddated message
is logged each time an error second occurs (excessive occurrences of
error seconds during the logging period will result in heavy use of
98
Page 99

Storing, Logging and Printing
Logging Results
printer paper).
7 Choose the logging DEVICE.
If RS232 is chosen, see "Logging Results to RS-232-C Printer "
page 105.
If HPIB is chosen, see "Logging Results to HP-IB Printer " page 103.
If PARALLEL ischosen,see "LoggingResultsto Parallel(Centronics)
Printer " page 102.
If DISK is chosen, see “Saving Data Logging to Disk” page 128.
If Option602,Internal Printer, is fittedandINTERNAL is chosen, see
"Logging Results to Internal Printer " page 104.
99
Page 100

Storing, Logging and Printing
Logging on Demand
Logging on Demand
Description When is pressed the chosen results are logged to the chosen
logging device. The choice of results for logging is:
PRINT NOW
RESULTS SNAPSHOT - last recorded measurement results
OVERHEAD SNAPSHOT - last recorded overhead values of the chosen STS-3
OVERHEAD CAPTURE - Overhead Capture display
SCREEN DUMP - allows logging of the chosen display
POINTER GRAPH - Pointer Graph display
SONET TRIBUTARY SCAN - SONET Tributary Scan display
SONET ALARM SCAN - SONET Alarm Scan display
SELTEST FAILS - Last recorded selftest failures
HOW TO:
1 Choose LOG ON DEMAND to determine results to be logged when
PRINT NOW
SCREEN DUMP allows you to log the selected display when
PRINT NOW
using this feature).
2 Choose the logging DEVICE.
If RS232 is chosen, see "Logging Results to RS-232-C Printer "
page 105.
If HPIB is chosen, see "Logging Results to HP-IB Printer " page 103.
100
is pressed.
is pressed. (Logging or Disk displays cannot be logged
 Loading...