

Page 1

HP 37717C
Communications
Performance Analyzer
PDH Concept
Guide
Page 2

Copyright HewlettPackard Ltd. 1998
All rights reserved.
Reproduction, adaption,
or translation without prior
written permission is
prohibited, except as
allowed under the
copyright laws.
Information in this
document may apply to
modules which use the
VxWORKS TM software.
The VxWORKS TM
software was developed by
Wind River Systems, Inc.,
which has copyright to it.
HP Part No. 37717-90407
First edition, March 98
Printed in U.K.
Documentation
Warranty
The information contained
in this document is subject
to change without notice.
Hewlett-Packard mak es no
warranty of any kind with
regard to this material,
including, but not limited
to, the implied warranties
or merchantability and
fitness for a particular
purpose.
Hewlett-Packard shall not
be liable for errors
contained herein or for
incidental or
consequential damages in
connection with the
furnishing, performance,
or use of this material.
WARNING
Warning Symbols Used
on the Product
!
The product is marked
with this symbol when the
user should refer to the
instruction manual in order
to protect the apparatus
against damage.
The product is marked
with this symbol to
indicate that hazardous
voltages are present
The product is marked
with this symbol to
indicate that a laser is
fitted. The user should
refer to the laser safety
information in the
Calibration Manual.
Hewlett-Packard Limited
Telecommunications Networks Test Division
South Queensferry
West Lothian, Scotland EH30 9TG
Page 3

PDH Concept Guide
HP 37717C Communications
Performance Analyzer
Page 4

About This Book
The information on PDH testing in this book covers the following subjects:
• An Introduction to PDH, the PDH modules and their features.
• Measurement examples.
• Measurement result definitions
• Logging messages
iv
Page 5

Contents
1 Introduction to PDH Testing
Introduction to PDH / DSn 2
Unstructured PDH Generation and Measurement. Option UKK (USB)
3
Structured PDH Generation and Measurement. Options UKJ (USA)
and UKN (USE) 4
Binary Interfaces. Option UH3 (US7) 5
Multiple PDH Outputs. Option UHC (US6) 6
DS1, DS3, E1 and E3 Transmit and Receive Interfaces for PDH/DSn
Payloads. Option 110 7
2 PDH / DSn Testing
Alarm Monitoring 10
Analysis of N x 64 kb/s 13
BERT Testing 17
Cross Multiplexer Testing 22
FAS Monitoring 28
Frequency Measurement 32
Frequency Offset Tolerance 35
Multiplexer Testing 39
Round Trip Delay 44
M.2100, M.2110, M.2120 Analysis 47
3 Result Definitions
Trouble Scan 52
Short Term Results 53
v
Page 6

Contents
Cumulative Results 54
PDH Error Analysis G.821, G.826, M.2100, M.2110, M.2120 55
Alarm Seconds 70
Frequency Measurement 71
4 PDH Logging Messages
Logging Devices 74
Results Logging 75
vi
Page 7

1
Introduction to PDH / DSn page 2
Unstructured PDH Generation and Measurement. Option UKK (USB) page 3
Structured PDH Generation and Measurement. Options UKJ (USA) and UKN (USE) page 4
Binary Interfaces. Option UH3 (US7) page 5
Multiple PDH Outputs. Option UHC (US6) page 6
DS1, DS3, E1 and E3 Transmit and Receive Interfaces for PDH/DSn Payloads. Option 110
page 7
1 Introduction to PDH Testing
Information on PDH in general and the PDH test
features of the HP 37717C.
Page 8

Introduction to PDH Testing
Introduction to PDH / DSn
Introduction to PDH / DSn
The Plesiochronous Digital Hierarchy (PDH / DSn) is still the dominant
technology in most existing telecommunications networks throughout
the world, although it is being replaced in many networks by
Synchronous Digital Hierarchy (SDH) or SONET networks. PDH / DSn
networks were developed at a time when point-to-point transmission was
the predominant network requirement. To support this requirement, the
standard approach to network management and maintenance was to use
manual distribution frames for access to individual signals. This is now
considered out of date and consequently SDH / SONET is now the
preferred network topology for new installations.
However PDH / DSn networks will exist for a long time to come even in
networks where SDH /SONET is the preferred technology. PDH is the
ETSI international standard, based on 2 Mb/s, defined by the ITU-T, and
covers the hierarchal transmission rates of 2 Mb/s, 8 Mb/s, 34 Mb/s and
140 Mb/s. DSn is the ANSI standard covering transmission rates of 1.544
Mb/s (DS1) and 44.736 Mb/s (DS3). PDH is asynchronous at 8 Mb/s, 34
Mb/s and 140 Mb/s. In order to access a signal, for rerouting or test
purposes, the whole line signal structure must be demultiplexed step by
step down to the 2 Mb/s level, because of the asynchronous nature of the
multiplexing.
At each multiplexing step, the bit rate of the individual tributary signals
is controlled within specified limits and is not synchronized with the
multiplex equipment. Because the bit rates of the individual tributaries
are controlled within specific limits this type of multiplexing is referred
to as Plesiochronous i.e. nearly synchronous. The individual tributaries
are synchronized with the equipment at each multiplex step by the
process of positive bit stuffing justification.
In new SDH / SONET networks, PDH / DSn signals are mapped into
virtual containers / tributaries before being transported as part of the
SDH / SONET payload. The SDH / SONET payload must then be
demapped into a PDH / DSn tributary signal.
Therefore all PDH / DSn, SDH / SONET and mixed PDH/SDH DSn /
SONET networks require test sets which have PDH / DSn interfaces and
PDH / DSn test capability.
2
Page 9

Introduction to PDH Testing
Unstructured PDH Generation and Measurement. Option UKK (USB)
Unstructured PDH Generation and Measurement. Option
UKK (USB)
Option UKK (USB), Unstructured PDH, provides generation and
measurement of unstructured PDH at interface rates of 704 kb/s,
2.048 Mb/s, 8.448 Mb/s, 34.368 Mb/s and 139.264 Mb/s
Allows the addition of Frequency Offset to the PDH signal
Provides 75 Ω unbalanced or 120 Ω balanced input and output
interfaces.
Allows selection of PRBS, WORD or USER patterns
Allows selection of Line Code AMI, HDB3 or CMI
Provides an ECL pulse each time an error occurs (Error Out)
Option UKK [USB]
3
Page 10
Introduction to PDH Testing
Structured PDH Generation and Measurement. Options UKJ (USA) and
UKN (USE)
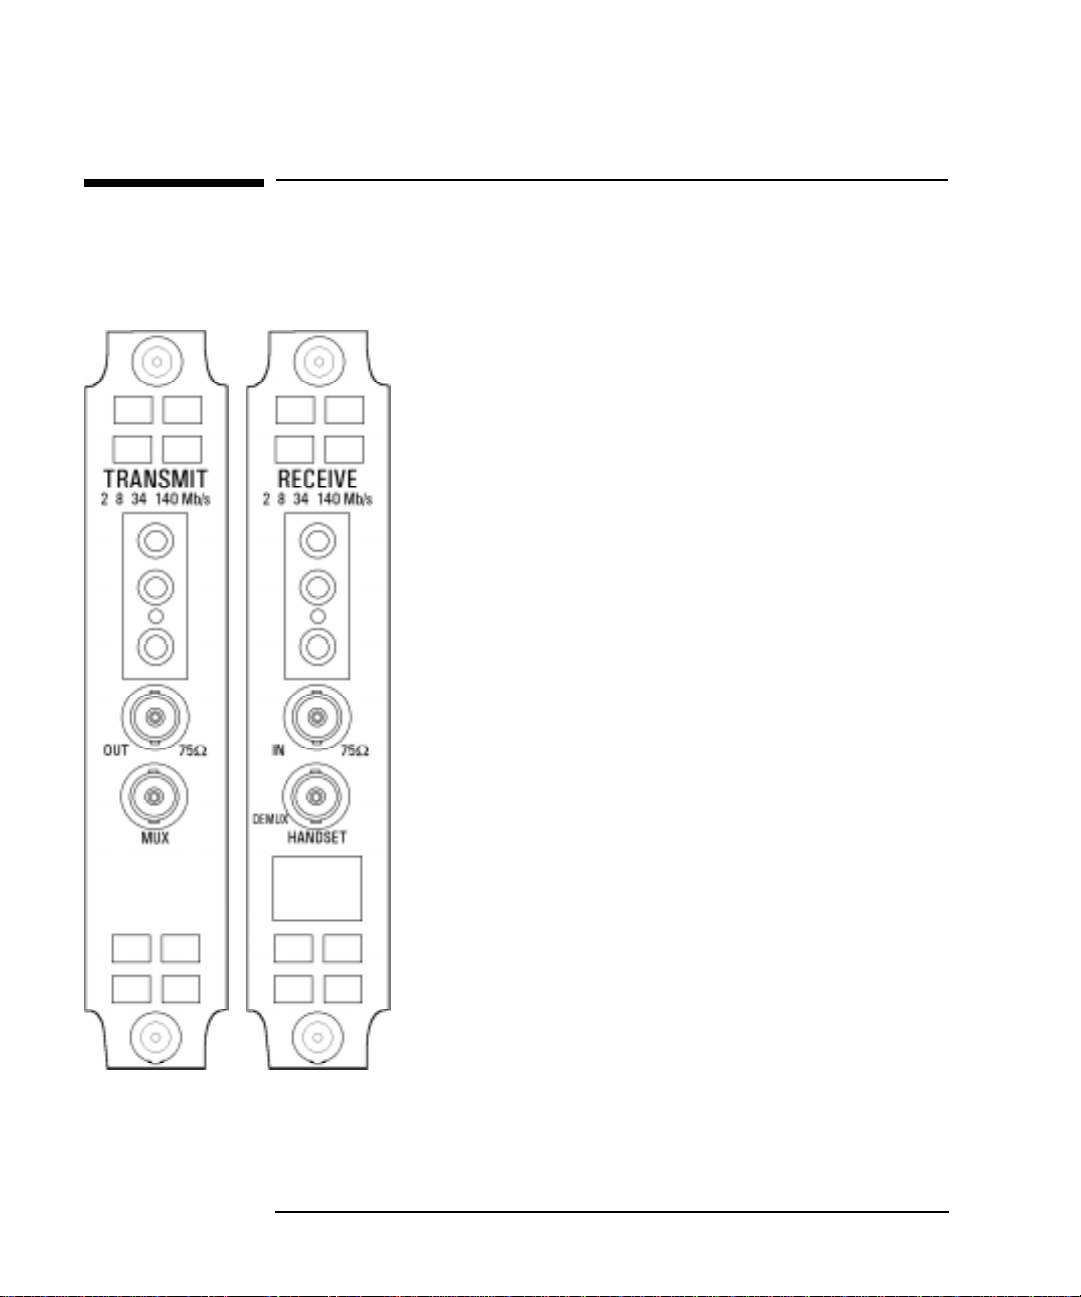
Structured PDH Generation and Measurement. Options
UKJ (USA) and UKN (USE)
Options UKJ (USA) and UKN (USE), provide
generation and measurement of Structured or
Unstructured PDH at interface rates of 2.048 Mb/s (E1),
8.448 Mb/s (E2), 34.368 Mb/s (E3) and 139.264 Mb/s
(E4).
Structured test signal rates of 64 kb/s, 2.048 Mb/s, 8.448
Mb/s and 34.368 Mb/s are provided.
Frequency Offset can be added at the interface rates.
Line rate frequency can be measured.
Provides 75 Ω unbalanced or 120 Ω balanced input and
output interfaces.
Allows selection of PRBS, WORD or USER patterns
Option UKJ (USA)
Allows selection of Line Code AMI, HDB3 or CMI
Interface and test signal rates can be Framed or
Unframed
MUX connector allows a 2 Mb/s signal from external
equipment to be inserted into the HP 37717C test
signal.
DEMUX connector allows a 2 Mb/s signal from the HP
37717C to be Dropped to external equipment.
Option UKN (USE) also provides generation and
measurement of PDH signals with ATM payloads.
Information on the ATM capabilities of the UKN (USE)
module is given in the “Users Guide” and the “ATM
Concept Guide”.
4
Page 11
Introduction to PDH Testing
Binary Interfaces. Option UH3 (US7)
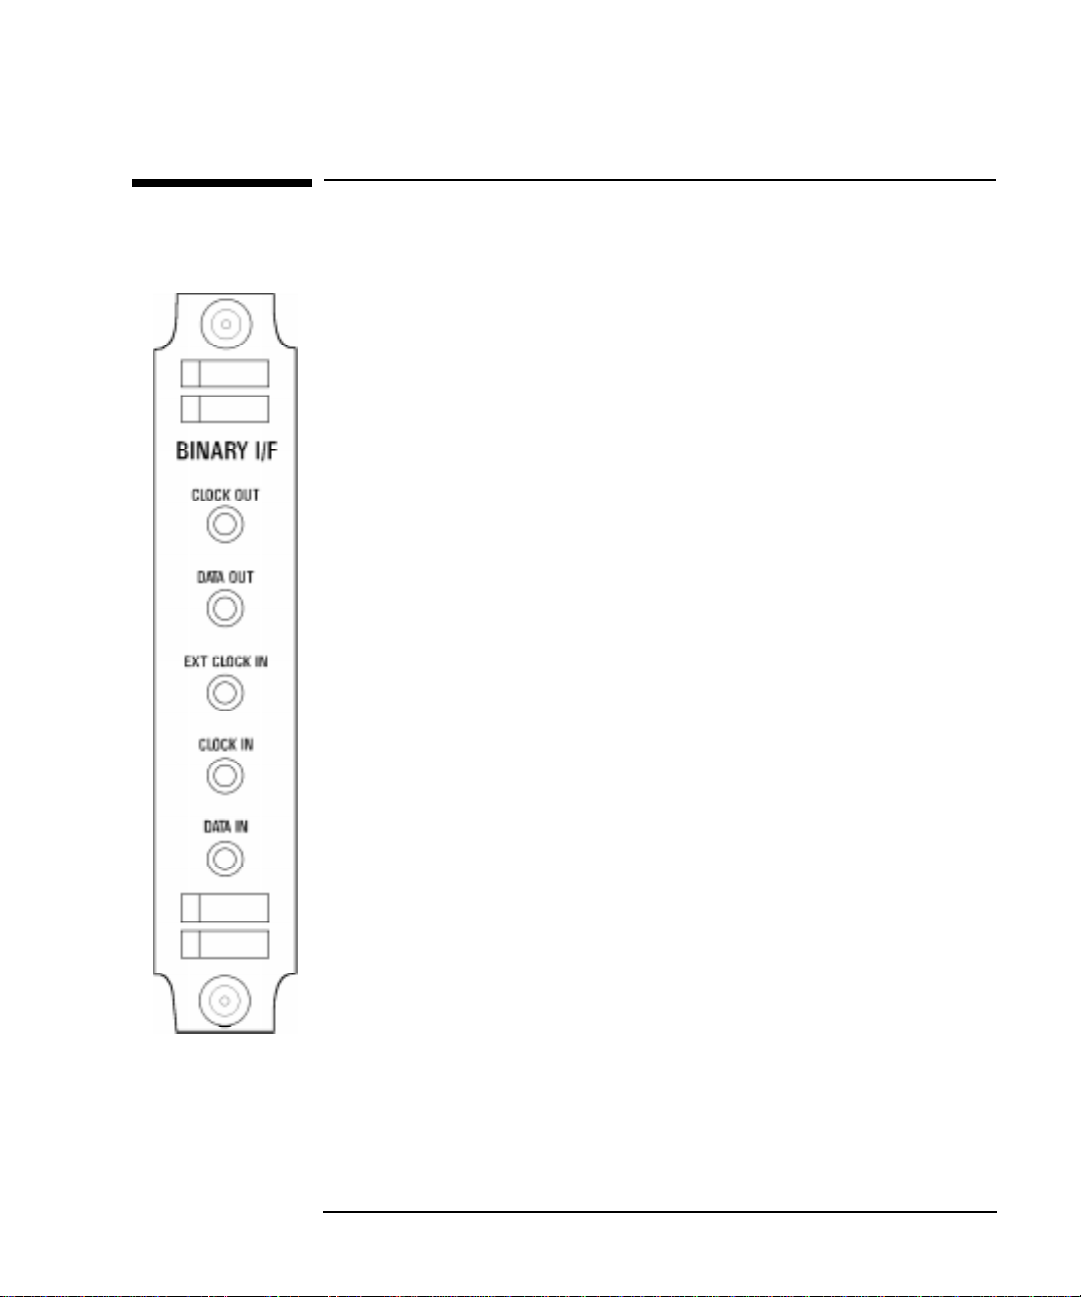
Binary Interfaces. Option UH3 (US7)
Option UH3 (US7) provides binary NRZ interfaces for the structured
PDH module option UKJ (USA), and the unstructured PDH module
option UKK (USB).
The interfaces can operate at any of the standard rates ± 100 ppm.
When used with option UKK (USB), with an external binary clock input,
the interfaces can operate at any rate in the range 700 kb/s to
170 Mb/s.
TTL signal levels, at data and clock ports, and external clock port, are
valid from 700 kb/s to 50 Mb/s, 75Ω to ground.
ECL signals, at data and clock ports, and external clock port, are valid
from 700 kb/s to 170 Mb/s, 75Ω to -2V.
The external clock input may be used to clockcoded data from the PDH
/ DSn transmitter at standard rates. In addition if Option UKK (USB),
Unstructured PDH, is fitted can clock coded data in the range 700 kb/s
to 170 Mb/s.
Option UH3 (US7)
Simultaneous jitter of binary clock and binary data outputs is possible
(2, 8, 34 & 140 Mb/s) if Option UHK (USB) or A3K, Jitter Generator, is
fitted.
Jitter measurement on the binary clock input is possible (2, 8, 34 & 140
Mb/s ±;100 ppm) if Option UHN, A3L, A3V or A3N , Jitter Measurement,
is fitted.
Frequency measurement of the external clock input and binary clock
input is provided.
5
Page 12
Introduction to PDH Testing
Multiple PDH Outputs. Option UHC (US6)
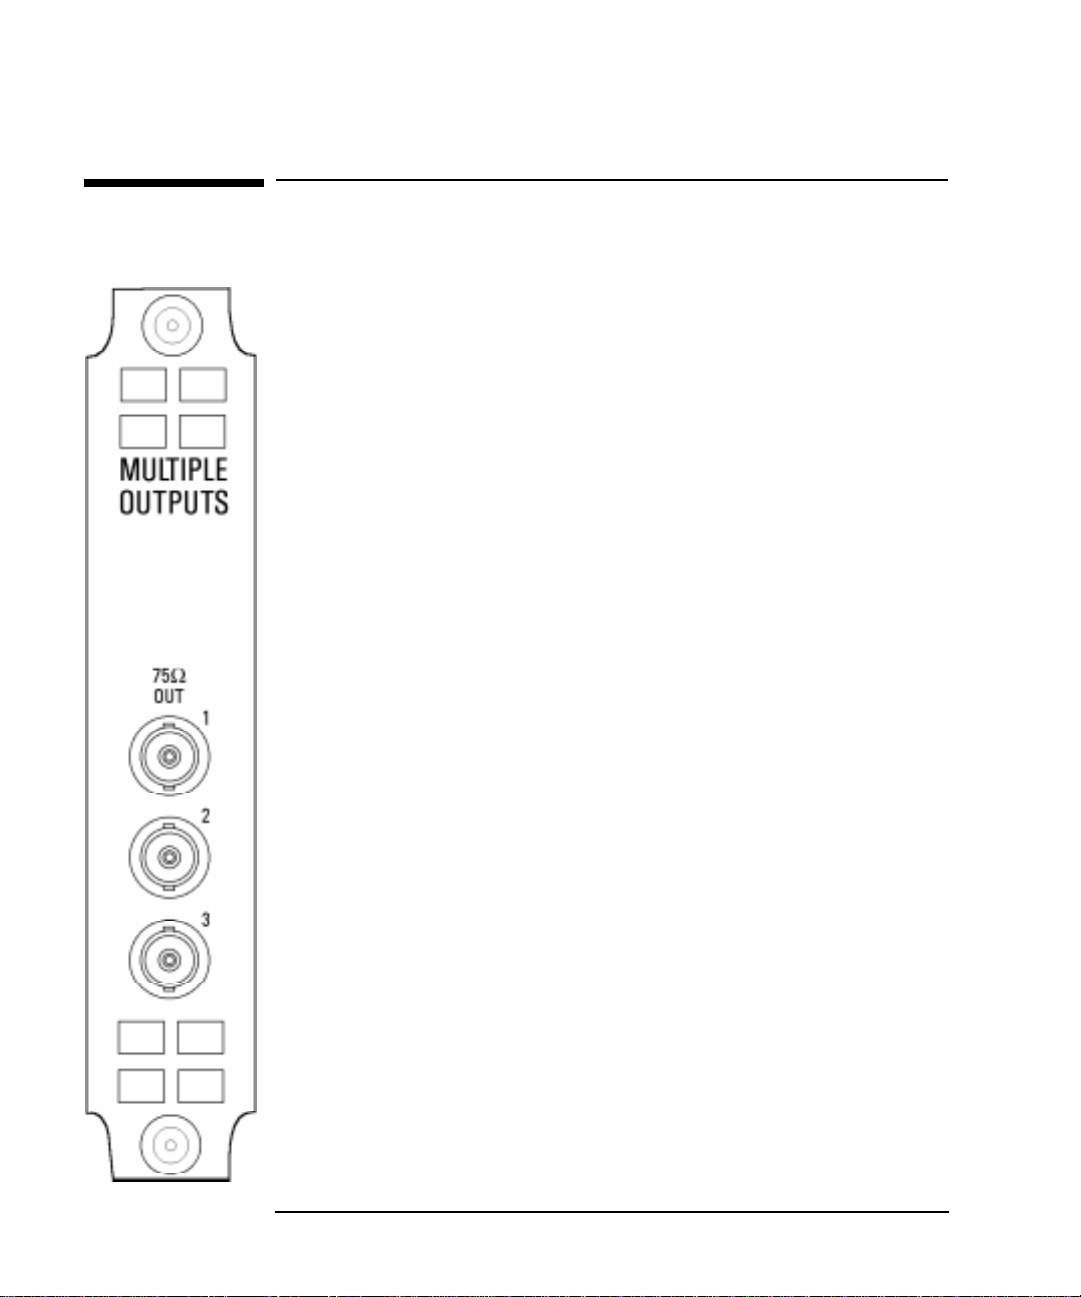
Multiple PDH Outputs. Option UHC (US6)
Option UHC (US6), Multiple PDH Outputs, provides three additional
75Ω PDH outputs.
OUT 1 is delayed by 4 bits relative to the main PDH OUT.
OUT 2 is delayed by 8 bits relative to the main PDH OUT.
OUT 3 is delayed by 12 bits relative to the main PDH OUT.
6
Page 13
Introduction to PDH Testing
DS1, DS3, E1 and E3 Transmit and Receive Interfaces for PDH/DSn
Payloads. Option 110
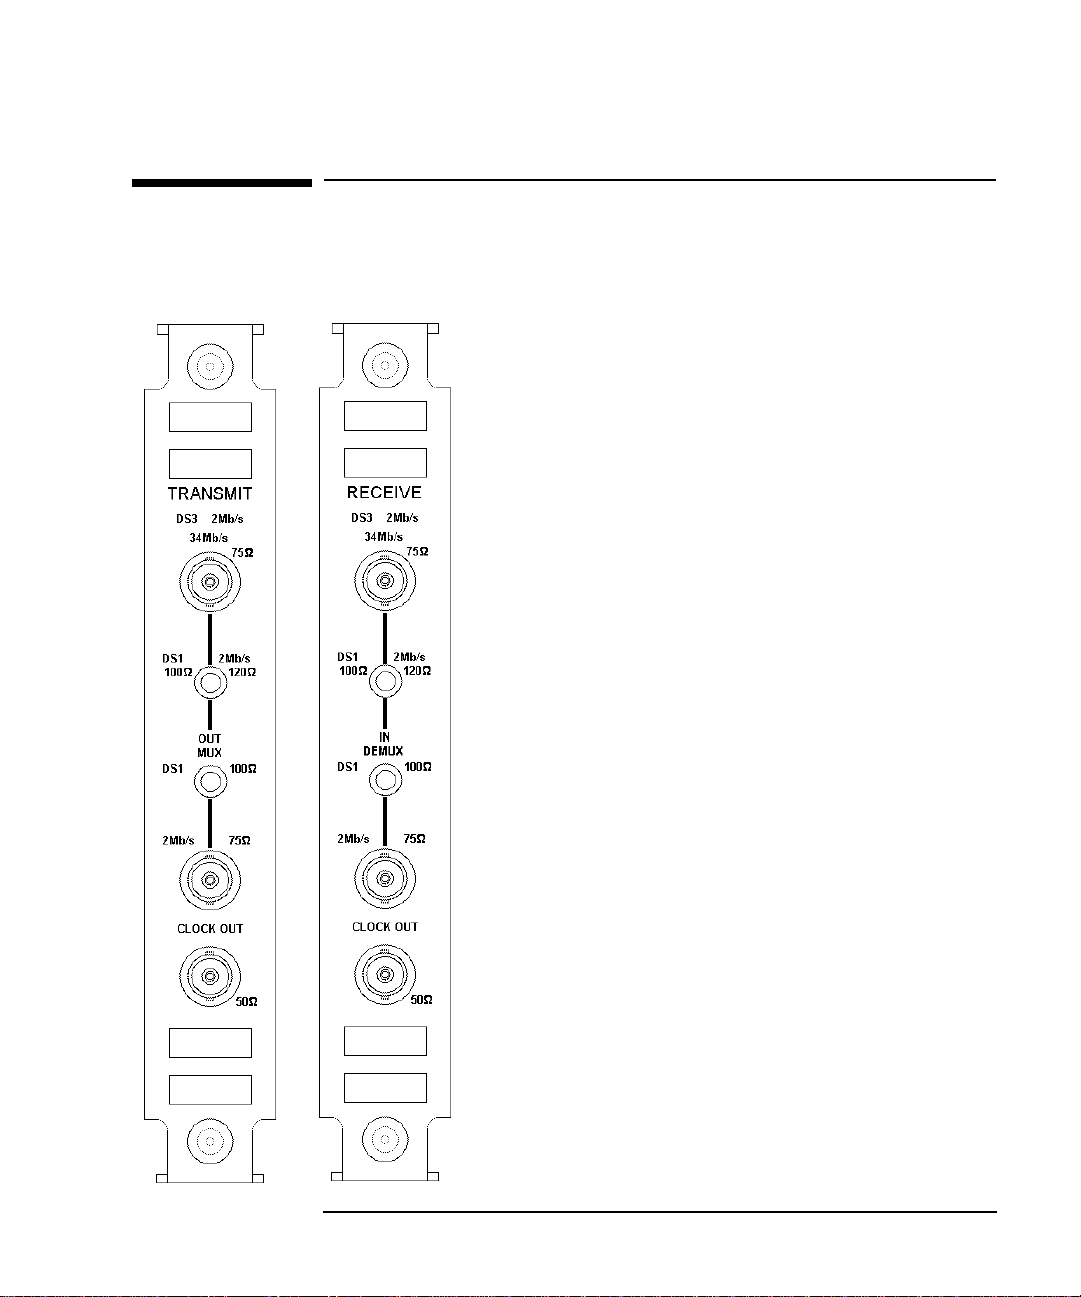
DS1, DS3, E1 and E3 Transmit and Receive Interfaces for PDH/
DSn Payloads. Option 110
Option 110, provides generation and measurement of
PDH /DSn signals at interface rates of: 1.544 Mb/s (DS1),
44.736 Mb/s (DS3), 2.048 Mb/s (E1), and 34.368 Mb/s (E3).
Frequency Offset can be added at the interface rates.
Line rate frequency can be measured.
Provides the following RZ input and output interfaces:
DS3 and E3: 75 Ω unbalanced
E1: 75 Ω unbalanced, 120 Ω balanced.
DS1: 100 Ω balanced.
Allows selection of Line Code as:
AMI or B8ZS at DS1
AMI or HDB3 at 2Mb/s.
At DS3 the line code is fixed at B3ZS.
At 34 Mb/s the line code is fixed at HDB3.
Provides Input sensitivity level selection.
Provides output level control for DS1 and DS3.
DS1: DSX-1 or DS1-LO
DS3: DS3-HI, DSX-3 or DS3-900’.
Allows errors and alarms to be injected into the test signal.
An E1 Drop/Insert port allows an E1(2.048 Mb/s) signal to be
dropped/inserted from a E3 (34 Mb/s) signal. In conjunction
with the SONET/SDH test module (option 120), this port
allows the insertion of E1 into a TU-12/VT2.
A DS1 Drop/Insert port allows a DS1 signal to be dropped/
inserted from a DS3 or TU-11/VT1.5 when used in
conjunction with the SONET/SDH test module.
7
Page 14

Introduction to PDH Testing
DS1, DS3, E1 and E3 Transmit and Receive Interfaces for PDH/DSn
Payloads. Option 110
8
Page 15

2
Alarm Monitoring page 10
Analysis of N x 64 kb/s page 13
BERT Testing page 17
Cross Multiplexer Testing page 22
FAS Monitoring page 28
Frequency Measurement page 32
Frequency Offset Tolerance page 35
Multiplexer Testing page 39
Round Trip Delay page 44
M.2100, M.2110, M.2120 Analysis page 47
2 PDH / DSn Testing
This Chapter gives examples of the instrument
operation in typical PDH test applications.
Page 16

PDH / DSn Testing
Alarm Monitoring
Alarm Monitoring
Options Required Structured PDH UKJ (USA), 110 or UKN (USE)
Application
Problems in the network at all levels in the hierarchy can be detected by the
occurrence of alarms in each tributary of structured PDH systems.
Using the HP 37717C in a receive only mode, each tributary can be scanned and the
state of Frame Loss, Remote (RAI) and AIS alarms viewed on the
display.
Default (Known State) Settings
It can be advisable to set the HP 37717C to a known state prior to setting up to make
a measurement. This clears all previous settings and provides a clearly defined
instrument state. Select , , set STORED
SETTINGS NUMBER to 0 and ACTION to .
OTHER
STORED SETTINGS
RECALL
RESULTS
Test Setup Procedure (Alarm Monitoring)
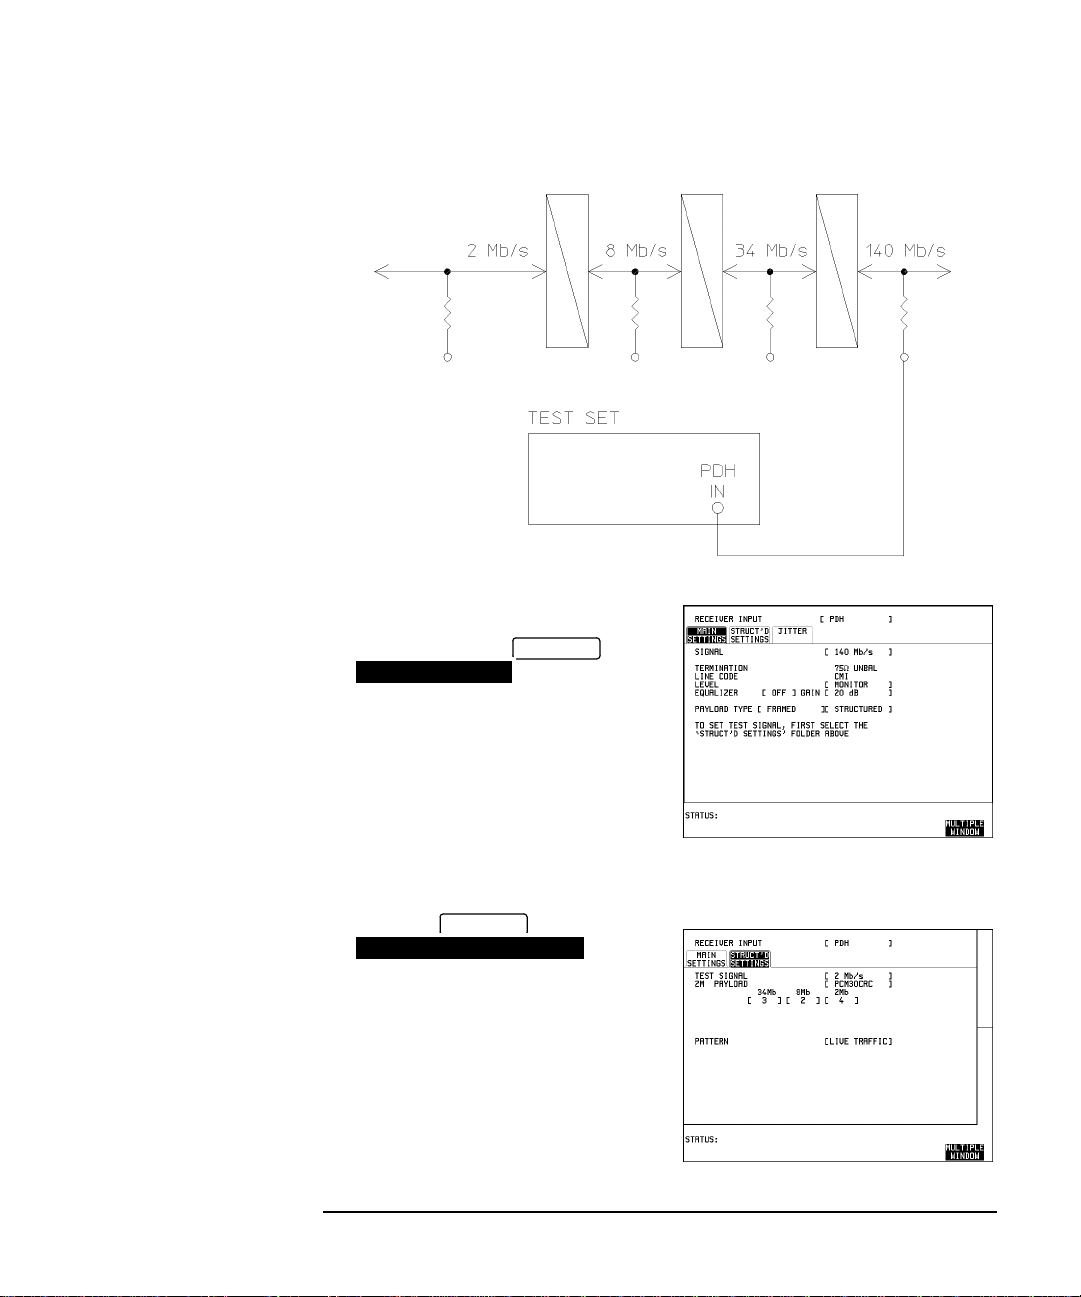
This setup procedure is based on Structured PDH 140 Mb/s line traffic interfaced at
the line equipment 75 Ω protected Monitor point. If a protected Monitor Point is not
available then an HP 15510A Protective Probe may be used at an unprotected
Monitor point.
When 120 Ω Balanced alarm monitoring is desired at an unprotected Monitor point
use an HP 15511A Protective Monitor Probe. The instrument is used in a receive
only mode to monitor Frame Loss, AIS and Remote alarms.
10
Page 17
PDH / DSn Testing
Alarm Monitoring
1 Connect the HP 37717C to the line
terminal equipment protected Monitor
point and set up the display
MAIN SETTINGS
RECEIVE
as shown opposite.
The GAIN and EQUALIZER settings
should be set to optimize the received
signal.
2 Set up the display
STRUCTURED SETTINGS
RECEIVE
as shown
opposite.
2M PAYLOAD determines the Framing
and selection which should match that of
the network equipment.
11
Page 18
PDH / DSn Testing
Alarm Monitoring
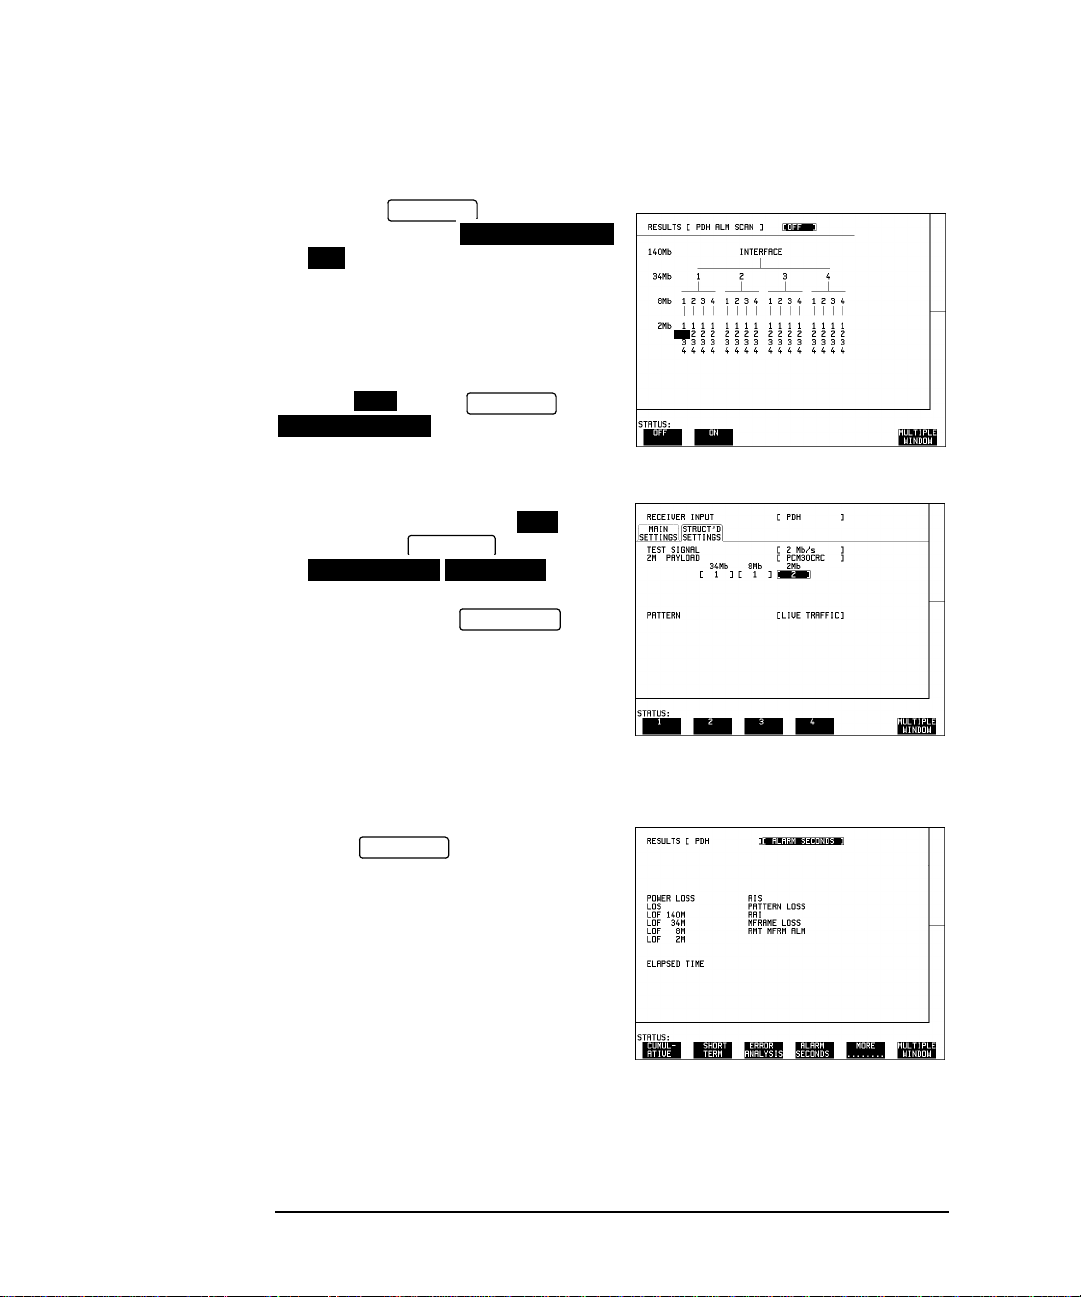
Start the Test (Alarm Monitoring)
1 Set up the display as shown
opposite and select
ON
RESULTS
PDH ALM SCAN
.
If any of the three alarms, Frame Loss,
RAI or AIS has occurred the appropriate
point in the hierarchy will be highlighted.
The test can be halted at any time by
selecting on the
PDH ALM SCAN
OFF
RESULTS
display.
2 T o determine which alarm has occurred
set the PDH ALM SCAN and
then set the
STRUCTURED
RECEIVE
SETTINGS
OFF
display
to the tributary highlighted as shown
opposite and press .
RUN/STOP
Example 2Mb number 2 of 8Mb number 1
of 34 Mb number 1 is highlighted.
3 Now view the Alarm Seconds results
on the display to determine
RESULTS
which alarms have occurred.
12
Page 19
PDH / DSn Testing
Analysis of N x 64 kb/s
Analysis of N x 64 kb/s
Option Required Structured PDH UKJ (USA) or DS1,DS3,E1, E3 structured PDH
110
Application
Many customer premises receive subrate signals for example 128 Kb/s or 384 kb/s.
The timeslots which make up these services may or may not be contiguous. Testing
these services requires that the test set to be able to insert a pattern across the
required timeslots.
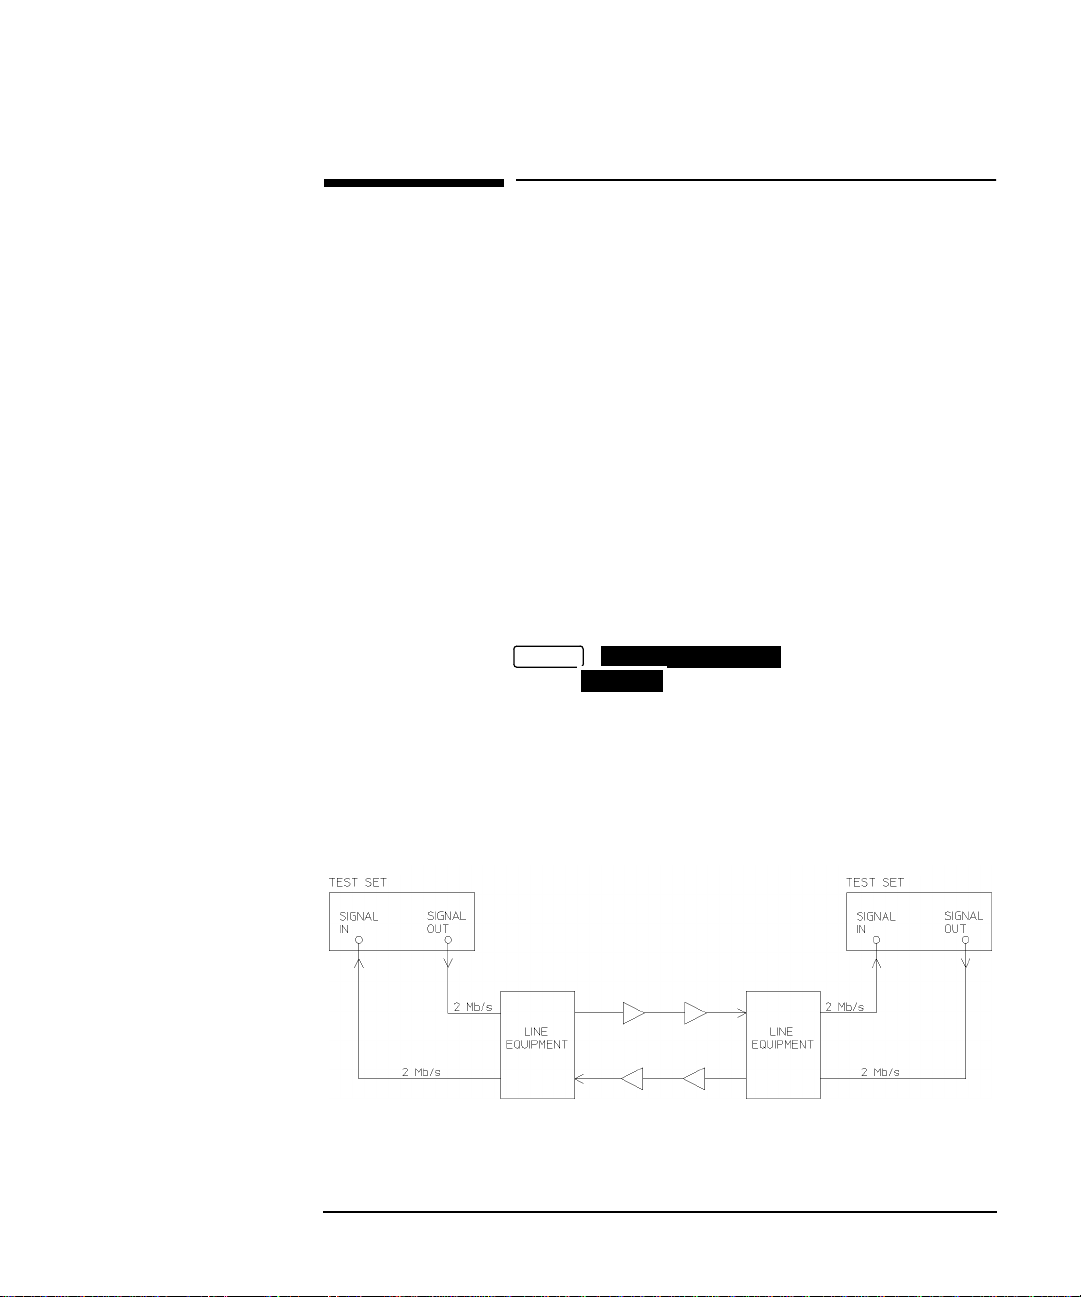
T esting N x 64 kb/s channels structured within a 2 Mb/s signal can be carried out on
an End to End basis using two test sets.
Default (Known State) Settings
It can be advisable to set the HP 37717C to a known state prior to setting up to make
a measurement. This clears all previous settings and provides a clearly defined
instrument state. Select , , set STORED SETTINGS
NUMBER to 0 and ACTION to .
OTHER
STORED SETTINGS
RECALL
Test Setup Procedure (N x 64 kb/s Analysis)
This setup procedure is interfaced at 2 Mb/s, with a test signal of 6 X 64 kb/s noncontiguous timeslots. A PRBS test pattern is transmitted across the 6 timeslots. A
BER measurement is performed on the received test pattern.
13
Page 20

PDH / DSn Testing
Analysis of N x 64 kb/s
HP 37717C #1
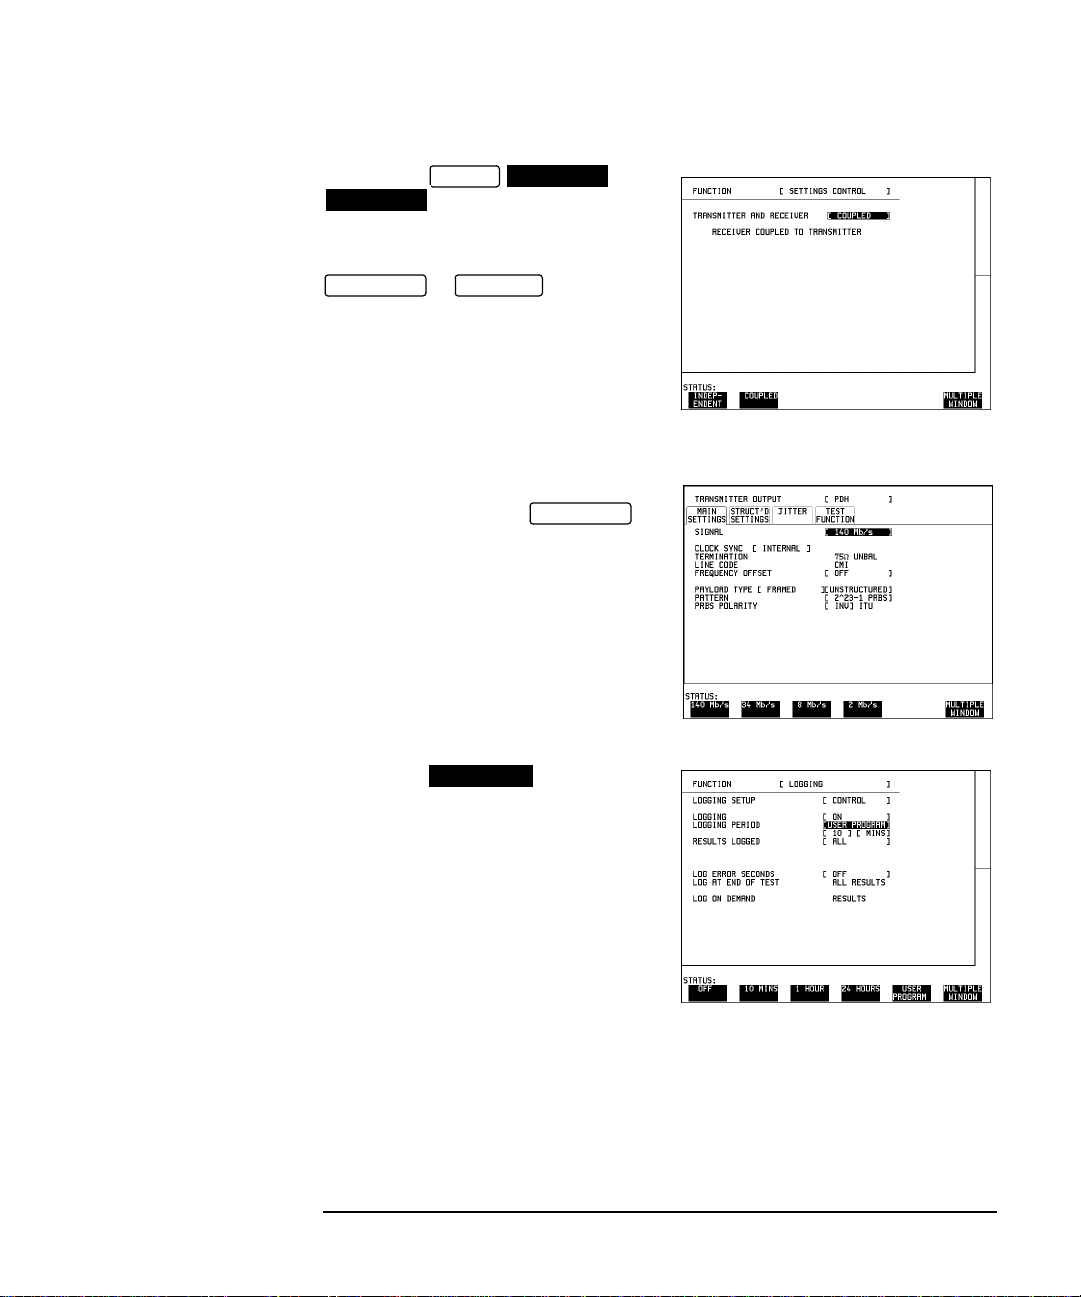
1. Set up the
CONTROL
OTHER
SETTINGS
display as shown opposite.
Any settings change made on the
or displays will
TRANSMIT
RECEIVE
automatically occur on the other.
2. Connect the HP 37717C to the line
equipment and set up the
MAIN SETTINGS
TRANSMIT
display as shown
opposite.
The settings of SIGNAL rate and LINE
CODE must match those of the network
equipment.
PAYLOAD TYPE selects the Framing
which must match that of the network
equipment.
3. Set up the display
STRUCTURED SETTINGS
TRANSMIT
as shown
opposite.
In this example timeslots 3, 5, 9, 25, 26
and 27 are selected.
14
Page 21

PDH / DSn Testing
Analysis of N x 64 kb/s
4. Set up the display as shown
RESULTS
opposite.
The RESULTS type may be changed
during the measurement without
interrupting the test.
HP 37717C #2
1. Set up the
CONTROL
OTHER
display as shown opposite.
SETTINGS
Any settings change made on the
TRANSMIT
or displays will
RECEIVE
automatically occur on the other.
2. Set up the display
MAIN SETTINGS
RECEIVE
as shown opposite.
The settings of SIGNAL rate and LINE
CODE must match those of the network
equipment.
PAYLOAD TYPE selects the Framing
which must match that of the network
equipment.
15
Page 22

PDH / DSn Testing
Analysis of N x 64 kb/s
3. Set up the
SETTINGS
RECEIVE
display as shown opposite.
STRUCTURED
In this example timeslots 3, 5, 9, 25, 26
and 27 are selected.
4. Set up the display as shown
RESULTS
opposite.
The RESULTS type may be changed
during the measurement without
interrupting the test.
Run the Test (N x 64 kb/s Analysis)
1. Press .
• The measurement results and alarms are available on the display
RUN/STOP
RESULTS
during the test period.
• The test can be halted at any time by pressing .
RUN/STOP
16
Page 23

PDH / DSn Testing
BERT Testing
BERT Testing
Options Required Structured PDH UKJ (USA), DS1,DS3,E1, E3 structured
PDH 110 or Unstructured PDH UKK (USB)
Application
A transmission system must be specified for its overall error performance, measured
over a period of time. Conformance to these specifications ensures that an installed
system will meet the requirements of an Integrated Digital Network (IDN).
After troubleshooting, or during installation or commissioning, it is necessary to
check that the transmission link meets this error performance.
This can be performed in two ways:
• End T o End - Error performance measurements are made on an end-to-end basis
testing the Go and Return paths separately but simultaneously . The measurements
are often performed unattended and the results and other events, alarms for
example, logged on a printer or disc and timed by a real time clock facility.
Two HP 37717C's are required for this measurement, one at each end of the link.
End-to End Test
17
Page 24

PDH / DSn Testing
BERT Testing
• Loopback - Error performance measurements are made via a loopback at the
remote end of the system testing the combined Go and Return paths. The
measurements are often performed unattended and the results and other events,
alarms for example, logged on a printer or disc and timed by a real time clock.
Loopback Test
Default (Known State) Settings
It can be advisable to set the HP 37717C to a known state prior to setting up to make
a measurement. This clears all previous settings and provides a clearly defined
instrument state. Select , , set STORED SETTINGS
OTHER
NUMBER to 0 and ACTION to .
STORED SETTINGS
RECALL
Test Setup Procedure (BERT Testing)
This setup procedure is based on 140 Mb/s, CMI, PRBS test data terminated in 75Ω .
A SINGLE test period of 24 HOURS is used and use of the a printer or disc for
recording of results and alarms is included. A graphical record of the results can be
viewed on the HP 37717C display at the end of the test period.
GRAPH
18
Page 25
PDH / DSn Testing
BERT Testing
1. Set up the
CONTROL
OTHER
display as shown opposite
SETTINGS
(on both HP 37717C's if end to end).
Any settings change made on the
or displays will
TRANSMIT
RECEIVE
automatically occur on the other.
2. Connect the HP 37717C to the line
equipment and set up the
TRANSMIT
display as shown opposite (on both HP
37717C's if end to end).
3. Select the function as
LOGGING
shown opposite (on both HP 37717C's if
end to end).
A LOGGING PERIOD selection of
[USER PROGRAM] [10 MIN] provides
the following:
A complete set of period and a complete
set of cumulative results logged on the
printer or disc every 10 minutes.
A complete set of cumulative results logged on the printer or to disc at the end of the
test period.
19
Page 26

PDH / DSn Testing
BERT Testing
4. Set the
TIMING CONTROL
RESULTS
as shown opposite
(on both HP 37717C's if end to end).
5. Select the
ERROR ANALYSIS
RESULTS
PDH RESULTS
display
The RESULTS type displayed can be
changed during the test period without
interrupting the test.
The RESULTS
TIMING CONTROL
STORAGE selection enables the graphics.
To disable graphics select STORAGE
[OFF].
Start the Test (BERT Testing)
1. Press (on both HP 37717C's if end to end).
The measurement results and alarms are available on the display during
RUN/STOP
RESULTS
the test period.
The graphical measurement results and alarms are stored in non volatile memory for
viewing later on the display.
The test can be halted at any time by pressing .
GRAPH
RUN/STOP
At the End of the Test (BERT Testing)
• The Date and Time the test started and the instrument setup are logged on the
selected logging device.
• All results are logged on the selected logging device at 10 minute intervals.
• Any alarms which occur during the test period will be logged on a printer or disc.
• At the end of the test period a complete set of cumulative results are logged on
the printer or disc.
• A graphical record of the results during the test period can be viewed on the
20
Page 27

PDH / DSn Testing
BERT Testing
GRAPH
display. If Remote Control option A3B or A3D is fitted the graph results
can be logged to an external printer, at a later date.
• Results and Alarm summaries can be viewed on the display.
GRAPH
The total graphics store capacity is normally 20,000 events. If GRAPH STORAGE
RESOLUTION [FULL] is selected on the display
OTHER
MISCELLANEOUS
the capacity reduces to 10,000 events.
The resolution, determined by the selection made under STORAGE on the
RESULTS
TIMING CONTROL
display, affects the ZOOM capability when
viewing the bar graphs. If 1 SECOND is selected all resolutions are available under
ZOOM. If 1 MIN is selected only 1 MIN/BAR, 15 MINS/BAR and 60 MINS/BAR
are available.If 15 MINS is selected only 15 MINS/BAR and 60 MINS/BAR are
available. If 1 HOUR is selected only 60 MINS/BAR is available.
Up to 10 sets of graphical results can be stored. If an attempt is made to store more
than 10 sets of results, then a first in first out policy is operated and the oldest set of
results will be lost. If graphics are enabled and a test is run which exceeds the
remaining storage capacity, then some previously stored graphical results will be
lost.
T o prev ent accidental overwriting of pre viously stored results the graphics capability
should be disabled, when graphical results are not required, by selecting STORAGE
[OFF] on the display.
RESULTS
TIMING CONTROL
21
Page 28

PDH / DSn Testing
Cross Multiplexer Testing
Cross Multiplexer Testing
Option Required Structured PDH UKJ (USA), DS1, DS3, E1, E3 structured PDH
110
Application
For comprehensive testing of network equipment it is essential that the test
equipment can multiplex/demultiplex the test signal.
The insertion of tributary signals into the PDH multiplexer, which are then
multiplexed into the 140 Mb/s PDH structure should take place without introducing
errors. The insertion and structuring process is tested by adding a test pattern to the
tributary inserted at the tributary insert port. At the high rate side of the PDH
multiplexer the tributary is destructured and a BER test performed.
By using a protected monitor point at the high rate side of the PDH multiplexer the
mux/demux need not be taken out of service.
Default (Known State) Settings
It is advisable to set the HP 37717C to a known state before setting up a
measurement. This clears all previous settings and provides a clearly defined
instrument state. Select , , set STORED SETTINGS
NUMBER to 0 and ACTION to .
Cross Multiplexer Testing Test Setup Procedure
In this setup a 2 Mb/s Framed tributary, containing a test pattern, is inserted at the
tributary insert port of the PDH multiplexer. The 140 Mb/s structured PDH signal is
obtained from a protected monitor point. The 2 Mb/s tributary is destructured by the
HP 37717C test set and an Error measurement is performed on the 2 Mb/s tributary
test pattern.
A SINGLE test period of 24 HOURS is used and the printer is enabled to record
results and alarms.
The HP 37717C PDH/SDH test set GRAPHICS function is enabled. The graphical
results can be viewed on the display.
22
OTHER
STORED SETTINGS
RECALL
GRAPH
Page 29

PDH / DSn Testing
Cross Multiplexer Testing
Cross Multiplexer Testing
1. Connect the HP 37717C to the network
equipment and set up the
SETTINGS CONTROL
OTHER
display as shown
opposite.
23
Page 30

PDH / DSn Testing
Cross Multiplexer Testing
2. Set up the display as
TRANSMIT
shown opposite.
The PAYLOAD TYPE determines the
Framing, which is selected from the
softkey menu.
Selections of Framing and Code must
match those of the network equipment.
3. Set up the display
SETTINGS
RECEIVE
as shown opposite.
MAIN
The GAIN and EQUALIZER settings
should be set to optimize the received
signal.
4. Set up the display
STRUCTURED SETTINGS
RECEIVE
as shown
opposite.
The required 2 Mb/s test signal is selected
under 34Mb: 8Mb: 2Mb
2M Payload determines the test signal
framing and must match that of the
network equipment.
24
Page 31

PDH / DSn Testing
Cross Multiplexer Testing
5. Select the logging device and set up the
OTHER
display, function,
LOGGING
as shown opposite.
WHEN [PERIOD EC>0] ensures results
are not logged on the selected logging
device when a print period is error free.
Continuity Check
Before running the test carry out a continuity test to verify the measurement path.
1. Set up the display as shown
RESULTS
opposite.
2. Press to start a
RUN/STOP
measurement.
3. Press error add three times
SINGLE
and check that the errors are recorded on
the display.
RESULTS
4. Press to stop the
RUN/STOP
measurement.
Start the Cross Multiplexer Test
5. Set the
RESULTS
TIMING CONTROL
as shown opposite.
If you do not require stored graphics
results select STORAGE [OFF].
25
Page 32

PDH / DSn Testing
Cross Multiplexer Testing
6. Press to start the
RUN/STOP
measurement.
G.821 Analysis results are displayed but
any of the other results can be viewed
without affecting the measurement.
The following error results are available
on the display during the test
RESULTS
period:
• 2 Mb/s - FAS, CRC, REBE and BIT
• 8, 34 and 140 Mb/s - FAS
The graphical measurement results and alarms are stored in non volatile memory for
viewing later on the display.
The test can be halted at any time by pressing .
GRAPH
RUN/STOP
At the End of the Test (Cross Multiplexer Testing)
• The Date and Time the test started and the instrument set-up are logged on the
logging device selected.
• Results are logged on the selected logging device at 1 hour intervals if the error
count is greater than 0.
• Any alarms which occur during the test period will be logged on the selected
logging device.
• At the end of the test period a complete set of cumulative results are logged on
the selected logging device.
• A graphical record of the results during the test period can be viewed on the
GRAPH
display. If Remote Control option A3B or A3D is fitted the graph results
can be logged to an external printer, at a later date.
• Results and Alarm summaries can be viewed on the display.
GRAPH
26
Page 33

PDH / DSn Testing
Cross Multiplexer Testing
The total graphics store capacity is normally 20,000 events. If GRAPH STORAGE
RESOLUTION [FULL] is selected on the display
OTHER
MISCELLANEOUS
the capacity reduces to 10,000 events.
The resolution, determined by the selection made under STORAGE on the
RESULTS
TIMING CONTROL
display, affects the ZOOM capability when
viewing the bar graphs. If 1 SECOND is selected all resolutions are available under
ZOOM. If 1 MIN is selected only 1 MIN/BAR, 15 MINS/BAR and 60 MINS/BAR
are available.If 15 MINS is selected only 15 MINS/BAR and 60 MINS/BAR are
available. If 1 HOUR is selected only 60 MINS/BAR is available.
Up to 10 sets of graphical results can be stored. If an attempt is made to store more
than 10 sets of results, then a first in first out policy is operated and the oldest set of
results will be lost. If graphics are enabled and a test is run which exceeds the
remaining storage capacity, then some previously stored graphical results will be
lost.
T o prev ent accidental overwriting of pre viously stored results the graphics capability
should be disabled, when graphical results are not required, by selecting STORAGE
[OFF] on the display.
RESULTS
TIMING CONTROL
27
Page 34

PDH / DSn Testing
FAS Monitoring
FAS Monitoring
Options Required Structured PDH UKJ (USA), DS1, DS3, E1, E3 structured PDH
110 or Unstructured PDH UKK (USB)
NOTE Option UKK (USB) - Unstructured PDH allows FAS Monitoring to be carried out at
2, 8, 34 and 140 Mb/s.
Application
Degradation in error performance can be detected by the occurrence of Frame
Alignment Signal (FAS) errors in PDH /DSn systems.
Using the HP 37717C in a receive only mode, FAS errors can be measured and
viewed on the display. In addition, the results can be logged on the
selected logging device for examination later.
Default (Known State) Settings
It can be advisable to set the HP 37717C to a known state prior to setting up to make
a measurement. This clears all previous settings and provides a clearly defined
instrument state. Select , , set STORED SETTINGS
NUMBER to 0 and ACTION to .
RESULTS
OTHER
STORED SETTINGS
RECALL
Test Setup Procedure (FAS Monitoring)
This setup procedure is based on Structured PDH 140 Mb/s line traffic interfaced at
the line equipment protected Monitor point. If a protected Monitor Point is not
available then an HP 15510A Protective Probe may be used at an unprotected
Monitor point.
The instrument is used in a receive only mode to measure FAS Errors. A Timed Start
test period is used which allows the measurement to be started at a time when the
user would not normally be available.
All Error Ratio and Analysis results are logged on the selected logging device at 2
hour intervals and at the end of the test period. Occurrences of error seconds and
alarms are logged on the selected logging device in real time.
28
Page 35

PDH / DSn Testing
FAS Monitoring
FAS Monitoring
PDH / DSn
1. Connect the HP 37717C to the line
terminal equipment protected Monitor
point and set up the display
MAIN SETTINGS
RECEIVE
as shown opposite.
When Balanced F AS monitoring is desired
at an unprotected Monitor point use an HP
15511A Protective Monitor Probe.
The GAIN and EQUALIZER settings
should be set to optimize the received
signal.
29
Page 36

PDH / DSn Testing
FAS Monitoring
2. Set up the display
STRUCTURED SETTINGS
RECEIVE
as shown
opposite.
2M PAYLOAD Framing selection should
match that of the network equipment.
3. Set up the
OTHER
LOGGING
display as shown opposite.
Start the Test (FAS Monitoring)
4.Set the
RESULTS
TIMING CONTROL
as shown opposite.
The test period will begin at the START
time selected on this display.
30
Page 37

PDH / DSn Testing
FAS Monitoring
5.Set up the PDH display as
RESULTS
shown opposite.
The following error types can be
monitored:
140 Mb/s - FAS (Short Term,
Cumulative and G.821 Analysis)
34 Mb/s- F AS (Short T erm, Cumulative
and G.821 Analysis)
8 Mb/s - F AS (Short Term, Cumulative
and G.821 Analysis)
2 Mb/s - FAS, CRC and REBE (Short Term, Cumulative and G.821 Analysis)
• Any occurrence of Alarms or Error Seconds during the test period are logged on
the selected logging device.
• Cumulative and Period versions of Error Results and Analysis Results are logged
on the selected logging device at 1 hour intervals.
• The test can be halted at any time by pressing .
RUN/STOP
At the End of the Test
Cumulative and Period versions of Error Results and Analysis Results are logged on
the selected logging device.
31
Page 38

PDH / DSn Testing
Frequency Measurement
Frequency Measurement
Options Required
If measuring frequency at PDH rates one of the following options is required.
Structured PDH UKJ (USA) or UKN (USE), or DS1, DS3, E1, E3 structured PDH
110, or Unstructured PDH UKK (USB)
If measuring frequency at SDH rates the following options must be fitted:
• For STM-0/1 electrical interfaces: A3R [A3S].
• For STM- Optical Interfaces: A3R and UH1.
• For STM-0/1/4 Optical Interfaces: A3R and 130 (1310 and 1550nm) or 131
(1310nm).
Application
The clock frequency and the amount of offset from the ITU standard rate can be
measured to give an indication of probability of errors. The measurement can be
made in out of service or monitor mode and is generally of short duration.
Default (Known State) Settings
It can be advisable to set the HP 37717C to a known state prior to setting up to make
a measurement. This clears all previous settings and provides a clearly defined
instrument state. Select , , set STORED SETTINGS
NUMBER to 0 and ACTION to .
Test Setup Procedure (Frequency Measurement)
If measuring on live traffic the measurement is interfaced at the line terminal
equipment Monitor point.
The HP 37717C is used in a receive only mode to measure the PDH / DSn
frequency. The PDH / DSn frequency is measured and compared with the internal
ITU standard frequency selected
32
OTHER
STORED SETTINGS
RECALL
Page 39

PDH / DSn Testing
Frequency Measurement
.
Figure 1 Frequency Measurement
1. Select SIGNAL [8 Mb/s] on the
RECEIVE
display.
For frequency measurement PATTERN;
TERMINATION and CODE are not
relevant.
2. Select
FREQUENCY
RESULTS
PDH
.
33
Page 40

PDH / DSn Testing
Frequency Measurement
Run the Test (Frequency Measurement)
Connect the PDH / DSn IN port to the line
terminal equipment monitor point.
The measured frequency and amount of
offset from the internal standard is
displayed.
If the PDH / DSn frequency is different
from the selected BIT RATE the error
message Unable to recover clock appears
on the display. A FREQ reading is
displayed but this should be ignored.
At the End of the Test (Frequency Measurement)
Disconnect the HP 37717C from the line terminal equipment.
34
Page 41

PDH / DSn Testing
Frequency Offset Tolerance
Frequency Offset Tolerance
Options Required
If checking frequency offset tolerance at PDH /DSn rates one of the following
options is required.
• UKJ (USA) or UKK (USB) or 110 - Modules with PDH capability
If checking frequency offset tolerance at SDH rates one of the following options
must be fitted:
• A3R [A3S] - SDH Module
• A3R and UH1 (STM-1 Optical Interface)
• A3R and 130 or 131 - STM-0/1/4 Optical Interface
Application
The capability of the network equipment to reliably recover the clock is tested by
varying the clock rate of the generated data and checking for the occurrence of
transmission errors.
The measurement can be made via a loopback or in a cross-multiplexer
configuration, and is generally of short duration.
The ITU G.703 Recommendation for Clock Tolerance is:
• DS1 1.544 Mb/s ± 32 ppm
• E1 2.048 Mb/s ± 50 ppm
• E2 8.448 Mb/s ± 30 ppm
• E3 34.368 Mb/s ± 20 ppm
• DS3 44.736 Mb/s ± 20 ppm
• E4 139.264 Mb/s ± 15 ppm
In SDH systems if the master timing reference is lost a standby reference within 20
ppm can be used for a limited time:
• STM-1 155.520 Mb/s ± 20 ppm
• STM-4 622.080 Mb/s ± 20 ppm.
35
Page 42

PDH / DSn Testing
Frequency Offset Tolerance
Default (Known State) Settings
It can be advisable to set the HP 37717C to a known state prior to setting up to make
a measurement. This clears all previous settings and provides a clearly defined
instrument state. Select , , set STORED SETTINGS
OTHER
NUMBER to 0 and ACTION to .
STORED SETTINGS
RECALL
Test Setup Procedure (Frequency Offset Tolerance)
This setup procedure tests the clock recovery capability of the line terminal
equipment at 34 Mb/s using a PRBS pattern connected to the 75Ω interface. The
frequency of the generated data is offset and the data is looped back and monitored
for errors.
Figure 2 Frequency Offset Tolerance Test
1. Set up the
CONTROL
OTHER
display as shown below.
SETTINGS
Any settings change made on the
or displays will
TRANSMIT
RECEIVE
automatically occur on the other.
36
Page 43

PDH / DSn Testing
Frequency Offset Tolerance
2. Set up the display as shown
RECEIVE
opposite.
Select the PATTERN required from the
menu.
3. Set the
RESULTS
TIMING CONTROL
as shown opposite.
4. Select the PDH Results
RESULTS
display.
Any of the other results can be selected
without affecting the measurement.
Continuity Check
Before running the test carry out a continuity test to verify the measurement path.
1. Connect a loopback at the desired point on the line terminal or cross-multiplexer
equipment.
2. Press to start a measurement.
RUN/STOP
37
Page 44

PDH / DSn Testing
Frequency Offset Tolerance
3. Press error add three times and check that the errors are recorded on the
RESULTS
4. Press to stop the measurement.
RUN/STOP
SINGLE
display.
Run the Test (Frequency Offset Tolerance)
1. Connect the HP 37717C to the 75Ω
interface of the multiplexer and set up the
TRANSMIT
2. Press to start the
display as shown opposite.
RUN/STOP
measurement.
3. Select TX CLOCK OFFSET [+20ppm] and check that the Error Count and Error
Ratio results are unchanged.
4. Select TX CLOCK OFFSET [-20ppm] and check that the Error Count and Error
Ratio results are unchanged.
NOTE The OFFSET values used above conform to ITU, G.703 Recommendation. If
different values are required selection of [USER OFFSET] allows offsets of up to
100 ppm to be used.
At the End of the Test
1. Halt the test by pressing , and disconnect the HP 37717C.
RUN/STOP
2. Remove the loopback from the line terminal or cross-multiplexer equipment.
38
Page 45

PDH / DSn Testing
Multiplexer Testing
Multiplexer Testing
Application
PDH multiplexers combine four lower rate signals into a higher rate signal for
transmission or further multiplexing. It is important that each multiplexer port
operates error free and no "crosstalk" occurs between ports.
Multiplexing of the tributaries can be verified by performing a BER test at each of
the four ports. However a more rigorous test involves loading all four ports to
simulate live traffic conditions. This verifies the individual ports and detects any
crosstalk problems between the ports.
Default (Known State) Settings
It is advisable to set the HP 37717C to a known state before setting up a
measurement. This clears all previous settings and provides a clearly defined
instrument state. Select , , set STORED SETTINGS
NUMBER to 0 and ACTION to .
OTHER
STORED SETTINGS
RECALL
Multiplexer Test Setup Procedure
The following Options must be fitted to the HP 37717C to perform this test:
• UHC (US6) - Multiple Outputs
• UKJ (USA) or UKK (USB) or 110 - PDH Module
In this setup the PDH OUT signal and the three additional data outputs, from the
Multiple Outputs option, load the 34 Mb/s input ports of the multiplexer. The HP
37717C (Structured PDH Option UKJ (USA)) destructures the 140 Mb/s signal and
a BER test is performed on each of the 34 Mb/s signals in turn.
A SINGLE test period of 15 Minutes is used and the selected logging device is
enabled to record results and alarms.
39
Page 46

PDH / DSn Testing
Multiplexer Testing
Figure 3 Structured PDH Multiplexer Test
NOTE This test can be performed using the Unstructured PDH Option UKK (USB) but the
equipment configuration is slightly different as shown below.
Figure 4 Unstructured PDH Multiplexer Test
40
Page 47

PDH / DSn Testing
Multiplexer Testing
1. Connect the HP 37717C to the network
equipment and set up the
SETTINGS CONTROL
OTHER
display as shown
opposite.
2. Set up the display
MAIN SETTINGS
TRANSMIT
as shown opposite.
PAYLOAD TYPE, PATTERN and PRBS
POLARITY selections should meet the
requirements of the network equipment.
3. Set up the display MAIN
RECEIVE
SETTINGS as shown below.
PAYLOAD TYPE [STRUCTURED]
ensures the 140 Mb/s signal is destructured
into the four 34 Mb/s test signals
41
Page 48

PDH / DSn Testing
Multiplexer Testing
4. Set up the display
STRUCTURED SETTINGS
RECEIVE
as shown
opposite.
The required 34 Mb/s test signal is
selected under 34Mb.
5. Select the logging output required with
the display,
OTHER
function, LOGGING SETUP
LOGGING
DEVICE
then select LOGGING SETUP
CONTROL
and set up the display as
shown opposite.
Start the Multiplexer Test
6. Set the
RESULTS
TIMING CONTROL
as shown opposite.
42
Page 49

PDH / DSn Testing
Multiplexer Testing
7. Set up the display as shown
RESULTS
opposite.
8. Press to start the
RUN/STOP
measurement.
9. Repeat the test for the other three 34
Mb/s signals, selectable on the
RECEIVE
STRUCTURED SETTINGS
display.
G.821 ANALYSIS is selected but any of
the other results can be selected from the
softkey menu without affecting the measurement.
• The measurement results and alarms are available on the display
RESULTS
during the test period.
• The test can be halted at any time by pressing .
RUN/STOP
At the End of the Multiplexer Test
• The Date and Time the test started and the instrument setup are logged on the
selected logging device.
• All results are logged on the selected logging device at the end of the test.
• Any alarms which occur during the test period will be logged on the selected
logging device.
43
Page 50

PDH / DSn Testing
Round Trip Delay
Round Trip Delay
Application
In certain applications the time taken for a signal to pass through the network can be
very important for example Voice Traffic where excessive delay can make speech
difficult to understand. The Round Trip delay feature of the HP 37717C allows
measurement of the delay at any interface or test signal rate.
Default (Known State) Settings
It can be advisable to set the HP 37717C to a known state prior to setting up to make
a measurement. This clears all previous settings and provides a clearly defined
instrument state. Select , , set STORED SETTINGS
NUMBER to 0 and ACTION to .
Test Setup Procedure (Round Trip Delay)
The following Option must be fitted to the HP 37717C to perform this test:
OTHER
STORED SETTINGS
RECALL
• UKJ (USA) or 110 - Structured PDH Module
This setup is interfaced at 140 Mb/s with a test signal of 64 kb/s. A test pattern is
transmitted in the 64 kb/s slot and a timer is set running. A loopback is applied to the
network equipment to return the test signal. The received pattern stops the timer and
the Round Trip Delay is calculated.
Round Trip Delay
44
Page 51

PDH / DSn Testing
Round Trip Delay
1. Connect the HP 37717C to the network
equipment as shown and set up the
OTHER
SETTINGS CONTROL
display
as shown opposite.
Any settings change made on the
or displays will
TRANSMIT
RECEIVE
automatically occur on the other.
2. Set up the display
MAIN SETTINGS
TRANSMIT
as shown opposite.
The SIGNAL rate and LINE CODE
settings must match those of the network
equipment.
Ensure that the TEST
TRANSMIT
FUNCTION display is set for bit errors.
3. Set up the display
STRUCTURED SETTINGS
TRANSMIT
as shown
opposite.
The 2M PAYLOAD selection determines
the Framing which should match that of
the network equipment.
The test 64 kb/s slot is selected under
34Mb; 8Mb; 2Mb; 64kb.
Continuity Check
Before running the test carry out a continuity test to verify the measurement path.
45
Page 52

PDH / DSn Testing
Round Trip Delay
1. Connect a loopback at the desired point
on the line terminal equipment and set up
the display as shown opposite.
RESULTS
2. Press to start a
RUN/STOP
measurement.
3. Press error add three times
SINGLE
and check that the errors are recorded on
the display.
RESULTS
4. Press to stop the
RUN/STOP
measurement.
Start the Test (Round Trip Delay)
5. Set the
RESULTS
TIMING CONTROL
as shown opposite.
6. Select the
TRIP DELAY
Select ACTION to start the test.
RESULTS
display.
ON
PDH RESULTS
The Round Trip Delay result is displayed
in milliseconds.
The delay measurement range is up to 2
seconds. The Resolution varies according
to the received rate:
• 2 Mb/s - 1µs
• 8, 34, 140 Mb/s - 10µs
• STM-1 - 0.5 ms
46
Page 53

PDH / DSn Testing
M.2100, M.2110, M.2120 Analysis
M.2100, M.2110, M.2120 Analysis
Application
Previously ITU-T G.821 was the only international recommendation available to
measure the quality of a communications link. ITU-T G.821 was originally an "Out
of Service" measurement and analysis for commissioning a link and troubleshooting
during severe disruption. The commissioning test was a one month "Out of Service"
test based on errored and severely errored seconds. A one month test with the
subsequent loss of revenue is clearly unacceptable.
Due to demand ITU-T G.821 also evolved into proprietary methods for "In Service"
testing based on FAS and code errors. Demand for high quality leased lines meant
an "In Service" performance standard, closer to real conditions and allowing
comparisons between providers, was required.
The ITU-T M.2100 series was specifically defined to provide a clear indication of
link quality, for service providers using long term performance analysis. "Bringing
into Service" and "repair criteria" analysis were also included.
M.2100 analysis is based on frame errors and provides Error Seconds (anomaly),
Severely Errored Seconds (defect) and Unavailability results for receive and
transmit directions. Transmit results are only av ailable for 2 Mb/s signals with CRC
framing. "Out of Service" testing is only available for the receive direction. M.2110
is an "Out of Service" measurement for "bringing into service" testing of paths. A 15
minute BER test (G.821) is performed and if this is error free a 24 hour M.2110 test
is performed. If the 24 hour M.2110 test displays PASS (S1 limit not reached) the
path can be returned to service. If FAIL is displayed (S2 limit reached or exceeded)
the 15 minute BER test should be repeated, If ? (UNCERTAIN)is displayed (result
between the S1 and S2 limits) run the 7 day BIS test.
The PASS FAIL and UNCERTAIN parameters are determined by the S1 and S2
limits which are user selectable.
S2
BIS Objective (BISO)
S1
UNACCEPTABLE
REGION OF UNCERTAINTY
BRING INTO SERVICE
47
Page 54

PDH / DSn Testing
M.2100, M.2110, M.2120 Analysis
Default (Known State) Settings
It can be advisable to set the HP 37717C to a known state prior to setting up to make
a measurement. This clears all previous settings and provides a clearly defined
instrument state. Select , , set STORED SETTINGS
OTHER
NUMBER to 0 and ACTION to .
STORED SETTINGS
RECALL
Test Setup Procedure M2110 Analysis
The following Option must be fitted to the HP 37717C to perform this test:
• UKJ - Structured PDH Module
This setup procedure is interfaced at 140 Mb/s, with a test signal of 2 Mb/s with
PCM30CRC framing.
1. Set up the
CONTROL
OTHER
display as shown opposite.
SETTINGS
Any settings change made on the
] or displays will
TRANSMIT
RECEIVE
automatically occur on the other.
2. Connect the HP 37717C to the line
equipment and set up the
MAIN SETTINGS
TRANSMIT
display as shown
opposite.
The settings of SIGNAL rate and LINE
CODE must match those of the network
equipment.
48
Page 55

PDH / DSn Testing
M.2100, M.2110, M.2120 Analysis
3. Set up the display
STRUCTURED SETTINGS
TRANSMIT
as shown
opposite.
2M PAYLOAD selects the Framing which
must match that of the network equipment.
4. Set up the display as shown
RESULTS
opposite.
5. Press to start the
RUN/STOP
measurement.
At the end of the test period check that the
G.821 results are error free.
49
Page 56

PDH / DSn Testing
M.2100, M.2110, M.2120 Analysis
6. Set up the display as shown
RESULTS
opposite
Select the Path Allocation value required
in the range 0.5% to 40%.
The Path Allocation value determines the
S1 and S2 limits and these will change on
the display as the Path Allocation value is
changed.
7. Set up the display as shown
RESULTS
opposite.
Press to start the
RUN/STOP
measurement.
8. View the M.2110 results.
BIS Results of PASS, FAIL and ?
(uncertain) are possible.
If P ASS is displayed (S1 limit not reached)
the path may be returned to service
immediately.
If FAIL is displayed (S2 limit reached or
exceeded) repeat the BER (G.821) test.
If ? is displayed (result between the S1 and
S2 limits) run the 7 day BIS test.
50
Page 57

3
Trouble Scan page 52
Short Term Results page 53
Cumulative Results page 54
PDH Error Analysis G.821, G.826, M.2100, M.2110, M.2120
page 55
Alarm Seconds page 70
Frequency Measurement page 71
3 Result Definitions
Information about the PDH results.
Page 58

Result Definitions
Trouble Scan
Trouble Scan
All possible error sources and alarms are scanned simultaneously. Up to 4 non-zero
error counts are displayed in priority order.
Error Count Priority
UPDH (Option
UKK[USB])
CRC
BIT
CODE
FRAME
REBE
SDH (Option A3R [A3S]) SPDH
RS B1 BIP or B1 BIP
MS B2 BIP or B2 BIP
Path B3 BIP or B3 BIP
VC3 PATH BIP
TU2 BIP
TU12 BIP
A1A2 FRAME
MS FEBE or MS REI
PATH FEBE or HP REI
PATH IEC or HP IEC
VC3 PATH FEBE or HP REI
TU2 FEBE or LP REI
TU12 FEBE or LP REI
BIT
(Option
UKJ[USA] )
CRC
BIT
CODE
FAS 140M
FAS 34M
FAS 8M
FAS 2M
REBE
SPDH
(Option
110)
CRC4(E2)
CRC6(DS1ESF)
BIT
CODE
FRAME
REBE(E1)
CP-Parity
(DS3 CBP
framing)
P-Parity
(DS3
framing)
FEBE (DS3
CBP
framing)
ATM (Option
UKN) + SDH
B1 BIP (SDH only)
B2 BIP (SDH only)
B3 BIP (SDH only)
Non Corrected
HEC
Corrected HEC
Lost Cells
Misinserted Cells
Path FEBE or REI
Bit
Errored Cells
ATM (Option
UKN) + SPDH
EM BIP
Non Corrected
HEC
Corrected HEC
Lost Cells
Misinserted Cells
EM FEBE
Bit
Errored Cells
If any alarms are active "ALARMS ACTIVE" is displayed.
SHOW HISTORY
and the alarm led’s can be used to determine which
alarms are active.
If no alarms are active and no non-zero error counts are detected then
"NO TROUBLE" is displayed.
52
Page 59

Result Definitions
Short Term Results
Short Term Results
Displays period results obtained during the measurement. The period is
user-defined under SHORT TERM PERIOD on the display.
Many result parameters are presented in two forms: a count of error
events (EC or COUNT) and a ratio of the number of errors to the total
possible in the time period (ER or RATIO).
PDH Results (Options UKJ[USA], UKK[USB] and 110)
BIT EC Counts Bit errors occurring during the Short Term
Period.
BIT ER Calculates the ratio of Bit errors to the number of
clocks in the Short Term Period.
CODE EC Counts Code errors occurring during the Short Term
Period.
CODE ER Calculates the ratio of Code errors to the number of
clocks in the Short Term Period.
FRAME (FAS) Compares the received FAS word with the correct
value.
CRC Compares the received CRC4 with the calculated CRC4
(2 Mb/s only).
REBE Detects Bit 1 of the NFAS word in frames 13 and 15
being set to 0 (2 Mb/s only).
RESULTS
If Option 110 (DS1 and DS3 line rates and payloads provided) or option
UKJ and A3R is fitted, (DS1 and DS3 payloads) the following additional
results are available:
DS1 CRC Compares the received CRC6 with the calculated
CRC6.
DS3 P-Bit Compares the received P-Bit parity with the calculated
parity.
DS3 C-Bit Compares the received C-Bit parity with the calculated
parity
DS3 FEBE Calculated from the received FEBE bits.
53
Page 60

Result Definitions
Cumulative Results
Cumulative Results
Provides a cumulative display of the results during the measurement
period. Many result parameters are presented in two forms: a count of
error events (EC or COUNT) and a ratio of the number of errors to the
total possible in the time period (ER or RATIO).
PDH Results (Options UKJ[USA], UKK [USB] and 110)
BIT EC Counts Bit errors occurring during the measurement
Period.
BIT ER Calculates the ratio of Bit errors to the number of
clocks in the measurement Period.
CODE EC Counts Code errors occurring during the measurement
Period.
CODE ER Calculates the ratio of Code errors to the number of
clocks in the measurement Period.
FRAME (FAS) Compares the received FAS word with the correct
value.
CRC Compares the received CRC4 with the calculated CRC4
(2 Mb/s only).
REBE Detects Bit 1 of the NFAS word in frames 13 and 15
being set to 0 (2 Mb/s only).
If Option 110 (DS1 and DS3 line rates and payloads provided) or option
UKJ and A3R is fitted, (DS1 and DS3 payloads) the following additional
results are available:
DS1 CRC Compares the received CRC6 with the calculated
CRC6.
DS3 P-Bit Compares the received P-Bit parity with the calculated
parity.
DS3 C-Bit Compares the received C-Bit parity with the calculated
parity
DS3 FEBE Calculated from the received FEBE bits.
54
Page 61

Result Definitions
PDH Error Analysis G.821, G.826, M.2100, M.2110, M.2120
PDH Error Analysis G.821, G.826,
M.2100, M.2110, M.2120
Analysis results are calculated for the following error sources:
Option UKK[USB]
Out of Service G.821 BIT (All Rates)
M.2100 (All Rates)
In-Service G.821 FRAME (Not 704 kb/s),
G.821 CRC and REBE (2 Mb/s, CRC Framing only).
Option UKJ[USA], 110
G.821 BIT and FAS (2,8,34,140 Mb/s), CRC and REBE (2 Mb/s, CRC
Framing only).
G.826 (All Rates)
M.2100 (All Rates)
M.2110 BIS Bring Into Service (All Rates)
M.2120 Circuit Maintenance (All Rates)
G.821 Bit Errors
These result from a bit by bit comparison of the received pattern and the
internal reference pattern.
Table 3-1 PDH G.821 - Bit Analysis
Display Definition
EC Error Count - Cumulative Bit error count during the measurement period.
ES Error Second - Cumulative count of seconds within available time that contain at least 1
% Ann. D
ES
Bit error. Percentage Error Seconds is also displayed - error seconds expressed as a
percentage of the available time.
Percentage Annex D Error Seconds - As% ES , only error second is normalised to 64 kb/s
rate as per ITU-T G.821 Annex D.
55
Page 62

Result Definitions
PDH Error Analysis G.821, G.826, M.2100, M.2110, M.2120
Table 3-1 PDH G.821 - Bit Analysis
Display Definition
EFS Error Free Seconds - Cumulative count of seconds within available time that contain zero
SES Severely Errored Seconds - Cumulative count of seconds within available time in which
UNAV Unavailable Seconds - Cumulative count of unavailable seconds. A period of una vailability
DEG MIN Degrade Minutes - Cumulative count of degraded minutes. Available seconds, excluding
CODE ES Code Errored Second - Cumulative count of seconds that contain at least 1 Code error.
errors. Percentage Error Free Seconds is also displayed - error free seconds expressed
as a percentage of the available time.
-3
the Bit Error Ratio is > 1 in 10
severely errored seconds expressed as a percentage of the available time.
begins at the start of 10 or more consecutive seconds in which the Bit Error Ratio is > 1 in
-3
, and ends at the start of 10 or more consecutive seconds in which the Bit Error Ratio
10
is < 1 in 10-3. Percentage Unavailable Seconds is also displayed - unavailable seconds
expressed as a percentage of the total elapsed time.
Severely Errored Seconds, are packaged into 1 minute blocks. The Bit Error Ratio for the
packaged block is measured and if it exceeds 1 in 10
Percentage Degraded Minutes is also displayed -Degraded Minutes expressed as a
percentage of the total number of packaged 1 minute blocks.
. Percentage Sev erely Errored Seconds is also displa y ed -
-6
G.821 Frame (FAS) Errors
These result from a bit by bit comparison of the received FAS word with
the correct value, once frame alignment has been achieved.
Table 3-2 PDH G.821 - Frame (FAS) Analysis (Not 704 kb/s)
a Degraded Minute is registered.
Display Definition
EC Error Count - Cumulative Frame error count during the measurement period.
ES Error Second - Cumulative count of seconds within available time that contain at least 1
% Ann. D
ES
EFS Error Free Seconds - Cumulative count of seconds within available time that contain z ero
SES Severely Errored Seconds - Cumulative count of seconds within available time in which
Frame error. Percentage Error Seconds is also displayed - error seconds expressed as a
percentage of the available time.
Percentage Annex D Error Seconds - As % ES, only error second is normalized to 64 kb/
s rate as per ITU-T G.821 Annex D.
errors. Percentage Error Free Seconds is also displayed - error free seconds expressed
as a percentage of the available time.
-3
the Bit Error Ratio is > 1 in 10
severely errored seconds expressed as a percentage of the available time.
. Percentage Sev erely Errored Seconds is also displa y ed -
56
Page 63

Result Definitions
PDH Error Analysis G.821, G.826, M.2100, M.2110, M.2120
Table 3-2 PDH G.821 - Frame (FAS) Analysis (Not 704 kb/s)
Display Definition
UNAV Unavailable Seconds - Cumulative count of unavailable seconds. A period of una vailability
DEG MIN Degraded Minutes - Cumulative count of degraded minutes. Available seconds, excluding
CODE ES Code Errored Second - Cumulative count of seconds that contain at least 1 Code error.
begins at the start of 10 or more consecutive seconds in which the Bit Error Ratio is > 1 in
-3
, and ends at the start of 10 or more consecutive seconds in which the Bit Error Ratio
10
is < 1 in 10-3. Percentage Unavailable Seconds is also displayed - unavailable seconds
expressed as a percentage of the total elapsed time.
Severely Errored Seconds, are packaged into 1 minute blocks. The Bit Error Ratio for the
packaged block is measured and if it exceeds 1 in 10
Percentage Degraded Minutes is also displayed - degraded minutes expressed as a
percentage of the total number of packaged 1 minute blocks.
-6
a Degraded Minute is registered.
G.821 CRC Errors
These result from a comparison of the received CRC4 with the calculated
CRC4.
Table 3-3 PDH G.821 - CRC Analysis (2 Mb/s, CRC Framing)
Display Definition
EC Error Count - Cumulative CRC error count during the measurement period.
ES Error Second - Cumulative count of seconds within available time that contain at least 1
CRC error. Percentage Error Seconds is also displayed - error seconds expressed as a
percentage of the available time.
% Ann. D
ES
EFS Error Free Seconds - Cumulative count of seconds within available time that contain zero
SES Severely Errored Seconds - Cumulative count of seconds within available time in which
UNAV Unavailable Seconds - Cumulative count of unavailable seconds. A period of una vailability
Percentage Annex D Error Seconds - As % ES, only error second is normalized to 64 kb/
s rate as per ITU-T G.821 Annex D.
errors. Percentage Error Free Seconds is also displayed - error free seconds expressed
as a percentage of the available time.
-3
the Bit Error Ratio is > 1 in 10
severely errored seconds expressed as a percentage of the available time.
begins at the start of 10 or more consecutive seconds in which the Bit Error Ratio is > 1 in
-3
, and ends at the start of 10 or more consecutive seconds in which the Bit Error Ratio
10
is < 1 in 10-3. Percentage Unavailable Seconds is also displayed - unavailable seconds
expressed as a percentage of the total elapsed time.
. Percentage Sev erely Errored Seconds is also displa y ed -
57
Page 64

Result Definitions
PDH Error Analysis G.821, G.826, M.2100, M.2110, M.2120
Table 3-3 PDH G.821 - CRC Analysis (2 Mb/s, CRC Framing)
Display Definition
DEG MIN Degrade Minutes - Cumulative count of degraded minutes. Available seconds, excluding
CODE ES Code Errored Second - Cumulative count of seconds that contain at least 1 Code error.
Severely Errored Seconds, are packaged into 1 minute blocks. The Bit Error Ratio for the
packaged block is measured and if it exceeds 1 in 10
Percentage Degraded Minutes is also displayed - degraded minutes expressed as a
percentage of the total number of packaged 1 minute blocks.
-6
a Degraded Minute is registered.
G.821 REBE Errors
These are calculated from bit 1 of the NFAS word in frames 13 and 15 of
the received 2 Mb/s.
Table 3-4 PDH G.821 - REBE Analysis (2 Mb/s, CRC Framing)
Display Definition
EC Error Count - Cumulative REBE error count during the measurement period.
ES Error Second - Cumulative count of seconds within available time that contain at least 1
% Ann. D
ES
EFS Error Free Seconds - Cumulative count of seconds within available time that contain z ero
REBE error. Percentage Error Seconds is also displayed - error seconds expressed as a
percentage of the available time.
Percentage Annex D Error Seconds - As % ES, only error second is normalized to 64 kb/
s rate as per ITU-T G.821 Annex D.
errors. Percentage Error Free Seconds is also displayed - error free seconds expressed
as a percentage of the available time.
SES Severely Errored Seconds - Cumulative count of seconds within available time in which
UNAV Unavailable Seconds - Cumulative count of unavailable seconds. A period of una vailability
DEG MIN Degraded Minutes - Cumulative count of degraded minutes. Available seconds excluding
CODE ES Code Errored Second - Cumulative count of seconds that contain at least 1 Code error.
the Bit Error Ratio is > 1 in 10
severely errored seconds expressed as a percentage of the available time.
begins at the start of 10 or more consecutive seconds in which the Bit Error Ratio is > 1 in
-3
, and ends at the start of 10 or more consecutive seconds in which the Bit Error Ratio
10
is < 1 in 10
expressed as a percentage of the total elapsed time.
Severely Errored Seconds, are packaged into 1 minute blocks. The Bit Error Ratio for the
packaged block is measured and if it exceeds 1 in 10
Percentage Degraded Minutes is also displayed - degraded minutes expressed as a
percentage of the total number of packaged 1 minute blocks.
-3
. Percentage Unavailable Seconds is also displayed - unavailable seconds
-3
. Percentage Sev erely Errored Seconds is also displa y ed -
-6
a Degraded Minute is registered.
58
Page 65

Result Definitions
PDH Error Analysis G.821, G.826, M.2100, M.2110, M.2120
G.826 PDH Analysis
PDH G.826 Analysis results are only available on Option UKJ[USA],110.
Table 3-5 PDH G.826 Analysis - 2 Mb/s CRC4 Framed (PCM30CRC, PCM31CRC)
Display Definition
NEAR ES Receive Error Second - Cumulative count of seconds within av ailable time that contain at
FAR ES Transmit Error Second - Cumulative count of seconds within available time that contain at
NEAR SES Receive Severely errored Seconds - Cumulative count of 1 second periods within
FAR SES Transmit Severely errored Seconds - Cumulative count of 1 second periods within
ESR Error Second Ratio - The ratio of errored seconds to the total seconds of av ailab le time . A
SESR Severely Errored Second Ratio - The ratio of severely errored seconds to the total
UAS Unav ailable Seconds - Cumulativ e count of unav ailable seconds . A period of unavailability
EB Errored Block count - An errored block is a CRC4 with one or more bits in error.
BBE Background Block Error count - Cumulative count of errored blocks excluding those in
BBER Background Block Error Ratio - The ratio of errored blocks to total blocks. Total blocks
PUAS Path Unavailable Second count - Logical OR of the Near and Far end unavailable
least 1 G.703 Code error or 1 CRC error.
least 1 REBE error.
available time that contain at least 805 CRC errors or a DEFECT. Defects are LOS, LOF
and AIS.
available time that contain at least 805 REBE errors or RAI has occurred f or 2 consecutive
100 ms periods. Near-end occurrences of LOS, LOF and AIS are not included in the
cumulative result.
period of unavailability begins at the start of 10 or more consecutive Severely Errored
Seconds, and ends at the start of 10 or more non Severely Errored Seconds.
seconds of available time.
begins at the start of 10 or more consecutive severely errored seconds and ends at the
start of 10 or more consecutive non severely errored seconds.
severely errored seconds.
excludes severely errored seconds and periods of unavailability.
seconds.
Table 3-6 PDH G.826 Analysis - 2 Mb/s Framed - Not CRC4
Display Definition
NEAR ES Receive Error Second - Cumulative count of seconds within av ailable time that contain at
least 1 G.703 Code error or 1 Frame error.
59
Page 66

Result Definitions
PDH Error Analysis G.821, G.826, M.2100, M.2110, M.2120
Table 3-6 PDH G.826 Analysis - 2 Mb/s Framed - Not CRC4
Display Definition
FAR ES Transmit Error Second - Cumulative count of seconds within available time where RAI
NEAR SES Receive Severely errored Seconds - Cumulative count of 1 second periods within
FAR SES Transmit Severely errored Seconds - Cumulative count of 1 second periods within
ESR Error Second Ratio - The ratio of errored seconds to the total seconds of av ailab le time . A
SESR Severely Errored Second Ratio - The ratio of severely errored seconds to the total
UAS Unav ailable Seconds - Cumulativ e count of unav ailable seconds . A period of unavailability
occurs for 2 consecutive 100 ms periods.
available time that contain at least 28 F r ame errors or BER 1X10
are LOS, LOF, PSL and AIS.
available time where RAI occurs for 2 consecutiv e 100 ms periods. Near-end occurrences
of LOS, LOF and AIS are not included in the cumulative result.
period of unavailability begins at the start of 10 or more consecutive Severely Errored
Seconds, and ends at the start of 10 or more non Severely Errored Seconds.
seconds of available time.
begins at the start of 10 or more consecutive severely errored seconds and ends at the
start of 10 or more consecutive non severely errored seconds.
Table 3-7 PDH G.826 Analysis - 2 Mb/s Unframed
Display Definition
ES Error Second - Cumulative count of seconds within available time that contain at least 1
SES Severely errored Seconds - Cumulative count of 1 second periods within available time
G.703 Code error.
that contain a DEFECT. Defects are LOS and AIS.
-3
, or a DEFECT . Defects
ESR Error Second Ratio - The ratio of errored seconds to the total seconds of av ailab le time . A
SESR Severely Errored Second Ratio - The ratio of severely errored seconds to the total
UAS Unav ailable Seconds - Cumulativ e count of unav ailable seconds . A period of unavailability
period of unavailability begins at the start of 10 or more consecutive Severely Errored
Seconds, and ends at the start of 10 or more non Severely Errored Seconds.
seconds of available time.
begins at the start of 10 or more consecutive severely errored seconds and ends at the
start of 10 or more consecutive non severely errored seconds.
60
Page 67

Result Definitions
PDH Error Analysis G.821, G.826, M.2100, M.2110, M.2120
Table 3-8 PDH G.826 Analysis - 8 Mb/s Framed
Display Definition
NEAR ES Receive Error Second - Cumulative count of seconds within av ailable time that contain at
FAR ES Receive Error Second - Cumulative count of seconds within available time where RAI
NEAR SES Receive Severely errored Seconds - Cumulative count of 1 second periods within
FAR SES Transmit Severely errored Seconds - Cumulative count of 1 second periods within
ESR Error Second Ratio - The ratio of errored seconds to the total seconds of av ailab le time . A
SESR Severely Errored Second Ratio - The ratio of severely errored seconds to the total
UAS Unav ailable Seconds - Cumulativ e count of unav ailable seconds . A period of unavailability
least 1 Frame error.
occurs for 2 consecutive 100 ms periods.
available time that contain at least 41 Frame errors or BER 1X10
are LOS, LOF, AIS and PSL.
available time where RAI occurs for 2 consecutiv e 100 ms periods. Near-end occurrences
of LOS, LOF and AIS are not included in the cumulative result.
period of unavailability begins at the start of 10 or more consecutive Severely Errored
Seconds, and ends at the start of 10 or more non Severely Errored Seconds.
seconds of available time.
begins at the start of 10 or more consecutive severely errored seconds and ends at the
start of 10 or more consecutive non severely errored seconds.
Table 3-9 PDH G.826 Analysis - 34 Mb/s Framed
Display Definition
NEAR ES Receive Error Second - Cumulative count of seconds within av ailable time that contain at
least 1 Frame error.
-3
or a DEFECT. Defects
FAR ES Receive Error Second - Cumulative count of seconds within available time where RAI
occurs for 2 consecutive 100 ms periods.
NEAR SES Receive Severely errored Seconds - Cumulative count of 1 second periods within
available time that contain at least 52 Frame errors or a DEFECT. Defects are LOS, LOF,
AIS and PSL.
FAR SES Transmit Severely errored Seconds - Cumulative count of 1 second periods within
available time where RAI occurs for 2 consecutiv e 100 ms periods. Near-end occurrences
of LOS, LOF and AIS are not included in the cumulative result.
ESR Error Second Ratio - The ratio of errored seconds to the total seconds of av ailab le time . A
period of unavailability begins at the start of 10 or more consecutive Severely Errored
Seconds, and ends at the start of 10 or more non Severely Errored Seconds.
SESR Severely Errored Second Ratio - The ratio of severely errored seconds to the total
seconds of available time.
61
Page 68

Result Definitions
PDH Error Analysis G.821, G.826, M.2100, M.2110, M.2120
Table 3-9 PDH G.826 Analysis - 34 Mb/s Framed
Display Definition
UAS Unav ailable Seconds - Cumulativ e count of unav ailable seconds . A period of unavailability
begins at the start of 10 or more consecutive severely errored seconds and ends at the
start of 10 or more consecutive non severely errored seconds.
Table 3-10 PDH G.826 Analysis - 140 Mb/s Framed
Display Definition
NEAR ES Receive Error Second - Cumulative count of seconds within av ailable time that contain at
FAR ES Receive Error Second - Cumulative count of seconds within available time where RAI
NEAR SES Receive Severely errored Seconds - Cumulative count of 1 second periods within
FAR SES Transmit Severely errored Seconds - Cumulative count of 1 second periods within
ESR Error Second Ratio - The ratio of errored seconds to the total seconds of av ailab le time . A
SESR Severely Errored Second Ratio - The ratio of severely errored seconds to the total
UAS Unav ailable Seconds - Cumulativ e count of unav ailable seconds . A period of unavailability
least 1 Frame error.
occurs for 2 consecutive 100 ms periods.
available time that contain at least 69 Frame errors or a DEFECT. Defects are LOS, LOF,
AIS.
available time where RAI occurs for 2 consecutiv e 100 ms periods. Near-end occurrences
of LOS, LOF and AIS are not included in the cumulative result.
period of unavailability begins at the start of 10 or more consecutive Severely Errored
Seconds, and ends at the start of 10 or more non Severely Errored Seconds.
seconds of available time.
begins at the start of 10 or more consecutive severely errored seconds and ends at the
start of 10 or more consecutive non severely errored seconds.
Table 3-11 PDH G.826 Analysis - 8, 34 and 140 Mb/s Unframed
Display Definition
ES Error Second - Cumulative count of seconds within available time that contain at least 1
SES Severely errored Seconds - Cumulative count of 1 second periods within available time
ESR Error Second Ratio - The ratio of errored seconds to the total seconds of av ailab le time . A
DEFECT. Defects are LOS and AIS.
that contain a DEFECT. Defects are LOS and AIS.
period of unavailability begins at the start of 10 or more consecutive Severely Errored
Seconds, and ends at the start of 10 or more non Severely Errored Seconds.
62
Page 69

Result Definitions
PDH Error Analysis G.821, G.826, M.2100, M.2110, M.2120
Table 3-11 PDH G.826 Analysis - 8, 34 and 140 Mb/s Unframed
Display Definition
SESR Severely Errored Second Ratio - The ratio of severely errored seconds to the total
UAS Unav ailable Seconds - Cumulativ e count of unav ailable seconds . A period of unavailability
seconds of available time.
begins at the start of 10 or more consecutive severely errored seconds and ends at the
start of 10 or more consecutive non severely errored seconds.
Table 3-12 G.826 Analysis DS1 Unframed
Display Definition
ES Error Second - Cumulative count of seconds within available time that contain at least 1
SES Severely errored Seconds - Cumulative count of 1 second periods within available time
ESR Error Second Ratio - The ratio of errored seconds to the total seconds of av ailab le time . A
SESR Severely Errored Second Ratio - The ratio of severely errored seconds to the total
UAS Unav ailable Seconds - Cumulativ e count of unav ailable seconds . A period of unavailability
DEFECT. Defects are LOS, LOF and DS1 AIS.
that contain a DEFECT. Defects are LOS, LOF and DS1 AIS.
period of unavailability begins at the start of 10 or more consecutive Severely Errored
Seconds, and ends at the start of 10 or more non Severely Errored Seconds.
seconds of available time.
begins at the start of 10 or more consecutive severely errored seconds and ends at the
start of 10 or more consecutive non severely errored seconds.
Table 3-13 G.826 Analysis DS3 Unframed
Display Definition
ES Error Second - Cumulative count of seconds within available time that contain at least 1
DEFECT. Defects are LOS, LOF.
SES Severely errored Seconds - Cumulative count of 1 second periods within available time
that contain a DEFECT. Defects are LOS, LOF.
ESR Error Second Ratio - The ratio of errored seconds to the total seconds of av ailab le time . A
period of unavailability begins at the start of 10 or more consecutive Severely Errored
Seconds, and ends at the start of 10 or more non Severely Errored Seconds.
SESR Severely Errored Second Ratio - The ratio of severely errored seconds to the total
seconds of available time.
63
Page 70

Result Definitions
PDH Error Analysis G.821, G.826, M.2100, M.2110, M.2120
Table 3-13 G.826 Analysis DS3 Unframed
Display Definition
UAS Unav ailable Seconds - Cumulativ e count of unav ailable seconds . A period of unavailability
begins at the start of 10 or more consecutive severely errored seconds and ends at the
start of 10 or more consecutive non severely errored seconds.
Table 3-14 PDH G.826 Analysis - DS1, D4 & SLC-96 Framing
Display Definition
NEAR ES Receive Error Second - Cumulative count of seconds within av ailable time that contain at
FAR ES Receive Error Second - Cumulative count of seconds within available time that contain at
NEAR SES Receive Severely errored Seconds - Cumulative count of 1 second periods within
FAR SES Transmit Severely errored Seconds - Cumulative count of 1 second periods within
ESR Error Second Ratio - The ratio of errored seconds to the total seconds of av ailab le time . A
SESR Severely Errored Second Ratio - The ratio of severely errored seconds to the total
UAS Unav ailable Seconds - Cumulativ e count of unav ailable seconds . A period of unavailability
least 1 Frame error.
least 1 DS1 FERF.
available time that contain at least 8 Frame errors or a DEFECT. Defects are LOS, LOF,
DS1 Frame Loss and DS1 AIS.
available time that contain at least 1 DS1 FERF.
period of unavailability begins at the start of 10 or more consecutive Severely Errored
Seconds, and ends at the start of 10 or more non Severely Errored Seconds.
seconds of available time.
begins at the start of 10 or more consecutive severely errored seconds and ends at the
start of 10 or more consecutive non severely errored seconds.
Table 3-15 PDH G.826 Analysis - DS1, ESF Framing
Display Definition
NEAR ES Receive Error Second - Cumulative count of seconds within av ailable time that contain at
FAR ES Receive Error Second - Cumulative count of seconds within available time that contain at
least 1CRC6 error.
least 1 DS1 FERF.
64
Page 71

Result Definitions
PDH Error Analysis G.821, G.826, M.2100, M.2110, M.2120
Table 3-15 PDH G.826 Analysis - DS1, ESF Framing
Display Definition
NEAR SES Receive Severely errored Seconds - Cumulative count of 1 second periods within
FAR SES Transmit Severely errored Seconds - Cumulative count of 1 second periods within
ESR Error Second Ratio - The ratio of errored seconds to the total seconds of av ailab le time . A
SESR Severely Errored Second Ratio - The ratio of severely errored seconds to the total
UAS Unav ailable Seconds - Cumulativ e count of unav ailable seconds . A period of unavailability
EB Errored Block count - An errored block is a CRC6 with one or more bits in error.
BBE Background Block Error count - Cumulative count of errored blocks excluding those in
BBER Background Block Error Ratio - The ratio of errored blocks to total blocks. Total blocks
PUAS Path Unavailable Second count - Logical OR of the Near and Far end unavailable
available time that contain at least 320 CRC6 errors or a DEFECT. Defects are LOS, LOF,
DS1 Frame Loss and DS1 AIS.
available time that contain at least 1 DS1 FERF.
period of unavailability begins at the start of 10 or more consecutive Severely Errored
Seconds, and ends at the start of 10 or more non Severely Errored Seconds.
seconds of available time.
begins at the start of 10 or more consecutive severely errored seconds and ends at the
start of 10 or more consecutive non severely errored seconds.
severely errored seconds.
excludes severely errored seconds and periods of unavailability.
seconds.
Table 3-16 PDH G.826 Analysis - DS3, M13 Framing
Display Definition
NEAR ES Receive Error Second - Cumulative count of seconds within av ailable time that contain at
least 1 P-Bit parity error.
FAR ES Receive Error Second - Cumulative count of seconds within available time that contain at
least 1 DS3 FERF.
NEAR SES Receive Severely errored Seconds - Cumulative count of 1 second periods within
available time that contain at least 2444 P-Bit parity or a DEFECT. Defects are LOS, LOF,
DS3 Frame Loss and DS3 AIS.
FAR SES Transmit Severely errored Seconds - Cumulative count of 1 second periods within
available time that contain at least 1 DS3 FERF.
65
Page 72

Result Definitions
PDH Error Analysis G.821, G.826, M.2100, M.2110, M.2120
Table 3-16 PDH G.826 Analysis - DS3, M13 Framing
Display Definition
ESR Error Second Ratio - The ratio of errored seconds to the total seconds of av ailab le time . A
SESR Severely Errored Second Ratio - The ratio of severely errored seconds to the total
UAS Unav ailable Seconds - Cumulativ e count of unav ailable seconds . A period of unavailability
EB Errored Block count - An errored block is a P-Bit parity with one or more bits in error.
BBE Background Block Error count - Cumulative count of errored blocks excluding those in
BBER Background Block Error Ratio - The ratio of errored blocks to total blocks. Total blocks
PUAS Path Unavailable Second count - Logical OR of the Near and Far end unavailable
period of unavailability begins at the start of 10 or more consecutive Severely Errored
Seconds, and ends at the start of 10 or more non Severely Errored Seconds.
seconds of available time.
begins at the start of 10 or more consecutive severely errored seconds and ends at the
start of 10 or more consecutive non severely errored seconds.
severely errored seconds.
excludes severely errored seconds and periods of unavailability.
seconds.
Table 3-17 PDH G.826 Analysis - DS3, C-Bit Framing
Display Definition
NEAR ES Receive Error Second - Cumulative count of seconds within av ailable time that contain at
least 1 Frame error.
FAR ES Receive Error Second - Cumulative count of seconds within available time that contain at
NEAR SES Receive Severely errored Seconds - Cumulative count of 1 second periods within
FAR SES Transmit Severely errored Seconds - Cumulative count of 1 second periods within
ESR Error Second Ratio - The ratio of errored seconds to the total seconds of av ailab le time . A
SESR Severely Errored Second Ratio - The ratio of severely errored seconds to the total
least 1 DS1 FERF.
available time that contain at least 8 Frame errors or a DEFECT. Defects are LOS, LOF,
DS1 Frame Loss and DS1 AIS.
available time that contain at least 1 DS1 FERF.
period of unavailability begins at the start of 10 or more consecutive Severely Errored
Seconds, and ends at the start of 10 or more non Severely Errored Seconds.
seconds of available time.
66
Page 73

Result Definitions
PDH Error Analysis G.821, G.826, M.2100, M.2110, M.2120
Table 3-17 PDH G.826 Analysis - DS3, C-Bit Framing
Display Definition
UAS Unav ailable Seconds - Cumulativ e count of unav ailable seconds . A period of unavailability
EB Errored Block count - An errored block is a frame byte with one or more bits in error.
BBE Background Block Error count - Cumulative count of errored blocks excluding those in
BBER Background Block Error Ratio - The ratio of errored blocks to total blocks. Total blocks
PUAS Path Unavailable Second count - Logical OR of the Near and Far end unavailable
begins at the start of 10 or more consecutive severely errored seconds and ends at the
start of 10 or more consecutive non severely errored seconds.
severely errored seconds.
excludes severely errored seconds and periods of unavailability.
seconds.
PDH M.2100 Analysis
For Option UKK[USB], Analysis results based on ITU-T G .821 or M.2100
can be selected on the display under
OTHER
RESULTS DISPLAY MODE.
For Option UKJ[USA], 110 Analysis results based on ITU-T G.821 or
M.2100 can be selected on the [PDH] [ERROR ANALYSIS]
display.
M.2100 Analysis is based on Frame/CRC/REBE errors.
Table 3-18 PDH M.2100 - Analysis (Not 704 kb/s)
MISCELLANEOUS
RESULTS
Display Definition
RX ES Receive Error Seconds - Cumulative count of seconds within av ailable time that contain at
least 1 FAS error. 2 Mb/s, CRC Framing - Cumulative count of seconds within available
time that contain at least 1 CRC4 error.
TX ES Transmit Error Seconds - 2 Mb/s, CRC Framing only. Cumulative count of seconds within
available time that contain at least 1 REBE error.
RX SES Receive Severely Errored Seconds - Cumulative count of seconds within availab le time in
which the error ratio exceeds a threshold. The threshold changes according to the
selected rate as follows: 140 Mb/s - ≥ 568 Frame Bit errors 34 Mb/s - ≥ 223 Frame Bit
errors 8 Mb/s - ≥ 99 Frame Bit errors 2 Mb/s (Non CRC4) - ≥ 28 Frame Bit errors 2 Mb/s
(CRC4) - ≥ 830 CRC4 errors
TX SES Transmit Severely Errored Seconds - 2 Mb/s, CRC Framing only. Cumulative count of
seconds within available time that contain ≥ 830 REBE errors.
67
Page 74

Result Definitions
PDH Error Analysis G.821, G.826, M.2100, M.2110, M.2120
Table 3-18 PDH M.2100 - Analysis (Not 704 kb/s)
Display Definition
UNAV Unavailable Seconds - Cumulative count of unavailable second. A period of unavailability
begins at the start of 10 or more consecutive Severely Errored Seconds, and ends at the
start of 10 or more non Severely Errored Seconds.
68
Page 75

Result Definitions
PDH Error Analysis G.821, G.826, M.2100, M.2110, M.2120
PDH M.2110 BIS (Bring Into Service)
Provides a 2 Hour, 24 Hour and 7 Day PASS, FAIL, ? indication for BIS
testing as described in M.2110. The ES and SES results are compared to
the S1 and S2 thresholds and indicate PASS, FAIL or ? (uncertain). If
the result is “uncertain”, the procedures laid down in M.2110 should be
followed.
The S1 and S2 thresholds can be set
in two different ways:
1. USER PROGRAM - S1 and S2
values are input by the user.
2. PATH ALLOCATION - The HP
37717C calculates the S1 and S2
values, from the user entered Path
Allocation value, according to tables
and procedures in M.2100.
PDH M.2120 Circuit Maintenance
Provides a threshold report when any of the relevant thresholds are
exceeded within a 15 Minute (TR1 ES & SES) or 24 Hour period (TR2 ES
& SES).
The TR1 and TR2 thresholds can be
set in two different ways:
1. USER PROGRAM - TR1 ES &
SES and TR2 ES & SES values are
input by the user.
2. PATH ALLOCATION - The HP
37717C calculates the TR1 and TR2
values, from the user entered Path
Allocation and Maintenance
Factor. The Maintenance Factor is
a scaling factor used only to calculate
the TR2 threshold from the entered Path Allocation.
69
Page 76

Result Definitions
Alarm Seconds
Alarm Seconds
PDH Alarm Seconds
Alarm Second measurements are carried out on all the alarms in PDH
Status/Alarm Indications except for Clock Loss and FEAC codes (option
120 instruments).
Table 3-19 PDH Alarm Seconds
Alarm Options Description
Power Loss UKJ[USA], UKK[USB], 110 All rates
Loss of Signal UKJ[USA], UKK[USB], 110 All rates
AIS UKJ[USA], UKK[USB], 110 All rates
Pattern Loss UKJ[USA], UKK[USB], 110 All rates
LOF 140M UKJ[USA], 110 140 Mb/s Frame Loss
LOF 34M UKJ[USA], 110 34 Mb/s Frame Loss
LOF 8M UKJ[USA], 110 8 Mb/s Frame Loss
LOF 2M UKJ[USA], 110 2 Mb/s Frame Loss
Frame Loss UKK[USB] 2 Mb/s In Service Only
DS1 OOF 110 Frame Loss detected
DS3 OOF 110 Frame Loss detected
DS1 AIS 110 Detection of AIS
DS3 AIS 110 Detection of AIS
RAI /X-BIT/YELLOW UKJ[USA], UKK[USB], 110 Not 704 kb/s
Multiframe Loss UKJ[USA], UKK[USB], 110 2 Mb/s, CAS or CRC Framing
Remote M’Frame Alarm UKJ[USA], UKK[USB], 110 2 Mb/s, CAS Framing Only
Excess Zero 110 DS1: applies to B8ZS only.
DS3 Idle 110 Available DS3 only.
DS3 Framing Mismatch 110 Frame format does not match
received format
70
Page 77

Result Definitions
Frequency Measurement
Frequency Measurement
Frequency measurement is available at standard PDH and SDH rates.
The measured frequency is displayed in Hz with 1 Hz resolution.
Offset from the standard rate is displayed in Hz and ppm (parts per
million). The measurement is carried out continuously, regardless of the
state of the RUN/STOP key selection.
71
Page 78

Result Definitions
Frequency Measurement
72
Page 79

4
4 PDH Logging Messages
Page 80

PDH Logging Messages
Logging Devices
Logging Devices
Results may be logged to the Disc Drive. A color bit map of graphics
results can be recorded on the disk drive by using the screen dump
feature.
If Remote Control Option A3X is fitted, results may be logged to the
Internal Printer.
If Remote Control Option A3B or A3D, is fitted results can be logged to
an external HP DeskJet printer or suitable alternative non HP printer.
An alternative suppliers RS-232-C printer can be 40 column width or 80
column width. If a 40 column width printer is used Graphics results
cannot be logged.
74
Page 81

PDH Logging Messages
Results Logging
Results Logging
Header and results are logged to the selected device when:
• is pressed.
• If LOGGING [ON] is selected on the display and a
|==============================================================================|
| Hewlett Packard HP37717C |
| Instrument Configuration |
|------------------------------------------------------------------------------|
| RECEIVER |
| Receive Signal : 34 Mb/s Termination : 75 Ohm UNBAL |
| Linecode : HDB3 Payload : FRAMED |
| Payload Type : UNFRAMED |
| Pattern : 2^23-1 Polarity : INVERTED |
| Hit Threshold : 1.00 Filter : OFF |
| Range : 1.6 UI RMS Filter : 12 kHZ HP |
| |
| MEASUREMENT STARTED 23 Jul 97 13:09:02 Print Period 10 Minutes |
|------------------------------------------------------------------------------|
Logging Header Example
PRINT NOW
measurement is started by pressing
OTHER
RUN/STOP
LOGGING
75
Page 82

PDH Logging Messages
Results Logging
If is pressed the cumulative results are logged. If a measurement is in
PRINT NOW
progress the current results are logged. If a measurement is not in progress the
cumulative results for the last measurement are logged.
During the Measurement Period
If LOG ERROR SECOND [ON] is selected on the LOGGING display all
occurrences of an Error Second will be logged:
• Bit
• Code (PDH)
• Frame (PDH)
• CRC (PDH)
• REBE (PDH)
• DS3 Frame (SDH)
• DS3 P-Bit (SDH)
• DS3 C-Bit (SDH)
• DS3 FEBE (SDH)
• DS1 Frame (SDH)
• DS1 CRC6 (SDH)
• A1A2 FRAME (SDH)
• RS B1 BIP/B1 BIP (SDH)
• MS B2 BIP/B2 BIP (SDH)
• MS FEBE/RS REI (SDH)
OTHER
• Path B3 BIP/B3 BIP (SDH)
• Path FEBE/HP REI (SDH)
• Path IEC/HP IEC (SDH)
• TU Path BIP (SDH)
• TU Path FEBE/LP REI (SDH)
• Hit Count (Jitter)
• Hit seconds (Jitter)
• Positive Peak Amplitude (Jitter)
76
Page 83

PDH Logging Messages
Results Logging
• Negative Peak Amplitude (Jitter)
• Peak to Peak Amplitude (Jitter)
• RMS Amplitude (Jitter)
• Positive Peak (2Mb/s Wander)
• Negative Peak (2Mb/s Wander)
• Peak to Peak (2Mb/s Wander)
• Peak to Peak (15 min) (2Mb/s Wander)
• Peak to Peak (24 hours) (2Mb/s Wander)
• Time Interval Error (2Mb/s Wander)
• Estimated Bit Slips (2Mb/s Wander)
• Estimated Frame Slips (2Mb/s Wander)
• EM BIP (ATM)
• FEBE/REI (ATM)
• Corrected HEC (ATM)
• Non Corrected HEC (ATM)
• Cell Loss (ATM)
• Errored Cells (ATM)
• Misinserted Cells (ATM)
All Alarm occurrences will be logged both when set and cleared:
• Signal Loss
• AIS (PDH & ATM)
• Pattern Sync Loss (PDH & ATM)
• Loss Of Frame (SDH, PDH & ATM)
• Out Of Frame (SDH)
• Multiframe (PDH)
• Remote Loss (PDH)
• Remote Multiframe Loss (PDH)
• Loss of Pointer (SDH)
77
Page 84

PDH Logging Messages
Results Logging
• MS AIS (SDH)
• Path AIS/AU AIS (SDH)
• Pattern Loss (SDH)
• Clock Loss (SDH)
• MS FERF/MS RDI (SDH)
• Path FERF/HP RDI (SDH)
• K1K2 Change (SDH)
• H4 Multiframe Loss (SDH)
• TU Loss of Pointer (SDH)
• TU AIS (SDH)
• TU Path FERF/LP RDI (SDH)
• DS3 Frame Loss (SDH)
• DS3 AIS (SDH)
• DS3 FERF (SDH)
• DS1 Frame Loss (SDH)
• DS1 AIS (SDH)
• DS1 FERF (SDH)
• Jitter Lock Loss (Option UHN[US9])
• Excess Jitter (Option UHN[US9])
• Excess Wander (Option UHN[US9])
• Wander Ref Loss (Option UHN[US9])
• Wander Signal Loss (Option UHN[US9])
• FERF/RDI (ATM)
• Loss of Cell Sync (ATM)
• Selected Cell Not Received (ATM)
• Congestion Experienced (ATM)
• Test Cell Loss (ATM)
• VP AIS (ATM)
78
Page 85

PDH Logging Messages
Results Logging
• VP FERF/VP RDI (ATM)
• VC AIS (ATM)
• VC FERF/VC RDI (ATM)
In addition the following events are logged:
• All Alarms Clear
• Power Failure
• Power Restored
• New Day
• Squelched - Printing stopped to conserve paper during period of Unavailability
• Unsquelched - Printing restarted after period of Unavailability
• Print Demanded - if is pressed.
• Print Period - if selected on display.
PRINT NOW
OTHER
LOGGING
• Printing Enabled - if Printer enabled during a measurement.
• Measurement Complete
| 13:02:48 ALL ALARMS CLEAR |
| 13:03:04 AIS 140M SET |
| 13:03:04 Jitter Unlock SET |
| 13:03:04 Signal Loss 140M SET |
| 13:03:04 Pattern Loss SET |
| 13:03:04 AIS 140M CLEAR |
| 13:03:04 Jitter Unlock CLEAR |
| 13:03:08 Signal Loss 140M CLEAR |
| 13:03:08 AIS 140M SET |
| 13:03:08 Jitter Unlock SET |
| 13:03:08 AIS 140M CLEAR |
| 13:03:08 Pattern Loss CLEAR |
| 13:03:17 Jitter Unlock CLEAR |
| 13:03:18 ALL ALARMS CLEAR |
| 13:03:41 AIS 140M SET |
| 13:03:42 Pattern Loss SET |
| 13:03:49 Pattern Loss CLEAR |
| 13:03:49 AIS 140M CLEAR |
| 13:03:50 ALL ALARMS CLEAR |
Logging During Measurement Example
79
Page 86

PDH Logging Messages
Results Logging
At the End of the Measurement Period
A complete set of measurement results are logged.
|==============================================================================|
| MEASUREMENT COMPLETE 23 Jul 97 13:45:17 Elapsed Time 00d 00h 02m 27s|
|==============================================================================|
| Cumulative Results |
| |
| Error Results : |
| FAS 140M FAS 34M FAS 8M FAS 2M |
| Error Count N/A 0 N/A N/A |
| Error Ratio N/A 0 N/A N/A |
| |
| BIT (test) CODE CRC REBE |
| Error Count 0 0 N/A N/A |
| Error Ratio 0 0 N/A N/A |
| |
| JITTER |
| Hit Count 147285 |
| Hit Seconds 56 |
| Hit Free Seconds 91 |
| Positive Peak 0.736 |
| Negative Peak 0.746 |
| Peak-to-Peak 1.482 |
| RMS 0.040 |
| |
| Analysis Results : |
| G.821 ANALYSIS |
| BIT (test) FAS 140M FAS 34M FAS 8M FAS 2M |
| Errored Sec 0 N/A 0 N/A N/A |
| %Errored Sec 0.00000 N/A 0.00000 N/A N/A |
| %ES (Annex D) 0.00000 N/A N/A N/A N/A |
| Error Free Sec 147 N/A 147 N/A N/A |
| %Error Free Sec 100 N/A 100 N/A N/A |
| Severely Err Sec 0 N/A 0 N/A N/A |
| %Severely Err Sec 0.00000 N/A 0.00000 N/A N/A |
| Degraded Minutes 0 N/A 0 N/A N/A |
| %Degraded Minutes 0.00000 N/A 0.00000 N/A N/A |
| Unavailable Sec 0 N/A 0 N/A N/A |
| %Unavailable Sec 0.00000 N/A 0.00000 N/A N/A |
| |
| CODE CRC4 REBE |
| Errored Sec 0 N/A N/A |
| %Errored Sec N/A N/A N/A |
| Error Free Sec N/A N/A N/A |
| %Error Free Sec N/A N/A N/A |
| Severely Err Sec N/A N/A N/A |
| %Severely Err Sec N/A N/A N/A |
| Degraded Minutes N/A N/A N/A |
| %Degraded Minutes N/A N/A N/A |
| Unavailable Sec N/A N/A N/A |
| %Unavailable Sec N/A N/A N/A |
| |
| G.826 ANALYSIS |
| Near 140Mb/s Far Near 34Mb/s Far |
| Errored Seconds N/A N/A 0 0 |
| Severely Errored Seconds N/A N/A 0 0 |
| Unavailable Seconds N/A N/A 0 0 |
| Path Unavailable Seconds N/A N/A 0 0 |
| Errored Second Ratio N/A N/A 0 0 |
| Severely Errored Sec Ratio N/A N/A 0 0 |
| |
80
Page 87

PDH Logging Messages
Results Logging
| M.2100 ANALYSIS |
| Rx 140Mb/s Tx Rx 34Mb/s Tx |
| Errored Seconds N/A N/A 0 0 |
| Severely Errored Seconds N/A N/A 0 0 |
| Unavailable Seconds N/A N/A 0 0 |
| |
| M.2110 ANALYSIS |
| 2-hr 24-hr 7-day |
| BIS Results WAIT WAIT WAIT |
| |
| M.2120 ANALYSIS |
| TR1 Rx TR1 Tx TR2 Rx TR2 Tx |
| Threshold Reports 0 0 0 0 |
| |
| |
| Frequency : 34368011 Hz Offset : 11 Hz Offset : +0.3 ppm |
|==============================================================================|
Logging At End of Measurement Example
Bar Graph Logging
To log the Bar Graphs:
On the display, LOGGING SETUP , select the
OTHER
required logging device under LOGGING PORT .
On the CONTROL display, select LOGGING [ON] .
OTHER
Display the Bar Graphs required on the Bar Graph display and press .
Select .
THIS SCREEN
The Error Summary, the Alarm Summary, the selected Bar Graphs and the Alarms
Graph are logged.
LOGGING DEVICE
LOGGING
PRINT
81
Page 88

PDH Logging Messages
Results Logging
Bar Graph Logging
82
Page 89

PDH Logging Messages
Results Logging
Graphics Text Results Logging
To log the Alarm Summaries:
Select the required logging device under LOGGING PORT on the
LOGGING
Select LOGGING [ON] on the display (RS232 or HPIB).
display.
OTHER
LOGGING
Display the results required on the Text Results display and press .
OTHER
PRINT
The Error Summary and Alarm Summary are logged.
Results Snapshot Logging
To log the Results Snapshot:
Select the required External logging device under LOGGING PORT on the
OTHER
LOGGING
Select LOGGING [ON] on the display.
Select LOG ON DEMAND [RESULTS] on the display and
press .
PRINT NOW
|==============================================================================|
| Hewlett Packard HP37717C |
| Instrument Configuration |
|------------------------------------------------------------------------------|
| RECEIVER |
| Receive Signal : 34 Mb/s Termination : 75 Ohm UNBAL |
| Linecode : HDB3 Payload : FRAMED |
| Payload Type : UNFRAMED |
| Pattern : 2^23-1 Polarity : INVERTED |
| Hit Threshold : 1.00 Filter : OFF |
| Range : 1.6 UI RMS Filter : 12 kHZ HP |
| |
| MEASUREMENT STARTED 23 Jul 97 13:09:02 Print Period 10 Minutes |
|------------------------------------------------------------------------------|
|==============================================================================|
| 13:10:07 PRINT DEMANDED- RESULTS SNAPSHOT Elapsed Time 00d 00h 01m 04s|
|==============================================================================|
| Cumulative Results |
| |
| Error Results : |
| FAS 140M FAS 34M FAS 8M FAS 2M |
| Error Count N/A 0 N/A N/A |
| Error Ratio N/A 0 N/A N/A |
| |
| BIT (test) CODE CRC REBE |
| Error Count 946675 0 N/A N/A |
| Error Ratio 4.275E-04 0 N/A N/A |
| |
| JITTER |
| Hit Count 0 |
| Hit Seconds 0 |
display.
OTHER
LOGGING
OTHER
LOGGING
83
Page 90

PDH Logging Messages
Results Logging
| Hit Free Seconds 64 |
| Positive Peak 0.016 |
| Negative Peak 0.036 |
| Peak-to-Peak 0.052 |
| RMS 0.001 |
| |
| Analysis Results : |
| G.821 ANALYSIS |
| BIT (test) FAS 140M FAS 34M FAS 8M FAS 2M |
| Errored Sec 61 N/A 14 N/A N/A |
| %Errored Sec 95.31250 N/A 21.87500 N/A N/A |
| %ES (Annex D) 72.25388 N/A N/A N/A N/A |
| Error Free Sec 3 N/A 50 N/A N/A |
| %Error Free Sec 4.68750 N/A 78.12500 N/A N/A |
| Severely Err Sec 14 N/A 14 N/A N/A |
| %Severely Err Sec 21.87500 N/A 21.87500 N/A N/A |
| Degraded Minutes N/A N/A N/A N/A N/A |
| %Degraded Minutes N/A N/A N/A N/A N/A |
| Unavailable Sec 0 N/A 0 N/A N/A |
| %Unavailable Sec 0.00000 N/A 0.00000 N/A N/A |
| |
| CODE CRC4 REBE |
| Errored Sec 0 N/A N/A |
| %Errored Sec N/A N/A N/A |
| Error Free Sec N/A N/A N/A |
| %Error Free Sec N/A N/A N/A |
| Severely Err Sec N/A N/A N/A |
| %Severely Err Sec N/A N/A N/A |
| Degraded Minutes N/A N/A N/A |
| %Degraded Minutes N/A N/A N/A |
| Unavailable Sec N/A N/A N/A |
| %Unavailable Sec N/A N/A N/A |
| |
| G.826 ANALYSIS |
| Near 140Mb/s Far Near 34Mb/s Far |
| Errored Seconds N/A N/A 14 9 |
| Severely Errored Seconds N/A N/A 14 9 |
| Unavailable Seconds N/A N/A 0 0 |
| Path Unavailable Seconds N/A N/A 0 0 |
| Errored Second Ratio N/A N/A 2.188E-01 1.800E-01 |
| Severely Errored Sec Ratio N/A N/A 2.188E-01 1.800E-01 |
| |
| M.2100 ANALYSIS |
| Rx 140Mb/s Tx Rx 34Mb/s Tx |
| Errored Seconds N/A N/A 17 9 |
| Severely Errored Seconds N/A N/A 6 9 |
| Unavailable Seconds N/A N/A 44 0 |
| |
| M.2110 ANALYSIS |
| 2-hr 24-hr 7-day |
| BIS Results WAIT WAIT WAIT |
| |
| M.2120 ANALYSIS |
| TR1 Rx TR1 Tx TR2 Rx TR2 Tx |
| Threshold Reports 0 0 1 1 |
| |
| |
| Frequency : 34367996 Hz Offset : -4 Hz Offset : -0.1 ppm |
|==============================================================================|
Results Snapshot Logging Example
84
Page 91

Index
A
Alarm Monitoring, 10
Alarm scan display, 12
Alarm Seconds
PDH, 70
Alarm seconds display, 12
Analysis of N X 64 kb/s, 13
B
Bar Graph Logging, 81
BERT Testing, 17
Binary Interfaces, Option UH3 (US7)
Module Information, 5
C
Coupled Settings, 48
Cross Multiplexer Testing, 22
D
Default Settings, 48
DS1, DS3, E1 and E3 Interfaces for ATM
Payloads, Option UKZ
Module Information, 7
E
End to End BERT Testing, 17
F
FAS Monitoring, 28
Frequency Measurement, 32, 71
Frequency Offset Tolerance, 35
G
G.821 Analysis
Bit, 55
CRC, 57
Frame (FAS), 56
REBE, 58
G.826 Analysis
140 Mb/s Framed, 62
2 Mb/s CRC4 Framed, 59
2 Mb/s Framed Not CRC4, 59
2 Mb/s Unframed, 60
34 Mb/s Framed, 61
8 Mb/s Framed, 61
8, 34 and 140 Mb/s Unframed, 62
DS1 Unframed, 63
DS1, D4 & SLC-96 Framing, 64
DS1, ESF Framing, 64
DS3 Unframed, 63
DS3, C-Bit Framing, 66
DS3, M23 Framing, 65
Graph
Storage resolution selection, 21
Graphics
Bar Graph Logging, 82
Logging Bar Graphs, 81
I
Introduction to PDH, 2
L
Logging At End of Measuremen, 81
Logging Bar Graphs, 82
Logging Devices, 74
Logging During Measurement, 79
Logging Header, 75
Logging Results
At end of Measurement, 80
Bar Graphs, 80
During Measurement, 76
Error & Alarm Summaries, 83
Graphics Text, 83
Logging Header, 75
Result Snapshot, 83
Loopback BERT Testing, 18
M
M.2100 Frame Analysis, 67
M.2110 BIS Analysis, 69
M.2120 Circuit Maintenance, 69
M2100, M2110, M2120 Analysis, 47
Multiple PDH Outputs, Option UHC
Module Information, 6
Multiplexer Testing, 39
P
PDH Alarm Seconds, 70
PDH Results
Cumulative, 54
Error Analysis, 55–69
Short Term, 53
R
Receive and transmit settings linked, 14
Results Definitions
Cumulative PDH, 54
Frequency Measurement, 71
G.821 Bit Analysis, 55
G.821 CRC Analysis, 57
G.821 Frame Analysis, 56
G.821 REBE Analysis, 58
G.826 PDH Analysis, 59
M.2100 Analysis, 67
M.2110 Analysis, 69
M.2120 Analysis, 69
PDH Alarm Seconds, 70
Short Term PDH, 53
Trouble Scan, 52
Results Snapshot Logging Example, 84
Round Trip Delay, 44
S
Settings Coupled, 48
Short Term Results
PDH, 53
Storage resolution selection, 21
Structured PDH Multiplexer Test, 40
T
Timeslot selection, 14
Transmit and receive settings linked, 14
Trouble Scan, 52
U
Unstructured PDH Multiplexer Test, 40
Unstructured PDH, Option UKK
Module Information, 3
85
Page 92

Index
86
Page 93

Hewlett-Packard Sales and Service Offices
If you need technical assistance with a
Hewlett-Packard test and measurement
product or application please contact the
Hewlett-Packard office or distributor in
your country.
Asia Pacific:
Hong Kong:
Tel: (852) 2599 7889
India:
Tel: (91-11) 682-6000
Japan:
Hewlett-Packard Japan Ltd.
Measurement Assistance Center
9-1, Takakura-Cho, Hachioji-Shi,
Tokyo 192-8510, Japan
Tel: (81) 426-56-7832
Fax: (81) 426-56-7840
Korea:
Tel: (82-2) 769 0800
Malaysia:
Tel: (60-3) 291 0213
For countries in Asia Pacific not listed,
contact:
Hewlett-Packard Asia Pacific Ltd
17-21/F Shell Tower, Times Square,
1 Matheson Street
Causeway Bay
Hong Kong
Tel: (852) 2599 7777
Fax: (852) 2506 9285
Australia/New Zealand:
Hewlett-Packard Australia Ltd.
31-41 Joseph Street
Blackburn, Victoria 3130
Australia
Tel: 1 800 629 485
Canada:
Hewlett-Packard Canada Ltd.
5150 Spectrum Way
Mississauga, Ontario
L4W 5G1
Tel: (905) 206 4725
Europe, Africa and Middle East:
Philippines:
Tel: (63-2) 894 1451
People’s Republic of China:
Tel: (86-10) 6505 0149
Singapore:
Tel: (1800) 292 8100
Taiwan:
Tel: (886-3) 492 9666
Thailand:
Tel: (66-2) 661 3900
Austria:
Tel: (0)1 25000-0
Belgium and Luxembourg:
Tel: (02) 778 3417
Baltic Countries:
Tel: (358) 08872 2100
Czech Republic:
Tel: 420-2-4743111
Denmark:
Tel: 45 99 10 00
Page 94

Hewlett-Packard Sales and Service Offices (cont’d)
Finland:
Tel: (90) 88 721
France:
Tel: (0)1 69.82.60.60
Germany:
Tel: (0180) 532 62-33
Greece:
Tel: 30-1-7264045
Hungary:
Tel: 36-1-4618219
Ireland:
Tel: (01) 284 4633
Israel:
Tel: 972-3-5380333
Italy:
Tel: 02 - 92 122 241
Netherlands:
Tel: (020) 547 6669
Norway:
Tel: (22) 73 57 50
Poland:
Tel: 48-22-6087700
Sweden:
Tel: (08) 444 22 77
Switzerland:
Tel: (01) 735 7111
Turkey:
Tel: 90-212-2245925
United Kingdom:
Tel: (01344) 366 666
For countries in Europe/Middle East
and Africa not listed, contact:
Hewlett-Packard
International Sales Europe
Geneva, Switzerland
Tel: +41-22-780-4111
Fax: +41-22-780-4770
Latin America:
Hewlett-Packard
Latin American Region Headquarters
5200 Blue Lagoon Drive
9th Floor
Miami, Florida 33126
U.S.A.
Tel: (305) 267-4245
Tel: (305) 267-4220
Fax: (305) 267-4288
Portugal:
Tel: (11) 482 85 00
Russia:
Tel: (7/095) 928 6885
Fax: (7/095) 916 9844
South Africa:
Tel: 27-22-8061000
Spain:
Tel: (34) 1 631 1323
United States:
Hewlett-Packard Company
Test and Measurement Organization
5301 Stevens Creek Blvd.
Bldg. 51L-SC
Santa Clara, CA 95052-8059
Tel: 1 800 452 4844
Page 95

About This Edition
This is the 1st edition of
the 37717-90407 manual.
It documents the product
as of March 1998. Edition
dates are as follows:
1st Edition, March 1998
Copyright Hewlett-
Packard Ltd. 1998.
All rights reserved.
Reproduction, adaption,
or translation without prior
written permission is
prohibited, except as
allowed under the
copyright laws.
Page 96

In This Book
This book provides information on HP 37717C
modules with PDH capability. It also provides
applications associated with these modules.
The individual applications contain techniques
which may be of value for purposes other than
those shown.
Printed in U.K. 03/98
37717-90407
 Loading...