

Page 1

HEWLETT
PACKARD
II
NETWORK ANALYZER 3577A
5 Hz to 200 MHz
35677AlB
4@p
COMPLETE NETWORK ANALYSIS
For higher productivity
Page 2

COPYRIGHT AND DISCLAIMER NOTICE
Copyright - Agilent Technologies, Inc. Reproduced with the permission of Agilent
Technologies Inc. Agilent Technologies, Inc. makes no warranty of any kind with regard
to this material including, but not limited to, the implied warranties of merchantability
and fitness for a particular purpose. Agilent Technologies, Inc. is not liable for errors
contained herein or for incidental or consequential damages in connection with the
furnishing, performance, or use of this material or data.
Page 3

Superb measurement performance and outstanding network
analysis capabilities are made
possible through technical design
innovations in the 3577A. The
broadband 5 Hz to 200 MHz
measurement capability is provided by precise analog design.
The accuracy and display flex-
ibility are the result of digital
signal processing. Simplicity of
operation is the benefit of in-
novative microprocessor control.
High Accuracy and Resolution
Use the internal synthesized
source over the 5 Hr to 200 MHz
frequency range with 0.001 Hz
resolution and settability. Meas-
ure with 100 dB of dynamic
range and 0.02 dS and 0.2 deg
dynamic accuracy. Make critical
low level measurements with
- 130 d&n sensitivity in the
1 Hz resolution bandwidth.
Move the displav marker to
resolve points of interest to
0.001 dB and 0.005 deg.
The HP 3577A
High Performance
Network Analyzer
5 Hz to 200 MHz
Multiple Transmission
Parameters
Configure the 3577A to measure
signal levels at any i”putfA.0, or
R), or the ratio of any two in-
puts (e.g., B/RI. Characterize
magnitude performance such as
insertion loss/gain, attenuation,
or input/output polar. Use the
User-Defined Vector Math func-
tion to mee*ure rransfer func-
tions. Determine phase shift and
electrical length with the Electronic Line Stretcher. Aid active
device measurements by verifying gain compression.
Phase Distortion
Measurements
The swept group delay capability
lets the usar select from several
frequency apertures for an op
timum display. Or use Phase
Slope compensation to display
deviation from linear phase at
high resolution.
Reflection and S-Parameter
Capability
Using a” appropriate signal
separarion device, characterize
reflection quantities such as
reflection coefficient, return loss,
or impedance. Make simultaneous
reflection/transmission measura-
merits with s 35677A/B
S-Parameter Test Set. The
35677A and 356778 provide
100 kHz to 200 MHz coverage
for 50 R and 75 n systems,
respectively.
Page 4

35h
35774
~vQ2L;+.,L~~
G/j+. jo Fa
.,,.,
, ,, 1,
‘,
--,-,
The Complete
Network Analysis
System
An Integrated Three Input Receiver,
Graphics Display and Synthesized Source
with Companion 50 fl and 75 fl S-Parameter Test Sets
Performance
. 5 Hz fo 200 MHz.
m 100 dB Dynamic Range.
m 0.02 dB and 0.2 deg Dynamic
Accuracy.
m 0.001 Hz, 0.001 dB.
0.005 deg Resolution.
m - 130 dBm Sensitivity in
, Y_ n^^^J,.*:^^ m....?l...:rl*!+
Conw
q
H Annotated Dual Trace Display,
H Normalization.
m Autoscale and Markers.
. Vector Error Correction.
m Save/Recall Memory.
8 Vector Noise Averaging.
Verse
Is
i
Rectangular, Polar, or Smith
Display Formats.
m Swept Frequency (Log, Line
or Alternate) or Swept Ampll
. 50 0 and 1 M!l Input
Impedances.
m Vector Math Operations.
Page 5

W Rectangular, Polar, or Smith Chart
Display Formats.
m swept Frequency (Log, Linear
or Alternate) or Swept Amplitude.
q 50 0 and
Illlp~C!anCeS.
1 Mn Input
q Vector Math Operations.
B Direct HP-16 Plotter Control for
Hard Copy.
n Fast Data Transfer in Binary or
ASCII Modes.
. Programmable Display Graphics
for Custom Testing.
Page 6

Built-in Accuracy
Enhancements
aeduce measuremen*
ty by removing frequency
response errors through Normalization. Higher accuracy
reflection measurements are
possible with Vector Error Correction. Noise effects are
minimized by averaging mag
nitude and phase using Vector
Noise Averaging.
Operational Simplicity
Focus your attention on the
display, using the soft keys to
guide you through the measurement. Select the Autoscale func-
tion to bring the measurement
on the screen quickly - then
use the Marker to investigate
points of interest on the trace
with accurate numeric readout.
Use the Data Storage Registers
to store complete magnitude and
phase information for later
retrieVd. Change test Setups
quickly via the non-volatile
Save/Recall Memory. Obtain
hardcopy of measurement
results rapidly with direct
transfer to a graphics plotter.
uncertain-
Achieve Your
Productivity Goals
in Design and
Production
Full HP-IS” Programmability
Automatic measurements are
easy with the 3577A’s simple
programming codes that
minimize software development
time. Quickly access a single
point or an entire trace of data
with fast data transfer capability. Customize the display
with Display Graphics such as
operator instructions, limit test
lines, and connection diagrams.
Page 7

haracterire a Wide
C
Narrowband and Broadband
D6Wkes
Measurement of narrowband
devices can often be slow,
tedious and expansive. The
3577A allows you
these difficult
precisely and easily as in wideband festing. The built-in synthesized source assures high frequency stability, accuracy and
resolution for narrowband
testing. The 5 Hz to 200 MHz
phase continuous aweep with
either increasing or decreasing
frequency is ideal for characterizing broadband devices. Determine the resonant and antiresonant frequencies of a quartz
crystal or analyze high-Q
resonators wirh 0.001 Hz resolution. Make magnitude and phase
measurements of low-Q devices
with 0.02 dS and 0.2 deg
SCCU~~Cy.
to
measurements
make
as
Range
of Devices
From 5 Hz
to 200 MHz
Active and Passive Filters
The TOO dS dynamic range, high
resolution and accuracy are ideal
for characterizing both active
and passive filters. The 5 Hz to
200 MHz frequency range is a
good match for L-C, ceramic and
quartz technologies. Tha 1 kHz
resolution bandwidth allows a
fast broadband swap, while the
1 Hz resolution bandwidth and
stable source make measurements of filters with steep skirts
and, near-unity shape factors
easy. The 1 Hz bandwidth
lowers the noise level to
- 130 dgm for measurement of
stopband attenuation and high
loss devices. Observe both passband insertion loss and stopband
attenuation simultaneously with
the Alternate Fraquancy Sweep
capability.
Communications
Quality signal transmission of
voice, data, video, baseband, or
radar requires the ability to pass
desired signals with low phase
and magnitude distortion. Phase
distortion parameters such as
group delay and deviation from
linear phase can be measured
with up to 1 ps and 0.005 deg
resolurion, respectively. Adjust
the group delay flatness of an IF
system while simultaneously
observing orher interactive
parameters such as return loss
or passband ripple with
0.001 dB resolution. Then, make
the neceaaary high performance
baseband and subsystem
measureme”ts.
Nsrrowbond
mmS”reme”t3 01
WST~Z cwidr
dB”iCC5 are BBl”
With me 357,A.
Page 8

<‘ye4
tion and output return loss
out reversing the amplifier.
The source level can
be set from + 15 dBm
to -49 dBm for high
gain amplifier maas-
urements. Measure
gain compression
and output power
linearity with Amplitude Sweep
capability.
Component Testing
Swept frequency measurements
of components such as inductors, capacitors, transformers
and cables are fast and easy to
make. Determine self resonances
and spurious responaea beyond
the frequency range of “se for
safe desinn and production
cable length using
: Line Stretcher to
remove the linear phase component. Determine the delay of
surface acoustic wave (SAW)
devices or video delay lines.
Transistor fixtures allow
s-parameter measurements of
bipolar transistors and FET’s.
over Your Audio,
C
Video, Baseband, IF,
and -RF Needs.
Numerous Other Applications
The 3577A has applications in
many diverse ereas such as
hydrophonic and digital communications. Take, for example,
underwater sonar, where
magnitude and phase information received by a transducer
and the transducer’s driving
point impedance are important
to system operation. Also, high
speed digital problems can be
solved using the transmission
line techniques of network
analysis. Digital baseband and
PCM applications require filters
and amplifiers with critical time
domain response characteristics
which can be readily explained
with swept frequency analysis.
This technique can also be ap-
plied to disc drive reed-write
amplifiers where the magnitude
and phase response directly af-
fects the quality of digital data
transmission.
Page 9

ustomize Your
C
Display Through
Soft Keys
The dual trace display of the
3577A assures that measurement results are clear, crisp and
easy to read. The display is fully
annotated with the sweep frequencies, amplitude level,
reference level, delay aperture,
scale factor and marker data.
The eight keys at the right of
the display are soft keys through
which you control the
measurements to be made. Use
the other front panel keys to access soft key menus such es
Frequency, Sweep Type or
Input. Once you’re finished, use
one of the five Save/Recall
Memories to store the front
panel setup in “on-volatile
memory for convenient recall
when needed.
Data Storage
and Vector Math
The 401 points of trace data
can be stored in magnitude and
phase format in any one of four
data registers, then redisplayed
using any display function. Since
the data is stored with full accuracy and resolution, it can be
resealed as needed. The internal
Vector Math capability can add,
subtract, multiply or divide userdefined combinations of input
data, stored data and user-
defined constants and functions.
These customized results can
then be redisplayed without the
need of a computer. This eliminates the tedious, complex calculations needed for converting
open loop gain to closed loop
gain, or presenting voltage-
current transfer functions
directly in impedance or
admittance.
Comparisons
Using the Store and Display
function, previously stored data
and current input data can be
simultaneously viewed on the
display. This allows the characteristics of a standard “golden-
unit”
to
be stored, then displayed for direct comparison
with the response of a test
device. Now, adjusr the device
for the required performance, or
measure changes w?lith time or
temperature. Using normalization
also allows the difference to be
viewed, thus simplifying the
visual comparisons of the
traces.
two
Normalization
Swept magnitude and phase frequency response variations can
be stored es a reference using
the Normalize function. The
display will show the difference
between the stored reference
and the measured input data.
Use normalization to remove the
frequency response effects of
external cables and probes, or to
enhance the magnitude ratio and
phase accuracy of .the 3577A.
By eliminating internal ratio accuracy errors and frequency
response variations, the 3577A
will measure magnitude and
phase with accu&cies
0.02
dB and 0.2 deg,
respectively
of
up to
Page 10
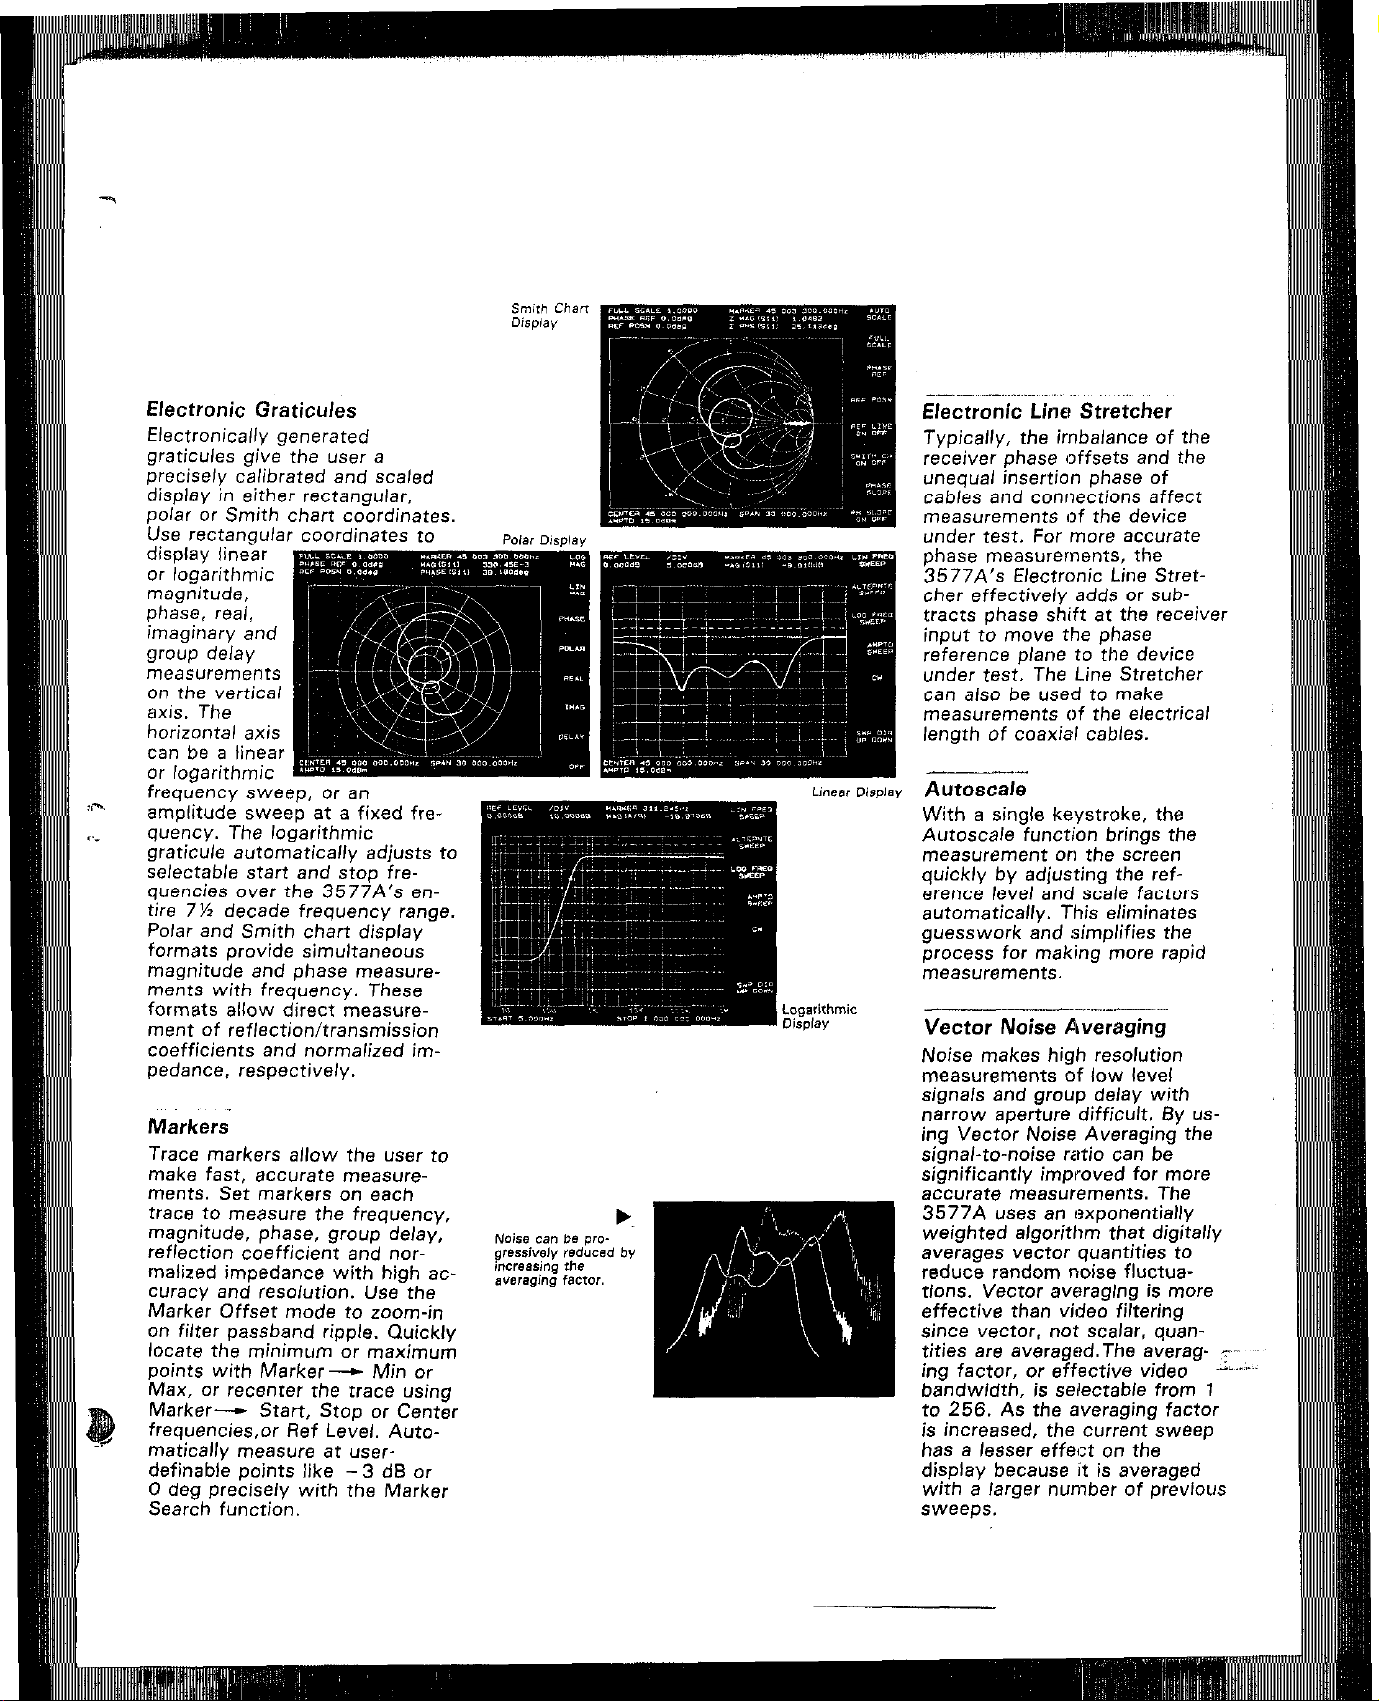
Electronic Graticules
Electronically generated
graticules give the user a
precisely calibrated and scaled
display in either rectangular,
polar or Smith chart coordinates.
Use rectanaular coordinates to
frequency sweep, or an
amplitude sweep at a fixed frequency. The logarithmic
graticule automatically adjusts to
selectable start and stop frequencies over the 3577A’s entire 7% decade frequency range.
Polar and Smith chart display
formats provide simultaneous
magnitude and phase measurements with frequency. These
formats allow direct measurement of reflection/transmission
coefficients and normalized impedance, respectively.
Markers’
Trace
markers allow
make fast, accurate measure-
ments. Set markers on each
trace to measure the frequency,
magnitude, phase, group delay,
reflection coefficient and normalized impedance with high ac-
curacy and resolution. Use the
Marker Offset mode to zoom-in
on filter passband ripple. Quickly
locate the minimum or maximum
points with Marker- Min or
Max, or recenter the trace using
Marker--, Start, Stop or Center
frequencies,or Ref Level. Automatically measure at user-
definable points like - 3 dB or
0 deg precisely with the Marker
Search function.
the user to
Electronic Line Stretcher
Typically, the imbalance of the
receiver phase offsets and the
unequal insertion phase of
cables and connections affect
measurements of the device
under test. For more accurate
phase measurements, the
3577A’s Electronic Line Stretcher effectively adds or subtracts phase shift at the receiver
input to move the phase
reference plane
under test. The Line Stretcher
can also be used to make
measurements of the electrical
length of coaxial cables.
,-___.
to
the device
Autoscale
With a single keystroke, the
Autoscale function brings the
measurement on the screen
quickly by adjusting the ref-
erence level and scale factors
automatically. This eliminates
guesswork and zsimplifies the
process for making more rapid
measurements.
---..-._--
Vector Noise Averaging
Noise makes high resolution
measurements of low level
signals and group delay with
narrow aperture difficult. By using Vector Noise Averaging the
signal-to-noise ratio can be
significantly improved for more
accurate measurements. The
3577A uses an Iexponentially
weighted algorithm that digitally
averages vector quantities to
reduce random noise fluctuations. Vector averaging is more
effective than video filtering
since vector. not scalar, quantities are averaged.The averag- :I’
ing factor, or effective video sir.
bandwidth, is selectable from 7
to 256. As the averaging factor
is increased, the current sweep
has a lesser effect on the
display because it is averaged
with a larger number of previous
SWeC?pS.
Page 11
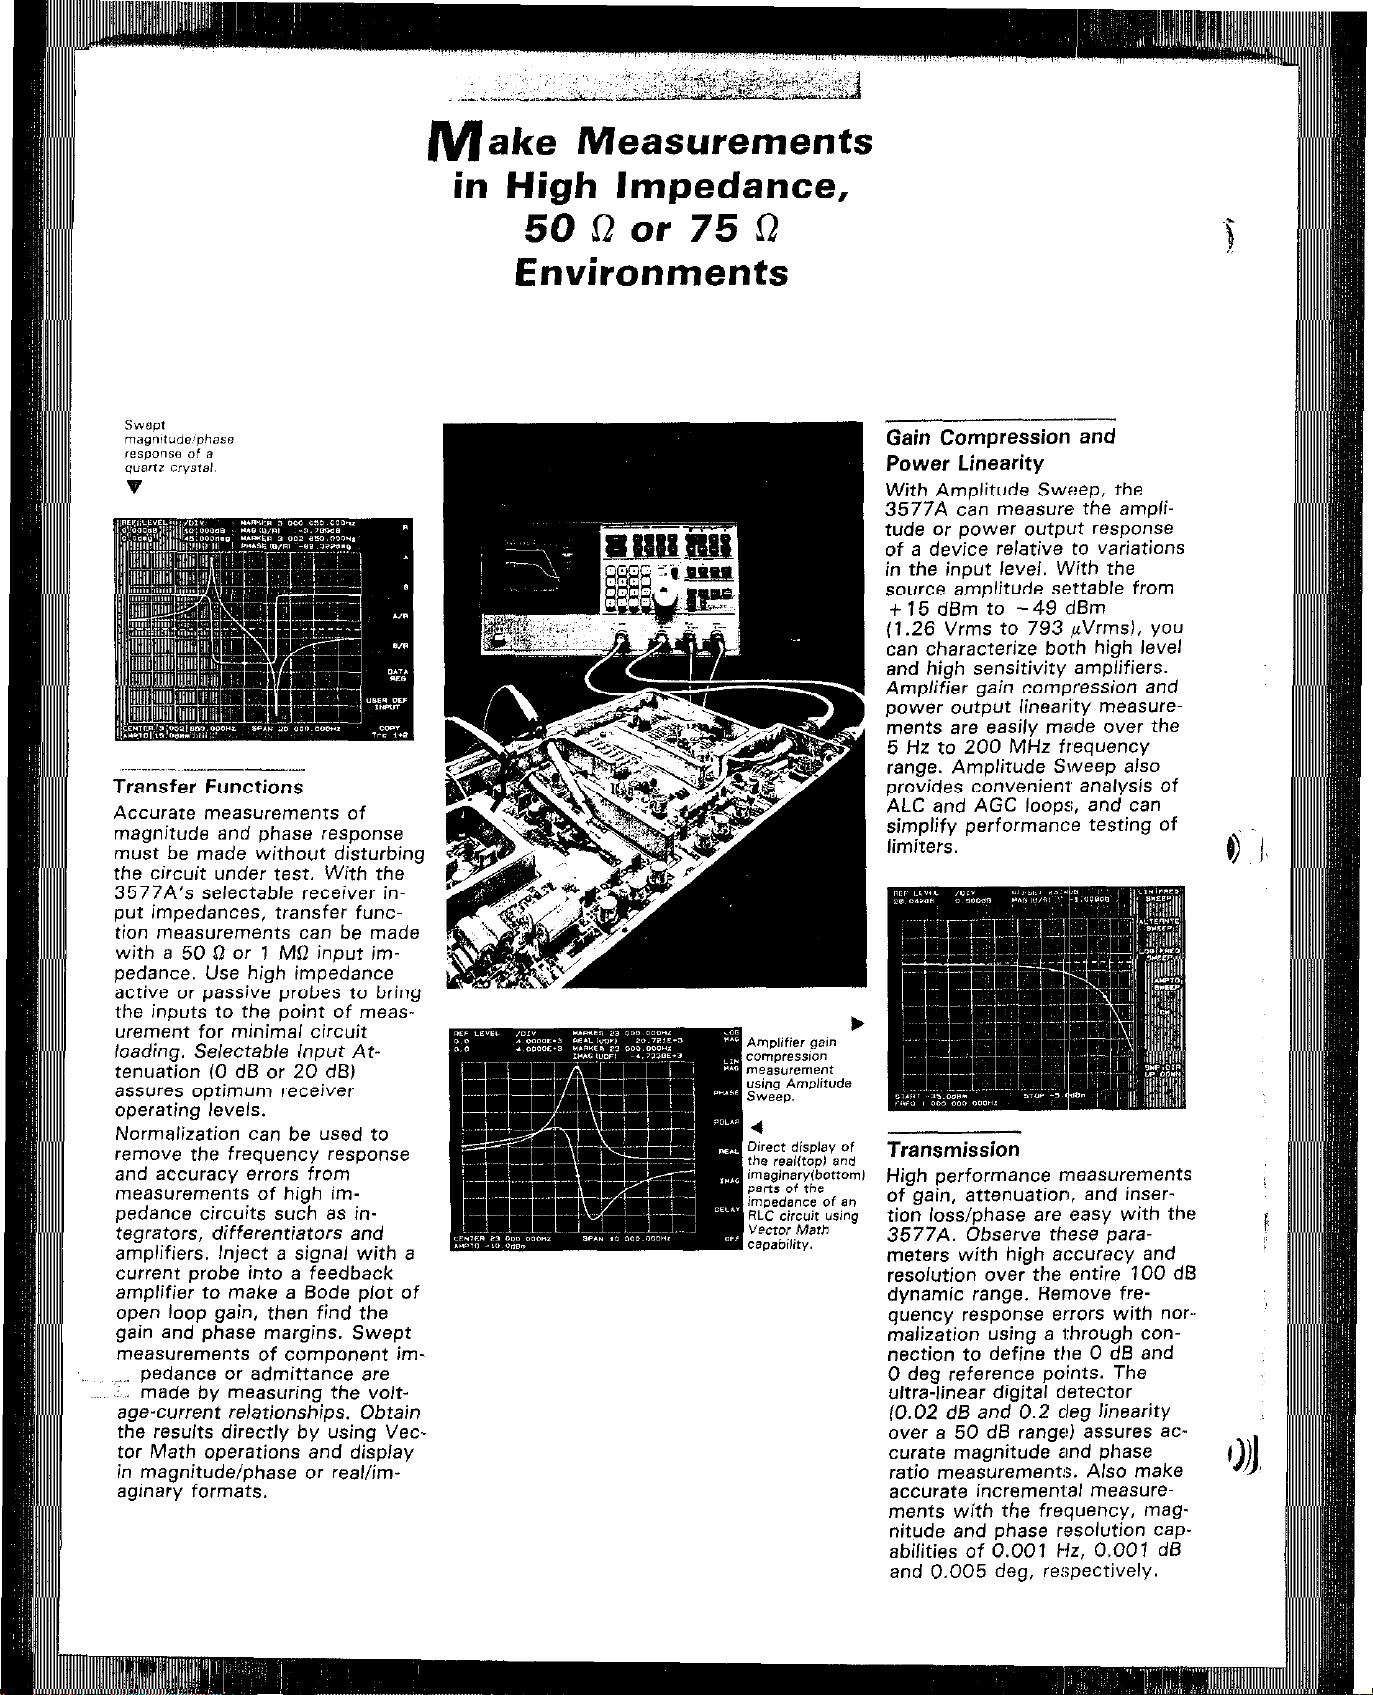
Transfer Functions
Accurate measurements of
magnitude and phase response
must be made without disturbing
the circuit under test. With the
3577A’s selectable receiver input impedances, transfer function measurements can be made
with a 50 0 or 1 MR input impedance. Use high impedance
active or passive probes to bring
the inputs to the point of measurement for minimal circuit
loading. Selectable Input Attenuation (0 dB or 20 dl3)
assures optimum receiver
operating levels.
Normalization can be used to
remove the frequency response
and accuracy errors from
measurements of high im-
pedance circuits such as in-
tegrators, differentiators and
amplifiers. Inject a signal with a
current probe into a feedback
amplifier to make a Bode plot of
open loop gain, then find the
gain and phase margins. Swept
measuramants of component im-
pedance or admittance are
,,,
’ made by measuring the volt-
age-current relationships. Obtain
the results directly by using Vector Math operations and display
in magnitude/phase or reallimaginary formats.
in High Impedance,
56 In or 75 L?
Environments
Gain Compression and
Power Linearity
With Amplitude Sweep, the
3577A can measure the amplitude or power output response
of a device relative to variations
in the input level. With the
source amplitude settable from
+15 dBm to -49 dBm
(1.26 Vrms to 793 fiVrms1, you
can characterize both high level
and high sensitivity amplifiers.
Amplifier gain compression and
power output linearity measurements are easily made over the
5 Hz
to
range. Amplitude Sweep also
provides convenient analysis of
ALC and AGC loop:;, and can
simplify performance testing of
limiters.
200 MHz frequency
Transmission
High performance measurements
of gain, attenuation, and insertion loss/phase are easy with the
3577A. Observe these parameters with high accuracy and
resolution over the entire 100 dB
dynamic range. Remove frequency response srrors with “ormalization using a through connection to define the 0 dB and
0 deg reference points. The
ultra-linear digital detector
(0.02 dB and 0.2 deg linearity
over a 50 dB range) assures accurate magnitude and phase
ratio measurements. Also make
accurate incremental measure-
ments with the frequency. mag-
nitude and phase resolution cap-
abilities of 0.001 Hz, 0.001 dB
and 0.005 deg. re!ipectively.
Page 12

S-Parameter Test Sets
Use a 35677Al9 S-Parameter
Test Set for simultaneous
transmission/reflection
measurements from 100 kHz to
200 MHz. Select between the
35677A and 356779 for meas-
urements in either 50 D or 75 0
impedances. The Test Sets use
one interconnect from the
3577A Network Analyzer - pro-
viding power and automatically
reconfiguring the 3577A input
menu to include forward and
reverse s-parameters. Rear panel
bias ports on the Test Sets
allow setting quiescent operating
points for transistors, diodes and
varactors. Measurements on
transistors are easily accom-
plished by using the 11600B
and 116028 Transistor Fixtures.
.,. ,_~ . ~~, .,...
Power Splitters
Power Splitters complement the
35677AIB S-Parameter Test
Sets by providing economical -”
transmission measurement
capability below~, 100 kHz and
lower insertion loss for measurements at higher drive levels. The
11850AIEl Three Way Power
Splitters are useful for precise
tL+nsmission measureGents from
5
Hz to 200 MHz in 50 R
or 75 D impedances, respectively. Use the two resistor
11667A Power Solitter for sim-
ple 50 L’ measurements over the
5
Hz to
200 MHz frequency
range. The 35679AlB Type N
Test Port Extension Cables make
it easy and convenient to con-
nect a Power Splitter or an
S-Parameter Test Set to the
device under test.
Page 13

Difficult
Measurements Made
Simple. . .
Impedance
P
Return Loss
Accurate return loss meesure-
menrs can be made using the
35677AfB S-Parameter Test
Sets due to their excellent port
match and 40 dB directivity. Impedances near the characteristic
impedance of the system under
test can be viewed at high
resolution in the logarithmic
magnitude display format. The
test set allows the user to
observe transmission and reflection meesuremenfe simuftaneousiy for real time optimization
of interactive parameters such
as return loss and insertion loss.
Reflection Coefficient
In addition to measuring return
bss, the 3577A can also display
the complex reflection coefficient in either rectangular or
polar format. In the polar mode,
use the marker to determine
either magnitude and phase or
the real and imaginary values as
well as the precise test frequency. Using the electronically
generated Smith chart graticule,
marker data can be read in
normalized impedance.
Automatic Vector
Error Correction
Hardware errore in the test
setup can greatly degrade reflection measurements. With the
3577A, errors in reflection
measurements such as directivi-
ty, frequency response and
eource match can be corrected
automatically through internal
calibration algorithms. Calibra-
tion is simple with soft key con-
trol and displayed operator in-
structions for sequentially con-
necting an open circuit, short
circuit and load termination.
Choose between one, two or
three step calibration sequences
depending upon the degree of
accuracy needed (simple fre-
quency response correction may
be all that is necessary). The
35678A/8 Type N Calibration
Kits provide the necessary
calibration standards in 50 0 or
75 n impedances.
Page 14

Phase Distortion
quency aperture to be set from
0.5% to 16% of the displayed
frequency spa” with annotation
directly in Hertz. By selecting
the aperture es a percent of
span, the user can change the
span and still retain the same effective smoothing. Narrow the
aperture for high resolution narrowband device measurements
or increase the aperture for fast,
noise-free measurements. Then
select the frequency aperture
and amount of Vector Noise
Averaging for the best meesurement results possible.
Deviation From Linear Phase
Phase distortion can be
measured as deviation from
linear phase, or es group delay,
since delay is the slope of the
phase response. The linear component of the phase response
can be removed with Phase
Slope compensation of * 72,000
deglspan so that the remaining
higher order phase variations can
be seen with high resolution.
Dual trace measurement cep-
ability allows the user to mini-
mize distortion by adjusting a
device for either constant group
delay or linear phase response,
while optimizing for a flat
magnitude response.
Group Delay
The 3577A measures group
delay directly by dividing the
measured phase changes across
the selected frequency aperture
by the aperture value. Excellent
phase resolution and synthesized
frequency control allow meas-
urements with 0.01 nsldiv and
1 ps marker resolution. Make
group delay measurements over
the range of 1 ps to 20,000 s,
depending on the frequency
aperture. Use Vector Noise
Averaging to make critical group
delay measurements with nar-
row apertures.
Page 15

Displayed measurement results
can be transferred directly via
the HP-IS to graphics plotters
that recognize Hewlett-Packard
Graphics LanguageiHP-GLI commands. The 3577A will directly
control the plotter to provide
high quality, permanent hard
copy without the need for a
computer.
Flexible Plotter Control
Simple softkey selections make
it easy to rapidly plot the display
trace 1, trace 2, graticule or
characters. Plot just the information needed from the display or
add additional traces to the
same plot for relating or compar-
ing multiple measurements. You
can plot the entire display with
selectable pen colors and special
line types for easy trace
identification.
Quick, Cost-
effective Hard Copy
Without a Computer
(..
,
/
Cost-effective
Documentation
Measurement hardcopy can be
used in a lab notebook or for
production test reports and
record keeping. Digital plotting
saves both time and money: no
more time consuming, hand
drawn plots; no more frustrating
sessions adjusting and re-
shooting with oscilloscope
cameras. High resolution, full
color, annotated plots are yours
at the push of a button1
--
\ Add Special Markers
These special markers can be
added for easy identification of
points of interest on the hard
copy plot. Set the marker to any
point on the trace, then select
Plot Marker 1 or Plot Marker 2
.i with the soft keys. The point of
interest is indicated and the COT-
‘? responding marker values are
plotted nearby. Add as many
special markers as you need to
identify minimums, maximums or
:. other significant data points.
Page 16

utomation
A
Means Greater
Productivity
IIIII f
Ill1 a
Ill1
Faster Measurements
All front panel capabilities of the
3577Aiexcept the sc line
SWlfC”, Cllsplsy Intensity, entry
knob, HP-18 address selection,
and talk only on/off) plus
HP-IS only functions are sccessible for complete automatic
testing. The simple command
structure, built-in functions and
Learn Mode help reduce programming time and cc
ample, a complete 40 I porn
measurement can be transferred
to an HP Series 200 Computer
- ^ ^
I” ID” ms us,ng the mnary
floating point mode. By reducing
the number of data points, using
single frequency or markers,
measured data can be trsnsferred in even less time. Comolete
trigger, serial poll with mas’ksble
Status bytes, parallel poll and
talk-only capabilities add even
greater versatility.
special
1’ 7 cl
0:: lzG.cL:
_
I-&.~- -.LL;O
LLLLL LL
Custom Display Graphics
The 3577A display can be used
as an interactive !!rsphics terminal for sutomstlc testing.
Draw lines or use the special
alphanumeric character set to
display operator messages, test
procedures, limit test lines or
connection diagrams. Define the
soft key menu for your special
test requirements, then use the
soft keys to control the messurement. Measured data can be
reformatted and redisplayed, sdding to the 3577A’s capabilities
- convert s-parameters to h- or
y-parameters, display VSWR, or
show pole/zero locations
s-plane.
on an
Achieve Higher Quality
Automatic network analysis can
achieve higher accuracy by using speciai calibration techniques
which eliminate numerous
sources of errors in both
mission and reflection measurements. Likewise, by eliminating
sources of human error, consistent, repeatable results can be
obtained 24 hours a day,
resulting in fewer rejects and
greater throughput. Complete
documentation of test results.
such as plots and tabular printouts, can be used for QA trends
and statistical performance
analysis.
trans-
Page 17

SPECIFICATIONS describe the instruments
warranted performance. Specifications apply
after B warm up period of one hour except
as noted orherwise. SUPPLEMENTAL
CHARACTERISTICS are inrended t0 provide
information useful in applying the instrumerit by giving typical. but non-warranted,
Performance specifications. Supplemental
characteristics are denoted as “typical”,
“nominal”,
or “wpproxima~ely”.
Specifications
at a Glance
SOWCR
Characteristics
Receiver
Eheracterlatlcs
Resolution
Bandwidth Input Frequency
1 Hz
1 kHz
Magnitude
* 0.04 da
1-0.02 dB
kO.10 dB
to.50 d8
Frequency Range: 5 Hz to 200 MHz.
Frequency Resolution: 0.001 Hz.
Output Level Range: + 15 dBm to
- 49 d&n f I .26 “rms to 793 p”rms,.
Output Resolution: 0.1 d8.
fmpedence: 50 n with >20 dS return loss.
Output Connector: 50 0 Type N female.
6weep Type: Linear, Alternate,, Logarithmic
and CW Frequency; Logarithmic Amplitude.
Sweep Mode: Continuous. Single, Manual.
Trigger Mode: Free Run. Immediate, Line.
External.
Frequency Range: 5
Inputs: Three (A,B,R).
Impedance: 50 6l with > 25 dB return loss
or 1 ML’.
f”&COlmBCfDrs: Three. 50 0 Type N
Magnitude Rangefwith 50 D input im-
pedance and 20 dB input attenuation):
5 Hz to 30 kHz 30 kHz to 200 MHz
OdBmto -1lOdBm OdBmto -llOdBm
0 d8m to - 80 dBm 0 dBm to - 95 dBm
Not%: These levels shift 20 dB lower with
0 dB
input
Phase Range: * 180 deg.
Group Delay Range: 1 PS to 20,000 s.
Resolution Bandwidth: 1 kHz, 100 Hz,
10 Hz. 1 Hz.
Dvnamic Accuracy Iin 1 kHr. 100 Hz, or
10 Hz resoludon bandwidthl:
Phase
* 0.4 deg
f 0.2 deg
k 1.0 deg
r5.0 deg
HZ
to 200 MHZ.
Input Frequency Calibration: Normalization and reflection
attwuation.
Input Level Relative to
Maximum Allowable Input
0 dB to
- 10 dB to -60 dB
-60 d6 to -80 d8
-8OdBto -1OOdB
- 10 dB
Di.Sphy
Characteristics
Real/Imaginary
35677A/B S-PARAMETER TEST SETS
Measurement FunctIona: Log magnitude,
linear magnitude, phase, rwl. imaginary and
group delay.
Greticules: Rectangular ldual tracel, polar
and Smith chart.
Resolution:
Display
Magnitude
Phase
Group Delay
Measured No. Points/Sweep: Linear and
Alternate’Frequency, 51.107.201.401;
Logarithmic Frequency, 401.
Measured No. Steps/Sweep: Logarithmic
Amplitude Sweep, 5,10,20,50,100.200.400.
Noise Averaging: Exponentially weighted
vector pveraging on successive sweeps.
hemy factors are lfoff).4.8.16,32,64.
Vector Math: Vector addition, subtraction.
multiplication, and division of measured
data. stored data, constants and/or
functions.
vector error correction lremoves effects of
directivity, frequency response. and/or
source match).
Graphics: HP-IB programmable
alphanumeric and special characters, and
line vectors.
Hard Copy: Direct plots using an HP
graphics plotter without B computer.
Savelflecafl Memory: Front panel Setups
can be stowd and recalled using any of the
five non-volatile memories.
Frequency Range: 100 kHz ‘to 200 MHz.
Test Poti ‘Impedance:
35677A: ,50 0 with 226 dE port march.
356776: 75 !l with >24 d6 port match.
Connsctora:
Input Poti, Output PortsfA.6.R): 50 D
Type F female.
0.01 dB/div 0.001 d6
0.01 degldiv 0.005 deg
0.1 nV/div 5 digits
0.01 nsldiv
Marker
1 PS
.677A: 50 0 Type N female.
356776: 75 n Type N female.
DbWtiVit#: >40 d6.
Typical iWaxlmum
3577A’Sourc9 Output Level at + 15 d5ml:
Output
Power With
Page 18

3577A
Network Analyzer
Specifications
.y*~III_&
SOURCE CHARACTERISTICS
Frequency
Characteristics
Output
Characteristics
Frequency flange: 5 Hz to 200 MHz.
Frequency Resolution: 0.001 Hz.
Stability:
Level Range: + 15 dBm to -49 dBm
Il.26 Vrms to 793 FVrms; 2 dBV to
- 62 dW into a 50 iI load.
Aesolut;on: 0.1 dB.
Entrv Units: dBm. dBV~ V~
A&racy: t 1 dB at + 15 dEm and
100 kHz. Below + 15 dBm, add the greeter
of i 0.02 dB/dB or 0.2 dB.
Flatness: 1.5 dBp-p from 5 Hz to 200 MHz.
Impedance: 500; >20 dB return loss at ali
lP”Pi
RF Output Connector: 50 n Type N female.
Spectral Purity:
Phase Noise (in 1 Hz Bandwidth):
c - 70 dBc at offset frequencies from carrier of 100 Hz to 20 kHz.
Harmonics: c -30 dBc.
Non-Harmonic Spurious Signals:
< - 50 dBc or - 70 dBm whichever is
greeter.
Reverse Power Protection: Output is
automatically opened at a signal ievel of approximately + 22 dBm 15OW, or i 4 Vdc,
or greater applied to the source output.
Source output is reconnected with the Clear
Trip function.
i 5 x 1 O-‘/day, 0 to
55 “C.
SUWp
Characteristics
Linear Frequency:
Range: 5 Hz to 200 MHz.
Entry: Start/stop or center/span
frequencies.
Span: 0 Hz or 0.01 Hz to 200 MHz, phase
continuous.
Sweep Time: 100 msispan to 6553 s/span.
Direction: Increasing or decreasing
frequency.
Log Frequency lsegmentsd linear
approximationJ:
Range: 5 Hz to 200 MHz.
Entry: Start/stop frequencies.
Span: 0.01 Hz to 200 MHz, phase
continuous.
Log Accuracy: 2%.
Sweep Time: 200 mslspan to 6553 s/span.
Sweep, Direction: Increasing frequency.
Alternate Frequency: Sweep alternates
between two separate start/stop frequencies
using linear sweep only.
CW: Frequency is fixed. Data is updated with
a selectable Sample time from lms to 16 s.
Log Amplitude lflxed frequency):
Range: + 15 dEm to -49 dBm.
Entry: Start/stop level in dBm or dBV.
Sweep Time: 1 mslstep to 16 s/step. Total
sweep time/span depends upon total
number of steps and time/step.
Sweep Modes: Continuous, single,
manual.
Trigger Modes: Free run, immediate, line.
external.
9577A
Block Dlagram
Page 19

hpllt
Characteristics
3577A
Network Analyzer
Specifications
Frequency Range: 5 Hz to 200 MHz.
Inputs: Three receiver inputs (A, E and R).
Input Impedance: Selectable 50 0 with
>25 dB return loss, or 1 MQ in parallel
with approximately 30 pF.
Input Input Att*n”aflon
Impedance
50 0
1 MO
Input Damage Level lapproximate):
50 0: C30 dBm or 25 Vdc.
1 MR: + 16.9 dBVl7 Vrms) or 25 Vdc.
The 50 0 Input impedance automatically
switches to 1 MO at approximately
+ 20 dBm, and can be reset with the cleartrip function.
Input Connectors: 50 0 Type N female.
Resolution Bandwidth: Selectable 1 kHz,
100 Hz, 10 Hz, or 1 Hz.
SensitivitvfDue to noise and internal
0 dB
- 20 dell
-33 dEV
122.4 m”,
20 dB
0 dB”l
-13,dBV
1224 rn”i
Magnitude
Characteristics
L.O. Feedthrough: < -33 dB below
maximum input level.
AC Line and Fan Related Spurious
Signals: < - 100 dBm below 1 kHz input
frequency.
Electrical Length/Reference Plane
Extension: Provides equivalent electrical
line length, or delay at inputs A, B and R.
Range: -3x 10⁸ m to +3x 10⁸ m, or
+1sto-1s.
Resolution: 5 diaits or 0. I cm 13.3 DSI
whichever is gre&r.
Accuracy: 10. I cm or fO.OZ%
whichever is greater.
Range: Maximum Input Level to Sensitivity.
Resolution:
Marker: 0.001 dB (log); 5 digits WwarJ.
Display: 0.01 dBldiv to 20 di3ldiv flog
absolutel;
0.01 dt3ldiv to 200 dB/div llog ratioJ;
0.1 “Vldiv to 10 Vldiv (linear absolute);
70-‘0/div to 10ZOldiv flinear ratio).
Disolav Units: dB, dBm. dBV, V, and linear
ratib.
Accuracy fat 100 kHr, 25” 13. and Max-
imum Input Level):
Absolute (A.&A): 10.2 dB.
Ratio (A/R,B/R,A/BI: * 0.15 dB 150 III;
kO.2 dB (1 MO).
Accuracy and frequency r.?spo”~e errors,
and effects of different input attenuation
can be calibrated out with normalization.
Dynamic Accurscv:
Residual Responsss: > 100 dB below
maximum input level, except for crosstalk
error limits, L.O. feedthrough, and ac line
and fan related spurious signals.
Crosstalk Error Llmlts:
e.04 d9
* .OZ d9
t.10 dE
+.50dB
i.50 d6
+.C4dB, 0 d9 to -10 d9
k.02 d9 -IO dB to -60 d9
t.25 dB -60 dB to -80 d6
i.75 d0 -80 d9 lo -90 d9
f3.W dB -90 dB to -lW dB
_,~-,..-~- ,,.,.,. ~~~-~~~
Page 20
3577A
Network Analyzer
Specifications
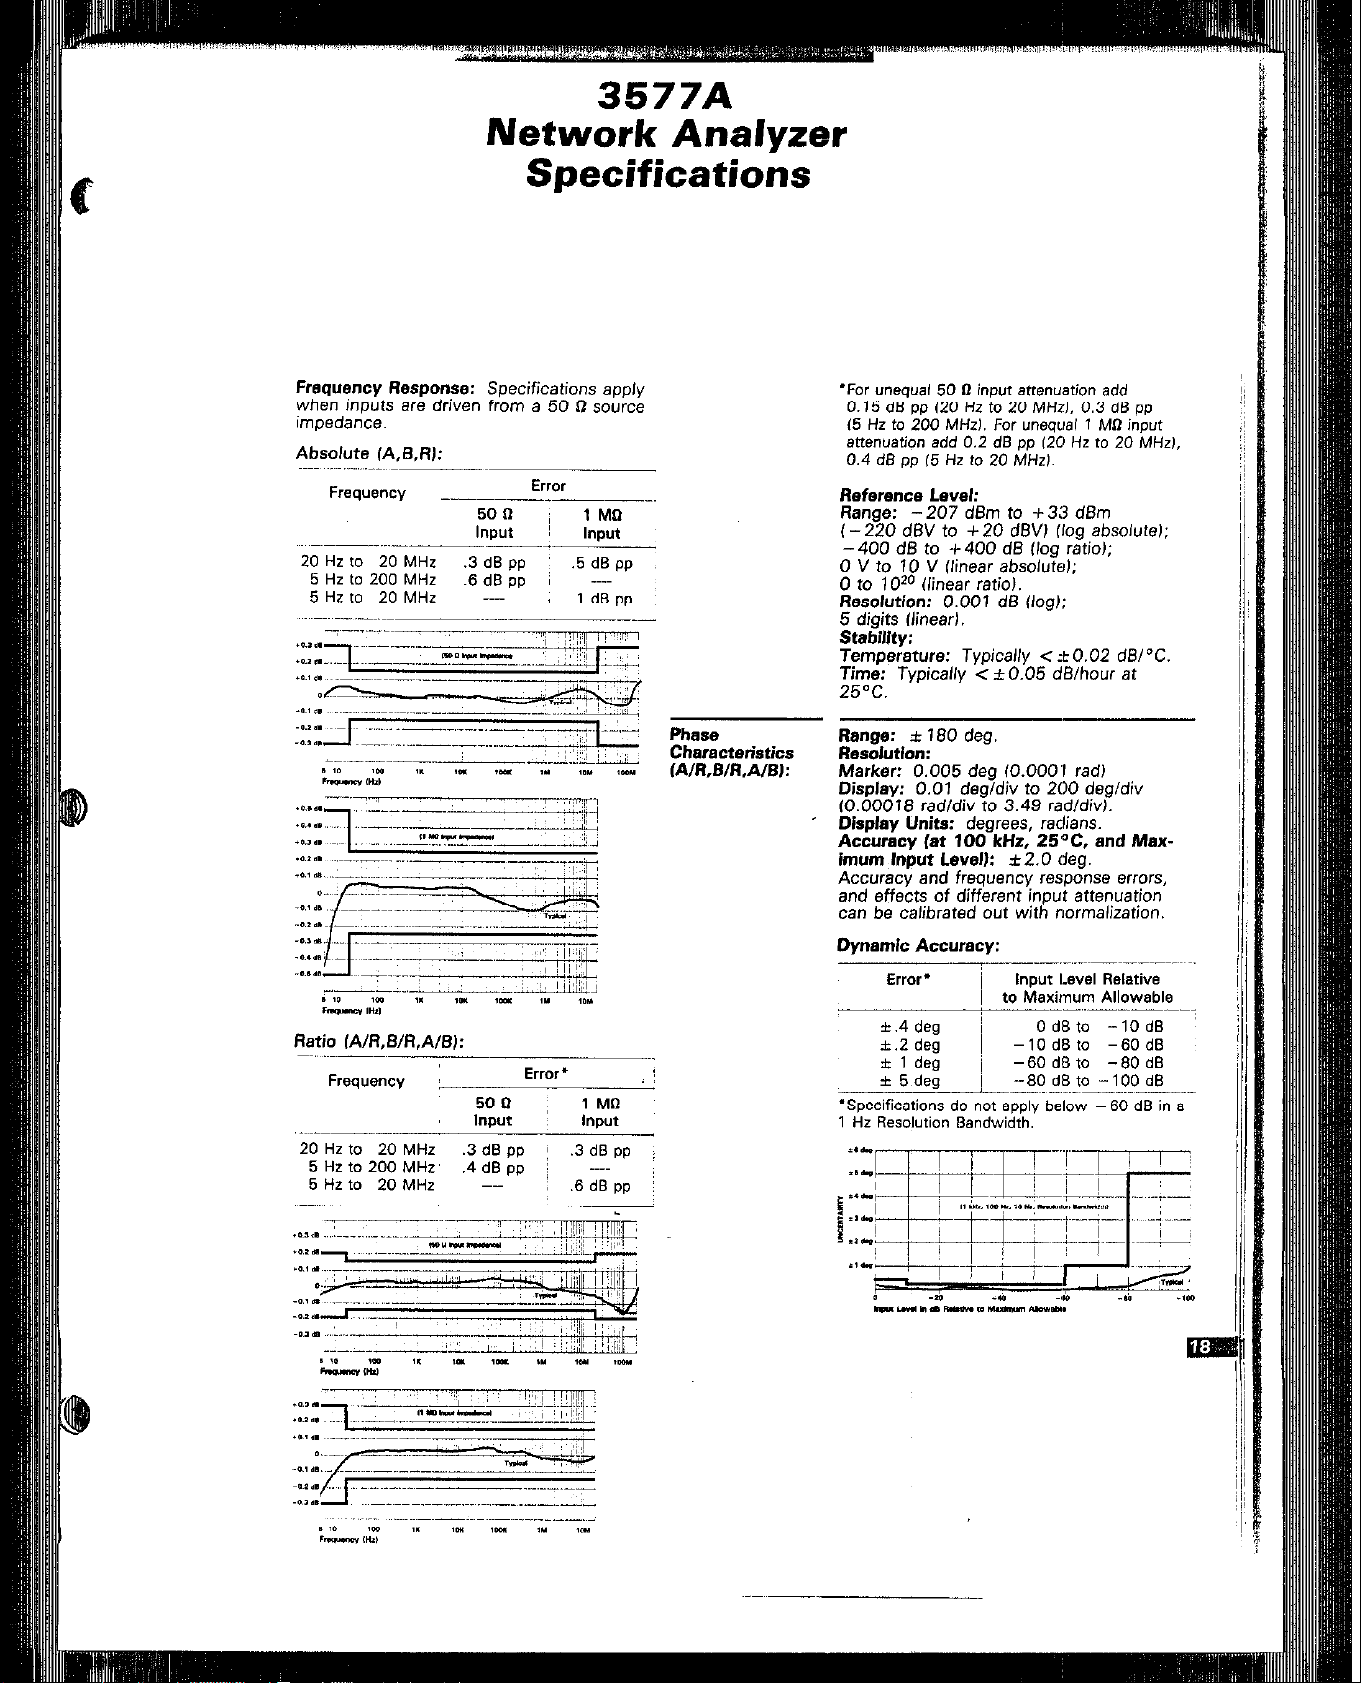
Frequency Response: Specifications apply
when inputs are driven from a 50 0 source
impedance.
Absolute IA,B.AI:
Phase
Characteristics
~A/R,B/R.A/EJ:
‘For unequal 50 U input attenuation add
0.15 dS PP (20 HZ to 20 MHz,, 0.3 dS pi
(5 Hz to 200 MHzI. For unequal 1 MU input
attenuation add 0.2 dB ,,P 120 Hz to 20 MHz,,
0.4 dB pp 15 Hz to 20 MHzl.
Reference Level:
Range: - 207 dBm to + 33 dBm
( - 220 dBV to + 20 dBVJ flog absoiutel;
- 400 dB to + 400 dB (log ratio);
0 V to 10 V llinear absolutul;
0 to lO*O llinear ratio).
Resolution: 0.001 dB (log);
5 digits Ilinearl.
Stability:
Temperature: Typically < zt0.02 dB/OC,
Time: Typically < kO.05 dB/hour at
25OC.
Range: f 780 deg.
R~SOlUttOll:
Marker: 0.005 deg fO.0001 radJ
Display: 0.01 deg/div to 200 dsgidiv
10.00018 radldiv to 3.49 radldivl.
Display Units: degrees, radians.
Accuracy fat 100 kHz, 25°C. and Maximum Input Levell: lt2.0 deg.
Accuracy and frequency response errors,
and effects of different input attenuation
can be calibrated out with normalization.
Dynamic Accuracy:
Error.
Ratio fA/A,B/A,A/BJ:
Frequency :--
20 HZ to 20 MHZ .SdB PP .3 dB PP
5 Hz10 200 MHz’ .4dB pp ---5 HZ to 7.0 MHZ
Error*
5ou 1 MU
InLlut ,n.ut
j
-
.6 dS p,,
*.4 deg ~ 0 dB to -10 dB
f.2 deg 1 -1OdBto -6OdB
!
iz 1 deg ~
-t 5 deg ,
‘Specifications do not apply below - 60 dB in a
1 Hz Resolution Bandwidth.
-60 dR to -SO dB
-8OdBto -lOOdS
Page 21

Network Analyzer
Specifications
:8
Frequency Response: Specifications apply
when inputs are driven from a 50 ll ecurce
imoedance.
Frewancv -,-~-~~---E”“r” ..___
50 n 1 Mll
Input Input
20 HZ to 20
HZ 200
5 HZ to 20
Crosstalk Specified under Input
Characteristics.
Reference Level:
Range: - 500 deg to + 500 deg
to + 8.7 radl
Resolution: 0.01 deg.
Stablllty:
Temperature: Typically < iO.05
Time: Twicelly < ~0.05 deg/hour
Range, Resolution, Display Units, Dynamic
Accuracy, Frequency Response, Uncertain-
ty, Crosstalk, Reference Level, and Stability
specifications are the same es the COT-
responding magnitude and phase
characteristics.
Full Scale Magnitude Range:
Absolute (A&W: 0.1 nV to 10 V.
Ratio ~A/R,B/R,A/BJ: lo-I0 to 1020.
MHz 2 deg PP 5 5 deg PP
MHz 10 deg
to
MHz --- lOd*gw
p,, . ..-
(-8.7 rad
i deg/OC.
et 25°C.
RealNmaghary
Characteristics
Delay
Characteristics
fUnear Frequency
Sweep; AIR. WA,
A/B; 50 0 input
lmpedancel
Range, Dynamic Accuracy, Frequency
Response, Uncertainty, Crosstalk, Stability
specifications ate the same es the
corresponding magnitude and phase
characteristics.
Resolution:
Marker: 5 digits.
Display: 0.1 nV/div to 10 Vldiv fc!
absolute; IO-‘c tc 10zO for ratio.
Display Units: V and lineer ratio.
ftefwmux Level:
Range: f 10 V for absolute;
* lO*O for ratio.
Resolution: 5 digits.
Range: Group delay is a computed
parameter, defined by the equat;o”
Minimum: The minimum delay time is
give” by the expression
1.4x 10-E
Aperture [Hz1
Maximum: The maximum delay is given by
the expression
where N = number of point:: per sweep
Effective Range: 1 ps tc 20,000 s.
N-l
2 x Span IHzJ ’
l51,101,201,401).
Rasclutian~
Marker: Same es minimum delay time or 5
digits, whichever is greater.
Display: 0.01 nsldiv to 1000 s/div.
Apertun: Selectable 0.5%, 7%. 2%. 4%.
8%. 16% of frequency span.
Display Units: s.
Accuracy:
.13 .s
lfreq IHzW
or
Dynamic Phase Accuray * 2 “s
380 x Aperture [HzJ
whichever is creeter.
.13s -
The
ffreq, IHzl)’
calibrated out with normalizetion.
Crosstalk: Determined by the expression
Phase Crosstalk
360 x Aperture [HzJ
Reference Level:
Range: f 1 O3 s.
Resolution: 5 digits.
stthluty:
Temperature: Determined by the expression
Phase Temperature Stability
360 x Aperture [Hz1 -’
Time: Determined by the expression
Phase Time Stability
360 x Aperture [Hz1
f2 ns
zt2 ns term can be
Page 22

DISPLAY CHARACTERISTICS
AnnotatIon: Start/stop, center/span or CW
frequency, source level, scaleldiv, reference
level, delay aperture, marker data. and soft
key functions.
Eratlculea: Rectangular logarithmic and
linear. polar, and Smith. All gratieoles ere
electronically generated.
Traces: Two simultaneous tracee may be
present with e rectangular grericule.
One trace with polar or Smith graticules.
Markers: Each trace has one main marker
and an offset marker. Markers indicate data
et corresponding trace coordinates in the
fame unite as used to set the Reference
Level. Markers can be used to modify oer-
tain display parameters. Marker resolution is
the same 8s horizontal display resolution.
Rsferancs Lb-m Position:
Rectangular Greticule: 0% to 100% full
scale deflection in 0.05% increments.
Polar/Smith Chart Graticule: + 500 deg in
0.001 deg increments.
Data
Storage: Measured data can be
stored in vector format in non-volatile
storage registers 01.02.03.04. Stored data
can be redisplaved later or operated on with
Vector Math.
Vector Math: Input Magnitude and Phase
Data. Stored Data. and User Defined Con-
stants and Functions can be
combined into expressions which define
displayed or stored data. Mathematical
operations are: add, subtract. multiply, and
divide.
Calibration:
Normalization: Both traces can be nor-
malized to measured data with full ec-
curacy. and resolution. Scale
factors can be changed after
normalization without affecting calibration.
NormelizelShortJ: Compensates for fre-
quency reSpO”Se errors.
Requires e short termination.
One Pa-t Pan Cal: compensates
for directivity errors and frequency response
errors. Requires open and load terminations.
One Port Full Cal: Compensates for direc-
tivitv, frasuencv response and source match
errors. Requires open, short, and load
terminations.
Noise Avsraglng:
Type: Exponentially weighted vector
averaging on Successive swap data.
Averaging Factor: Selectable 7 (off),
4.8.16.32.64.128.256.
The current trace A,, is always displayed
and updated et the sweep rate according to
the expression
A, = Sri/F + IF- 1)fAn _ ,jIF, where
S,, = current input signal, F= averaging fac-
tor, A,, - t = previously averaged trace.
3577A
Network Analyzer
Specifications
PROGRAMMING CHARACTERISTICS
mathematically
Averaging Factor is fixed at 1 in alternate
i.EtPhase Slope Compensation: Pro-
vides linear phase elope offset in deglspan.
Range: - 72,000 deg./span to
+ 72,000 deg./span I- 1256 red/span to
+ 1256 rad/spanJ.
Resolution: 5 digits or 0.001 deg
whichever is greater.
Accurecy: 0.02%.
Autoscale: Automatically adjusts the
reference level and scaleldiv. of the
displayed measurement.
Meeawed No. of Points per Sweep:
Logarithmic frequencv, 401;
linear frequencv, 51.101.201.401;
cw frequency. 1.
Measure No. of Steps p”r Swew:
Logarithmic Amplitude Sweep, 5.10.20,
50.100.200.400.
Display Resolurion: Horizontal and vetiicel.
Rectangular: 1600 points.
Polar: 1200 ooints.
CapabilIty: Remote progr’amming is via the
Hewlett-Packard Interface Bus IHP-IBI’ for
ell 3577A front panel control functions, ex-
cept the ec line switch, display intensity.
entry knob. HP-18 address and talk-only
on/off. The 35677AlB S-Parameter Test
Sets ~6% proQremmable through the 3577A
interface only.
,nterfacs Funcrlons: SH ‘I ,AH 1 ,TS,TE!&L4,
LE0,SR1.RL1.PP1,DC1,D~~l,C0,E1.
Output Data Transfer Time: 401 data
points (single parameter) can be transferred
direotly to an HP 200 series computer in
Basic language as follows:
ASCII Mode: Typically 1500 ms.
Binary Floating Point Mode: Typically
160 ms.
Graphics Capabilities:
Alphanumeric Characters?: 12 lines of text
with 40 CharacterS per line can be
displayed. Character Set includes
alphanumerics special characters and lin%
vectors.
Vector Display: Trecw line8 ten be Drawn
on the dieplay between any two points
with a resolution of 2048 points along the
horizontal and vertical axes;
‘HP-IB is Hewlett-Packard’s implementation
of IEEE Standard 488-I 078.
Page 23

GENERAL CI-IARACTERISTICS
External Reference Frequency Input:
Frequency: IO MHz/N fN is an
integer from 1 to 1001.
Lever: 0 dBm zt 10 dB. nominal.
Impedance: 50 Q, nominal.
Connector: RNC female. rear panel.
Reference Frequency Outrwt:
Frequency: 70 MHz.
Lavel: Typically 0 dBm.
Impedance: 50 Q, nominal.
Connector: BNC female, rear panel.
Extwnal Trigger: Triggers on negative TTL
transition or contact closure to ground.
Minimum Pulse Width: Tvpicallv 1 +?.
Impedance: 50 0, nominal.
Co”“ector: BNC female. rear panel.
Plotter Control: Directly compatible with
HP-18 graphics plotters that use HewlettPackard Graphics Language (HP-GLJ with
listen only capsbility. Plotter may be
controlled by the 3577A through the HP-IS
connector without a” external computer.
Plotted data includes trace 1, trace 2.
graticole, ate annotation. Additional
markers can be plotted, and pen numbers,
pen speed. and line type can also be
selected.
0iaplsy Adjustments: Astigmatism. x-axis
position, y-axis position, alignment. focus.
and intensity.
Save/Recal: Front panel setups can be
slored in non-volatile memory locations I
through 5. Last state is saved when power
is removed.
Operating Conditions:
Tempertim: 04C to + 55Y.
Relative tiumidii: 495% at 4YC.
Altitude: <4,572 m !lS,CCO ft,.
Nan-O- Condmmm
Tamperawe: -40°C to ; 75’~
pa* 1%; 150,ooO ftl.
3577A
Network Analyzer
Specifications
3577A Network Analyw
Option 907 Front Handle Kit
Option 908 Rack Mount Kit
Option 909 Rack Mount and Front
Handle Kit
option 910 Exrra Operatitlg & Service
Msnuals
921 l-2663 Transit Case
03577-84401 Service Acceseow Kir
4ea. Type N male to BNC female
IHP Pan No. 12X-0780.)
1 ea. Operating Manual. (HP Part No.
03577-90000).
1 88. Service Manual. IHP Part No.
3577-ScfIlO).
Power: 175V + 1045, -:259/o 147 Hz to
. _ _ _
44cL Hzl, Or 230 V + 10%. - 15% (47 Hz to
66 Hzl, 450 VA maximum.
578 mm D (8.75 in x 76.75 in x 22.75 ;“J.
Add 1 l/B inch to depth to include front panel
Controls and co”“8ctom.
Adapter.
Page 24

35677AlB
S-Parameter Test
Set Specifications
All specifications apply without bias signals. Degrees
are specified as deviation from linear phase. Frequency Response, Port Match, and Test Port
Reciprocity specifications are equivalent values for
ratio measurements. and errors can be calibrated out,
35677A
Block Diagram
Frequency Range: 100 kHz to
200 MHz.
Test Port Impedance:
35677A: 50 0.
356776: 75 n.
Dlrectivitv: ~40 dB.
Frequency Response:
Transmission(S ,,S,J: i- 1 d6, et5 deg.
ReflectionlS,,,$,): f 1 dS, 15 deg.
Port Match:
Test Ports 1,2: 35677A. > 26 dB;
356776, 224 dB.
Test Ports 1,2 open/short ratio:
35677A. < 10.75 d6 magnitude and
< + 5 deg phase;
356778, < * 1 dB magnitude and
< f 7.5 deg phase.
Input Port: >20 dB return loss.
Output Ports A, B, and A: >26 dB
Test Port Isolation: > 100 dB
l”sertlo” Loss:
RF Input to Test Port 1 or 2: 35677A.
typically 13 dB; 356778, typically 19 dB.
RF Input to Output Ports A, 6, or R:
35677A. typically 19 d9: 356778,
typically 31 d6.
Test Port Reciprocity:
Transmission fS,,, S,,I: typically
< 20.5 dB magnltuda and < 15 deg
phase.
Reflection (S,,, S J: typically < *to.5
dB magnitude and < + 5 deg phase.
Incident Power Ratio (Test Port 1 to
Test Port 2): typically ci 1.5 d6.
RF Input Maximum Operating Level:
+ 25 dBm or * 30 Vdc.
356776
Block Diagram
RF Inout Damaae Level: + 27 dBm or
+3O’Vdc. -
Port 1 or 2 Damage Level: +27 dBm
or 130 Vdc.
Co”“ectors:
Input Port and Output Ports A, B, and
R: 50 # Type N female.
Test Ports 1 and 2: 35677A, 50 !I
Type N female; 356776, 7Zi tl Type N
female.
DC Bias Inputs: SNC female, rear panel.
DC Bias Range: Typically :t 30 Vdc and
*20 mA with some degradation of RF
specifications; 200 mA damage level.
Accessories Included:
4 ea. 190 mmf7.5 in.1 50 II cables with
Type N male connectors for connection
to 3577A (HP Part No. 8120.43871.
1 ea. Test Set interconnect cable to
3577A (HP Part No. 35677-61620)
1 ea. Rear Panel Lock Foot Kit IHP Part
No. 5061-0099).
1 ea. Service Manual IHP Part No.
35677-900101. *
Recommended Accessories;:
35677A: 3567BA 50 0 Type N Calibra-
tion Kit; 35679A 50 0 Type N Test Port
Extension Cables.
356778: 356788 75 II Type N Calibration Kit; 356798 75 0 Type N Test Port
Extension Cables.
Programming: The 35677A/B are
completely controlled through the 3577A
using the 3577A interconnect cable. All
programming is accomplished through
the 3577A HP-IB interface.
Power: All power is obtained through
the 3577A interconnect cable.
Weight: 6 kgf13 Ibsl “et; 12 kg
(12 Ibsj shipping.
Dimensions: 90 mm H x 426 mm W
x 564 mm D 13.5 in x 16.76 in x
22.75 in).
Add 1 l/8 inch to depth to include front
panel connectors.
Ordering Information
35677A S-Parameter Test Set 150 0)
356776 S-Parameter Test Set (75 01
Option 907 Front Handle Kit
Option 908 Rack Mount Kit
Option 909 Rack Mount and Front
Handle Kit
Option 910 Extra Service Marx&
92 1 l-2660 Transit Case
* Note operation information included in
3577A Operation Manual. IHP Pan No.
03577-900001.
Page 25

selection Guide
DESCRIPTION
NETWORK ANALYZER
S-PARAMETER TEST SET 4 .
TYPE N CALIBRATION KIT
TYPE N TEST PORT
EXTENSION CABLES
POWER SPLITTERS
TYPE N MINIMUM LOSS PA0
TYPE N ACCESSORY KIT 1
BNC ACCESSORY KIT w
TRANSISTOR FIXTURES
TO-18/l-O-72 TRANSISTOR FIXTURE - .I*:
TO.5/TO-12 TRANSISTOR FIXTURE
TRANSISTOR FIXTURE ADAPTER e
wg
PROBES
CURRENT PROBE E I:
500 MHz ACTIVE
1: 1 MINIATURE PROBE
10: 1 MINIATURE PROBE
PROBE
50 D IMPEDANCE
TRANSMISSION SPARAMFTERS TRANSMISSION fPARAMErERS TRANSFER FUNCTlONS
: *
: <. : ,.
: I : *
: :.’
75 D IIUPEDANC~
: *
: .I : . . i.. 1
HIGH IMPEDANCE
11) 2 ea. recommended.
121 3
88 recommended.
I31 4 ea recommended.
141 Rewires 2ea
11525A Apt.7 to Tyrre N male adapters for use with the 35677A.
 Loading...