

Page 1

User’s Guide
Publication Number 01670-97004
First Edition, August 1996
For Safety Information, Warranties, and Regulatory Information, see the
pages at the end of this manual.
Copyright Hewlett-Packard Company 1991 - 1996
All Rights Reserved.
HP 1670D-Series
Logic Analyzers
Page 2

HP 1670D-Series Logic Analyzers
The HP 1670D-series logic analyzers are 100-MHz state/250-MHz
timing logic analyzers.
Features
• 132 data channels and 4 clock/data channels in the HP 1670D
• 98 data channels and 4 clock/data channels in the HP 1671D
• 64 data channels and 4 clock/data channels in the HP 1672D
• 3.5-inch flexible disk drive
• 540-MB hard disk drive
• HP-IB, RS-232-C, parallel printer, and LAN interfaces
• BNC and UTP LAN ports
• Variable setup/hold time
• 64 K memory on all channels, 128 K in half-channel mode
• Marker measurements
• 12 levels of trigger sequencing for state and 10 levels of trigger
sequencing for timing
• 125-MHz time tagging and state tagging
• Full programmability
• DIN mouse
• DIN keyboard support
Options
• Programmer’s Guide
• Service Guide
• 1M memory on all channels, 2M in half-channel mode
ii
Page 3

In This Book
This User’s Guide shows you how to
use the HP 1670D-series logic
analyzers. It contains measurement
examples, field and feature
definitions, and a basic service guide.
Refer to this manual for information
on what the menu fields do and how
they are used. This manual covers all
HP 1670D-series analyzers.
The User’s Guide is divided into four
parts. The first part, chapters 1
through 4, covers general product
information you need to use the logic
analyzer. The second part, chapters
5 and 6, contains detailed examples
to help you use your analyzer in
performing complex measurements.
The third part, chapters 7 through 9,
contains reference information on the
hardware and software, including the
analyzer menus and how they are
used. There are sections for each
analyzer menu and a separate
chapter on System Performance
Analysis. The fourth part, chapters 10
through 12, provides a basic service
guide.
1
2
3
4
5
6
7
8
9
10
11
12
Logic Analyzer Overview
Connecting Peripherals
Using the Analyzer
Using the Trigger Menu
Triggering Examples
File Management
Reference
System Performance Analysis
(SPA) Soft ware
Concepts
Troubleshooting
Specifications
Operator’s Service
Glossary
Index
iii
Page 4

iv
Page 5

Contents
1 Logic Analyzer Overview
To make a measurement 1–4
2 Connecting Peripherals
To connect a mouse 2–3
To connect a keyboard 2–4
To connect to an HP-IB printer 2–5
To connect to an RS-232-C printer 2–7
To connect to a parallel printer 2–8
To connect to a controller by HP-IB or RS-232-C 2–9
To connect to a controller by LAN 2–10
3 Using the Analyzer
Accessing the Menus 3–3
To access the System menus 3–4
To access the Analyzer menus 3–6
Using the Analyzer Menus 3–8
To label channel groups 3–8
To create a symbol 3–10
To examine an analyzer waveform 3–12
To examine an analyzer listing 3–14
To compare two listings 3–16
The Inverse Assembler 3–18
To use an inverse assembler 3–18
4 Using the Trigger Menu
Specifying a Basic Trigger 4–3
To assign terms to an analyzer 4–4
To define a term 4–5
To change the trigger specification 4–6
v
Page 6

Contents
Changing the Trigger Sequence 4–7
To add sequence levels 4–8
To change macros 4–9
Setting Up Time Correlation between Analyzers 4–10
To set up time correlation between two state analyzers 4–11
To set up time correlation between a timing and a state analyzer 4–11
Arming and Additional Instruments 4–12
To arm another instrument 4–12
To receive an arm signal from another instrument 4–13
Managing Memory 4–14
To selectively store branch conditions (State only) 4–15
To set the memory length 4–16
To place the trigger in memory 4–17
To set the sampling rates (Timing only) 4–18
5 Triggering Examples
Single-Machine Trigger Examples 5–3
To store and time the execution of a subroutine 5–4
To trigger on the nth iteration of a loop 5–6
To trigger on the nth recursive call of a recursive function 5–8
To trigger on entry to a function 5–10
To capture a write of known bad data to a particular variable 5–11
To trigger on a loop that occasionally runs too long 5–12
To verify correct return from a function call 5–13
To trigger after all status bus lines finish transitioning 5–14
To find the nth assertion of a chip select line 5–15
To verify that the chip select line is strobed after the address is stable 5–16
To trigger when expected data does not appear when requested 5–17
To test minimum and maximum pulse limits 5–18
To detect a handshake violation 5–20
To detect bus contention 5–21
vi
Page 7

Cross-Arming Trigger Examples 5–22
To examine software execution when a timing violation occurs 5–23
To look at control and status signals during execution of a routine 5–24
To trigger timing analysis of a count-down on a set of data lines 5–25
To monitor two coprocessors in a target system 5–26
Special Displays 5–27
To interleave trace lists 5–28
To view trace lists and waveforms on the same display 5–30
6 File Management
Transferring Files Using the Flexible Disk Drive 6–3
To save a configuration 6–4
To load a configuration 6–6
To save a listing in ASCII format to a flexible disk 6–7
To save a screen’s image 6–8
To load additional software 6–9
Contents
Transferring Files Using the LAN 6–10
To transfer files using NFS 6–11
To transfer files using ftp 6–12
7 Reference
Configuration Capabilities 7–3
Probing 7–5
General-purpose probing system description 7–8
Assembling the probing system 7–11
Keyboard Shortcuts 7–15
Moving the cursor 7–15
Entering data into a field 7–16
vii
Page 8

Contents
Using the keyboard overlays 7–16
Common Menu Fields 7–17
Print field 7–17
Run/Stop field 7–19
Roll fields 7–20
Disk Drive Operations 7–21
Disk operations 7–21
Autoload 7–23
Format 7–23
Load and Store 7–24
Pack Disk 7–24
The RS-232-C, HP-IB, Centronics, and LAN Interfaces 7–25
The HP-IB interface 7–26
The RS-232-C interface 7–26
The Centronics interface 7–27
The Ethernet LAN interface 7–28
System Utilities 7–30
Real Time Clock Adjustments field 7–30
Update FLASH ROM field 7–30
Shade adjustments 7–31
The Configuration Menu 7–32
Type field 7–32
Illegal configuration 7–32
The Format Menu 7–33
Pod threshold field 7–33
Acquisition modes 7–33
Data on Clocks display 7–34
Pod clock field (State only) 7–34
viii
Page 9

Master and Slave Clock fields (State only) 7–37
Symbols field 7–40
Label fields 7–41
Label polarity fields 7–42
The Trigger Menu 7–43
Trigger sequence levels 7–43
Modify trigger field 7–43
Timing trigger macro library 7–44
State trigger macro library 7–46
Modifying the user macro 7–48
Resource terms 7–51
Arming Control field 7–54
Acquisition Control field 7–56
Count field (State only) 7–57
Contents
The Listing Menu 7–58
Markers 7–58
The Waveform Menu 7–60
/Div field 7–60
Accumulate field 7–60
Delay field 7–61
Waveform display 7–61
Waveform label field 7–62
The Mixed Display Menu 7–63
Interleaving state listings 7–63
Markers 7–64
Time-correlated displays 7–64
The Chart Menu 7–65
Axis Control field 7–66
Markers field (label vs state only) 7–67
Rescale field 7–68
ix
Page 10

Contents
The Compare Menu 7–69
Reference/Difference listing field 7–70
Copy Listing to Reference field 7–71
Find Error field 7–71
Compare Full/Compare Partial field 7–71
Mask field 7–72
Bit Editing field 7–72
8 System Performance Analysis (SPA) Software
System Performance Analysis Software 8–2
What is System Performance Analysis? 8–4
Getting Started 8–6
SPA Measurement Processes 8–8
Using State Overview, State Histogram, and Time Interval 8–21
Using SPA with Other Features 8–30
9 Concepts
The File System 9–3
Standard files 9–4
Hardware–Directory mapping 9–5
User-Generated file types 9–7
Dynamic files 9–9
The Trigger Sequence 9–10
Trigger sequence specification 9–11
Analyzer resources 9–13
Timing analyzer 9–16
State analyzer 9–16
Configuration Translation Between HP Logic Analyzers 9–17
The Analyzer Hardware 9–19
HP 1670D-series analyzer theory 9–20
x
Page 11

Logic acquisition board theory 9–23
Self-tests description 9–26
10 Troubleshooting
Analyzer Problems 10–3
Intermittent data errors 10–3
Unwanted triggers 10–3
No activity on activity indicators 10–4
Capacitive loading 10–4
No trace list display 10–4
Preprocessor Problems 10–5
Target system will not boot up 10–5
Slow clock 10–6
Erratic trace measurements 10–7
Contents
Inverse Assembler Problems 10–8
No inverse assembly or incorrect inverse assembly 10–8
Inverse assembler will not load or run 10–9
Error Messages 10–10
". . . Inverse Assembler Not Found" 10–10
"No Configuration File Loaded" 10–10
"Selected File is Incompatible" 10–10
"Slow or Missing Clock" 10–11
"Waiting for Trigger" 10–11
"Must have at least 1 edge specified" 10–11
"Time correlation of data is not possible" 10–12
"Maximum of 32 channels per label" 10–12
"Xmin is greater than or equal to Xmax" 10–12
"Ymin is greater than or equal to Ymax" 10–12
"Timer is off in sequence level n where it is used" 10–13
"Timer is specified in sequence, but never started" 10–13
"Inverse assembler not loaded - bad object code." 10–13
xi
Page 12

Contents
"Measurement Initialization Error" 10–14
"Warning: Run HALTED due to variable change" 10–14
11 Specifications
Accessories 11–2
Specifications 11–3
Characteristics 11–3
Supplemental characteristics 11–4
12 Operator’s Service
Preparing For Use 12–3
To inspect the logic analyzer 12–4
To apply power 12–4
To set the line voltage 12–5
To degauss the display 12–6
To clean the logic analyzer 12–6
To test the logic analyzer 12–6
Troubleshooting 12–7
To use the flowcharts 12–8
To check the power-up self-tests 12–10
To run the self-tests 12–11
To test the auxiliary power 12–18
xii
Page 13

1
Logic Analyzer Overview
Page 14

Front Panel
HP 1670D-Series Logic Analyzer
Select Key
The Select key action depends on the type of field currently highlighted. If
the field is an option field, the Select key brings up an option menu or, if
there are only two possible values, toggles the value in the field. If the
highlighted field performs a function, the Select key starts the function.
Done Key
The Done key saves assignments and closes pop-up menus. In some fields, its
action is the same as the Select key.
Shift Key
The shift key, which is blue, provides lowercase letters and access to the
functions in blue on some of the keys. You do not need to hold the shift key
down while pressing the other key — just press the shift key first, and then
the function key.
Knob
The knob can be used in some fields to change values. These fields are
indicated by a side view of the knob placed on top of the field when it is
selected. The knob also scrolls the display and moves the cursor within lists.
If you are using a mouse while dragging, you can do the same actions by
holding down the right button.
1-2
Page 15

Rear Panel
Logic Analyzer Overview
Line Power Module
Permits selection of 110-120 or 220-240 Vac and contains the fuses for each
of these voltage ranges.
External Trigger BNCs
The External Trigger BNCs provide the
"Port InPort In" and and "Port OutPort Out" connections connections
for the Arm In and Arm Out of the Trigger Arming Control menu.for the Arm In and Arm Out of the Trigger Arming Control menu.
RS-232-C Connector
Standard DB-25 type connector for connecting an RS-232-C printer or
controller.
HP-IB Connector
Standard HP-IB connector for connecting an HP-IB printer or controller.
Parallel Printer Connector
Standard Centronics connector for connecting a parallel printer.
LAN Connectors
Connects the logic analyzer to your local Ethernet network. The BNC
connector on top accepts 10Base2 ("thinlan"). The UTP connector below the
BNC connector accepts 10Base-T ("ethertwist").
1-3
Page 16

Logic Analyzer Overview
To make a measurement
To make a measurement
For more detail on any of the following information, see the referenced
chapters. If you are using a preprocessor with the logic analyzer, some of
these steps may not apply.
Map to target
Connect probes Connect probes from the target system to the logic
analyzer to physically map the target system to the channels in the logic
analyzer. Attach probes to a pod in a way that keeps logically-related
channels together. Remember to ground each pod.
See Also "Probing" in Chapter 7 for more detail on constructing probes.
Set type* When the logic analyzer is turned on, Analyzer 1 is named
Machine 1 and is configured as a timing analyzer, and Analyzer 2 is off.
To use state analysis, state compare, or software profiling, you must set
the type of the analyzer in the Analyzer Configuration menu. You can
only use one timing analyzer at a time.
Assign pods* In the Analyzer Configuration menu, assign the
connected pods to the analyzer you want to use. The number of pods on
your logic analyzer depends on the analyzer model. Pods are paired and
are always assigned as a pair to a particular analyzer.
* If you load a configuration file, this step is not necessary.
1-4
Page 17

Logic Analyzer Overview
To make a meas urement
Set up analyzers*
Set modes and clocks Set the state and timing analyzers using the
Analyzer Format menu. In general, the timing modes trade channel
count for speed. The state analyzer provides for complicated clocking. If
your state clock is set incorrectly, the data gathered by the logic analyzer
might indicate an error where none exists.
See Also "The Format Menu" in Chapter 7 for more information on modes and clocks.
Group bits under labels The Analyzer Format menu indicates active
pod bits. You can create groups of bits across pods or subgroups within
pods, and name the groups or subgroups using labels.
* If you load a configuration file, this step is not necessary.
1-5
Page 18

Logic Analyzer Overview
To make a measurement
Set up trigger*
Define terms In the Analyzer Trigger menu, define trigger variables
called terms to match specific conditions in your target system. Terms
can match patterns, ranges, or edges acrossds multiple labels.
Configure Arming Control Use Arming Control if
you want to correlate the triggers and data of both analyzers
•
you want to use the logic analyzer to trigger an external instrument, or
•
you want to use an external instrument to trigger the logic analyzer.
•
Set up trigger sequence Create a sequence of steps that control when
the logic analyzer starts and stops storing data, and filters which data it
will store. For common tasks, you can use a trigger macro to simplify the
process, or use the user-defined macros to loop and jump in sequence.
See Also Chapter 4, "Using the Trigger Menu" and Chapter 5, "Triggering Examples"
for more information on setting up a trigger.
"The Trigger Sequence" in Chapter 9 for more information about the trigger
sequence mechanism.
"To save a configuration" and "To load a configuration" in Chapter 6 for
instructions on saving and loading the setup so you don’t have to repeat
setting up the analyzer and trigger.
* If you load a configuration file, this step is not necessary.
1-6
Page 19

Logic Analyzer Overview
To make a meas urement
Run measurement
Select single or repetitive From any Analyzer menu, select the field
labeled Run in the upper right corner to start measuring, or press the
Run key. A single run will run once, until memory is full; a repetitive run
will continue until you select Stop or until a stop measurement condition
that you set in the markers menu is fulfilled.
If nothing happens, see Troubleshooting. When you start a run,
your analyzer menu changes to one of the display menus or a status
message pops up. If nothing happens, press the Stop key. If the analyzer
still does not display any measurements, see Chapter 10,
"Troubleshooting." If memory length is large it will take a noticeable
amount of time to fill, and data is not displayed during acquisition.
Gather data You can gather statistics automatically by going to the
Waveform, Listing, or Chart menu, turning on markers, and setting
patterns for the X and O markers. You can set the analyzer to stop if
certain conditions are exceeded, or just use the markers to count valid
runs.
See Also "Markers" in Chapter 7 for more information on markers and stop
measurement conditions.
1-7
Page 20

Logic Analyzer Overview
To make a measurement
View data
Search for patterns In the Waveform, Listing, and Chart menus, you
can use symbols and markers to search for patterns in your data. In these
menus, toggle the Markers field to turn the pattern markers on, then
specify the pattern. When switching views, markers keep their settings.
Correlate data You can correlate data by setting Count Time in your
state analyzer’s Trigger menu, and then using interleaving and mixed
display. Interleaving correlates the listings of two state analyzers. Mixed
display correlates a timing analyzer waveform and a state analyzer listing.
You can also correlate data by setting the analyzer type to State
Compare, acquiring the data, then using the Compare menu to do a
bit-by-bit comparison between the acquired state data and a reference
listing.
The System Performance Analysis (SPA) Software does not save a
record of actual activity, so it cannot be correlated with timing or state
mode.
Make measurements The markers can count occurrences of events,
measure durations, and collect statistics. The SPA provides high-level
summaries to help you identify bottlenecks. To use the markers, select
the appropriate marker type in the display menu and specify the data
patterns for the marker. To use SPA, go to the SPA menu, select the
most appropriate mode, fill in the parameters, and press Run.
See Also Chapter 8, "System Performance Analysis (SPA) Software" for more
information on using SPA.
"The Waveform Menu", "The Compare Menu", "The Listing Menu", and "The
Chart Menu" in Chapter 7 for additional information on the menu features.
1-8
Page 21

2
Connecting Peripherals
Page 22

Connecting Peripherals
Your HP 1670D-series logic analyzer comes with a PS2 mouse. It also
provides connectors for a LAN, keyboard, Centronics (parallel)
printer, HP-IB, and RS-232-C devices. This chapter tells you how to
connect peripheral equipment, such as the mouse or a printer, to the
logic analyzer.
Mouse and Keyboard
You can use either the supplied mouse and optional keyboard, or
another PS2 mouse and keyboard with standard DIN connector. The
DIN connector is the type commonly used by personal computer
accessories.
Printers
The logic analyzer communicates directly with HP PCL printers
supporting the Printer Control Language or with other printers
supporting the Epson standard command set. Many non-Epson
printers have an Epson-emulation mode. HP PCL printers include the
following:
• HP ThinkJet
• HP LaserJet
• HP PaintJet
• HP DeskJet
• HP QuietJet
You can connect your printer to the logic analyzer using HP-IB,
RS-232-C, or the parallel printer port. The logic analyzer can only
print to printers directly connected to it. It cannot print to a
networked printer on the LAN.
2-2
Page 23

Connecting Peripherals
To connect a mouse
To connect a mouse
Hewlett-Packard supplies a mouse with the logic analyzer. If you prefer a
different style of mouse you can use any PS2 mouse with a standard PS2 DIN
interface.
Plug the mouse into the mouse connector on the back panel. Make
1
sure the plug shows the arrow on top.
2 To verify the connection, check the System External I/O menu for a
mouse box.
The mouse box is on the right side above the Settings fields. If the logic
analyzer was displaying the System External I/O menu when you plugged in
the mouse, the menu won’t update until you exit and then return to it.
The mouse pointer looks like a plus sign (
pointer over it and press the left button. To duplicate the front-panel knob,
hold down the right button while moving the mouse. Moving the mouse up or
to the right duplicates turning the knob clockwise. Moving the mouse down
or to the left duplicates turning the knob counterclockwise.
+). To select a field, move the
System External I/O Menu Showing Mouse Installed
Mouse pointer
Mouse box
2-3
Page 24

Connecting Peripherals
To connect a keyboard
To connect a keyboard
You can use either the HP-recommended keyboard, HP E2427B, or any other
keyboard with a standard DIN connector.
Plug the keyboard into the keyboard connector on the back panel.
1
2 To verify the connection, check the System External I/O menu for a
keyboard box.
The keyboard box is on the right side, below the X Window field. If the logic
analyzer was displaying the System External I/O menu while you plugged the
keyboard in, the menu won’t update until you exit and then return to it.
The keyboard cursor is the location on the screen highlighted in inverse
video. To move the cursor, use the arrow keys. Pressing Enter selects the
highlighted field. The primary keyboard keys act like the analyzer’s
front-panel data entry keys.
System External I/O Menu Showing Keyboard Installed
See Also "Keyboard ShortcutsKeyboard Shortcuts" in Chapter 7 for complete key mappings. in Chapter 7 for complete key mappings.
2-4
Keyboard box
Page 25

Connecting Peripherals
To connect to an HP-IB printer
To connect to an HP-IB printer
Printers connected to the logic analyzer over HP-IB must support HP-IB and
Listen Always. When controlling a printer, the analyzer’s HP-IB port does not
respond to service requests (SRQ), so the SRQ enable setting does not have
any effect on printer operation.
Turn off the analyzer and the printer, and connect an HP-IB cable
1
from the printer to the HP-IB connector on the analyzer rear panel.
2 Turn on the analyzer and printer.
3 Make sure the printer is set to Listen Always or Listen Only.
For example, the figure below shows the HP-IB configuration switches for an
HP-IB ThinkJet printer. For the Listen AlwaysListen Always mode, move the second
switch from the left to the 1 position. Because the instrument doesn’t
respond to SRQ EN (Service Request Enable), the position of the first switch
doesn’t matter.
Listen Always Switch Setting
2-5
Page 26

Connecting Peripherals
To connect to an HP-IB printer
4 Go to the System External I/O menu and configure the analyzer’s
printer settings.
a If the analyzer is not already set to HP-IB, select the field under
Connected To: in the Printer box and choose HP-IB from the menu.
b Select the Printer Settings field.
c In the top field of the pop-up menu, select the type of printer you are
using. If you are using an Epson graphics printer or an
Epson-compatible printer, select Alternate.
d If the default print width and page length are not what you want,
select the fields to toggle them.
If you select 132 characters per line when using a printer other than
QuietJet, the listings are printed in a compressed mode. QuietJet
printers can print 132 characters per line without using compressed
mode, but require wider paper.
e Press done.
Printer Settings Menu
2-6
Page 27

Connecting Peripherals
To connect to an RS-232-C prin ter
To connect to an RS-232-C printer
1 Turn off the analyzer and the printer, and connect a null-modem
RS-232-C cable, such as HP 13242G, from the printer to the RS-232-C
connector on the analyzer rear panel.
2 Before turning on the printer, locate the mode configuration switches
on the printer and set them as follows:
For the HP QuietJet series printers, there are two banks of mode function
•
switches inside the front cover. Set all the switches down to the 0 position.
For the HP ThinkJet printer, the mode switches are on the rear panel of
•
the printer. Push all the switches down to the 0 position.
For the HP LaserJet printer, the factory default switch settings will work.
•
3 Turn on the analyzer and printer.
4 Go to the System External I/O menu and configure the analyzer’s
printer settings.
a If the analyzer is not already set to RS-232-C, select the field under
Connected To: in the Printer box and choose RS-232C from the menu.
b Select the Printer Settings field.
c In the top field of the pop-up menu, select the type of printer you are
using. If you are using an Epson graphics printer or an
Epson-compatible printer, select Alternate.
d If the default print width and page length are not what you want,
select the fields to toggle them.
If you select 132 characters per line when using a printer other than a
QuietJet, the listings are printed in a compressed mode. QuietJet
printers can print 132 characters per line without using compressed
mode, but require wider paper.
e Press Done.
5 Select the RS232 Settings field and check that the current settings are
compatible with your printer.
See Also "The RS-232-C InterfaceThe RS-232-C Interface" in Chapter 7 for more information on RS-232-C in Chapter 7 for more information on RS-232-C
settings.settings.
2-7
Page 28

Connecting Peripherals
To connect t o a parallel printer
To connect to a parallel printer
1 Turn off the analyzer and the printer, and connect a parallel printer
cable from the printer to the parallel printer connector on the
analyzer rear panel.
2 Before turning on the printer, configure the printer for parallel
operation.
The printer’s documentation will tell you what switches or menus need to be
configured.
Turn on the analyzer and printer.
3
4 Go to the System External I/O menu and configure the analyzer’s
printer settings.
a If the analyzer is not already set to Parallel, select the field under
Connected To: in the Printer box and choose Parallel from the menu.
b Select the Printer Settings field.
c In the top field of the pop-up menu, select the type of printer you are
using. If you are using an Epson graphics printer or an
Epson-compatible printer, select Alternate.
d If the default print width and page length are not what you want,
select the fields to toggle them.
If you select 132 characters per line when using a printer other than a
QuietJet, the listings are printed in a compressed mode. QuietJet
printers can print 132 characters per line without using compressed
mode, but require wider paper.
e Press Done.
There are no settings specific to the parallel printer connector.
2-8
Page 29

Connecting Peripherals
To connect to a controller by HP-IB or RS-232-C
To connect to a controller by HP-IB or RS-232-C
You can control the HP 1670D-series logic analyzer with another instrument,
such as a computer running a program with embedded analyzer commands.
The steps below outline the general procedure for connecting to a controller
using HP-IB or RS-232-C.
Turn off both instruments, and connect the cable.
1
If you are using RS-232-C, the cable must be a null-modem cable. If you do
not have a null-modem cable, you can purchase an adapter at any electronics
supply store.
Turn on the logic analyzer, then the controller.
2
3 In the System External I/O menu, select the field under Connected
To: in the Controller box and set it appropriately.
The figure below is for HP-IB.
4 Select the appropriate Settings field and configure the values in the
pop-up menu to be compatible with the controller.
See Also HP 1670D-Series Logic Analyzers Programmer’s Guide for more
information on connecting and using controllers with RS-232-C and HP-IB.
Controller box
2-9
Page 30

Connecting Peripherals
To connect to a controller by LAN
To connect to a controller by LAN
You can control the HP 1670D-series logic analyzer using LAN. These
instructions are only a general guide for controlling a logic analyzer already
on the LAN.
Each type of LAN is slightly different. For information on connecting the
logic analyzer to your specific LAN, see the LAN User’s Guide.
In the System External I/O menu, check that the LAN settings are
1
correct and set Controller Connected To: to Ethernet.
2 Start up your preferred means of communication.
X Window: After enabling client-initiated windows, select Connect in the
•
X-Window box.
NFS: Contact your network administrator.
•
Telnet or ftp: Initiate a session from the controlling computer. If you are
•
using telnet, be sure to specify port 5025. If you are using ftp, log in as
control.
Control the logic analyzer as appropriate to your connection type.
3
X Window: Use the mouse and keyboard with X Window display to control
•
the logic analyzer as though from the front panel.
Telnet: Type analyzer programming commands in directly.
•
NFS or ftp: Prepare a file containing commands, and copy it to the logic
•
analyzer’s \system\program file. The analyzer must be connected as
control.
LAN Session
Remember to dis connect your LAN session before turning off the logic analyzer
See Also HP1670D-Series Logic Analyzer Programmer’s Guide for more
information on logic analyzer programming commands.
The LAN User’s Guide for details on connecting the logic analyzer to the
LAN and examples of controlling the logic analyzer over LAN.
2-10
Page 31

3
Using the Analyzer
Page 32

Using the Analyzer
This chapter shows you how to perform the basic tasks necessary to
make a measurement. Each section uses an example to show how the
task fits into the overall goal of making a measurement.
3–2
Page 33
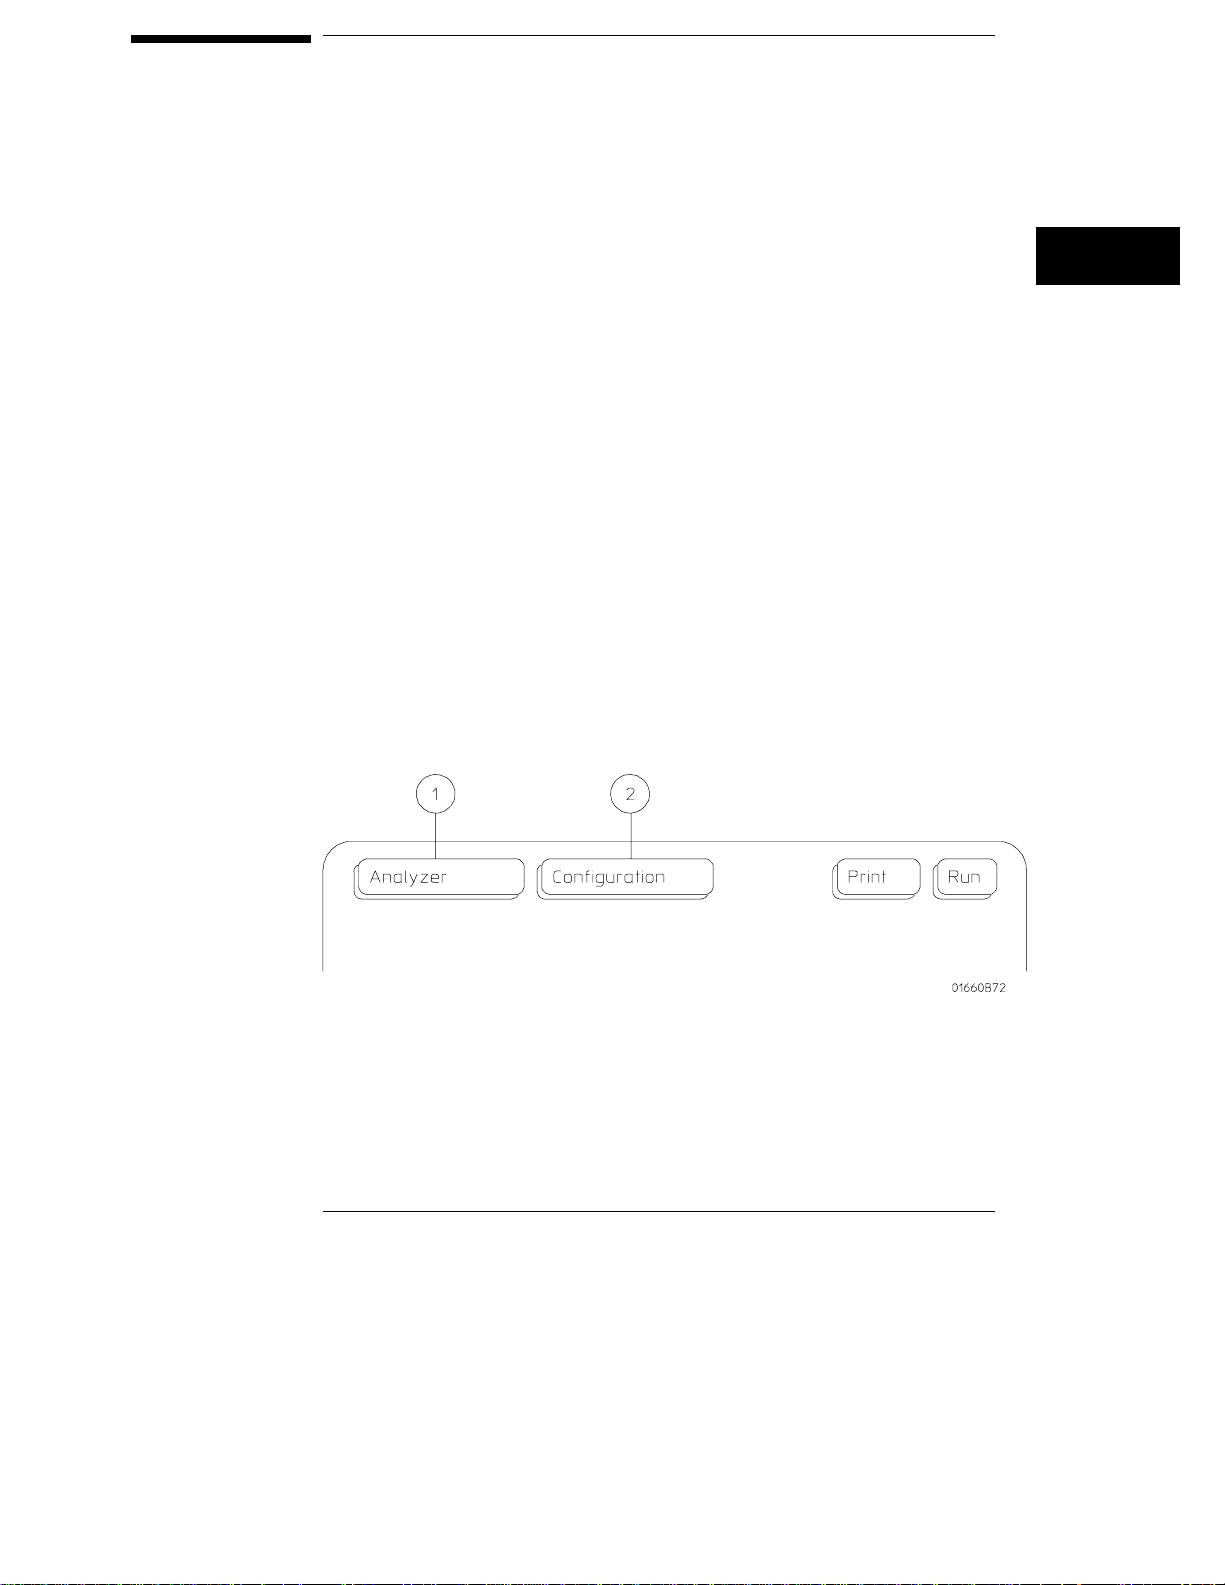
Accessing the Menus
When you power up the logic analyzer, the first screen after the
system tests is the Analyzer Configuration menu. Menus are identified
by two fields in the upper left corner. The leftmost field shows
Analyzer. This field is sometimes referred to as the "mode field" or the
"module field" because it controls which other set of menus you can
access. The second field, just to the right of the mode field, accesses
menus within the mode and so is called the "menu field". Menus are
referred to by the titles that appear in the mode and menu fields; for
example, the Analyzer Configuration menu.
The figure below shows the top of the first screen. The mode field,
item 1, displays "Analyzer." The menu field, item 2, displays
"Configuration." Because menus are identified by the titles in these
two fields, this menu is referred to as the Analyzer Configuration
menu. When there is no risk of confusion, the menu is sometimes
referred to just by the title showing in the second field; for example,
the Configuration menu.
Logic Analyzer Configuration Menu
3–3
Page 34
Using the Analyzer
To access the System menus
To access the System menus
The System menus allow you to load configurations, change colors, and
perform system diagnostics.
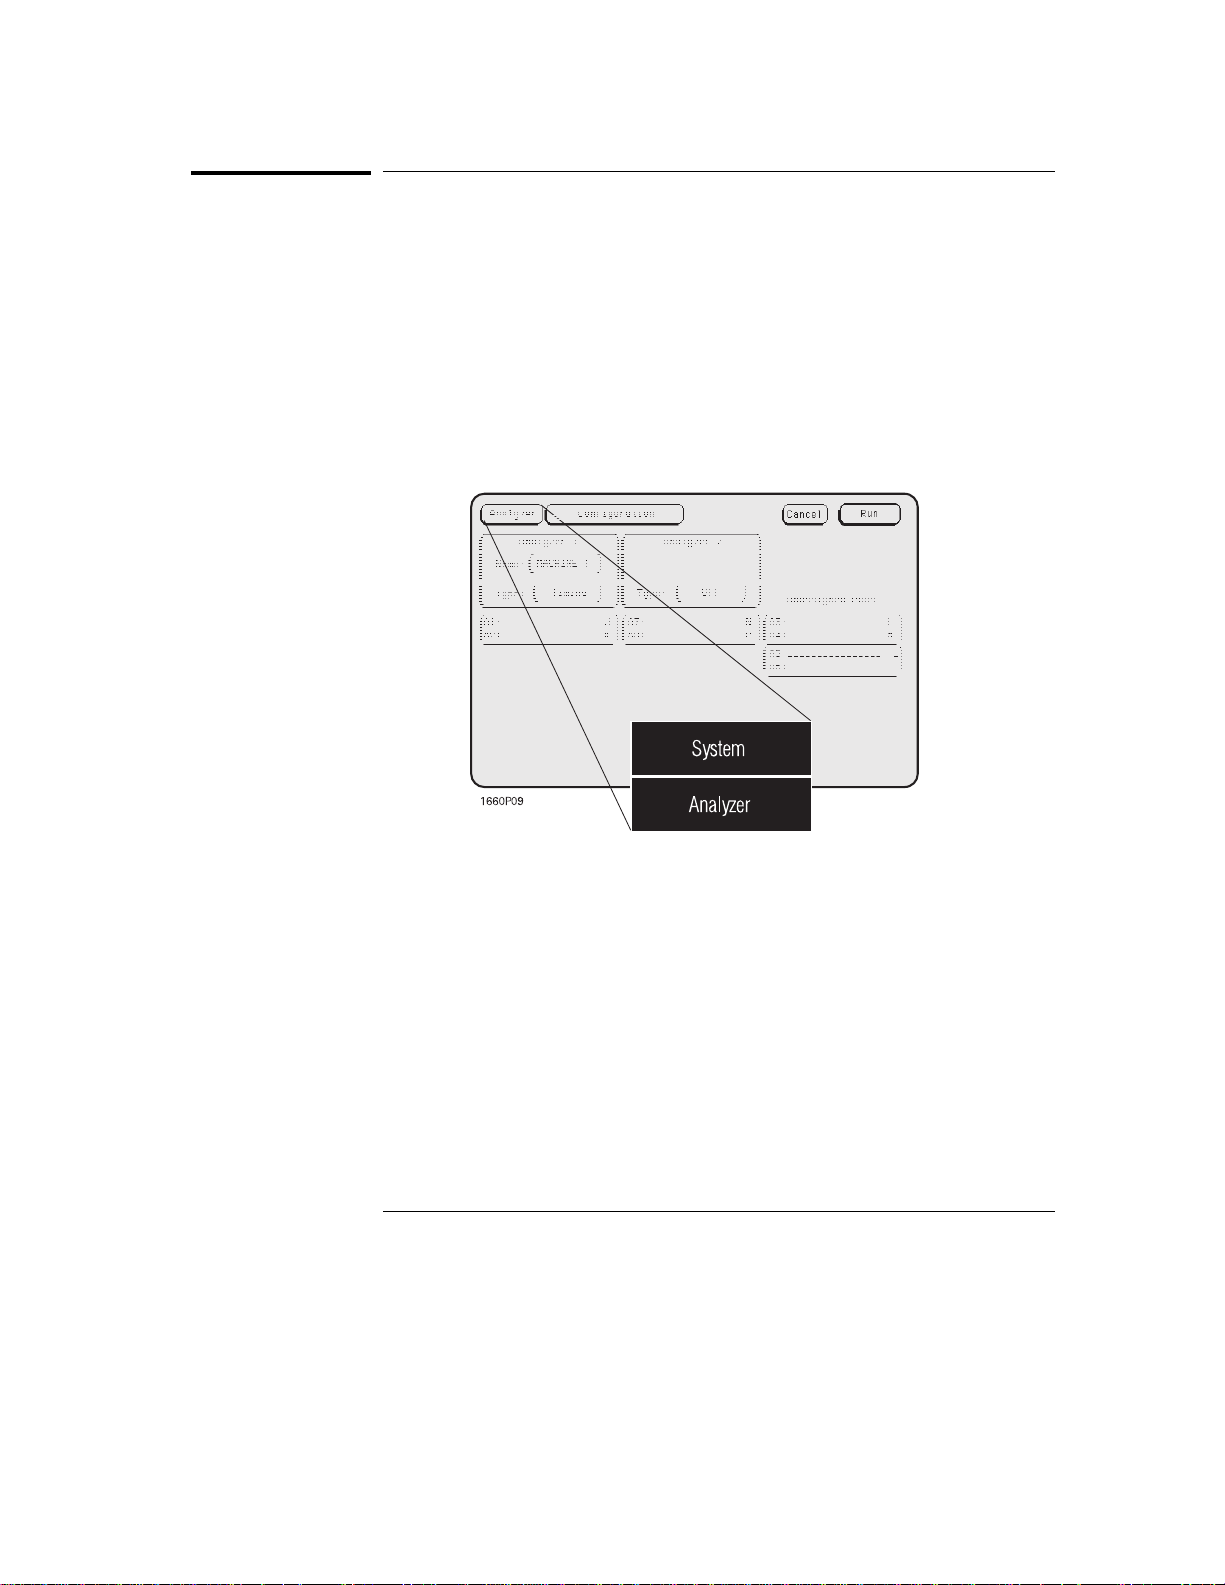
Select the mode field.
1
Use the arrow keys to highlight the mode field, then press the Select key. Or,
if you are using the mouse, click on the field. This operation is referred to as
"select".
A pop-up menu appears with the choices System and Analyzer. (If you have
installed any optional software, there may be other choices as well.)
Select System.
2
Mode Pop-Up Menu
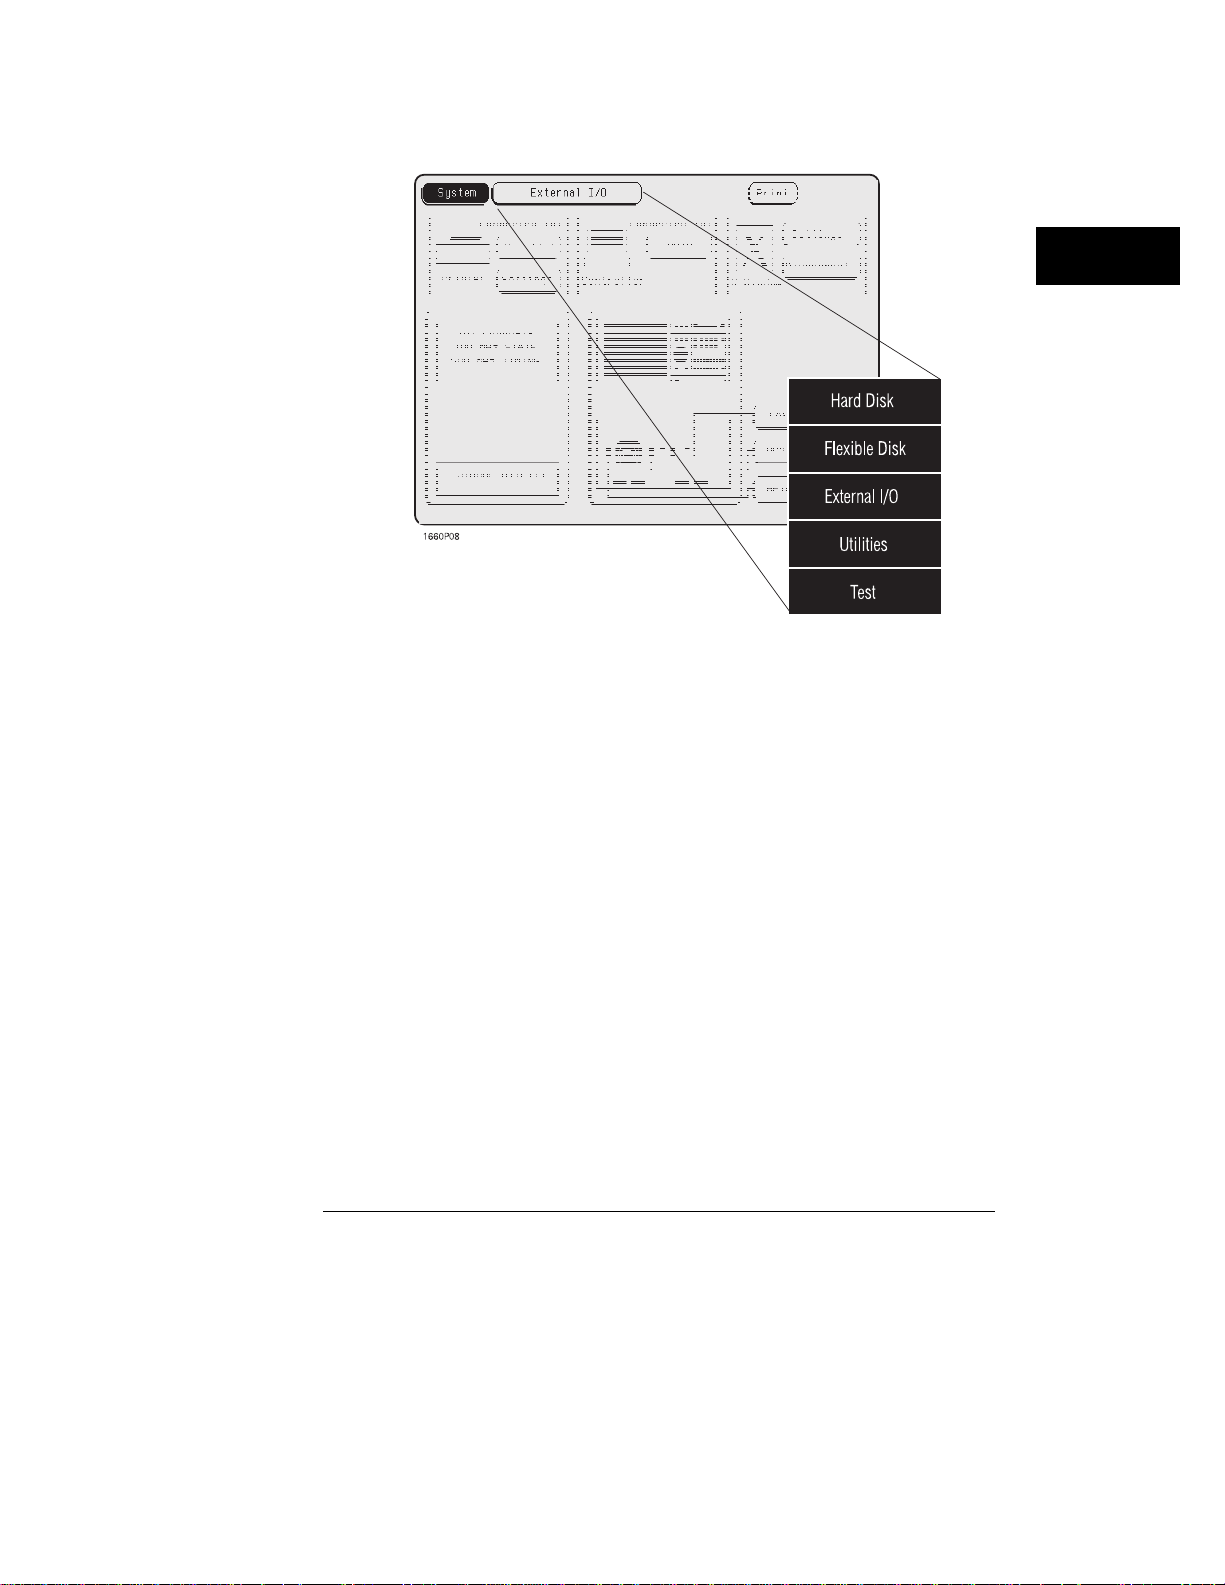
3 Select the menu field.
The pop-up menu lists five menus: Hard Disk, Flexible Disk, External I/O,
Utilities, and Test.
3–4
Page 35
Using the Analyzer
To access the System menus
System M enus
Hard Disk allows you to perform file operations on the hard disk.Hard Disk allows you to perform file operations on the hard disk.
Flexible Disk allows you to perform file operations on the flexible disk.
•
External I/O allows you to configure your HP-IB, RS-232-C, and LAN
•
interfaces, and connect to a printer and controller.
Utilities allows you to set the clock, update the operating system software,
•
and adjust the display.
Test displays the installed software version number and loads the self-
•
tests.
See Also For information on the Disk menus, "File Management" in Chapter 6 and
"Disk Drive Operations" in Chapter 7.
For information on the External I/O menu, "Connecting Peripherals" Chapter
2, and "The RS-232-C, HP-IB, Centronics, and LAN Interfaces" in Chapter 7.
For information on the Utilities menu, "System Utilities" in Chapter 7.
For how to run the self-tests, "Operator’s Service" Chapter 12.
3–5
Page 36

Using the Analyzer
To access the Anal yzer menus
To access the Analyzer menus
The Analyzer menus allow you to control the analyzer to make your
measurement, perform operations on the data, and view the results on the
display.
Select the mode field.
1
A pop-up menu appears with the choices System and Analyzer. (If you have
installed any optional software, there may be other choices as well.)
Select Analyzer.
2
3 Select the menu field.
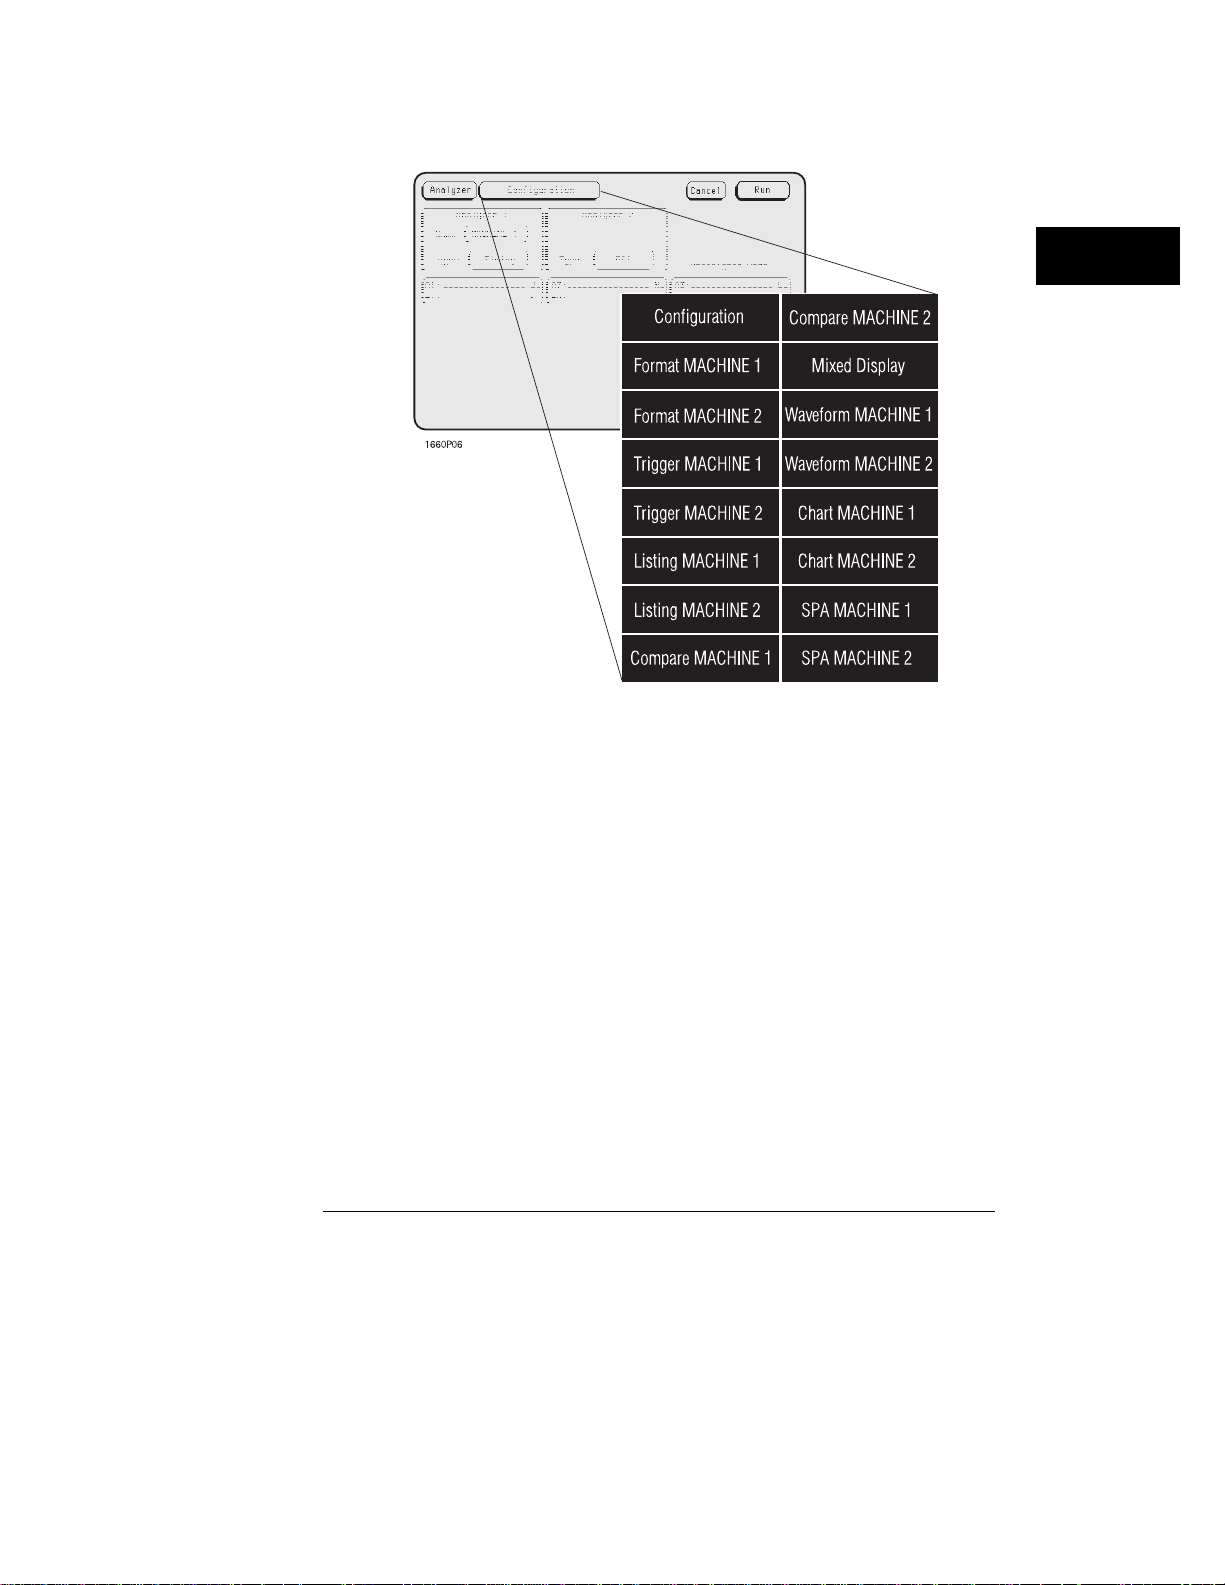
The figure on the next page shows all possible menus. Your analyzer will
never have all of them available at once, because certain menus are only
accessible when the analyzer is configured in a particular mode. For
instance, the Compare menu is only available when you set an analyzer to
State Compare mode. The SPA menu requires an analyzer to be set to SPA.
Configuration is always available in Analyzer mode. Use Configuration to
•
assign pods and set the analyzer type.
Format is available whenever an analyzer is set to a type other than "Off."
•
Use Format to create data labels and symbols, adjust the pod threshold
level, and set modes and clocks.
Trigger is available when an analyzer is set to State, State Compare, or
•
Timing. Use Trigger to specify a trigger sequence which will filter the raw
information into the measurement you want to see.
Listing is available when an analyzer is set to State, State Compare, or
•
Timing. Use Listing to view your measurement as a list of states. Using an
inverse assembler, a state analyzer can display the measurement as though
it were assembly code.
Compare is available only when an analyzer type is set to State Compare.
•
Use Compare to compare two listings and quickly scroll to the sections
where they differ. Because State Compare mode uses significantly more
memory than State mode, you should use State Compare only when you
plan to compare listings, and use State mode the rest of the time.
3–6
Page 37
Using the Analyzer
To access the Analyzer menus
Analyzer Menus
Mixed Display always appears in the menu list when an analyzer is set to
•
State, State Compare, or Timing, but it requires a State or State Compare
analyzer with time tags enabled.
Waveform is available when an analyzer is set to State, State Compare, or
•
Timing. Use Waveform to view the data as logic levels on discrete lines.
Chart is available only when an analyzer is set to State or State Compare.
•
Use Chart to view your measurement as a graph of states versus time.
SPA is available only when an analyzer is set to SPA. Use SPA to gather
•
and view overall statistics about your system performance.
See Also Chapter 7, "Reference", for details on the State and Timing menus, and
Chapter 8, "System Performance Analysis (SPA) Software" for information on
the SPA menu.
"Using the Analyzer Menus" in this chapter for how to use the menus.
3–7
Page 38

Using the Analyzer Menus
The following examples show how to use some of the Analyzer menus
to configure the logic analyzer for measurements. In these examples,
we assume that you have already determined which signals are of
interest, and have connected the logic analyzer to the target system.
Some of the examples use data from a Motorola 68360 target system,
acquired with an HP E2456A Preprocessor Interface.
To label channel groups
Hewlett-Packard logic analyzers give you the ability to separate or group data
channels and label the groups with a name that is meaningful to your
measurement. Labels also assist you in triggering only on states of interest.
Labels can only be assigned in the Analyzer Format menu. Once assigned, the
labels are available in all display menus, where they can be added to or
deleted from the display. Use labels when you want to group data channels
by function with a name that has meaning to that function.
The default label names are Lab1 through Lab126. You can modify any of
these default names to any six-character string. If you are using an HP
preprocessor interface, the configuration file has predefined labels for your
specific processor which should not be changed.
To create or modify a label and assign channel groups, use the following
procedure.
Press the Format key to select the Format menu.
1
2 Select a label under the Labels heading. In the pop-up menu, select
Modify Label.
3 Use the keyboard to type in a name for the label and press Done.
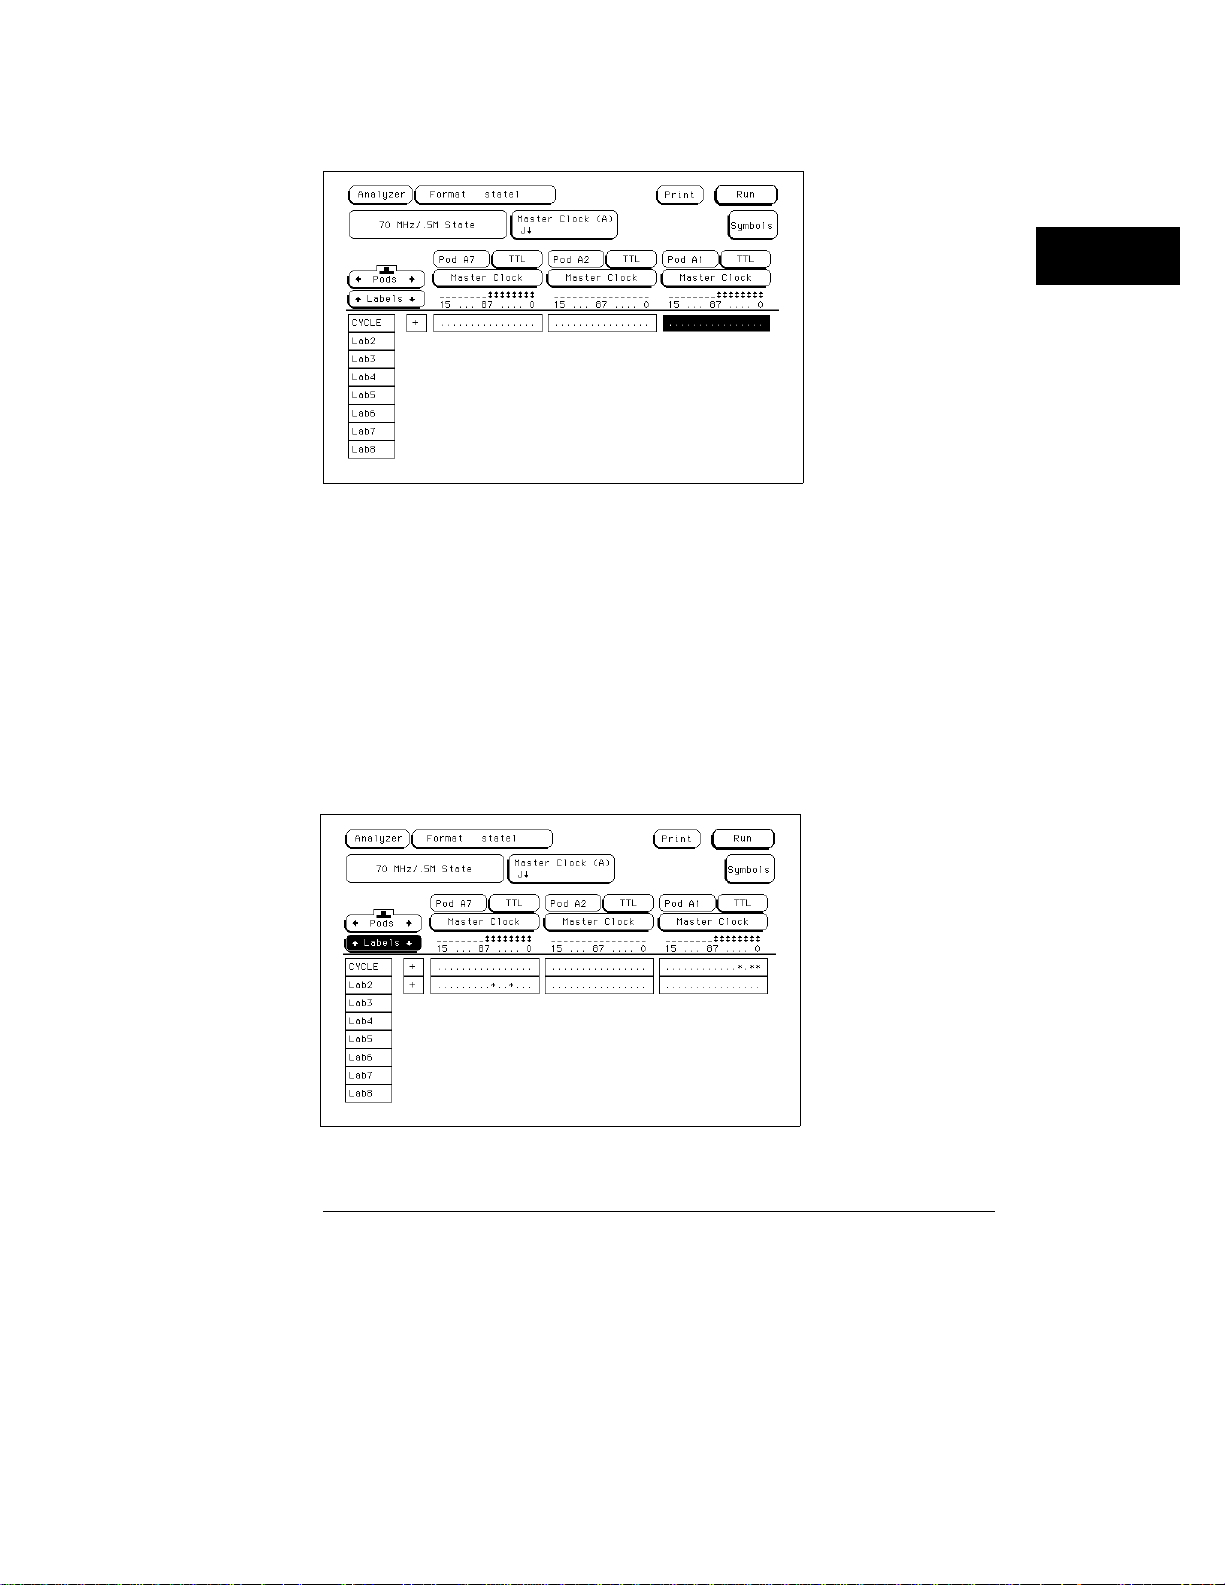
In this example, the label is called CYCLE.
3–8
Page 39
Using the Analyzer
To label channel groups
4 Select the pod containing the channels for the label. Use the knob or
the arrow keys to position the selector over a channel you want to
change.
An asterisk indicates the channel is selected; a dot indicates the channel is
not part of the current group.
Toggle the channel’s group status by pressing Select.
5
The indicator changes and the selector moves to the next channel.
In this example, the channels 3, 1, and 0 (Pod A1) are assigned to label
CYCLE and the channels 6 and 3 (Pod A7) are assigned to the label Lab2.
3–9
Page 40

Using the Analyzer
To create a symbol
To create a symbol
Symbols are alphanumeric mnemonics that represent specific data patterns
or ranges. Symbols allow you to quickly identify data of interest. When you
define a symbol and set the base type to Symbol in the Listing menu, the
symbol is displayed in the data listing where the data would normally be
displayed. The symbols also appear in the Waveform menu when you view a
label in bus form.
To create a symbol, use the following procedure.
In the Analyzer Format menu, select Symbols.
1
The symbol table menu appears. The symbol table is where all user symbols
are created and maintained. If you get a message, "No labels specified," check
that you have at least one label turned on with channels assigned to it.
In the Symbol menu, select the Label field. In the pop-up menu, select
2
the label that contains the channel groups you want.
When you open the symbol table menu, the Label field displays the name of
the first active label.
If the label you want does not appear in the pop-up menu, the label is
probably turned off. Return to the Format menu, select the label you want,
and select Turn Label On. Another possibility is that the label is on the other
analyzer. The two analyzers manage resources separately.
Select the Base field. In the pop-up menu, select the base for the
3
pattern.
In this example, binary is used instead of CYCLE because CYCLE only
contains three channels.
Select the field below Symbol. Select Add a Symbol, type in the
4
symbol name, then press Done.
3–10
Page 41
Using the Analyzer
To create a symbol
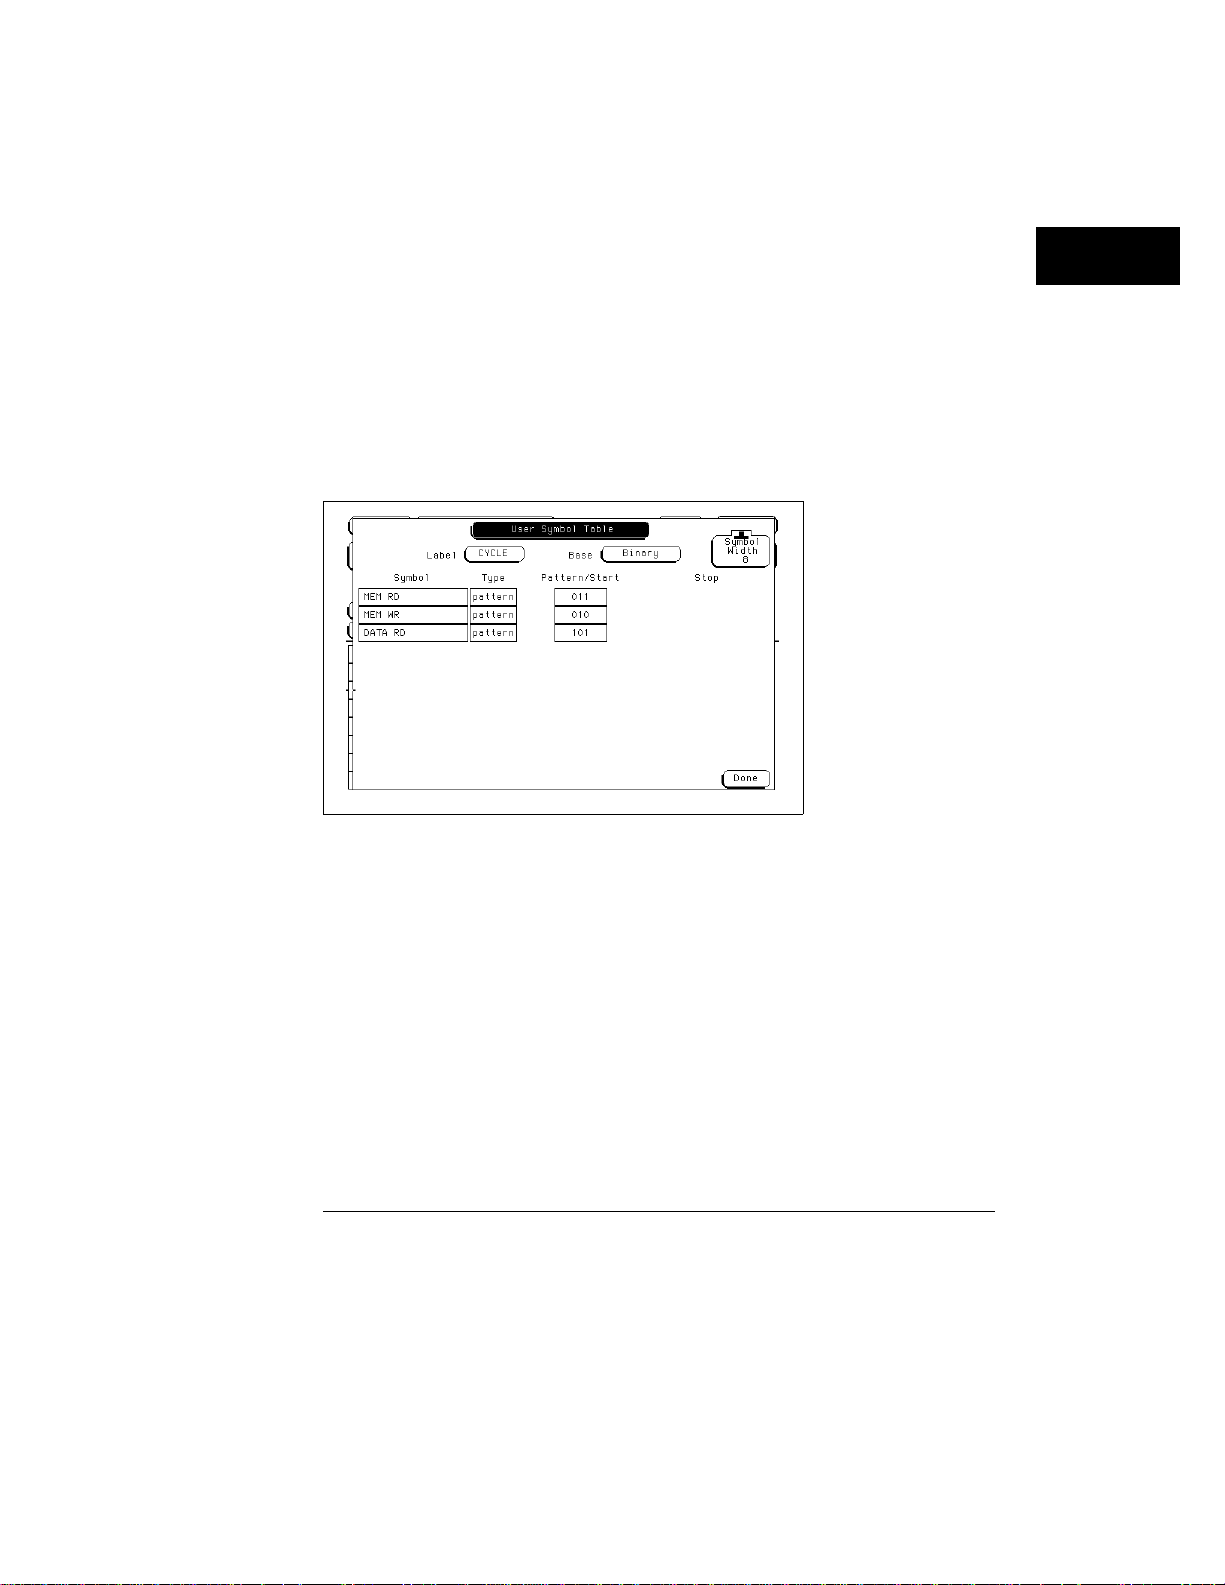
5 If you need additional Symbols, repeat step 4 until you have added all
symbols.
In this example, three symbols are added: MEM RD, MEM WR, and DATA RD.
6 Toggle the Type field to "range" or "pattern".
When Type is range, a third field appears under the Stop column. To specify
a full range, you need to enter a value for it, too.
Select the Pattern/Start field and use the keypad to enter an
7
appropriate value in the selected base. Use X for "don’t care."
8 When the pattern is specified, press Done. If you created additional
Symbols, repeat steps 6 and 7 until you have specified all symbols.
9 To close the symbol table menu, select Done.
Symbol Table Menu Showing Thr ee Symbol s
You can also download symbol tables created by your programming
environment using HP E2450A Symbol Utility. The Symbol Utility is shipped
with the HP 1670D-series logic analyzers.
See Also HP E2450A Symbol Utility User’s Guide for more information on the
Symbol Utility.
3–11
Page 42

Using the Analyzer
To examine an analyzer waveform
To examine an analyzer waveform
The Analyzer Waveform menu allows you to view state or timing data in a
format similar to an oscilloscope display. The horizontal axis represents
states (in state mode) or time (in timing mode) and the vertical axis
represents logic highs and lows.
In Analyzer mode, press the Run key to acquire data.
1
In any mode other than Analyzer, pressing the Run key has no effect. The
menus which ignore Run lack the Run field onscreen. In Analyzer mode with
Run available, the menu changes to a display menu.
Go to the Analyzer Waveform menu.
2
3 To adjust the horizontal axis (sec/Div or states/Div) use the knob.
If nothing happens when you turn the knob, make sure the Div field has a roll
indicator above it, as in the figures on the next page. When you first enter
the Waveform menu, the knob adjusts the horizontal axis but if you select
another rollable field, the knob will control that field instead.
To adjust the display relative to the trigger, select the Delay field and
4
enter a value or use the knob.
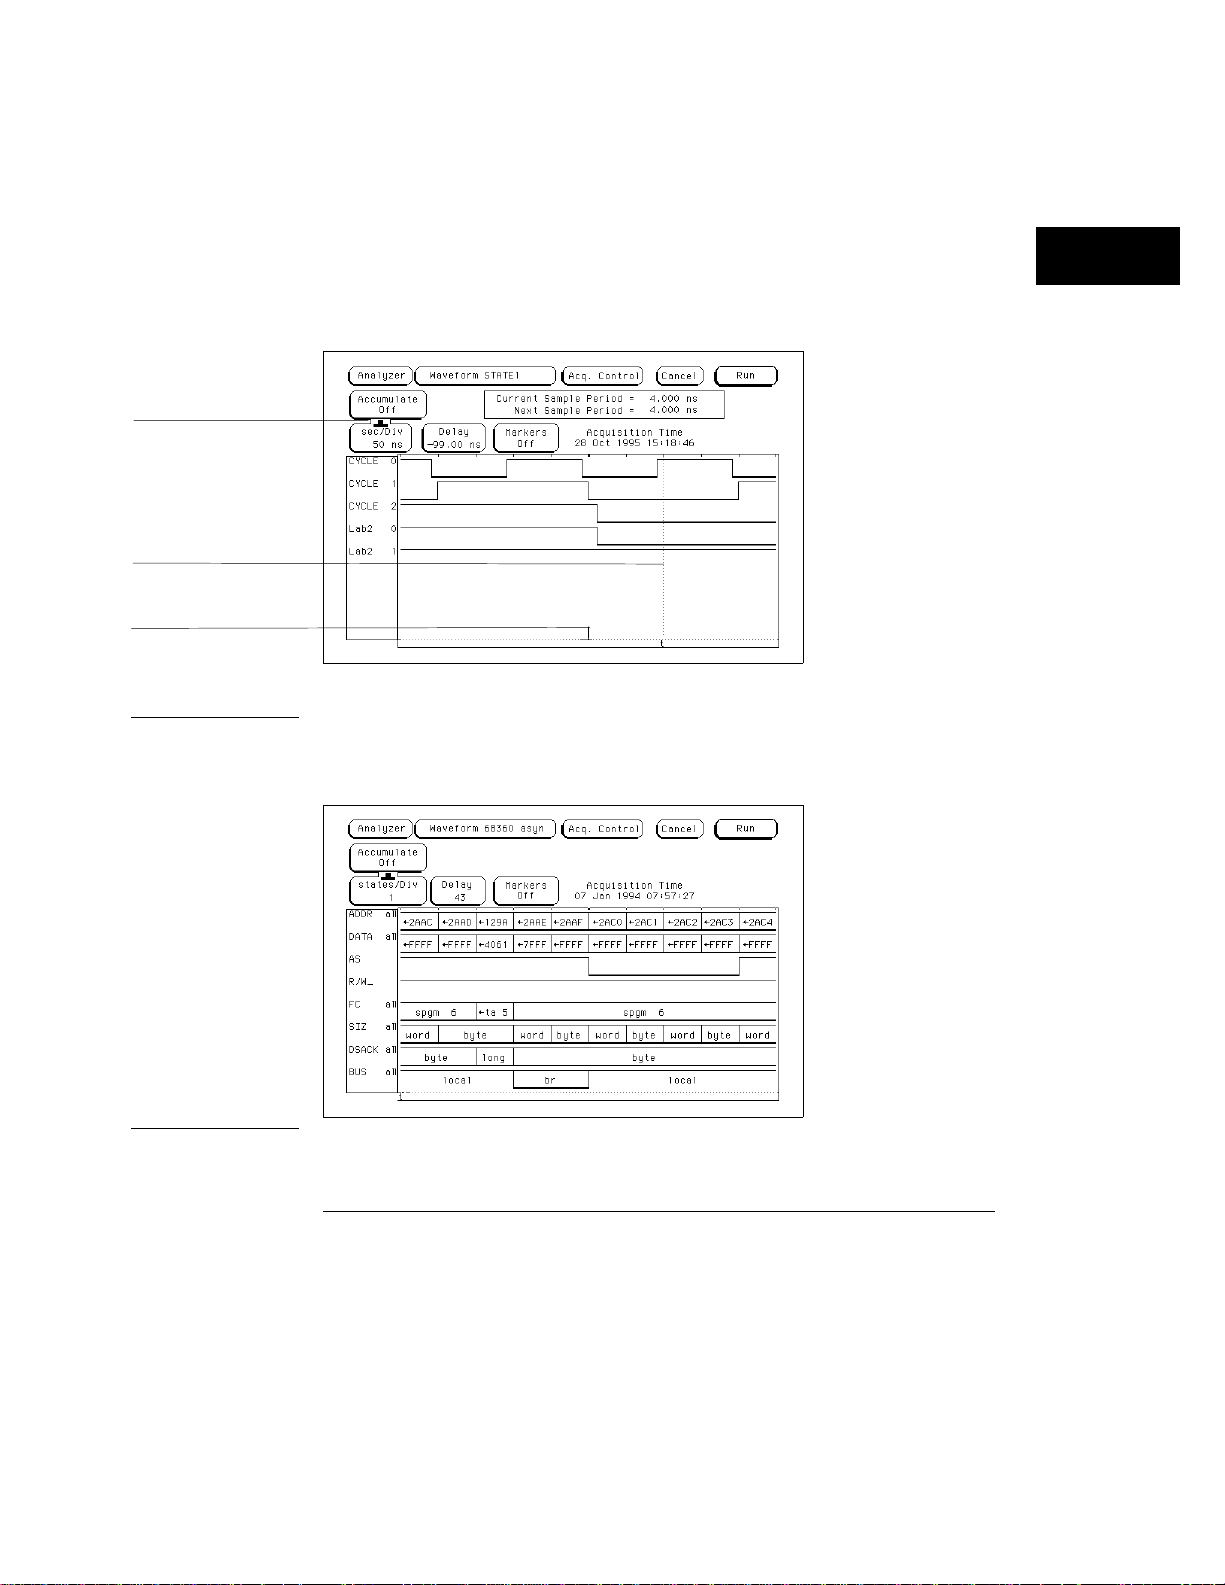
The portion of memory being displayed is indicated by a white bar along the
bottom of the display area. The position of the trigger in memory is indicated
by a white dot on the same line. When the bar includes the dot, then the
trigger is visible on the display as indicated by a vertical line with a "t"
underneath.
To scroll through waveforms, select the large rectangle below the Div
5
field and use the knob.
The roll indicator appears at the top of the rectangle and the name of the first
waveform is highlighted. The highlight moves as you turn the knob.
To insert waveforms, select the large rectangle under the Div field. In
6
the pop-up menu select Insert, and then select the labels and
channels.
The Sequential field inserts all the channels of the label as individual
waveforms; the Bus field groups the waveforms; the Bit N field inserts just
the Nth bit. Waveforms are inserted after the currently highlighted one.
3–12
Page 43
7 To take measurements, select the Markers field and choose the
appropriate marker type.
The markers available depend on the type of analyzer and whether or not
tagging is enabled. Use markers to locate patterns quickly.
See Also "Count Field" and "Markers Field" in Chapter 7.
roll indicator
trigger indicator
memory displayed
indicator
Using the Analyzer
To examine an analyzer waveform
Example
The following example shows a state waveform from the Hewlett-Packard
preprocessor interface for the Motorola 68360. Notice how the bus
waveforms insert symbols or state data.
3–13
Page 44

Using the Analyzer
To examine an analyzer listing
To examine an analyzer listing
The Analyzer Listing menu displays state or timing data as patterns (states).
The Listing menu uses any of several formats to display the data such as
binary, ASCII, or symbols. If you are using an inverse assembler and select
Invasm, the data is displayed in mnemonics that closely resemble the
microprocessor source code.
See Also "The Inverse Assembler" at the end of this chapter for additional information
on using an inverse assembler.
In Analyzer mode, press the Run key to acquire data.
1
In any mode other than Analyzer, pressing the Run key has no effect. The
menus which ignore Run omit the Run field. In Analyzer mode with Run
available, the menu changes to a display menu.
Go to the Analyzer Listing menu.
2
All labels defined in the Analyzer Format menu appear in the listing. If there
are more labels than will fit on the screen, the Label/Base field is shaded like
a normal field.
To scroll the labels, select the Label/Base field and use the knob, or
3
press the blue Shift key and a Page key.
If the Label/Base field is selectable, the roll indicator appears over the field as
in the example. To move the labels one full screen at a time, press Shift and a
Page key.
To scroll the data, use the Page keys or select the data roll field and
4
use the knob.
If you select the data roll field, the roll indicator moves to it. No matter
which field is currently controlled by the knob, however, the Page keys page
the data up or down.
The numbers in the data roll column indicate how many samples the data is
from the trigger. Negative numbers occurred before the trigger and positive
numbers occurred after.
If the labels have symbols associated with them, set the base to
5
Symbol.
The symbols you defined appear in the listing.
3–14
Page 45
6 To insert a label, select one of the label fields, then select Insert from
the pop-up menu, and select the label you want to insert.
The last label cannot be deleted, so there is always at least one label. You can
insert the same label multiple times and display it in different bases.
To take measurements, select the Markers field and choose the
7
appropriate marker type.
The markers available depend on the type of analyzer and whether or not
tagging is enabled. Use markers to locate states quickly.
See Also "Count Field" and "Markers" in Chapter 7.
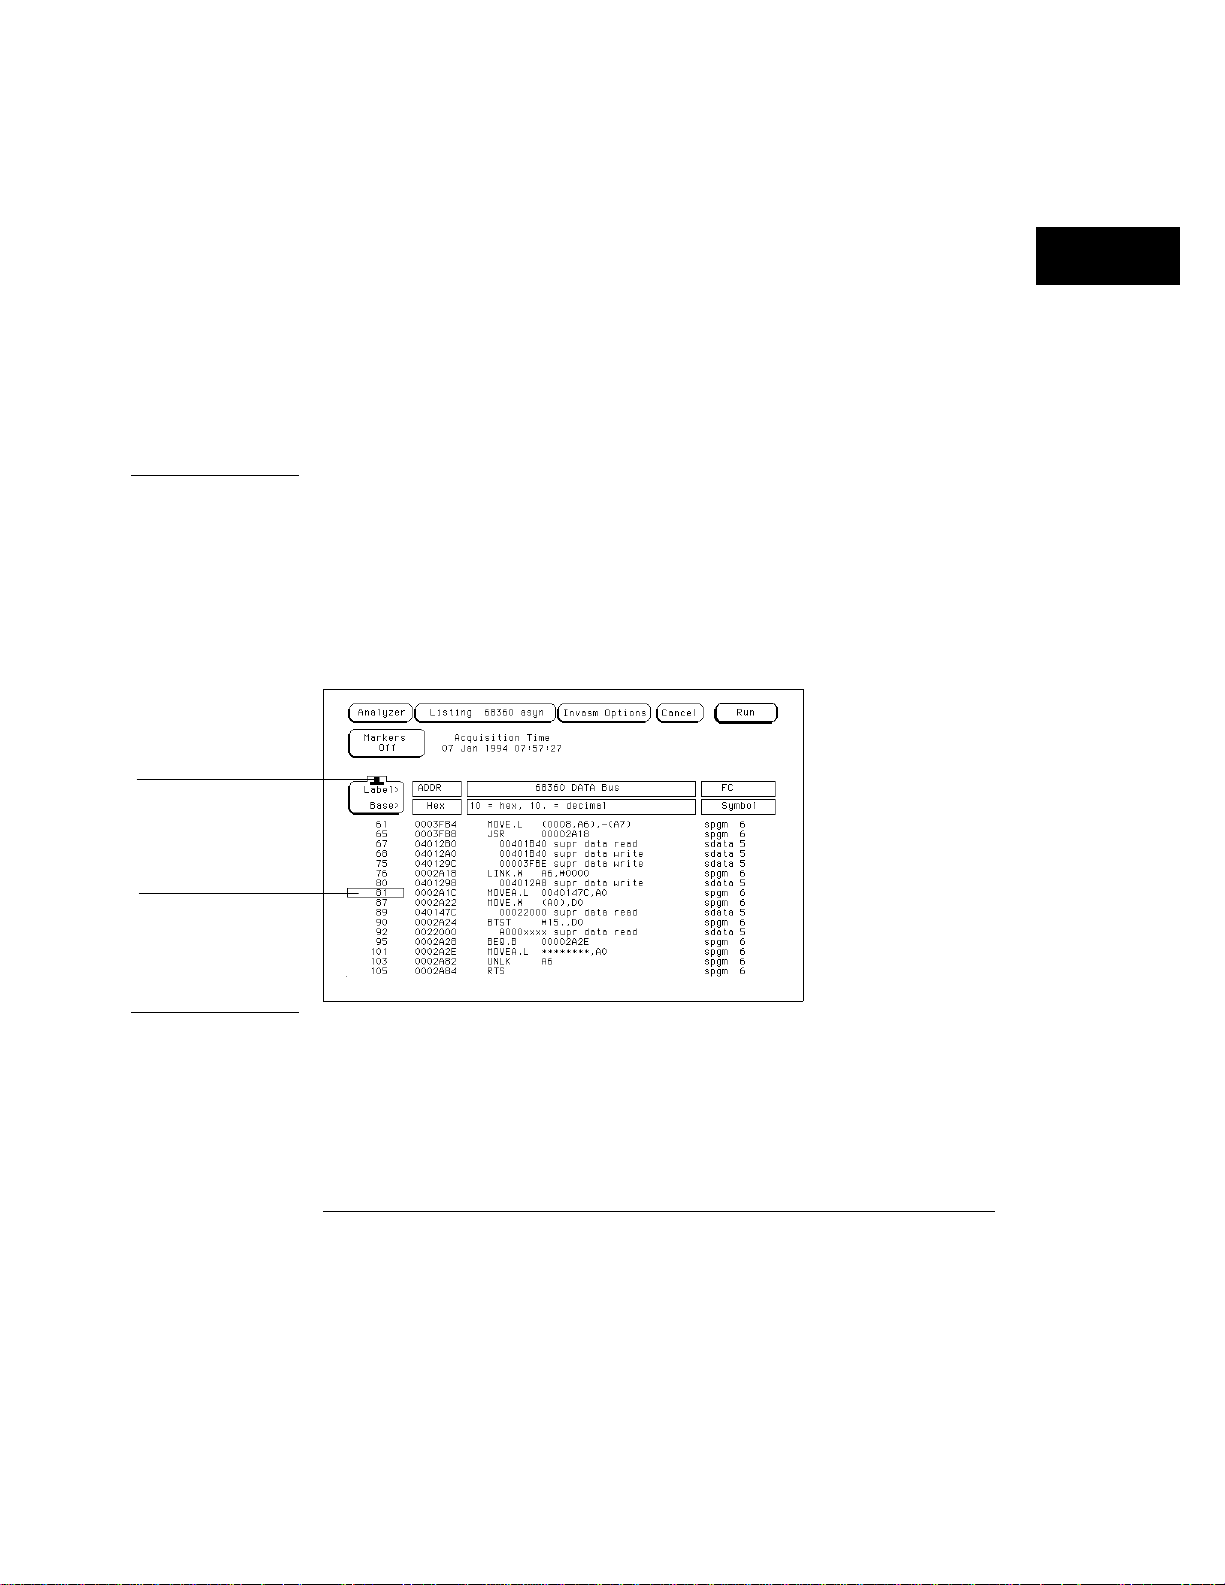
The following illustration shows a listing from the Hewlett-Packard
Example
preprocessor interface for the Motorola 68360. The ADDR label has the base
set to Hex to conserve space on the display. The DATA label has the base set
to Invasm for inverse assembly. The FC label has the base set to Symbol.
Additional labels are located to the right of FC, and can be viewed by
highlighting and selecting Label, then using the knob to scroll the display
horizontally.
Using the Analyzer
To examine a n analyzer listing
roll indicator
data roll field
3–15
Page 46

Using the Analyzer
To compare two listings
To compare two listings
Compare Menu
The Compare menu is available only if the analyzer type is State Compare.
The Compare menu allows you to take two state analyzer acquisitions and
compare them to find the differences. You can use this function to quickly
find all the effects after changing the target system, or to quickly compare
the results of quality tests with results from a working system.
In the Configuration menu set Type to State Compare.
1
2 Set up the rest of the measurement, then press the Run key to acquire
data.
3 Go to the Analyzer Compare menu, select Copy Listing to Reference,
and then select Execute.
The Compare menu initially is empty, but when you select Execute, the data
appears as the Reference listing. Note that in the Reference listing, time data
is not available even if Count Time is turned on in the Trigger menu. The
Difference listing does show time data for the currently acquired data.
Set up the other test that you want to compare to the first.
4
This can be a change to the hardware, or a different system. Do not change
the trigger, however, or all the states will be different.
Run the test again, then select the Reference listing field to toggle to
5
Difference listing.
The Difference listing is displayed on the next page.
3–16
Page 47
Using the Analyzer
To compare t wo listings
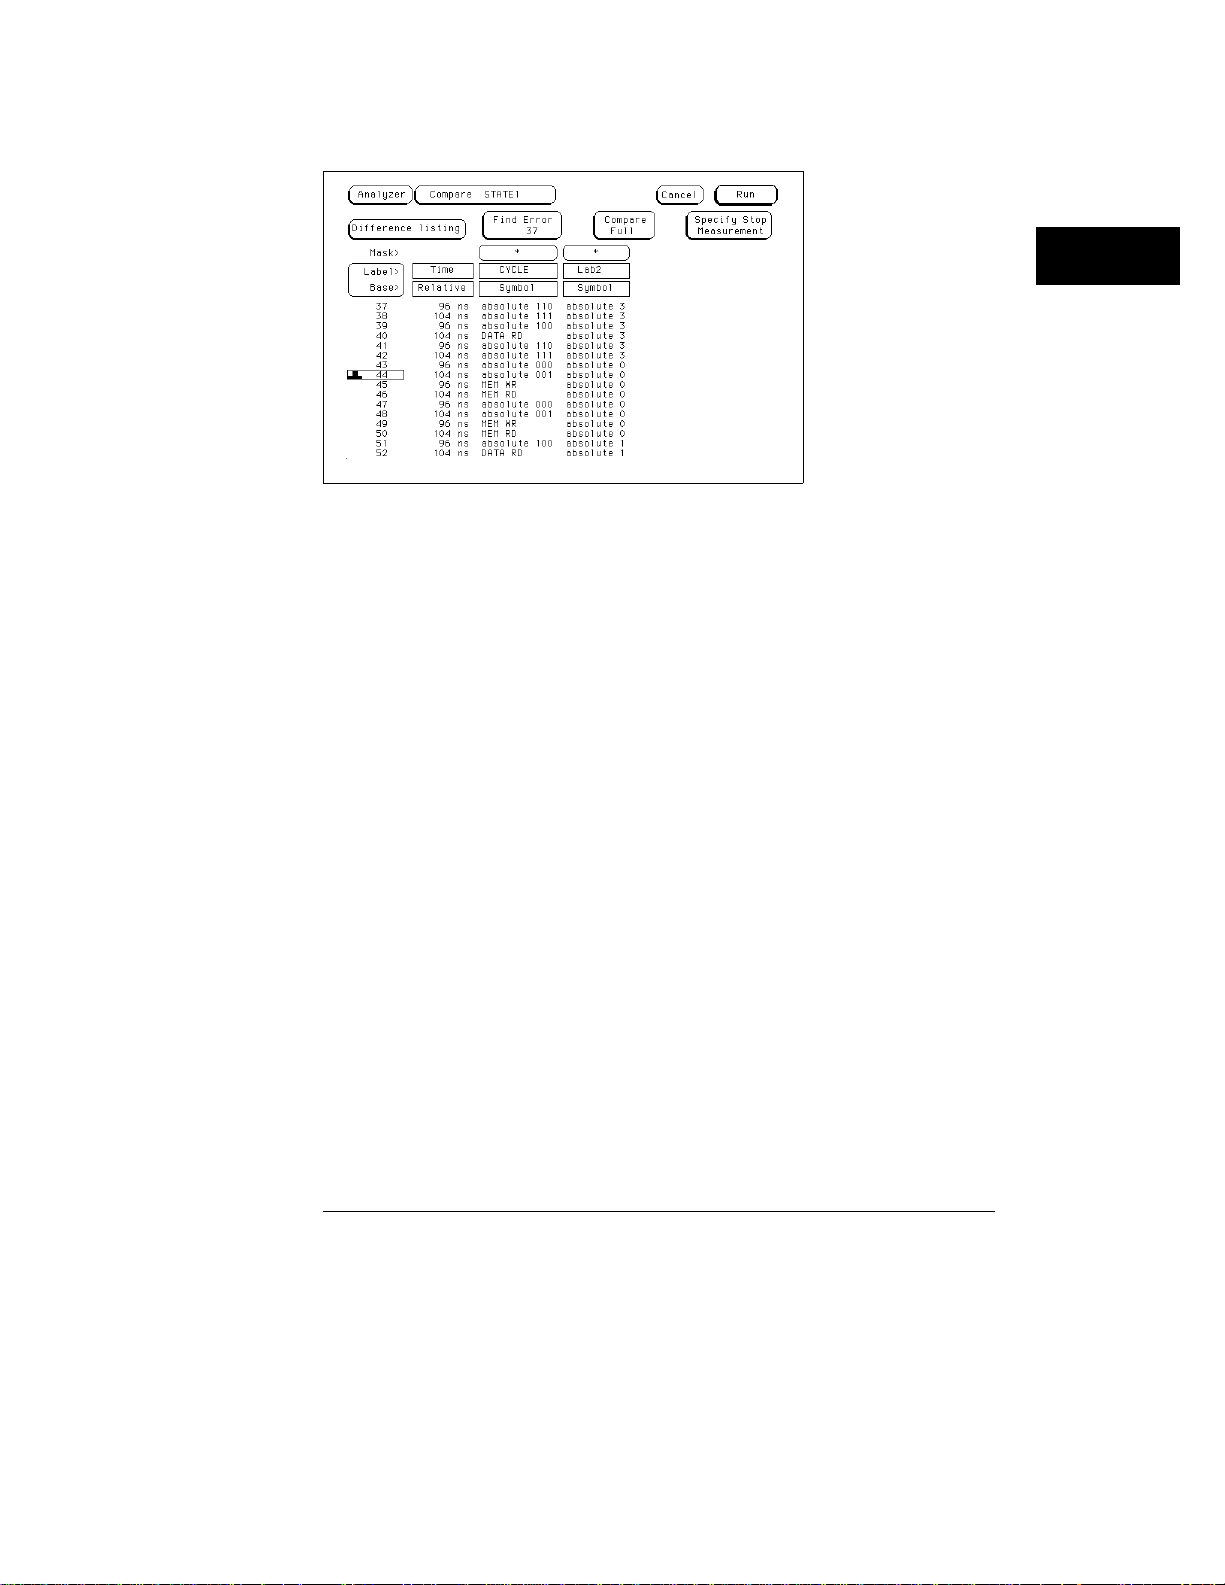
Difference Listing
The Difference listing displays the states that are identical in dark typeface,
and the states that are different in light typeface (indistinguishable in the
above illustration). The light typeface shows the data from the current
acquisition that is different from the data in the reference file.
Select the Find Error field, and use the knob to scroll through the
6
errors.
The display jumps past all states that are identical, and shows the number of
errors through the current state in the Find Error field. In the above
illustration, there are 37 errors through state 44 of the listing.
3–17
Page 48

The Inverse Assembler
When the analyzer captures a trace, it captures binary information.
The analyzer can then present this information in symbol, binary,
octal, decimal, hexadecimal, or ASCII. Or, if given information about
the meaning of the data captured, the analyzer can inverse assemble
the trace. The inverse assembler makes the trace list more readable
by presenting the trace results in terms of processor opcodes and data
transactions.
To use an inverse assembler
Most preprocessors include an inverse assembler in their software. Loading
the configuration file for the preprocessor sets up the logic analyzer to
provide certain types of information for the inverse assembler. This section
is provided in case you ever have to set up an analyzer for inverse assembly
yourself.
The inverse assembly software needs at least these five pieces of information:
Address bus. The inverse assembler expects to see the label ADDR, with
•
bits ordered in a particular sequence.
Data bus. The inverse assembler expects to see the label DATA, with bits
•
ordered in a particular sequence.
Status. The inverse assembler expects to see the label STAT, with bits
•
ordered in a particular sequence.
Start state for disassembly. This is the first displayed state in the trace list,
•
not the cursor position. See the figure on the next page.
Tables indicating the meaning of particular status and data combinations.
•
The particular sequences that each label requires depends on the type of
chip the inverse assembler was designed for. Because of this, inverse
assemblers cannot generally be transferred between platforms.
To run the inverse assembler, you must be sure the labels are spelled
correctly as shown here, or as directed in your inverse assembler
documentation. Even a minor difference such as not capitalizing each letter
will cause the inverse assembler to not work.
3–18
Page 49
The inverse assembler
synchronizes at the first
line in the trace list.. .
not at the cursor
position
Using the Analyzer
To use an inverse assembler
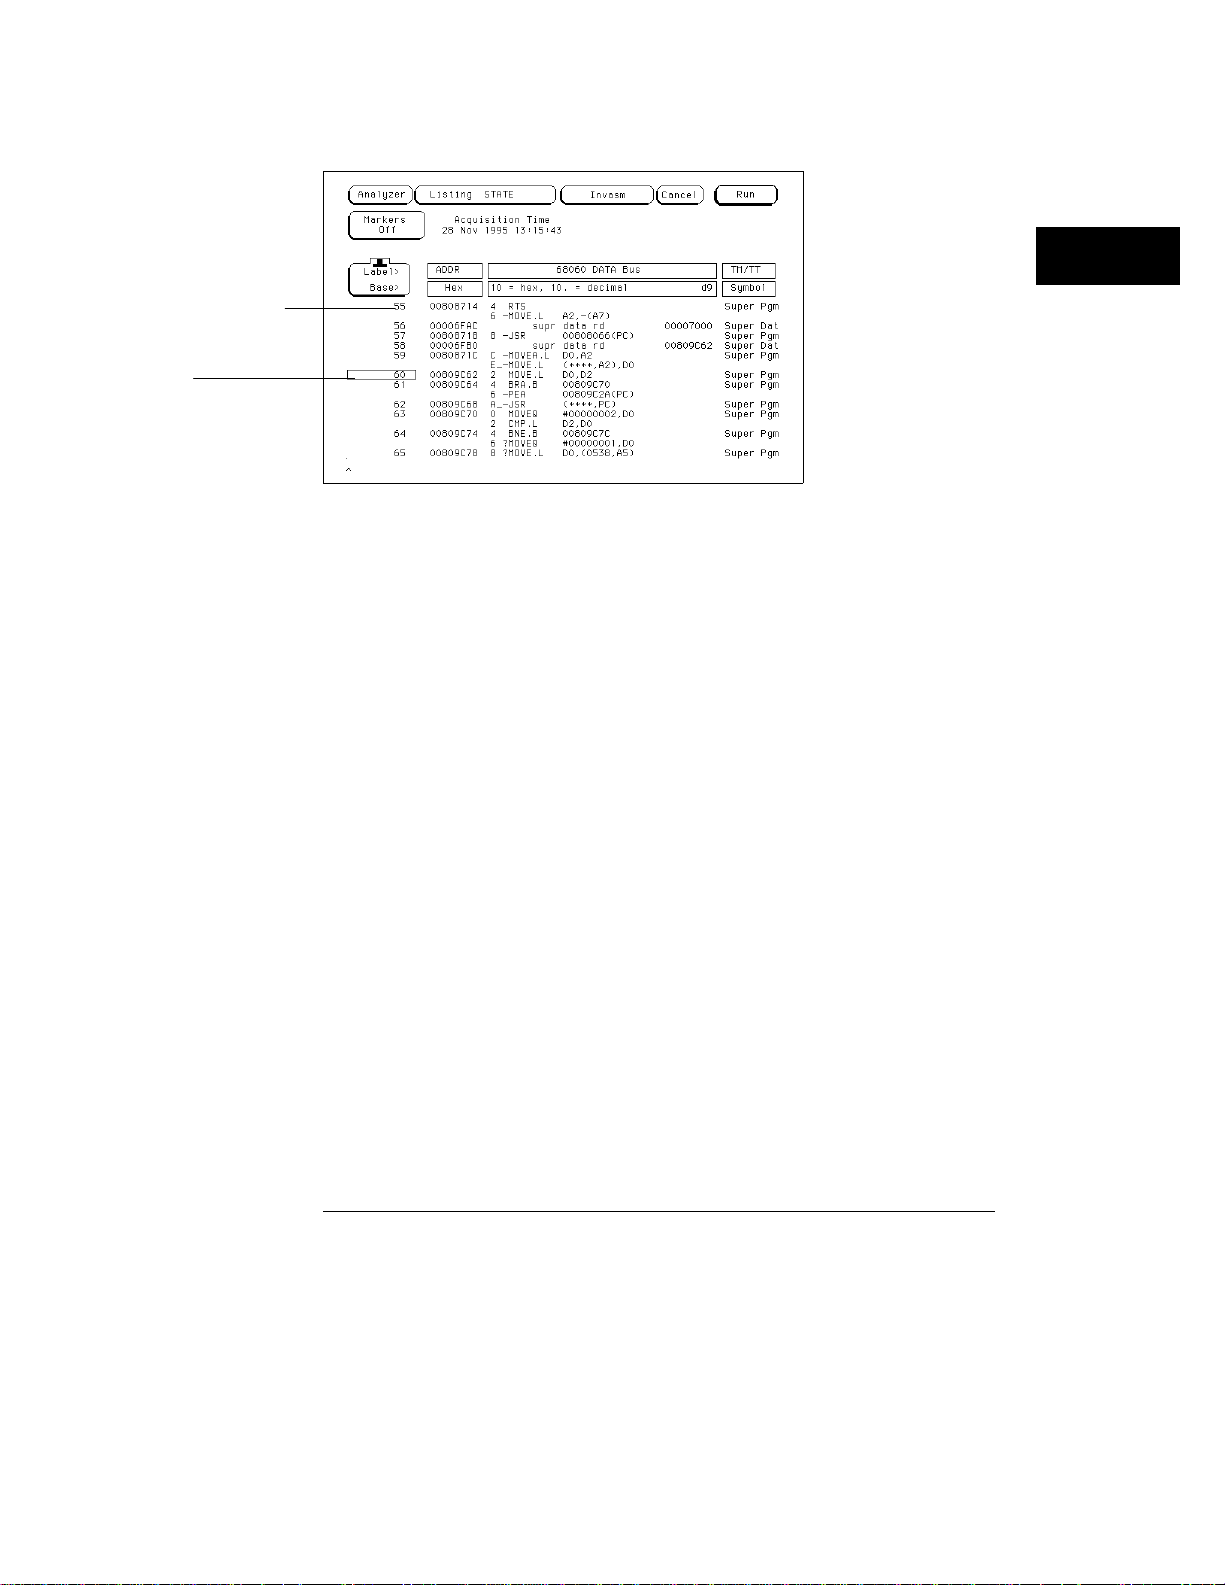
Inverse Assembly S ynchronization
When you select the Invasm field to begin inverse assembly of a trace, the
inverse assembler begins with the first displayed state in the trace list. This is
called synchronization. It looks at the status bits (STAT) and determines
the type of processor operation, which is then displayed under the STAT
label. If the operation is an opcode fetch, the inverse assembler uses the
information on the data bus to look up the corresponding opcode in a table,
which is displayed under the DATA label. If the operation is a data transfer,
the data and corresponding operation are displayed under the DATA label.
This continues for all subsequent states in the trace list.
If you roll the trace list to a new position and press Invasm again, the inverse
assembler repeats the above process. However, it does not reverse the trace
list from the starting position. This may cause differences in the trace list
above and below the point where you synchronized the inverse assembly.
The best way to ensure correct inverse assembly is to synchronize using the
first state you know to be the first byte of an opcode fetch.
See Also The Preprocessor User’s Guide for more information on controlling inverse
assembly.
Chapter 10, "Troubleshooting", if you have problems using the inverseTroubleshooting", if you have problems using the inverse
assembler. assembler.
3–19
Page 50

3–20
Page 51

4
Using the Trigger Menu
Page 52

Using the Trigger Menu
To use the logic analyzer efficiently, you need to be able to set up your
own triggers. This book provides examples of triggering in the next
chapter. Those examples assume you already know where to find
fields in the trigger menu. This chapter explains how to use those
fields.
This chapter shows you how to:
• Specify a basic trigger
• Change a trigger sequence
• Set up time correlation between analyzers
• Arm from another instrument, or arm another instrument
• Manage memory
4–2
Page 53

Specifying a Basic Trigger
The default analyzer triggers are
While storing "anystate" TRIGGER on "a" 1 time
Stor e "a ny state"
for state analyzers and
TRIGGER on "a" > 8 ns
for timing analyzers. If you want to simply record data, these will get
you started. You can quickly tailor them by specifying a particular
pattern to look for instead of the general case.
Customizing a trigger generally requires these steps:
• Assign terms to both analyzers
• Define the terms
• Change the trigger to use the new terms
4–3
Page 54
Using the Trigger Menu
To assign terms to an analyzer
To assign terms to an analyzer
When you turn the logic analyzer on, Analyzer 1 is named Machine 1 and
Analyzer 2 is off. Because trigger terms can only be used by one analyzer at a
time, all the terms are assigned to Analyzer 1. If you plan to use both
analyzers in your measurement, you need to assign some of the terms to
Analyzer 2.
Go to the Trigger Machine 1 menu.
1
If you have renamed Machine 1 in the Analyzer Configuration menu, the
name you changed it to will appear in the menu instead of Machine 1.
Select a term.
2
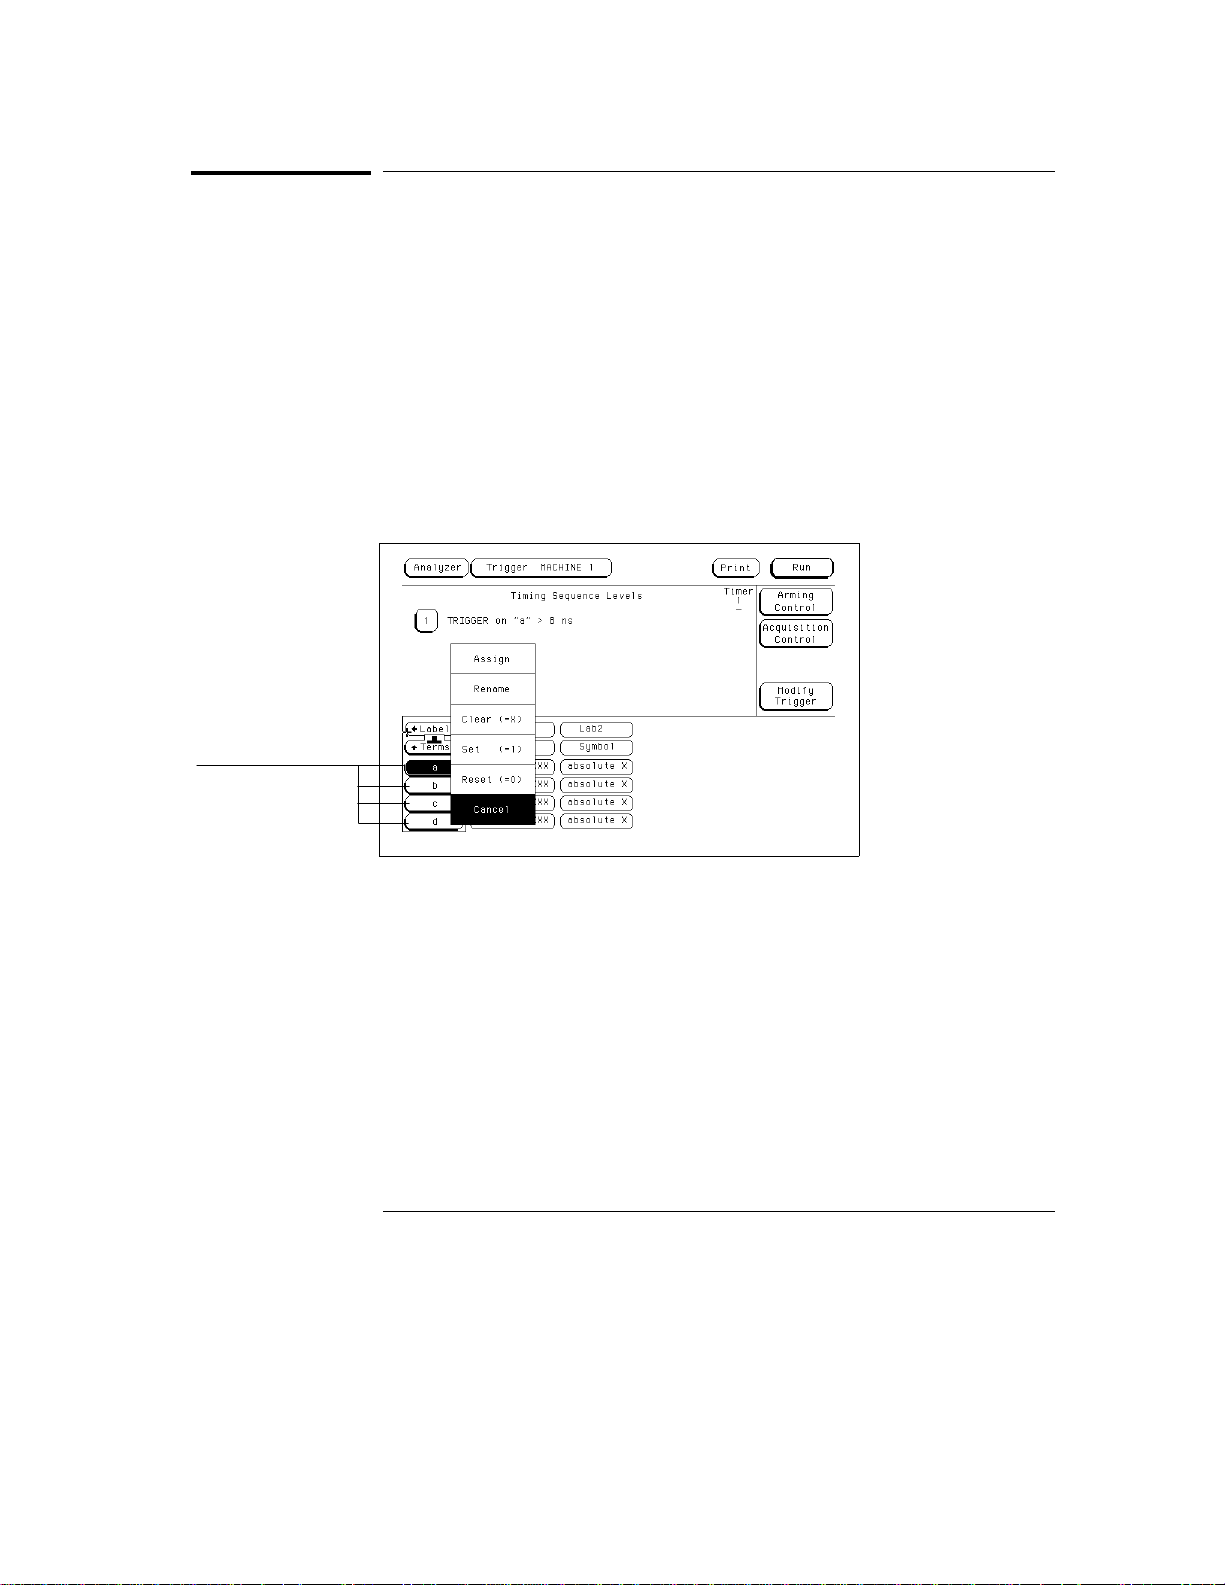
The terms are the fields below the roll field "Terms". See the figure below.
Terms
Trigger Menu
3 Select Assign from the list that appears.
The Resource Term Assignment menu appears. It is divided into two
sections, one for each analyzer. All the terms are listed.
To change a term assignment, select a term field.
4
The term fields toggle from one section to the other. You can get all your
terms assigned at once, or just change a few to meet immediate needs.
To exit the term assignment menu, select Done.
5
4–4
Page 55
Using the Trigger Menu
To define a term
To define a term
Both default triggers trigger on term "a". If you only need to look for the
occurrence of a certain state, such as a write to protected memory, then you
only need to define term "a" to make the measurement you want.
In the Trigger menu, select the field at the intersection of the term,
1
and the label whose value you want to trigger on.
You set labels in the Analyzer Format menu. If the channels you want to
monitor are not attached to a label, they will not appear in the trigger menu.
Enter the value or pattern you want to trigger on.
2
If the label’s base is Symbol, a pop-up menu appears offering a choice of
symbols. For other bases, use the keypad. An "X" stands for "don’t care".
If there are two conditions that need to be present at the same time, for
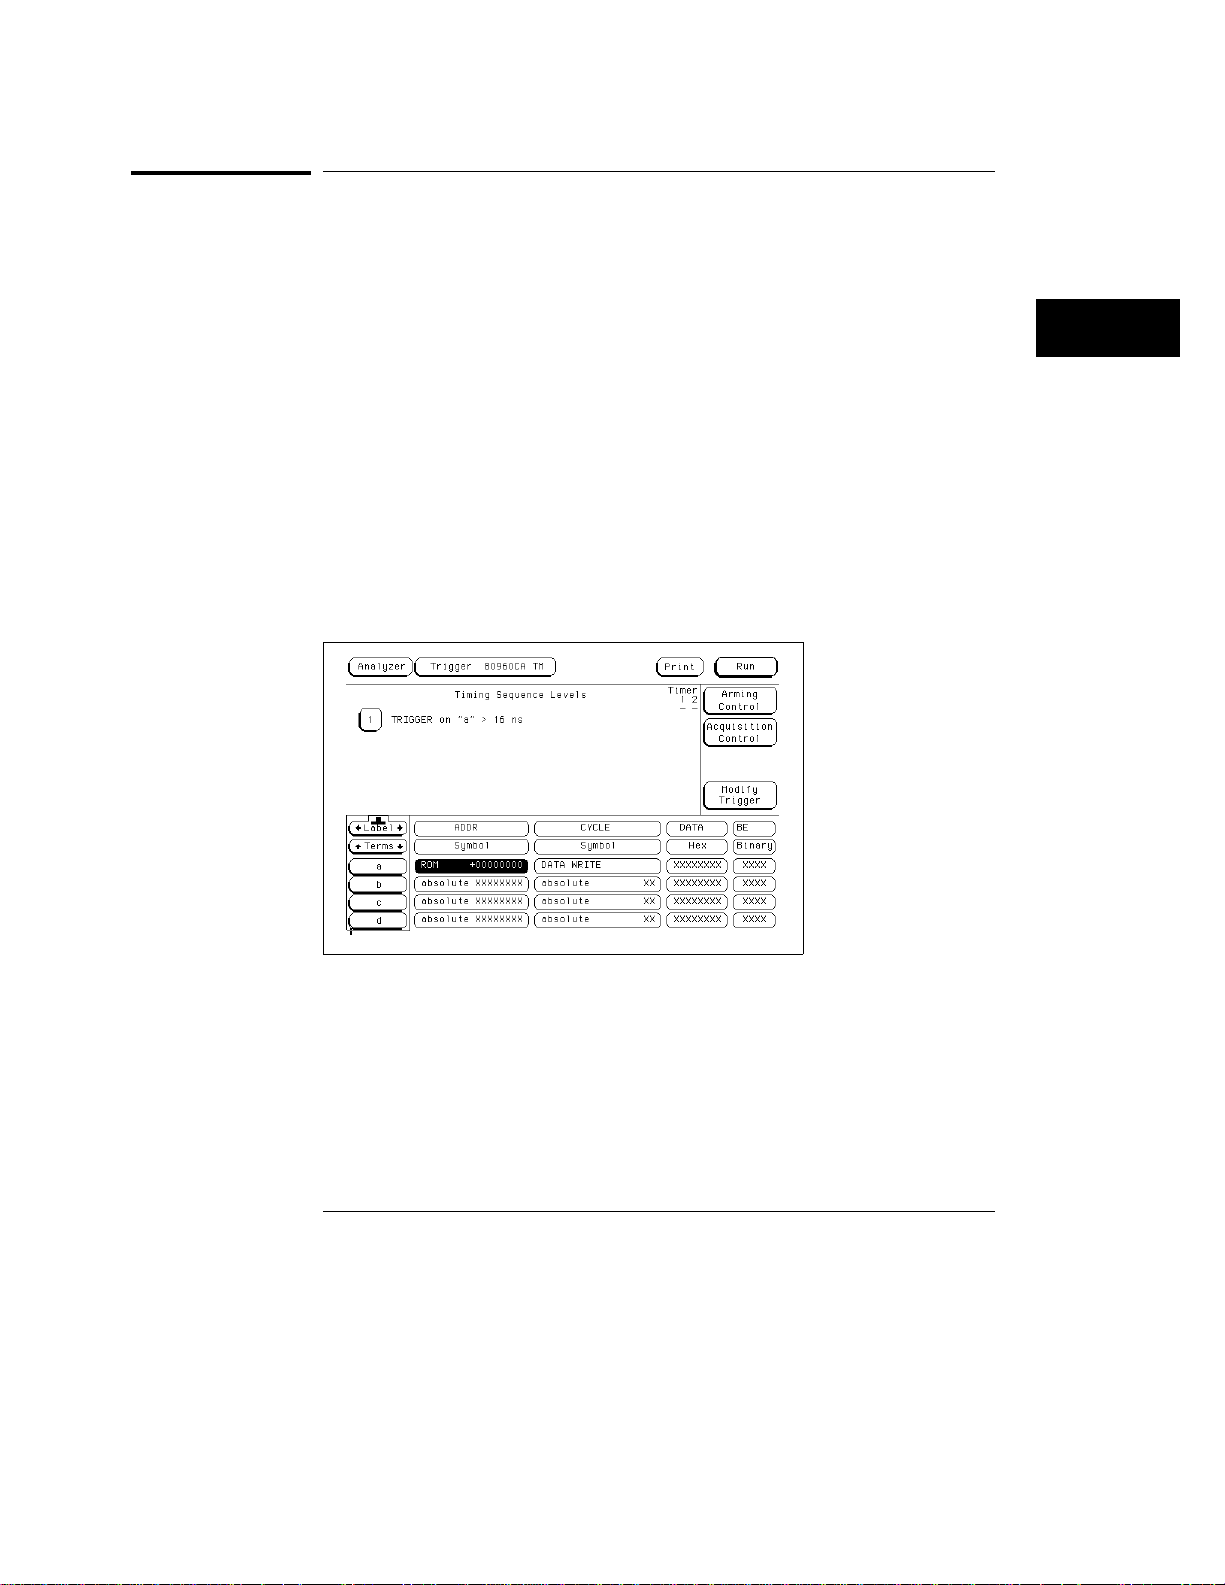
example a protected address on the address bus and a write on the read/
write line, define both values on the same term. See the figure below.
Press Done.
3
Term "a" Defined as a Data Write to Read-Only Memory
4–5
Page 56
Using the Trigger Menu
To change the trigger specification
To change the trigger specification
Most triggers use terms other than "a." Even a simple trigger might use
additional terms to set conditions on the actual trigger. To use these terms,
you must include them in the trigger sequence specification.
In the Trigger menu, select the number beside the specific level you
1
want to modify.
A Sequence Level menu pops up. It shows the current specification for that
trigger level.
Select the field you want to change.
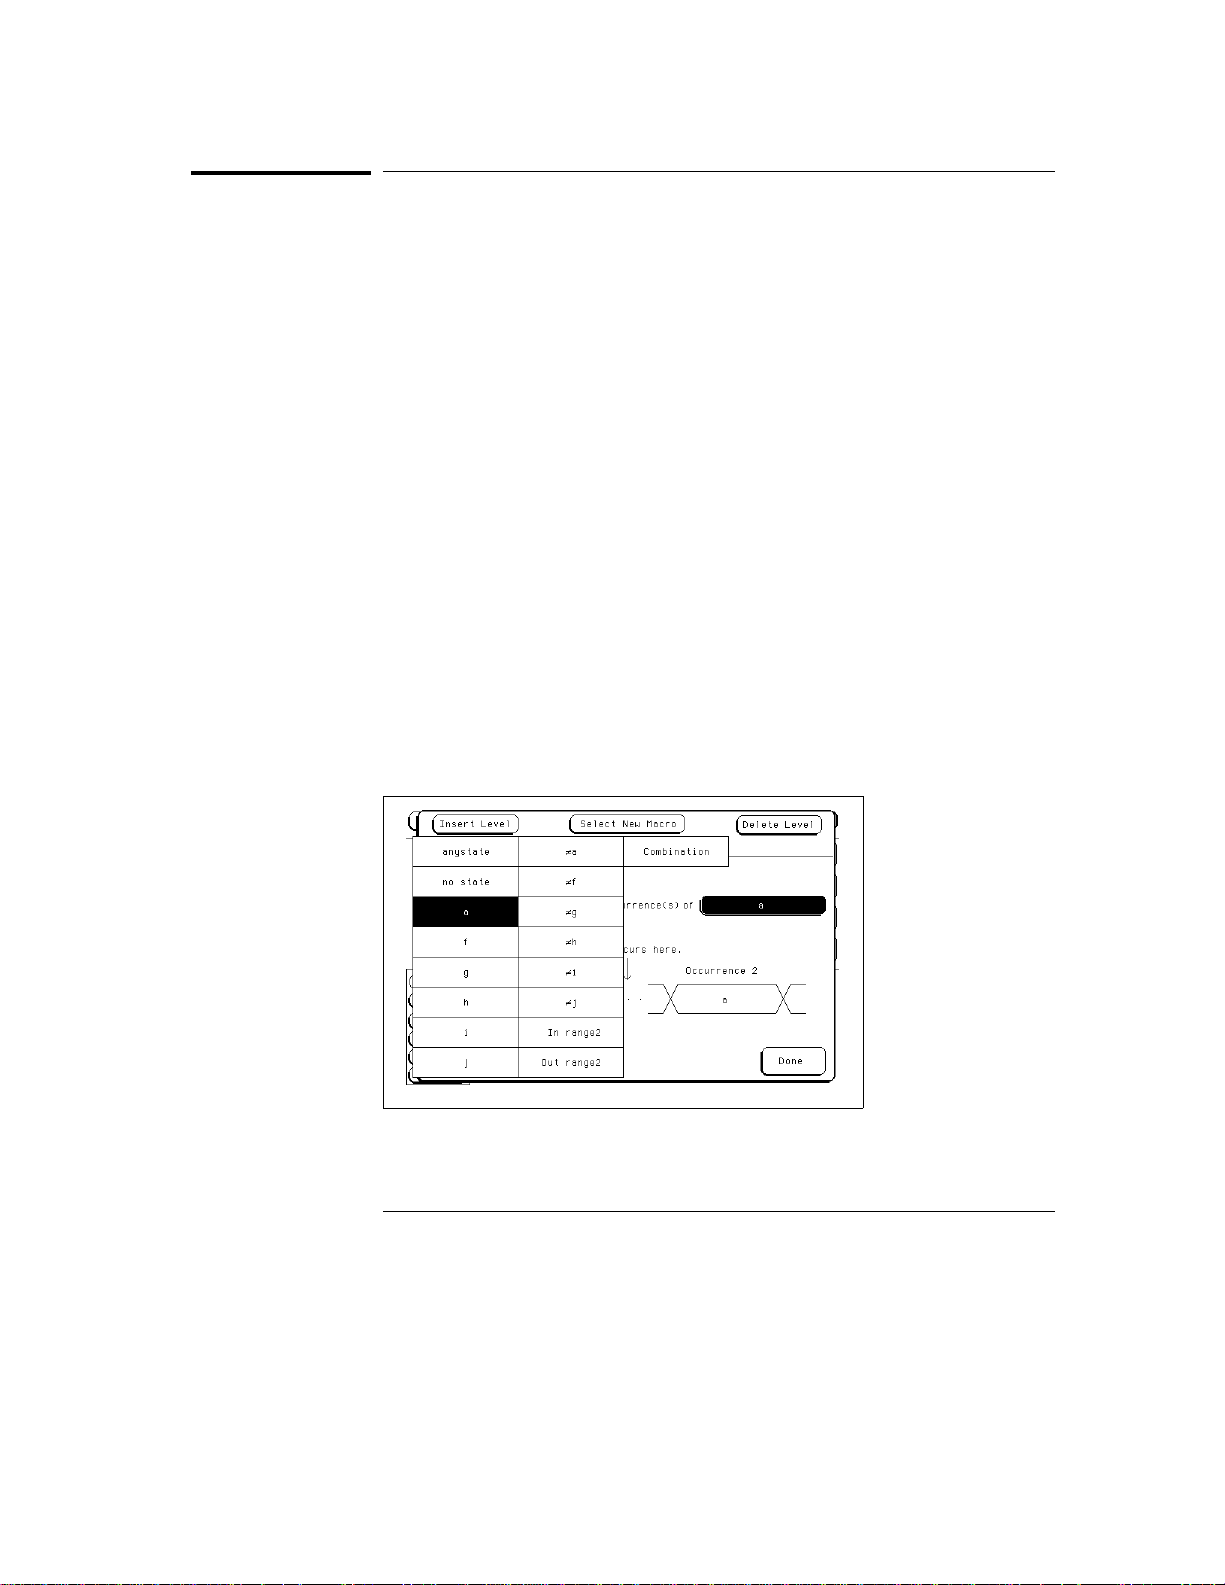
2
In the top row of the pop-up menu are three action fields: Insert Level,
Select New Macro, and Delete Level. The next section describes the fields in
detail. The fields after "While storing," "TRIGGER on," and "Else on" are
completed with trigger terms. Selecting these fields pops up a menu of terms.
Select the term you want to use from the pop-up menu, or enter a
3
new value, as appropriate to the field.
Selecting "Combination" pops up a menu to define a term combination. The
combination mechanism is discussed in "Resource terms" in the Trigger Menu
in Chapter 7 and "The Trigger Sequence" in Chapter 9.
If you have renamed a term, that name is automatically used everywhere the
term would appear.
Select Done, repeatedly, until you are back at the Trigger menu.
4
Term Selection Pop-up Menu
4–6
Page 57

Changing the Trigger Sequence
Most measurements require more complicated triggers to better filter
information. From the basic trigger, you can:
• Add sequence levels
• Change macros
Your logic analyzer provides a macro library to make setting up the
trigger easier. There are 12 state macros and 13 timing macros. Most
macros take more than one level internally to implement, and can be
broken down into their separate levels. You can use the levels to
design your own trigger sequences, once they are broken down.
4–7
Page 58
Using the Trigger Menu
To add sequence levels
To add sequence levels
You can add sequence levels anywhere except after the final one.
1 In the Trigger menu, select the number beside the sequence level just
after where you want to insert.
For example, if you want to insert a sequence level between levels 1 and 2,
you would select level 2. To insert levels at the beginning, select level 1.
A Sequence Level pop-up menu appears. Its exact contents depend on the
analyzer configuration and the level specification. However, all Sequence
Level pop-up menus have an Insert Level field in the upper left corner.
Select Insert Level.
2
Another pop-up menu offers the choices of Cancel, Before, or After. If the
level you started from was the last level, After will not appear.
Select Before.
3
The Trigger Macro pop-up menu replaces the Sequence Level one. The
macros available depend on whether the analyzer is configured as state or
timing.
Use the knob to highlight a macro, and select Done.
4
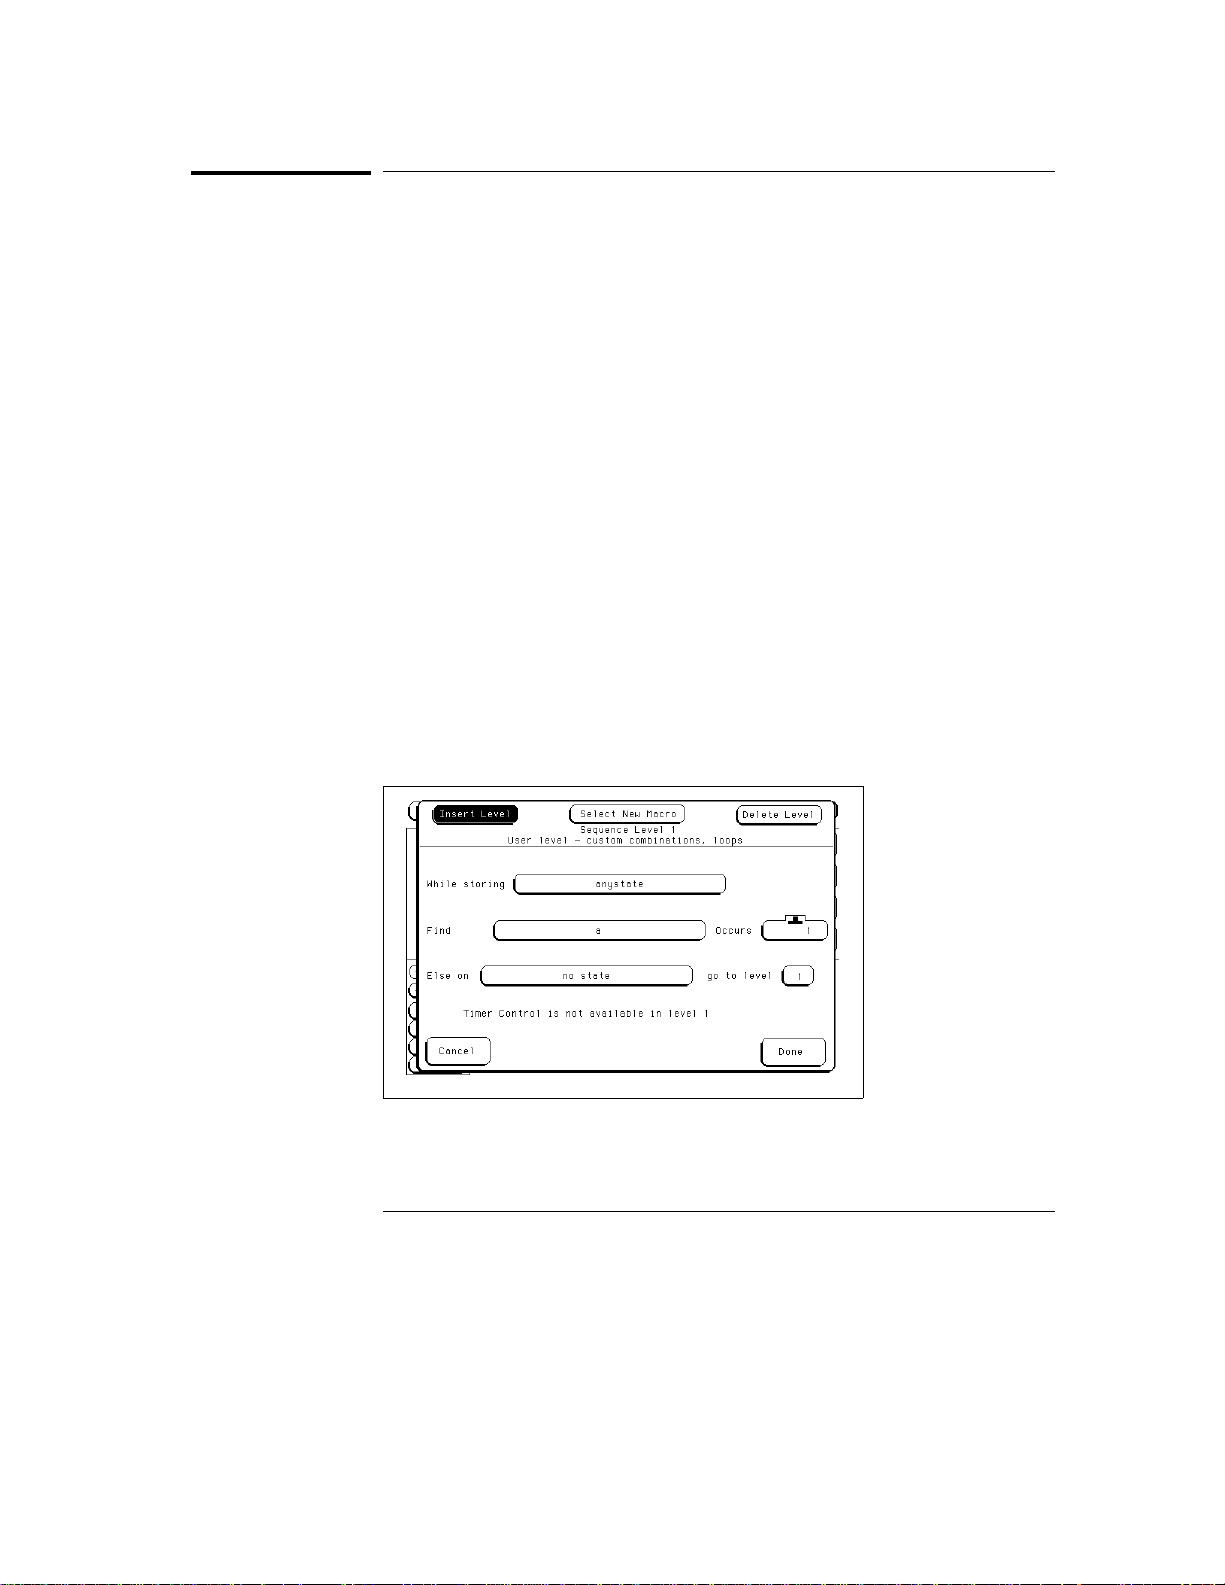
A new Sequence Level pop-up menu appears. Its contents reflect the macro
you just selected. The figure below shows a user macro for a state analyzer.
Fill in the fields and select Done.
5
Sequence Level Pop-up Menu
4–8
Page 59

Using the Trigger Menu
To change macros
To change macros
You do not need to add and delete levels just to change a level’s macro. You
can do this from within the Sequence Level pop-up menu.
From the Trigger menu, select the sequence level number of the
1
sequence level you want to modify.
A Sequence Level pop-up menu appears. Its contents reflect the current
macro.
Choose "Select New Macro".
2
The Trigger Macro pop-up menu replaces the Sequence Level menu. The
macros available depend on whether the analyzer is configured as state or
timing.
Use the knob to highlight the macro you want, and select Done.
3
A new Sequence Level pop-up menu appears. Its contents reflect the macro
you just selected. The wording of this screen is very similar to the macro
description, and the line drawing demonstrates what the macro is measuring.
Select the appropriate assignment fields and insert the desired
4
predefined terms, numeric values, and other parameter fields
required by the macro. Select Done.
For State and State Compare analyzers, the final level must always be a user
level.
See Also "Timing Trigger Macro Library" and "State Trigger Macro Library" in Trigger
Menu in Chapter 7 for a complete listing of macros.
4–9
Page 60

Setting Up Time Correlation between Analyzers
There are two possible combinations of analyzers: state and state, and
state and timing*. Timing and timing is not possible because the
Analyzer Configuration menu only permits one analyzer at a time to
be configured as a timing analyzer. For either combination, time
correlation is necessary for interleaving and mixed display.
Time correlation is useful when you want to store different sorts of
data for each trace, but see how they are related. For instance, you
could set up a timing and a correlated state analyzer and see if setup
and hold times are being met. Or, you could set up two state analyzers
and have one watch normal program execution, and the other watch
the control and status lines.
Time correlation requires that state analyzers store time tags. You set
the state analyzer to store time tags by turning on Count Time in the
Analyzer Trigger menu. The timing analyzer already stores time tags
when it samples data.
See Also "Special Displays" in Chapter 5 for more information on interleaving
and mixed display.
* "State" also includes State Compare.
4–10
Page 61

Using the Trigger Menu
To set up time correlation between two state analyzers
To set up time correlation between two state analyzers
To correlate the data between two state analyzers, both must have Count
Time turned on in their Trigger menus. Although both have Count State
available, it is not possible to correlate data based on states even when they
are identically defined.
In the Analyzer Trigger menu, select Count.
1
Count may be set to Count Off, Count Time, or Count States. Selecting the
field causes a pop-up menu to appear.
Select the field after Count and select Time.
2
A warning may appear about reduced memory. It will not prevent you from
changing Count to Count Time.
Select Done.
3
4 Repeat steps 1 through 3 for the other state analyzer.
Now when you acquire data you will be able to interleave the listings.
To set up time correlation between a timing and a state analyzer
To set up time correlation between a timing and a state analyzer, only the
state analyzer needs to have Count Time turned on. The timing analyzer
automatically keeps track of time.
In the State Analyzer Trigger menu, select Count.
1
Count may be set to Count Off, Count Time, or Count States. Selecting the
field causes a pop-up menu to appear.
Select the field after Count and select Time.
2
A warning may appear about reduced memory. It will not prevent you from
changing Count to Count Time.
Select Done.
3
Now when you acquire data you will be able to set up a mixed display.
4–11
Page 62

Arming and Additional Instruments
Occasionally, you may need to start the analyzer acquiring data when
another instrument detects a problem. Or, you may want to have the
analyzer itself arm another measuring tool. This is accomplished from
the Arming Control field of the Analyzer Trigger menu.
To arm another instrument
1 Attach a BNC cable from the External Trigger Output port on the
back of the logic analyzer to the instrument you want to trigger.
The External Trigger Output port is also referred to as "Port Out." It uses
standard TTL logic signal levels, and will generate a rising edge when trigger
conditions are met.
In the Analyzer Trigger menu, select Arming Control.
2
Arming Control is below the Run button.
Select the field next to Arm Out, and choose PORT OUT from the list.
3
4 If you are using both analyzers, set the "Arm Out sent from" field in
the upper right corner.
This field does not appear if only one analyzer is configured.
The selected analyzer will send the arm signal when it finds its trigger. If the
OR’d Trigger field is on, the first analyzer that finds its trigger will trigger the
other analyzer, which has the effect of sending the Arm Out signal, regardless
of whether the intended trigger was seen.
Select Done.
5
When you make a measurement, the analyzer will send an arm signal through
the External Trigger Output when the analyzer finds its trigger.
4–12
Page 63

CAUTION
Using the Trigger Menu
To receive an arm signal from another instrument
To receive an arm signal from another instrument
When you set the analyzer to wait for an arm signal, it does not react to data
that would normally trigger it until after it has received the arm signal. You
can send the arm signal to any of the Trigger Sequence levels, but it will go
to level 1 unless you change it. Setting up the analyzer to receive an arm
signal is more efficient when the sequence levels are already in place.
Connect a BNC cable from the instrument which will be sending the
1
signal to the External Trigger Input port on the back of the logic
analyzer.
Do not exceed 5.5 volts on the External Trigger Input.
The External Trigger Input port is also referred to as "Port In." It uses
standard TTL logic signal levels, and expects a rising edge as input.
In the Analyzer Trigger menu, select Arming Control.
2
Arming Control is below the Run button.
3 Select the leftmost field, and choose PORT IN.
The field is not unlabeled but shows either Run or PORT IN. It has arrows
going from it to the analyzer(s).
To change the default settings, select the analyzer field.
4
A small pop-up menu appears. To change which device the analyzer is
receiving its arm signal from, select the Run from field. To change which
sequence level is waiting for the arm signal, select the Arm sequence level
field.
Select Done until you are back at the Trigger menu.
5
Arming a logic analyzer versus OR’d t rigger
If one analyzer is set to send the PORT OUT arm, and that analyzer is also set to
wait for an arm f rom the other analyzer, the dependent analyzer does not begin
to look for its trigger event until it receives the arm signal. The first analyzer
must arm the second analyzer, and then the second analyzer must find its
trigger event before t he Arm Out is sent.
If OR’d trigger is on, the Ar m Out will be sent as soon as the first ana lyzer
triggers.
4–13
Page 64

Managing Memory
Sometimes you will need to manage your memory carefully. There are
four simple ways to control memory usage when specifying your
trigger:
• Selectively store branch conditions (State only)
• Set memory size
• Place the trigger relative to memory
• Set the sampling rates (Timing only)
4–14
Page 65
Using the Trigger Menu
To selectively store branch conditions (State only)
To selectively store branch conditions (State only)
In addition to setting up your trigger levels to store anystate, no state, or
some subset of states, you can also choose whether or not to store branch
conditions. Branch conditions are always stored by default, and can make
tracing the analyzer’s path through a complicated trigger easier. If you really
need extra memory, however, you don’t have to store the branch conditions.
You cannot set the analyzer to store only some branches in a trigger
sequence specification.
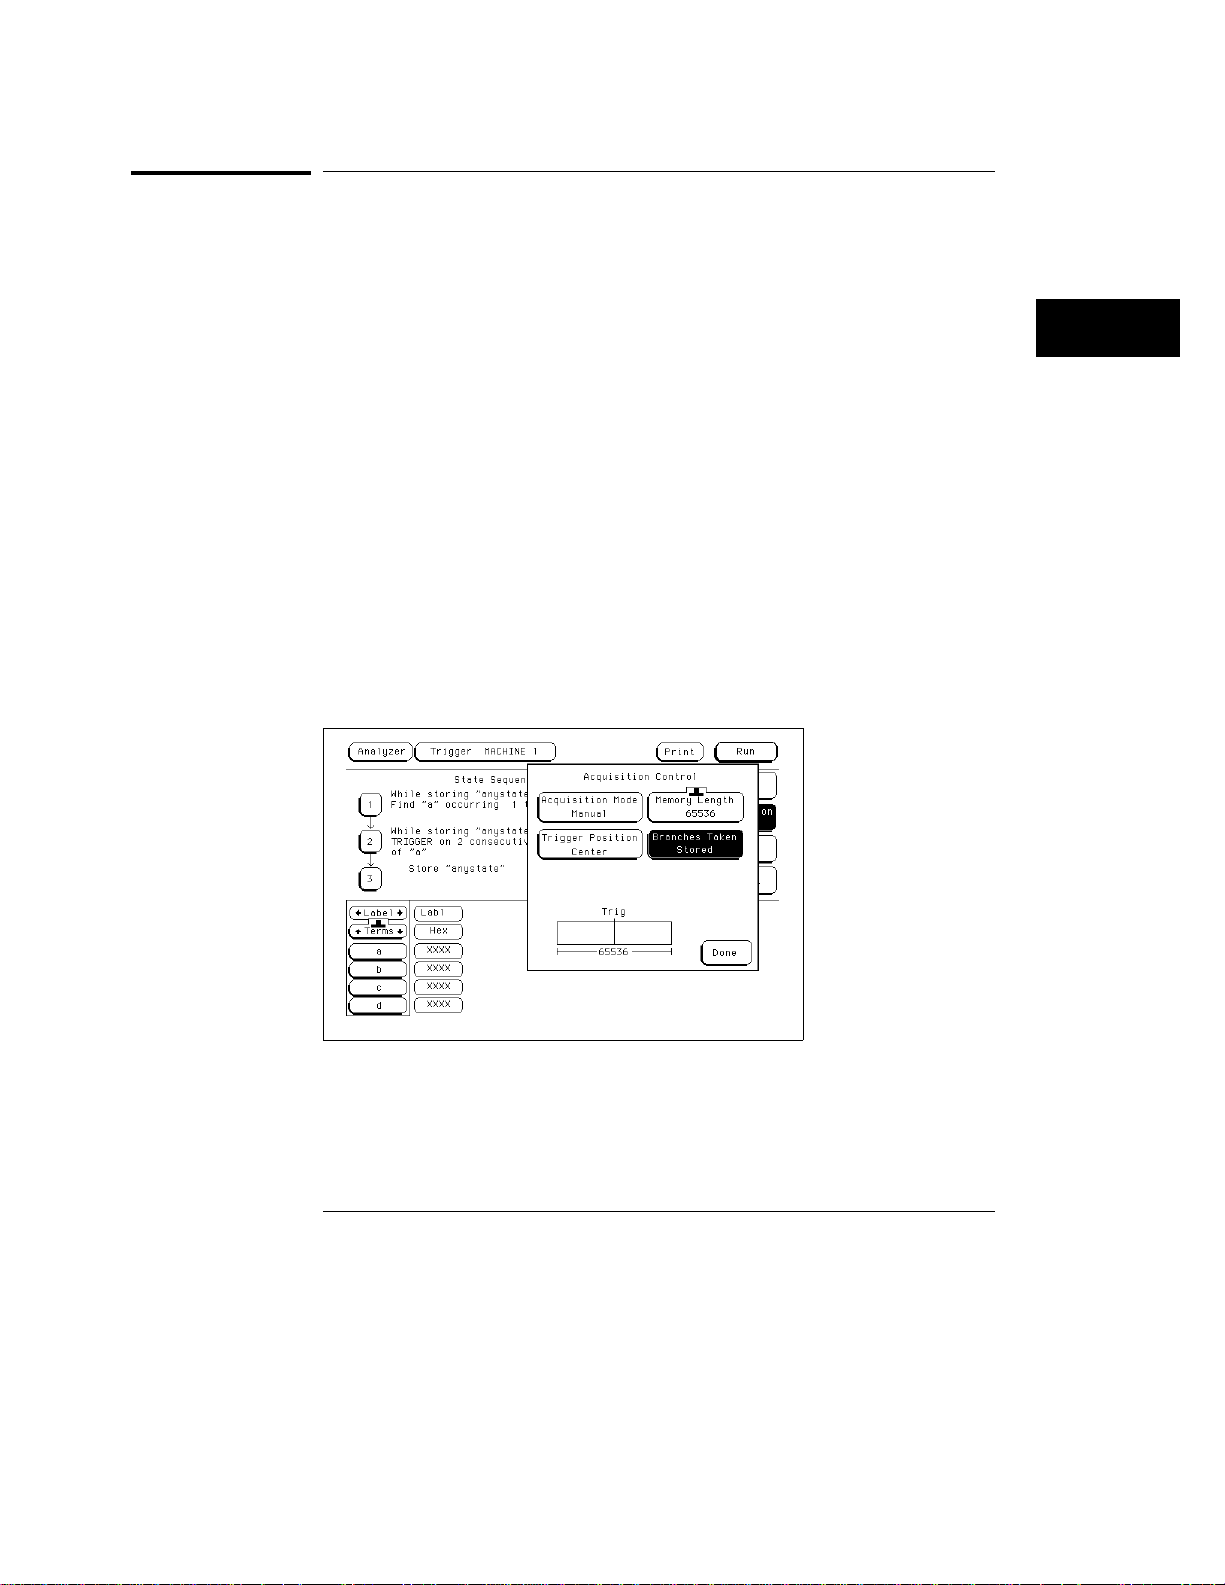
In the Analyzer Trigger menu, select Acquisition Control.
1
The Acquisition Control menu pops up. If the acquisition mode is set to
Automatic, the menu contains two fields and an explanation. If Acquisition
has been customized, it has four or five fields and a picture showing the
amount of memory and where the trigger is currently placed in memory.
If the mode is Automatic, select the field to toggle it to Manual.
2
The menu now shows four fields and a picture.
3 Select the Branches Taken Stored field.
It toggles to Branches Taken Not Stored.
4 Select Done.
Acquisition Control Pop-up Menu with Branches Field Highlighted
4–15
Page 66

Using the Trigger Menu
To set the memory length
To set the memory length
The HP 1670D-series logic analyzers provide 64K memory standard and
1M with the deep memory option. The table below shows the amount of
memory available for different modes of operation.
Typically, you will want to use small amounts of memory when you start to
troubleshoot, when you are first looking for a problem, and use deep memory
when you are searching for the root cause. Shallower memory provides
faster acquisitions, but might not have sufficient context. Deep memory
provides more context, but takes longer to fill, more time to display, and
more time for you to analyze. The Memory Length field allows you to
configure the acquisition memory to suit your needs.
In the Analyzer Trigger menu, select Acquisition Control.
1
The Acquisition Control menu pops up. If the acquisition mode is set to
Automatic, the menu contains two fields and an explanation. If Acquisition
has been customized, it has four or five fields and a picture showing the
amount of memory and where the trigger is currently placed in memory.
Select the Memory Length field.
2
Use the knob to select the memory length. Memory size can be set in powers
of 2 from 4096 to the maximum. The table below shows the maximum
memory for various modes of operation.
Select Done to exit the Acquisition Control menu.
3
Table 4-1 Maximum Memory Size
Mode Standard Memory 1M Option
Full-channel timing 65,536 (64K) 1,032,192
Half-channel timing 131,072 (128K) 2,080,768
1
State
2
State
State Compare
State Compare
1
With tags turned off or non-interleaved tags. Tags are non-interleaved if there is an
unassigned pod pair or a pod pair assigned to an analyzer that is turned off.
2
With interleaved tags .
1
2
4–16
65,536 (64K) 1,032,192
32,768 (32K) 507,904
32,768 (32K) 245,760
32,768 (32K) 114,688
Page 67
Using the Trigger Menu
To place the trigger in memory
To place the trigger in memory
In Automatic Acquisition Mode, the exact location of the trigger depends on
the trigger specification but usually falls around the center. You can
manually place it at the beginning, end, or somewhere else.
In the Analyzer Trigger menu, select Acquisition Control.
1
The Acquisition Control menu pops up. If the acquisition mode is set to
Automatic, the menu contains two fields and an explanation. If Acquisition
has been customized, it has four or five fields and a picture showing the
amount of memory and where the trigger is currently placed in memory.
If the mode is Automatic, select the field to toggle it to Manual.
2
The menu now shows four fields and a picture.
3 Select the Trigger Position field.
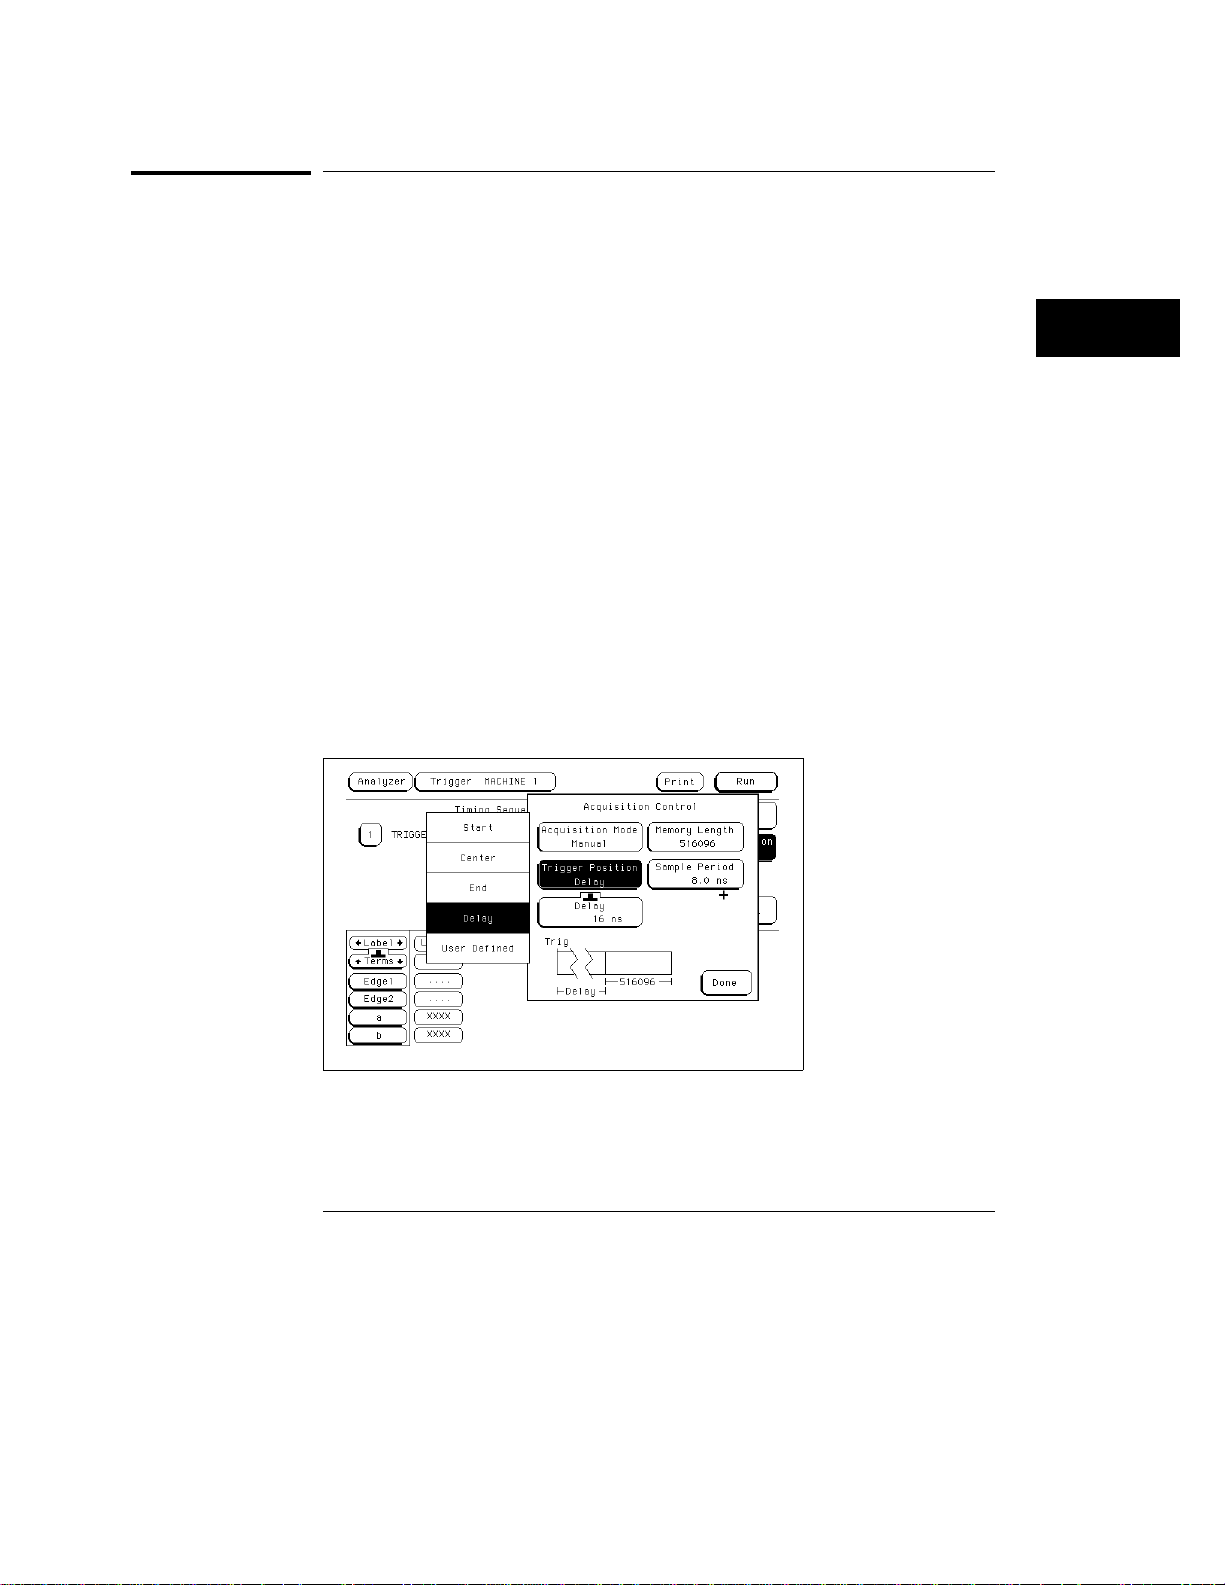
A list of choices appears, as shown in the timing trigger example below.
4 Select the appropriate entry for your needs.
Start, Center, and End place the trigger respectively at the beginning, middle,
and end of the memory. Delay, available in timing analyzers only, causes the
analyzer to not save any data before the time delay has elapsed. User Defined
calls up a fifth field where you specify exactly where you want the trigger.
Select Done.
5
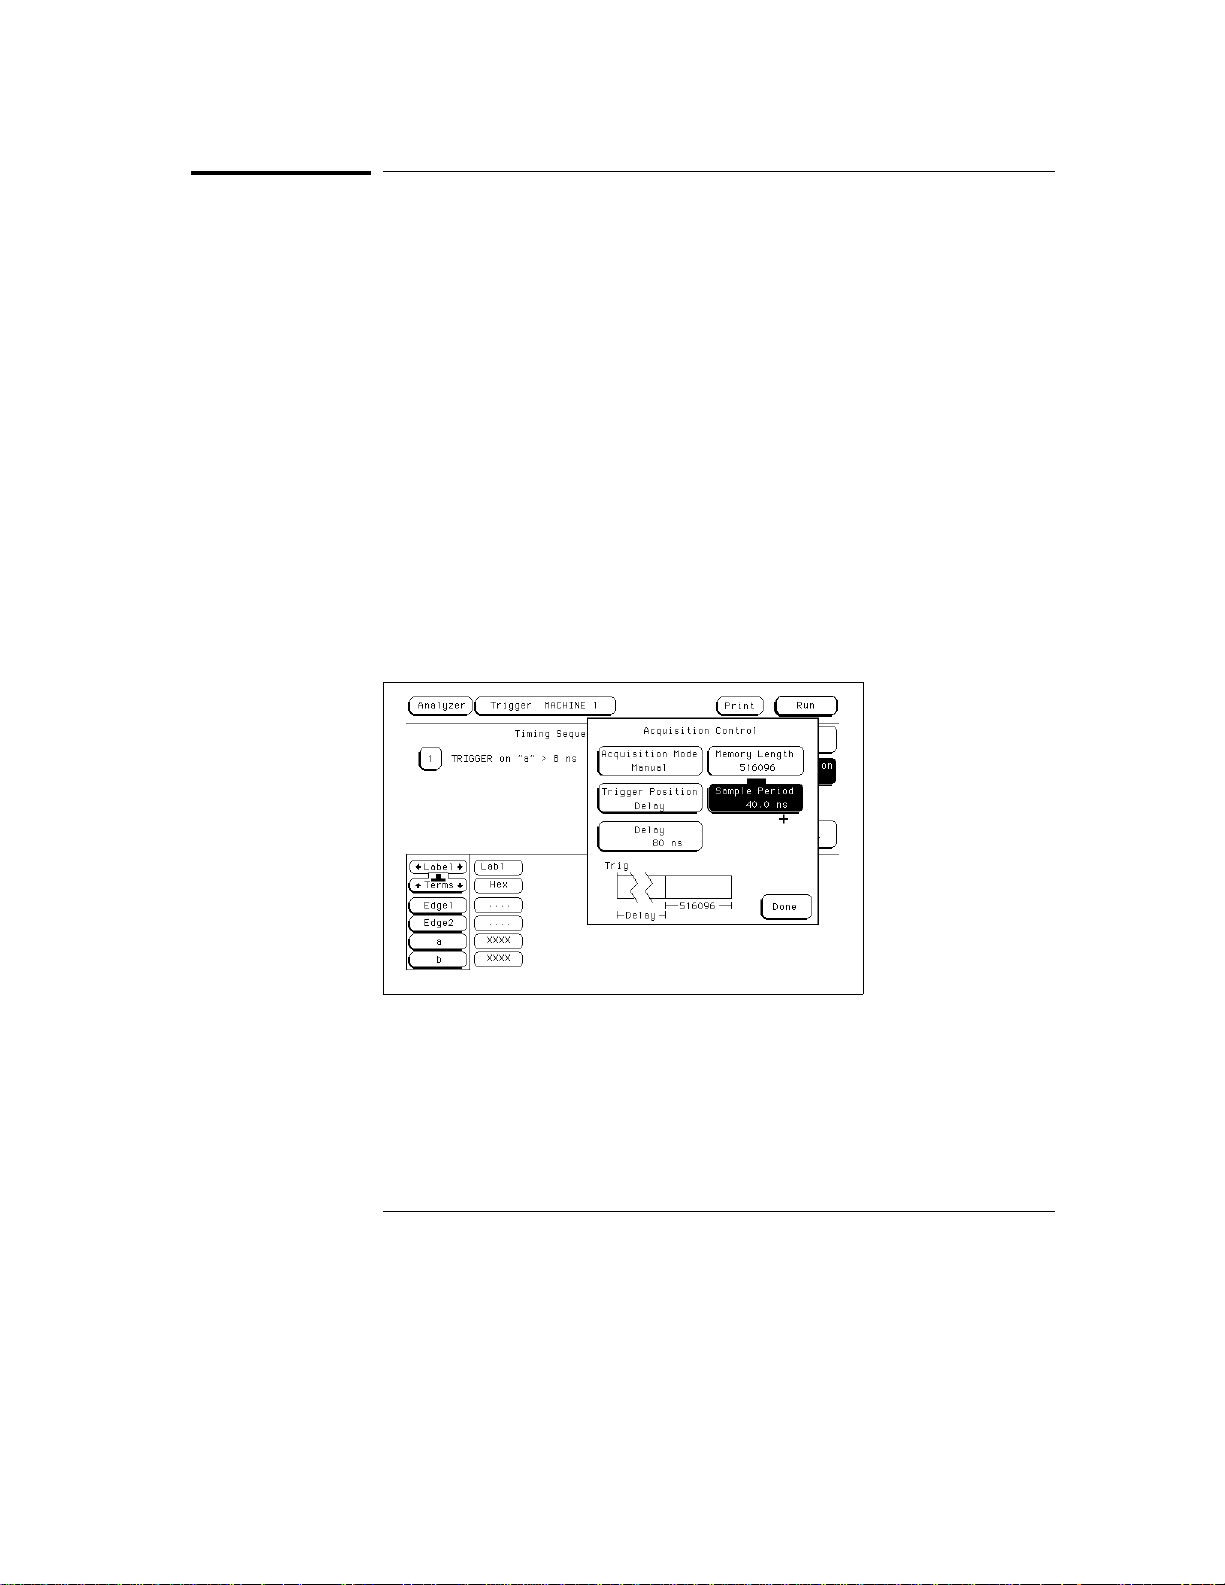
Acquisition Control Menu with Trigger Position Pop-up for a Timing Analyzer
4–17
Page 68
Using the Trigger Menu
To set the sampling rates (Timing only)
To set the sampling rates (Timing only)
A timing analyzer samples the data based on its own internal clock. A short
sample period provides more detail about the device under test; a long
sample period allows more time before memory is full. However, if the
sample period is too large, some information may be missed.
In the Analyzer Trigger menu, select Acquisition Control.
1
The Acquisition Control menu pops up. If the acquisition mode is set to
Automatic, the menu contains two fields and an explanation. If Acquisition
has been customized, it has four or five fields and a picture showing the
amount of memory and where the trigger is currently placed in memory.
If the mode is Automatic, select the field to toggle it to Manual.
2
The menu now shows four fields and a picture.
3 Set the Sample Period field using the knob.
4 Select Done.
Next time you take a measurement, the analyzer will sample at the rate you
entered.
Acquisition Control Menu with Sample Period Selected
4–18
Page 69
5
Triggering Examples
Page 70

Triggering Examples
As you begin to understand a problem in your system, you may realize
that certain conditions must occur before the problem occurs. You
can use sequential triggering to ensure that those conditions have
occurred before the analyzer recognizes its trigger and captures
information.
If you are not familiar with the trigger menus, read through the
previous chapter,"Using the Trigger Menu."
5-2
Page 71

Single-Machine Trigger Examples
The following examples require only a single analyzer to make
measurements. Sequence specifications are given in the form you see
within the sequence levels, but the illustrations show the complete,
multi-level sequence specification.
Although all the examples are case-specific, terms are named in a way
that highlights their roles in solving the trigger problem. You can
easily apply the examples to your specific instance by changing the
specific values assigned to the trigger terms.
5-3
Page 72
Triggering Examples
To store and time the execution of a subroutine
To store and time the execution of a subroutine
Most system software is composed of a hierarchy of functions and
procedures. During integration, testing, and performance evaluation, you
want to look at specific procedures to verify that they are executing correctly
and that the implementation is efficient. The analyzer allows you to do this by
triggering on entry to the address range of the subroutine, and counting the
elapsed time since the trigger state.
Go to the state analyzer’s Trigger menu.
1
2 Set Count to Time.
3 Define a range term, such as Range1, to represent the address range
of the particular subroutine.
You may need to examine the structure of your code to help determine this.
If your subroutine calls are really procedure calls, there is likely to be some
code at the beginning of the routine that adjusts the stack for local variable
allocation. This will precede the address of the first statement in the
procedure. If your subroutine has no local storage and is called by a jump or
branch, the first statement will also be the entry address.
Under State Sequence Levels, enter the following sequence
4
specification:
While storing "no stateno state"" TRIGGER on "In_Range1" Occurs 1 Else on "noTRIGGER on "In_Range1" Occurs 1 Else on "no
•
state" go to level 1state" go to level 1
While storing "In_Range1" Then find "Out_Range1" Occurs 1 Else on "no
•
state" go to level 2
Store "no state" on "no state" go to level 1
•
Prefetch Instructions
For processors that prefetch instructions or have pipelined architectures, you
may want to a dd part or all of the depth of the pipeline to the start address for
In_Range1 to ensure that the analyzer does not trigger on a prefetched but
unexecuted state.
5-4
Page 73
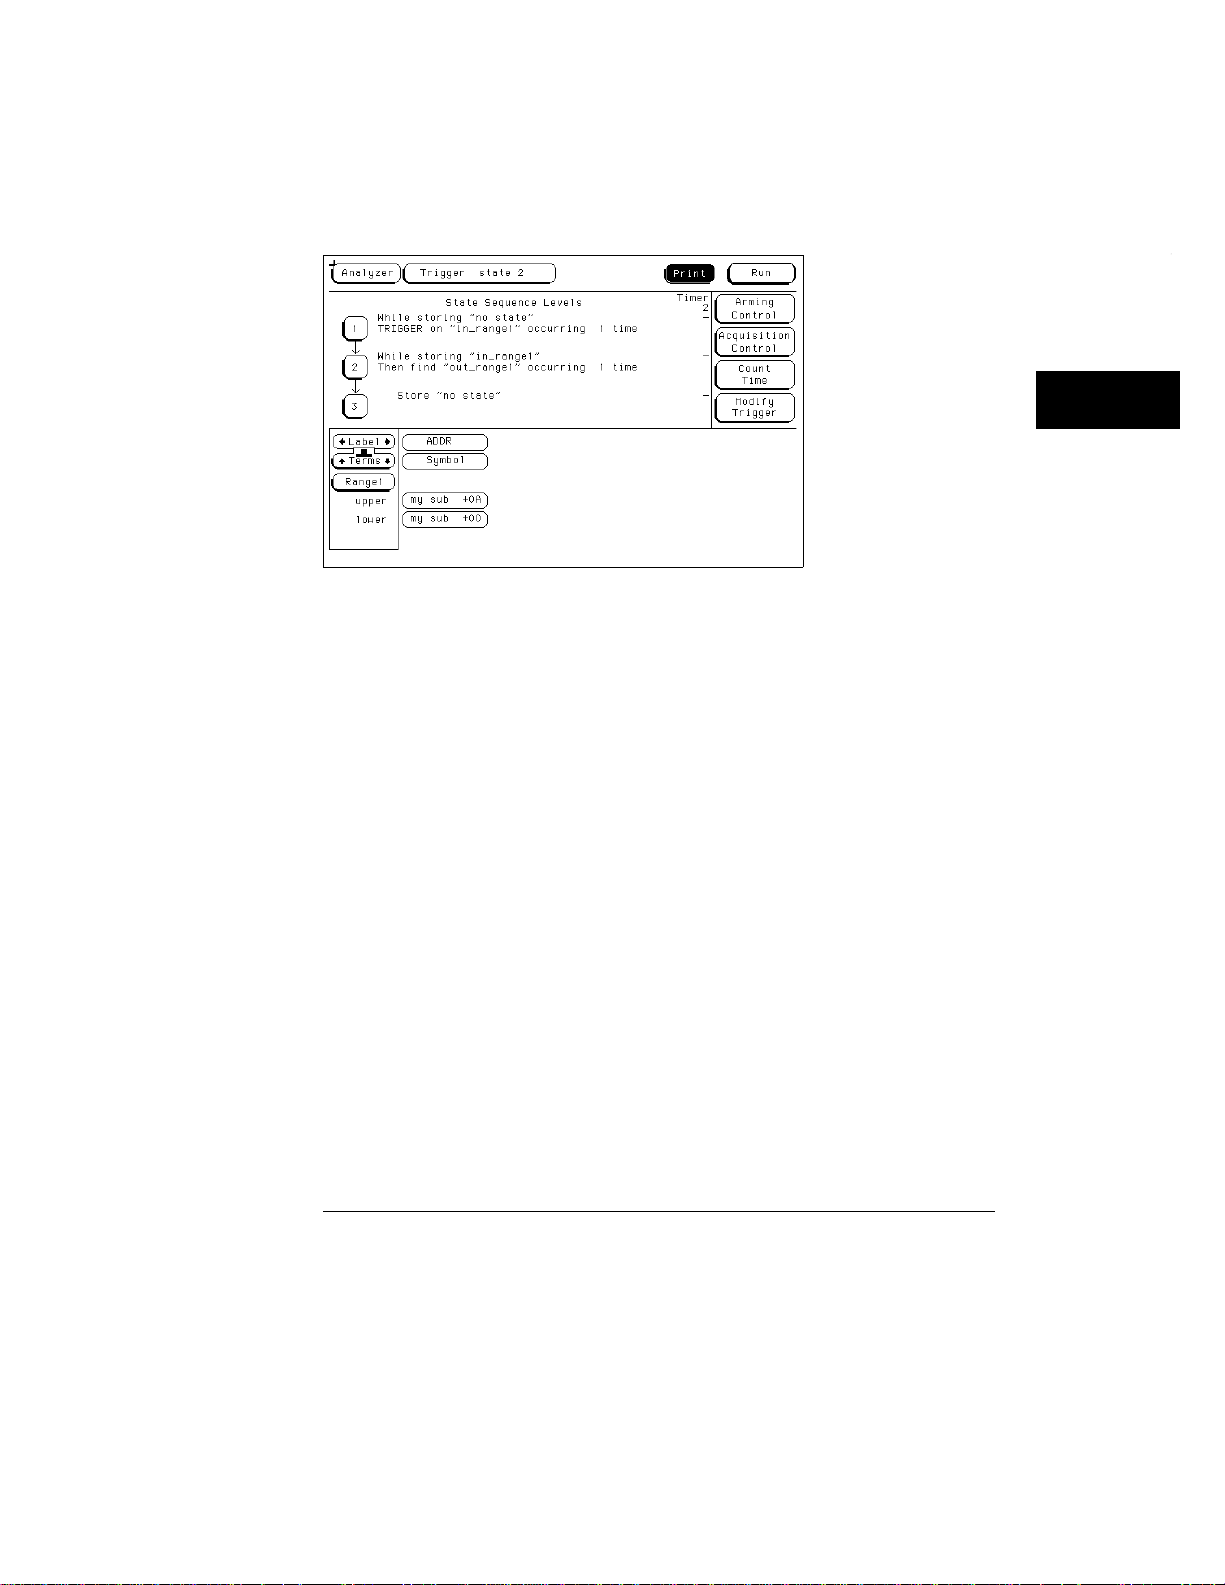
Triggering Ex amples
To store and time the execution of a subroutine
The figure below shows what you would see on your analyzer screen after
entering the sequence specification in step 4.
Trigger Setup for Storing and Timing Execution of a Subroutine
Suppose you want to trigger on entry to a routine called MY_SUB. You can
create a symbol from the address of MY_SUB in the Format menu, allowing
you to reference the symbol name when setting up the trace specification.
Assume that MY_SUB extends for 0A hex locations. You can set up the
trigger sequence as shown in the display above.
5-5
Page 74
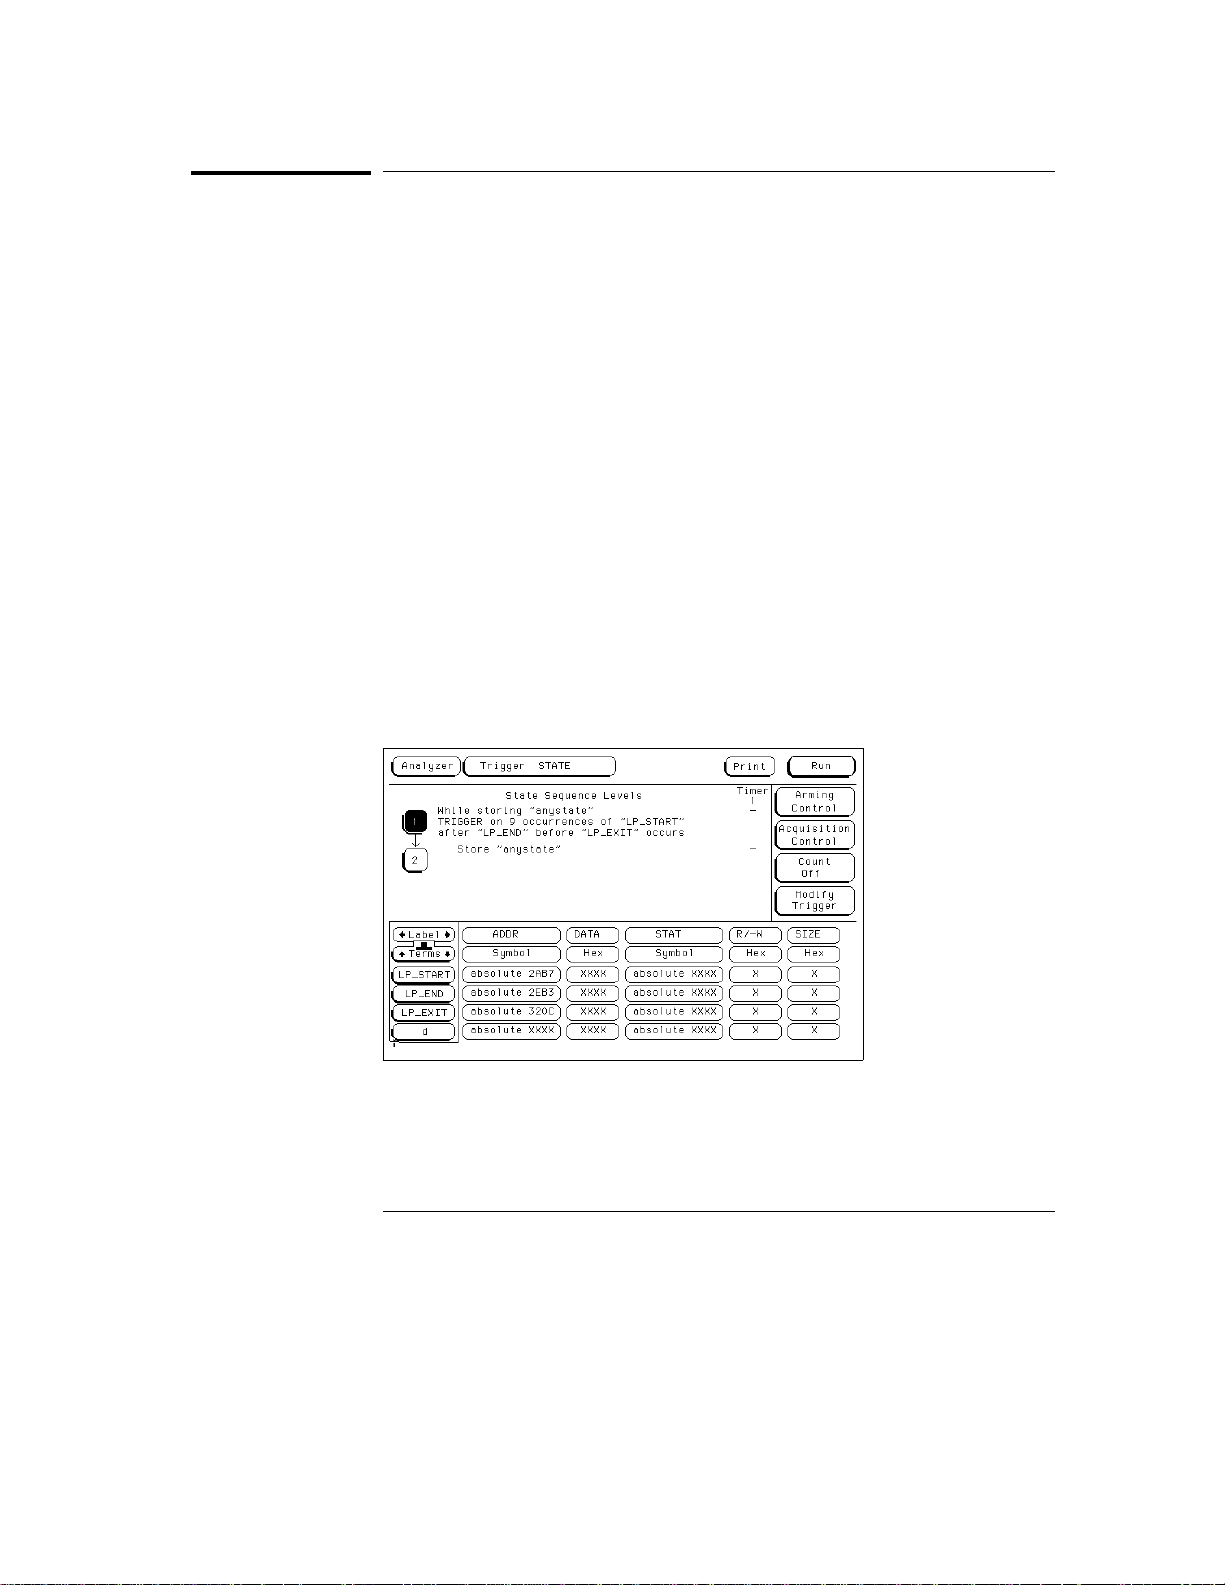
Triggering Examples
To trigger on the nth iteration of a loop
To trigger on the nth iteration of a loop
Traditional debugging requires print statements around the area of interest.
This is not possible in most embedded systems designs, but the analyzer
allows you to view the system’s behavior when a particular event occurs.
Suppose that your system behaves incorrectly on the last iteration of a loop,
which, in this instance, happens to be the 10th iteration. You can use the
analyzer’s triggering capabilities to capture that iteration and subsequent
processor activity.
Go to the state analyzer’s Trigger menu.
1
2 Define the terms LP_START and LP_END to represent the start and
end addresses of statements in the loop, and LP_EXIT to represent
the first statement executed after the loop terminates.
3 Change State Sequence Level 1’s macro to "Find event2 n times after
event1 before event3 occurs."
4 In the pop-up menu, enter the following sequence specification:
While storing anystate Find "LP_START" "9" times after "LP_END" beforeLP_START" "9" times after "LP_END" before
•
"LP_EXIT" occurs."LP_EXIT" occurs.
You should use your value for n-1 instead of "9" in the sequence specification9" in the sequence specification
above. above.
Trigger Setup for Tr iggering on the 10th Iteration of a Loop
5-6
Page 75

Triggering Ex amples
To trigger on the nth iteration of a loop
The specification has some advantages and a potential problem.
The advantages are that a pipelined processor won’t trigger until it has
•
executed the loop 10 times. Requiring LP_END to be seen at least once
first ensures that the processor actually entered the loop; then, 9 more
iterations of LP_STARTare really the 10th iteration of the loop. Also, no
trigger occurs if the loop executes less than 10 times — the analyzer sees
LP_EXIT and restarts the trigger sequence.
The potential problem is that LP_EXIT may be too near LP_END, and thus
•
appears on the bus during a prefetch. The analyzer will constantly restart
the sequence and will never trigger. The solution to this problem depends
on the structure of your code. You may need to experiment with different
trigger sequences to find one that captures only the data you want to view.
5-7
Page 76

Triggering Examples
To trigger on the nth recursive call of a recursive function
To trigger on the nth recursive call of a recursive
function
1 Go to the state analyzer’s Trigger menu.
2 Define the terms CALL_ADD, F_START, and F_END to represent the
called address of the recursive function, and the start and end
addresses of the function. Define F_EXIT to represent the address of
the first program statement executed after the original recursive call
has terminated.
Typically, CALL_ADD is the address of the code that sets up the activation
record on the stack, F_START is the address of the first statement in the
function, and F_END is the address of the last instruction of the function,
which does not necessarily correspond to the address of the last statement. If
the start of the function and the address called by recursive calls are the
same, or you are not interested in the function initialization code, you can use
F_START for both CALL_ADD and F_START.
Change State Sequence Level 1’s macro to "Find event2 n times after
3
event1 before event3 occurs."
4 In the pop-up menu, enter the following sequence specification:
While storing anystate Find "CALL_ADD" "9" times after "F_START"CALL_ADD" "9" times after "F_START"
•
before "F_EXIT" occurs.before "F_EXIT" occurs.
You should use your value for n-1 instead of "9" in the specification.9" in the specification.
Insert another sequence level before the current one. Select the User
5
Level macro and enter the following specification:
While storing "no state" Find "F_END" occurs "1" Else on "no state" go tono state" Find "F_END" occurs "1" Else on "no state" go to
•
level 1.level 1.
As with the trigger specification for "To trigger on the nth iteration of a loop,"To trigger on the nth iteration of a loop,"
this specification helps avoid potential problems on pipelined processors bythis specification helps avoid potential problems on pipelined processors by
requiring that the processor already be in the first recursive call beforerequiring that the processor already be in the first recursive call before
advancing the trigger sequence. Depending on the exact code used for theadvancing the trigger sequence. Depending on the exact code used for the
calls, you may need to experiment with different trigger sequences to findcalls, you may need to experiment with different trigger sequences to find
one that captures only the data you want to view.one that captures only the data you want to view.
5-8
Page 77
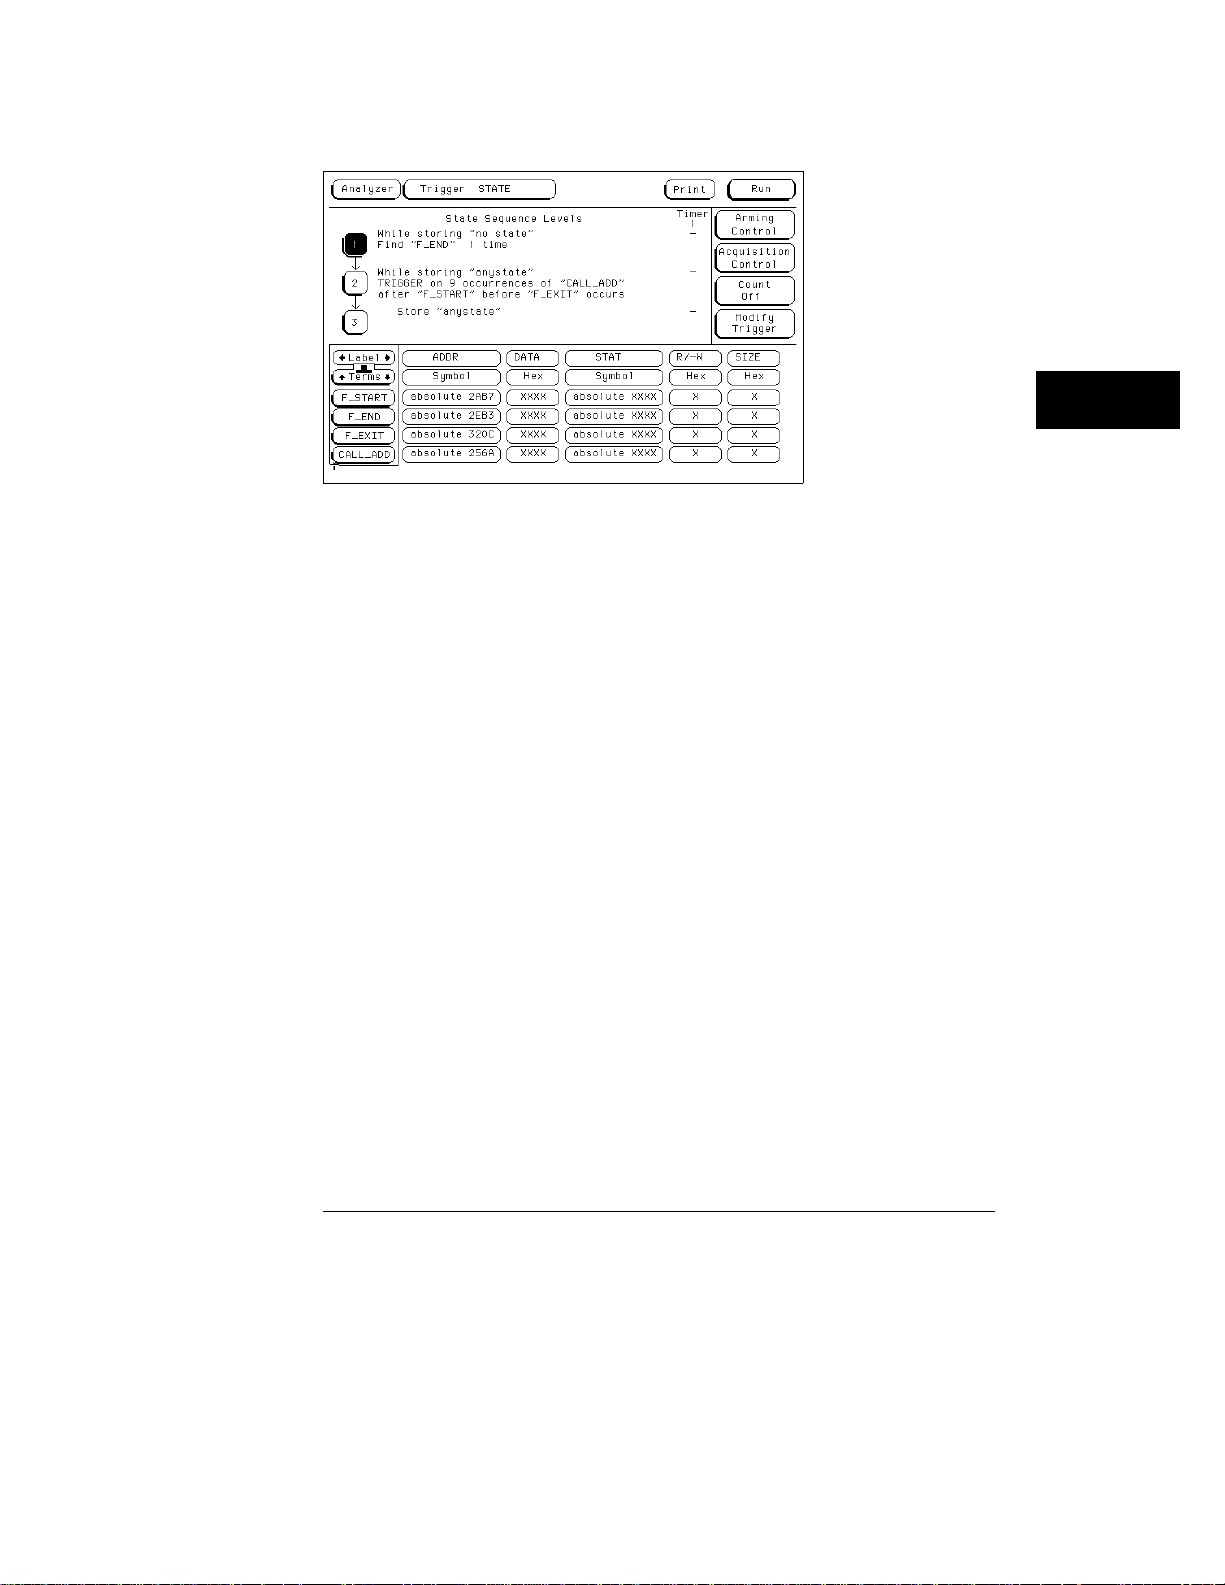
To trigger on the nth recursive call of a recursive function
Triggerin g on the 10th Call of a Recursive Function
Triggering Ex amples
5-9
Page 78
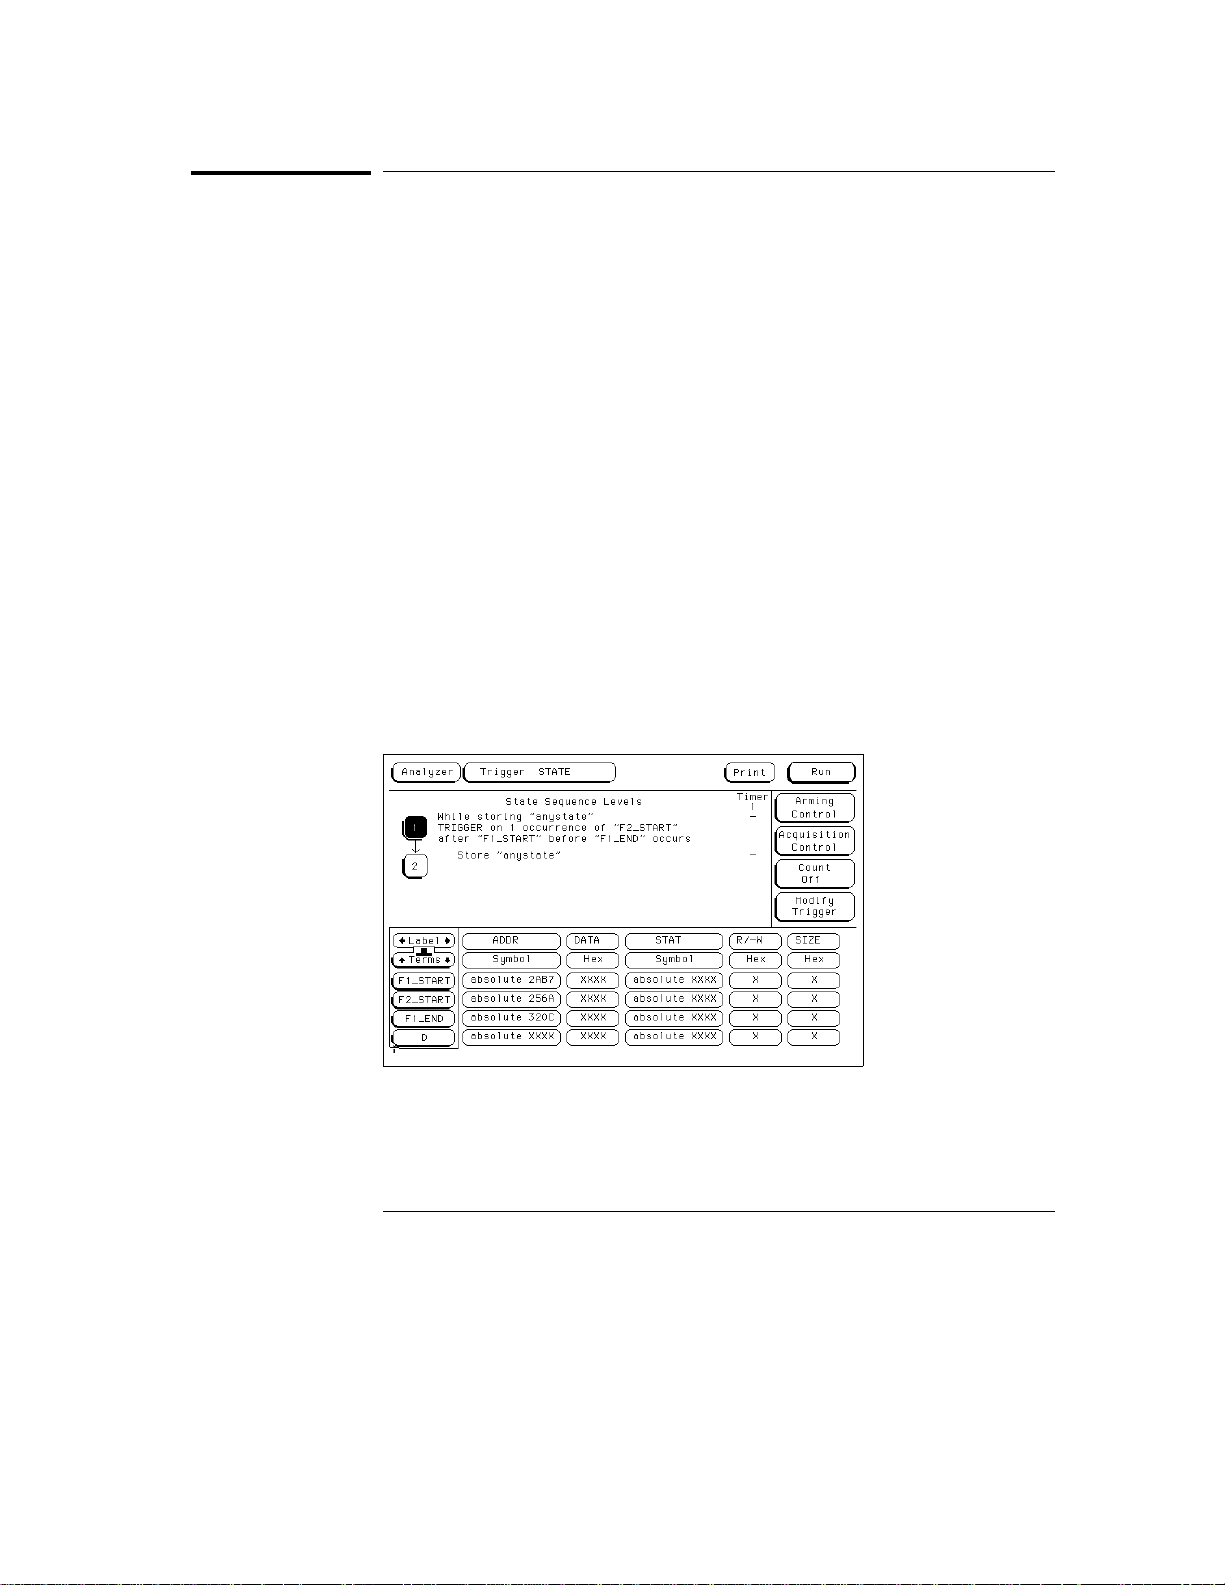
Triggering Examples
To trigger on entry to a function
To trigger on entry to a function
This sequence triggers on entry to a function only when it is called by one
particular function.
Go to the state analyzer’s Trigger menu.
1
2 Define the terms F1_START and F1_END to represent the start and
end addresses of the calling function. Define F2_START to represent
the start address of the called function.
3 Change State Sequence Level 1’s macro to "Find event2 n times after
event1 before event3 occurs."
4 In the pop-up menu, enter the following sequence specification:
While storing anystate Find "F2_START" "1" times after "F1_START"F2_START" "1" times after "F1_START"
•
before "F1_END" occurs.before "F1_END" occurs.
This sequence specification assumes there is some conditional logic in
function F1 that chooses whether or not to call function F2. Thus, if F1 ends
without the analyzer having seen F2, the sequence restarts.
The specification also stores all execution inside function F1, whether or not
F2 was called. If you are interested only in the execution of F1, without the
code that led to its invocation, you can change the storage specification from
"anystate" to "no state" for the second sequence term.anystate" to "no state" for the second sequence term.
Triggering on Entry to a Function
5-10
Page 79
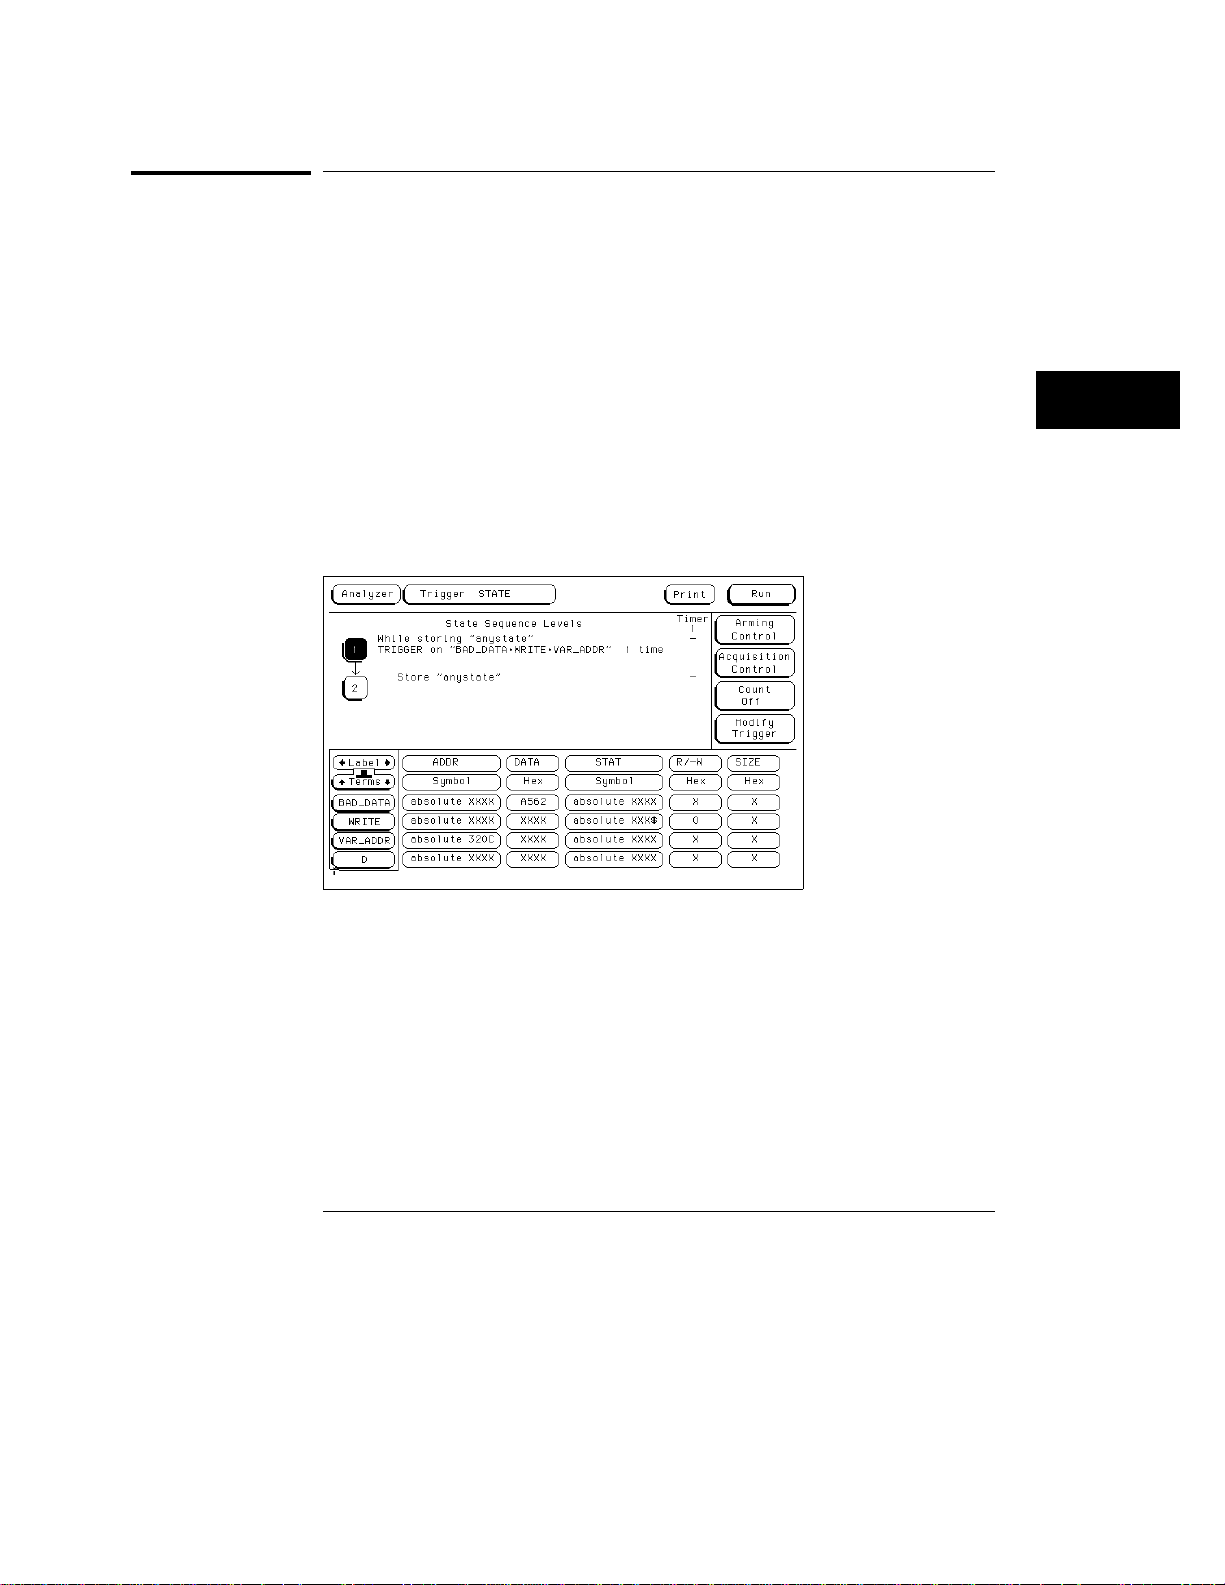
Triggering Ex amples
To capture a write of known bad data to a particular variable
To capture a write of known bad data to a particular
variable
The trigger specification ANDs the bad data on the data bus, the write
transaction on the status bus, and the address of the variable on the address
bus.
Go to the state analyzer’s Trigger menu.
1
2 Define the terms BAD_DATA, WRITE, and VAR_ADDR to represent
the bad data value, write status, and the address of the variable.
3 Under State Sequence Level 1, enter the following sequence
specification (use the Combination trigger term):
While storing "anystate" TRIGGER on "BAD_DATA anystate" TRIGGER on "BAD_DATA •• WRITE WRITE ••
•
VAR_ADDR" Occurs "1" Else on "no state" go to level "1"VAR_ADDR" Occurs "1" Else on "no state" go to level "1"
Capturing a Bad Write to a Variable
5-11
Page 80
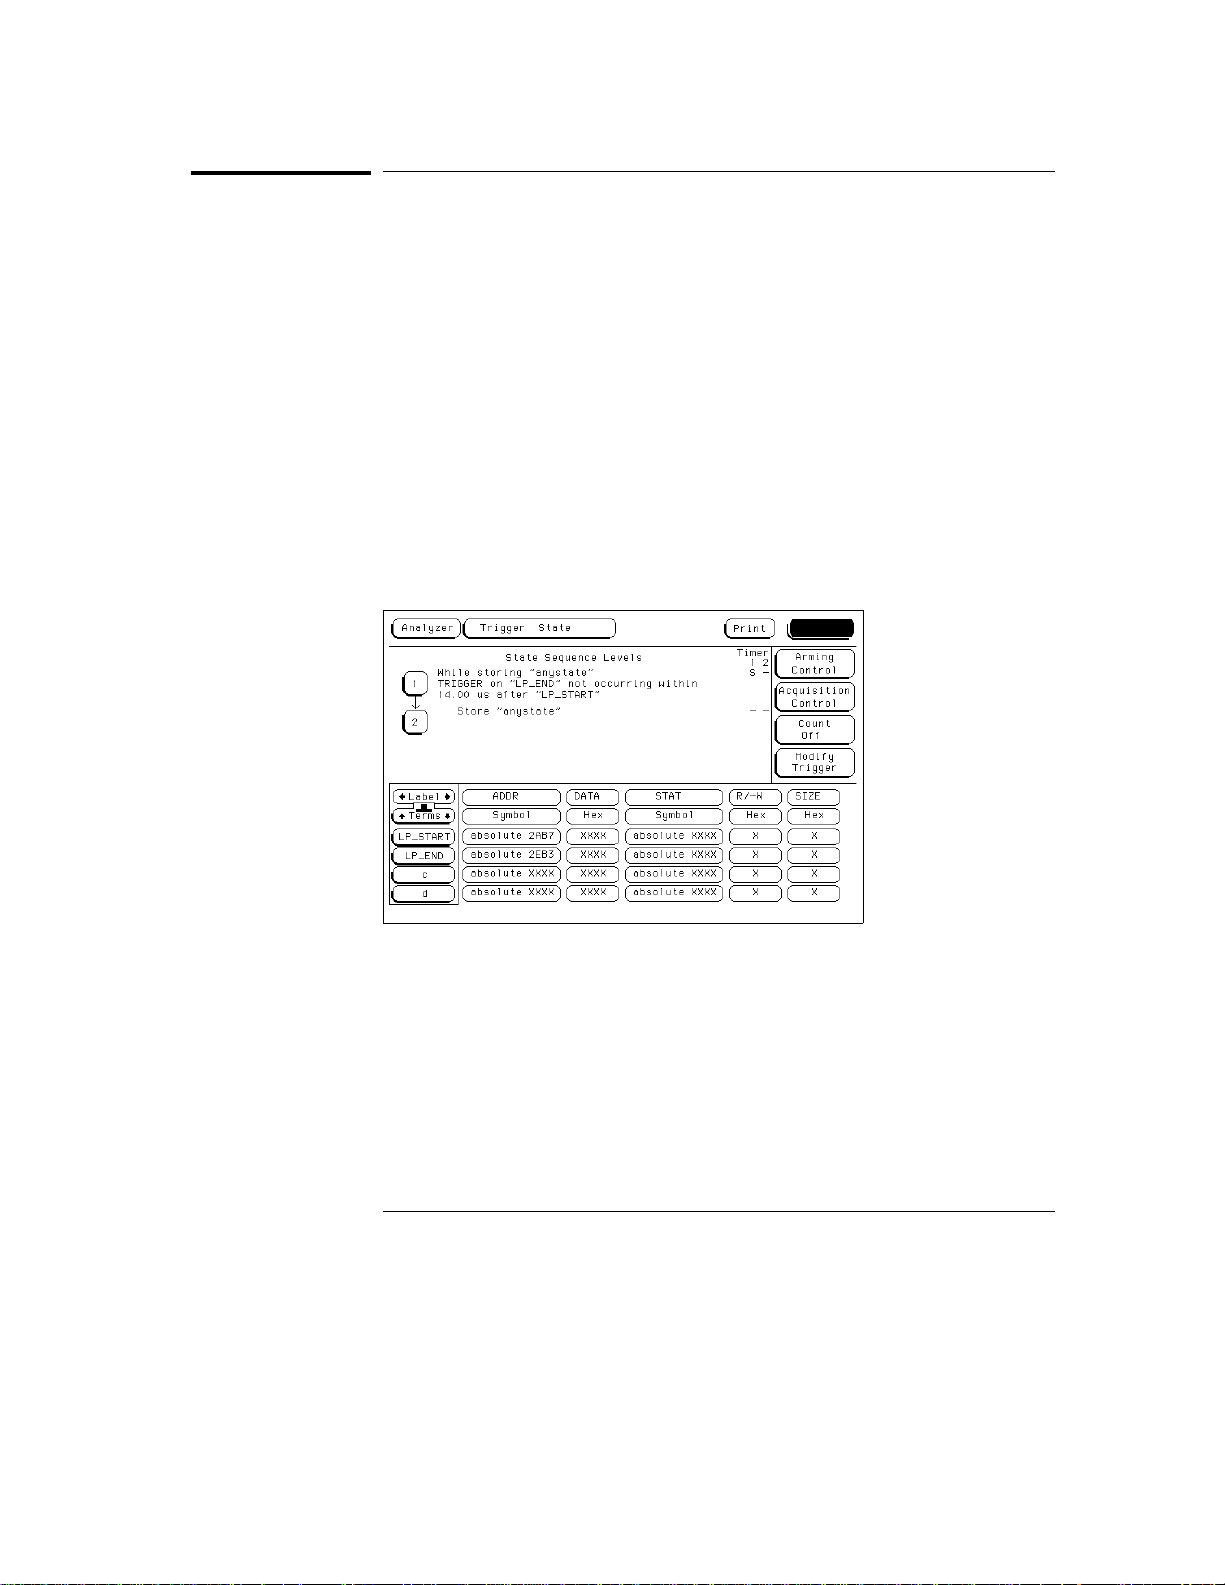
Triggering Examples
To trigger on a loop that occasionally runs too long
To trigger on a loop that occasionally runs too long
This example assumes the loop normally executes in 14 µs.
Go to the state analyzer’s Trigger menu.
1
2 Define terms LP_START and LP_END to represent the start and end
addresses of the loop, and set Timer1 to the normal duration of the
loop.
3 Change State Sequence Level 1’s macro to "Find event2 occurring too
late after event1."
4 In the pop-up menu, enter the following sequence specification:
While storing anystate Find "LP_END" occurring too late afterLP_END" occurring too late after
•
"LP_START" Use Timer: "Timer1" Time="14 "LP_START" Use Timer: "Timer1" Time="14 µs
Of course, you use your normal loop duration in place of "14 14 µs.
will automatically start Timer1 for you.will automatically start Timer1 for you.
"
" The macro The macro
Triggering on a Loop Overrun
5-12
Page 81
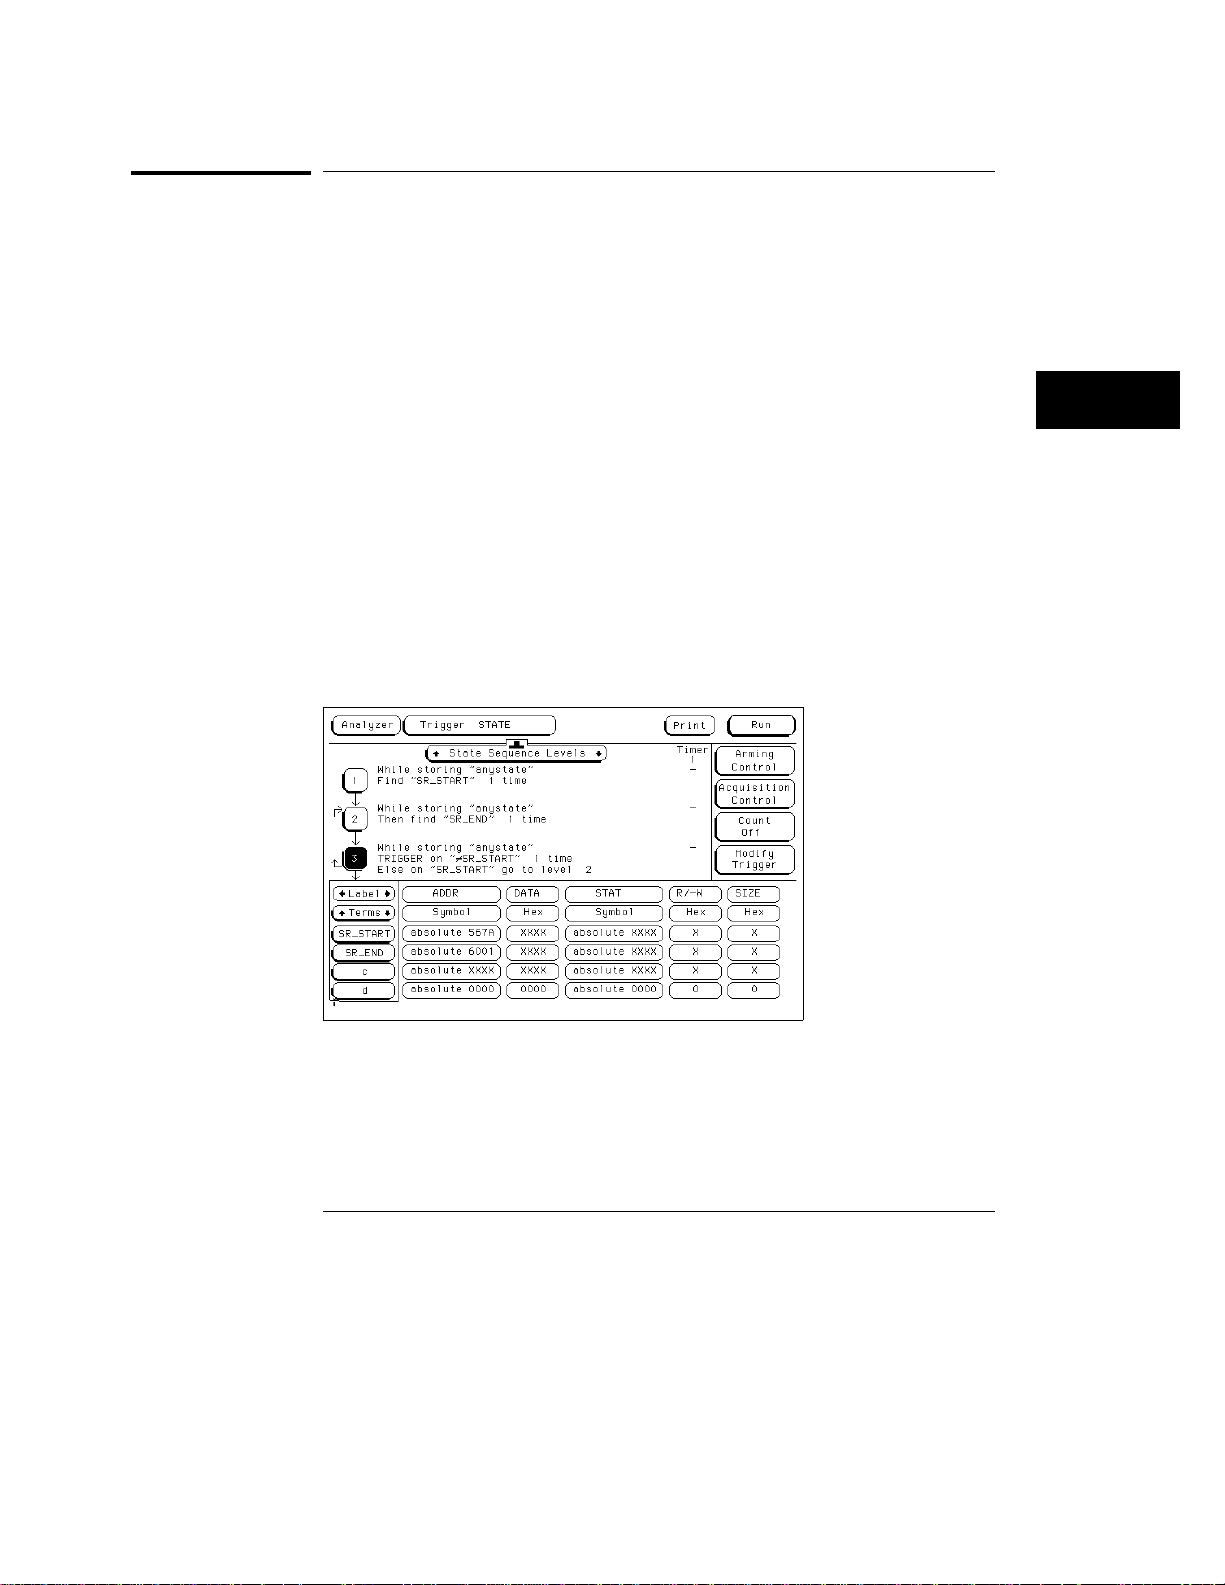
Triggering Ex amples
To verify correct retu rn from a function call
To verify correct return from a function call
The exit code for a function will often contain instructions for de-allocating
stack storage for local variables and restoring registers that were saved
during the function call. Some language implementations vary on these
points, with the calling function doing some of this work, so you may need to
adapt the procedure to suit your system.
Go to the state analyzer’s Trigger menu.
1
2 Define terms SR_START and SR_END to represent the start and end
addresses of the subroutine.
3 Under State Sequence Levels, insert 2 more sequence levels and enter
the following sequence specification:
While storing "anystate" Find "SR_START" Occurs "1" Else on "no state" goanystate" Find "SR_START" Occurs "1" Else on "no state" go
•
to level "1"to level "1"
While storing "anystate" Then find "SR_END" Occurs "1" Else on "no state"anystate" Then find "SR_END" Occurs "1" Else on "no state"
•
go to level "2"go to level "2"
While storing "anystate" TRIGGER on anystate" TRIGGER on "≠ SR_START" Occurs "1" Else on Occurs "1" Else on
•
"SR_START" go to level "2" "SR_START" go to level "2"
Verifying Correct Return from a Function Call
5-13
Page 82
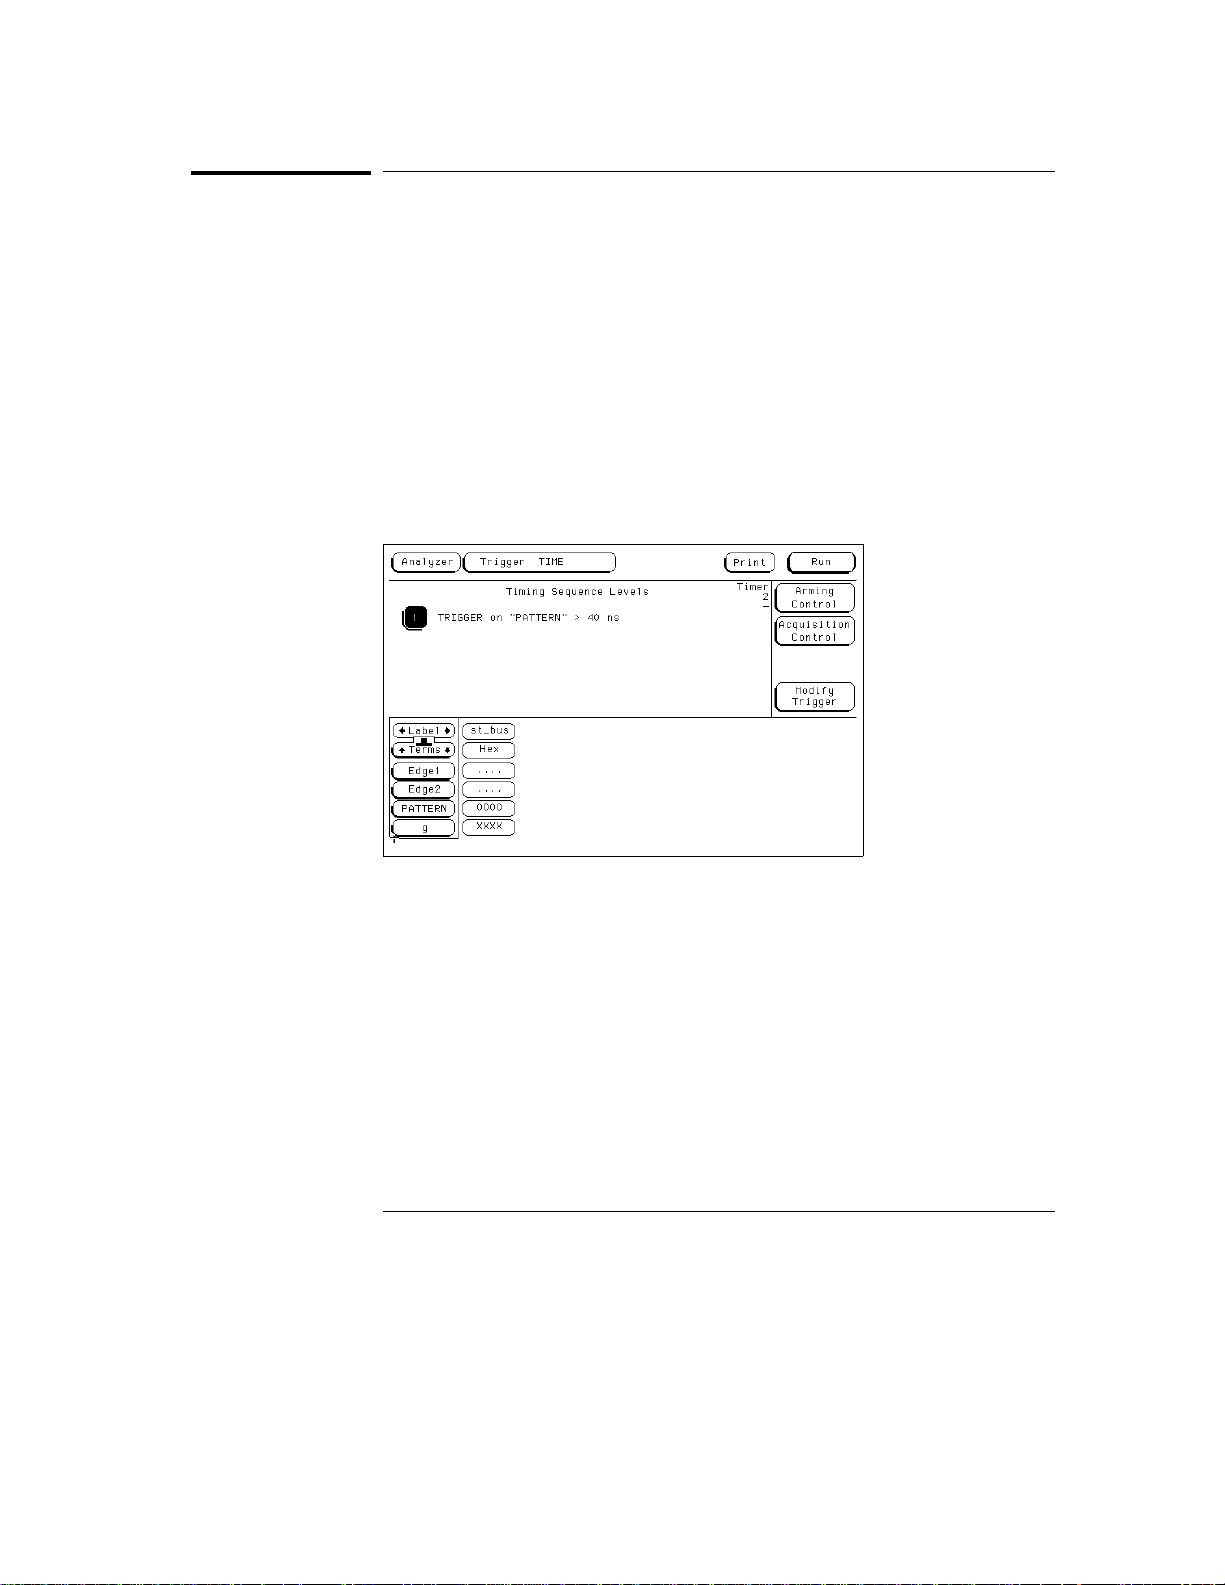
Triggering Examples
To trigger after all status bus lines finish transitioning
To trigger after all status bus lines finish transitioning
In some applications, you will want to trigger a measurement when a
particular pattern has become stable. For example, you might want to trigger
the analyzer when a microprocessor’s status bus has become stable during
the bus cycle.
Go to the timing analyzer’s Trigger menu.
1
2 Define a term called PATTERN to represent the value to be found on
the status bus lines.
3 Under Timing Sequence Levels, enter the following sequence
specification:
TRIGGER on "PATTERN" > 40 nsPATTERN" > 40 ns
•
Triggering After Lines Have Finished Transitioning
5-14
Page 83
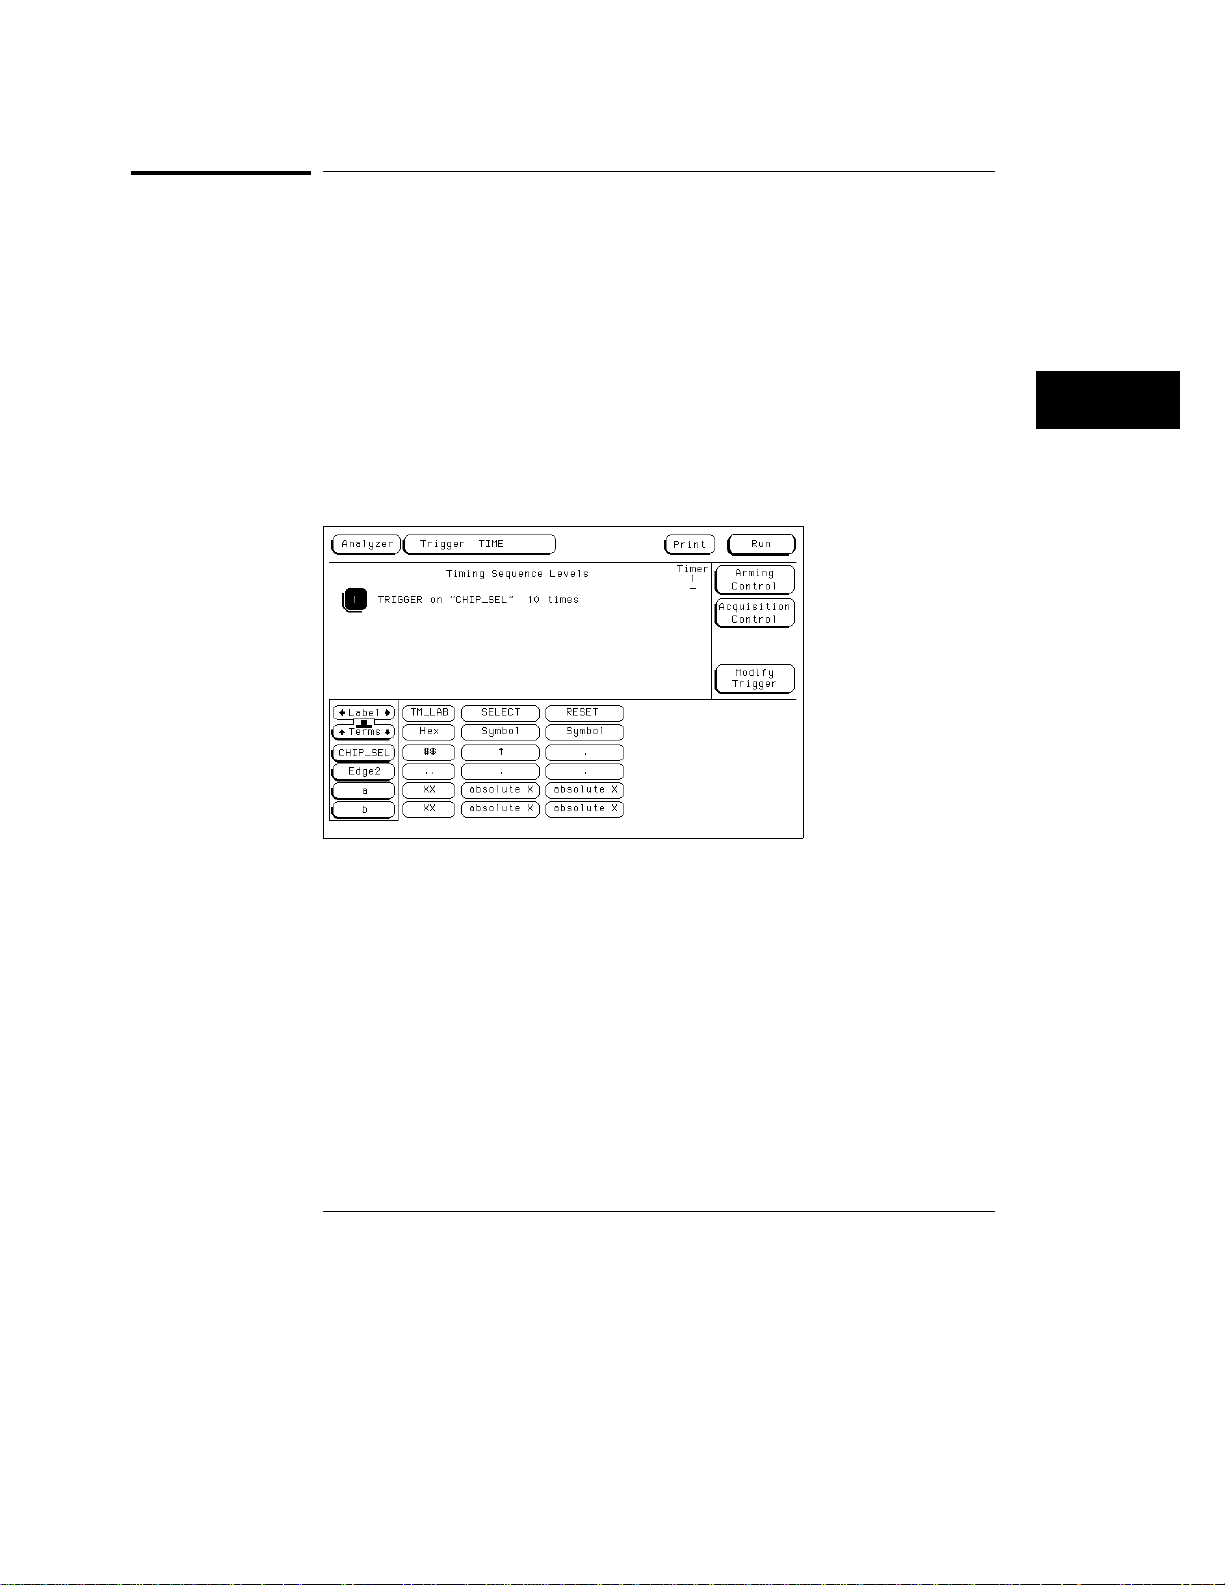
Triggering Ex amples
To find the nth assertion of a chip select line
To find the nth assertion of a chip select line
1 Go to the timing analyzer’s Trigger menu.
2 Define the Edge1 term to represent the asserting transition on the
chip select line.
You can rename the Edge1 term to make it correspond more closely to the
problem domain, for example, to CHIP_SEL.
Under Timing Sequence Levels, enter the following sequence
3
specification:
TRIGGER on "CHIP_SEL" Occurs "10" Else on "no state" go to level "1"CHIP_SEL" Occurs "10" Else on "no state" go to level "1"
•
You should use your value for "n" in place of "10" in the specification above.n" in place of "10" in the specification above.
Triggering on the 10th Assertion of a Chip Select Line
5-15
Page 84
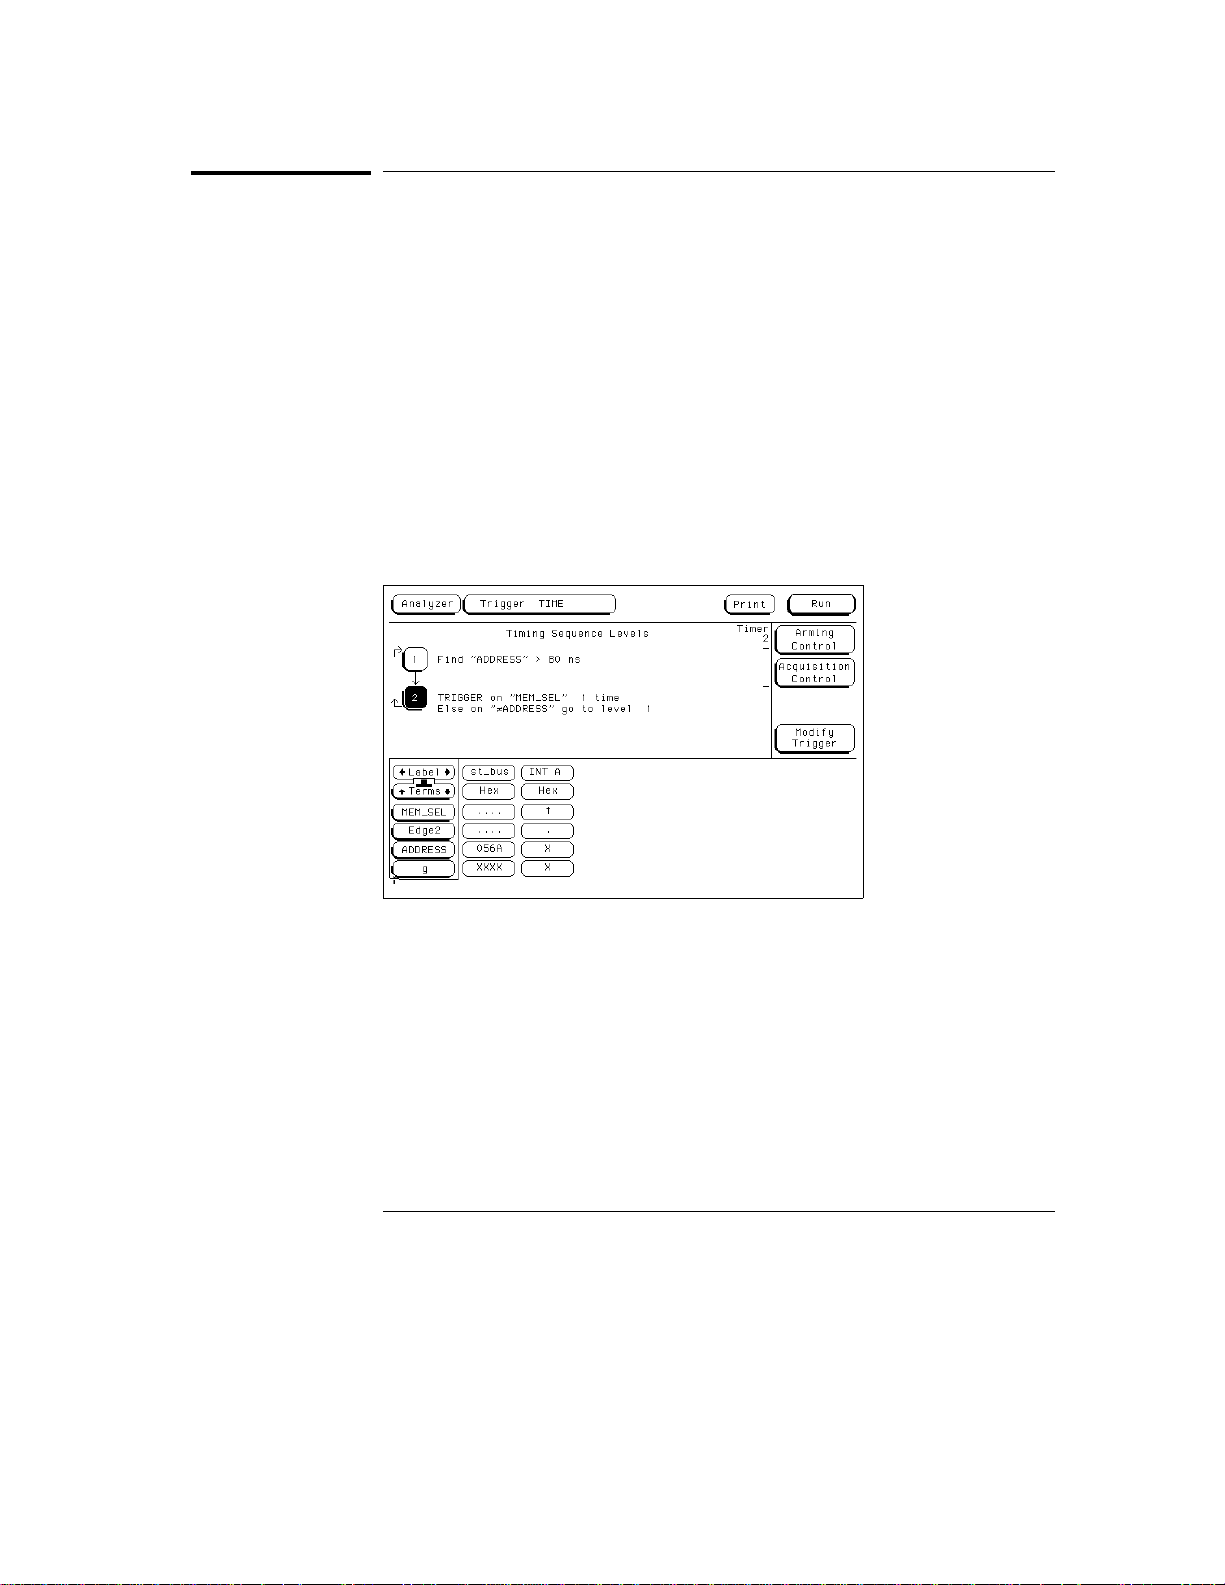
Triggering Examples
To verify that the chip select line is strobed after the address is stable
To verify that the chip select line is strobed after the
address is stable
1 Go to the timing analyzer’s Trigger menu.
2 Define a term called ADDRESS to represent the address in question,
and the Edge1 term to represent the asserting transition on the chip
select line.
You can rename the Edge1 term to suit the problem, for example, to
MEM_SEL.
Under Timing Sequence Levels, enter the following sequence
3
specification:
Find "ADDRESS" > 80 ns ADDRESS" > 80 ns
•
TRIGGER on "MEM_SEL" Occurs "1" Else on MEM_SEL" Occurs "1" Else on "≠ ADDRESS" go to level "1" go to level "1"
•
Verifying SetupTime for Memory Address
5-16
Page 85
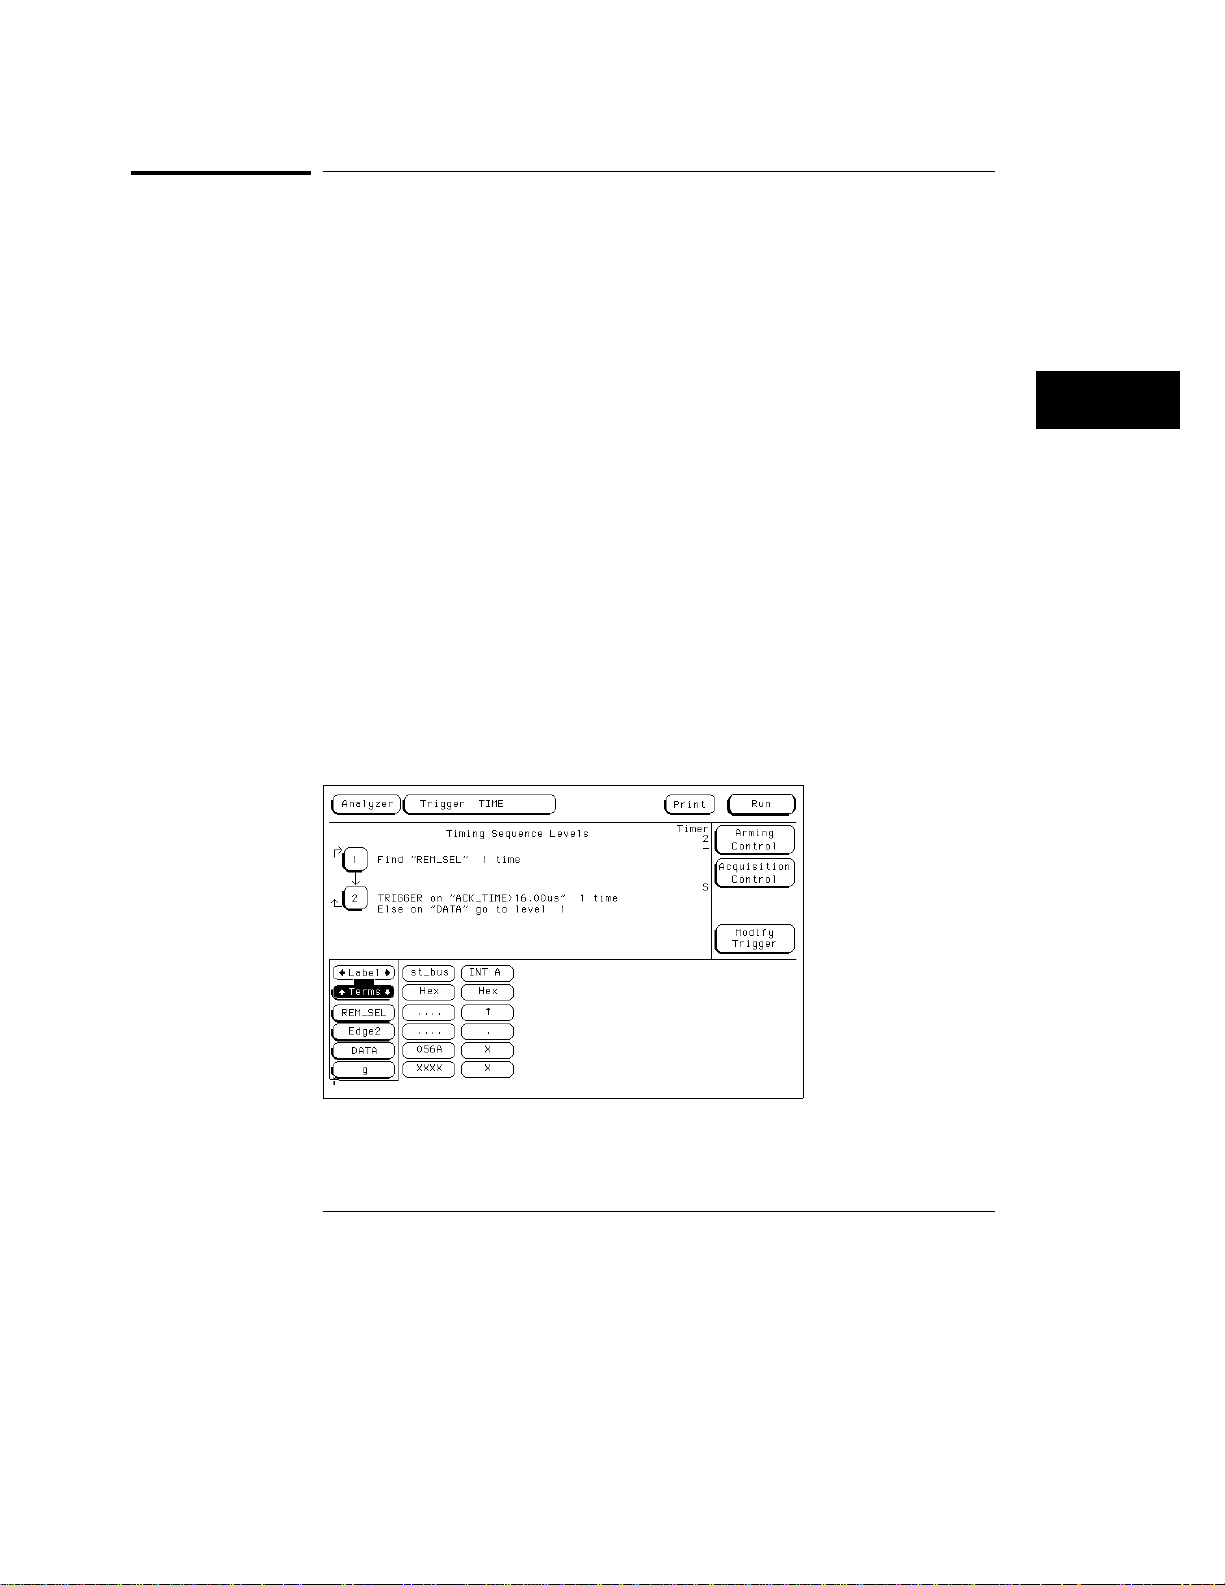
Triggering Ex amples
To trigger when expected data does not appear when requested
To trigger when expected data does not appear when
requested
1 Go to the timing analyzer’s Trigger menu.
2 Define a term called DATA to represent the expected data, the Edge1
term to represent the chip select line of the remote device, and the
Timer1 term to identify the time limit for receiving expected data.
You can rename the Edge1 and Timer1 terms to match the problem domain,
for example, to REM_SEL and ACK_TIME.
Under Timing Sequence Levels, enter the following sequence
3
specification:
Find "REM_SEL" Occurs "1" Else on "no state" go to level "1"REM_SEL" Occurs "1" Else on "no state" go to level "1"
•
TRIGGER on "ACK_TIME > 16.00 ACK_TIME > 16.00 µs" Occurs "1" Else on "DATA" go to Occurs "1" Else on "DATA" go to
•
level "1"level "1"
You will need to start ACK_TIME timer (Timer1) upon entering this state.
You do this using the Timer Control field in the menu for sequence level 2.
This sequence specification causes the analyzer to trigger when the data does
not occur in 16 µs or less. If it does occur within 16 µs, the sequence restarts.
Specifications of this type are useful in finding intermittent problems. You
can set up and run the trace, then cycle the system through temperature and
voltage variations, using automatic equipment if necessary. The failure will be
captured and saved for later review.
Triggering When Data Not Returned
5-17
Page 86
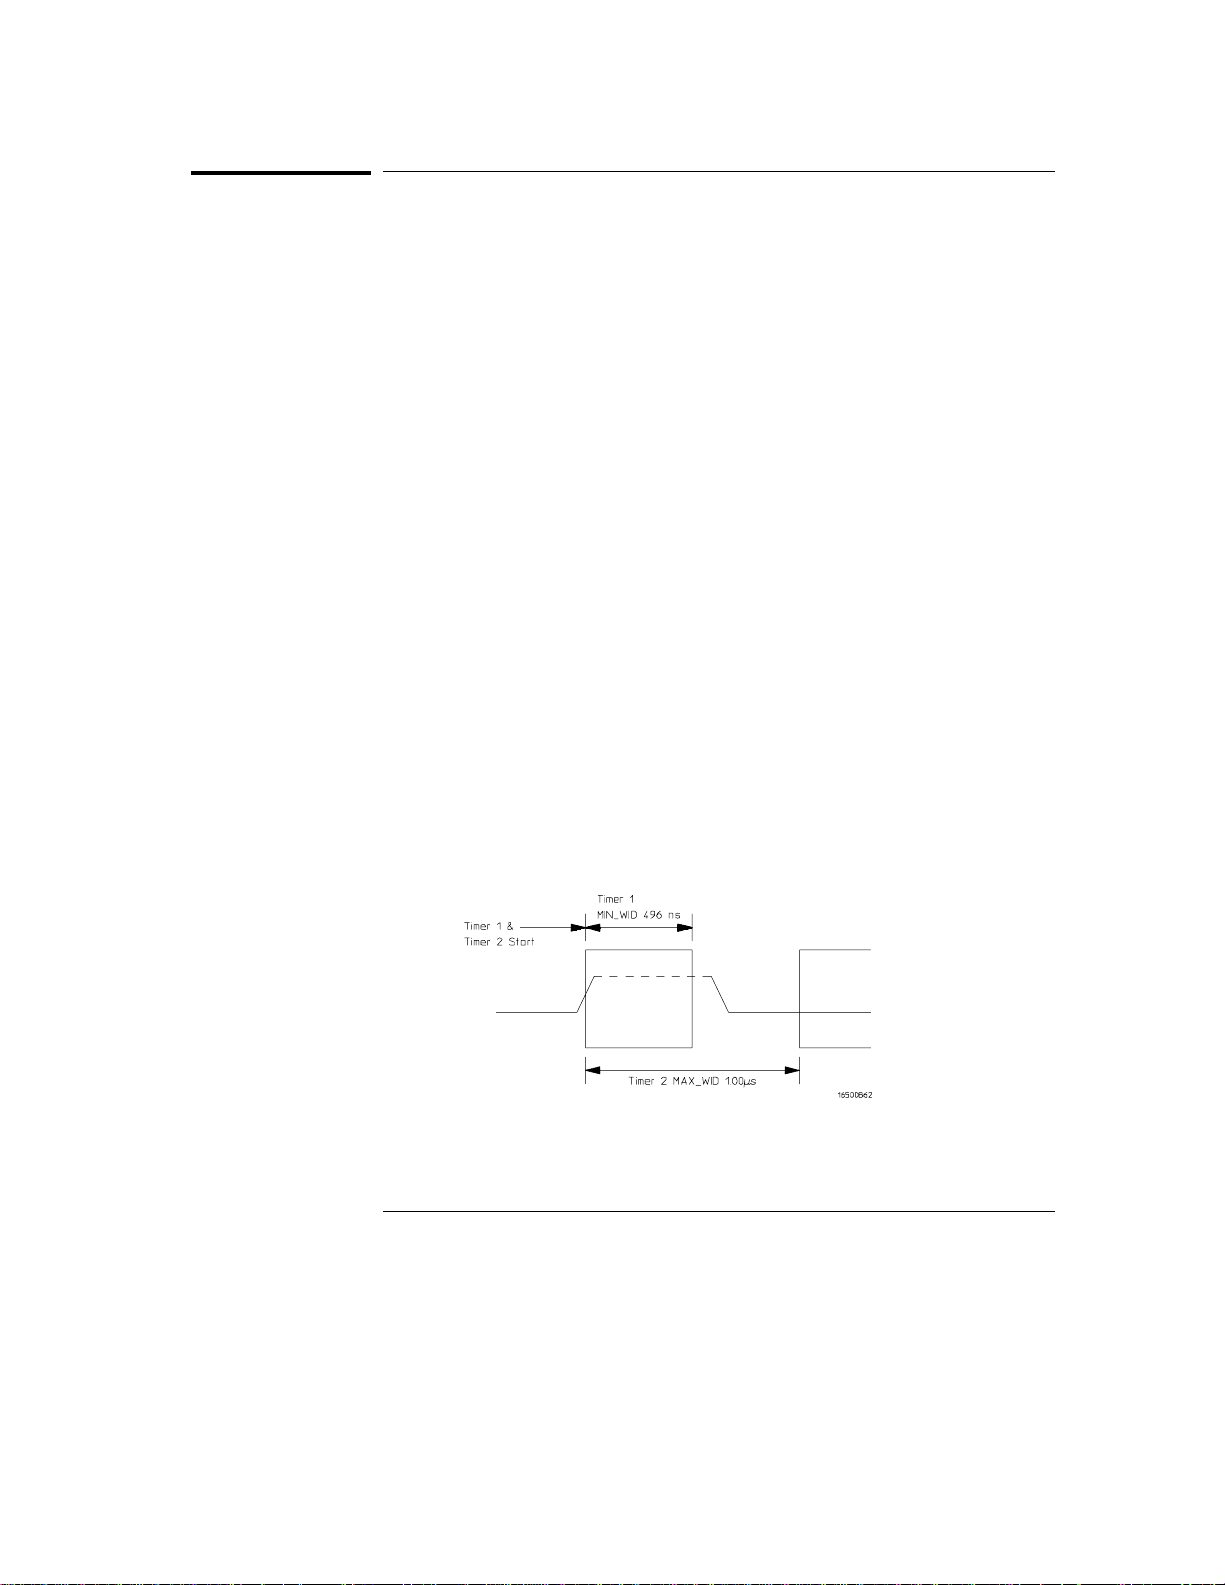
Triggering Examples
To test minimum and maximum pulse limits
To test minimum and maximum pulse limits
1 Go to the timing analyzer’s Trigger menu.
2 Define the Edge1 term to represent the positive-going transition, and
define the Edge2 term to represent the negative-going transition on
the line with the pulse to be tested.
You can rename these terms to POS_EDGE and NEG_EDGE.
Define the Timer1 term to represent the minimum pulse width, and
3
the Timer2 term to represent the maximum pulse width.
You can rename these terms to MIN_WID and MAX_WID. In this example,
Timer1 was set to 496 ns and Timer2 was set to 1 µs. Both timers start when
sequence level 2 is active.
Under Timing Sequence Levels, enter the following sequence
4
specification:
Find "POS_EDGE" Occurs "1" Else on "no state" go to level "1" POS_EDGE" Occurs "1" Else on "no state" go to level "1"
•
Then find "NEG_EDGE" Occurs "1" Else on "no state" go to level "2"NEG_EDGE" Occurs "1" Else on "no state" go to level "2"
•
You will need to start both timers upon entering this second state. You do
this using the Timer Control field in the menu for sequence level 2.
TRIGGER on "MIN_WID 496 ns + MAX_WID 1.00 MIN_WID 496 ns + MAX_WID 1.00 µs" Occurs "1" Else on Occurs "1" Else on
•
"anystate" go to level "1""anystate" go to level "1"
Because both timers start when entering sequence level 2, they start as soon
as the positive edge of the pulse occurs. Once the negative edge occurs, the
sequencer transitions to level 3. If at that point, the MIN_WID timer is less
than 496 ns, or the MAX_WID timer is greater than 1 µs, the pulse width has
been violated and the analyzer triggers. Otherwise, the sequence is restarted.
Measurement of Minimum and Maximum Pulse Width Limits
5-18
Page 87
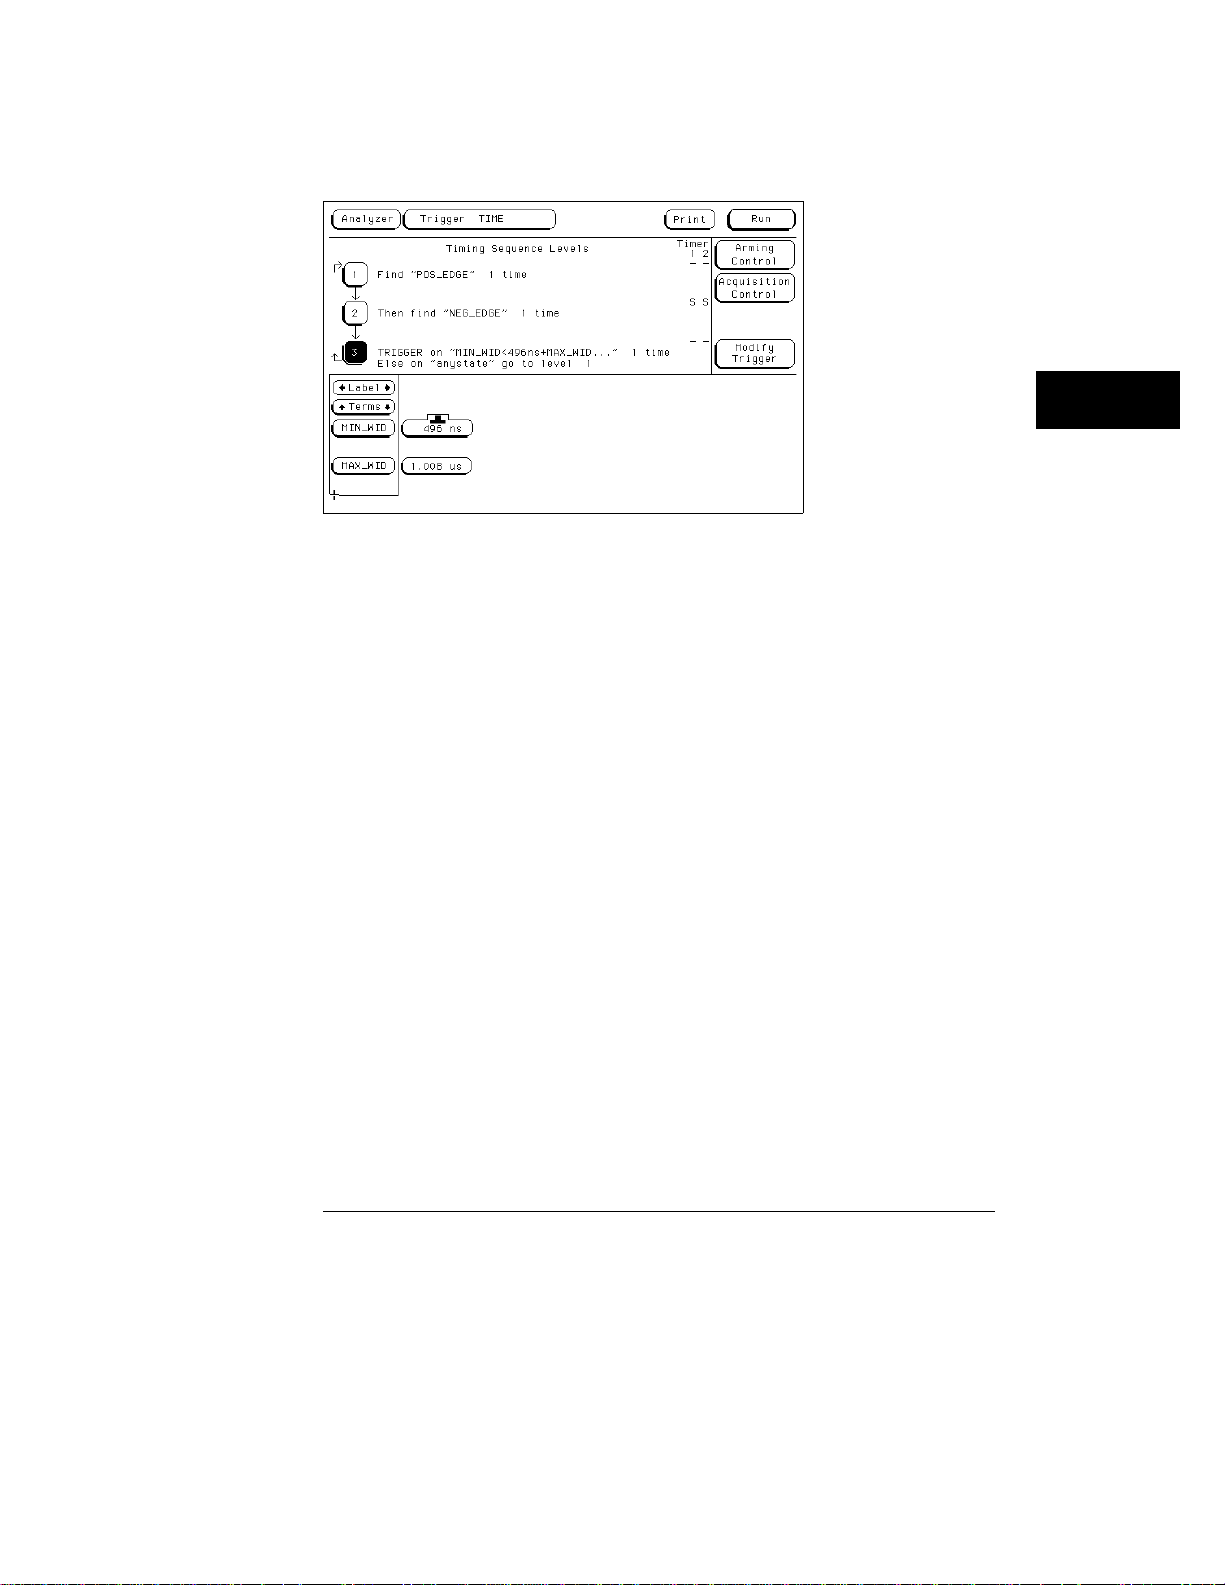
To test minimum and maximum pulse limits
Triggering When a Pulse Exceeds Minimum or Maximum Limits
Triggering Ex amples
5-19
Page 88
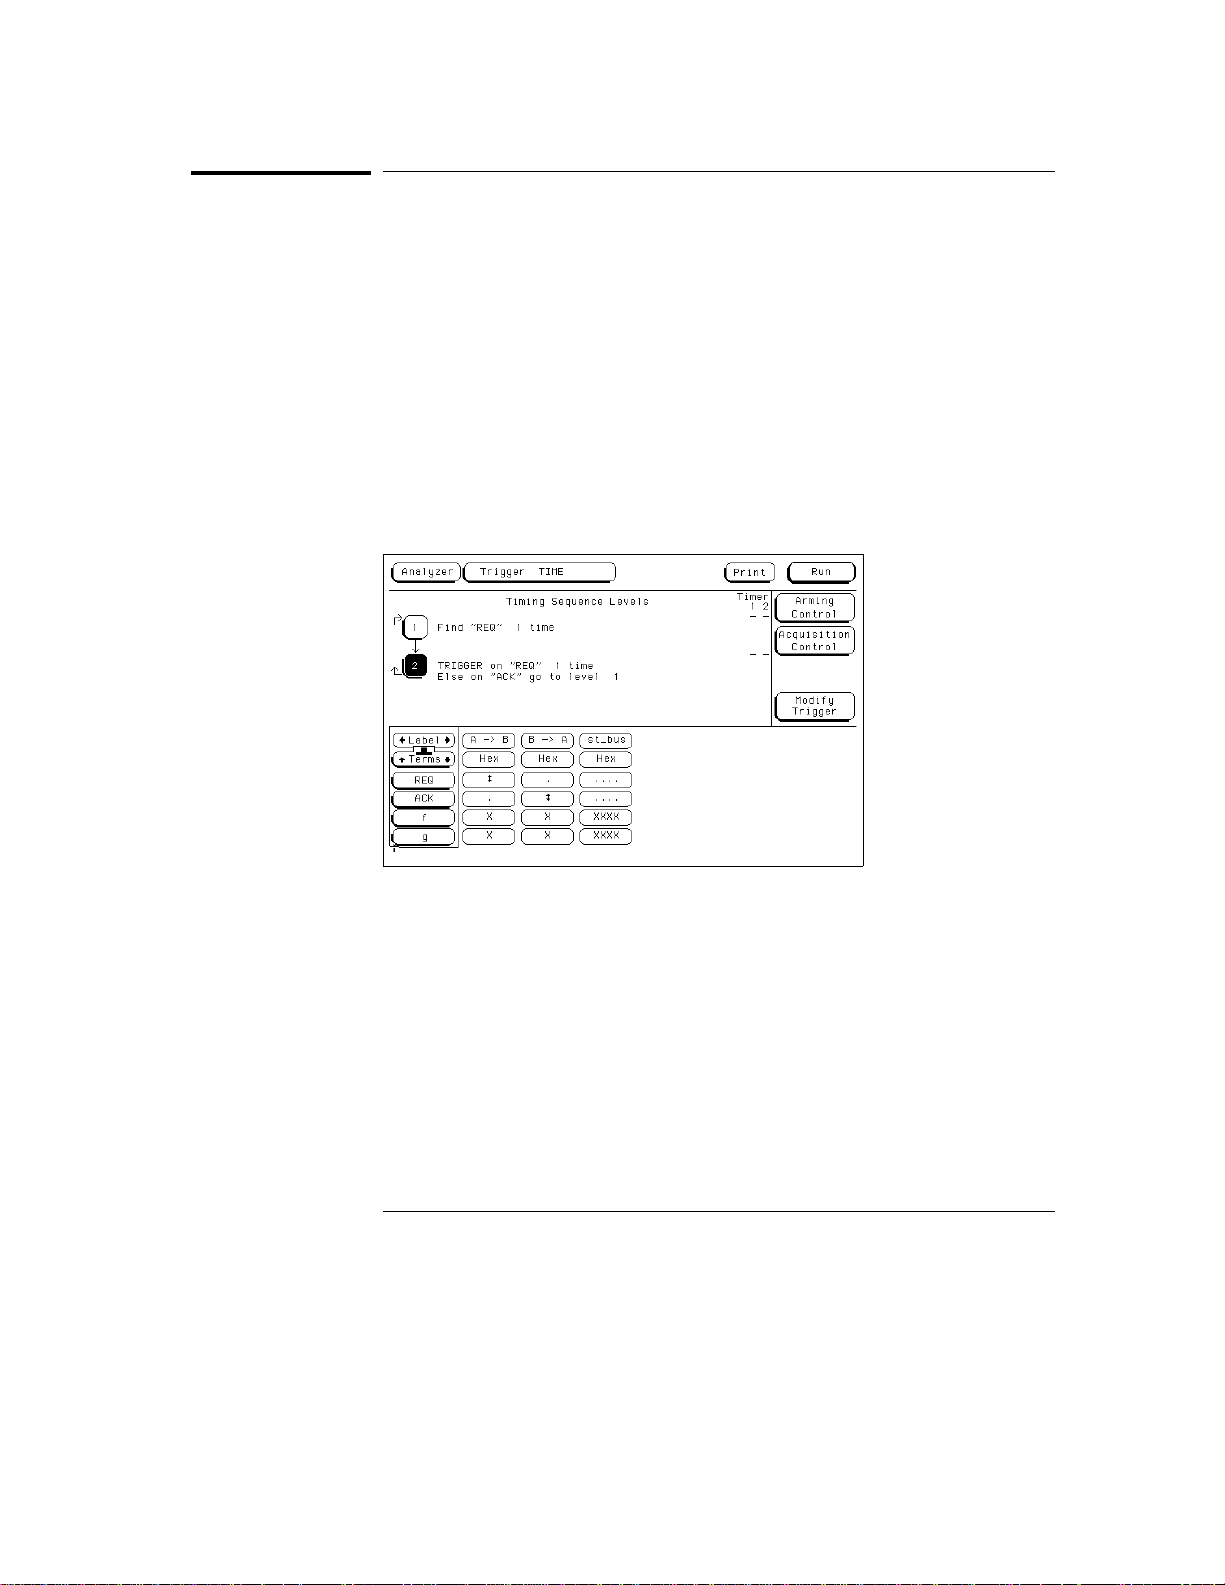
Triggering Examples
To detect a handshake violation
To detect a handshake violation
1 Go to the timing analyzer’s Trigger menu.
2 Define the Edge1 term to represent either transition on the first
handshake line, and the Edge2 term to represent either transition on
the second handshake line.
You can rename these terms to match your problem, for example, to REQ
and ACK.
Under Timing Sequence Levels, enter the following sequence
3
specification:
Find "REQ" Occurs "1" Else on "no state" go to level "1"REQ" Occurs "1" Else on "no state" go to level "1"
•
TRIGGER on "REQ" Occurs "1" Else on "ACK" go to level "1" REQ" Occurs "1" Else on "ACK" go to level "1"
•
Triggering on a Handshake Violation
5-20
Page 89
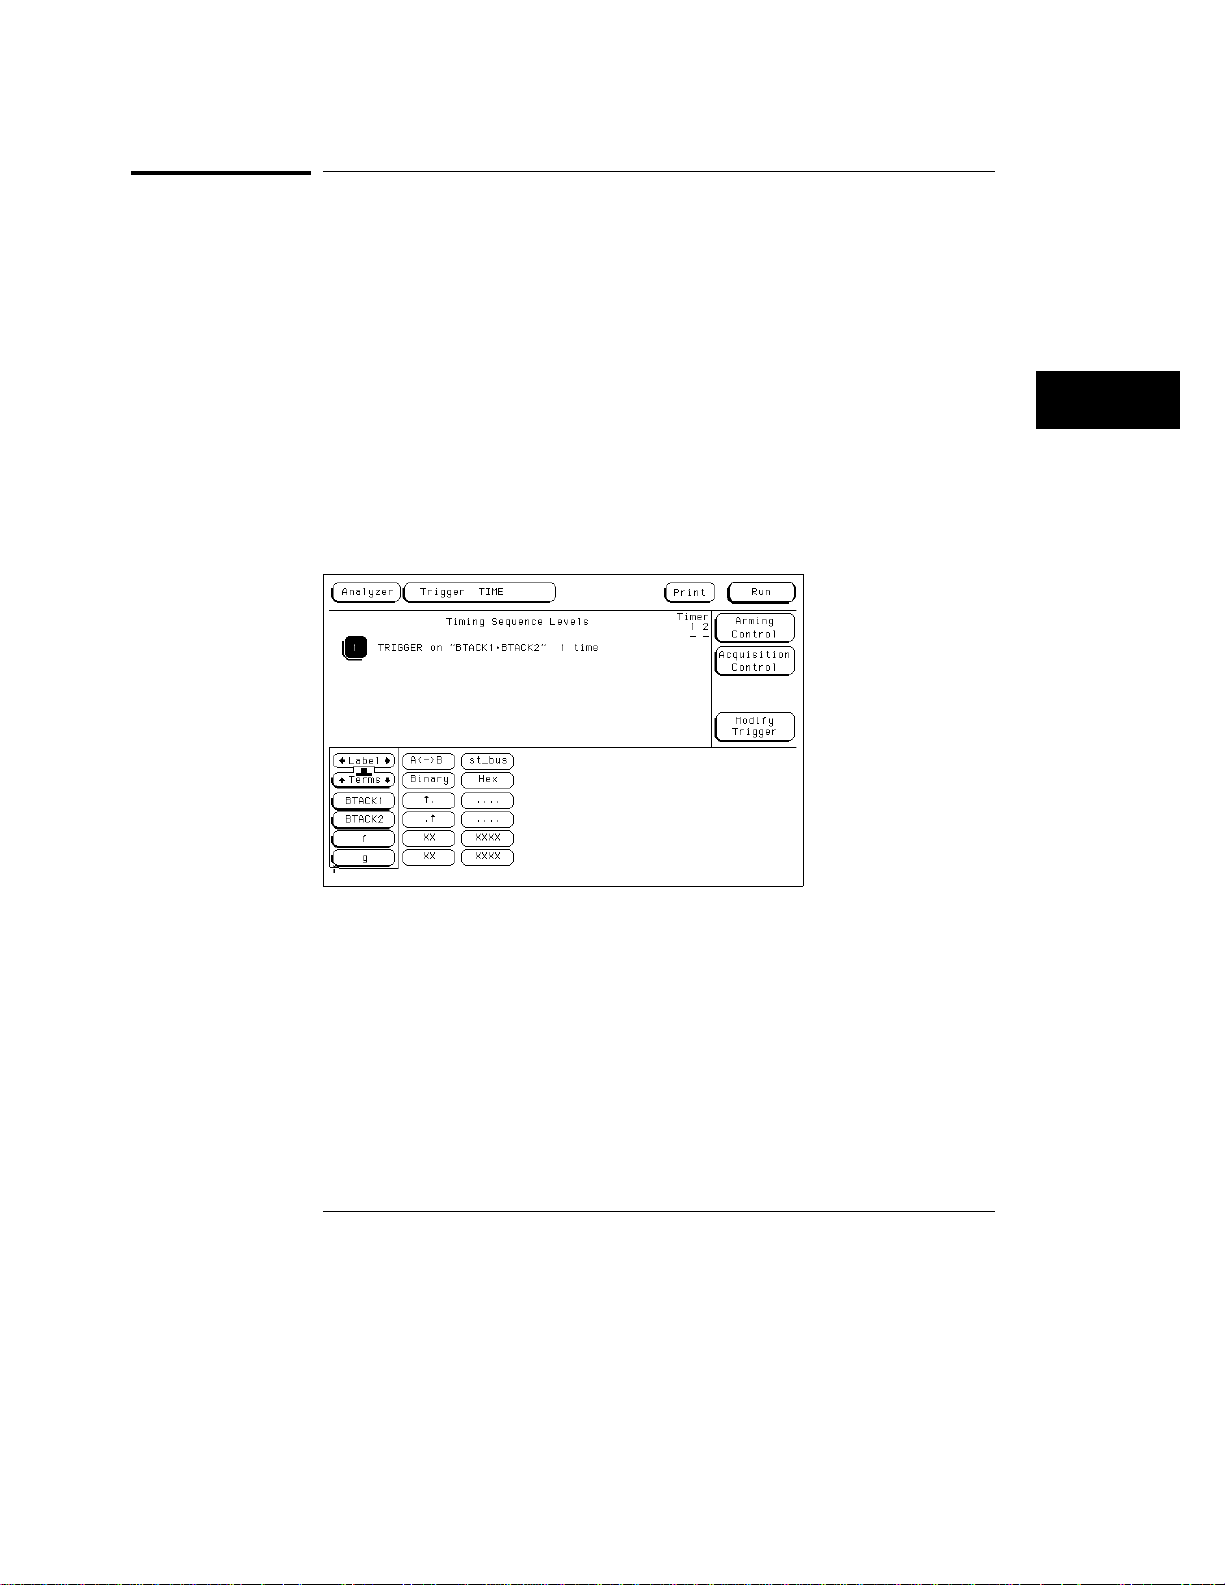
Triggering Ex amples
To detec t bus contention
To detect bus contention
In this setup, the trigger occurs only if both devices assert their bus transfer
acknowledge lines at the same time.
Go to the timing analyzer’s Trigger menu.
1
2 Define the Edge1 term to represent assertion of the bus transfer
acknowledge line of one device, and the Edge2 term to represent
assertion of the bus transfer acknowledge line of the other device.
You can rename these to BTACK1 and BTACK2.
3 Under Timing Sequence Levels, enter the following sequence
specification:
TRIGGER on "BTACK1 BTACK1 •• BTACK2" Occurs "1" Else on "no state" go to BTACK2" Occurs "1" Else on "no state" go to
•
level "1"level "1"
Triggering on Bus Contention
5-21
Page 90

Cross-Arming Trigger Examples
The following examples use cross arming to coordinate measurements
between two separate machines within the logic analyzer. The
machines can be configured as either a state* analyzer and timing
analyzer, or two state analyzers. It is not possible to set both
machines to time. Set up cross arming in the Arming Control menu
(obtained by selecting Arming Control in the Trigger menu). When
coordinating measurements between two machines, you also need to
select Count Time to correlate the measurements.
* "State" includes State Compare mode.
5-22
Page 91
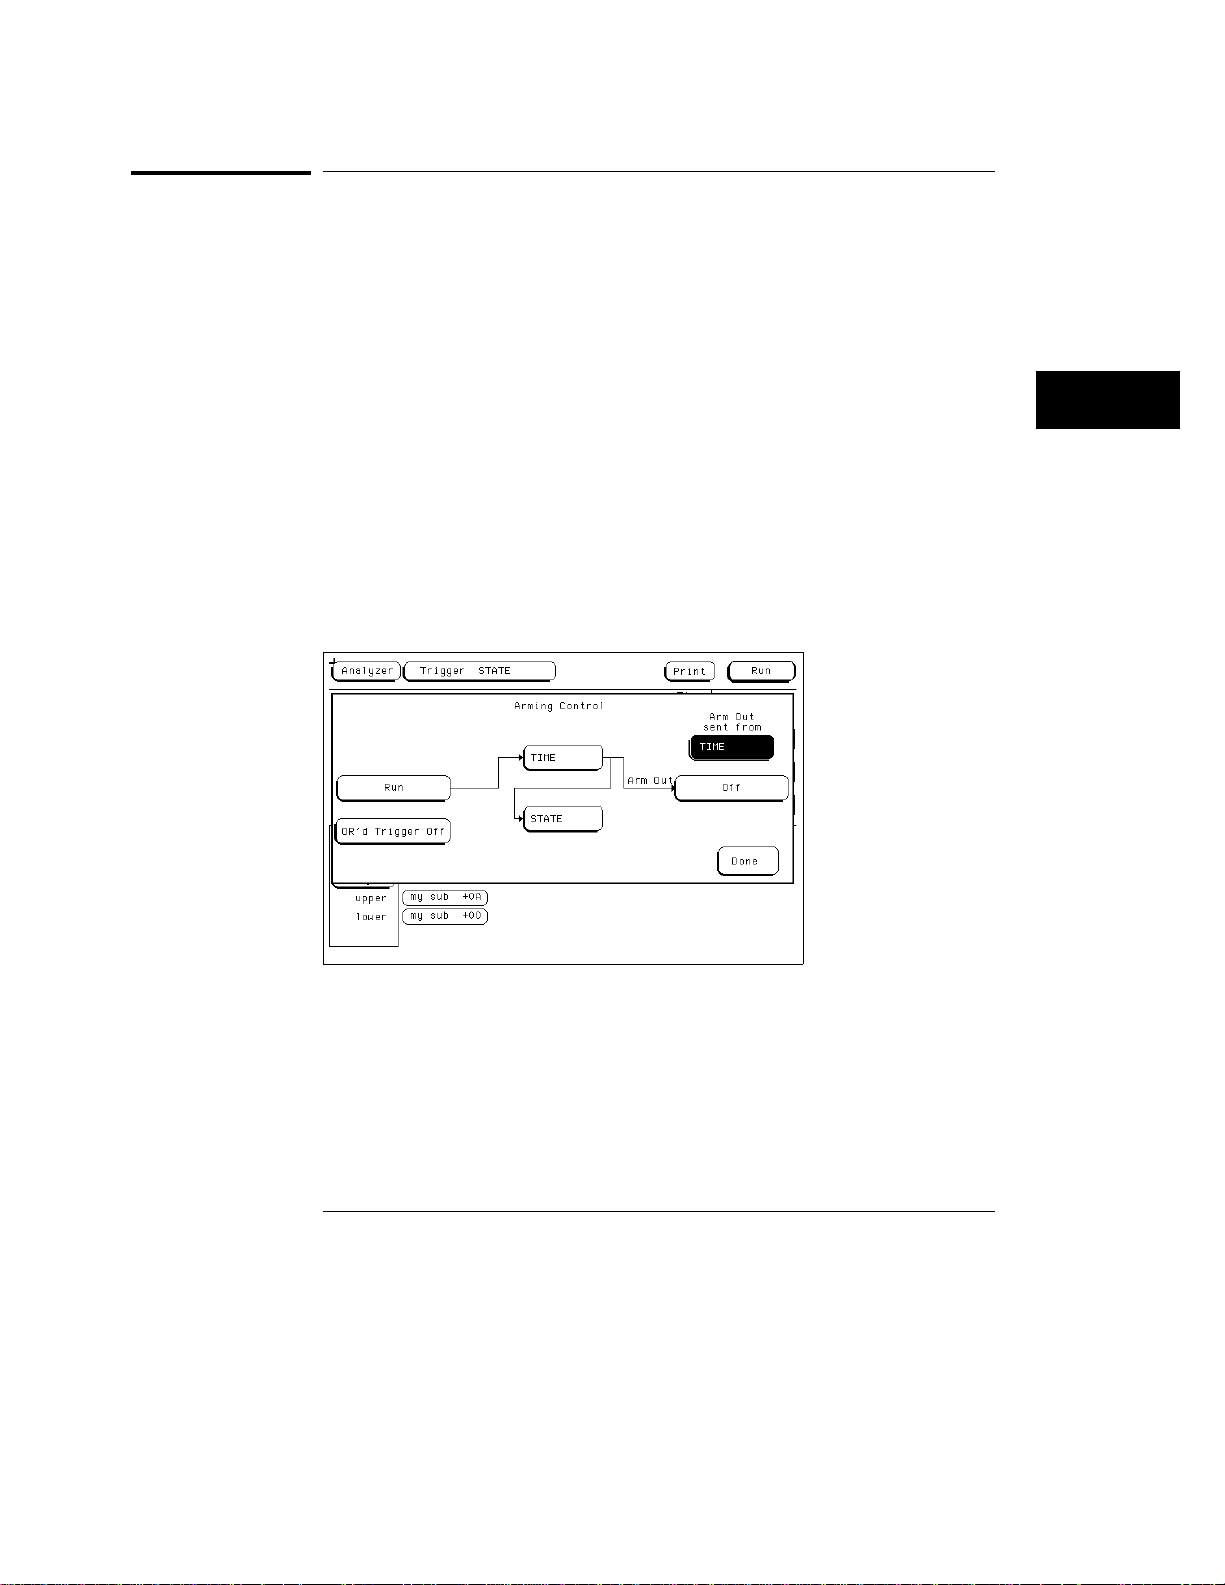
Triggering Ex amples
To examine software execution when a timing violation occurs
To examine software execution when a timing
violation occurs
The timing analyzer triggers when the timing violation occurs. When it
triggers, it also sets its "arm" level to true. When the state analyzer receives
the arm signal, it triggers immediately on the present state.
Set up one state analyzer and one timing analyzer.
1
2 Go to the timing analyzer’s Trigger menu.
3 Define Edge1 to represent the control line where the timing violation
occurs.
4 Under Timing Sequence Levels, enter the following sequence
specification:
TRIGGER on "Edge1" Occurs "1" Else on "no state" go to level "1"Edge1" Occurs "1" Else on "no state" go to level "1"
•
Go to the state analyzer’s Trigger menu and check that term "a" is set
5
to "don’t care". In the Arming Control menu, set the state analyzer to
be run by the timing analyzer.
Arming the State Analyzer fr om theTiming Analyzer
6 Under State Sequence Levels, enter the following sequence
specification:
While storing "anystate" TRIGGER on "arm anystate" TRIGGER on "arm •• a" Occurs "1" Else on "no a" Occurs "1" Else on "no
•
state" go to level "1" state" go to level "1"
5-23
Page 92

Triggering Examples
To look at control and status signals during execution of a routine
To look at control and status signals during execution
of a routine
The state analyzer will trigger on the start of the routine whose control and
status signals are to be examined more frequently than once per bus cycle.
When the state analyzer triggers, it sends out an arm signal. The timing
analyzer triggers when it receives the true arm level and detects the
transition represented by Edge1.
Set up one state analyzer and one timing analyzer.
1
2 Go to the state analyzer’s Trigger menu and define term R_START to
represent the starting address of the routine.
3 Under State Sequence Levels, enter the following sequence
specification:
While storing "anystate" TRIGGER on "R_START" Occurs "1" Else on "noanystate" TRIGGER on "R_START" Occurs "1" Else on "no
•
state" go to level "1"state" go to level "1"
Go to the timing analyzer’s Trigger menu.
4
5 Define the Edge1 term to represent a transition on one of the control
signals.
6 Set the timing analyzer to be run by the state analyzer. Under Timing
Sequence Levels, enter the following sequence specification:
TRIGGER on "arm arm •• Edge1" 1 time Edge1" 1 time
•
You do not need to use a combination trigger when one analyzer is armed
from the other analyzer — the arm term is ANDed automatically with the
term already in use.
5-24
Page 93

Triggering Ex amples
To trigger timing analysis of a count-down on a set of data lines
To trigger timing analysis of a count-down on a set of
data lines
Your target system may include various state machines that are started by
system events such as interrupt processing or I/O activity. The state analyzer
is ideal for recognizing the system events; the timing analyzer is ideal for
examining the step-by-step operation of the state machines.
Set up a timing analyzer and a state analyzer.
1
2 Go to the state analyzer’s Trigger menu.
3 Set the timing analyzer to be run from the state analyzer.
4 Set the state analyzer to trigger on the label and term that identify the
start of the count-down routine.
5 Go to the timing analyzer’s Trigger Menu.
6 Set the timing analyzer to trigger on any state and store any state.
5-25
Page 94

Triggering Examples
To monitor two coprocessors in a target system
To monitor two coprocessors in a target system
Debugging coprocessor systems can be a complex task. Replicated systems
and contention for shared resources increase the potential problems. Using
two state analyzers with preprocessors can make it much easier to discover
the source of such problems. For example, you may want to set up one
analyzer to trigger only when a certain problem occurs, and set up the other
analyzer to be armed by the first analyzer so that it takes its trace only when
the first analyzer recognizes its trigger. This will let you observe the behavior
of both coprocessors during the occurrence of a problem.
Set up both analyzers as state analyzers.
1
2 Go to the first analyzer’s Trigger menu.
3 Set the second analyzer to be run from the first analyzer.
4 Turn on "Count Time".
5 Set the first analyzer to trigger on the problem condition.
Some problems may involve complex sequences of conditions. See earlier
examples in this chapter for more information on defining a trigger sequence.
Go to the Trigger menu of the second analyzer.
6
7 Check that the second analyzer is triggering on arm and that Count
Time is set.
After the measurement is complete, you can interleave the trace lists of both
state analyzers to see the activity executed by both coprocessors during
related clock cycles.
You can use a similar procedure if you have only one processor, but want to
monitor its activity with that of other system nodes, such as chip-select lines,
I/O activity, or behavior of a watchdog timer. In some instances it may be
easier to look at related activity with a timing analyzer.
See Also "Special Displays" in this chapter for information on interleaving.Special Displays" in this chapter for information on interleaving.
"To trigger timing analysis of a count-down on a set of data lines" inTo trigger timing analysis of a count-down on a set of data lines" in
Cross-Timing Trigger Examples in this chapter. Cross-Timing Trigger Examples in this chapter.
5-26
Page 95

Special Displays
Interleaved trace lists
Interleaved trace lists allow you to view data captured by two or more
analyzers in a single display. When you interleave the traces, you see
each state that was captured by each analyzer. These states are
shown on consecutive lines.
You can interleave state listings from state analyzers when two are
used together in a run. Interleaved state listings are useful when you
are using multiple analyzers to look at interaction between two or
more processors.
Mixed Display menu
The Mixed Display menu allows you to show state listings and timing
waveforms together on screen. State listings are shown at the top of
the screen and waveform displays are shown at the bottom. You can
interleave state listings from two analyzers at the top of the screen, if
desired. You can display waveforms from the timing analyzer at the
bottom of the screen.
5-27
Page 96

Triggering Examples
To interleave trace lists
To interleave trace lists
1 Set up both analyzers as state analyzers.
2 Go to the Trigger menu of the first analyzer.
3 Set Count to Time, and set up the trigger.
The logic analyzer uses the time tags stored with each state to determine the
ordering of states shown in an interleaved trace list.
Set Count to Time, and set up the trigger on the second analyzer.
4
The second analyzer does not need to be run from the first analyzer, but both
analyzers must have "Count Time" turned on in order to correlate the data.Count Time" turned on in order to correlate the data.
Make the measurement run.
5
6 Go to one of the Listing menus.
7 Select one of the label fields in the trace list display, then select
Interleave.
8 Select the name of the other analyzer and the label to interleave.
Interleaved data is displayed in a light shade. The line numbers of interleaved
data are indented in the data roll field. The labels identifying the interleaved
data are shown above the labels for the current analyzer.
5-28
Page 97
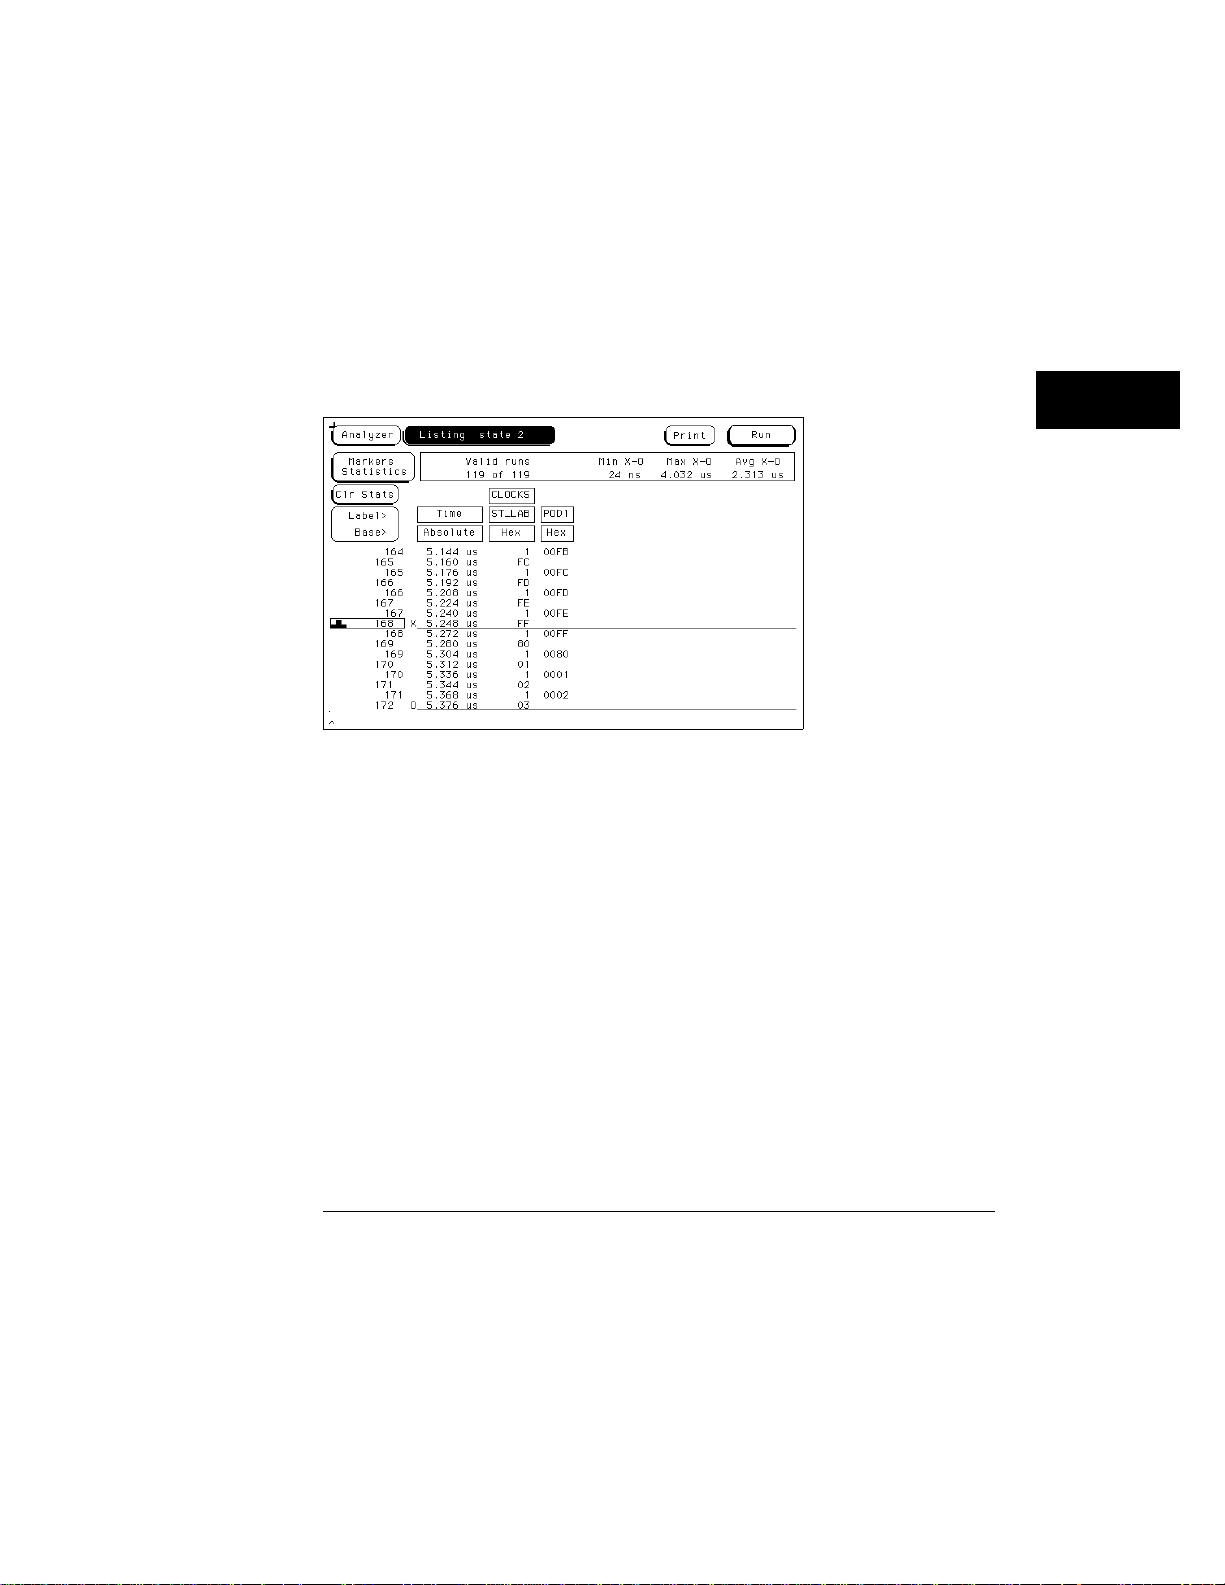
Triggering Ex amples
To interleave trace lists
In the picture below, the interleaved data are shown in the same font as the
current analyzer’s data.
If you have problems interleaving, check that each analyzer has a
independent clock from the target system, and that both analyzers are
configured as state or state compare analyzers.
Interleaved Trac e Lists on the HP 1671D
5-29
Page 98
Triggering Examples
To view trace lists and waveforms on the same display
To view trace lists and waveforms on the same display
1 Set up a timing and a state analyzer.
2 Go to the state analyzer’s Trigger menu.
3 Set Count to Time, and set up the trigger as appropriate.
You do not need to have one instrument arming the other to display the
information jointly, but you do need to turn on Count Time so that the
information may be correlated.
Set up the timing analyzer trigger.
4
Timing analyzers implicitly count time because their sampling is driven by an
internal clock, rather than an external state clock.
Make a measurement run.
5
6 Go to the Mixed Display menu.
7 Insert labels into the listing as you would in the listing menu.
8 Insert waveforms into the waveform display as you would in the
waveform menu.
You can also position X and O Time markers on the waveform display to be
displayed in both the listing and the waveform areas. You must set Time
Markers in the Mixed Display even if you set markers in another display.
Mixed Display
You can use M ixed Display to show both waveforms and lists in the same
display, making it easier to correlate the events of interest.
5-30
Page 99
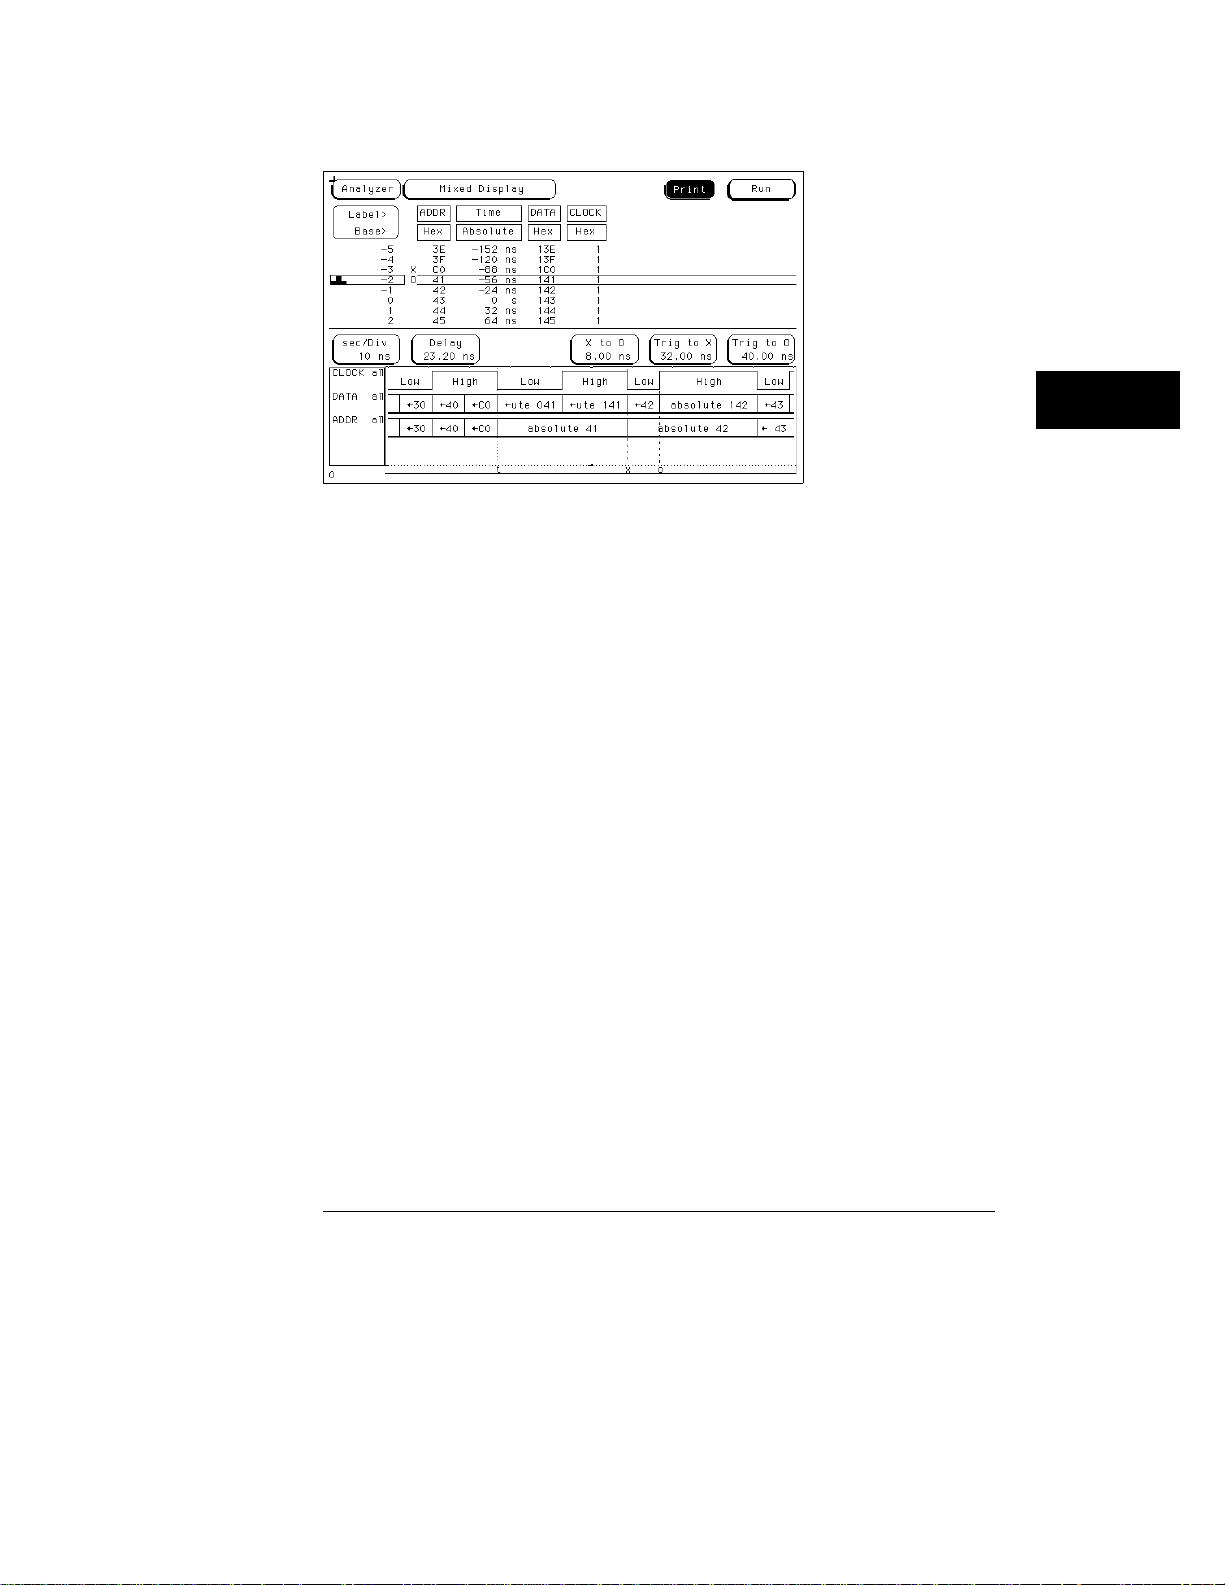
To view trace lists and waveforms on the same display
Mixed Display Using Timing and State in the HP 1671D
Triggering Ex amples
5-31
Page 100

5-32
 Loading...