

Page 1
User Manual
WITH AEMC® INSTRUMENTS
Class
A
POWERP
POWERP
ENGLISH
PowerPad® IV
Model 8345
D IV
D IV
POWER QUALITY ANALYZER
Find Quality Products Online at: [email protected]
www.GlobalTestSupply.com
Page 2

Copyright © Chauvin Arnoux®, Inc. d.b.a. AEMC® Instruments. All rights reserved.
No part of this documentation may be reproduced in any form or by any means (including electronic
storage and retrieval or translation into any other language) without prior agreement and written consent
from Chauvin Arnoux
®
, Inc., as governed by United States and International copyright laws.
This documentation is provided “as is,” without warranty of any kind, express, implied, or otherwise.
Chauvin Arnoux
but does not warrant the accuracy or completeness of the text, graphics, or other information contained
in this documentation. Chauvin Arnoux®, Inc. shall not be liable for any damages, special, indirect,
incidental, or inconsequential; including (but not limited to) physical, emotional or monetary damages
due to lost revenues or lost prots that may result from the use of this documentation, whether or not the
user of the documentation has been advised of the possibility of such damages.
Find Quality Products Online at: [email protected]
®
, Inc. has made every reasonable eort to ensure that this documentation is accurate;
www.GlobalTestSupply.com
Page 3

Statement of Compliance
Chauvin Arnoux®, Inc. d.b.a. AEMC® Instruments
certifies that this instrument has been calibrated using
standards and instruments traceable to international
standards.
We guarantee that at the time of shipping your
instrument has met its published specifications.
An NIST traceable certificate may be requested at
the time of purchase, or obtained by retur
instrument to our repair and calibration facility, for
a nominal charge.
The recommended calibration interval for this
instrument is 12 months and begins on the date of
receipt by the customer. For recalibration, please
use our calibration services. Refer to our repair and
calibration section at
Serial #:
ning the
Catalog #: 2136.35 / 2136.36
Model #: 8345
Please fill in the appropriate date as indicated:
Date Received:
Date Calibration Due:
Chauvin Arnoux®, Inc.
d.b.a AEMC® Instruments
Find Quality Products Online at: [email protected]
www.GlobalTestSupply.com
Page 4

TABLE OF CONTENTS
1. INTRODUCTION ................................................................................1
1.1 PRECAUTIONS FOR U S E ........................................................ 2
1.2 R ECEIVI NG YOUR SH IPMEN T ................................................ 2
1.3 ORDERING INFORMATION .....................................................3
1.3.1 Accessories ....................................................................................3
1.3.2 Replacement Parts ........................................................................3
1.5 CHARG ING TH E B ATT E RY ...................................................... 4
1.6 CH OOSI N G A LANGUAGE FOR THE D I SPL AY ....................4
2. PRODUCT FEATURES .....................................................................5
2.1 DESCRIPTION ...........................................................................5
2.1.1 Recording Functions.......................................................................5
2.1.2 Display Functions ...........................................................................6
2.1.3 Measurement Functions ................................................................7
2.1.4 Conguration Functions .................................................................7
2.2 OVER ALL VI EW ........................................................................8
2.3 M E A SU R EM ENT TER M IN ALS ................................................9
2.4 SIDE CO NNECTO RS ................................................................ 9
2. 5 BATTE RY ..................................................................................10
2.6 DISPLAY UNIT ......................................................................... 10
2.7 ON/OF F B UTTON ....................................................................10
2.8 KEY PAD .................................................................................... 11
2.8.1 Mode Buttons (Purple Buttons) ....................................................11
2.8.2 Navigation Buttons ......................................................................11
2.8.3 The Other Buttons .......................................................................12
2.8.4 The Function Buttons (8 Yellow Buttons) ...................................12
2.9 INSTALLIN G T HE COLO R C ODES ....................................... 12
2.10 MEMORY CARD ..................................................................... 13
2.11 PROP .......................................................................................14
2.12 MAGN E T I Z E D H OOK (OPTI ONA L) ......................................14
3. CONFIGUR ATION ...........................................................................15
3.1 NAVIGATION ............................................................................ 15
3.2 USERS ...................................................................................... 15
3.3 CONFIGURING THE INSTRU MENT ..................................... 17
3.3.1 Language .....................................................................................17
3.3.2 Date and Time .............................................................................17
3.3.3 Display .........................................................................................19
3.3.4 Memory ........................................................................................19
Find Quality Products Online at: [email protected]
www.GlobalTestSupply.com
Page 5

3.3.5 Network........................................................................................21
3.3.6 Updating the Embedded Software ..............................................23
3.3.7 Information ...................................................................................24
3.4 CONFIG URIN G T HE MEASU R E MENT................................. 24
3.4.1 Calculation Methods ....................................................................25
3.4.2 The Distribution Network and the Type of Connection ...............28
3.4.3 Sensors and Ratios .....................................................................33
3.4.4 Trend Mode ..................................................................................34
3.4.5 Transient Mode ............................................................................36
3.4.6 Inrush Current Mode ....................................................................37
3.4.7 Alarm Mode .................................................................................38
3.4.8 Energy Mode ...............................................................................39
3.4.9 Monitoring Mode ..........................................................................40
3.4.10 Flagging......................................................................................40
4. OPERATION ..................................................................................... 41
4.1 TURNING THE INSTRUMENT ON ......................................... 41
4.2 NAVIGATION ............................................................................ 41
4.2.2 Touch Screen...............................................................................41
4.2.3 Remote User Interface ................................................................41
4.3 CONFIGURATION ...................................................................43
4.4 CONNECTIONS .......................................................................43
4.4.1 Single-Phase Network .................................................................43
4.4.2 Split-Phase Network ....................................................................43
4.4.3 Three-Phase Network .................................................................44
4.4.4 Connection Procedure .................................................................44
4.5 INSTRUMENT FUNCTIONS ...................................................45
4.5.1 Measurements .............................................................................45
4.5.2 Screenshot...................................................................................45
4.5.3 Help..............................................................................................46
4.6 TURNING THE INSTRU MENT OFF ......................................46
4.7 SAFETY S TATUS .....................................................................46
5. WAVE FORM ..................................................................................... 47
5.1 DISPLAY FILTER...................................................................... 47
5.2 ROOT ME AN SQUARE (RM S) FUNC T I ON ...........................48
5.3 TOTAL HARMONIC DISTORTION (THD) FUNCTION ......... 49
5.4 CREST FACTOR (CF) FUNCT I ON .........................................49
5.5 M IN-MAX FUNCTION .............................................................50
5.6 SUMM ARY FUN CT I ON ........................................................... 51
5.7 PHASO R FUN CTI O N ..............................................................53
Find Quality Products Online at: [email protected]
www.GlobalTestSupply.com
Page 6

6. HARMONICS ....................................................................................55
6.1 DISPLAY FILTER......................................................................56
6.2 EX AMPL ES OF SCR E ENS .....................................................57
7. POWER..............................................................................................59
7.1 DISPLAY FIL TER ......................................................................59
7.2 EXAMPLES O F S C REENS .....................................................59
8. ENERGY ............................................................................................61
8.1 DISPLA Y FILTER...................................................................... 61
8.2 EXAM P L ES O F S C REENS ..................................................... 62
9. TREND MODE ..................................................................................63
9.1 STARTING A R EC ORDI NG .....................................................63
9.2 THE LIST O F RECOR D INGS .................................................64
9.3 READ I NG A RECO RDIN G ......................................................65
10. TRANSIENT MODE .......................................................................68
10.1 S TART I N G A RECOR DING ...................................................68
10.2 T H E L I ST OF RECORDI N GS ...............................................69
10.3 READ ING A REC ORDI N G .................................................... 70
11. INRUSH CUR R ENT MO D E ........................................................... 73
11.1 STARTIN G A C APTURE ........................................................73
11.2 THE LIST O F CAPTURES ..................................................... 74
11.3 READING A CA PTUR E ......................................................... 74
11.3.1 RMS Values ................................................................................75
11.3.2 Instantaneous Values.................................................................76
12. ALARM MODE ...............................................................................78
12.1 P ROGRAMMIN G AN ALAR M RECORDIN G ....................... 78
12.2 THE LIST O F ALARM R EC ORDI N GS .................................79
12.3 STARTI N G AN ALAR M RECORDIN G .................................80
13. MONITORING MODE ....................................................................81
13.1 START ING A MO NITORING REC ORDI NG .........................81
13.2 THE LIST O F M ONITO R I NG RECO RDIN GS......................83
13.3 READ I NG A MON I TORIN G R EC ORDING ..........................84
14. SCREENSHOTS .............................................................................85
14.1 TAKING A SCREENSHOT .....................................................85
14.2 MANAGING THE SCREENSHOTS ......................................85
14.2.1 Displaying a Screenshot ............................................................86
15. HE LP ...............................................................................................87
16. APPLICATION SOFTWARE .........................................................88
16.1 OBTAINING THE SOFTWARE .............................................88
Find Quality Products Online at: [email protected]
www.GlobalTestSupply.com
Page 7

17. T EC H N ICAL SPECIFICATION S ...................................................89
17.1 REFERENCE CONDITIONS .................................................89
17.2 ELECTRICAL SPECIFICATION S..........................................92
17.2.1 Input Voltage Specications .......................................................92
17.2.2 Current Input Specications .......................................................92
17.2.3 Bandwidth and Sampling ...........................................................92
17.2.4 Instrument Specications (Without Current Sensors) ...............94
17.2.5 Specications of the Current Sensors .................................... 104
17.2.6 Uncertainty of the Real-Time Clock .........................................105
17.3 M EMORY CARD ...................................................................105
17.4 POWER SUPPLY ..................................................................106
17.4.1 Battery ..................................................................................... 106
17.4.2 External Power Supply .............................................................107
17.4.3 Battery Life ...............................................................................107
17.5 DISPLAY CONDITIONS.......................................................108
17.6 ENVIRONMENTAL CONDITIONS ...................................... 108
17.7 MECHANICAL SPECIFICATIONS ......................................109
17.8 COMPLIAN C E W I T H INTERNATIONAL STANDARDS .... 109
17.8.1 Electrical Safety ....................................................................... 109
17.8.2 Standard IEC 61000-4-30, Class A .........................................110
17.8.3 Measurement Uncertainties and Ranges ................................110
17.8.4 Markings per IEC 62586-1 .......................................................112
17.9 ELECTROMAGNETIC COMPATIBI LITY (EMC) .................112
17.10 R A DIO EMISSIONS ............................................................112
17.1 1 GPL CODE ............................................................................112
18. MAINTENANCE ............................................................................113
18.2 SENSOR MAI NTENANCE ...................................................113
18.3 BATT E RY R E P LACEMENT .................................................113
18.4 M EMORY CARD ...................................................................115
18.5 UPDATING THE FIRMWARE ..............................................115
18.6 REPAIR AND CALIBR ATION...............................................116
18.7 TECHNICAL ASSISTANCE ..................................................116
18.8 LIMITED WARRANTY ..........................................................117
18.8.1 Warranty Repairs .....................................................................117
20.1 NOTATION .............................................................................118
20.2 FORMULAS ...........................................................................119
20.2.1 RMS Values .............................................................................119
20.2.2 Peak Values .............................................................................119
20.2.3 Crest Factor .............................................................................119
Find Quality Products Online at: [email protected]
www.GlobalTestSupply.com
Page 8

20.2.4 Levels of Harmonics and Interharmonics ................................119
20.2.5 Level of Unbalances ................................................................120
20.2.6 Mains Signaling Voltages (MSV) .............................................120
20.2.7 Level of Harmonic Group Distortion ........................................121
20.2.8 Distortion .................................................................................121
20.2.9 K Factor and Harmonic Loss Factor ........................................121
20.2.10 Frequency ..............................................................................122
20.2.11 DC Component ......................................................................122
20.2.12 Active Power (P) .....................................................................122
20.2.13 Fundamental Active Power (Pf) .............................................122
20.2.14 Fundamental Reactive Power (Qf) .........................................123
20.2.15 Harmonic Active Power (PH) ..................................................123
20.2.16 DC Power (PDC) ......................................................................123
20.2.17 Apparent Power (S) ................................................................123
20.2.18 Non-Active Power (N) ............................................................124
20.2.19 Distorting Power (D) ...............................................................124
20.2.20 Power Factor (PF), Power Factor of Fundamental (PF1) ......124
20.2.21 Tangent ..................................................................................125
20.3 F L IC KE R ............................................................................... 125
20.4 S OURCE S O F D I S T R IBUTION SU P P ORTED BY T H E
INSTRUMENT ..............................................................................126
20.5 HYSTERESIS ....................................................................... 126
20.5.1 Voltage Swell Detection ...........................................................126
20.5.2 Voltage Dip and Voltage Interruption Detection ......................126
20.6 M INIM UM SCA L E VA LU ES OF WAVEFORMS AN D
MIN I MUM R M S VA LU ES............................................................. 127
20.7 FOU R-QUA DR ANT DI AG RAM ........................................... 127
20.8 TRANSIENT CAPTURE TRIGGERING MECHANISM .... 128
20.9 C ONDI T I ONS OF C APTURE IN I NRUSH C URRE N T
MODE ............................................................................................128
20.10 GLOSSARY .........................................................................129
20.11 UNIT PREFI XES .................................................................134
Find Quality Products Online at: [email protected]
www.GlobalTestSupply.com
Page 9
1. INTRODUCTION
Thank you for purchasing an AEMC® Instruments PowerPad® IV Model 8345.
For best results from your instrument and for your safety, read the enclosed
operating instructions carefully and comply with the precautions for use.
Only qualied and trained operators should use this product.
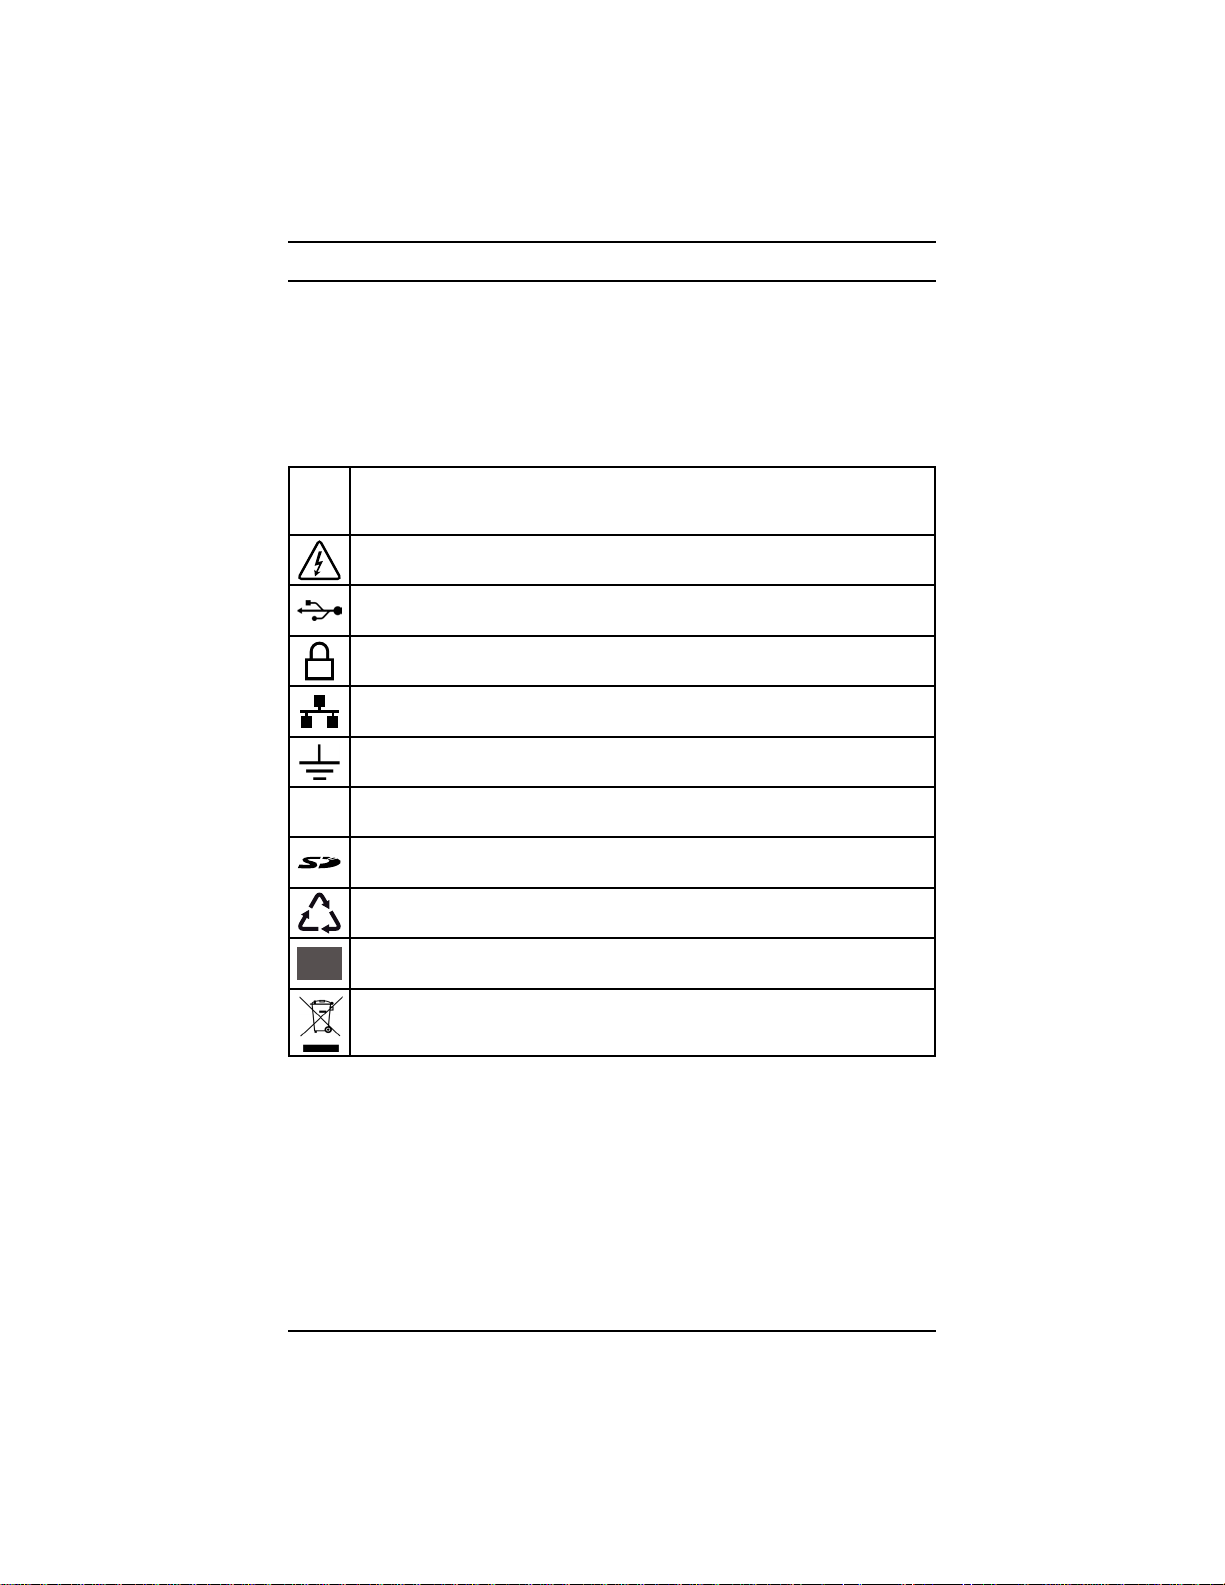
Symbols
CAUTION - Risk of Danger! Indicates a WARNING. Whenever this symbol
is present, the operator must refer to the user manual before operating the
instrument in all cases where this symbol is present
Indicates a risk of electric shock. The voltage at the parts marked with this
symbol may be dangerous
USB socket
Kensington anti-theft lock
Ethernet connector (RJ45)
Ground/Earth
Indicates important information to acknowledge
SD card
This product has been declared recyclable following an analysis of the life
cycle in accordance with standard ISO 14040
This product complies with the Low Voltage & Electromagnetic Compatibility
European directives (73/23/CEE & 89/336/CEE)
In the European Union, this product is subject to a separate collection system
for recycling electrical and electronic components in accordance with directive
WEEE 2002/96/EC
Denition of Measurement Categories (CAT)
CAT IV corresponds to measurements at the source of low-voltage installations.
Example: power feeders, counters, and protection devices.
CAT III corresponds to measurements on building installations.
Example: distribution panel, circuit-breakers, machines, and xed industrial devices.
CAT II corresponds to measurements on circuits directly connected to
low-voltage installations.
Example: power supply to domestic electrical devices and portable tools.
Power Quality Analyzer PowerPad® IV Model 8345 1
Find Quality Products Online at: [email protected]
www.GlobalTestSupply.com
Page 10

1.1 PRECAUTIONS FOR USE
This instrument complies with safety standard IEC/EN 61010-2-030 or BS EN
61010-2-030. The leads comply with IEC/EN 61010-031 or BS EN 61010-031.
The current sensors comply with IEC/EN 61010-2-032 or BS EN 61010-2-032
for up to 600 V in CAT IV.
Failure to observe the precautions for use may create a risk of electric shock,
re, explosion, or destruction of the instrument and installations.
■
Only competent and accredited personnel may perform troubleshooting or
metrological checks
■
The operator and responsible authority must read and understand the
various precautions to take before and during use
■
The operator must have knowledge and awareness of electrical hazards
when using this instrument
Do not use the instrument in an unspecied manner; otherwise, the
protection that the instrument provides may become compromised and
endanger you
Do not use the instrument on networks that exceed the instrument’s
specications for voltage or category
Do not use the instrument if it seems to be damaged, incomplete, or
improperly closed
Do not use the instrument without its battery
Before each use, check the condition of the insulation on the leads,
housing, and accessories. Any item with deteriorated insulation (even
partially) must be set aside for repair or scrapping
Ensure that your instrument is completely dry before use. If it is wet, you
must dry it completely before connecting or using it
Use only the supplied leads and accessories. If you use any leads or
accessories with lower voltage or category ratings, you are limited to lowest
voltage or category rating
Use personal protection equipment when appropriate
Keep your hands away from the instrument’s terminals
Keep your ngers behind the physical guards when handling the leads, test
probes, and alligator clips
Use only the manufacturer-provided power supply unit and battery pack
because these items have specic safety components
At hazardous voltages, certain current sensors must not be placed on or
removed from bare conductors. Please refer to each sensor’s data sheet
and comply with their handling instructions
1.2 RECEIVIN G YOUR SHI P MENT
Upon receiving your shipment, make sure that the contents are consistent with
the packing list. Notify your distributor of any missing items. If the equipment
appears to be damaged, le a claim immediately with the carrier and notify your
distributor at once with a detailed description of any damage. Save the damaged
packing container to substantiate your claim.
2 Power Quality Analyzer PowerPad® IV Model 8345
Find Quality Products Online at: [email protected]
www.GlobalTestSupply.com
Page 11

1.3 ORDERING INFORMATION
PowerPad® IV Model 8345 (No Probes) .......................................Cat. #2136.35
Includes meter, extra-large tool bag, internal carrying pouch, hand strap, USB
cable, ve 10 ft black voltage leads with alligator clips, twelve color-coded input
ID markers, power adapter (PA32ER) with US power cord, two 6 ft stackable
leads, two 10 ft black voltage leads with alligator clips for power adapter
PA32ER, SD Card, one power plug adaptor for PA32ER, 5.8 A·h Li-ion battery
pack, quick start guide, and USB stick with DataView® software and user manual.
PowerPad
®
IV Model 8345 (w/4 MA194-24-BK Sensors) ............Cat. #2136.36
Includes meter, extra-large tool bag, internal carrying pouch, hand strap, four
MA194-24-BK sensors, USB cable, ve 10 ft black voltage leads with alligator
clips, twelve color-coded input ID markers, power adapter (PA32ER) with US
power cord, two 6 ft stackable leads, two 10 ft black voltage leads with alligator
clips for power adapter PA32ER, SD Card, one power plug adaptor for PA32ER,
5.8 A·h Li-ion battery pack, quick start guide, and USB stick with DataView®
software and user manual.
1.3.1 Accessories
AC/DC Current Probe Model MR193-BK .........................................Cat. #2140.28
AC Current Probe Model MN93-BK .................................................Cat. #2140.32
AC Current Probe Model SR193-BK................................................Cat. #2140.33
AmpFlex
AmpFlex
AC Current Probe Model MN193-BK ...............................................Cat. #2140.36
MiniFlex
MiniFlex
Magnetic Hook for use with PowerPad
®
Model 193-24-BK ............................................................Cat. #2140.34
®
Model 193-36-BK ...........................................................Cat. #2140.35
®
Sensor Model MA193-10-BK ...........................................Cat. #2140.48
®
Sensor Model MA193-14-BK ...........................................Cat. #2140.50
®
IV Model 8345 ................. Cat. #5100.16
1.3.2 Replacement Parts
Carrying Bag .................................................................................... Cat. #2133.76
Lead - Set of 5, 10 ft (3M) Black Leads
w/5 Black Alligator Clips ...................................................................Cat. #2140.43
Lead - One 10 ft (3M) Black Lead w/1 Black Alligator Clip ..............Cat. #2140.44
Cable - Replacement 5 ft USB Cable ..............................................Cat. #2140.46
Sensor - MiniFlex
Battery-5.8 AH 64 WH Li-ion Battery Pack .....................................Cat. #2960.47
Adapter - Replacement Power Plug Adapter for PA32ER ............... Cat. #5100.14
Adapter - Replacement 1000 V PA32ER
Power Supply for Model 8345 .......................................................... Cat. #5100.15
Power Quality Analyzer PowerPad® IV Model 8345 3
®
Sensor Model MA194-24-BK ............................Cat. #2140.80
Find Quality Products Online at: [email protected]
www.GlobalTestSupply.com
Page 12
1.5 CHARGING THE B ATTERY
Before using the instrument, you must fully charge the battery.
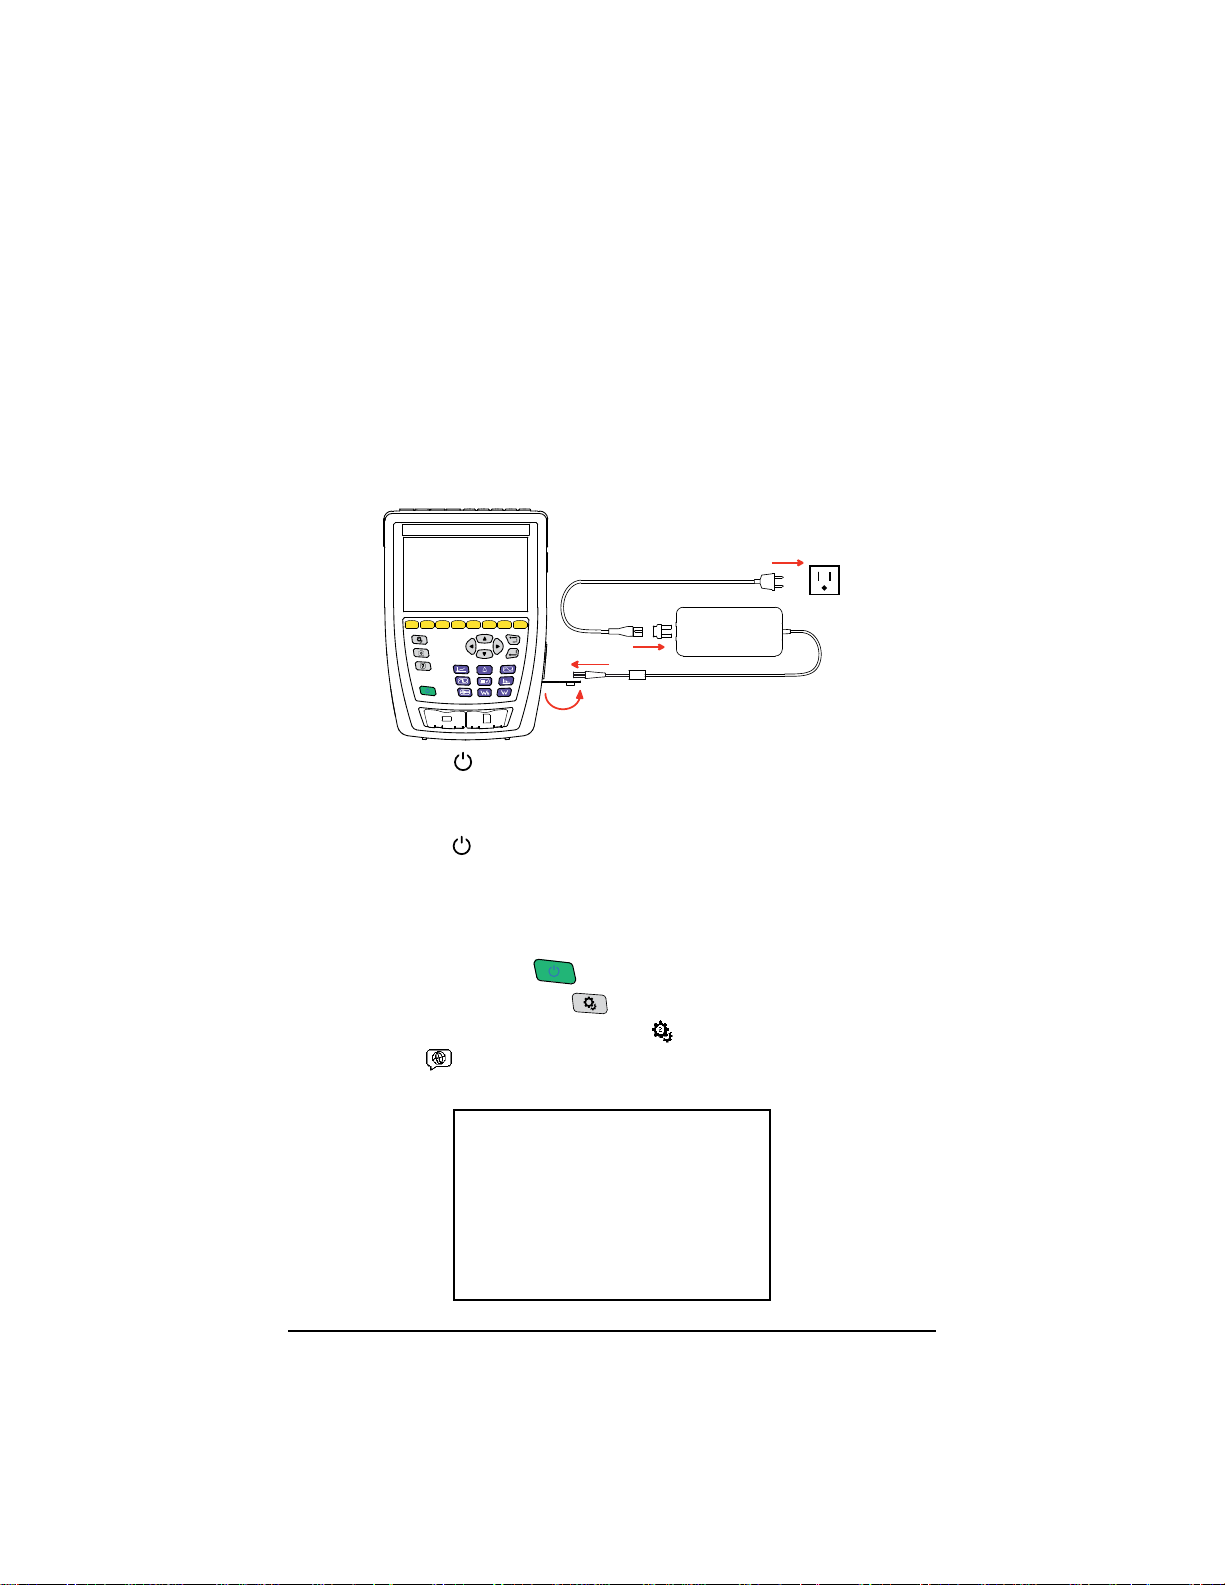
1. Remove the plastic lm preventing the connection between the battery and
instrument. To do this, refer to § 18.3, which explains how to remove the
battery from the instrument.
2. Connect the power cord to the power supply unit.
3. Plug the power cord into an outlet.
4. Open the elastomer cover that protects the power socket.
5. Connect the power supply’s 4-point connector to the instrument.
120 V ± 15 %, 60 Hz
230 V ± 15 %, 50 Hz
The ON/OFF button
the charging status.
When the battery is fully depleted, the charging time is approximately 6 hours.
The ON/OFF button
will blink while charging, and the display unit will indicate
will glow steady green when the battery is fully charged.
1.6 CHOOSI NG A LANGUAGE FOR T HE DI SPLAY
You must choose a language for the display before using the instrument. The
8345 has more than 20 languages available to choose from.
1. Press the ON/OFF button
2. Press the conguration button
3. Press the second yellow function button
4. Then, press
5. Choose your desired language from the list that appears.
to open the language menu.
to turn the instrument on.
.
.
4 Power Quality Analyzer PowerPad® IV Model 8345
Find Quality Products Online at: [email protected]
www.GlobalTestSupply.com
Page 13

2. PRODUCT FEAT U R ES
2.1 DESCRIPTION
The PowerPad® IV Model 8345 is a portable, three-phase power quality
analyzer that complies with the standards governing the methods of power
quality measurement, IEC 61000-4-30, Class A.
The 8345 can be used to:
■
Measure RMS values, powers, and disturbances of power distribution
networks
■
Take snapshots of the main specications of three-phase networks
■
Track variations of dierent parameters over time
The Model 8345 has a wide array of features that include the following:
■
Less than 0.1 % uncertainty for voltage measurements and less than 1 %
uncertainty for current measurements
■
Large selection of current sensors for measurements that range from a few
milliamperes to several kiloamperes
■
Built-in rechargeable battery
■
Compact and impact-resistant housing
■
Large, color, touch-screen graphic display unit
■
Up to three user proles
■
SD card for storing a large quantity of measurements and photographs that
can be read directly on a PC. You can also use a USB drive (optional)
■
Communication via USB, Wi-Fi, or Ethernet
■
Remote control from a PC, tablet, or smartphone via the remote user
interface (VNC)
■
Application software for processing recorded data and generating reports
2.1.1 Recording Functions
The 8345 has recording functions for various measurements and calculations:
■
RMS values of AC voltages up to 1000 V between terminals. Using ratios,
the instrument can reach hundreds of gigavolts
■
RMS values of AC currents up to 10,000 A (neutral included). Using ratios,
the instrument can reach hundreds of kiloamperes
■
Detection of current sensor types and powering of the sensor, if necessary
■
DC component of voltages and currents (neutral included)
■
RMS voltage and current over minimum and maximum half-cycles
(neutral excluded)
■
Direct, inverse, and zero sequence voltages and current unbalance
■
Inrush current for motor start-up applications
■
Peak values of voltages and currents (neutral included)
■
50 Hz and 60 Hz network frequency
Power Quality Analyzer PowerPad® IV Model 8345 5
Find Quality Products Online at: [email protected]
www.GlobalTestSupply.com
Page 14

■
Current and voltage crest factors (neutral included)
■
Harmonic loss factor (FHL) for application to transformers in the presence
of harmonic currents
■
K factor (FK) for application to transformers in the presence of harmonic
currents
■
40 alarms per user prole
■
Log of events, such as voltage dips, voltage swells, interruptions, transients,
rapid voltage changes (RVC), and synchronization
■
Total harmonic distortion of currents and voltages (neutral excluded)
referred to the fundamental (THD in %f)
■
Total harmonic distortion of currents and voltages (neutral included) referred
to the AC RMS value (THD in %r)
■
Active, reactive (capacitive and inductive), non-active, distorting, and
apparent power, per phase and total (neutral excluded)
■
Power factor (PF) and displacement factor (DPF or cos φ) (neutral excluded)
■
Distorting RMS value (d) for currents and voltages (neutral excluded)
■
Short-term icker of voltages (Pst) (neutral excluded)
■
Long-term icker of voltages (Plt) (neutral excluded)
■
Active, reactive (capacitive and inductive), non-active distorting, and
apparent energy, per phase and total (neutral excluded)
■
Energy valuation (€, $, £, etc.) with a basic rate and 8 special rates
■
Current and voltage harmonics (neutral included) up to order 63: RMS
value, percentages referred to the fundamental (%f) (neutral excluded) or to
the total RMS value (%r), minimum and maximum, and harmonic
sequence level
■
Apparent harmonic power (neutral excluded) up to order 63: percentages
referred to the fundamental apparent power (%f) or to the total apparent
power (%r), minimum and maximum of one order level
■
Current and voltage interharmonics up to order 62 (neutral included)
■
Synchronization with UTC with a choice of time zone
■
Monitoring mode to check the compliance of the voltages
■
Information signals on the CPL (MSV)
2.1.2 Display Functions
The 8345 has functions to display the following:
■
Waveforms for voltages and currents
■
Bargraphs of voltage and current harmonics
■
Screenshots
■
Instrument information, such as the serial number, software version, MAC,
Ethernet, USB, Wi-Fi addresses, and more
■
Recordings for trends, alarms, transients, and inrush currents
6 Power Quality Analyzer PowerPad® IV Model 8345
Find Quality Products Online at: [email protected]
www.GlobalTestSupply.com
Page 15

2.1.3 Measurement Functions
The trend recording (data logging) function oers the following features.
■
Time-stamping
■
Programming the recording’s beginning and end
■
Representation, in barcharts or curves, of mean values for many
parameters as a function of time, with or without the MIN-MAX
■
4 congurations per user prole
The transients function oers the following features.
■
Transient detection and recording for a chosen duration and on a chosen
date (the number of transients is limited by the SD card's size)
■
Programming of the transient recording’s beginning and end
■
Recording of 4 complete cycles in the 8 acquisition channels (one recording
before the transient-triggering event and three after)
■
Possibility of capturing shock waves up to 12 kV over a duration of 1 ms
The alarm function oers the following features.
■
A list of alarms recorded as a function of the thresholds programmed in the
conguration menu (up to 20,000 alarms)
■
Programming the session’s beginning and end
■
40 alarms per user prole
The inrush current function displays the following useful parameters for studying
motor start-up.
■
Instantaneous values of the current and voltage at the cursor's position
■
Absolute maximum instantaneous current and voltage over the starting event
■
Half-cycle RMS current and voltage (neutral excluded) at the
cursor’s location
■
Maximum half-cycle RMS current and voltage (over the starting event)
■
Instantaneous network frequency at the cursor's position
■
Maximum, mean, and minimum instantaneous network frequency over the
entire starting event
■
Time of motor start-up
2.1.4 Conguration Functions
The 8345 has conguration functions used to:
■
Set the date and time
■
Adjust the brightness
■
Choose the colors of the curves
■
Manage the screen’s auto-o
■
Choose the night mode display
■
Choose the language
■
Choose the calculation methods: whether non-active quantities are
Power Quality Analyzer PowerPad® IV Model 8345 7
Find Quality Products Online at: [email protected]
www.GlobalTestSupply.com
Page 16
broken down, the unit of energy, the K factor calculation’s coecients, the
N
L1
L2 L3
N
L1
L2 L3
reference for levels of harmonics, and the calculation of PLT (sliding window
or not)
■
Choose the distribution system: single-phase, two-phase, or three-phase
with or without neutral
■
Choose the connection method: standard, 2 elements, or 2½ elements
■
Congure the recordings, alarms, inrush currents, and transients
■
Erase the data (total or partial)
■
Display the current sensors: detected, not detected, not managed,
simulated, or impossible to simulate (2-element connection method)
■
Adjust the voltage and current ratios, transduction ratios, and sensitivity
■
Congure the communication links (Wi-Fi, Ethernet)
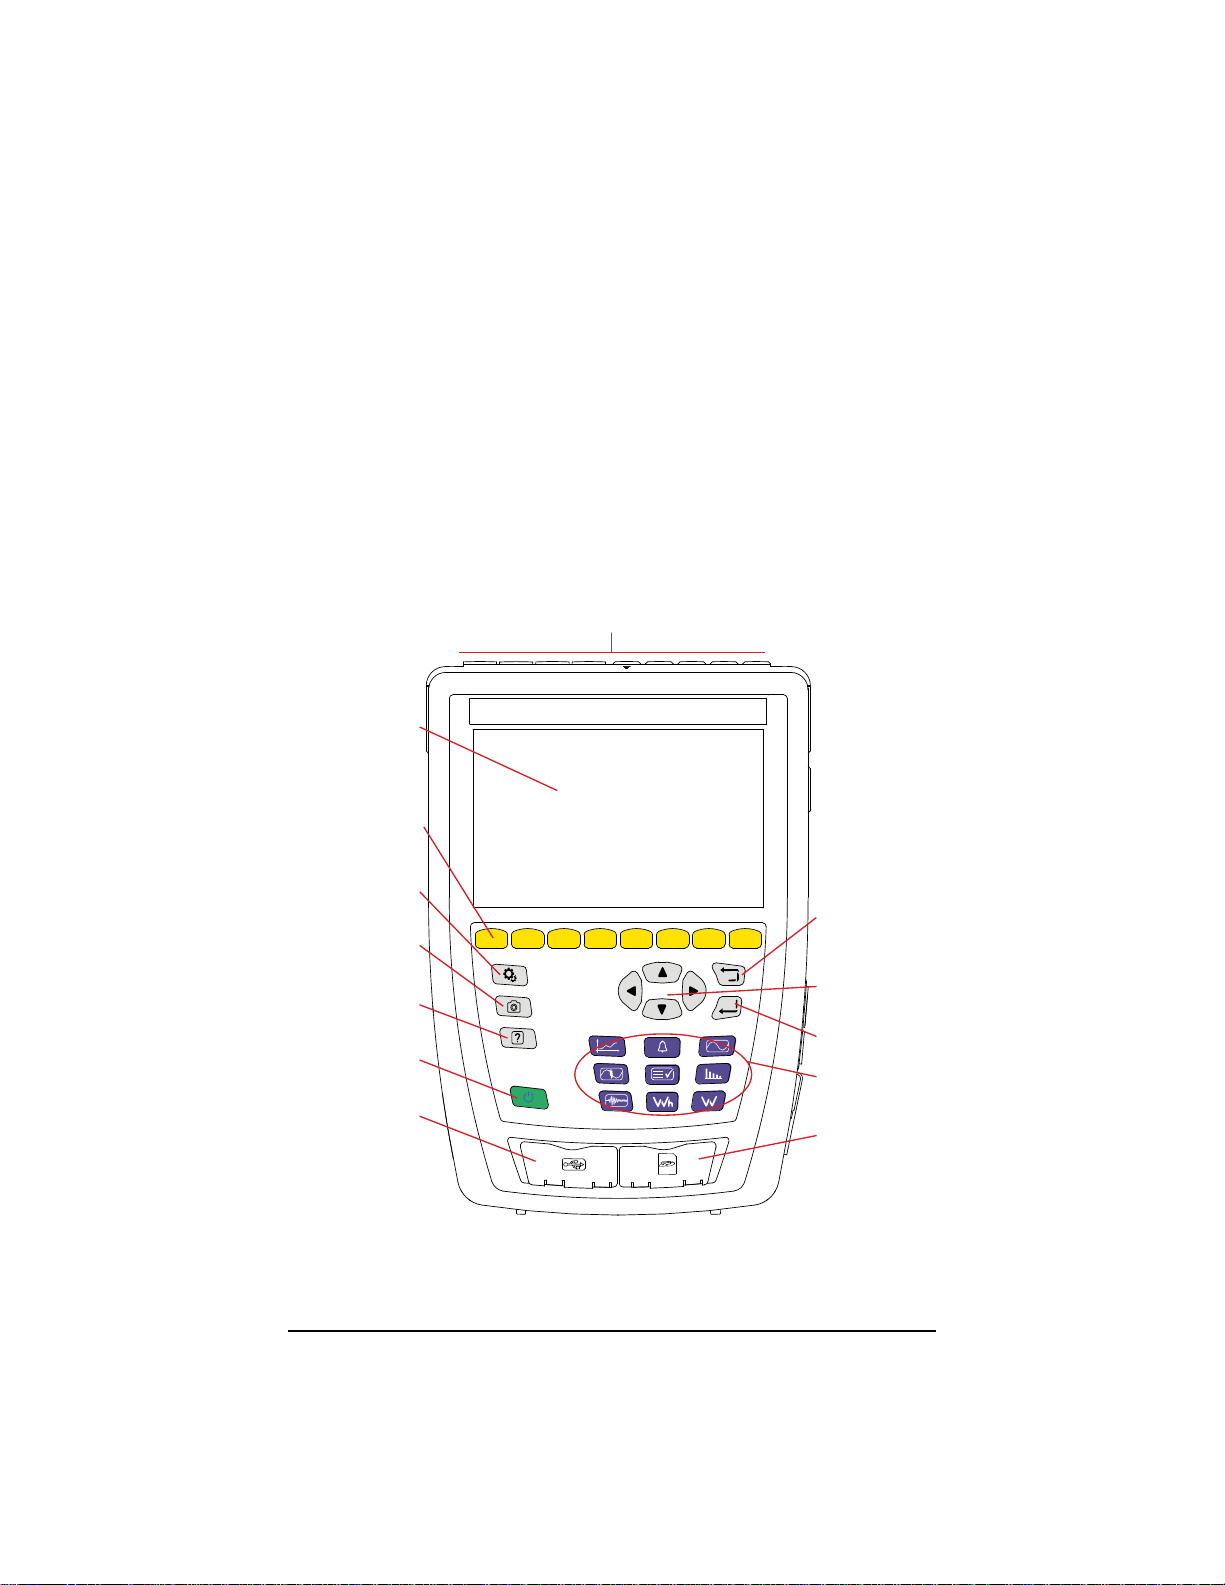
2.2 OVE RALL VIEW
Measurement terminals
Touch screen
Function buttons
(Yellow buttons)
Conguration button
Return button
Screenshot button
Navigation buttons
Help button
ON/OFF button
Conrm button
Mode buttons
(Violet buttons)
USB port
SD card slot
8 Power Quality Analyzer PowerPad® IV Model 8345
Find Quality Products Online at: [email protected]
www.GlobalTestSupply.com
Page 17
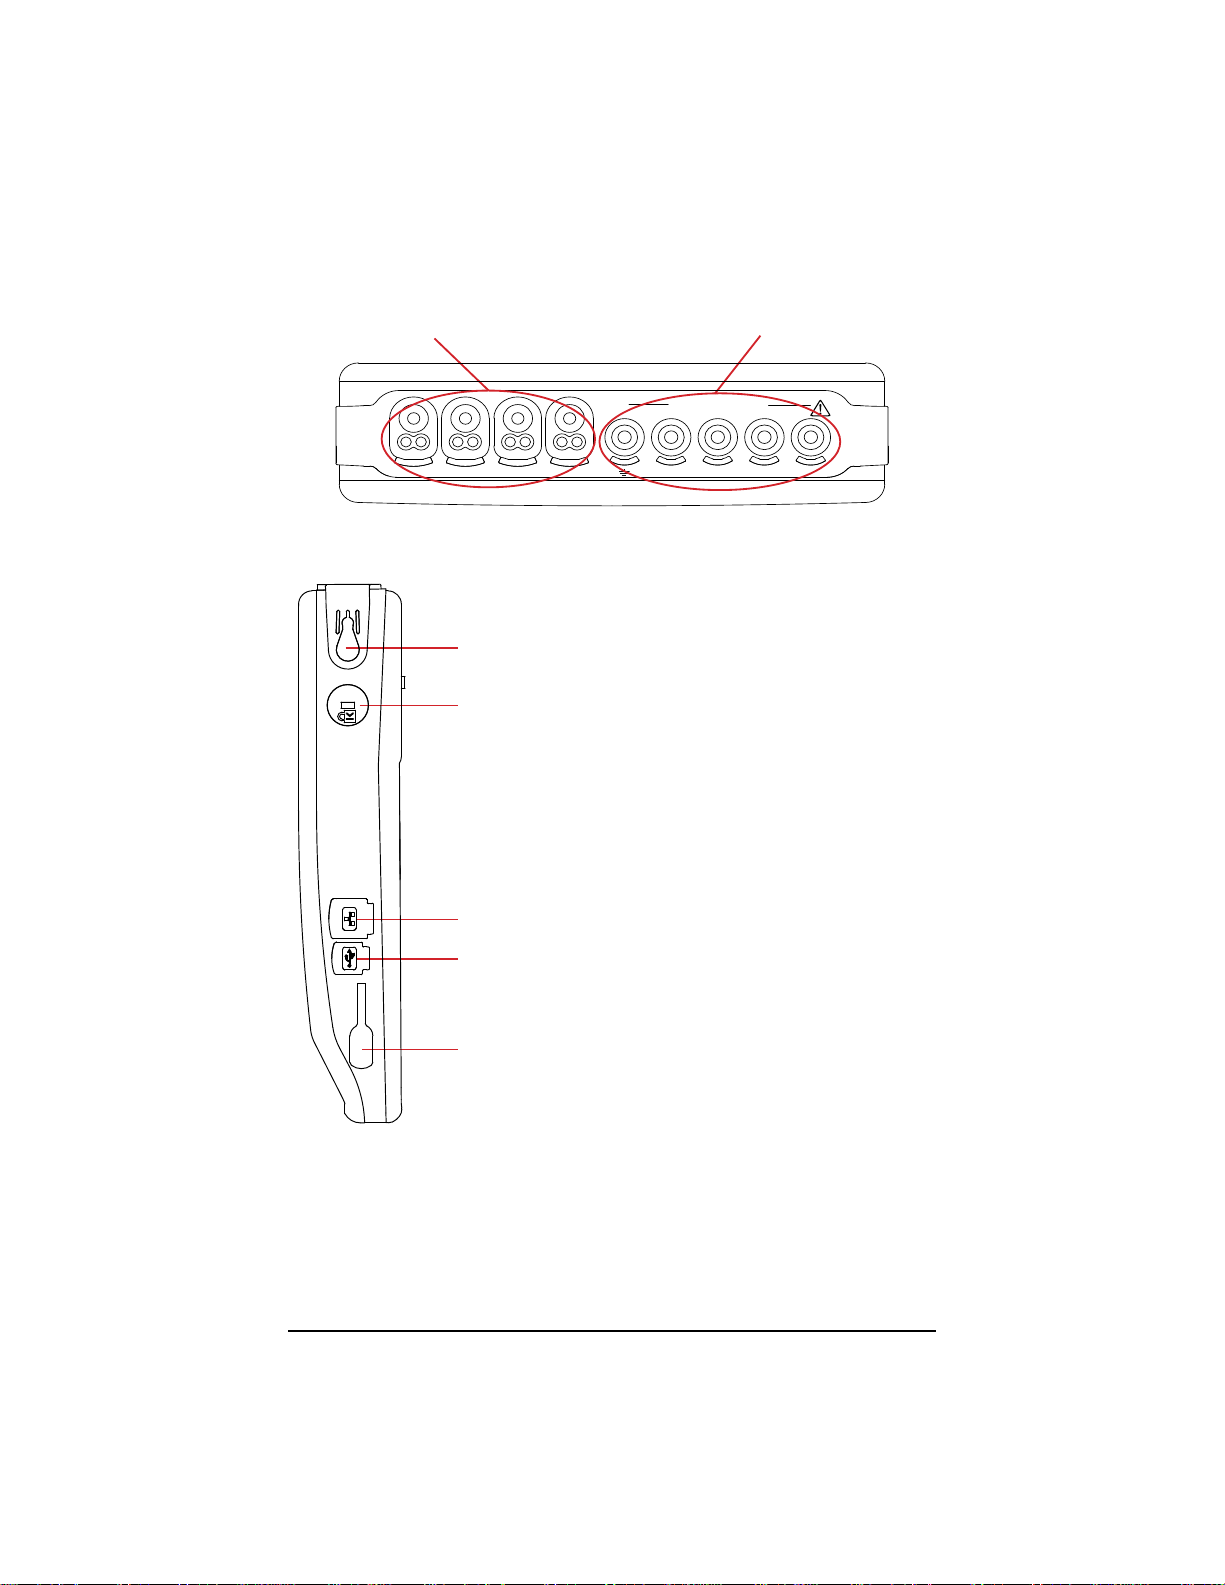
2.3 MEASUREMENT TE RMI NALS
1000V CAT IV
L2L1N
L3
L2L1N
L3
GND
4 current input terminals
(for current sensors)
2.4 SIDE CONNE CTORS
Strap attachment point
Theft-proong device for securing the instrument with a
Kensington lock
5 voltage input terminals
RJ45 connector for Ethernet connection
USB type B connector for connection to a PC
Special 4-point connector for the power supply. Used to charge
the battery or operate the instrument on external power
Power Quality Analyzer PowerPad® IV Model 8345 9
Find Quality Products Online at: [email protected]
www.GlobalTestSupply.com
Page 18
2.5 BATTERY
The instrument can operate on battery power or wall power. While the battery
charges, the instrument can operate on wall power. The battery contributes to
the operator’s safety, so do not use the instrument without its battery.
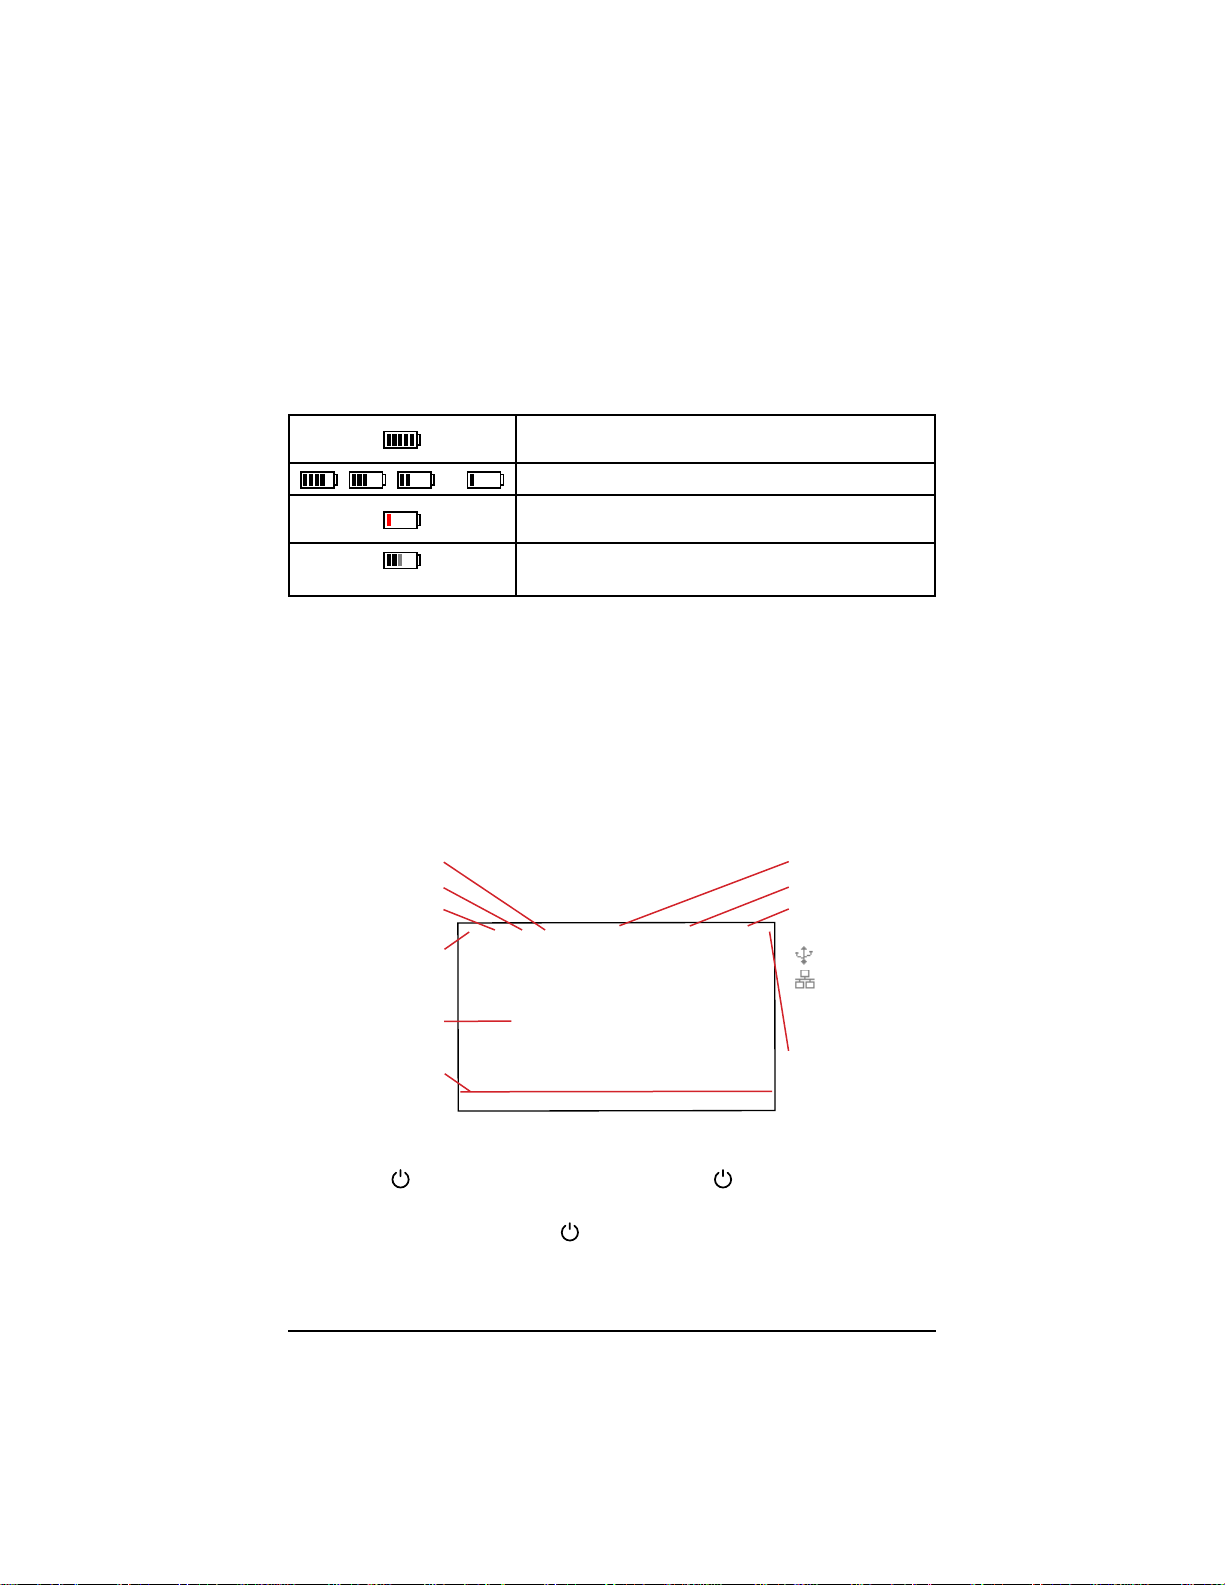
The instrument’s display has a battery indicator icon that shows the battery’s
status and remaining charge.
Indicates that the battery is fully charged or that the
new battery’s charge is unknown
, , , or
(one bar blinking)
Indicates the battery charge level
Indicates that the battery is fully discharged. You will
need to charge the battery completely
Indicates that the battery is charging
A message will be displayed if the remaining charge of the battery is too low to
ensure correct operation of the instrument.
If you do not connect the instrument to an external power source, the instrument
will turn o one minute after the message is displayed.
2.6 DISPLAY UNIT
The 8345 has a large, color, touch-screen display unit (WVGA).
At the top of the screen, the status bar reports the instrument’s status.
An example of a typical screen is below.
Screenshot
Help
Mode
Return to main screen
Frequency measured
Date and time
Connection:
USB drive
USB link
Ethernet link
Display for the chosen
mode and function
Available functions
(mode-dependent)
Battery charge level
2.7 ON/OFF BUTTON
Use the button to turn the instrument on. The button will blink orange
while the instrument is turning on.
When the battery is charging, the
steady green when the battery is fully charged.
If the instrument’s power is cut o suddenly or automatically, a message will be
displayed the next time it is turned on.
10 Power Quality Analyzer PowerPad® IV Model 8345
Find Quality Products Online at: [email protected]
www.GlobalTestSupply.com
button will blink green. The button will show
Page 19
Press the button again to turn the instrument o
The instrument will request conrmation if it is recording or metering energy,
recording transients or alarms, or capturing an inrush current.
If the power-o command is conrmed, the recordings will nalize, and the
instrument will turn o. Recordings will automatically resume the next time that
the instrument turns on.
If the instrument is o while connected to external power, the battery will charge.
If the display freezes and the instrument does not turn o by pressing
the
button, you can force it to turn o by holding the button for 10
seconds. If the instrument is forced to turn o, any in-progress recordings
on the SD card could be lost.
2.8 KEYPAD
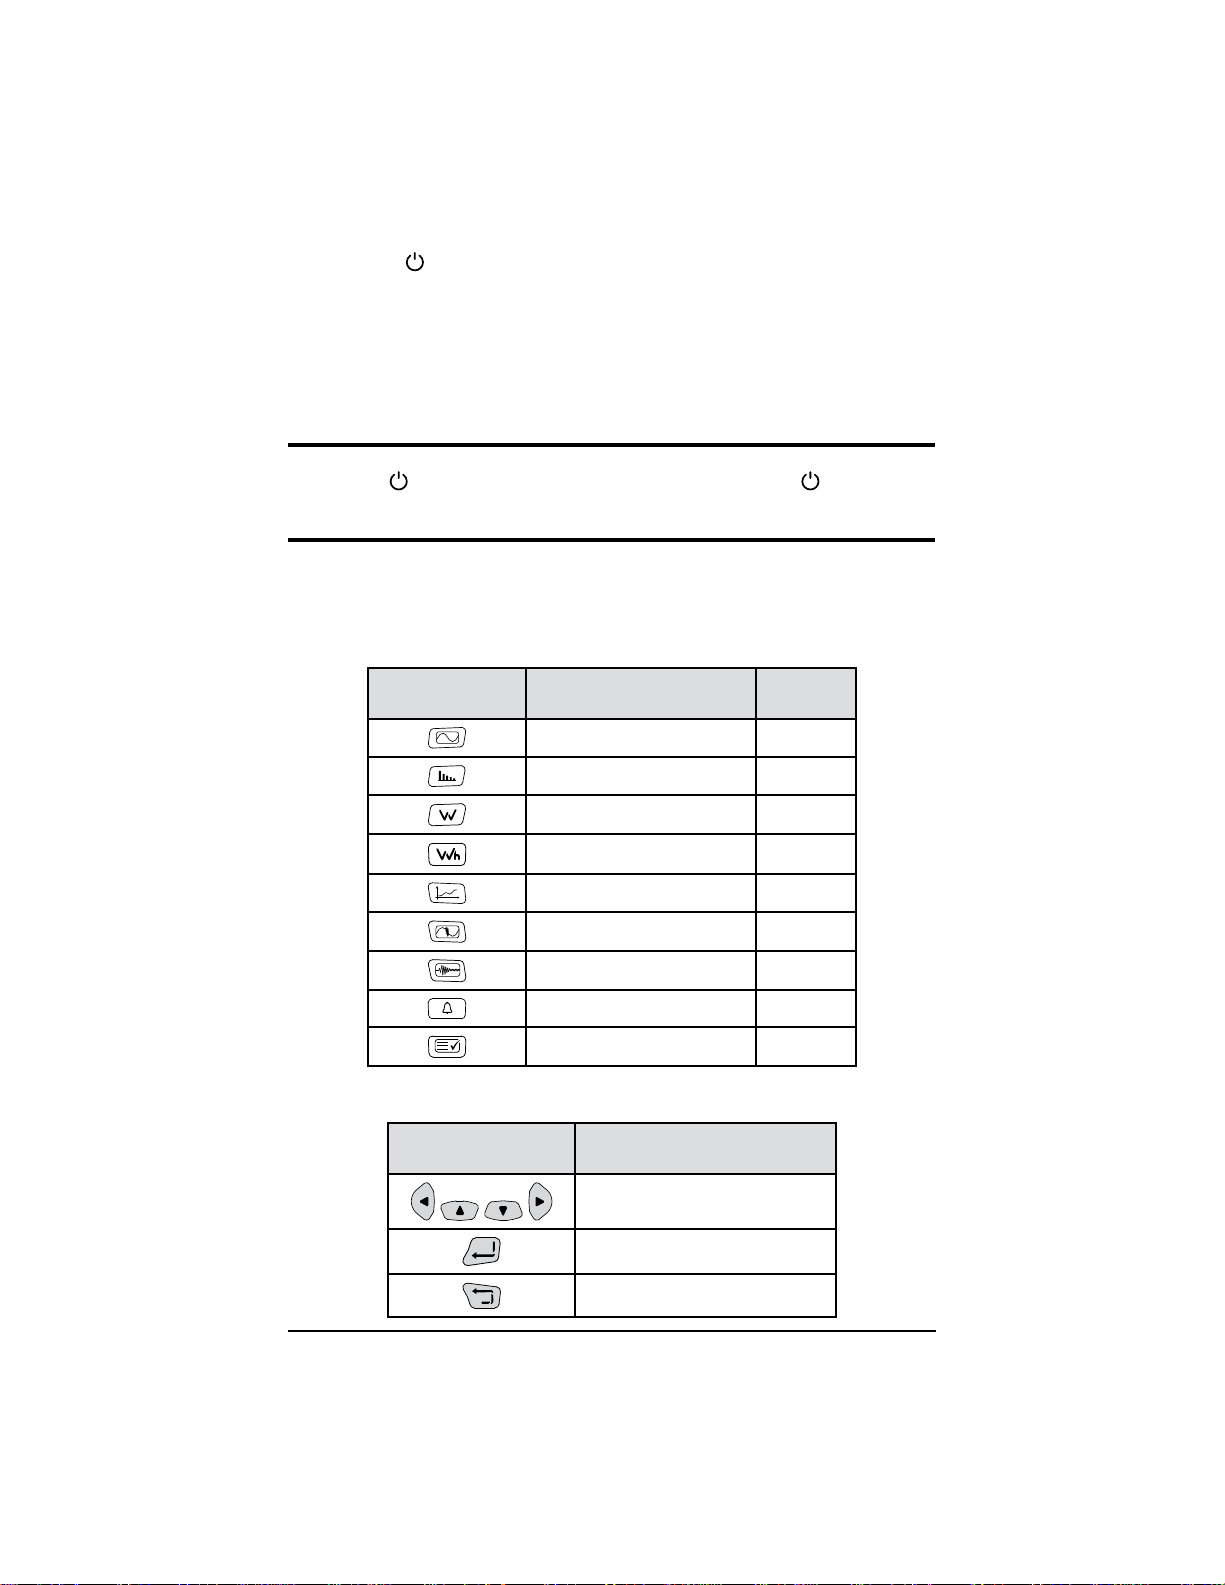
2.8.1 Mode Buttons (Purple Buttons)
These nine buttons are used to access specic modes:
Button Function See §
Waveform mode § 5
Harmonic mode § 6
Power mode § 7
Energy mode § 8
Trend mode § 9
Transient mode § 10
Inrush Current mode § 11
Alarm mode § 12
Monitoring mode § 13
2.8.2 Navigation Buttons
Button Function
Power Quality Analyzer PowerPad® IV Model 8345 11
Directional buttons
Conrm button
Return button
Find Quality Products Online at: [email protected]
www.GlobalTestSupply.com
Page 20
2.8.3 The Other Buttons
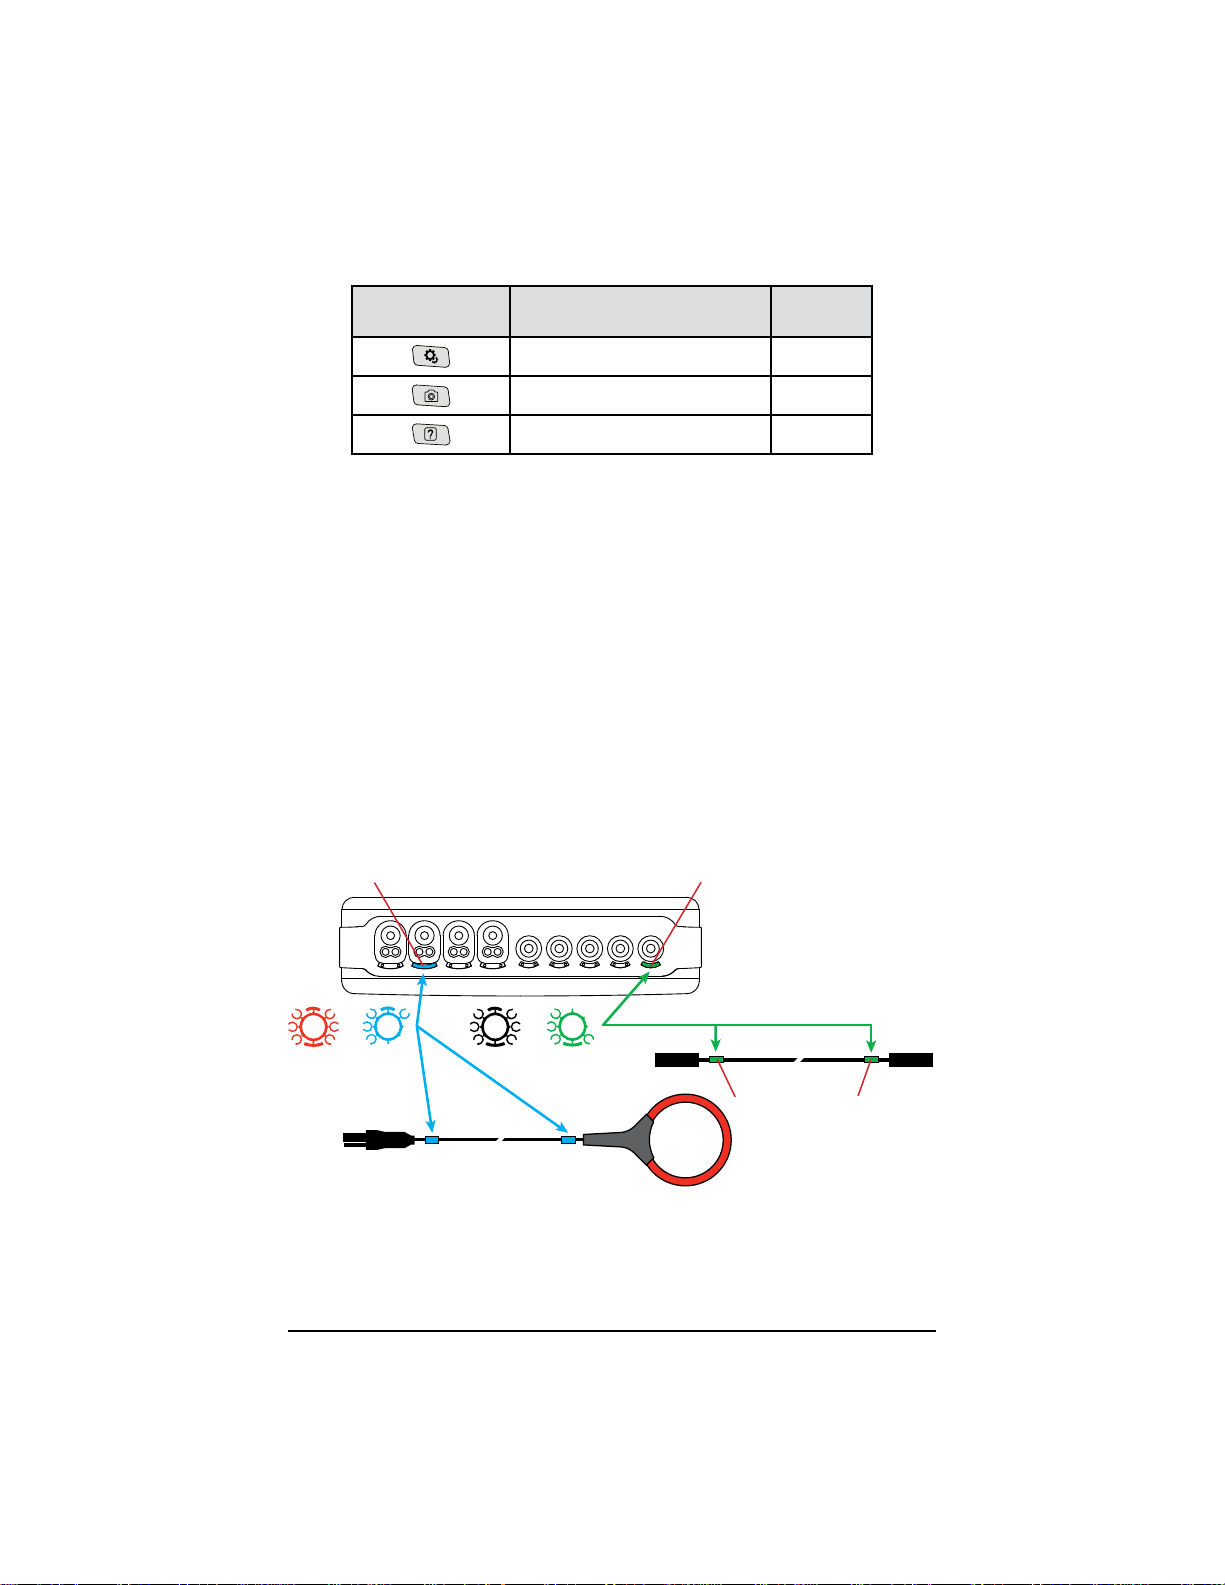
Button Function See §
Conguration button § 4.3
Screenshots button § 14
Help button § 15
2.8.4 The Function Buttons (8 Yellow Buttons)
The functions of the yellow buttons depend on the selected mode and context.
A button’s function for each screen is shown at the bottom of the display.
2.9 INSTALLING THE COLOR CODES
To identify the cords and the input terminals, you can color-code them using the
colored markers provided with the instrument.
1. Break o the sector and insert it into the two holes near the terminal. The
large sectors are for the current terminals, and the small sectors are for the
voltage terminals.
2. Clip two rings of the same color onto the ends of the cord that will connect
to the terminal.
You have 12 sets of dierent-colored markers to match the instrument with the
color codes in eect.
Large sectors for current terminals Small sectors for voltage terminals
The same color as
the terminal
12 Power Quality Analyzer PowerPad® IV Model 8345
Find Quality Products Online at: [email protected]
www.GlobalTestSupply.com
Page 21
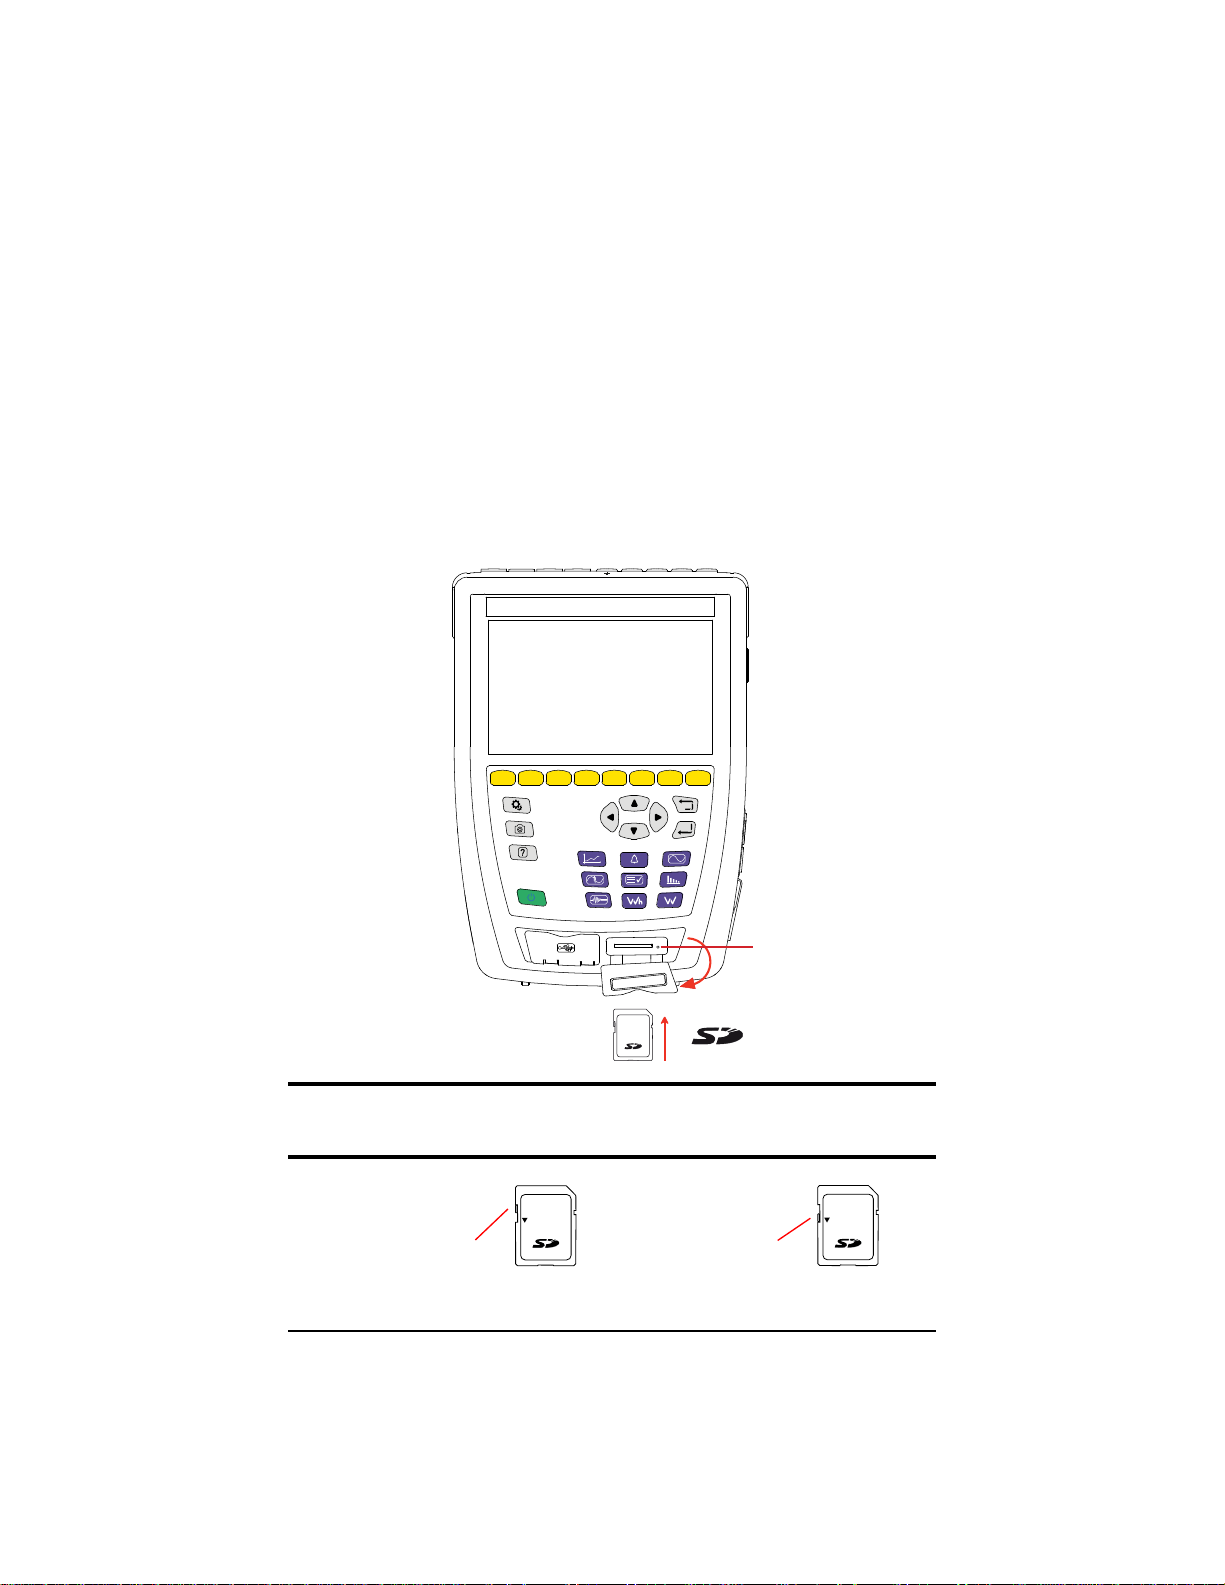
2.10 MEMORY CARD
The instrument is delivered with a formatted SD card that is essential for
recording measurements.
The instrument accepts SD (SDSC), SDHC, and SDXC memory cards in FAT16,
FAT32, or exFAT format.
To install a new SD card, you will need to:
1. Open the elastomer cap marked SD.
2. Press on the SD card to remove it from its slot. The red indicator will turn o.
3. Slide the new SD card into the slot until you feel a click. The red indicator
will turn on.
4. Then, close the elastomer cap.
L2 L3
L1
N
L1
N
L2 L3
SD card indicator
Lock the SD card by sliding its tab to the LOCK position when you
remove it from the instrument. Unlock the SD card by sliding its tab
away from the LOCK position before inserting it into the instrument.
LOCK
Locked SD cardUnlocked SD card
LOCK
Power Quality Analyzer PowerPad® IV Model 8345 13
Find Quality Products Online at: [email protected]
www.GlobalTestSupply.com
Page 22
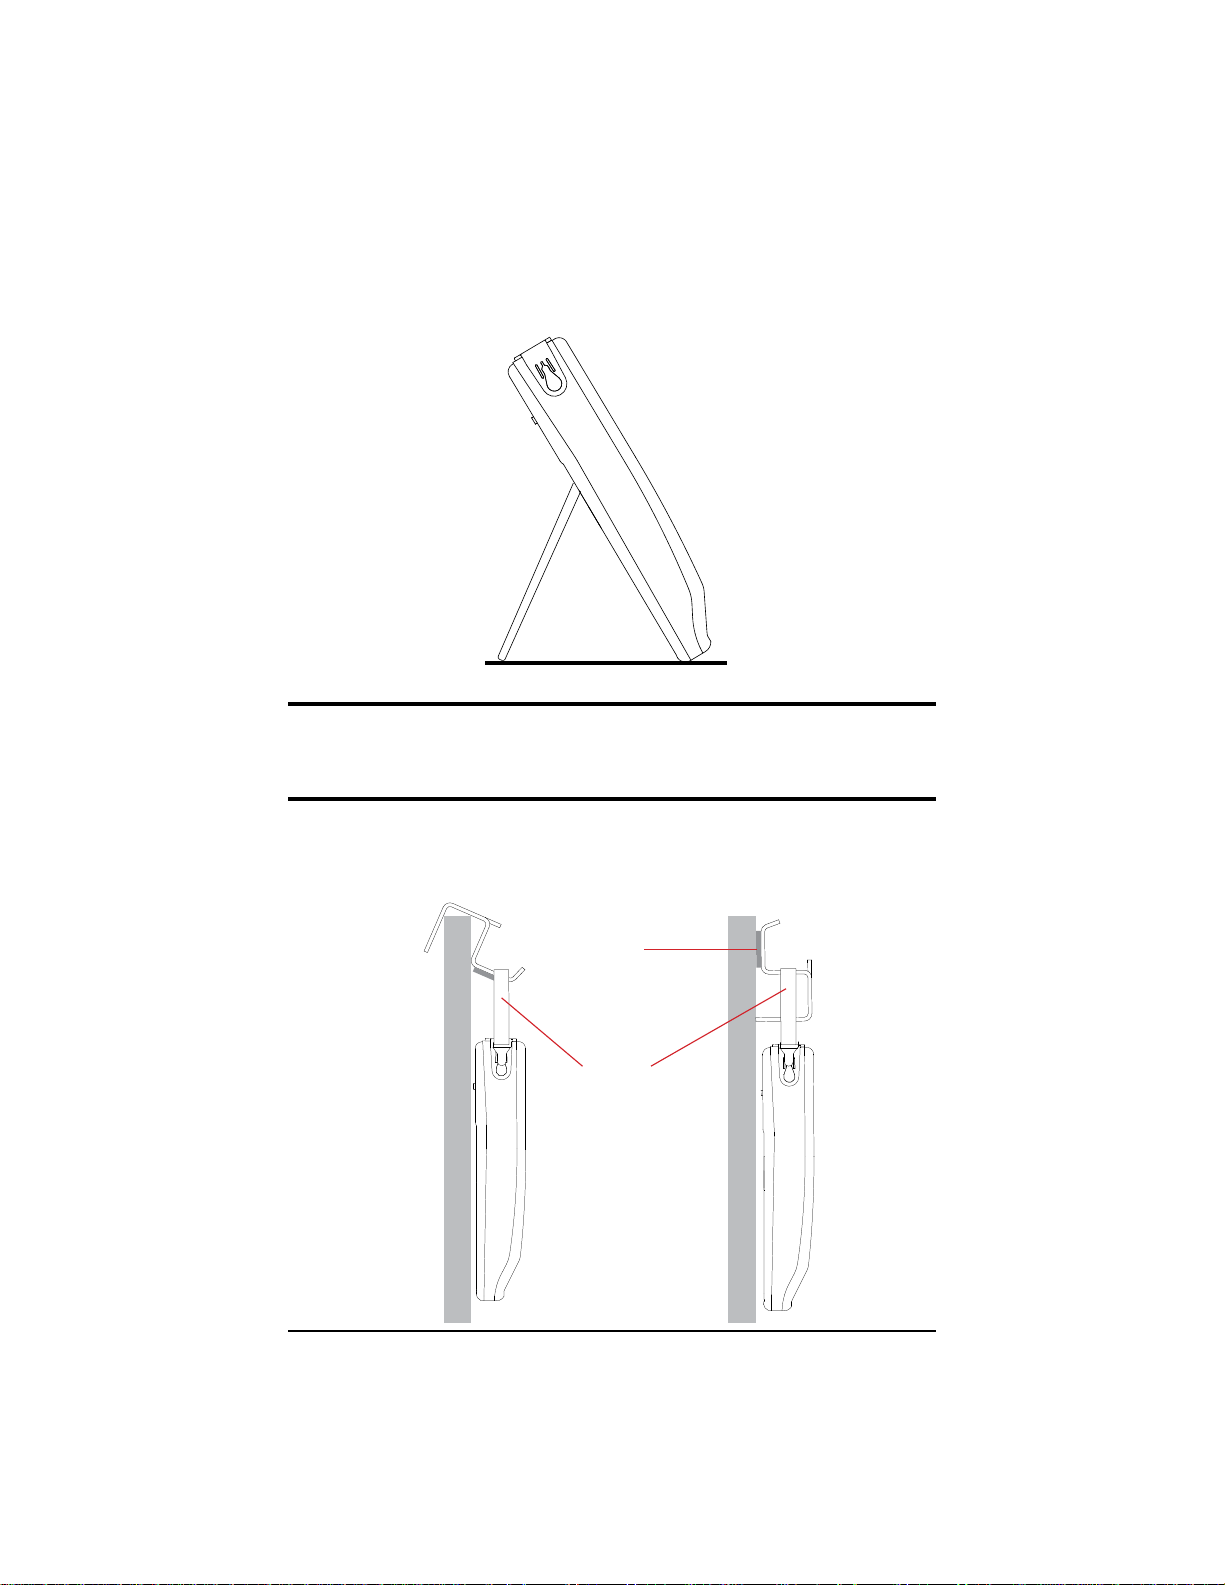
2.11 PROP
The back of the instrument has a retractable prop to hold it at a 60° angle.
NOTE: Do not insert the leads into the terminals while the instrument is
supported by the prop, or the prop could become damaged. The prop is
designed only for viewing the display and interacting with the interface
from dierent angles.
2.12 MAGNETIZED HOOK (OPTIONAL)
The magnetized hook can suspend the instrument from the top of a door or
attach it to a metallic surface.
Magnet
Hand strap
14 Power Quality Analyzer PowerPad® IV Model 8345
Find Quality Products Online at: [email protected]
www.GlobalTestSupply.com
Page 23
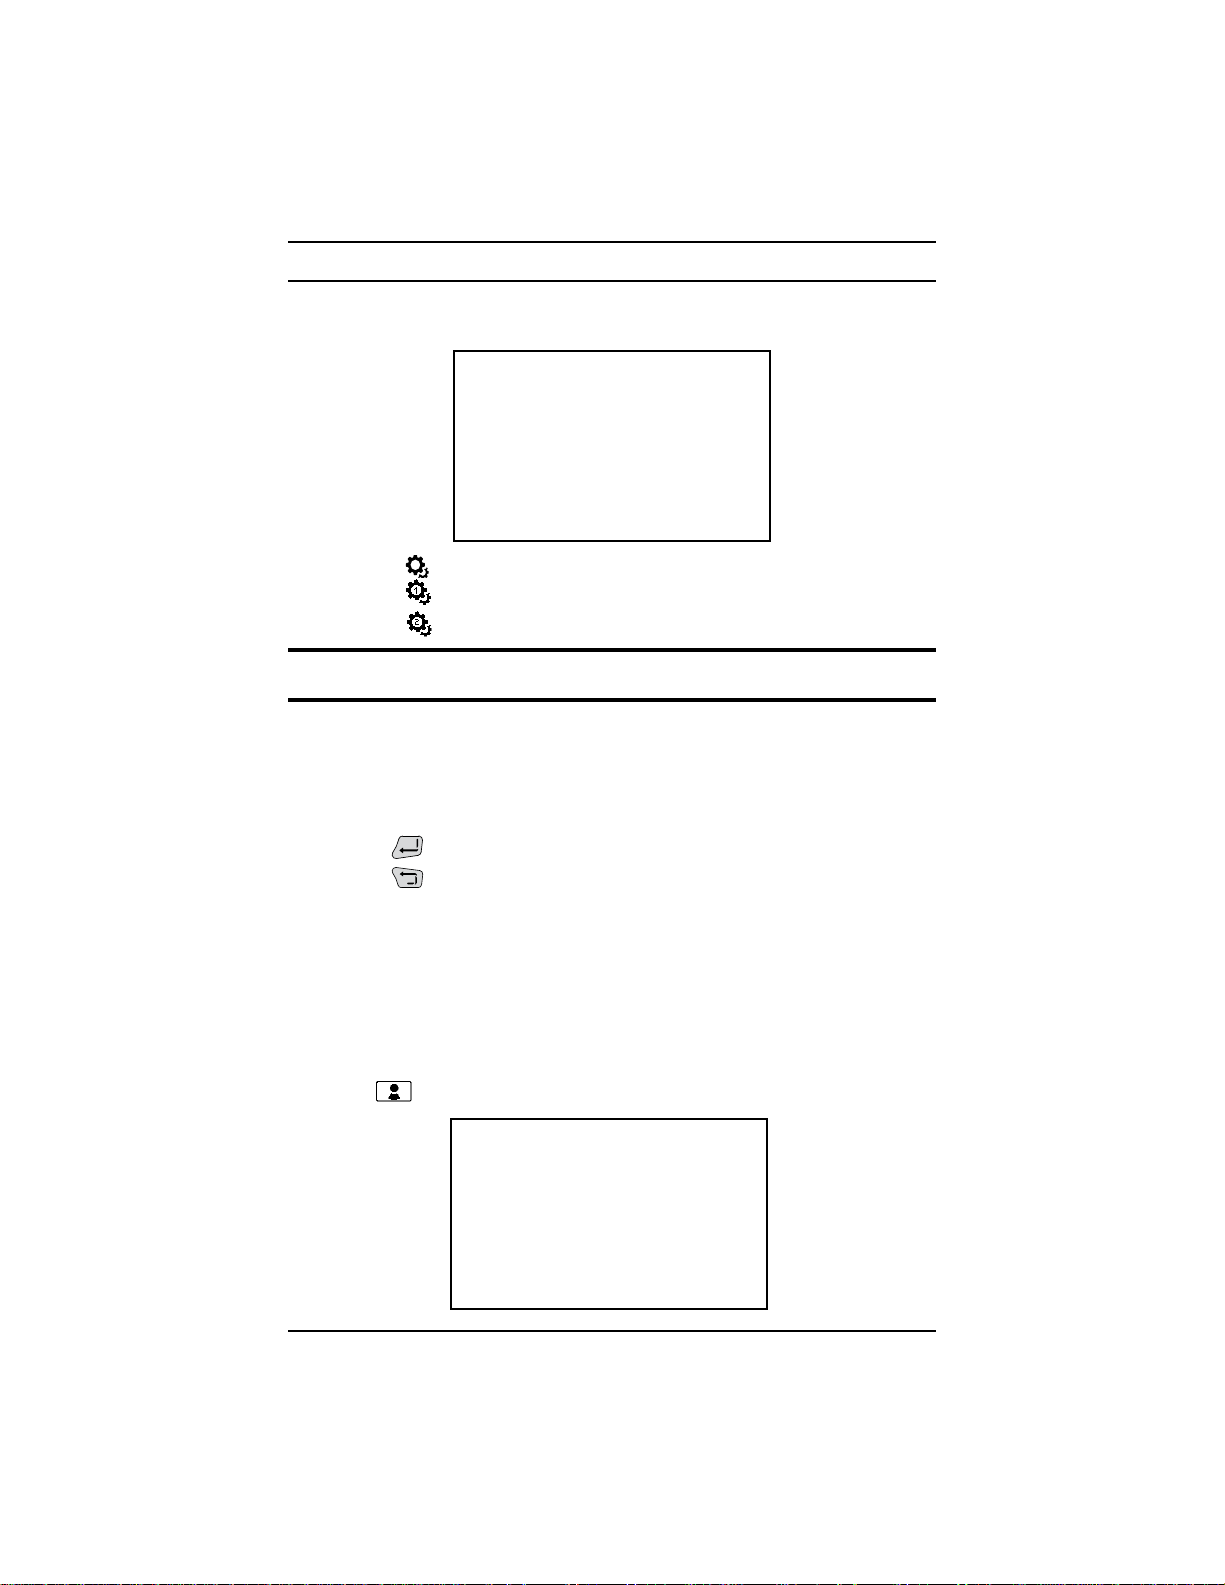
3. CONFIGURATION
The conguration screen allows you to set up specic congurations for the
instrument’s parameters and every measurement mode.
Press the button to access the conguration screen
Press the button to congure the measurements
Press the button to congure the instrument
You must congure your instrument before use.
3.1 NAVIGATION
The 8345’s screens are available using the naviga tion buttons or touch screen.
1. To congure the instrument, use the navigation buttons (◄, ►, ▲, ▼) or the
touch screen to select and modify the parameters.
2. Use the
3. Use the
If you are wearing gloves, we recommend using the navigation buttons instead
of the touch screen.
button to conrm the highlighted selection.
button to cancel or to return to the previous screen.
3.2 USERS
The 8345 allows three dierent users to congure the instrument and
measurements. The conguration for each user prole is saved, so multiple
users can use the 8345 without reconguring the instrument for each user.
1. Press
Power Quality Analyzer PowerPad® IV Model 8345 15
to access the user proles.
Find Quality Products Online at: [email protected]
www.GlobalTestSupply.com
Page 24
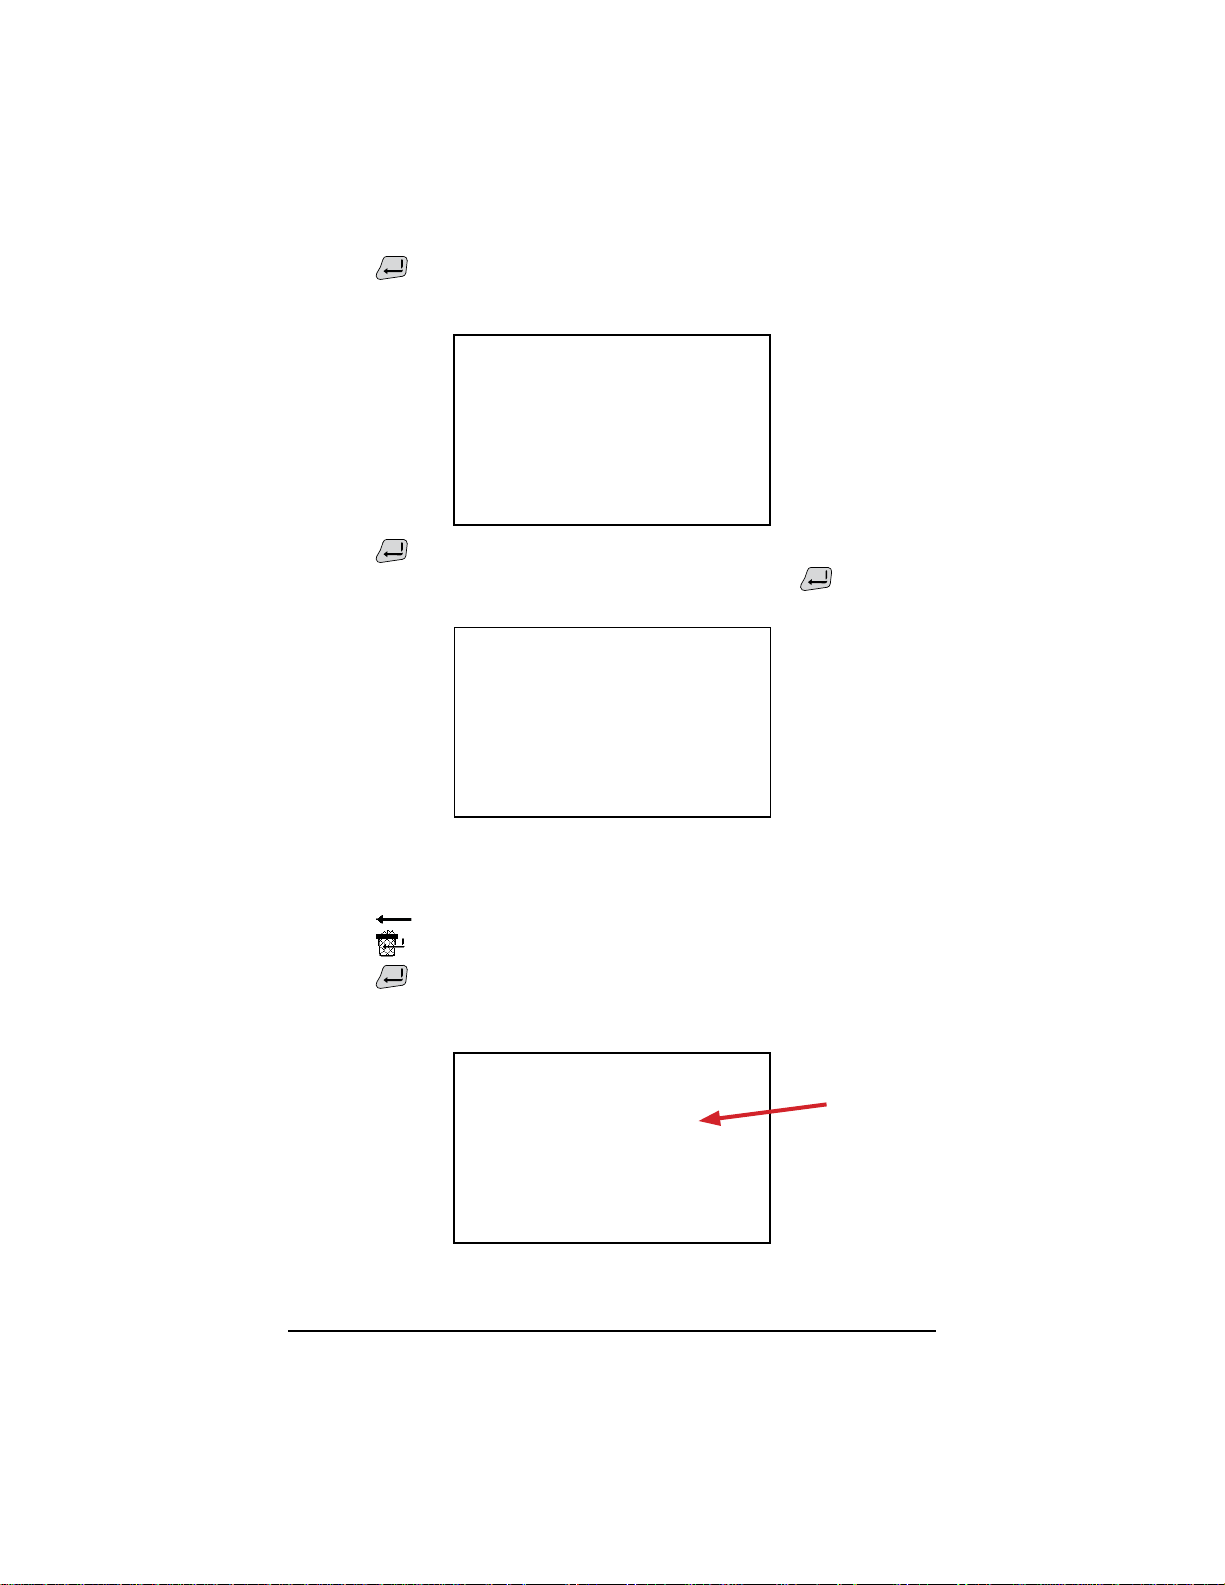
2. Press . The USER PROFILE screen displays the conrm button icon
next to the rst user prole being selected (see below image). Use the (▲,
▼) directional buttons, to select a dierent user prole.
3. Press
directional buttons to select the user name eld, and press
enable the eld name. Now you can edit the name.
4. Enter your desired username (up to 8 characters long) using upper- and
lower-case letters (A-Z), numbers (0-9), and symbols (@, -, _, and . ), all
accessible by the touch screen.
5. Press
6. Press
7. Press
which now shows the updated name entered with the conrm icon next to it.
to access the details of the user prole. Use the (◄, ►)
again to
to erase the previous character.
to erase the selected character and all following characters.
to submit the change and return to the USER PROFILE screen
16 Power Quality Analyzer PowerPad® IV Model 8345
Find Quality Products Online at: [email protected]
www.GlobalTestSupply.com
Page 25
3.3 CONFIGURING THE INSTRUMENT
Except for the display and language, the instrument’s conguration
cannot be changed if the instrument is recording or metering energy,
recording transients or alarms, or capturing an inrush current.
3.3.1 Language
1. Press on the setup screen to enter the language selection screen.
2. Use the navigation buttons or touch screen to highlight the language for
your instrument.
3. To conrm the selected language, use the
select the desired language option.
Refer to § 1.6 for more information.
button or the touch screen to
3.3.2 Date and Time
Press to set the date and time
73 available time zones
♦
Press to choose from
For Time source, choose between NTP server, GPS, and Manual for your
desired method to set the date and time
For Date/Time, enter the date and time if on Manual mode; otherwise, this
eld is grayed out and view only
For NTP server, enter the NTP server address that you would like to use to
set the date and time
For Date format, select your desired date format from MM/DD/YY,
DD/MM/YY, and YY/MM/DD
For Time format, choose whether to display time in 12 h or 24 h format
For Daylight Saving Time, check the box to apply Daylight Saving Time
Power Quality Analyzer PowerPad® IV Model 8345 17
Find Quality Products Online at: [email protected]
www.GlobalTestSupply.com
Page 26
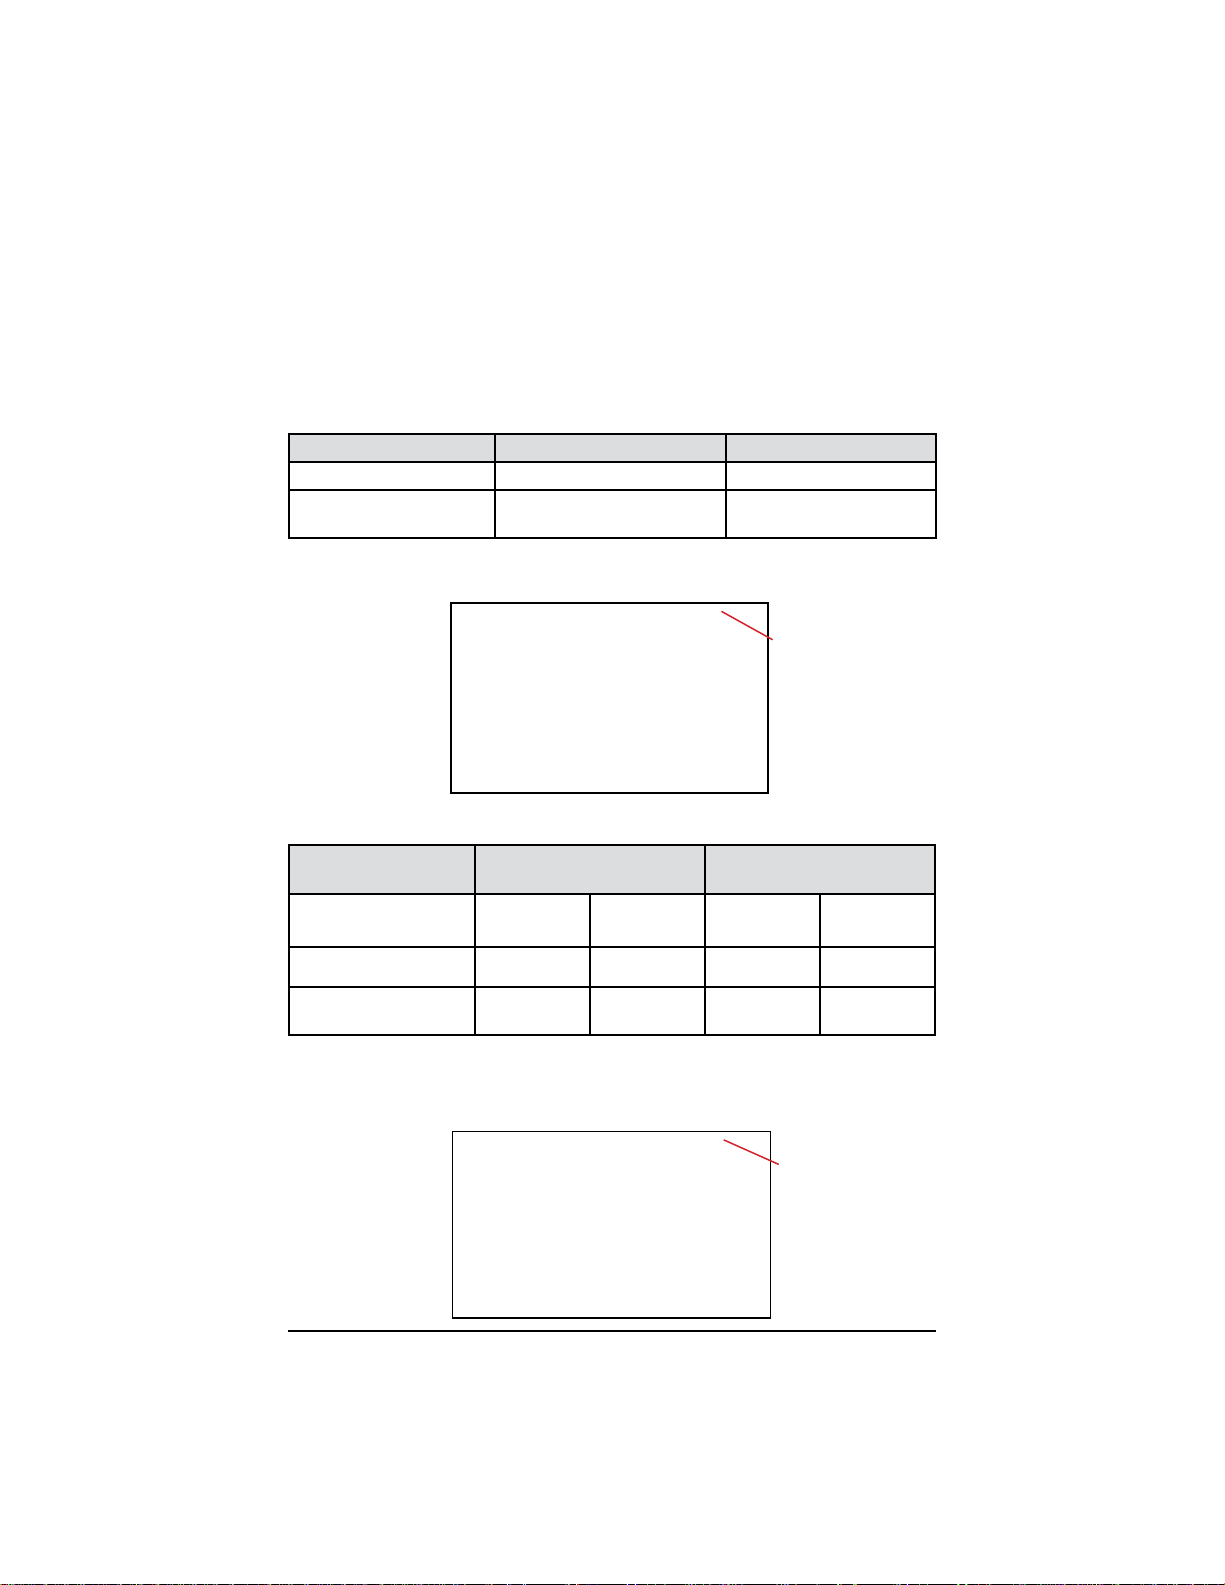
3.3.2.1 GPS Mode
The GPS mode is necessary to guarantee that your instrument is Class A (per
IEC 61000-4-30). The instrument must have access to the GPS satellites at
least once to receive the date and time. The instrument could take up to 15
minutes to synchronize.
The instrument will maintain accuracy in the following situations, even if the
satellites are no longer accessible.
Satellites in view Maximum drift (Class A) Drift (Model 8345)
None ±1 s / 24 h ±24 ms / 24 h
One or more
±16.7 ms vs UTC
at all times
±60 ns / 1 s
corrected at all times
To avoid time discontinuities, you cannot set the time automatically when a
recording is in progress.
Status of time
synchronization via GPS
The satellite reception status is indicated by an icon (
GPS
synchronization
Satellites in view None One or more None One or more
No recording
Recording in progress
Not synchronized Synchronized
) in the status bar.
After 40 days with no exposure to a GPS satellite, the synchronization icon ( )
will change to unsynchronized (
).
3.3.2.2 NTP Mode
Time synchronization
by NTP:
Not synchronized
Synchronized
Synchronized and
recording in progress
18 Power Quality Analyzer PowerPad® IV Model 8345
Find Quality Products Online at: [email protected]
www.GlobalTestSupply.com
Page 27
1. If you choose time synchronization by NTP, enter the address of the NTP
server in the NTP server eld (Example: 0.fr.pool.ntp.org)
2. Select your country’s time zone.
3. Connect the instrument to the server via Ethernet connector or Wi-Fi.
The time synchronization status is indicated by an icon (
) in the status bar.
3.3.3 Display
Press to open the conguration menu for the display
3.3.3.1 Colors of the Voltage Curves
1. Press
2. Choose a color for each of the 3 phases and neutral.
In night mode, the background changes from white to black.
3.3.3.2 Colors of the Current Curves
1. Press
2. Choose one color for each of the 4 current inputs.
In night mode, the background changes from white to black.
to choose the colors of the voltage curves.
to choose the colors of the current curves.
3.3.3.3 Screen Brightness and Auto-O
You can activate or deactivate the screen’s auto-o. If activated, the screen will
automatically turn o after 10 minutes with no user action, which helps prolong
battery life. If a recording is in progress, the screen will not automatically turn o.
Select to adjust the screen’s brightness and auto-o
Press any button to turn the screen back on
3.3.4 Memory
The screen indicates the content of the SD card or USB drive .
The bars at the top and at the right side of the screen show the SD card’s used
space in black and the remaining space in white. The SD card’s total size is to
the right of the bar.
Power Quality Analyzer PowerPad® IV Model 8345 19
Find Quality Products Online at: [email protected]
www.GlobalTestSupply.com
Page 28
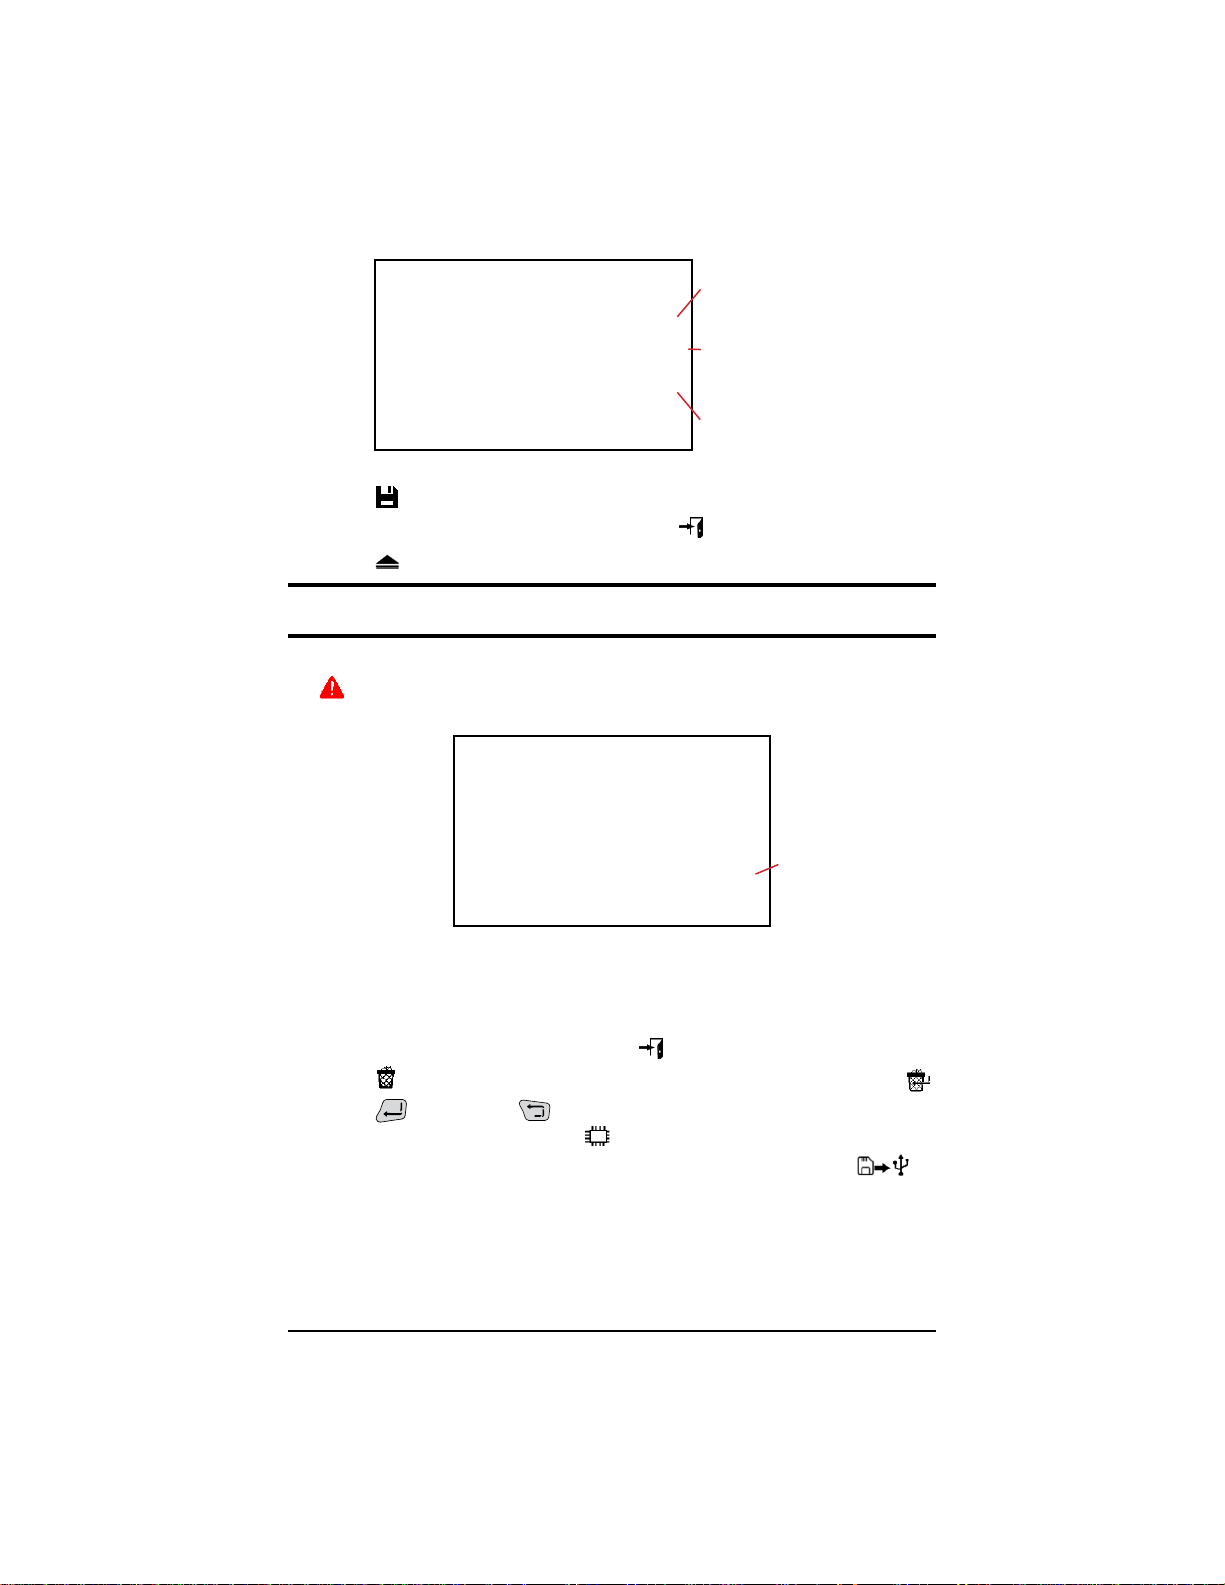
The SD card’s
remaining memory
The total size of the
SD card
The SD card’s
used memory
1. Press to manage the external memory’s content.
2. To view an item in detail, select it and press
3. Press
to eject the SD card or USB drive.
.
You must eject the SD card before removing it from the instrument;
otherwise, you risk losing its content.
When the SD card is removed, the red SD card present indicator will turn o and
the
symbol will be displayed in the status bar.
You can erase all or part of the memory’s content.
Memory used by
the selected items
1. Select the items from memory that you would like to erase. Once selected,
the display will indicate each item’s size to the right of the selected item on
the same line. The yellow bar at the right side of the screen indicates the
total memory used by the selected items.
2. To view a selected item in detail, press
3. Press
4. Press
To delete the other users, press
To copy all or part of the SD card’s contents to a USB drive, press
to erase the selection. The instrument will request conrmation .
to conrm or to abort.
.
20 Power Quality Analyzer PowerPad® IV Model 8345
Find Quality Products Online at: [email protected]
www.GlobalTestSupply.com
Page 29
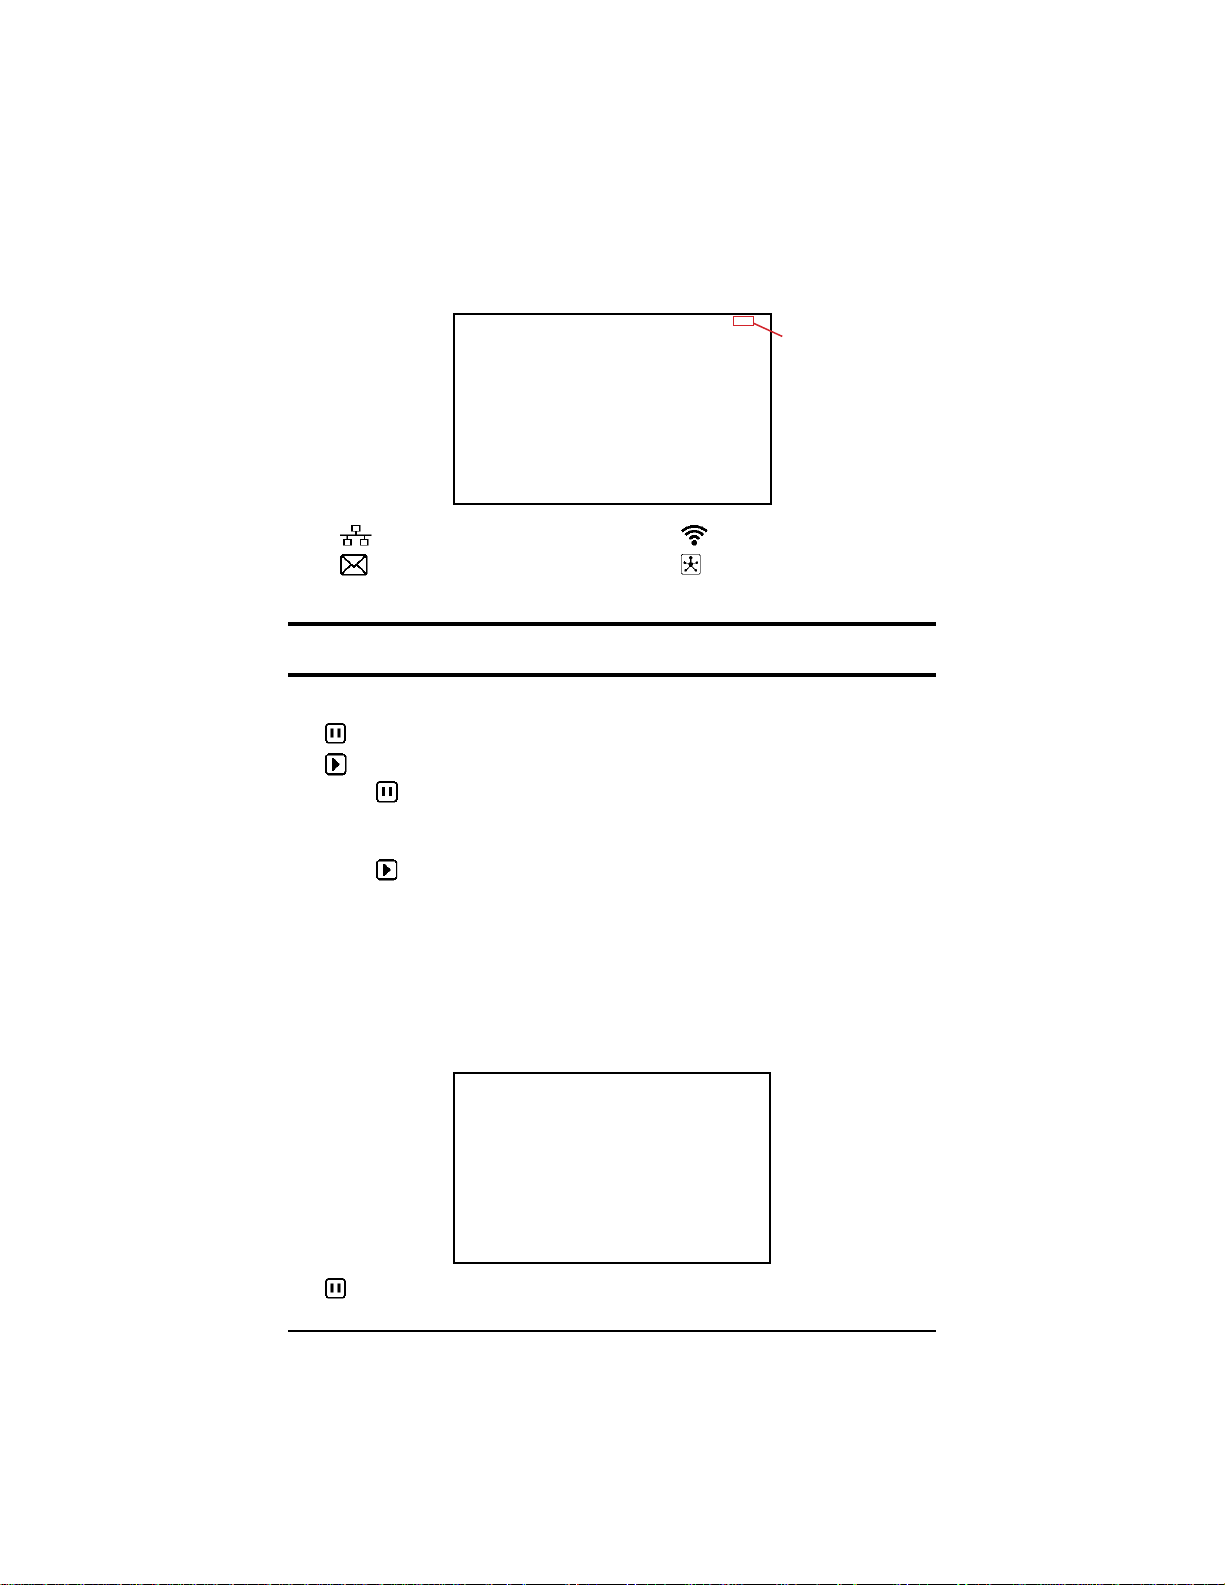
3.3.5 Network
The instrument’s connection status is indicated in the top right of the display.
Connection status
Press
Press
notications
3.3.5.1 Ethernet Link
The
The
3.3.5.2 Wi-Fi Link
to congure the Ethernet link
to congure the email
Only one link (Ethernet or Wi-Fi) can be activated at a time.
symbol indicates that the link is active.
symbol indicates that the link is inactive and that it can be activated.
Press in the screen’s bottom right to deactivate an active link before
modifying it
If no link is active, no action is needed.
Press to activate the link
For DHCP (Dynamic Host Conguration Protocol), select whether to update
the IP address automatically or manually
If selected, the instrument will request the IP address and other parameters
from a DHCP server and will generate an IP address automatically if no
DHCP server replies.
If deselected, you must assign the IP address and parameters manually.
Press
Press
to congure the Wi-Fi link
to connect to the IRD server
The
symbol indicates that the link is active.
Power Quality Analyzer PowerPad® IV Model 8345 21
Find Quality Products Online at: [email protected]
www.GlobalTestSupply.com
Page 30
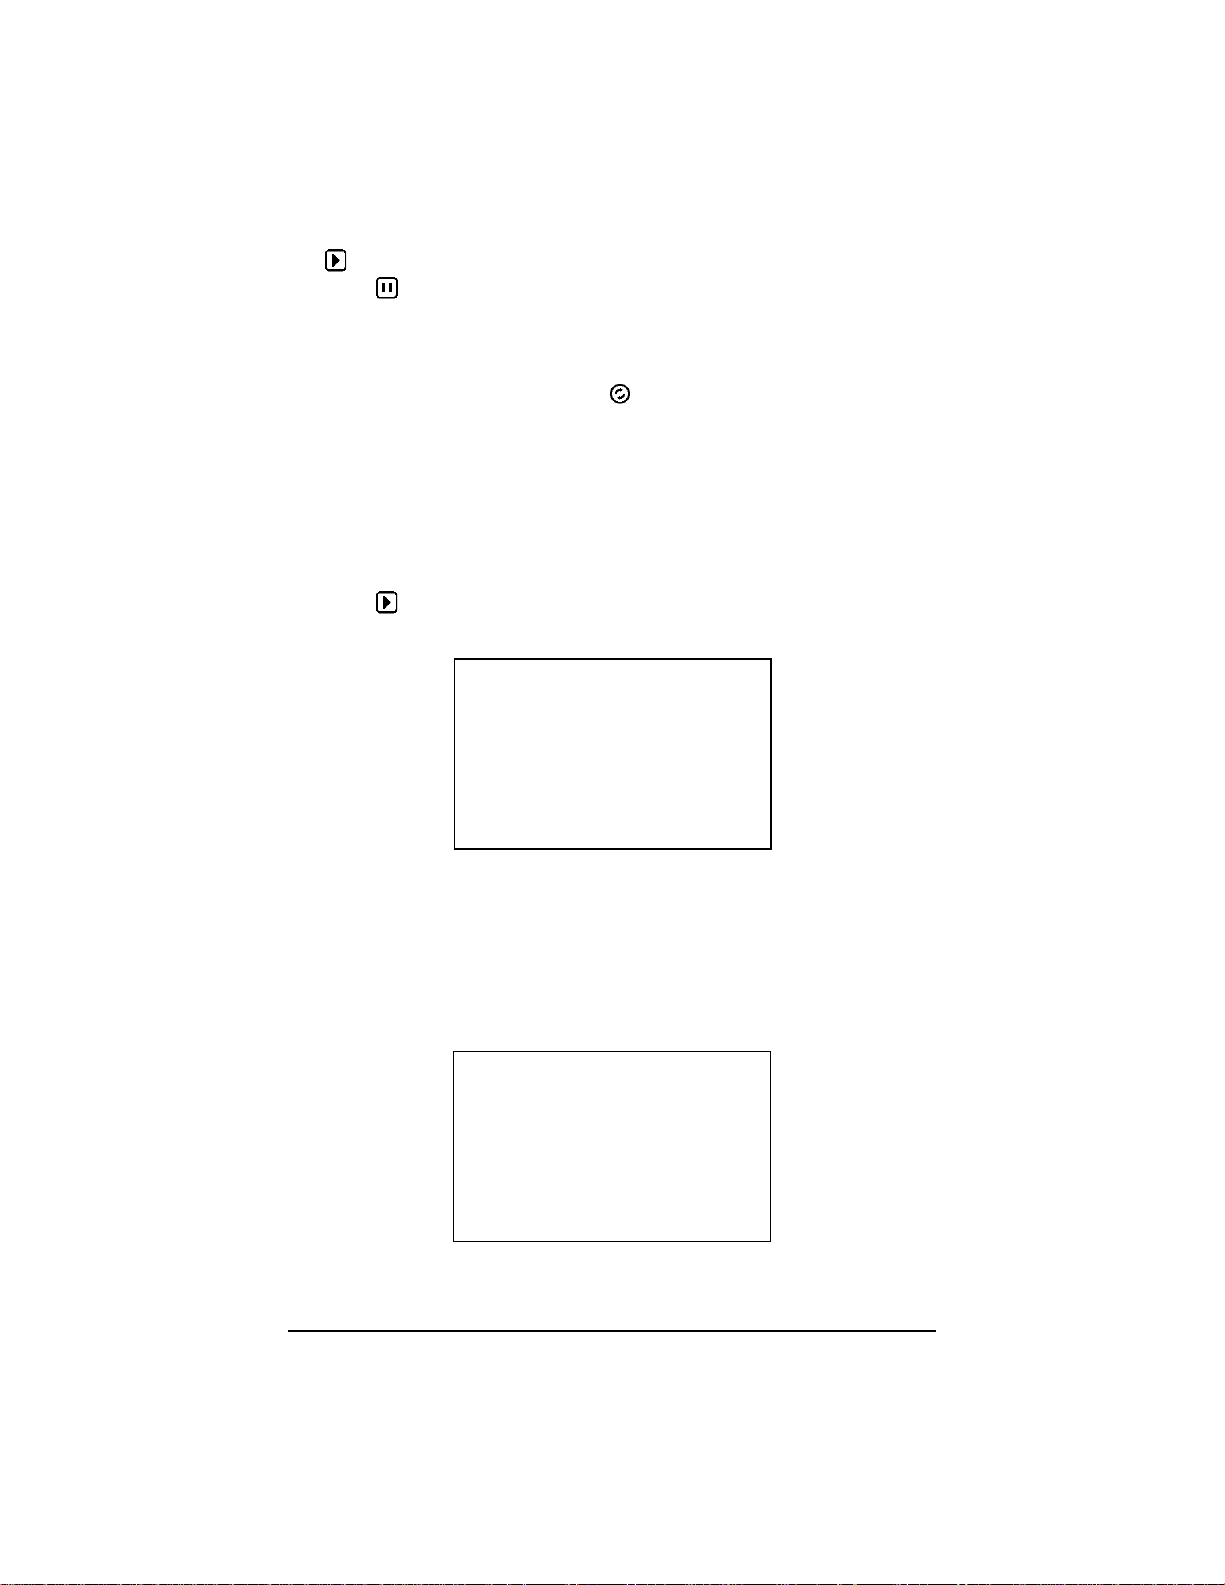
The symbol indicates that the link is inactive and can be activated.
Press in the screen’s bottom right to deactivate an active link before
modifying it
If no link is active, no action is needed.
For SSID, choose the network to connect to the instrument
If your network is not shown, press
For Password, enter the password for the selected SSID, if required
For DHCP (Dynamic Host Conguration Protocol), select whether to update
the IP address automatically or manually
If selected, the instrument will request the IP address and other parameters
from a DHCP server and will generate an IP address automatically if no
DHCP server replies
If deselected, you must assign the IP address and parameters manually
Press to activate the link
3.3.5.3 Email
to search for available networks
For Recipient, enter an email address to receive notications if an alarm
threshold is exceeded
3.3.5.4 IRD Server
An Internet Relay Device (IRD) is a protocol used for communication between
two peripherals located in two distinct sub-networks, like a PC and measuring
instrument. Each peripheral connects to an IRD server, and the server links the
two peripherals together.
We recommend utilizing the IRD Server for conguring test measurements, and
directly connecting to a PC for generating reports involving large packets of data.
22 Power Quality Analyzer PowerPad® IV Model 8345
Find Quality Products Online at: [email protected]
www.GlobalTestSupply.com
Page 31
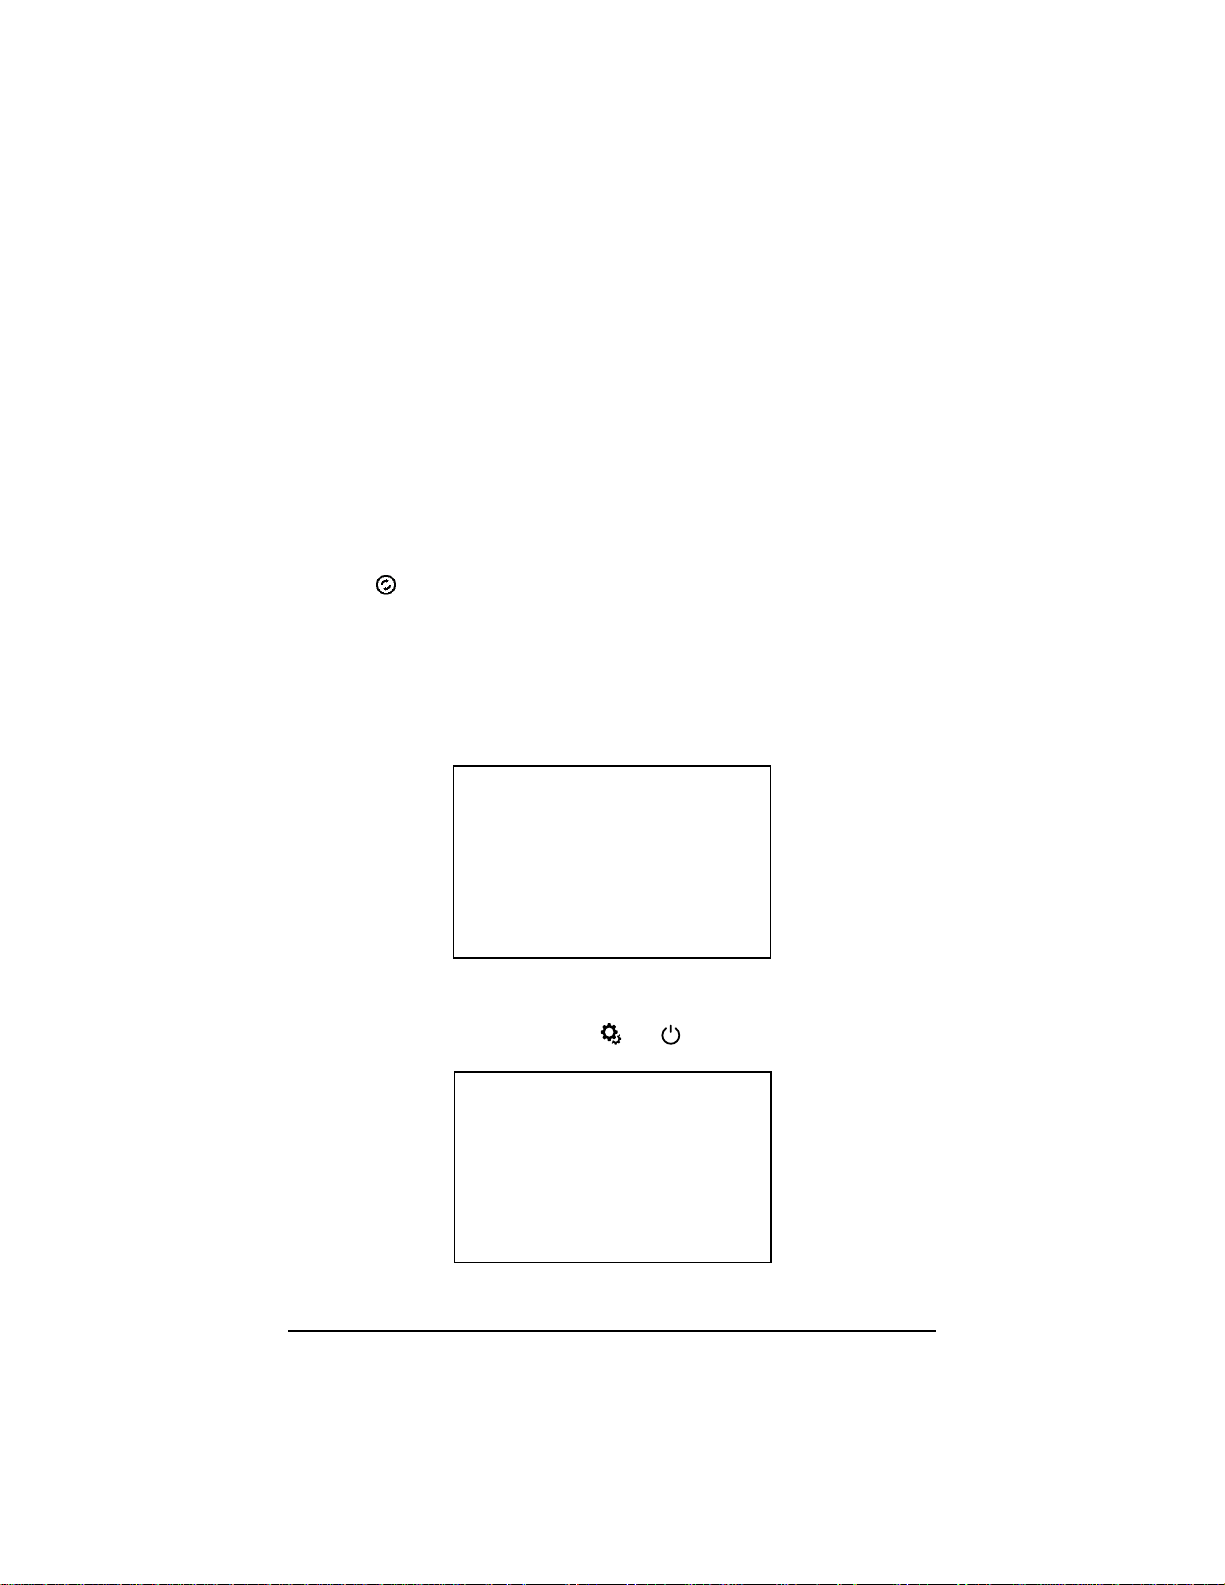
For Server address, select the server address to connect to the instrument
For Server port, enter the server port number to connect to the server
address (up to 5 numbers)
The Device name is the device's serial number. It is used by the IRD server
to connect to the device and cannot be changed.
For Password, enter the password that will be needed to communicate with
the instrument. The password can be up to 30 characters long and include
upper- and lower-case letters (A-Z), numbers (0-9), and a variety of symbols
Enter the instrument’s identication and password to control it from a PC
3.3.6 Updating the Embedded Software
As updates for the 8345 become available, you are able to update the
embedded software via the update screen.
Press in the instrument conguration menu to open the update screen
for the embedded software
Refer to § 18.5 for more information about the rmware updates
When the instrument locates updated software, the instrument will display
information about the updated version and ask if you would like to install it.
For example, if the SD card has an update, the instrument will locate it and
display the following screen.
1. Restart the instrument to reboot in a mode specic to the software update.
2. If it does not automatically reboot in the correct mode, turn the instrument
o, and restart it while holding the
screen shown below.
Power Quality Analyzer PowerPad® IV Model 8345 23
Find Quality Products Online at: [email protected]
www.GlobalTestSupply.com
and buttons until you see the
Page 32
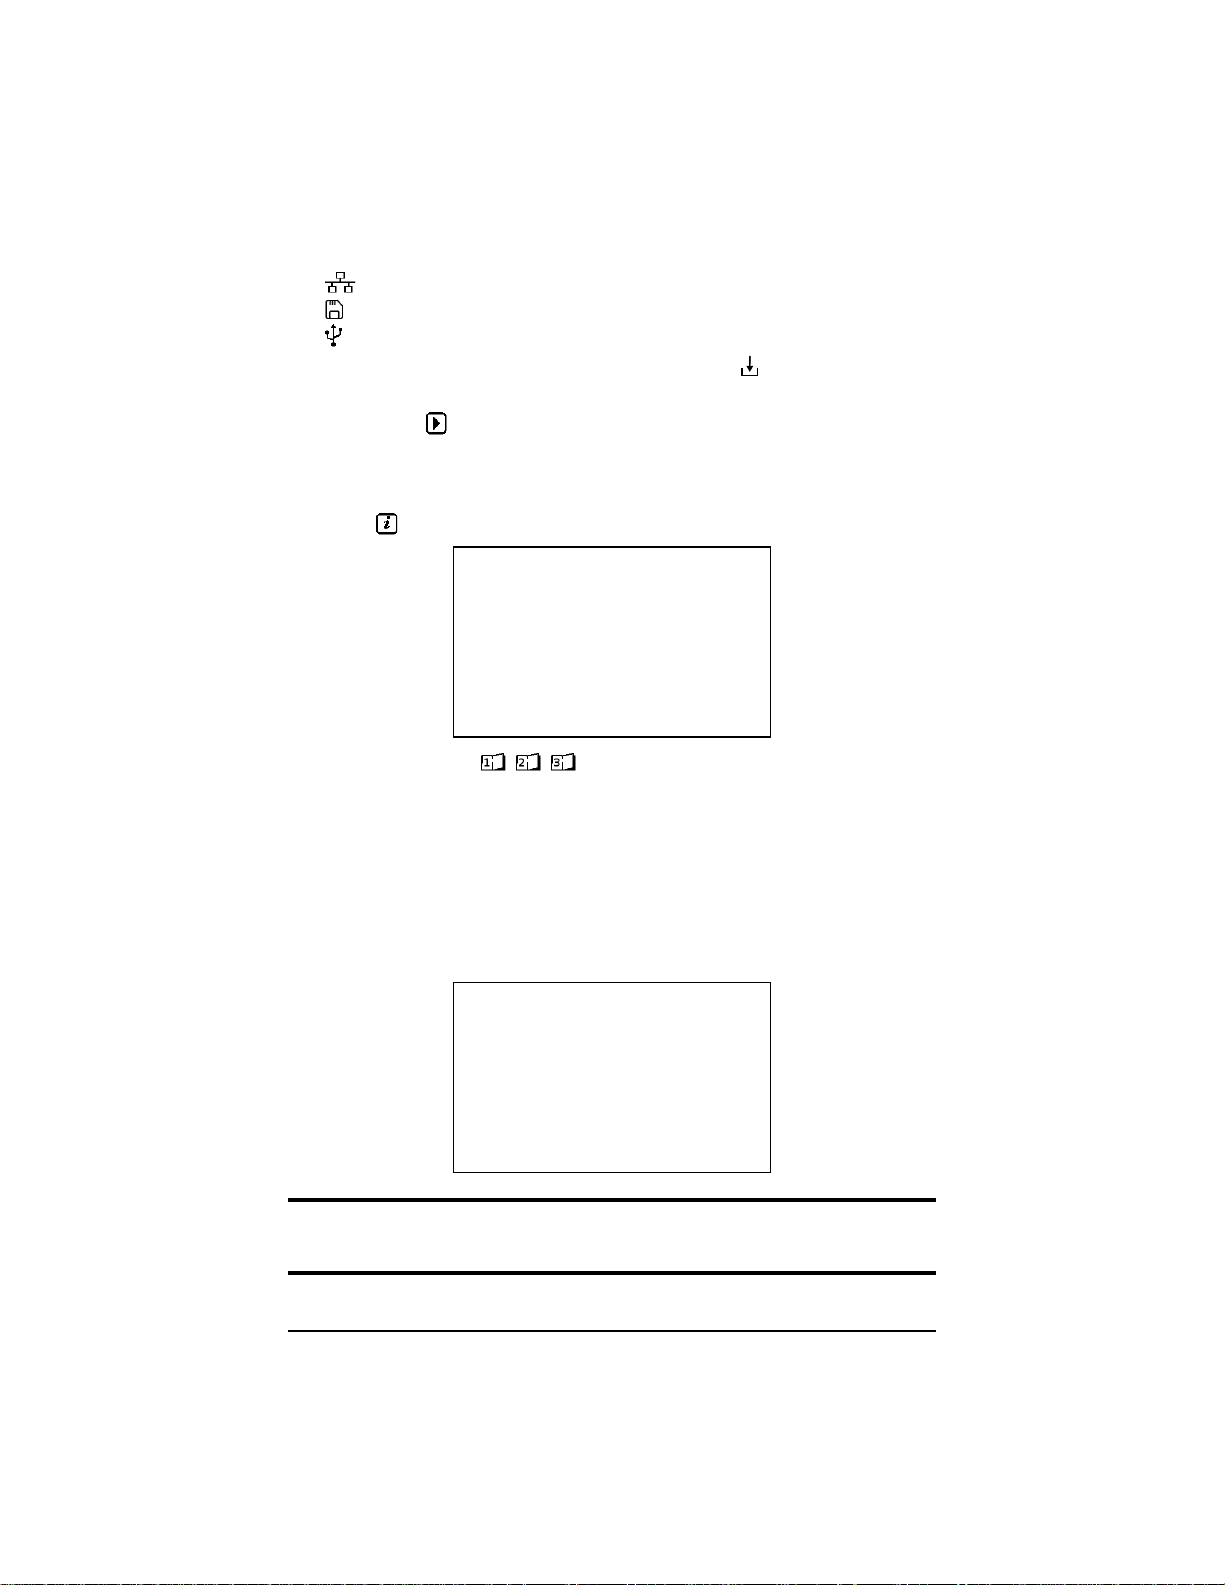
3. Select the method to use to update the software:
to update from the website via Ethernet link to update from the
SD card
to update from the USB drive
4. When the update method has been selected, press
to download the le,
which could take several minutes.
5. Then, press
to begin the update.
3.3.7 Information
The instrument’s information is available to view via the information screens.
Press in the conguration menu to view the information screens
The information pages (
, , ) in the function bar allow you to look up the
complete information about the instrument, like the:
■
Warranty number
■
Serial number
■
Software version
■
Hardware version
■
MAC, Ethernet, and Wi-Fi addresses
3.4 CONFIGURING THE MEASUREMENT
The measurement’s conguration cannot be altered if the instrument
is recording or metering energy, recording transients or alarms, or
capturing inrush currents.
24 Power Quality Analyzer PowerPad® IV Model 8345
Find Quality Products Online at: [email protected]
www.GlobalTestSupply.com
Page 33

Before making measurements, you must specify the following:
■
Calculation methods
■
Distribution network
■
Type of connection
■
Voltage ratios
■
Current sensors, their ranges, and their ratios
■
Values to record in Trend mode
■
Triggering levels for the transient and inrush current capture modes
■
Alarm thresholds for Alarm mode
■
Units and ranges for Energy mode
■
Monitoring mode’s parameters (using the application software)
3.4. 1 C alculation Methods
Press the button to determine the calculation methods
3.4.1.1 Nominal Values
Press the button in the function bar to congure the nominal values
For Nominal frequency, choose either 50 Hz or 60 Hz
For Nominal voltage (with neutral), enter the nominal voltage (with neutral)
to use in measurements and calculations
For Nominal voltage (without neutral), enter the nominal voltage
(without neutral) to use in measurements and calculations
The nominal voltage congured here is the Nominal System Voltage (U
not the Nominal Declared Input Voltage (U
possible to congure U
between 50 V and 650 kV, but U
n
) on the instrument’s terminals. It is
din
must never exceed
din
1000 V between phases and 400 V between Phase and Neutral.
In the case of medium-voltage or high-voltage networks, a step-down transformer
may be located between the network and measuring instrument. The uncertainty
on the step-down transformer’s ratio aects the measurement’s accuracy. The
measurement is guaranteed only when U
= Un and the ratio is equal to 1.
din
) and
n
Power Quality Analyzer PowerPad® IV Model 8345 25
Find Quality Products Online at: [email protected]
www.GlobalTestSupply.com
Page 34
3.4.1.2 Real Time Values
Press the button in the function bar to congure the real-time values
For Real-Time values , choose either 10/12 cycles and 200 ms or 150/180
cycles and 3 s. This choice will apply to the value’s calculation and display in
most modes
For Fundamental power factor, choose DPF, PF1, or cos φ for the display
For 10sec Frequency (Class A), select whether to include the calculation
of the frequency over 10 s (per IEC 61000-4-30 Class A) or not. If you are
only measuring current, deactivate this choice
For Display agging, choose whether or not display agging is activated
When activated, all quantities that undergo voltage dips, voltage swells, and
interruptions will be reported (see § 3.4.10).
For Phasor Diagram Reference, choose between current and voltage
For Phasor Diagram Direction, choose between (clockwise) and
(counterclockwise)
3.4.1.3 Waveform Mode
Select to congure the parameters of waveform mode
For Long Term Flicker window, select the Plt icker calculation method
If Sliding is selected, the P
will be available 2 hours after the instrument turns on because P
12 values of P
st.
is calculated every 10 minutes. The rst value
lt
requires
lt
If Fixed is selected, the Plt is calculated every 2 hours.
For RMS Calculation, select the method to use for RMS calculation
26 Power Quality Analyzer PowerPad® IV Model 8345
Find Quality Products Online at: [email protected]
www.GlobalTestSupply.com
Page 35

For FK Coecient : q, choose a value between 1.5 and 1.7 to use for the
K factor calculation. The exponential constant q depends on the type of
winding and the frequency
A value of 1.7 is suitable for transformers where the conductor cross
sections are round or square.
A value of 1.5 is suitable for transformers where the low-voltage windings
are in foil form.
For FK Coecient : e, choose a value between 0.05 and 0.10 for the
K factor calculation
The e value represents the ratio of Eddy current losses at the fundamental
frequency to resistive losses at the reference temperature.
■
The default values for the FK coecients (q = 1.7 and e = 0.10) are suitable
for most applications
3.4.1.4 Harmonic Mode
Select to congure the parameters of harmonic mode
For Harmonics rate reference, select either fundamental (%f) or RMS (%r)
For MSV1, input a value for the rst agging frequency
For MSV2, input a value for the second agging frequency
3.4.1.5 MSV T emplate
Select to congure the curve of maximum MSV voltages as a function
of the frequency
There are 5 modiable preset points to dene the curve.
Power Quality Analyzer PowerPad® IV Model 8345 27
Find Quality Products Online at: [email protected]
www.GlobalTestSupply.com
Page 36
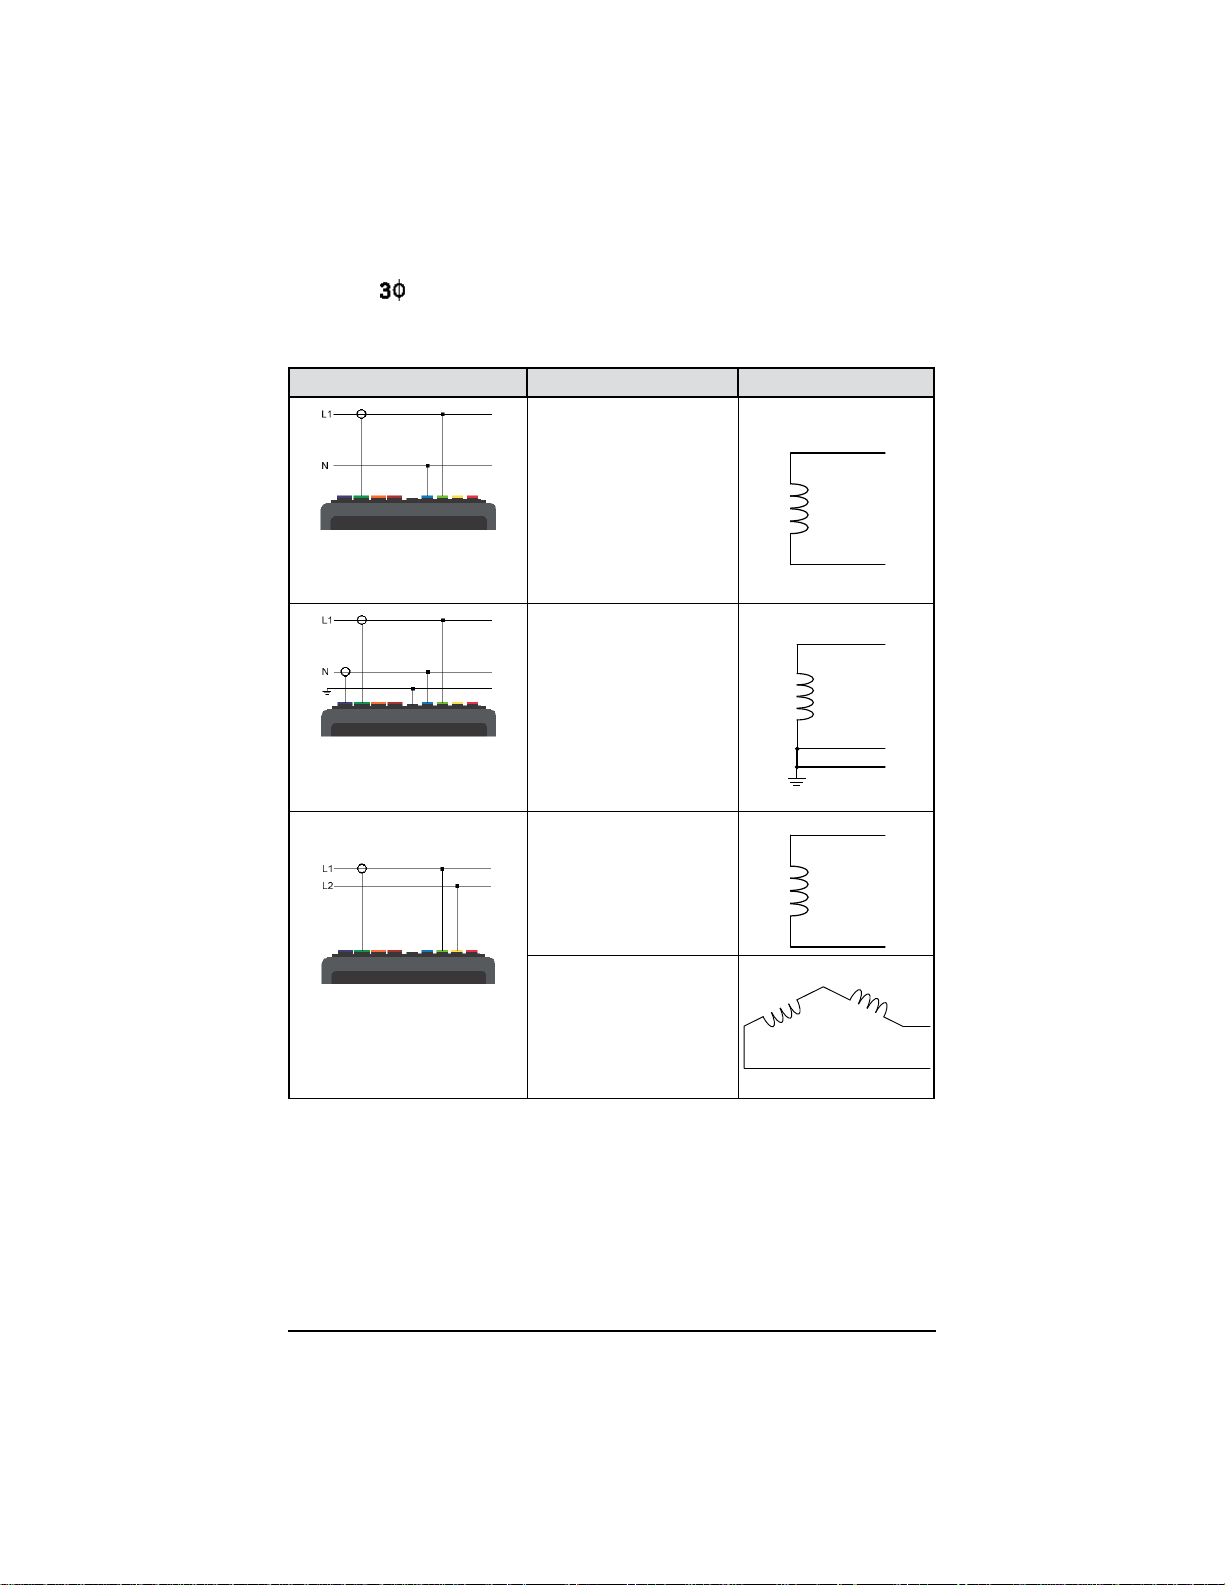
3.4.2 The Distribution Network and the Type of Connection
L1
L1
L1
L2
Select to choose the connection of the instrument according to the
distribution network
Each distribution system corresponds to one or more network types.
Distribution system Network Electrical Diagram
Single-phase
2 wires
with neutral
Single-phase
2 wires
(L1 and N)
Single-phase
3 wires
(L1, N, and earth)
without earth
Single-phase
3 wires
with neutral and earth
N
N
GND
Split-phase
2 wires
L2
Split-phase
2 wires
(L1 and L2)
Three-phase
2 wires
in open star
L1
28 Power Quality Analyzer PowerPad® IV Model 8345
Find Quality Products Online at: [email protected]
www.GlobalTestSupply.com
Page 37
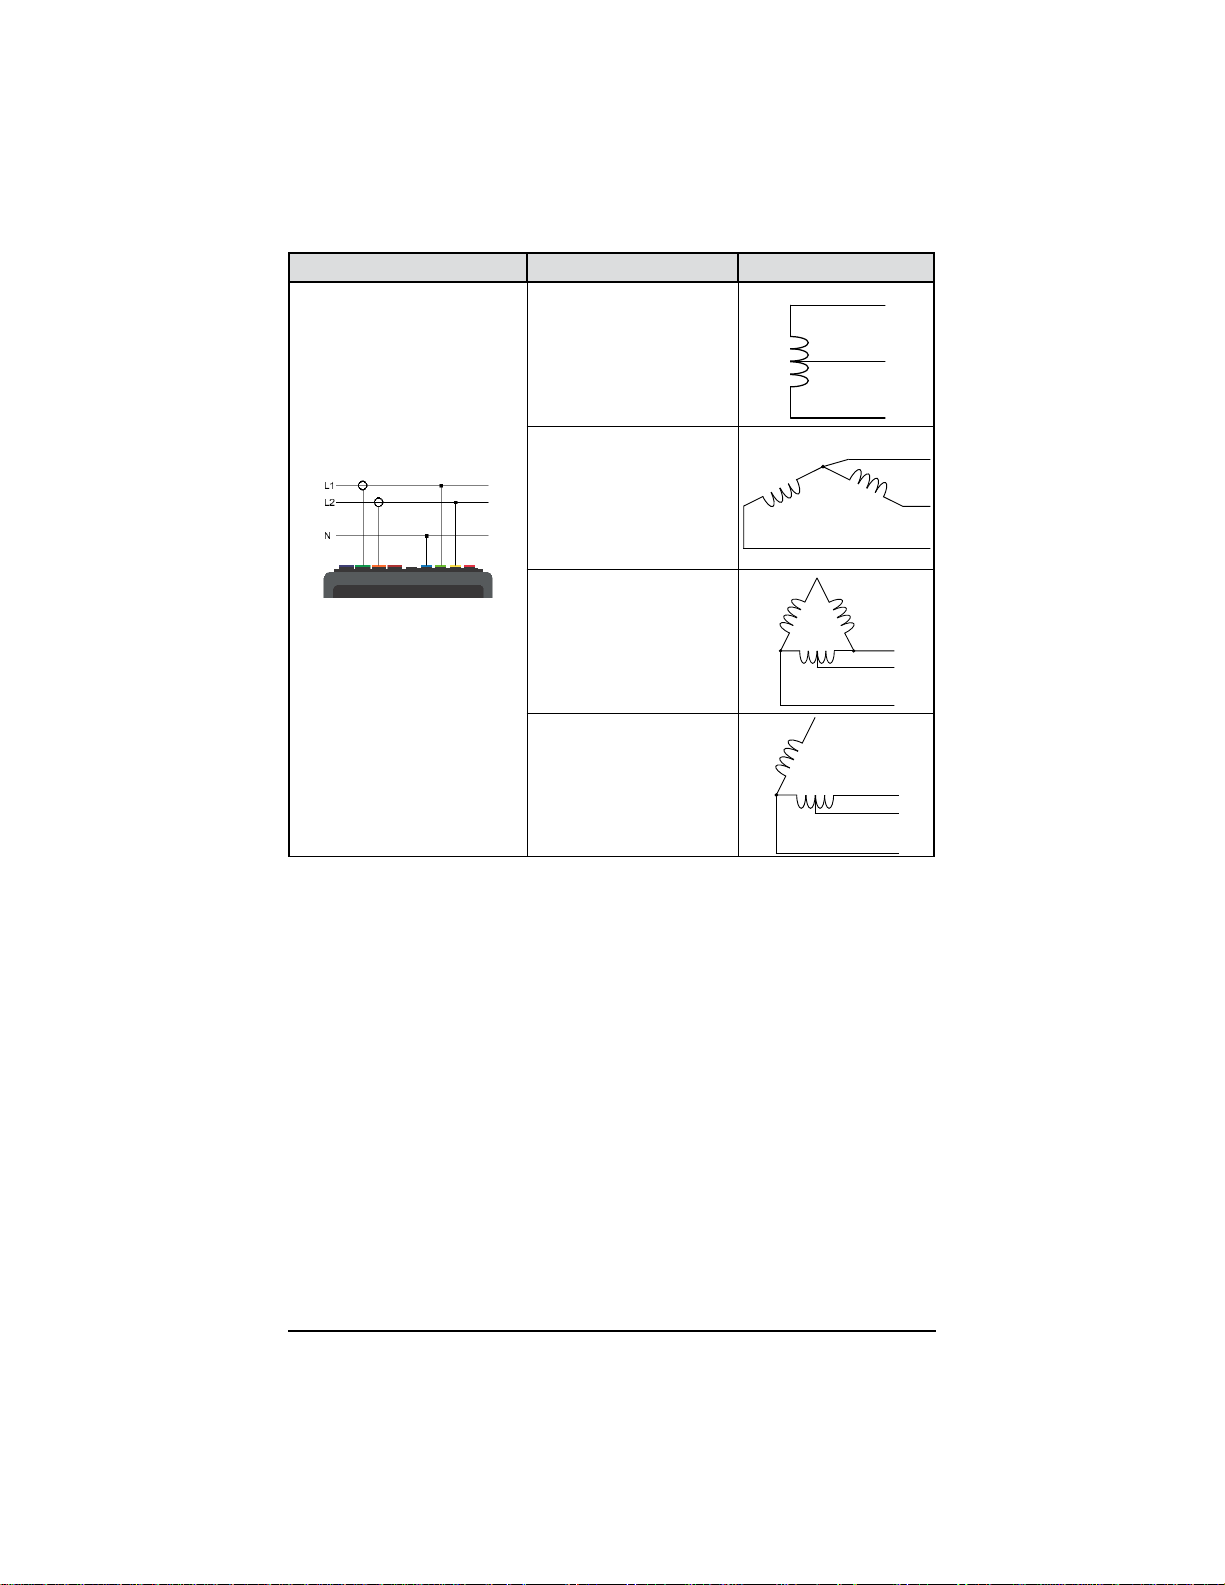
Distribution system Network Electrical Diagram
L1
N
Split-phase
3 wires
with neutral
without earth
Split-phase
3 wires
in open star
with neutral
without earth
N
L2
L1
L2
Split-phase
3 wires
(L1, L2, and N)
Split-phase
3 wires
in “high leg” delta
with neutral
without earth
Split-phase
3 wires
in open “high leg” delta
with neutral
without earth
L1
N
L2
L1
N
L2
Power Quality Analyzer PowerPad® IV Model 8345 29
Find Quality Products Online at: [email protected]
www.GlobalTestSupply.com
Page 38
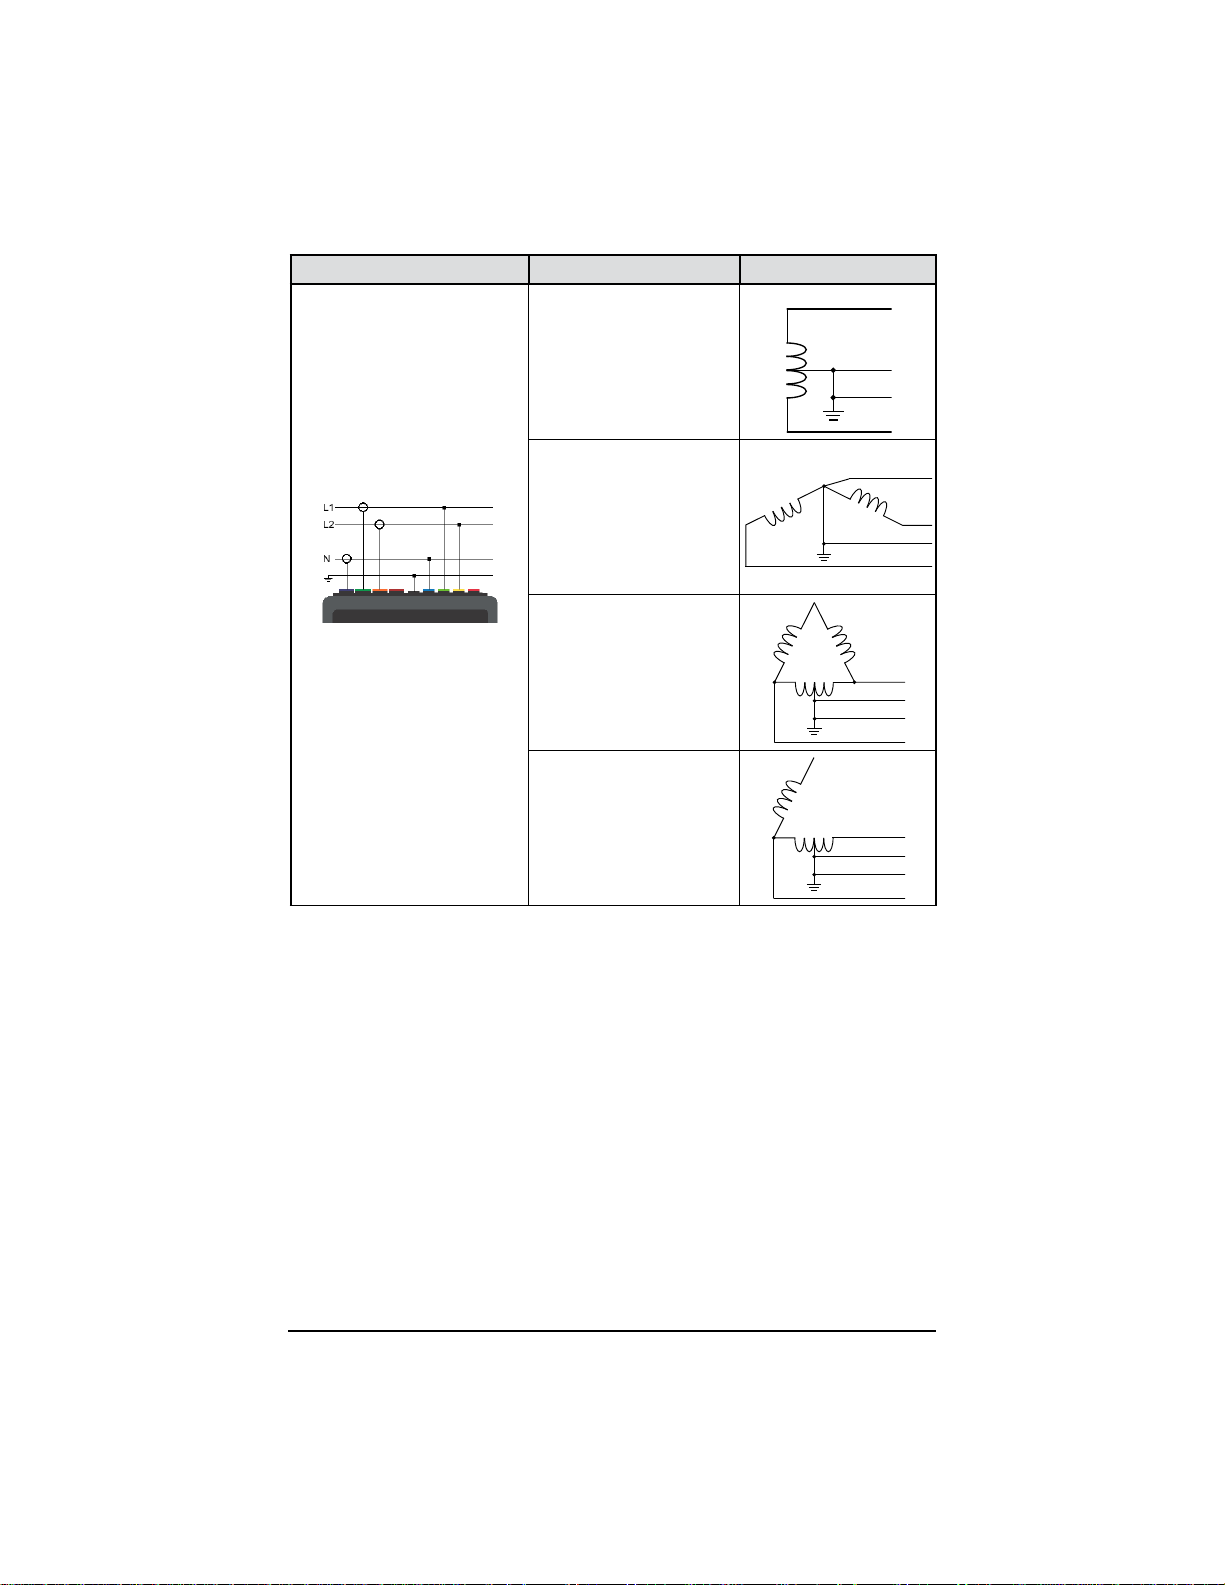
Distribution system Network Electrical Diagram
L1
N
Split-phase
4 wires
(L1, L2, N, and earth)
Split-phase
4 wires
with neutral and earth
Three-phase
4 wires
in open star
with neutral and earth
Three-phase
4 wires
in “high leg” delta
with neutral and earth
Three-phase
4 wires
in open “high leg” delta
with neutral and earth
N
GND
L2
L1
GND
L2
L1
N
GND
L2
L1
N
GND
L2
30 Power Quality Analyzer PowerPad® IV Model 8345
Find Quality Products Online at: [email protected]
www.GlobalTestSupply.com
Page 39
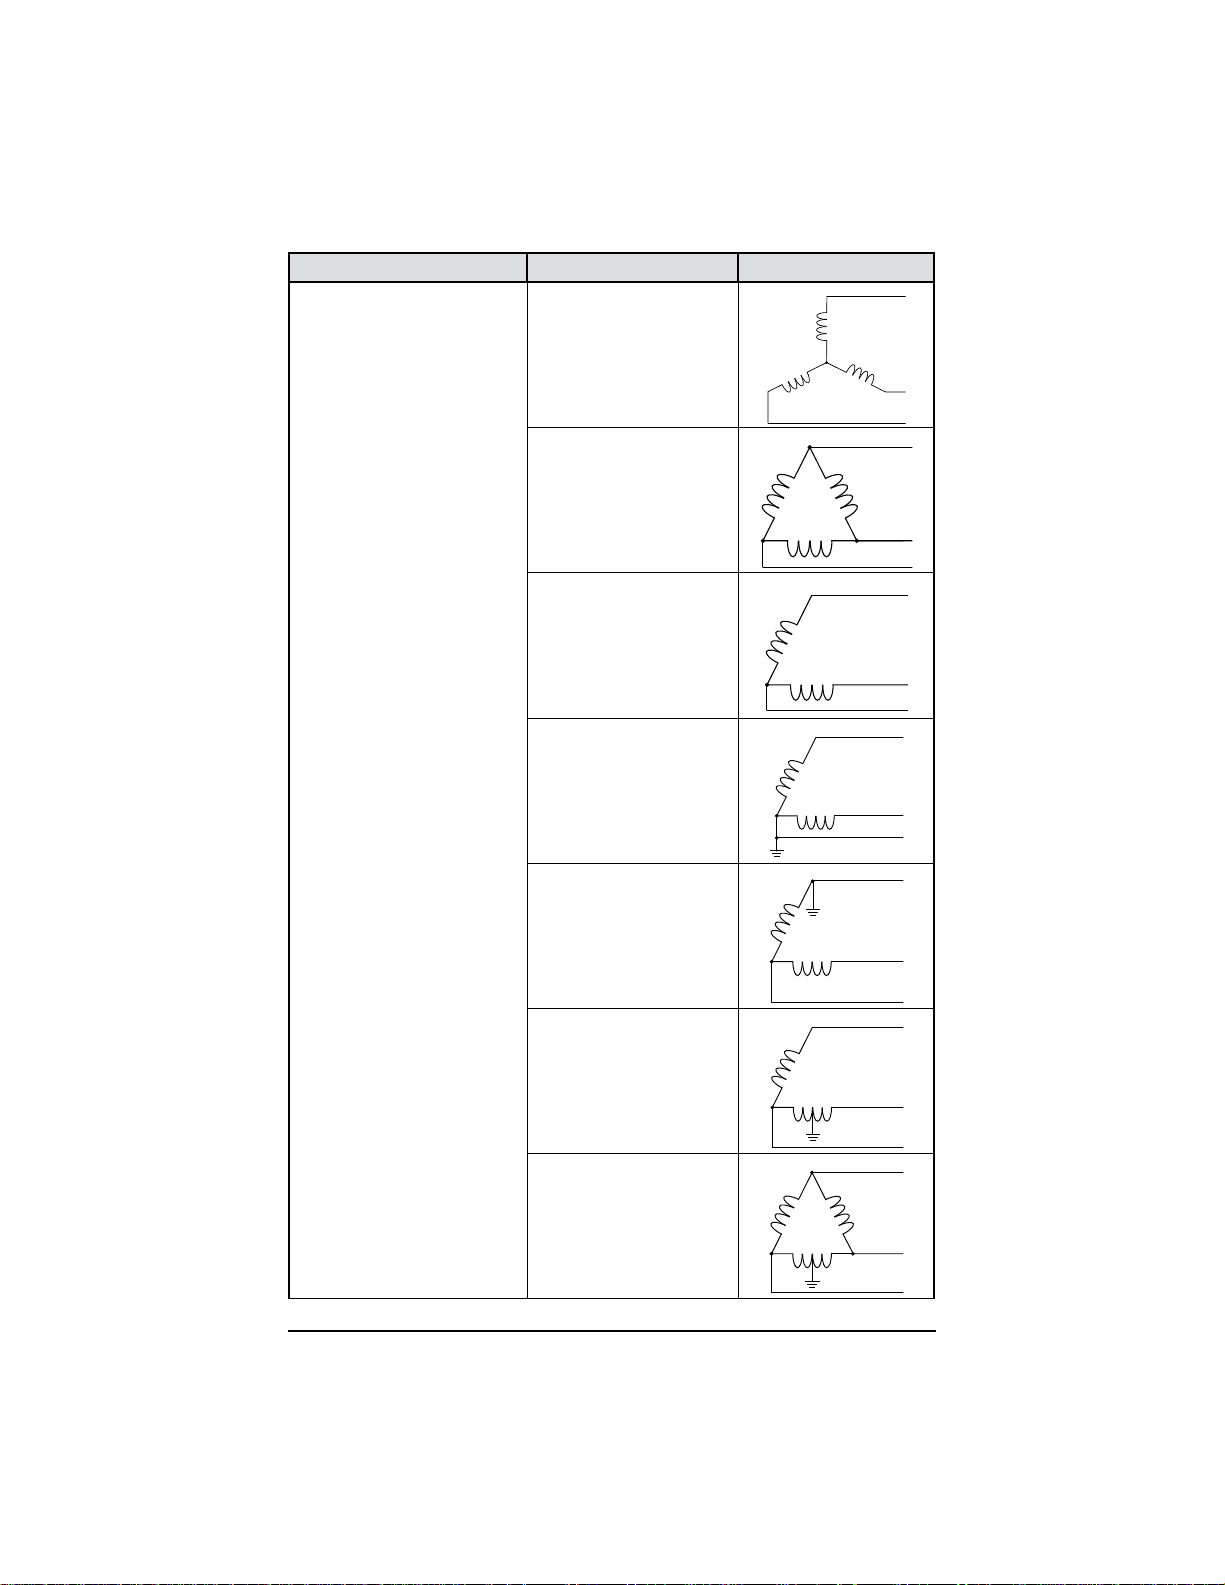
Distribution system Network Electrical Diagram
L3
L3
L3
L3
Three-phase
3 wires
in star
Three-phase
3 wires in delta
Three-phase
Three-phase
3 wires
(L1, L2, and L3)
Indicate the current sensors
that will be connected: all 3
sensors (3A) or only 2 (A 1 and
A2, A2 and A3, or A3 and A1).
If 3 sensors are connected,
the calculation will be
completed by the 3 wattmeters
with virtual neutral method.
If 2 sensors are connected,
the calculation will be done by
the Aron method.
For a 2-sensor connection,
the third sensor is not needed
if the other two sensors are
identical (same type, same
range, and same ratio).
Otherwise, the third sensor
must be connected for current
measurements.
3 wires
in open delta
Three-phase
3 wires
in open delta
with link to earth
between phases
Three-phase
3 wires
in open delta
with link to earth
on the phase
Three-phase
3 wires
in open “high leg” delta
L3
L1
L2
L1
L2
L3
L1
L2
L1
L2
L1
L2
L3
L1
L2
Three-phase
3 wires
in “high leg” delta
L1
L2
Power Quality Analyzer PowerPad® IV Model 8345 31
Find Quality Products Online at: [email protected]
www.GlobalTestSupply.com
Page 40
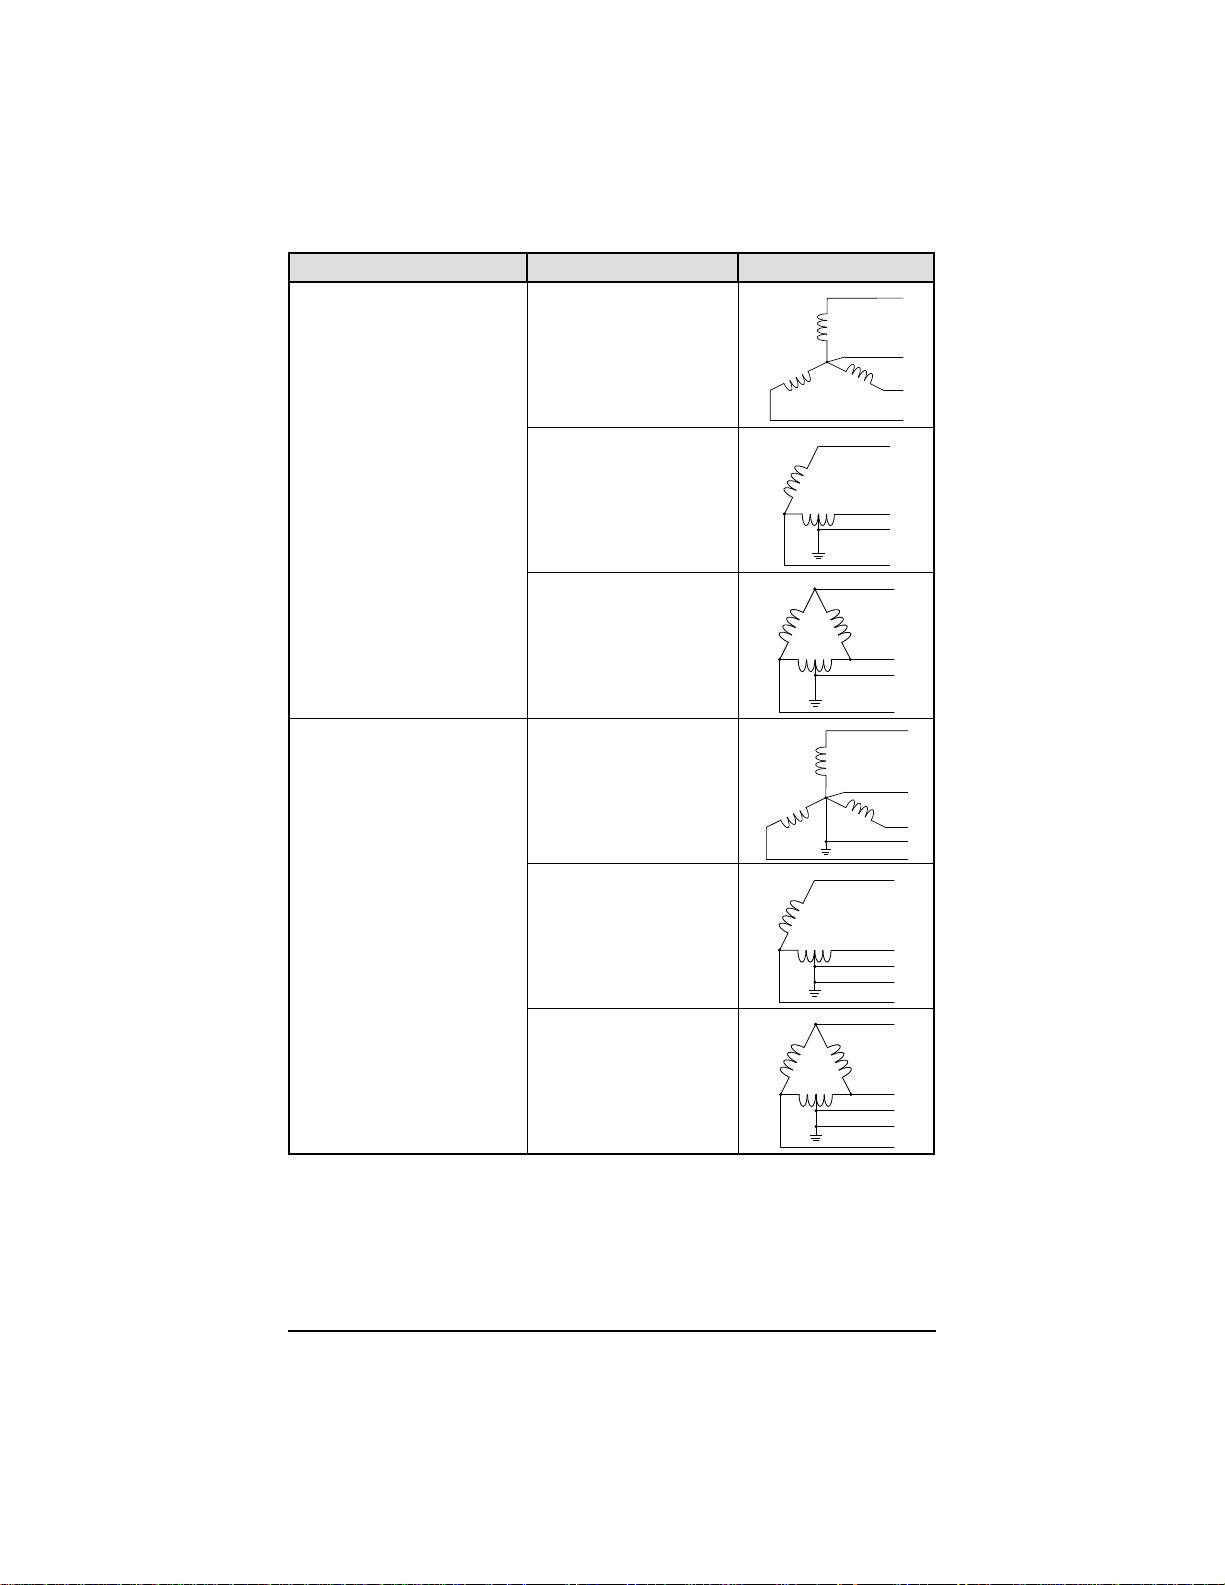
Distribution system Network Electrical Diagram
L3
L3
L3
L3
Three-phase
4 wires
with neutral
without earth
Three-phase
4 wires
(L1, L2, L3, and N)
Indicate which voltages will
be connected: all 3 voltages
(3V) or only 2 (V1V2, V2V3, or
V3V1).
If you connect only 2
voltages, the 3 phases must
be balanced (2½ elements
method).
Three-phase
4 wires
in open “high leg” delta
with neutral
without earth
Three-phase
4 wires
in “high leg” delta
with neutral
without earth
Three-phase
5 wires
in star
with neutral and earth
L3
N
L1
L2
L3
L1
N
L2
L1
N
L2
N
L1
GND
L2
Three-phase
5 wires
(L1, L2, L3, N, and earth)
Indicate which voltages will be
connected: all 3 (3V) or only 2
Three-phase
5 wires
in open “high leg” delta
with neutral and earth
GND
L1
N
L2
(V1V2, V2V3, or V3V1).
If you connect only 2
voltages, the 3 phases must
be balanced (2½ elements
method).
Three-phase
5 wires
in delta
with neutral and earth
L1
GND
L2
N
32 Power Quality Analyzer PowerPad® IV Model 8345
Find Quality Products Online at: [email protected]
www.GlobalTestSupply.com
Page 41
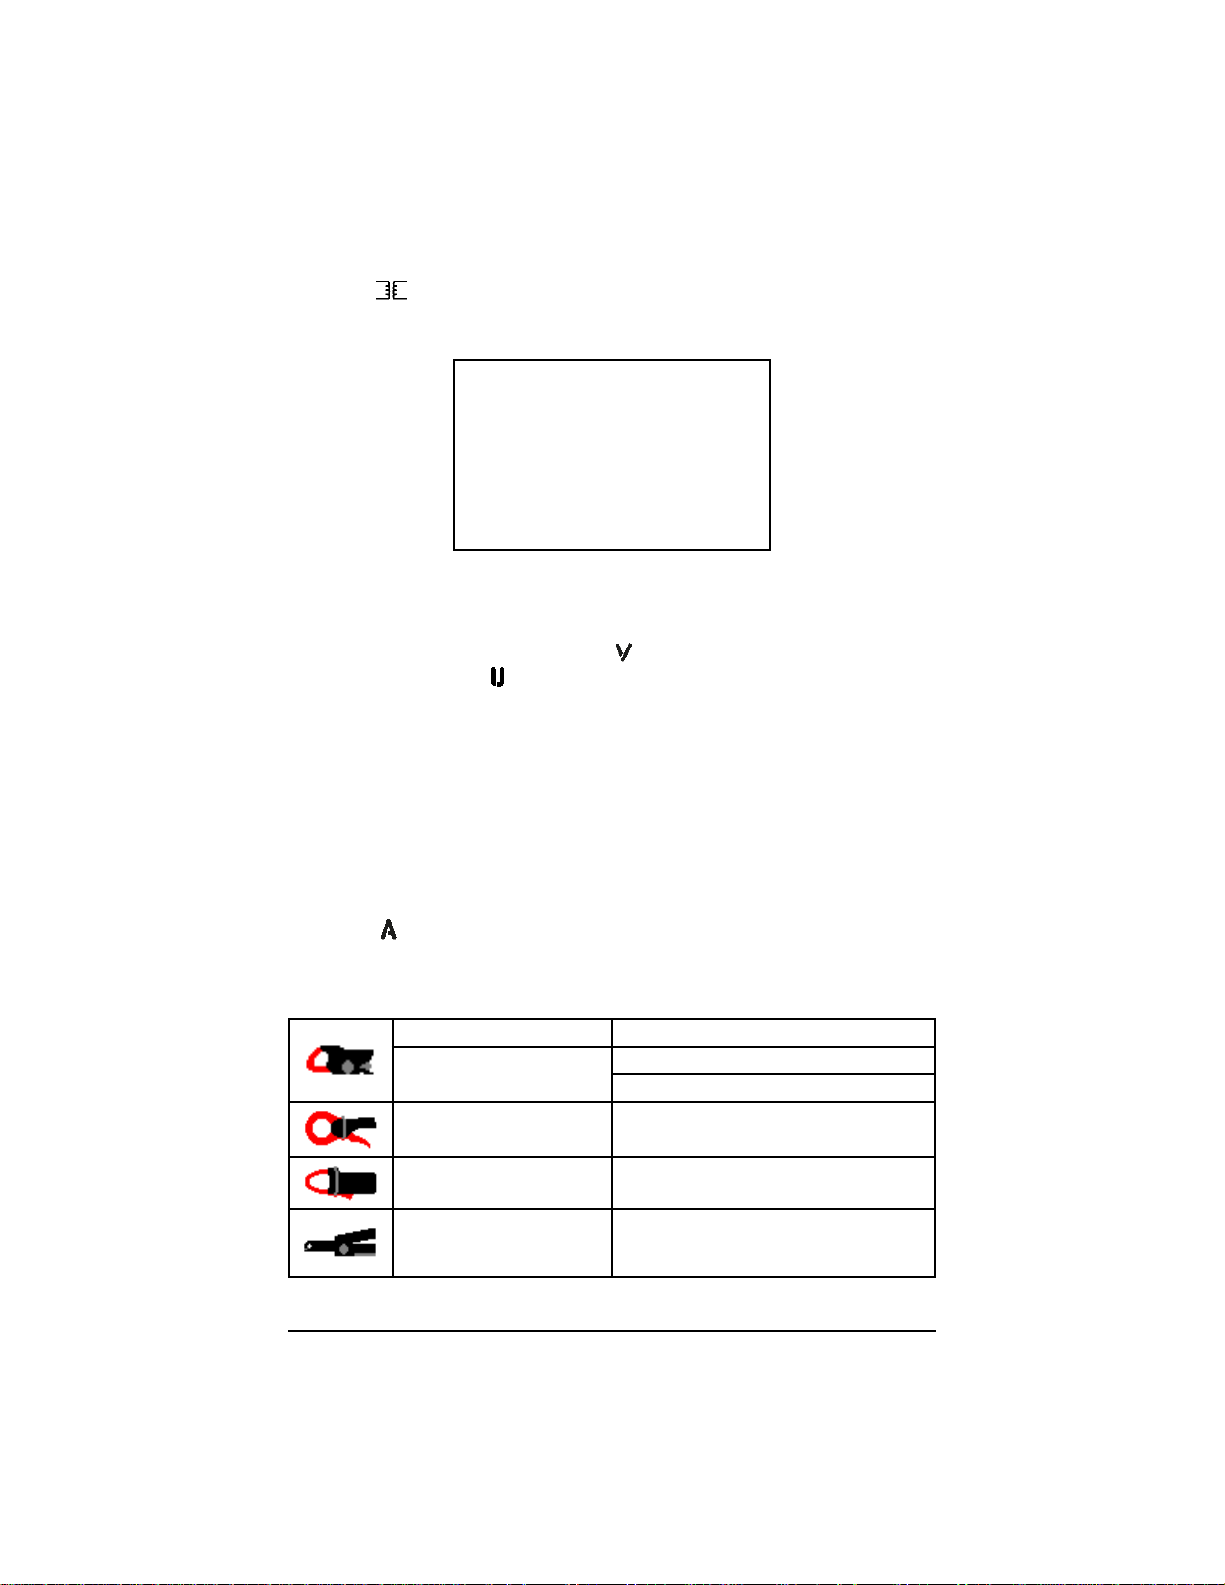
3.4.3 Sensors and Ratios
Press to select the voltage ratios and current sensor’s ratios and range
3.4.3.1 Voltage Ratio
Voltage ratios are used when the voltages are too high for the instrument and
voltage transformers are used to lower them. The ratio lets you display the true
voltage and use it in the calculations.
To choose the voltage ratios, select for phase-to-neutral voltages
(neutral included) or
4V 1/1 or 3U 1/1: every channel has the same ratio.
4V or 3U: every channel has the same ratio to be programmed.
3V+VN: every channel has the same ratio; the neutral has a dierent ratio.
V1+V2+V3+VN or U1+U2+U3: every channel has a dierent ratio.
For ratios, the primary voltages are in kV, and the secondary voltages are in V.
To avoid calculations, you can use a multiplier 1/√3 for both the primary voltages
and secondary voltages.
3.4.3.2 Current Sensors
Select to choose the ratios and ranges of the current sensors
The instrument will automatically display the detected current sensor models.
The dierent current sensors are:
for phase-to-phase voltages (neutral excluded)
MN93 clamp (200 A)
MN193 clamp (100 A)
MN193 clamp (5 A)
SR193 clamp (1000 A)
MR193 clamp (1000 A)
SL261 (BNC adapter)
■
[1 to 60,000] / {1; 2; 5}
Choice of sensitivity:
■
sensitivity 10 mV/A, range 100 A
■
sensitivity 100 mV/A, range 10 A
Power Quality Analyzer PowerPad® IV Model 8345 33
Find Quality Products Online at: [email protected]
www.GlobalTestSupply.com
Page 42
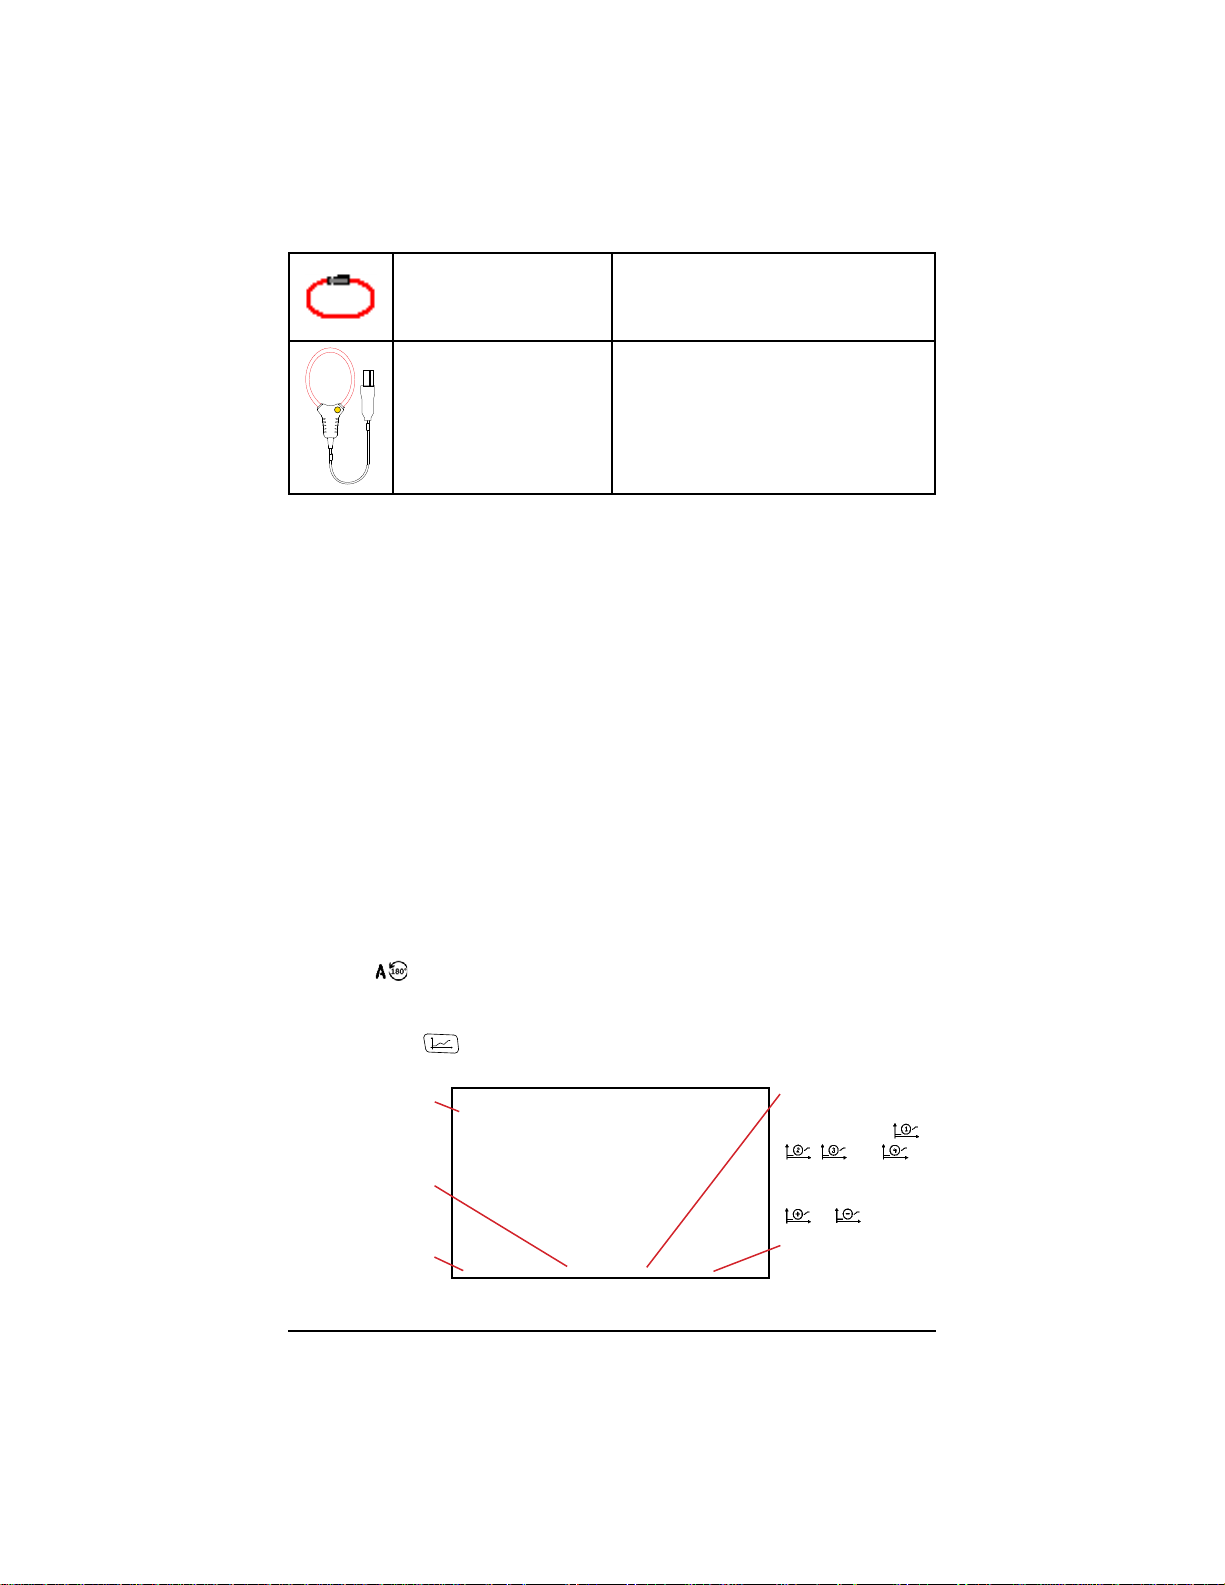
Choice of range:
■
AmpFlex® 193
MiniFlex® MA194-24-BK
0.10 A to 100.0 A
■
1.0 A to 1000 A
■
10 A to 10.00 kA
Choice of range:
■
0.10 A to 100.0 A
■
1.0 A to 1000 A
■
10 A to 10.00 kA
Current ratios are used when the currents are too high for the instrument and
current transformers are used to lower them. The ratio allows you display the
true current and use it in the calculations.
4A: every channel has the same ratio.
4A+AN: every channel has the same ratio; the neutral has a dierent ratio.
A1+A2+A3+AN: every channel has a dierent ratio.
For the ratio, the primary current cannot be less than the secondary current.
When 2 current sensors of the same type and same ratio are connected in
a three-phase, three-wire setup, the instrument will simulate the third sensor
and give it the same specications as the other sensors. The connection
conguration must indicate which sensors will be present. Then, the instrument
will show the third sensor as simulated.
This menu will only appear for the sensors referenced in the table above.
3.4.3.3 Reversing the Current
If your current sensors are connected and you notice that one or more sensors
are not correctly oriented during the measurement, you can easily reverse them
without physically reorienting them.
Press to reverse a current sensor
3.4.4 Trend Mode
The Trend mode is used to record dierent quantities for a specied duration.
Every quantity that the instrument measures can be recorded.
Conguration in
progress
The quantities to
record are on 3 pages
Choose the quantities
to record
34 Power Quality Analyzer PowerPad® IV Model 8345
Find Quality Products Online at: [email protected]
www.GlobalTestSupply.com
There are 4 possible
programmable
congurations,
, and
To change from one
to the other, use the
or key
Select or deselect all
the page’s parameters
,
Page 43

Press to congure the Trend mode
Select the quantities to record
The frequency (Hz) is always selected.
For more information about these quantities, refer to the glossary in § 20.10.
Red quantities are incompatible with the conguration and cannot be recorded.
Pages 2 and 3 concern the recording of harmonics. For each of these quantities,
you can select the orders of the harmonics to record (between 0 and 63) and, if
desired, select to record the odd harmonics only.
Levels of harmonics of order 01 will be displayed only when they concern values
stated in %r.
Press the button to congure the recording’s length, setup, recording
period, and name
For Duration, enter the trend recording’s duration between 1 min and 2 hr
For Set-up, choose a conguration from four user-dened congurations
For Period, choose the recording period from the 19 available options
between 200 ms and 2 h
For Name, enter the recording’s name (up to 8 characters long) using
capital letters (A-Z), numbers (0-9), and symbols (&, _, and -)
Power Quality Analyzer PowerPad® IV Model 8345 35
Find Quality Products Online at: [email protected]
www.GlobalTestSupply.com
Page 44
3.4.5 Transient Mode
The Transient mode is used to record voltage or current transients.
Select to congure the Transient mode
3.4.5. 1 Voltage Thresholds
Press to congure the voltage thresholds
For Number of cycles before trigger event, choose the number of cycles
between 1 and 4 that will occur before the transient recording is triggered
For Threshold set-up, dene the relationship between the thresholds and
voltage inputs. You can enter thresholds from 0 V to 9999 kV
If 4V is selected, every voltage input has the same threshold, so there is
only one threshold to congure
If 3V+VN is selected, every voltage input has the same threshold, but the
neutral has a dierent threshold. There are two thresholds to congure
If V1+V2+V3+VN is selected, every voltage input and the neutral have
dierent thresholds, so there are four thresholds to congure
3.4.5.2 Current Thresholds
Select to congure the current thresholds
For Number of cycles before trigger event, choose the number of cycles
between 1 and 4 that will occur before the transient recording is triggered
For Threshold set-up, dene the relationship between the thresholds and
current inputs. You can enter thresholds from 0 mA to 9999 kA
If 4A is selected, every current input has the same threshold, so there is
only one threshold to congure.
If 3A+AN is selected, every current input has the same threshold, but the
neutral has a dierent threshold. There are two thresholds to congure.
If A1+A2+A3+AN is selected, every voltage input and the neutral have
dierent thresholds, so there are four thresholds to congure.
3.4.5.3 Shock Wav e Thresholds
Select to congure the voltage thresholds of shock waves with respect
to earth
For Threshold set-up, dene the relationship between the thresholds and
voltage inputs. You can enter thresholds from 0 V to 2000 MV
36 Power Quality Analyzer PowerPad® IV Model 8345
Find Quality Products Online at: [email protected]
www.GlobalTestSupply.com
Page 45
If 4VE is selected, every voltage input has the same threshold, so there is
only one threshold to congure.
If 3VE+VNE is selected, every voltage input has the same threshold. The
neutral has a dierent threshold, so there are two thresholds to congure.
If V1E+V2E+V3E+VNE is selected, every voltage input and the neutral have
dierent thresholds, so there are four thresholds to congure.
3.4.5.4 Rapid Capture Conguration
Press to rapidly congure a transient capture
For Duration, enter the length of the capture between 1 min and 99 d
For Max count, enter the maximum number of transients in the capture
between 1 and 1000
For Name, enter the capture’s name (up to 8 characters long) using capital
letters (A-Z), numbers (0-9), and symbols (&, _, and -)
3.4.6 Inrush Current Mode
The Inrush Current mode is used to capture inrush currents.
Select to congure the inrush current mode
For Triggering lter, determine whether the inrush current threshold will
apply to all 3 current inputs (3A) or only one of them (A1, A2, or A3)
Enter a current threshold between 0 mA to 9999 kA for the selected
current inputs. The threshold detects the appearance of an additional
current by accounting for the current present
For Hysteresis, choose from 0 % to 100 % for the capture’s hysteresis
The rst threshold triggers the capture, and the hysteresis stops it.
For more information about the hysteresis, refer to § 20.5. Setting the
hysteresis to 100 % is equivalent to not having a stop threshold.
Press to congure an inrush current capture
For Duration, enter the length of the capture between 1 min and 99 d
For Max count, you cannot modify this eld. It is grayed-out because the
number of captures is always 1
For Name, enter the capture’s name (up to 8 characters long). The name
can include capital letters (A-Z), numbers (0-9), and symbols (&, _, and -)
Power Quality Analyzer PowerPad® IV Model 8345 37
Find Quality Products Online at: [email protected]
www.GlobalTestSupply.com
Page 46
3.4.7 Alarm Mode
The Alarm mode is used to monitor one or more quantities, either in
absolute value or in signed value. Whenever a quantity crosses the user-dened
threshold, the instrument will record information about the occurrence.
Alarm active or not
Monitored quantity
Period of calculation
of the quantity
Channels to monitor
The instrument can save up to 40 possible alarms.
1. Select
to congure the alarms
2. Select the quantities and parameters to monitor
■
The order of the harmonic (between 0 and 63) for U-h, V-h, A-h, U-ih, V-ih,
and A-ih only
■
The value’s period of calculation
For AC signals:
1/2c: 1 cycle every half-cycle. The value is measured over one cycle,
starting at a passage through zero of the fundamental component and
refreshed every 1/2 cycle.
10/12c: 10 cycles for 50 Hz (42.5 Hz to 57.5 Hz) or 12 cycles for 60 Hz
(51 Hz to 69 Hz)
150/180c: 150 cycles for 50 Hz (42.5 Hz to 57.5 Hz), or 180 cycles for
60 Hz (51 Hz to 69 Hz)
10 s
For DC signals:
200 ms
3 s
■
The channel(s) to monitor. The 8345 will propose a list according to your
specied connection
3L: each of the 3 phases
N: the neutral
4L: each of the 3 phases and the neutral
■
The alarm’s direction (< or >). Depending on the measured quantity, the
direction may be imposed by the instrument
■
The threshold
■
The hysteresis: 1 %, 2 %, 5 %, or 10 %
■
The minimum duration of the threshold overshoot
3. Then, choose whether to activate the alarm
or not by selecting
the checkbox
Threshold, hysteresis,
and duration of the
overshoot
An email is sent
when the threshold
is crossed
8 pages of 5 alarms
each
38 Power Quality Analyzer PowerPad® IV Model 8345
Find Quality Products Online at: [email protected]
www.GlobalTestSupply.com
Page 47
For more information about these quantities, please refer to the glossary
in § 20.10.
You can also choose to have an email sent
there are several alarms, they can be grouped in a single email to limit the rate
of emails to a maximum of one email every 5 minutes.
To specify an email address, refer to § 3.3.5.3.
If an alarm conguration line is red, that quantity is not available.
when the alarm is triggered. If
3.4.8 Energy Mode
The Energy mode is used to calculate the energy consumed or produced
during a specied time period.
Select to congure the Energy mode
3.4.8.1 Energy Basic Tari
Select to congure the parameters for the basic tari
For Displayed energy unit, select the energy unit to use in the
calculations. You can choose from Wh, Joule, Toe (nuclear),
Toe (non-nuclear), and BTU
For Currency, press the (€$£) button to access the currency symbol
options and then enter the currency symbols to use in the calculations
For Base tari (kWh-1), enter the base tari rate to use in the calculations
3.4.8.2 Energy Specic Ta r is
Select to dene up to 8 specic tari rates, like o-hours
Power Quality Analyzer PowerPad® IV Model 8345 39
Find Quality Products Online at: [email protected]
www.GlobalTestSupply.com
Page 48

For Enabled, select whether the specic tari congured on the screen will
be used in the calculations
For Days, select the days when the specic tari will apply
For Start, specify when the specic tari will begin on the selected days
For Duration, specify how long the specic tari will apply
For Tari (kWh-1), enter the specic tari rate to use for the congured
parameters on the current page
Use the page left and page right buttons to access the dierent specic
tari conguration pages
3.4.9 Monitoring Mode
The Monitoring mode is used to check the voltage’s conformity for a specied
duration. Each monitoring recording contains a trend record, transients record,
alarm detection, log of events, and statistical analysis of a set of measurements.
Press the button to access Monitoring mode
Use the application software to congure the Monitoring mode
3.4. 10 Flagging
Flagging concerns voltage dips, voltage swells, and interruptions.
Use the application software to congure the agging parameters
If a voltage is agged, every voltage-dependent quantity is reported because
they have been calculated from a agged quantity.
Flagging
dierent forms, like counting a single voltage dip as both a dip and a
frequency variation.
The triggering thresholds are specic to the dierent standards that dene the
voltage specications provided by public distribution networks
(EN 50160, IEC 62749, etc).
40 Power Quality Analyzer PowerPad® IV Model 8345
prevents a single event from being reported several times in
Find Quality Products Online at: [email protected]
www.GlobalTestSupply.com
Page 49
4. OPERATION
4.1 TURNING THE I NSTRUMENT ON
To turn the instrument on, press the button
The 8345 will display a start-up screen before displaying the waveform screen.
4.2 NAVIGATION
You can use the buttons, touch screen, or remote user interface (VNC) to
navigate the instrument’s menus.
4.2.1 Keypad
Refer to § 2.8 for descriptions of the buttons.
The yellow function buttons change according to the mode, current screen, and
context. The active button is highlighted in yellow.
4.2.2 Touch Screen
Every instrument function is available using the touch screen.
Press the button to open the following screen
4.2.3 Remote User Interface
You can use a PC, tablet, or smartphone to control the instrument remotely.
Via Ethernet connection
1. Connect the instrument to the PC using an Ethernet cable (see § 2.4).
2. Press the
3. Then, press the second yellow function button or
conguration screen.
Power Quality Analyzer PowerPad® IV Model 8345 41
Find Quality Products Online at: [email protected]
button to enter the mode conguration screen.
to enter the instrument
www.GlobalTestSupply.com
Page 50
4. Press to enter the network conguration screen.
5. Press
6. Check that the link is active. If it is active, the display will be shaded and will
show
bottom right, and you will have to check the physical connection between
the Ethernet cable, instrument, and PC.
7. Record the IP address.
Via Wi-Fi connection
1. Share a Wi-Fi connection with a tablet or smartphone.
2. On the tablet or smartphone, enter your instrument’s IP address into a web
browser’s address bar.
To locate the instrument’s IP address for Wi-Fi connections
1. Press the
2. Then, press the second yellow function button or
conguration screen.
3. Then, press
4. Then, press
5. Choose the Wi-Fi network connected to your tablet or smartphone.
6. Check that the link is active. If it is active, the display will be shaded and will
show
7. Record the IP address.
to enter the Ethernet link screen.
in the bottom right. If it is inactive, the display will show in the
button to enter the mode conguration screen.
to enter the instrument
to enter the network conguration screen.
to enter the Wi-Fi link screen.
in the bottom right.
Only one link (Ethernet or Wi-Fi) can be activated at a time.
Starting a remote session
1. Enter your instrument’s IP address into a browser to activate the remote
session (VNC).
2. In the left-hand tab, click Fullscreen to adjust display window’s size on
your screen.
3. Click Settings to congure the VNC session parameters.
4. Then, select Shared Mode to control the instrument or View Only to view
the instrument’s screen only.
5. Click Settings again to close the conguration menu.
6. Then, click Connect. You will see the 8345’s screen on your connected
device’s screen.
42 Power Quality Analyzer PowerPad® IV Model 8345
Find Quality Products Online at: [email protected]
www.GlobalTestSupply.com
Page 51
4.3 CONFIGURATION
Before making any measurement, remember to specify:
■
The connection type (§ 3.4.2)
■
The current sensors, the voltage ratio, and the current ratio (§ 3.4.3)
■
The calculation method, if necessary (§ 3.4.1)
For the recording modes, remember to specify:
■
The quantities to record
■
The recording’s start time
■
The recording’s duration
■
The recording conditions
4.4 CONNECTIONS
1. Ensure that the leads and sensors are correctly color-coded (see § 2.9).
2. Then, connect them to the circuit as shown by the following screens.
4.4.1 Single-Phase Network
4.4.2 Split-Phase Network
Power Quality Analyzer PowerPad® IV Model 8345 43
Find Quality Products Online at: [email protected]
www.GlobalTestSupply.com
Page 52

4.4.3 Three-Phase Network
For three-phase, 3-wire networks, indicate the current sensors that will be
connected: all 3 sensors (3A) or only 2 (A1 and A2, A2 and A3, or
A3 and A1)
For three-phase, 4-wire and 5-wire networks, indicate the voltage sensors
that will be connected: all 3 sensors (3V) or only 2 (V1 and V2, V2 and V3,
or V3 and V1)
4.4.4 Connection Procedure
Depending on the network, not every terminal or sensor needs to be connected.
The unused terminals must be connected to the N terminal; otherwise,
phantom voltages will occur on the open channels. If the N terminal is
not used, connect it to the GND terminal.
The following procedure helps minimize connection errors.
1. Connect the earth lead between the
2. Connect the neutral lead between voltage terminal N and the network neutral.
3. Connect the neutral current sensor to the current terminal N and then clamp
the neutral cable.
4. Connect the phase L1 lead between voltage terminal L 1 and network phase L1 .
5. Connect the phase L1 current sensor to current terminal L1 and then clamp
the phase L1 cable.
6. Connect the phase L2 lead between voltage terminal L2 and network phase L2.
7. Connect the phase L2 current sensor to current terminal L2 and then clamp
the phase L2 cable.
8. Connect the phase L3 lead between voltage terminal L3 and network phase L3.
9. Connect the phase L3 current sensor to current terminal L3 and then clamp
the phase L3 cable.
If you connect a current sensor in reverse, you can correct the connection
directly in the conguration.
Press , , and then (see § 3.4.3.3)
terminal and the network earth.
44 Power Quality Analyzer PowerPad® IV Model 8345
Find Quality Products Online at: [email protected]
www.GlobalTestSupply.com
Page 53
Disconnecting the instrument from the network:
1. Disconnect in the reverse order of connection and always end by
disconnecting the earth, neutral, or both.
2. Disconnect the leads from the instrument.
4.5 INSTRUMENT FUNCTIONS
4.5. 1 Measurements
There are 4 possible real-time modes: waveform , harmonics , power
, and energy
There are 5 possible recording modes: trend , transients , inrush
currents
1. Ensure that the instrument’s conguration is correct for the desired
measurements.
2. Then, you can make the following measurements:
• View a signal’s waveforms
• View a signal’s harmonics
• View power measurements
• Meter energy
• Record a trend
• Record transients
• Capture an inrush current
• Detect alarms
• Monitor a network
Some functions cannot be run simultaneously:
■
The real-time modes (waveform, harmonics, power, and energy) can be
activated while recordings are in progress
■
If an inrush current capture is in progress, you cannot start the recording of
a trend, transients, alarms, or monitoring
■
If a recording of a trend, transients, alarms, or monitoring is in progress, you
cannot start an inrush current capture
, alarms , and network monitoring
4.5.2 Screenshot
1. T o record a screenshot, hold the button, or click on the icon in the
status bar.
2. Release the
you release the button or icon before the symbol turns black, no screenshot
will be recorded.
The screenshots are recorded on the SD card in directory 8345\Photograph
Real-time screens that vary, like curves or metering, are captured in bursts of up
to 5 snapshots, so you can choose the best screenshot for your needs
Power Quality Analyzer PowerPad® IV Model 8345 45
Find Quality Products Online at: [email protected]
button or icon when the symbol turns black . If
www.GlobalTestSupply.com
Page 54
4.5.3 Help
Press the help button at any time for information about the functions
and symbols used for the in-progress display mode
4.6 TURNING THE INSTRUMENT OFF
To turn the instrument o, press the button
The instrument will request conrmation if it is recording or metering energy,
recording transients, recording alarms, or capturing inrush current,
If you conrm the Power-o command, the recordings will be nalized and the
instrument will turn o.
If the instrument turns on before the scheduled end of any recording sessions,
these sessions will resume automatically.
4.7 SAF ETY STATUS
If there is an overload on the inputs, the instrument will change to safety status.
Safety status is indicated by a red line under the status bar.
Safety status
The red line indicates that the sum of all voltage inputs exceeds 1450 V
condition is not reached with signals ranging up to 1000 V
accidentally connect the 3 voltage inputs to the same phase, the sum of
the voltage inputs will exceed the safety threshold.
When the overload has been eliminated, the safety status will disappear after
approximately 10 seconds, and you can use your instrument normally again.
This change to safety status may also occur when the instrument is turned on.
46 Power Quality Analyzer PowerPad® IV Model 8345
; however, if you
RMS
crest
. This
Find Quality Products Online at: [email protected]
www.GlobalTestSupply.com
Page 55
5. WAVEFORM
The Waveform mode screen is the initial screen when the instrument turns on.
Press the button to enter waveform mode
Display of voltages or
currents
saturation indicators
with
Cursor
Selected display lter
Functions
Values at the
cursor’s position
Waveform mode displays voltage curves, current curves, and values calculated
from the voltage and currents (except harmonics, powers, and energies).
Waveform mode Functions
RMS Displays curves and RMS values
THD Displays curves and harmonic distortion
CF Displays curves and crest factor
Displays the maximum (MAX), RMS, minimum (MIN), positive peak (PK+),
and negative peak (PK-) values in table form
Displays the RMS, DC, THD, CF, P
table form
Displays the phasor diagram of the signals
Reduces or increases the time scale of the curves
To move the time cursor, use the ◄ ► buttons
To change the display lter, use the ▲ ▼ buttons. The available display
, Pst, Plt, FHL, FK, and KF values in
inst
lters depend on the chosen distribution network and connection type
5.1 DISPLAY FILTER
The available display lters depend on the distribution system and connection.
Connection Display lter
Single-phase, 2 wires
Split-phase, 2 wires
Single-phase, 3 wires 2V, 2A, L1, N 2V, 2A, L1
Split-phase, 3 wires U, 2V, 2A, L1, L2 2V, 2A, L1, L2
Split-phase, 4 wires U, 3V, 3A, L1, L2, N 2V, 2A, L1, L2
Three-phase, 3 wires 3U, 3A 3U, 3A
Three-phase, 4 wires 3U, 3V, 3A, L1, L2, L3 3U, 3V, 3A, L1, L2, L3
Three-phase, 5 wires 3U, 4V, 4A, L1, L2, L3, N 3U, 3V, 4A, L1, L2, L3
L1 L1
Display lter for
function
Power Quality Analyzer PowerPad® IV Model 8345 47
Find Quality Products Online at: [email protected]
www.GlobalTestSupply.com
Page 56
5.2 ROOT MEAN SQUARE (RMS) FUNCTION
The RMS function displays the signals measured over a period and their RMS
values averaged over 200 ms or 3 s, depending on the conguration. The
conguration is explained in detail in § 3.4.1.2.
Press the RMS button to access the RMS function screen
To move the cursor, use the ◄ ► buttons. You can use the cursor to check
the instantaneous values along the displayed curves
To change the display lter, use the ▲ ▼ buttons
To increase or decrease the time scale of the curves, use the buttons
The channel numbers (
that the channel is full or that one or more channels used to calculate it is full.
The
symbol near a channel number indicates that a measurement has been
agged, so the voltage and all quantities that depend on it are doubtful. The
symbol concerns voltage dips, voltage swells, interruptions, and rapid voltage
changes. The associated current channel and the associated combined voltages
are also agged. For example, if V1 is agged, then A1, U1, and U3 will also be
marked.
The 3U display lter displays the instantaneous curves of phase-to-phase
voltages and their RMS values.
) are saturation indicators. A solid circle ( ) indicates
The 4V display lter displays the instantaneous curves of phase-to-neutral
voltages and their RMS values.
48 Power Quality Analyzer PowerPad® IV Model 8345
Find Quality Products Online at: [email protected]
www.GlobalTestSupply.com
Page 57
The 4A display lter displays the instantaneous curves of currents and their
RMS values.
The L3 display lter displays the instantaneous phase 3 voltage curves, current
curves, and their RMS values.
Cursor
Max and min of the
voltages and currents
Values at the cursor's
position:
■
Max value
■
Nominal value
■
Min value
There are 3 curves that are often superimposed: the maximum curve, the
nominal curve, and the minimum curve.
The L1, L2, and N display lters are similar but concern phase 1, phase 2, and
the neutral.
5.3 TOTAL HARMONIC DISTORTION (THD) FUNCTION
The THD function displays the signals measured over a period and their total
harmonic distortion.
Press the THD button to access the THD function screen
The THD is displayed with either the RMS value of the fundamental (%f) or the
RMS value without DC (%r), depending on your conguration (see § 3.4.1).
The THD function screens are similar to the RMS screens and depend on the
selected display lter.
5.4 CREST FACTOR (CF) FUNCTION
The CF function displays the measured signals and their crest factors.
Press the CF button to access the CF function screen
The CF function screens are similar to the RMS screens and depend on the
selected display lter.
Power Quality Analyzer PowerPad® IV Model 8345 49
Find Quality Products Online at: [email protected]
www.GlobalTestSupply.com
Page 58
5.5 MIN-MAX FUNC TION
The MIN-MAX function displays the voltage’s and current’s RMS, maximum
(MAX), minimum (MIN), positive peak (PK+), and negative peak (PK-) values.
Press the button to access the MIN-MAX function screen
The instrument will begin searching for the extreme values when it is
switched on. To reset the values, press the
To change the display lter, use the ▲ ▼ buttons. The available display
lters depend on the chosen distribution network and connection type
The instrument will display “- - -” if a value cannot be calculated. For example, no
value can be calculated because the instrument is not connected to the network.
The 3U display lter displays the extreme values of phase-to-phase voltages.
The 4V display lter displays the extreme values of phase-to-neutral voltages.
button.
The 4A display lter displays the extreme values of the currents.
50 Power Quality Analyzer PowerPad® IV Model 8345
Find Quality Products Online at: [email protected]
www.GlobalTestSupply.com
Page 59
The L1 display lter displays the extreme values of the voltage and current of
phase 1.
The L2, L3, and N display lters are similar but concern phase 2, phase 3, and
the neutral.
5.6 SUMMARY FUNCTION
The summary function displays values for the voltage and current inputs that
depend on the selected distribution network, connection type, and display lter.
Press to enter the summary function screen
Displayed Values
RMS value
DC component
Total harmonic distortion referred to the RMS value of the fundamental
For
voltages
For
currents
*Additional information about the icker is available in § 20.3.
Depending on the display lter, not every listed parameter will be displayed.
(THD %f)
Total harmonic distortion referred to the RMS value without DC (THD %r)
Crest factor (CF)
Short-term instantaneous icker (P
Short-term icker (P
Long-term icker (P
RMS value
DC component
Total harmonic distortion referred to the RMS value of the fundamental
(THD %f)
Total harmonic distortion referred to the RMS value without DC (THD %r)
Total harmonic distortion referred to the RMS value without DC (THD %r)
Crest factor (CF)
Harmonic loss factor (FHL)
K factor (FK)
K-factor (KF)
)
st
)
lt
inst
)*
The calculations will begin when the instrument turns on.
Power Quality Analyzer PowerPad® IV Model 8345 51
Find Quality Products Online at: [email protected]
www.GlobalTestSupply.com
Page 60
If a value cannot be calculated, the instrument will display - - -. For example, no
value can be calculated because the instrument is not connected to the network.
To change the display lter, use the ▲ ▼ buttons. The available display
lters depend on the chosen distribution network and connection type
The 4V display lter displays the data of the phase-to-neutral voltages.
The energy calculation starts at xed times: 00.00, 00.10, 00.20, 00.30, 00.40,
00.50, 01.00, 01.10, etc. If you switch your instrument on at 08.01, the rst P
st
value will be displayed at 08.20.
The calculation of the P
10.00, 12.00, etc. If you switch your instrument on at 08.01, the rst P
starts at xed times: 00.00, 02.00, 04.00, 06.00, 08.00,
lt
value will
lt
be displayed at 12.00 in the case of a xed window and at 10.10 in the case of a
sliding window.
Only calculations completed with the xed window are recognized by IEC
standard 61000-4-30.
The 4A display lter displays the extreme values of the currents.
The L2 display lter displays the voltage and current data of phase 2.
The L1, L3, and N display lters are similar but concern phase 1, phase 3, and
the neutral.
52 Power Quality Analyzer PowerPad® IV Model 8345
Find Quality Products Online at: [email protected]
www.GlobalTestSupply.com
Page 61
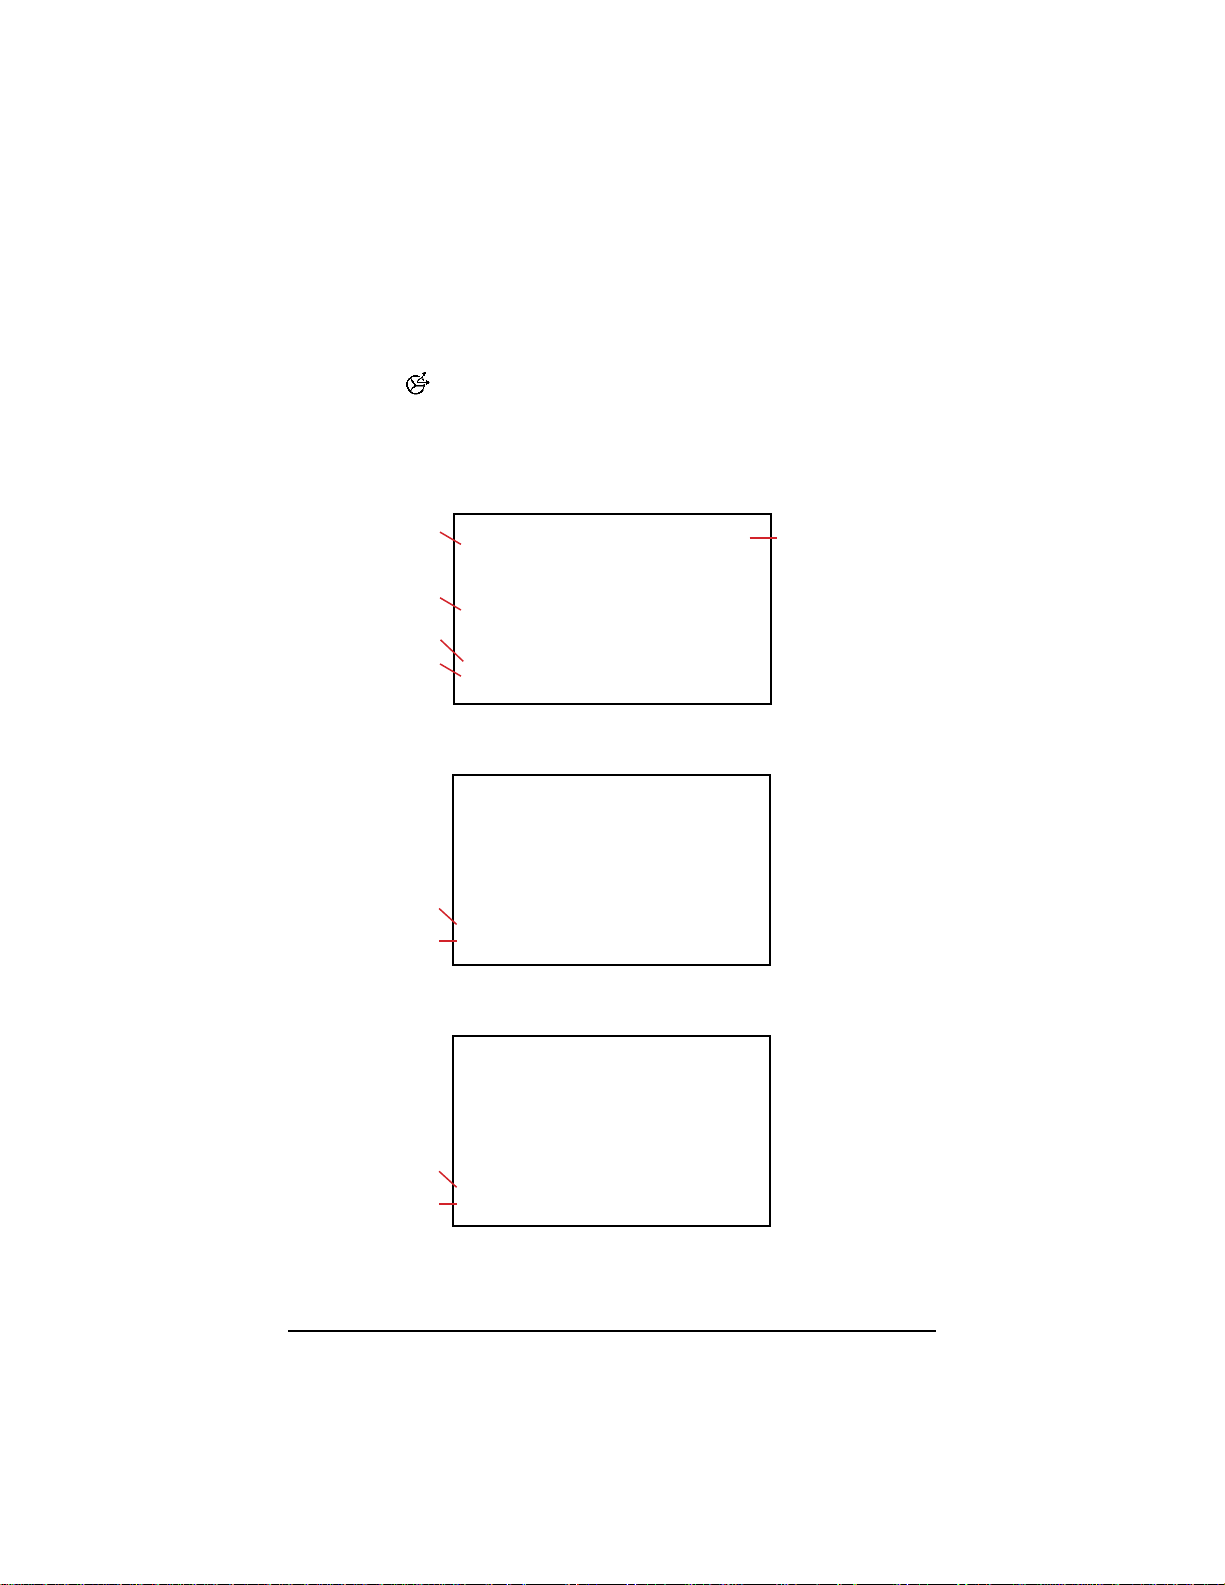
5.7 PHAS OR F UNCTIO N
The phasor function displays the phasor diagram of the signals, the absolute
values of the voltages or current, the phase dierence between voltages or
between currents, and the unbalance ratio or inverse unbalance ratio of the
voltages or current.
Press the button to access the phasor function screen
To change the display lter, use the ▲ ▼ buttons. The available display
lters depend on the chosen distribution network and connection type
The 3U display lter displays the phasor diagram of the phase-to-phase
voltages. U1 is the reference.
Absolute values
Phase dierence
Inverse unbalance ratio
Zero sequence
unbalance ratio
The displayed channels
The 3V display lter displays the phasor diagram of the currents and the
phase-to-neutral voltages. V1 is the reference.
Inverse unbalance ratio
Zero sequence
unbalance ratio
The 3A display lter displays the phasor diagram of the currents and the
phase-to-neutral voltages. A1 is the reference.
Inverse unbalance ratio
Zero sequence
unbalance ratio
Power Quality Analyzer PowerPad® IV Model 8345 53
Find Quality Products Online at: [email protected]
www.GlobalTestSupply.com
Page 62

The choice of current or voltage as reference can be changed in the
conguration as mentioned in § 3.4.1.
The L3 display lter displays the phasor diagram of the phase 3 voltage and
current. A3 is the reference.
The choice of current or voltage as reference can be changed in the
conguration as mentioned in § 3.4.1.
The L1 and L2 display lters are similar but concern phase 1 and phase 2.
54 Power Quality Analyzer PowerPad® IV Model 8345
Find Quality Products Online at: [email protected]
www.GlobalTestSupply.com
Page 63
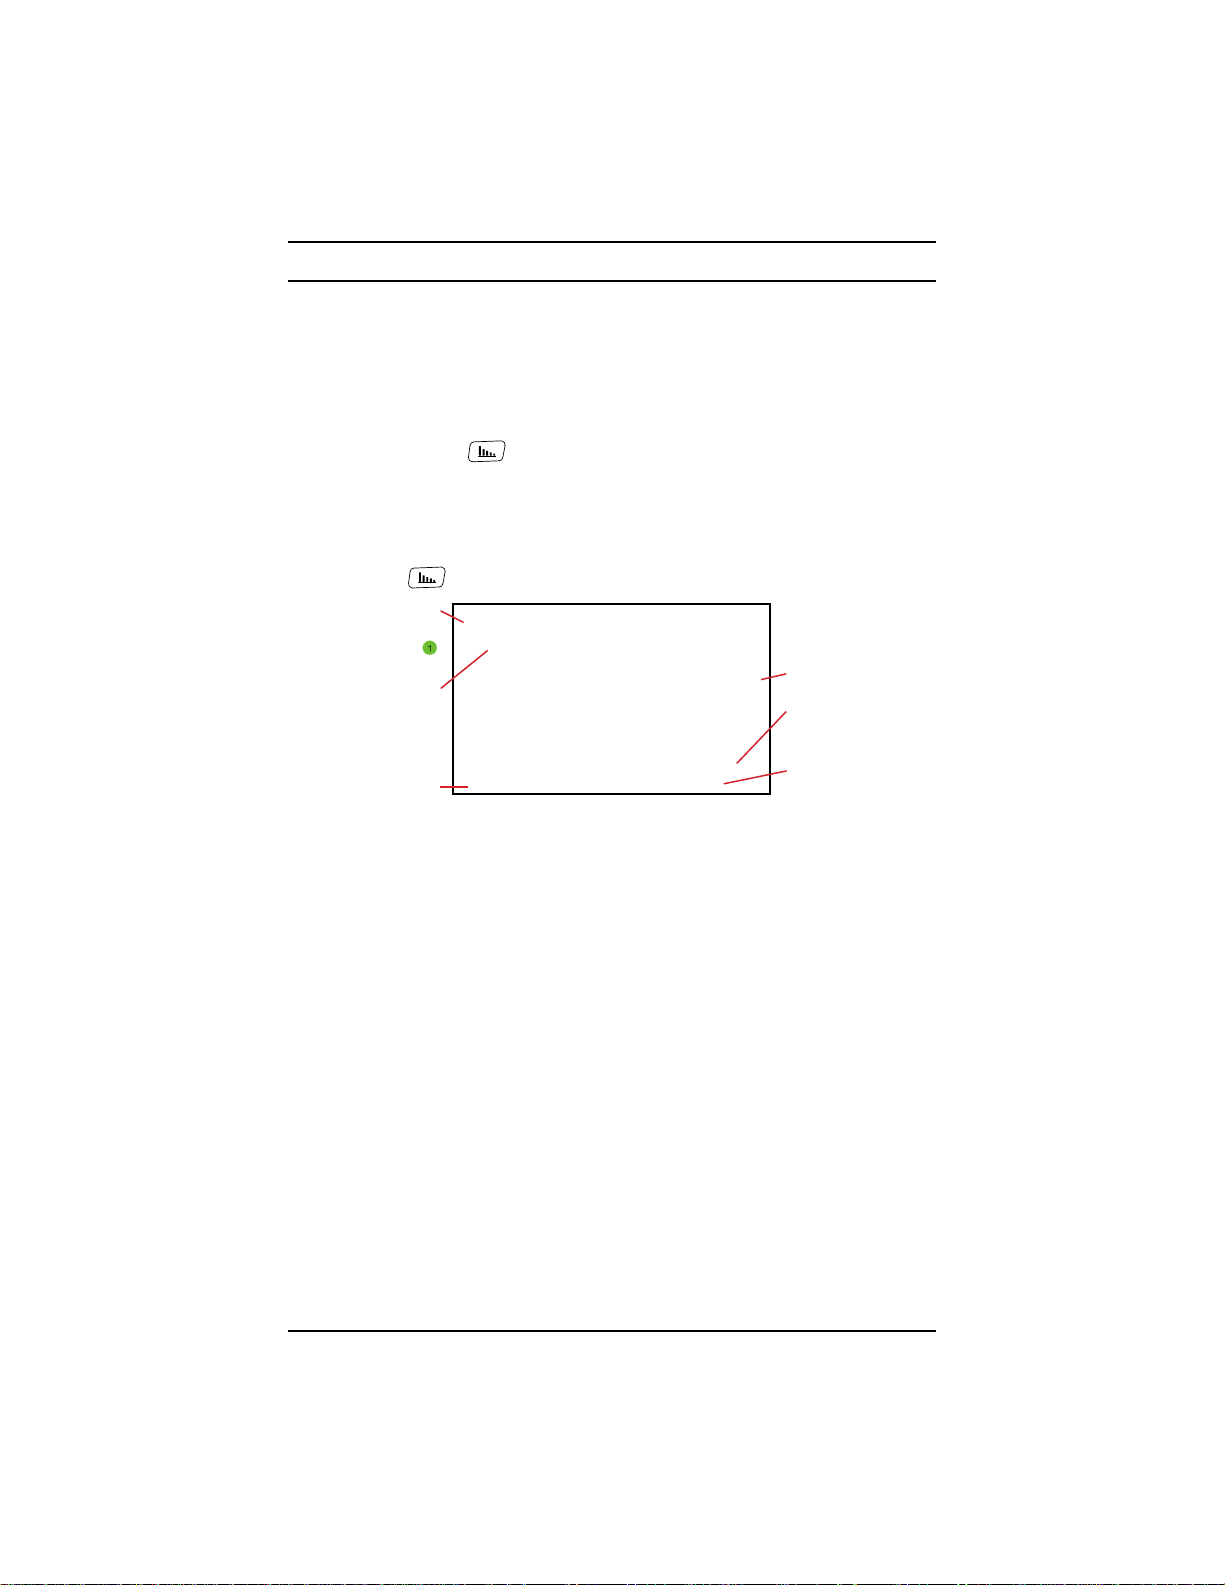
6. HARMONICS
The voltages and currents can be analyzed as sum of sine waves at the network
frequency and multiples thereof. Each multiple is a harmonic of the signal that is
characterized by its frequency, amplitude, and phase dierence with respect to
the fundamental frequency (network frequency).
An interharmonic occurs when one of the frequencies of the sine waves is not a
multiple of the fundamental frequency.
The Harmonics mode
of the voltage, current, and mains signaling voltage (MSV).
The bargraph he l ps d etermine the harm o ni c currents prod uced by nonlinear
loads and analy ze t h e p r o bl e ms that arise from t h e s e ha rmonics as a fun ction
of their order, like the overheating of n e ut r a ls, conductors , m oto rs, and more.
Press the button to access the Harmonics mode screen
Display of voltages or
currents
saturation indicators
with
Cursor
displays a bargraph that represents the harmonics
Display lter
Values at the cursor’s
position
Functions
Press V to display:
Reset the
maximum values
• The harmonics of the phase-to-neutral voltages listed order-by-order
• The total harmonic distortion referred to either the RMS value of the
fundamental (%f) or the RMS value without DC (%r), depending on the
conguration (see § 3.4.1)
• The distorting phase-to-neutral voltages
Press A to display:
• The harmonics of the currents listed order-by-order
• The total harmonic distortion referred to either the RMS value of the
fundamental (%f) or the RMS value without DC (%r), depending on the
conguration (see § 3.4.1)
• The distorting currents
Press U to display:
• The harmonics of the phase-to-phase voltages listed order-by-order
• The total harmonic distortion referred to either the RMS value of the
fundamental (%f) or the RMS value without DC (%r), depending on the
conguration (see § 3.4.1)
• The distorting phase-to-phase voltages
Power Quality Analyzer PowerPad® IV Model 8345 55
Find Quality Products Online at: [email protected]
www.GlobalTestSupply.com
Page 64
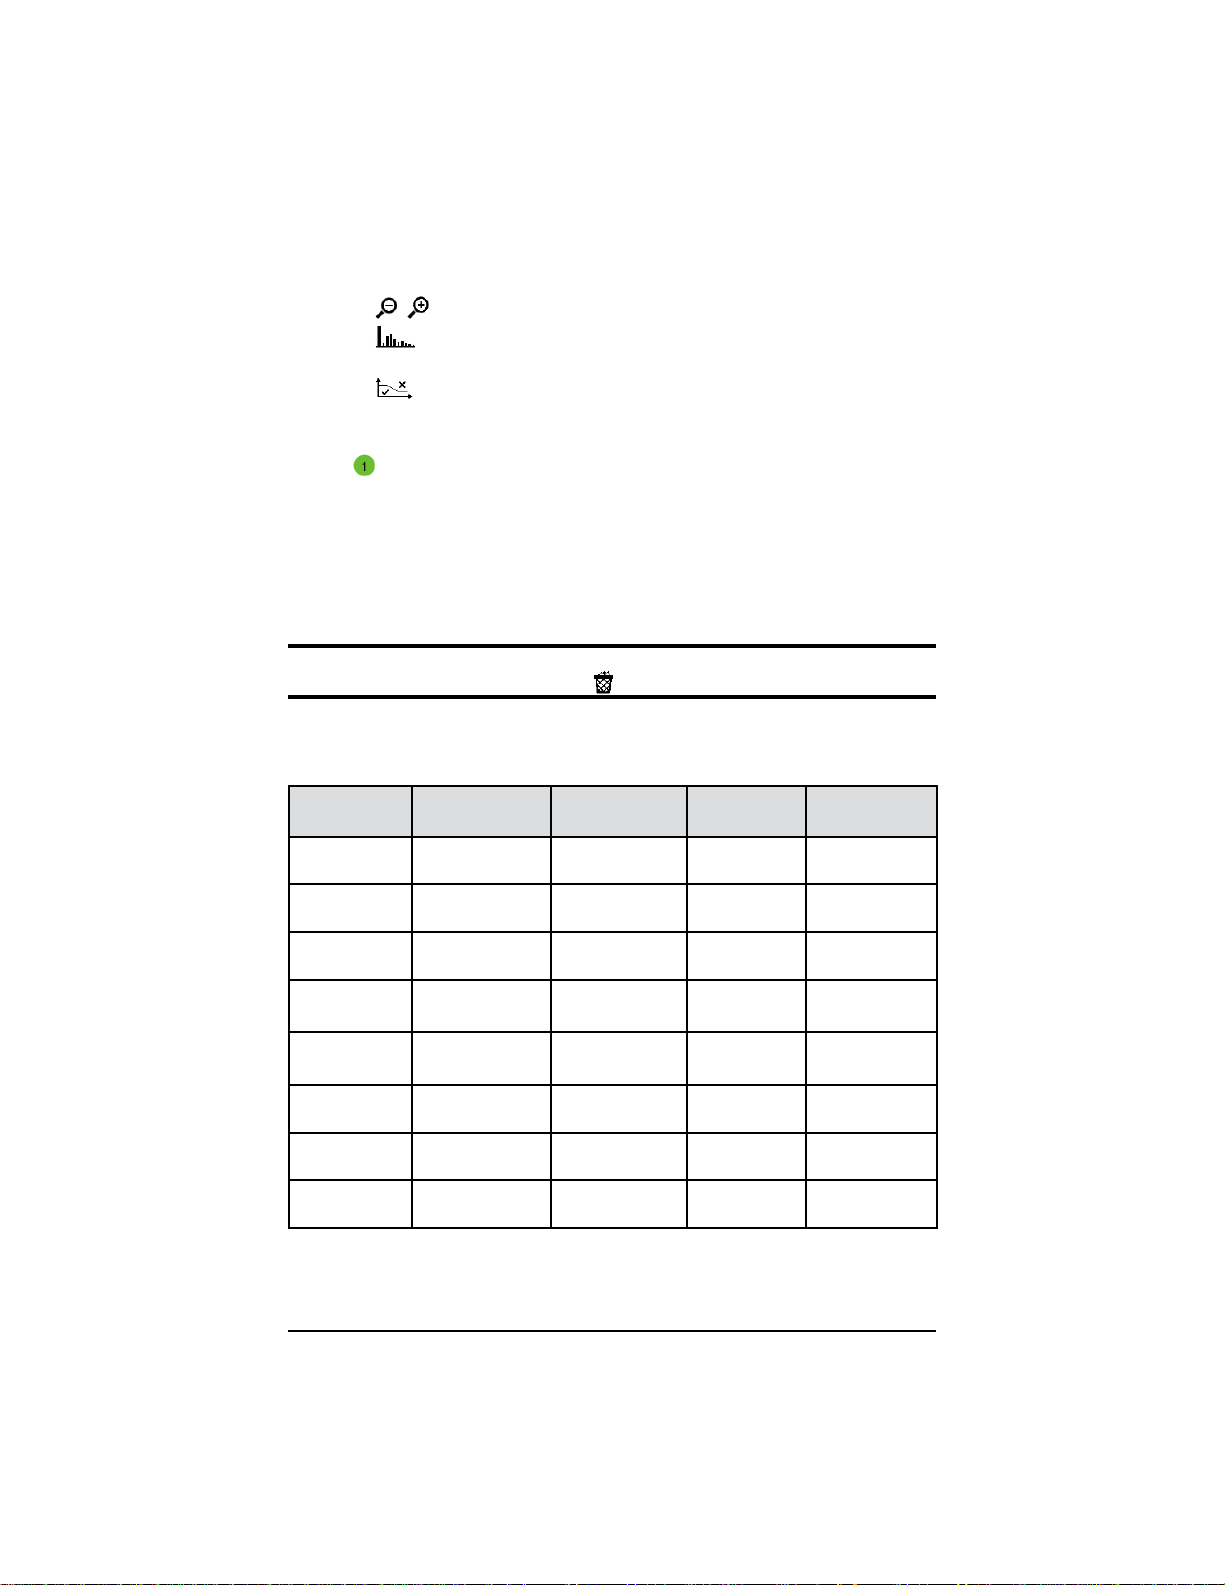
Press MSV to display the spectral level (curve) and RMS values at the
congured MSV1 and MSV2 frequencies (see § 3.4.1)
Press to stretch or shrink the scale of the bargraph
Press to view interharmonics when the display lter concerns only one
phase (L1, L2, L3, or N)
Press with the MSV function active to view the limits prole for the
level of V or U according to the congured frequency (see § 3.4.1)
The channel numbers
colored
when the measured channel is full or at least one channel used to
are saturation indicators. The circle’s interior will be
calculate it is full.
To move the harmonic order’s cursor, use the ◄ ► buttons
If there are more harmonics when you reach the last harmonic of the screen,
you will go to the second screen.
To change the display lter, use the ▲ ▼ buttons. The available display
lters depend on the chosen distribution network and connection type
The calculation of the harmonics starts when the instrument turns on.
To reset the values, press the
button.
6.1 DISPLAY FILTER
The available display lters depend on your selected connection:
Connection
Single-phase
2 wires
Single-phase
3 wires
Split-phase
2 wires
Split-phase
3 wires
Split-phase
4 wires
Three-phase
3 wires
Three-phase
4 wires
Three-phase
5 wires
Display lter
for V
L1 L1 - L1 on V
L1, N L1, N - L1 on V
- L1 L1 L1 on U
2L, L1, L2 2L, L1, L2 L1
2L, L1, L2, N 2L, L1, L2, N L1
- 3L, L1, L2, L3 3L, L1, L2, L3 L1, L2, L3 on U
3L, L1, L2, L3 3L, L1, L2, L3 3L, L1, L2, L3
3L, L1, L2, L3, N 3L, L1, L2, L3, N 3L, L1, L2, L3
Display lter
for A
Display lter
for U
Display lter
for MSV
L1, L2 on V
L1 on U
L1, L2 on V
L1 on U
L1, L2, L3
on V and U
L1, L2, L3
on V and U
56 Power Quality Analyzer PowerPad® IV Model 8345
Find Quality Products Online at: [email protected]
www.GlobalTestSupply.com
Page 65
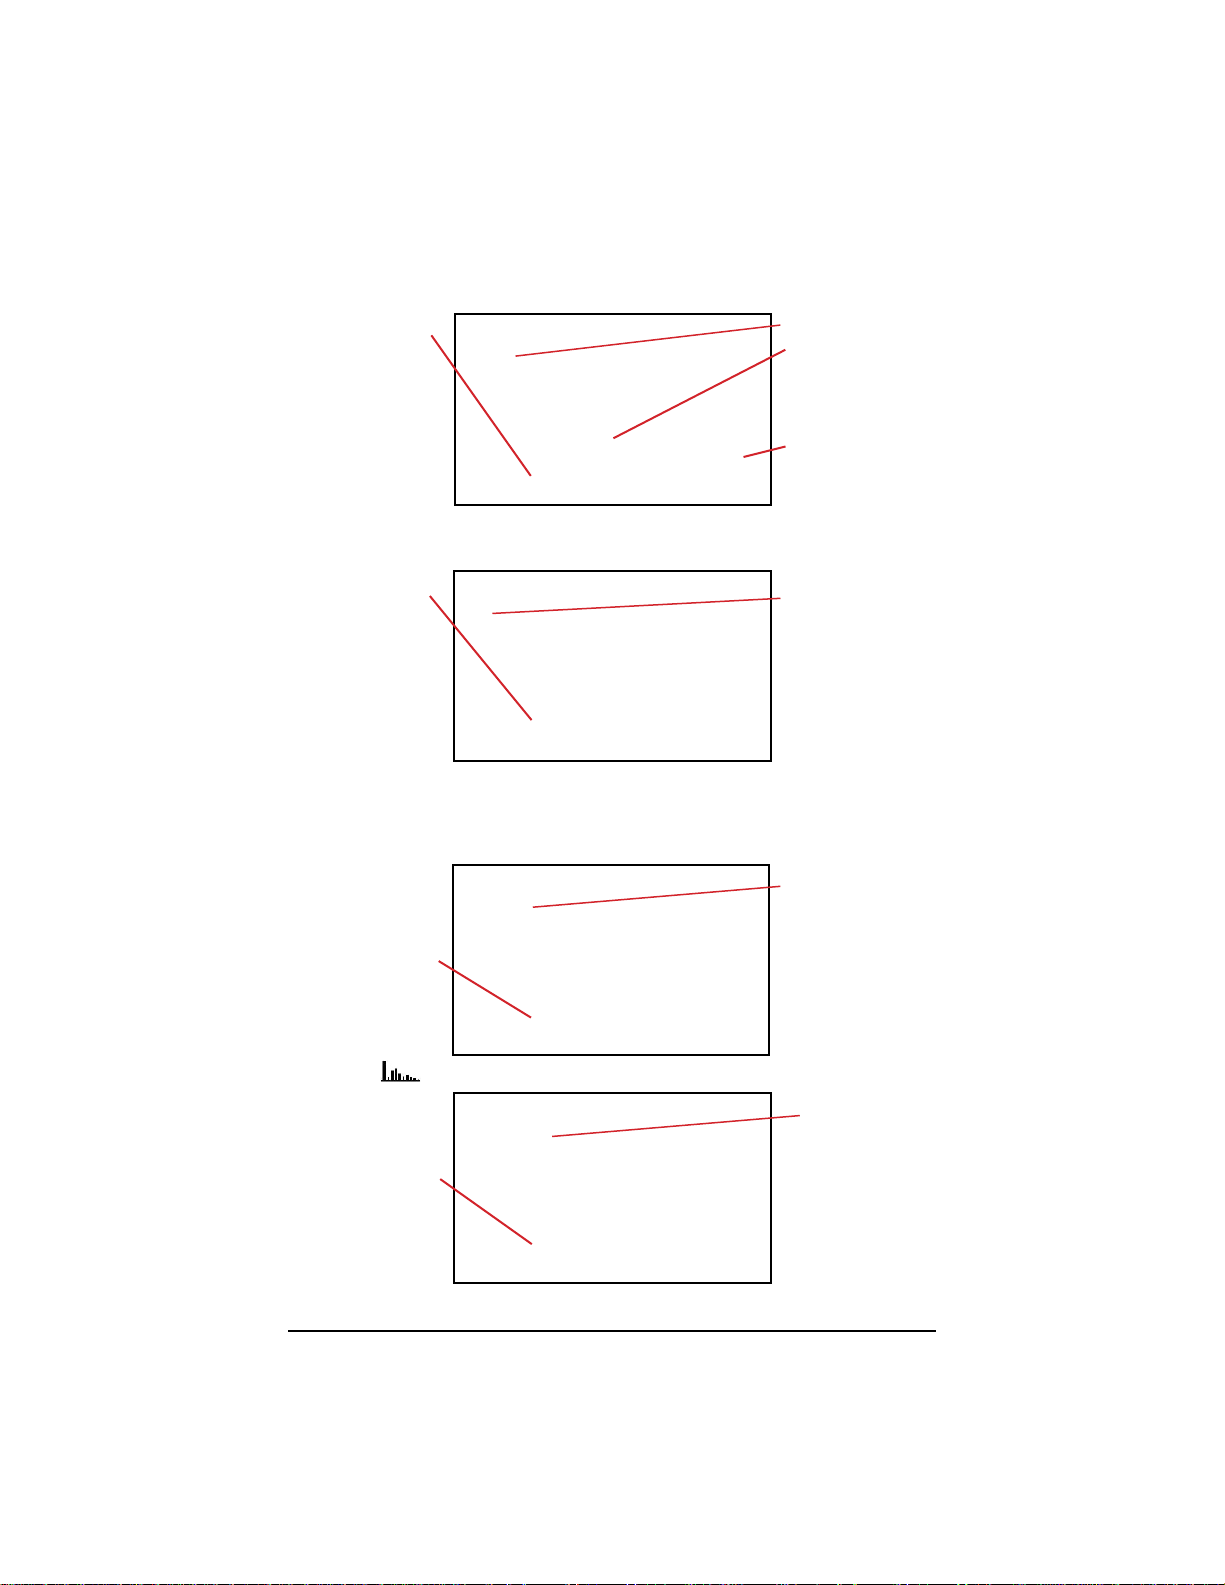
6.2 EXAMPL E S OF SCREENS
The V function with the 3L display lter
Information about
harmonic number 3
at the cursor’s
position:
■
Level (%f or %r)
■
Phase dierence
with respect to the
harmonic of order 1
■
Maximum
■
Amplitude
The A function with the N display lter
Information about
harmonic number 0
(DC) at the cursor’s
position:
■
Level (%r)
■
Maximum
■
Amplitude
The period displayed by the bargraphs is either 200 ms or 3 s, depending on the
selected conguration (see § 3.4.1).
The U function with the L1 display lter
Cursor
Envelope of the
maximum harmonics
Second page of
harmonics
Cursor
Cursor
Information about
harmonic number 5 at
the cursor’s position
The U and
Information about
interharmonics i04
between harmonics
4 and 5 at the
cursor’s position
function with the L2 display lter
Cursor
Power Quality Analyzer PowerPad® IV Model 8345 57
Find Quality Products Online at: [email protected]
www.GlobalTestSupply.com
Page 66
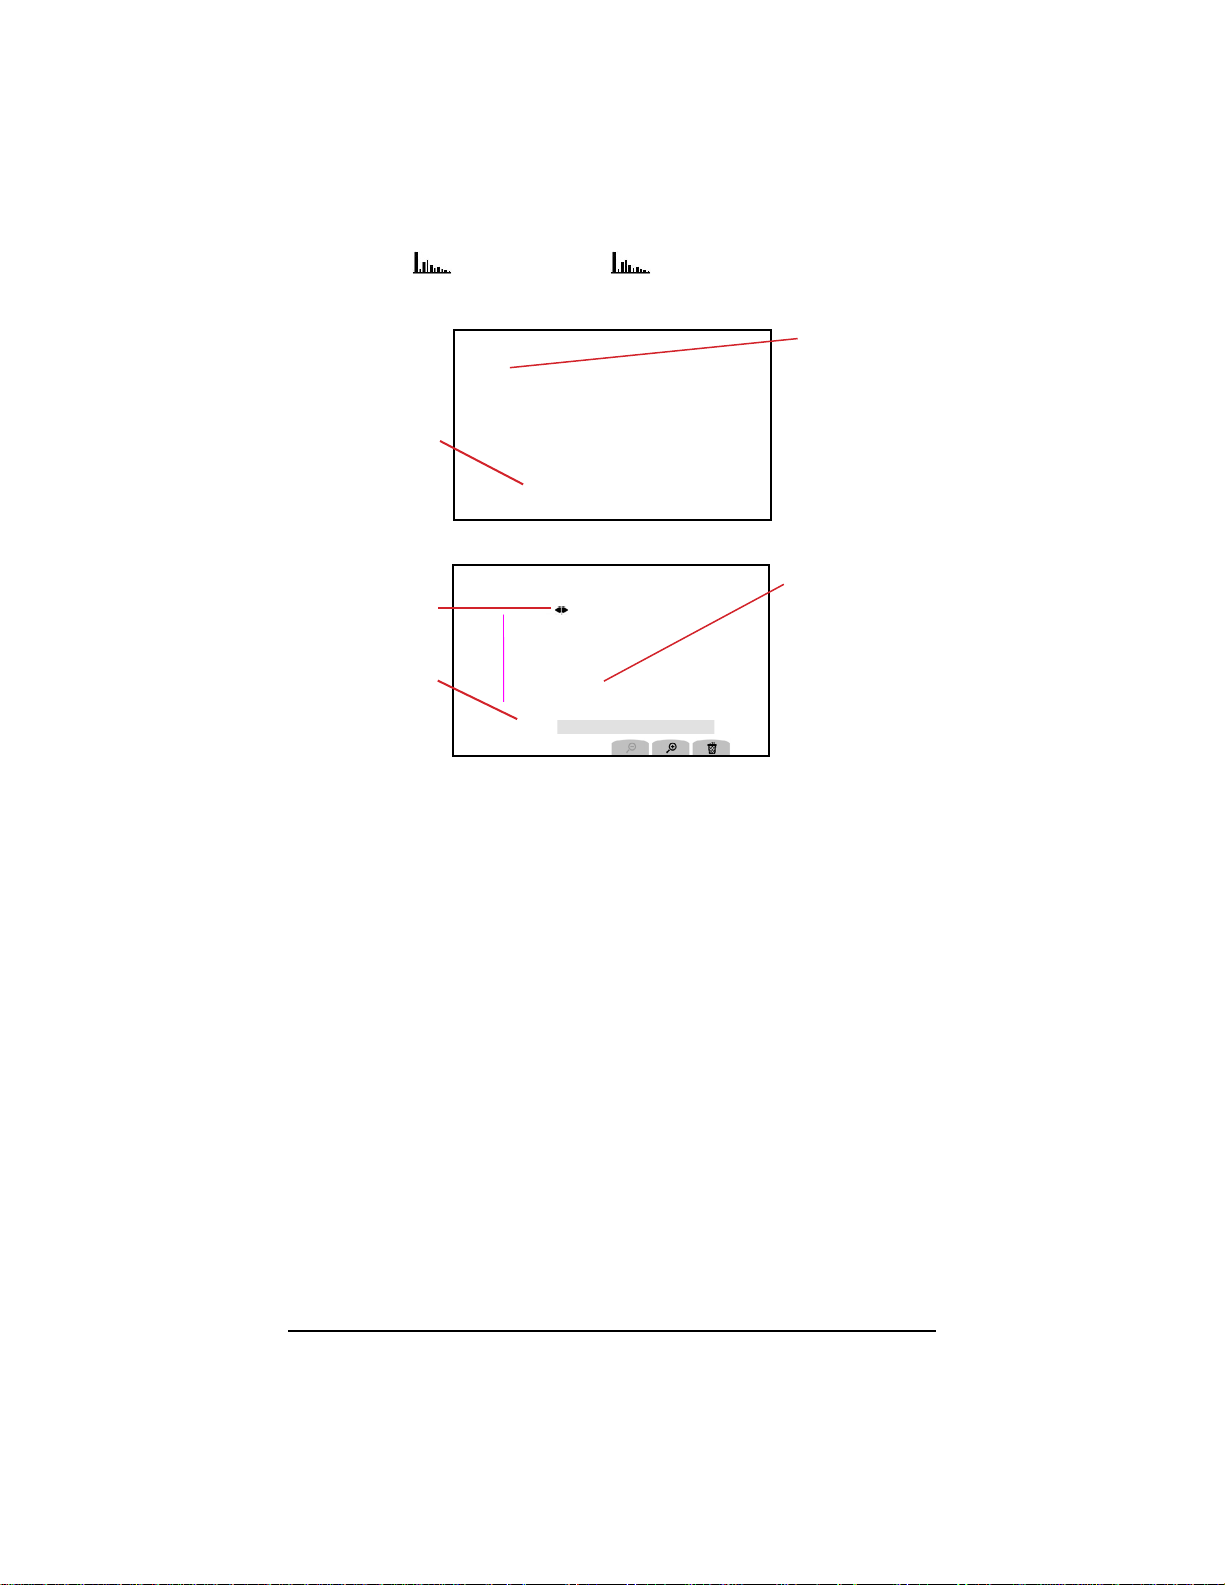
To exit the function, press the button again
The MSV-V function with the L1 display lter
Value at the
cursor’s position
The MSV-U curve function with the L1 display lter
Cursor
Value at the
cursor’s position
To exit from the MSV function, press the MSV button again
Cursor
Envelope of the curve
Anything above
the envelope is not
correct
The conguration
process for the
parameters of
the envelope is
described in § 3.4.1.5
58 Power Quality Analyzer PowerPad® IV Model 8345
Find Quality Products Online at: [email protected]
www.GlobalTestSupply.com
Page 67
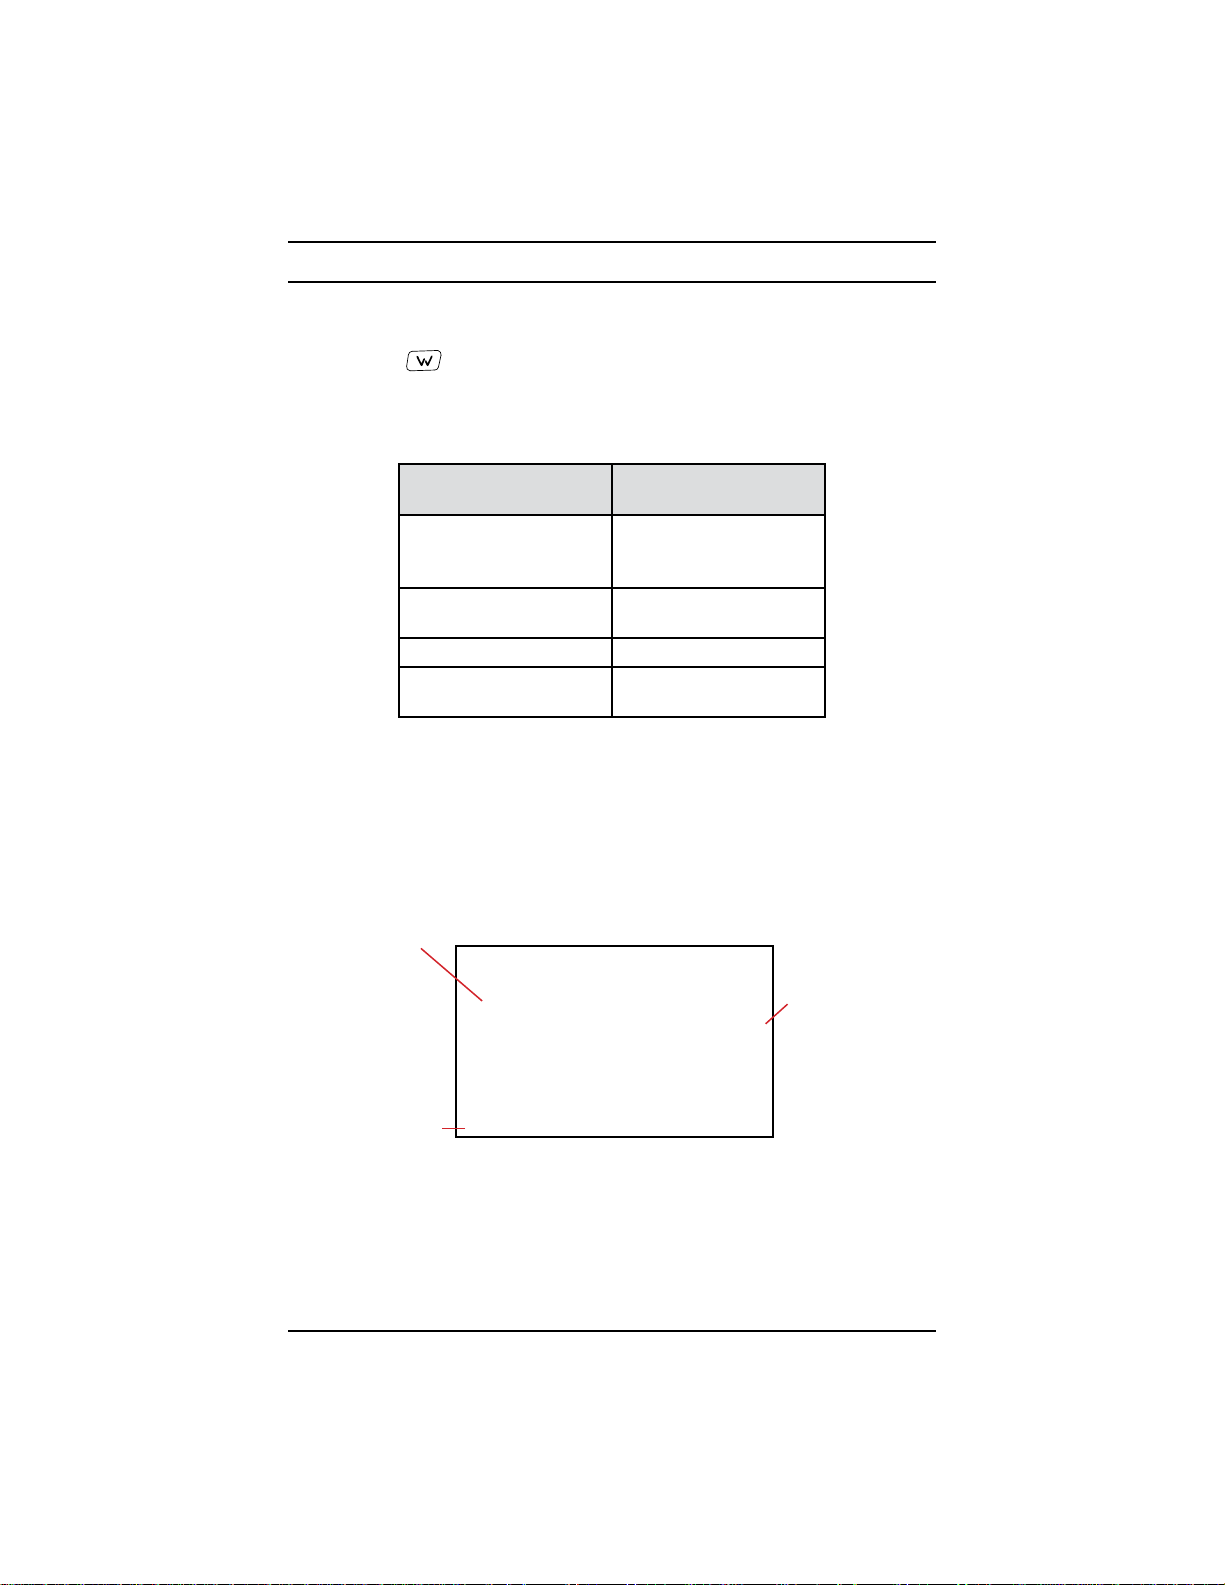
7. POWER
The Power mode displays power measurements (W) and power factor
calculations (PF).
Press the button to access the Power mode screen
7.1 DISPLAY FILTER
The available display lters depend on the selected connection.
Connection Display lter
Single-phase, 2 wires
Single-phase, 3 wires
Split-phase, 2 wires
Split-phase, 3 wires
Split-phase, 4 wires
Three-phase, 3 wires
Three-phase, 4 wires
Three-phase, 5 wires
The Σ lter is used to obtain the value on the whole system (all phases).
7.2 EXAMPLES OF SC REEN S
A few examples of the Power mode screens for a three-phase, 5-wire
connection are below.
To change the display lter, use the ▲ ▼ buttons. The available display
lters depend on the chosen distribution network and connection type
W function with the 3L display lter
P: active power
P
: DC power (if a
DC
DC current sensor
is connected)
Q
: reactive power
f
D: distorting power
N: non-active power
S: apparent power
Functions
L1
2L, L1, L2,
Σ
Σ
3L, L1, L2, L3, Σ
Selected display lter
Power Quality Analyzer PowerPad® IV Model 8345 59
Find Quality Products Online at: [email protected]
www.GlobalTestSupply.com
Page 68
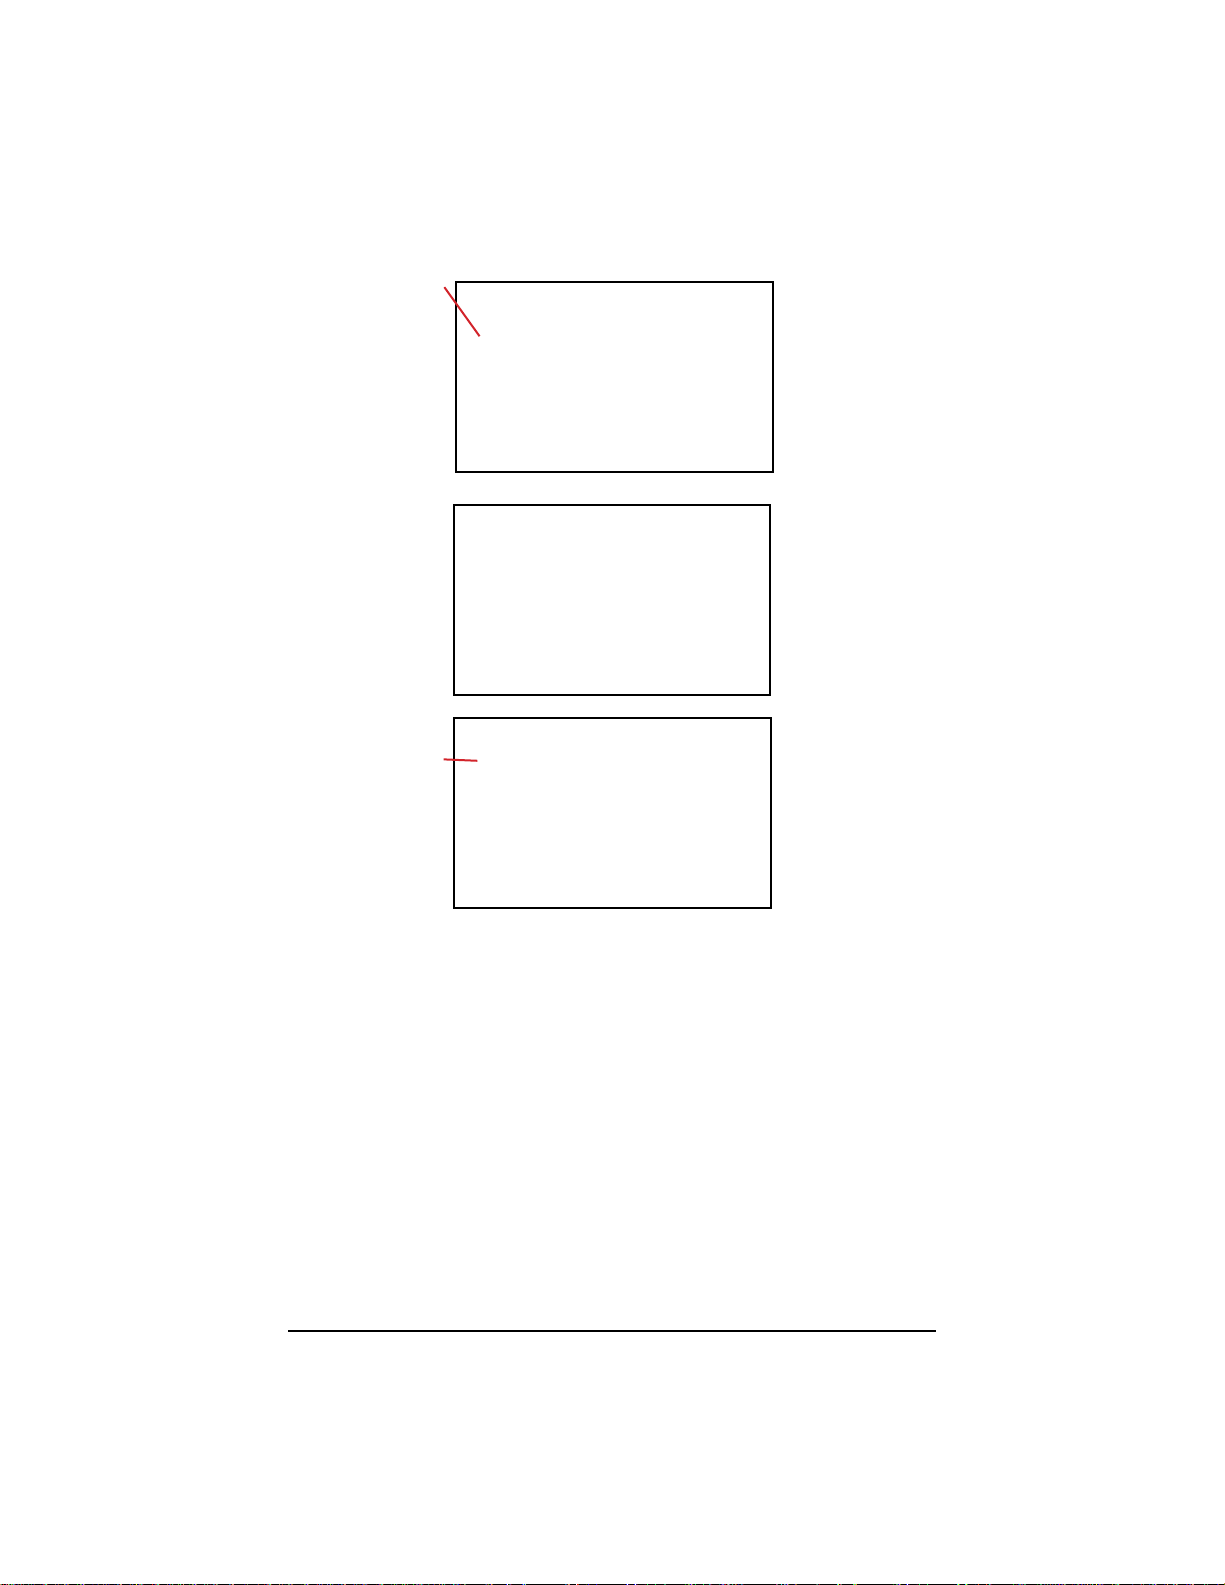
PF function with the 3L display lter
PF: power factor = P/S
DPF or PF1 or
cos φ: fundamental
power factor
The name is chosen
in the conguration
(see § 3.4.1)
tan φ: tangent of the
phase dierence
φVA: phase
dierence of the
voltage with respect
to the current
L1 display lter
Σ display lter
Sum of the
three channels
60 Power Quality Analyzer PowerPad® IV Model 8345
Find Quality Products Online at: [email protected]
www.GlobalTestSupply.com
Page 69
8. ENERGY
The Energy mode is used to meter generated and consumed energy over a
period and indicate the corresponding price.
Press the button to access the Energy mode screen
Press to access the energy conguration. To change the conguration,
there must not be any in-progress or suspended metering, and the zero
must be reset
Press to view the energy consumed by the load when a display lter
showing multiple inputs is selected. If a display lter showing a single
input is selected, the function buttons are grayed out and the screen
automatically shows the consumed energy
Press to view energy produced by the source when a display lter
showing multiple inputs is selected. If a display lter showing a single
input is selected, the function buttons are grayed out and the screen
automatically shows the produced energy
Press Wh to view the amount of energy produced or consumed
Press to view the calculated price of the energy produced or consumed
using the taris set in the energy conguration mode
Press to reset the energy metering to zero
Press to start energy metering
Press to suspend energy metering
8.1 DISPLAY FILTER
The display lter depends on the selected connection:
Connection Display lter
Single-phase, 2 wires
Single-phase, 3 wires
Split-phase, 2 wires
Split-phase, 3 wires
Split-phase, 4 wires
Three-phase, 3 wires Σ
Three-phase, 4 wires
Three-phase, 5 wires
L1
2L, L1, L2, Σ
3L, L1, L2, L3, Σ
The Σ lter can obtain the calculation on the whole system (all phases).
Power Quality Analyzer PowerPad® IV Model 8345 61
Find Quality Products Online at: [email protected]
www.GlobalTestSupply.com
Page 70
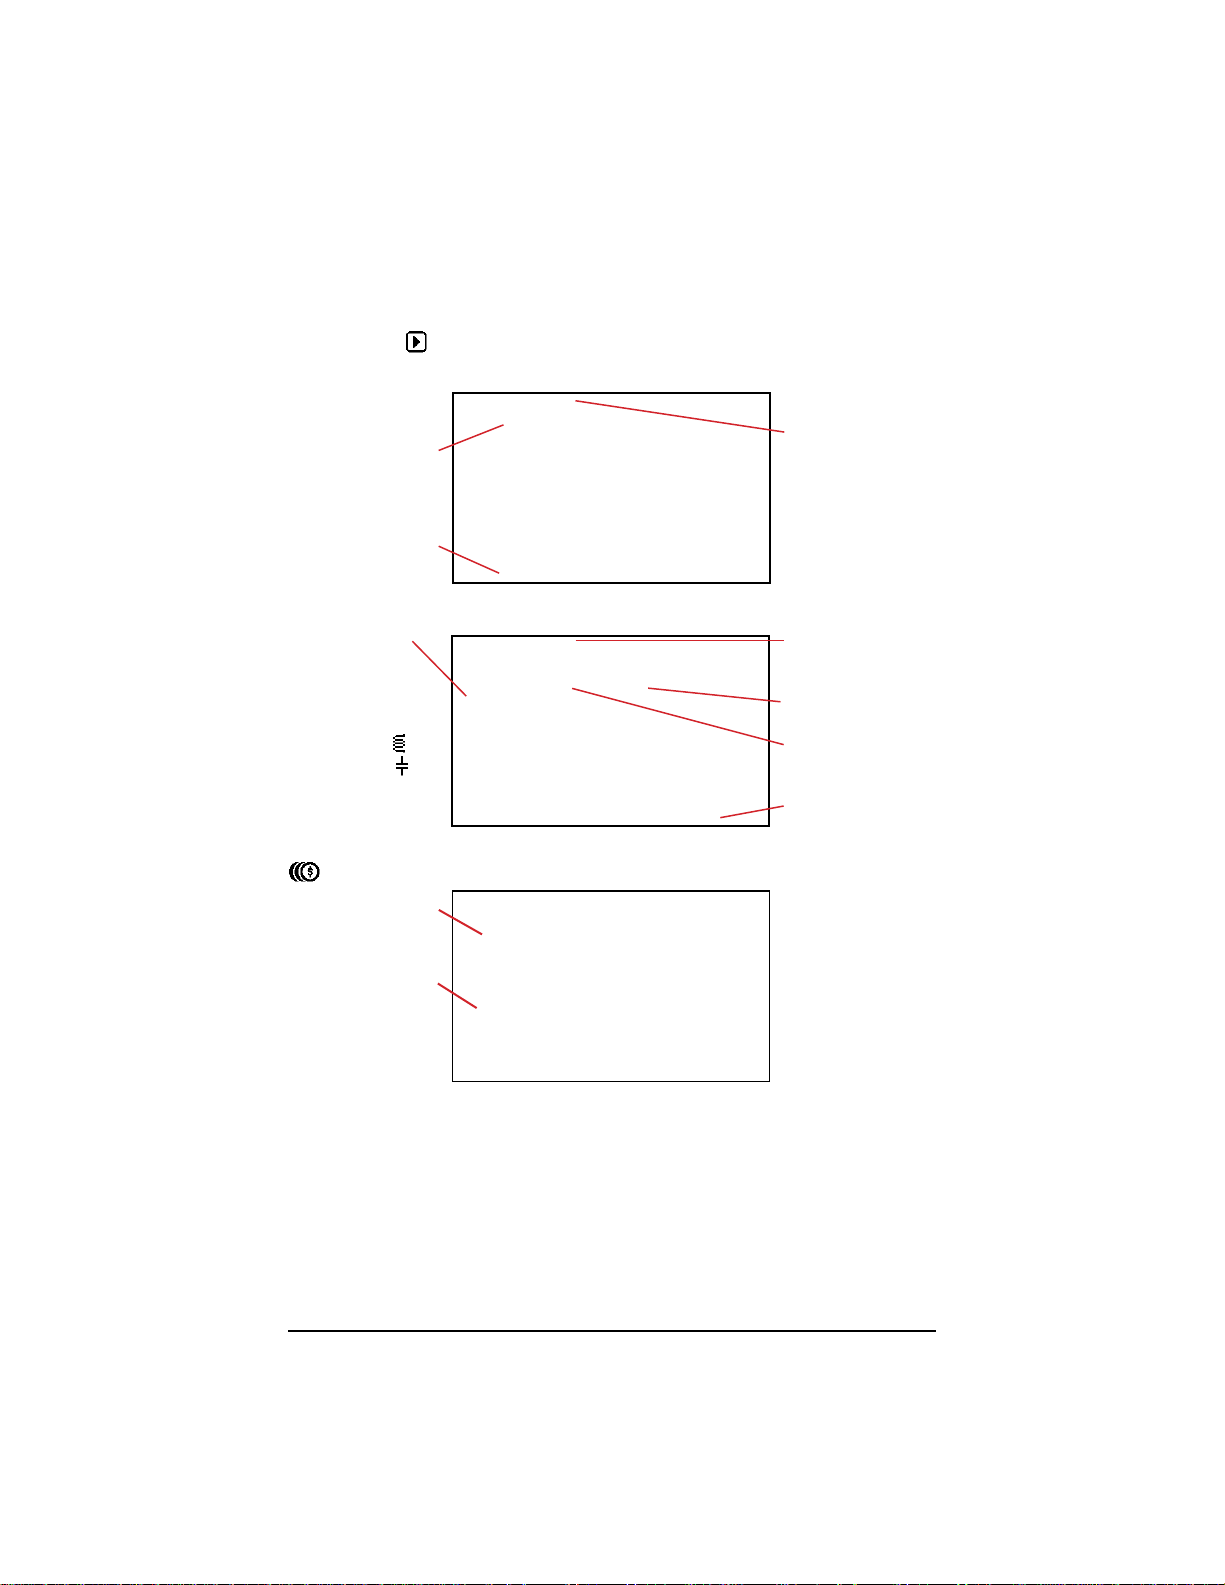
8.2 EXAMPL E S OF SCREENS
To change the display lter, use the ▲ ▼ buttons. The available display
lters depend on the chosen distribution network and connection type
Press the button in the function bar to start energy metering
Wh function with the 3L display lter
Energy metering
Start date and time
Energy consumed
Wh function with the L1 display lter
EP: active energy
E
: DC energy
PDC
(if a DC current
sensor is connected)
E
: reactive energy
Qf
(inductive part
capacitive part
E
: distorting energy
D
E
: non-active energy
N
E
: apparent energy
S
and
)
is in progress
Energy metering is
suspended
Energy consumed
Energy produced
Resets the values
function with the Σ display lter
Sum of energies on
three channels
Currency chosen
in the conguration
(see § 3.4.8)
62 Power Quality Analyzer PowerPad® IV Model 8345
Find Quality Products Online at: [email protected]
www.GlobalTestSupply.com
Page 71
9. TREND MODE
The Trend mode records the evolution of the quantities selected in the
conguration (see § 3.4.4) for a specied duration.
The number of trend recordings is limited only by the SD card’s capacity.
Press the button to access the Trend mode screen
The home screen will display a list of the previously-completed recordings. If no
recordings have been completed, this list will be empty.
9.1 STARTING A RECORDING
Press to schedule a recording
To congure
a recording
To start the congured
recording on the
To modify the list of
recorded quantities
For Set-up, select one of the 4 congured lists of quantities to record from
the trend recording conguration. The
function button allows you to
congured date
congure the lists of quantities to record
For Start, specify when the recording will begin
For End, specify when the recording will end
For Period, specify the recording period from one of the 19 options
between 200 ms and 2 h. The recording period determines the
measurement resolution. If the recording period exceeds the entire
recording’s duration, the instrument will change the end date to
accommodate the recording period
For Name, enter the recording’s name (up to 8 characters long) using
capital letters (A-Z), numbers (0-9), and symbols (&, _, and -)
Press the function button to start the trend recording programmed in the
conguration (§ 3.4.4) at the end of the current minute plus one minute
Power Quality Analyzer PowerPad® IV Model 8345 63
Find Quality Products Online at: [email protected]
www.GlobalTestSupply.com
Page 72
Press the button to start the recording at the programmed date and time
Press the button to suspend the in-progress recording
■
The symbol to the right of the camera icon indicates that a recording has
been programmed
■
The symbol to the right of the camera icon indicates that a recording is
in progress
■
The symbol to the right of the camera icon indicates that the in-progress
recording is suspended
To comply with IEC 61000-4-30, trend recordings must be performed with:
■
A frequency measurement over 10 seconds
■
V
, U
RMS
RMS
, and A
selected
RMS
9.2 THE LIST OF RECORDINGS
Press to view the previous recordings
Each entry in the recording list includes the recording’s name, start date,
start time, end date, and end time
To view the
dierent pages
Press to erase the selected recording
If the end date is red, the recording encountered either a power supply problem
or a write error on the SD card and could not continue to the planned end date.
Use the help button
to learn what each error number means
To erase all trend recordings, refer to § 3.3.4.
64 Power Quality Analyzer PowerPad® IV Model 8345
Find Quality Products Online at: [email protected]
www.GlobalTestSupply.com
Page 73
9.3 READING A RECORDING
Select a recording from the list, and press the conrm button to open it.
To change the display lter, use the ▲ ▼ buttons. The available display
lters depend on the chosen distribution network and connection type
To move the cursor, use the ◄ ► buttons. The cursor allows you to view
the values along the displayed curves
Use the buttons to stretch or shrinks the time scale. The selected
aggregation period and the recording’s duration determine the dierent
zoom possibilities
The rst data is available at the end of the recording period.
The
If a quantity could not be recorded correctly, this symbol is displayed above
the quantities.
Order 5 current harmonics (A-h05) for a 3L display lter
indicator reports that a problem was encountered during recording.
When a recording’s duration is more than one day, it may take up to ten
seconds to display the curves.
Cursor
Value of the curves at
the cursor’s position
Phase-to-neutral voltages (V
) for an L3 display lter
RMS
Display lter
Whenever a value is recorded for each phase, the instrument will record the
minimum single-cycle RMS value and maximum single-cycle RMS value.
Curve of the maxima
Curve of the minima
Values at the cursor’s
position (minimum,
mean, and maximum)
Press to zoom on the maximum of the curve of the maxima
Press to zoom on the minimum of the curve of the minima
Power Quality Analyzer PowerPad® IV Model 8345 65
Find Quality Products Online at: [email protected]
www.GlobalTestSupply.com
Page 74
Phase-to-neutral voltages (V
) for an L1 display lter and
RMS
The display window’s
position in the recording
Active power (P) for a display lter Σ
The power, like energy, is displayed in bargraph form.
Each bar’s duration is either 1 s or one recording period (if longer than 1 s).
Press the Σ button in the function bar to display the active energy (EP)
66 Power Quality Analyzer PowerPad® IV Model 8345
Find Quality Products Online at: [email protected]
www.GlobalTestSupply.com
Page 75
Cumulative active energy (EP) for a Σ display lter.
1. Place the cursor at the beginning of the accumulation range.
2. Press the Σ button.
3. Move the cursor to the end of the energy accumulation range.
The cumulative total is displayed as it changes.
The cumulative total’s
Period taken into
account in the
energy metering
Cumulative total
active energy over
the selected duration
(one minute)
start and end dates
Using the display lter, the cumulative total can be determined on each phase or
on all of the phases combined.
Power factor (PF) for an L1 display lter
Power Quality Analyzer PowerPad® IV Model 8345 67
Find Quality Products Online at: [email protected]
www.GlobalTestSupply.com
Page 76
10. TRANSIENT MODE
The Transient mode records voltage or current transients for a specied duration
determined by the selected conguration (see § 3.4.5). It also records shock
waves, which are very high voltages for a very short time.
The 8345 can record a large number of transients that is limited only by the SD
card’s capacity.
Press the button to access Transient mode
The initial Transient mode screen displays a list of the previous recordings. If no
recordings have been completed, this list will be empty.
10.1 STARTING A RECORDING
Press the button to schedule a recording
For Type, determine whether the recording will concern transients, shock
waves (SURGE), or both
For Max count, enter the maximum number of transients or shock waves to
record between 1 and 1000
For Start, specify when the recording will begin
For End, specify when the recording will end
For Name, enter the recording’s name (up to 8 characters long). The name
can include capital letters (A-Z), numbers (0-9), and symbols (&, _, and -)
Press the button in the function bar to start the recording at the
programmed time, if the SD card has enough space
Press the button in the function bar to start recording a transient
68 Power Quality Analyzer PowerPad® IV Model 8345
Find Quality Products Online at: [email protected]
www.GlobalTestSupply.com
Page 77
programmed in the conguration (§ 3.4.5) at the end of the current minute
plus one minute
Press the button in the function bar to suspend the in-progress recording
Press the button to adjust the voltage, current, or shock wave thresholds
■
The symbol to the right of the cameral icon indicates that a recording has
been programmed
■
The symbol to the right of the camera icon indicates that a recording is
in progress
■
The symbol to the right of the camera icon indicates that the in-progress
recording is suspended
10.2 THE LIST OF RECORDINGS
Press to view the completed recordings.
• Each entry in the recording list includes the recording’s name, start date,
start time, end date, and end time.
To view dierent pages
Press to erase the selected recording
If the end date is red, the recording could not continue to the planned end date
because of:
■
A power supply problem (the instrument turned o due to low battery)
■
The maximum number of transients was reached
■
A write error on the SD card
Use the help button
to learn what the error number means
To erase all recordings of transients, refer to § 3.3.4.
Power Quality Analyzer PowerPad® IV Model 8345 69
Find Quality Products Online at: [email protected]
www.GlobalTestSupply.com
Page 78
10. 3 READING A RECORDING
Channel that
triggered the transient
To view dierent pages
1. Select a recording from the list.
2. Press the conrm button
3. Press the
button.
4. Use the ▲ ▼ buttons to change the display lter. The available display
lters depend on the chosen distribution network and connection type.
Display Filter Description
Ɐ Displays all of the transients
4V Displays transients triggered by an event in one of the voltage channels
4A Displays transients triggered by an event in one of the current channels
L1, L2, or L3
N Displays transients triggered by a voltage or current event in the neutral
Displays the transients triggered by a voltage or current event in phase
L1, L2, or L3
to open it.
5. Conrm by pressing the key again.
Only the transients
triggered by an event
on the L1 phase are
displayed
The display lter
is active
Select a transient from the list, and press the conrm button to open it
Use the ◄ ► buttons to move the cursor. The cursor allows you to view the
values along the displayed curves
Use the ▲ ▼ buttons to change the display lter. The available display
lters depend on the chosen distribution network and connection type
Use the buttons to stretch and shrink the time scale
70 Power Quality Analyzer PowerPad® IV Model 8345
Find Quality Products Online at: [email protected]
www.GlobalTestSupply.com
Page 79
Transient event in all of the voltage channels
Cursor
Values at the
cursor’s position
To place the
cursor as close
as possible to the
triggering point
Channel that triggered
the transient capture
To zoom on the
event that triggered
the transient capture.
This key is only
active on 4V and L3
Zoom on the triggering event
Reminder of the
Location of the zoom
in the recording
The cursor goes
automatically to the
triggering event
channel that triggered
the transient capture
Envelope of the
preceding period
When the curve
passes outside of the
envelope, it triggers
the transient capture
Shock waves in the voltage channels
If you have recorded a shock wave, it will appear in the capture list when the
recording is read.
Only shock waves in
L1 are displayed
Display lter is active
Select a shock wave recording from the list, and press the conrm button
to open it
The screen will display the whole captured signal for a duration of 1.024 s. The
triggering event is is located at one quarter of the screen from the left.
The channel that
To place the cursor
as close as possible
to the triggering point
To place the cursor
on the maximum of
the shock wave
triggered the capture
Unlike all the other
modes, where the
voltages refer to the
neutral, the voltages
refer to the earth
Power Quality Analyzer PowerPad® IV Model 8345 71
Find Quality Products Online at: [email protected]
www.GlobalTestSupply.com
Page 80
Zoom on the triggering event or the maximum value
Press to place the cursor as close as possible to the triggering element
Press to place the cursor on the maximum
Since shock waves build up quickly, these two points are often close together.
Press one or more times to zoom
The channel that
Location of the zoom
in the recording
triggered the capture
72 Power Quality Analyzer PowerPad® IV Model 8345
Find Quality Products Online at: [email protected]
www.GlobalTestSupply.com
Page 81
11. INRUSH CURRENT MODE
The Inrush Current mode is used to capture and record inrush currents for a
duration specied by the selected conguration (see § 3.4.6).
The 8345 can record a large number of inrush current captures that is limited
only by the SD card’s capacity.
Press the button to access Inrush Current mode
The inrush current’s initial screen will display a list of the previous captures. If no
captures have been completed, this list will be empty.
11.1 STARTING A CAPTURE
Press to program a capture
Press the button in the function bar to start the capture of a current
programmed in the conguration (§ 3.4.6) at the end of the current minute
plus one minute
To congure a capture
To change the
current thresholds
For Type, determine whether the recording will concern transients, shock
To start the screen’s
congured capture
waves (SURGE), or both
■
The Max count is grayed out and cannot be modied. The max count for
inrush currents is 1
For Start, specify when the recording will begin
For End, specify when the recording will end
For Mode, select whether the capture will concern RMS values and
instantaneous values or only RMS values
For Name, enter the recording’s name (up to 8 characters long). The name
can include capital letters (A-Z), numbers (0-9), and symbols (&, _, and -)
Press the button in the function bar to start the capture at the
Power Quality Analyzer PowerPad® IV Model 8345 73
Find Quality Products Online at: [email protected]
www.GlobalTestSupply.com
Page 82
programmed time, if the SD card has enough space
Press the button in the function bar to start the capture of a current
programmed in the conguration (§ 3.4.6) at the end of the current minute
plus one minute
Press the button in the function bar to suspend the in-progress recording
Press the button in the function bar to change the voltage, current, or
shock wave thresholds
The capture will begin recording when the current exceeds the threshold.
11.2 THE LIST OF CAPTURES
Press to view the captures performed
Each entry in the recording list includes the recording’s name, start date,
start time, end date, and end time
To view dierent pages
Press to erase the selected capture
To erase all of the inrush current captures, refer to § 3.3.4.
If the end date is red, the recording could not continue to the planned end date
because of:
■
A power supply problem (the instrument turned o due to low battery)
■
A write error on the SD card
To learn what the error number means, use the help button
.
11.3 READING A CAP TURE
Select the capture from the list, and press the conrm button to open it
Captures with red end dates may be unusable.
Each entry in the capture list includes the capture’s name, number of inrush
74 Power Quality Analyzer PowerPad® IV Model 8345
Find Quality Products Online at: [email protected]
www.GlobalTestSupply.com
Page 83
current detections, start date, start time, duration, and the channel that
triggered the capture.
Press the conrm button again to display information about the capture
Press to congure a new capture
11.3. 1 RMS Values
Press the RMS button to view the RMS voltage and current values
To change the display lter, use the ▲ ▼ buttons. The available display
lters depend on the chosen distribution network and connection type
Display Filter Description
3V Displays the 3 phase-to neutral voltages
3U Displays the 3 phase-to-phase voltages
3A Displays the 3 currents
L1, L2, L3 Displays the current and voltage on phases L1, L2, and L3
Hz Displays the evolution of the network frequency over time
The cursor allows you to view the values along the displayed curves.
To move the cursor, use the ◄ ► buttons
To stretch or shrink the time scale, use the buttons
The maximum duration of an RMS recording is 30 minutes. It can take up to
about ten seconds to display the curves at the maximum duration.
Power Quality Analyzer PowerPad® IV Model 8345 75
Find Quality Products Online at: [email protected]
www.GlobalTestSupply.com
Page 84
Capture of inrush current in RMS on 3A
The display
window’s position
in the recording
Cursor
Maximum values
Disc 2 is solid, which
means channel A2
triggered the capture
Values at the
cursor’s position
Capture of RMS inrush current on L2
Press to place the cursor on the minimum voltage
Press to place the cursor on the maximum voltage
Press to place the cursor on the minimum current
Press to place the cursor on the maximum current
11.3.2 Instantaneous Values
Press the WAVE button to view the instantaneous voltage and current values
This recording mode displays all samples and is more precise than RMS, which
only displays one value per half-cycle.
Use the ▲ ▼ buttons to change the display lter. The available display
lters depend on the chosen distribution network and connection type
Display Filter Description
3V Displays the 3 phase-to neutral voltages and the neutral
3U Displays the 3 phase-to-phase voltages
3A Displays the 3 currents and the current of the neutral
L1, L2, L3 Displays the current and voltage on phases L1, L2, and L3
N Displays the current and voltage on the neutral
Use the ◄ ► buttons to move the cursor. The cursor allows you to view the
values along the displayed curves
Use the buttons to stretch or shrink the time scale
76 Power Quality Analyzer PowerPad® IV Model 8345
Find Quality Products Online at: [email protected]
www.GlobalTestSupply.com
Page 85
The maximum duration of a RMS+WAVE recording is 10 minutes. In
this case, it can take up to a minute to display the curves.
Capture of instantaneous inrush current values on 4A
Capture of instantaneous inrush current values on L3
Max instantaneous
absolute values
Power Quality Analyzer PowerPad® IV Model 8345 77
Find Quality Products Online at: [email protected]
www.GlobalTestSupply.com
Page 86
12. ALARM MODE
The Alarm mode detects and records overshoots of the selected quantities in
conguration (see § 3.4.7) for a specied duration.
The 8345 can record a large number of alarm recordings and is limited only by
the SD card’s capacity. Each alarm recording can contain up to 20,000 alarms.
The max number of alarms per recording is determined in the conguration.
Press the button to access Alarm mode
The Alarm mode’s initial screen displays a list of previous alarm recordings. If no
alarm recordings have been completed, this list will be empty.
You are unable to program an alarm recording if an inrush current
capture is in progress.
12.1 PROGRA MMI N G AN ALARM RECOR DING
Press to program an alarm campaign
Press to modify the alarms (refer to § 3.4.7)
Alarms deactivate when they are modied, so you must reactivate the
alarms after modication.
For Start, specify when the recording will begin
For End, specify when the recording will end
For Max Count, you can have up to 20,000 alarms
For Name, enter the recording’s name (up to 8 characters long). The name
can include capital letters (A-Z), numbers (0-9), and symbols (&, _, and -)
78 Power Quality Analyzer PowerPad® IV Model 8345
Find Quality Products Online at: [email protected]
www.GlobalTestSupply.com
Page 87
Press to start the alarm recording at the programmed time
The alarm recording
is in progress
Press the button in the function bar to start an alarm recording
Progress of alarm
recording
programmed in the conguration (§ 3.4.5) at the end of the current minute
plus one minute
Press the button in the function bar to modify the alarm recording
conguration
12.2 T HE LIST OF AL ARM RE C ORDINGS
Press to view the previous alarm recordings
Each entry in the list includes the alarm recording’s name, start date, start
time, end date, and end time
Used memory
To view the dierent
Press to erase the selected alarm recording
pages
To erase all of the alarm recordings, refer to § 3.3.4.
If the end date is red, the recording could not continue to the planned end date
because of:
■
A power supply problem (the instrument turned o due to low battery)
■
A write error on the SD card
To learn what the error number means, use the help button
.
Power Quality Analyzer PowerPad® IV Model 8345 79
Find Quality Products Online at: [email protected]
www.GlobalTestSupply.com
Page 88
12.3 STARTING AN A LARM RECO RDING
Select an alarm recording from the list, and press the conrm button to
open it
To change the display lter, use the ▲ ▼ buttons. The available display
lters depend on the chosen distribution network and connection type
Beginning of the alarm
Quantities that crossed
the alarm threshold(s)
To view dierent pages
Display Filter Description
Ɐ Displays the alarms on all channels
L1, L2, L3 Displays the alarms on phase L1, L2, or L3
N Displays the alarms on the neutral
Σ Displays the alarms on the summable quantities, like power
The alarm’s duration
Display lter
Extreme value
(min or max,
depending on the
threshold’s direction)
If an alarm duration is red, it means that it was cut o because:
■
The alarm recording ended while the alarm was in progress
■
A power supply problem (the instrument turned o due to low battery)
■
The recording was manually stopped ( was pressed)
■
The instrument was intentionally turned o ( was pressed)
■
The memory was full
■
A measurement error
■
An incompatibility between the monitored quantity and the instrument’s
conguration, like if a current sensor was removed
If the alarm was cut o due to a measurement error or an incompatibility, the
extreme value will be displayed in red and include an error number.
To learn what each error number means, use the help button
.
80 Power Quality Analyzer PowerPad® IV Model 8345
Find Quality Products Online at: [email protected]
www.GlobalTestSupply.com
Page 89

13. MONITORING MODE
The Monitoring mode monitors electrical networks per standard EN 50160. In
this mode, the 8345 detects:
■
Slow variations
■
Rapid variations and interruptions
■
Voltage dips
■
Temporary voltage swells
■
Transients
Therefore, a monitoring recording will trigger a trend recording, a search for
transients, an alarm recording, and a log of events.
The 8345 can record a large number of monitoring recordings that is limited only
by the SD card’s capacity.
Press the button to access Monitoring mode
The home screen will display a list of previous monitoring recordings. If no
monitoring recordings have been completed, this list will be empty.
13.1 STARTING A MONITORING RECORDING
The Monitoring mode is congured using the application software (see § 16).
1. When the software is installed and the instrument is connected, go to the
Instrument drop-down menu at the top of the application software's screen.
Power Quality Analyzer PowerPad® IV Model 8345 81
Find Quality Products Online at: [email protected]
www.GlobalTestSupply.com
Page 90

2. Select the Congure monitoring option.
The conguration window will open with 5 tabs:
• Monitoring
• Slow variations thresholds
• Interruptions and Rapid Voltage Changes (RVC)
• Voltage Dips and Swells
• Transients
3. In the Monitoring tab, indicate the nominal voltage, the frequency, and the
name of the le that will contain the monitoring recording.
4. In the Slow Variations Thresholds tab, the maximum variations of the
frequency and the voltages are already specied for one week and the
duration of the monitoring recording, per the standard. You can modify the
values or add quantities to monitor.
5. In the Interruptions and Rapid Voltage changes (RVC) tab, keep
the preset values or modify them. The values specify the duration of
interruptions and rapid voltage changes (RVC), which are slower than
transients.
6. In the Voltage Dips and Swells tab, modify or keep the preset values that
specify the levels and durations of the voltage dips and swells.
The Transients tab is used to congure a search for transients (see § 3.4.5).
1. Press OK to conrm the conguration and transfer it to the instrument.
2. Then, start the monitoring recording on the instrument by specifying its start
time and duration.
82 Power Quality Analyzer PowerPad® IV Model 8345
Find Quality Products Online at: [email protected]
www.GlobalTestSupply.com
Page 91
Press to program a monitoring recording
For Start, specify when the recording will begin
For End, specify when the recording will end
For Name, enter the recording’s name (up to 8 characters long) using
capital letters (A-Z), numbers (0-9), and symbols (&, _, and -)
Progress of
the recording
Press the button in the function bar to start the monitoring at the
programmed time, if there is enough space on the SD card
Press the button in the function bar to start the monitoring session
programmed in the conguration (§ 3.4.5) at the end of the current minute
plus one minute
Press the button in the function bar to suspend the in-progress recording
13.2 THE LIST OF MONITORING RECORDINGS
Press to view a list of the previous monitoring recordings
Each entry in the list includes the recording's name, start date, start time,
end date, and end time.
Used memory
To view dierent pages
Press to erase the selected monitoring recording
Power Quality Analyzer PowerPad® IV Model 8345 83
Find Quality Products Online at: [email protected]
www.GlobalTestSupply.com
Page 92
If the end date is red, the recording could not continue to the planned end date
because of:
■
A power supply problem (the instrument turned o due to low battery)
■
The maximum number of transients was reached
■
A write error on the SD card
To learn what the error number shown means, use the help button
.
To erase all of the monitoring recordings, refer to § 3.3.4.
13.3 READING A MONITORING RECORDING
Select a monitoring recording from the list, and press the confirm button
to open it
To view the
recording of a trend
To view searches
for transients
To view alarm
overshoots
To read a trend recording, refer to § 9.3.
To read a search for transients, refer to § 10.3.
To read an alarm recording, refer to § 12.3.
The recordings are in the application software in Recorded sessions/
Monitoring/EN50160 for slow variations, rapid changes, interruptions, voltage
dips, and voltage swells.
84 Power Quality Analyzer PowerPad® IV Model 8345
Find Quality Products Online at: [email protected]
www.GlobalTestSupply.com
Page 93
14. SCREENSHOTS
The button is used to take screenshots and view recorded screenshots.
The screenshots are recorded on the SD card in the directory 8345\Photograph.
You can read the screenshots on a PC via the application software or an SD
card reader (not provided).
14.1 TAKING A SCREENSHOT
You have two ways to take a screenshot:
Hold the button until the symbol in the status bar turns yellow
and then black
Press the symbol in the status bar at the top of the display unit. The
symbol in the status bar will turn yellow
Screens that are likely to vary (curves, metering) are captured in bursts (up to
ve), so you can select the best screenshot for your needs.
You must wait for the screenshots to be recorded and the
status bar to turn gray again before attempting another screenshot.
The number of screenshots that the instrument can record depends on the SD
card’s capacity.
Single screenshots (xed screens) are about 150 kB, and multiple screenshots
(variable screens) consume approximately 8 MB; therefore, the provided SD
card can hold several thousand screenshots
Refer to § 3.3.4 for the procedure to erase the SD card’s contents.
. Then, release the button
and then black
symbol in the
14.2 M A N AG ING THE S C REENSHOTS
Press the button to enter screenshot mode
The icons to the
left of the date and
time indicate the
To view dierent pages
Power Quality Analyzer PowerPad® IV Model 8345 85
instrument’s mode
when the screenshot
was taken
Find Quality Products Online at: [email protected]
www.GlobalTestSupply.com
Page 94
14.2.1 Displaying a Screenshot
To display a screenshot, select it and press the confirm button
The instrument will display the selected screenshot.
The mode icon and
alternate blinking
Press to erase the screenshot
To view the dierent
screenshots that make
up the photograph
86 Power Quality Analyzer PowerPad® IV Model 8345
Find Quality Products Online at: [email protected]
www.GlobalTestSupply.com
Page 95
15. HELP
The button will give you information about the various button functions and
symbols used for the in-progress display mode. Some modes, like Power mode,
have three available help screens, while others, like Waveform mode, only have
two help screens.
Examples of a help screen in Power mode are below.
■
The rst page indicates the possible functions for the selected mode
Selected mode (power)
First page
■
The second page describes the display functions for the selected mode
Second page
■
The third page, if available, denes the symbols for the selected mode
Third page
Power Quality Analyzer PowerPad® IV Model 8345 87
Find Quality Products Online at: [email protected]
www.GlobalTestSupply.com
Page 96
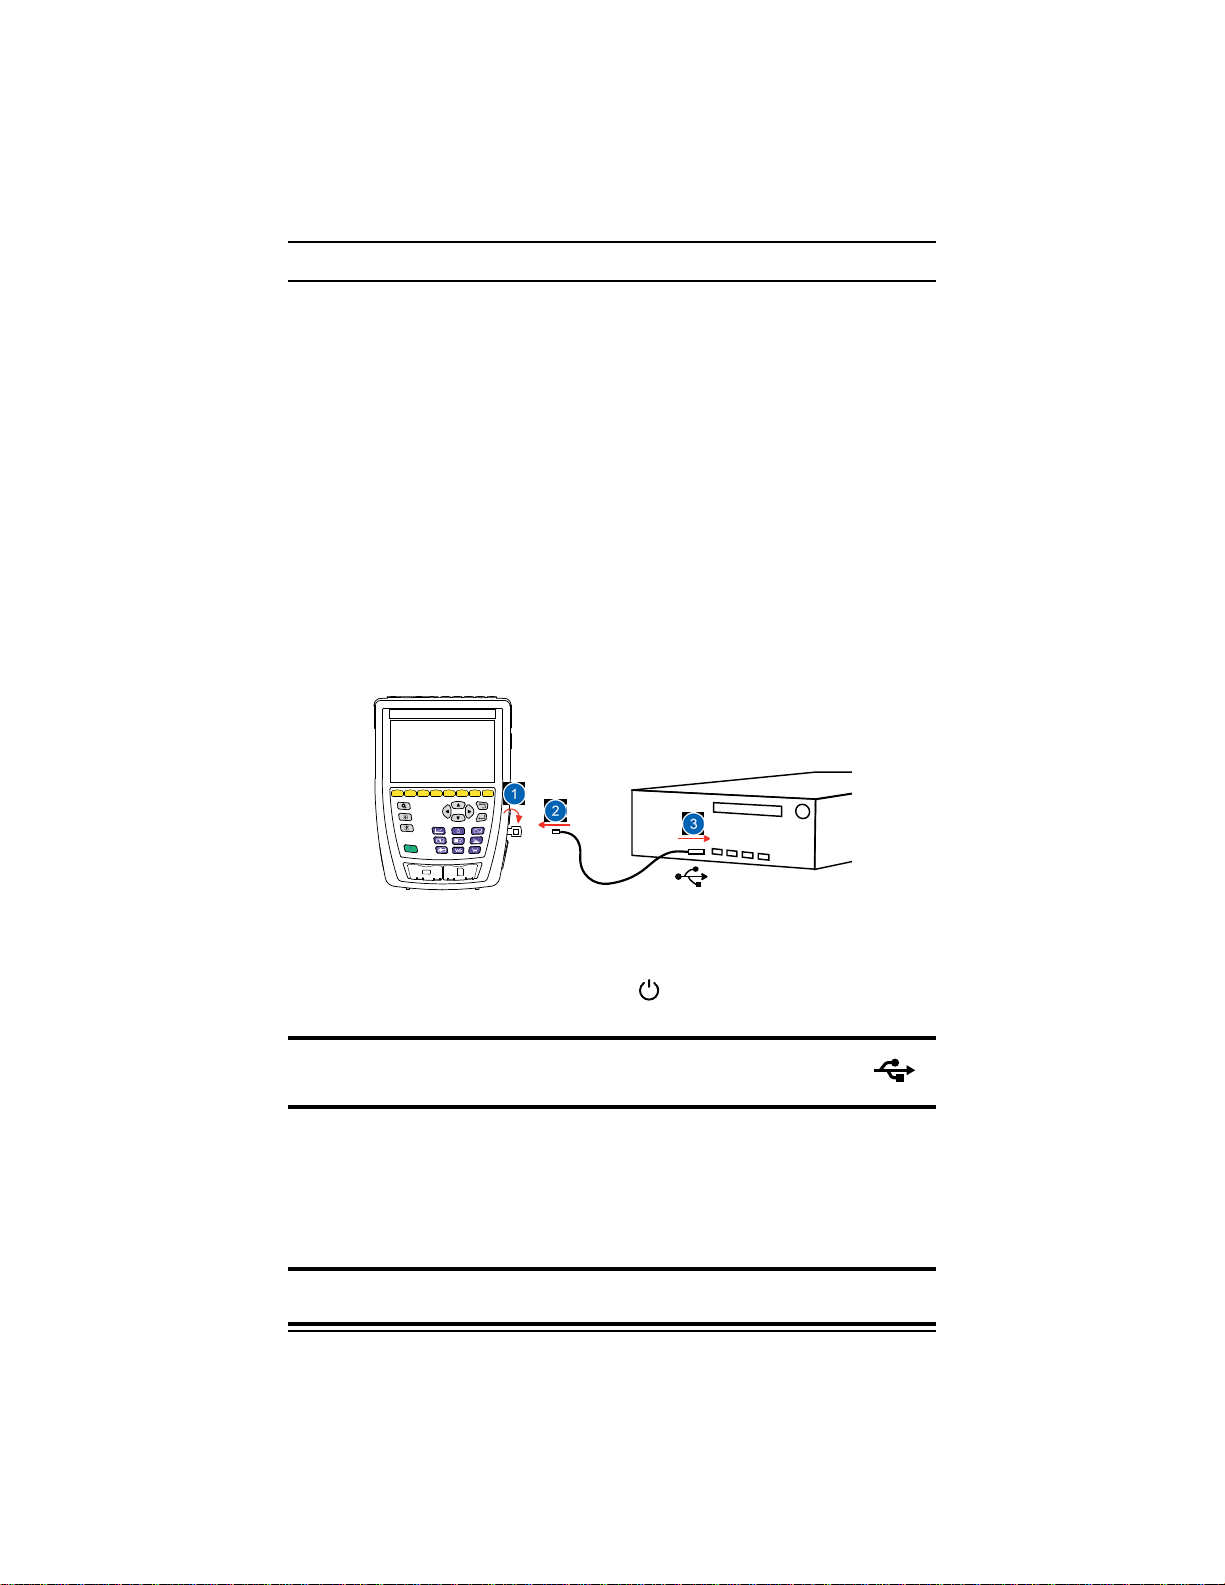
16. APPLICATION SOFTW ARE
The Power Analyzer application software is used to:
■
Congure the instrument and measurements
■
Start and schedule measurements
■
Transfer the instrument’s data to a PC
The application software can also export the conguration to a le and import a
conguration le.
16.1
OBTAINING THE SOFTWARE
The application software is available on the provided USB drive or on our
website at
To install the software
1. Insert the USB drive into your PC. An AutoPlay window will appear. If the
AutoPlay window does not appear, use your PC’s le browser to locate the
USB drive.
2. Run the setup.exe le.
3. Follow the instructions on your screen to nish the installation process.
To connect the instrument to your PC
1. Remove the cover that protects the instrument’s USB port.
2. Connect the instrument to the PC using the provided USB cable.
3. Turn the instrument on by pressing the
detect it.
USB 3.1 Gen 2 Super Speed is not supported on some PCs using
Windows 10 operating system. In this situation, we recommend
switching to either a lower speed USB port or ethernet connection.
Every measurement recorded on the instrument can be transferred to PC. The
SD card’s recorded data is not erased when the recordings are transferred,
unless requested.
The memory card’s stored data can be read on the PC using the application
software and an SD card reader (not provided).
To remove the SD card from the instrument, refer to § 3.3.4.
button, and wait for your PC to
SS
USB 3.1 Gen 2
For additional information regarding the application software, refer to the help le.
88 Power Quality Analyzer PowerPad® IV Model 8345
Find Quality Products Online at: [email protected]
www.GlobalTestSupply.com
Page 97
17. TECHNICAL SPECIFICATIONS
The 8345 complies with standard IEC 61000-4-30, Class A.
17.1 REFERENCE CONDITIONS
Quantity of Inuence Reference Conditions
Ambient temperature 23 °C ± 3 °C
Relative humidity 40 %RH to 75 %RH
Atmospheric pressure 860 hPa to 1060 hPa
Environmental
Conditions
Instrument
Conguration
Electric eld
Magnetic eld
Voltage ratio 1
Current ratio 1
Voltages Measured (not calculated)
Current sensors Real (not simulated)
Auxiliary power supply voltage 230 V ± 1 % or 120 V ± 1 %
Instrument warm up 1 h
< 1 V/m from 80 MHz to 1000 MHz
≤ 0.3 V/m from 1 GHz to 2 GHz
≤ 0.1 V/m from 2 GHz to 2.7 GHz
< 40 A/m DC (earth's magnetic eld)
< 3 A/m AC (50/60 Hz)
Power Quality Analyzer PowerPad® IV Model 8345 89
Find Quality Products Online at: [email protected]
www.GlobalTestSupply.com
Page 98
Quantity of Inuence Reference Conditions
Electrical
System
Specications
Electrical
System
Specications
(cont.)
1. The values for A
Phases
DC components of voltage
and current
3 phases available
(for three-phase systems)
No
Waveform Sine wave
Electrical network frequency 50 Hz ± 0.5 Hz or 60 Hz ± 0.5 Hz
U
± 1 %
din
Phase-to-neutral voltage
Voltage amplitude
between 100 V and 400 V
Phase-to-phase voltage
between 200 V and 1000 V
Flicker P
st
< 0.1
u0 = 0 % and u2 = 0 %
Phase modulus:
Voltage unbalance
100 % ± 0.5 % U
Phase angles:
din
L1: 0 ° ± 0.05 °
L2: -120 ° ± 0.05 °
L3: 120 ° ± 0.05 °
Harmonics <3 % U
Interharmonics <0.5 % U
and
and
and
30 mV
RMS
30 mV
11.73 mV
11.73 mV
391 mV
1.173 mV
1.173 mV
39.1 mV
117.3 µV
117.3 µV
3.91 mV
0 ° (active power and energy)
90 ° (reactive power and energy)
Input voltage on the current
terminals for current sensors
(except AmpFlex
MiniFlex
Input voltage on current
terminals for AmpFlex
MiniFlex
Input voltage on current
terminals for AmpFlex
MiniFlex
®
(1000 A range)
Input voltage on current
terminals for AmpFlex
MiniFlex
®
®
and
®
)
®
®
(10 kA)
®
®
(100 A range)
Phase dierence
are given in the following table.
nom
to 1000 mV
1 V
RMS
to 391 mV
RMS
RMS
at 50 Hz <=> 10 kA
RMS
to 39.1 mV
RMS
RMS
at 50 Hz <=> 1000 A
RMS
to 3910 µV
RMS
RMS
at 50 Hz <=> 100 A
RMS
din
din
without DC
RMS
<=> A
RMS
<=> 3 × A
(1)
nom
(1)
nom
without DC
RMS
/ 100
at 50 Hz <=> 300 A
without DC
RMS
at 50 Hz <=> 30 A
without DC
RMS
at 50 Hz <=> 3 A
RMS
RMS
RMS
RMS
RMS
RMS
90 Power Quality Analyzer PowerPad® IV Model 8345
Find Quality Products Online at: [email protected]
www.GlobalTestSupply.com
Page 99
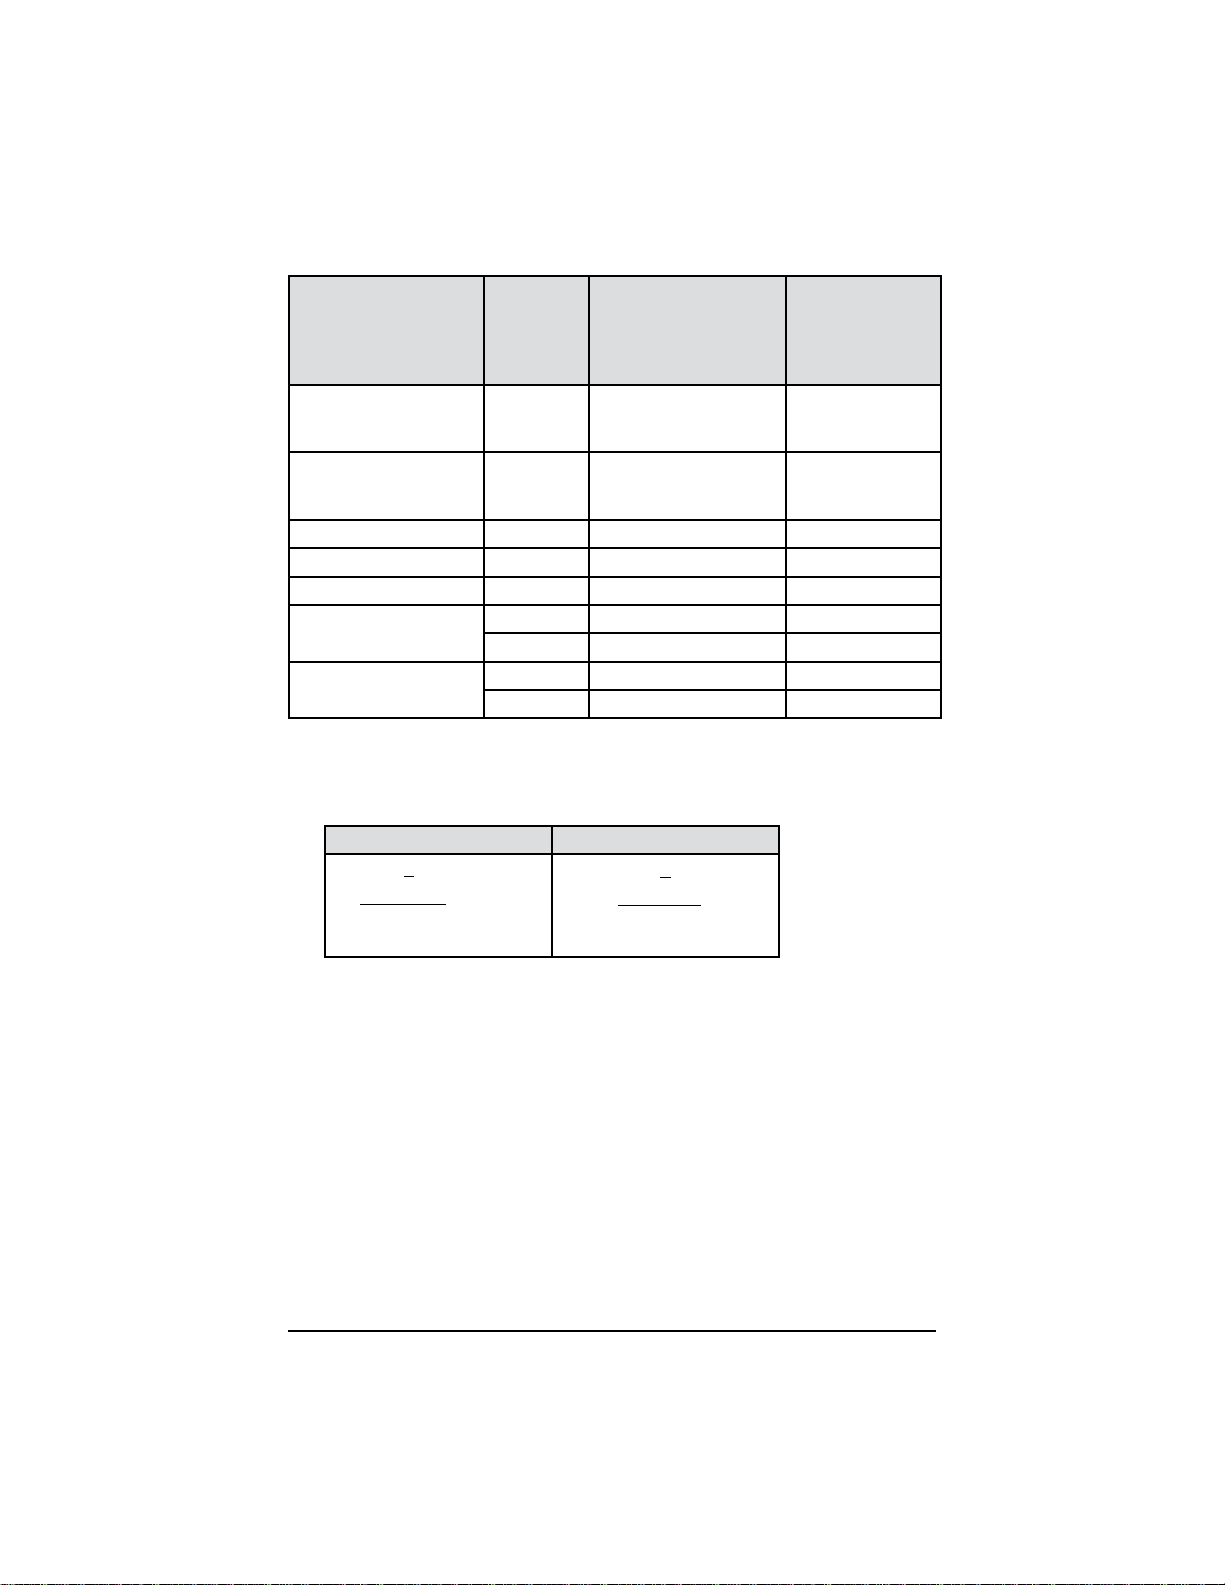
Nominal current (A
) depending on the sensor
nom
Nominal
Current Sensor
RMS
Current
A
nom
100 A
AmpFlex® 193 and
1000 A
10,000 A
100 A
MiniFlex® MA194-24-BK
1000 A
10,000 A
SR193 clamp 1000 A
MR193 clamp 1000 A
MN93 clamp (200 A) 200 A
MN193 clamp (5 A)
MN193 clamp (100 A)
SL261 clamp (10 mV/A)
SL261 clamp (100 mV/A)
®
1. AmpFlex
and MiniFlex® current sensors do not guarantee Class A at full scale
5 A
100 A
100 A
10 A
Full-Scale Technical
RMS per Class A
(A)
nom
nom
nom
nom
nom
nom
nom
nom
nom
nom
nom
nom
nom
14.14 A to 16.97 A
141.42 A to 169.71 A
1414.21 A to 1697.06 A
14.14 A to 16.97 A
141.42 A to 169.71 A
1414.21 A to 1697.06 A
94.3 A to 113 A 100 A
1.77 A to 2.12 A 2 A
47.1 A to 56.6 A 50 A
47.1 A to 56.6 A 50 A
3.54 A to 4.24 A 4 A
(2)
471 A to 566 A 500 A
471 A to 566 A 500 A
Full-Scale
Commercial RMS
per Class A
30 A
(1)
300 A
3000 A
30 A
(1)
300 A
3000 A
because they generate a signal proportional to the current’s dierential coecient,
and the scale factor can easily reach 3, 3.5, or 4 if the signal is not sinusoidal.
2. Calculation formulas:
Lower Value Upper Value
(3)
(1)
(1)
CF
√2
Class-A
x
A
nom
1.2
√2
x
CF
Class-A
x
A
nom
The factor 1.2 follows from the instrument’s current input capacity to accept 120 % of
A
with a sinusoidal signal.
nom
A
5 A < A
10 A < A
≤ 5 A => CF
nom
≤ 10 A => CF
nom
=> CF
nom
Class-A
Class-A
Class-A
= 4
= 3.5
= 3
3. The commercial full-scale RMS value is chosen inside the technical full scale.
Power Quality Analyzer PowerPad® IV Model 8345 91
Find Quality Products Online at: [email protected]
www.GlobalTestSupply.com
Page 100
17.2 ELECTRICAL SPECIFICATIONS
17.2.1 Input Voltage Specications
to 1000 V
0 V
RMS
Range of Use
0 V
without exceeding 1000 V
Input Impedance
Permanent Overload 1200 V
Temporary Overload
12,000 V
2 MΩ between phase and neutral
2 MΩ between neutral and earth
RMS
278 pulses per second maximum
phase-neutral and neutral-earth
RMS
to 1700 V
RMS
phase-phase
RMS
with respect to earth
RMS
phase-neutral and neutral-earth
phase-neutral and neutral-earth
RMS
17.2.2 Current Input Specications
0 V
RMS
Range of Use
(except AmpFlex® and MiniFlex®)
0 V
to (0.391 x f
RMS
for AmpFlex® and MiniFlex
Input Impedance
1 MΩ (except AmpFlex
12.5 kΩ for AmpFlex
Max Input Voltage 1.2 V
Permanent Overload 1.7 V
to 1 V
with CF = √2
RMS
/ 50) V
nom
with CF = √2
RMS
with CF = √2
RMS
with CF = √2
RMS
®
®
and MiniFlex®)
®
and MiniFlex
®
17.2.3 Bandwidth and Sampling
The instrument utilizes anti-aliasing lters, as required by IEC 61000-4-7 Ed. 2.
S/s: sample per second
spc: sample per cycle
The bandwidth and the sampling frequency (S = sample) are:
Channel Type Bandwidth Sampling Frequency
Voltage 88 kHz 400 kS/s
Current 20 kHz 200 kS/s
Shock Waves 200 kHz 2 MS/s
There are two streams of data used for metrology: 40 kS/s and 512 spc
(samples per cycle)
Waveform - RMS:
■
3U, 4V, 4A lters: 512 spc stream
■
L1, L2, L3, N lters: 512 spc stream
■
Min and Max curves: 400 kS/s for V and U, 200 kS/s for I
92 Power Quality Analyzer PowerPad® IV Model 8345
Find Quality Products Online at: [email protected]
www.GlobalTestSupply.com
 Loading...