

Page 1

n
3-PHASE POWER QUALITY
ANALYZER
8336
PowerPad® III
ENGLISH
IMPORTANT WARRANTY NOTE:
By registering online within 30 days from the date of
purchase, your warranty will be extended to 3 years
User Manual
Page 2

Copyright © Chauvin Arnoux®, Inc. d.b.a. AEMC® Instruments. All rights reserved.
No part of this documentation may be reproduced in any form or by any means (including electronic storage and retrieval or translation into any other
language) without prior agreement and written consent from Chauvin Arnoux®, Inc., as governed by United States and International copyright laws.
Chauvin Arnoux®, Inc. d.b.a. AEMC® Instruments
15 Faraday Drive • Dover, NH 03820 USA
Tel: (800) 945-2362 or (603) 749-6434 • Fax: (603) 742-2346
This documentation is provided “as is,” without warranty of any kind, express, implied, or otherwise. Chauvin Arnoux®, Inc. has made every reasonable
effort to ensure that this documentation is accurate; but does not warrant the accuracy or completeness of the text, graphics, or other information
contained in this documentation. Chauvin Arnoux®, Inc. shall not be liable for any damages, special, indirect, incidental, or inconsequential; including (but
not limited to) physical, emotional or monetary damages due to lost revenues or lost prots that may result from the use of this documentation, whether
or not the user of the documentation has been advised of the possibility of such damages.
Chauvin Arnoux®, Inc, AEMC®, DataView®, AmpFlex®, MiniFlex® and PowerPad® are registered trademarks of AEMC® Instruments.
Page 3
Thank you for purchasing a PowerPad® III Model 8336
For best results from your instrument and for your safety, read the enclosed operating instructions carefully and comply with the
precautions for use. These products must be only used by qualied and trained users.
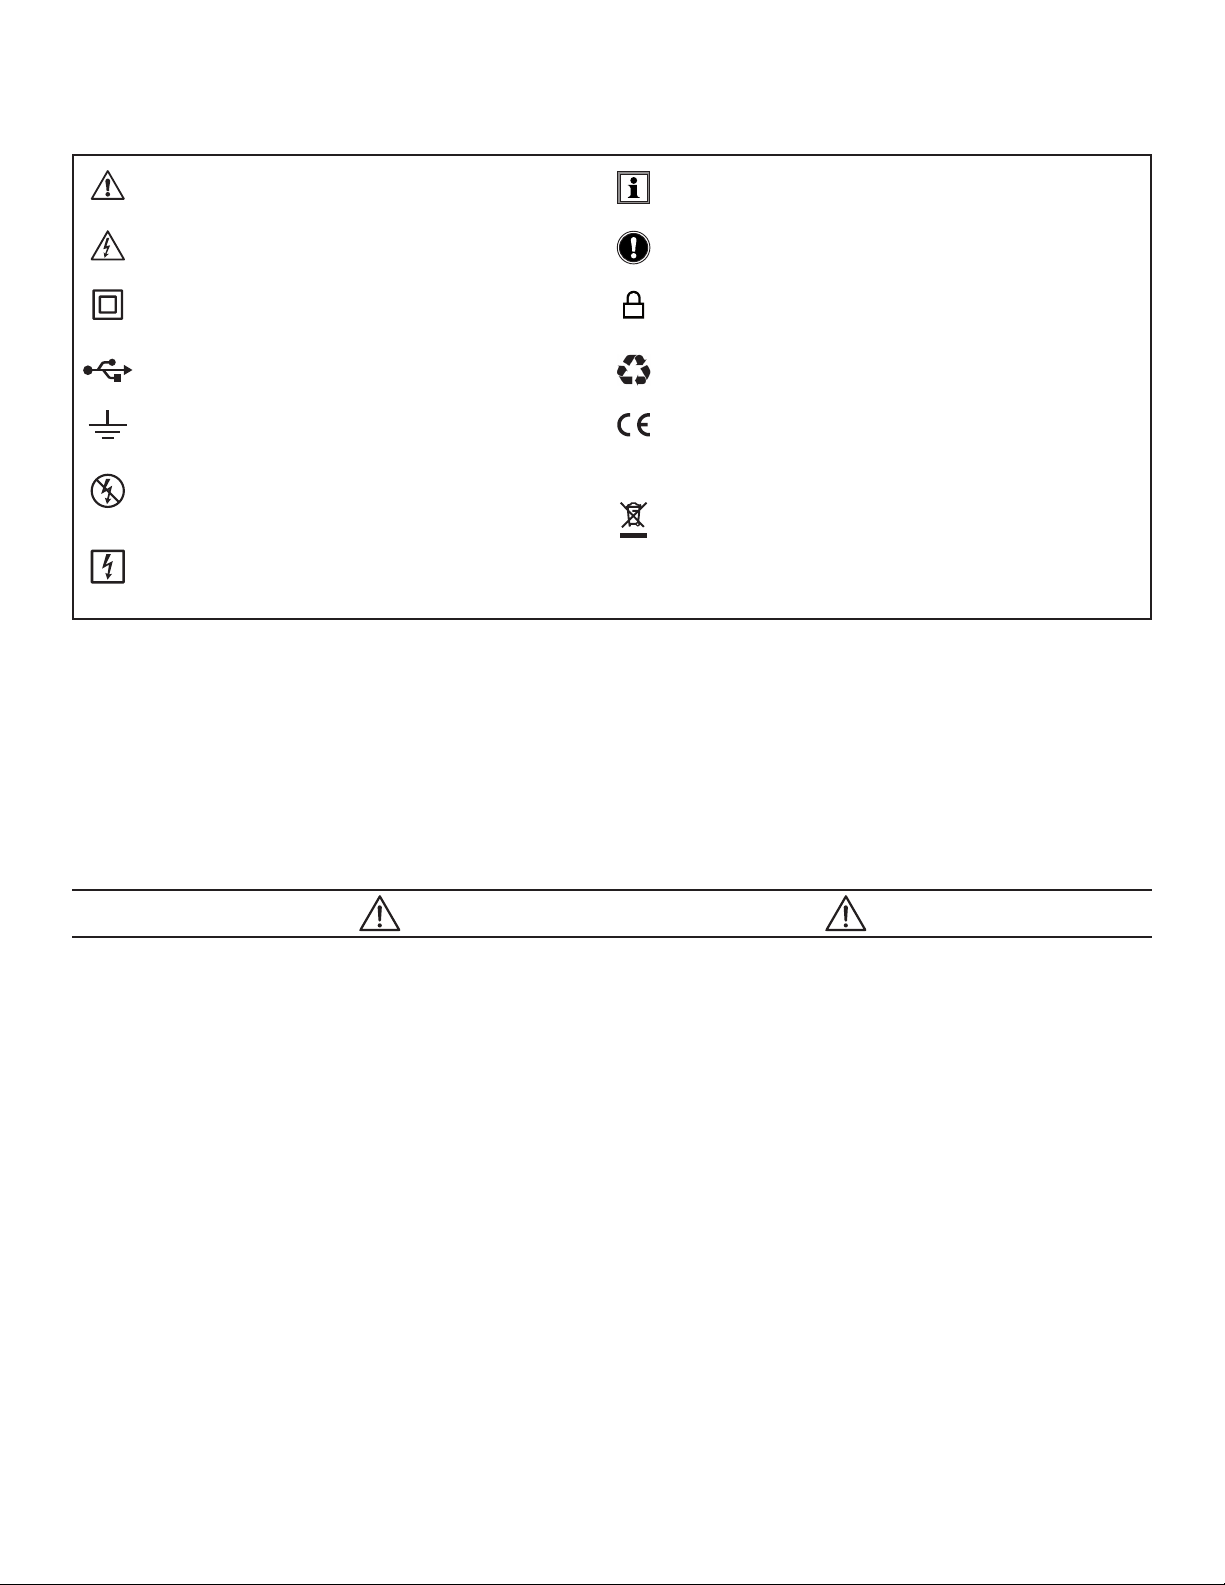
WARNING, risk of DANGER! The operator must refer to
these instructions whenever this danger symbol appears.
CAUTION! Risk of electric shock. The voltage at the
parts marked with this symbol may be dangerous.
Equipment is protected by double insulation. Kensington anti-theft system.
USB socket.
Ground/Earth.
Must not be applied to or removed from bare
conductors carrying dangerous voltages. Type B
current sensor as per EN 61010-2-032.
Application or withdrawal authorized on conductors
carrying dangerous voltages. Type A current sensor per
IEC 61010-2-032.
Denition of Measurement Categories (CAT)
■ CAT IV Measurement category IV corresponds to measurements taken at the source of low-voltage installations.
Example: power feeders, counters and protection devices.
■ CAT III Measurement category III corresponds to measurements on building installations.
Example: distribution panel, circuit-breakers, machines or xed industrial devices.
Useful information or hint to read.
Important instructions to read and to fully understand.
The product has been declared recyclable after analysis of
its life cycle in accordance with the ISO14040 standard.
The CE marking guarantees conformity with European
directives and with regulations covering EMC.
The trash can with a line through it means that in the
European Union, the product must undergo selective
disposal for the recycling of electric and electronic
material, in compliance with Directive WEEE 2002/96/EC.
■ CAT II Measurement category II corresponds to measurements taken on circuits directly connected to low-voltage installations.
Example: power supply to domestic electrical appliances and portable tools.
PRECAUTIONS FOR USE
This instrument is compliant with safety standard IEC 61010-2-030, the leads are compliant with IEC 61010-031, and the current
sensors are compliant with IEC 61010-2-032, for voltages up to 600V in category IV or 1000V in category III. Failure to observe the
safety instructions may result in electric shock, re, explosion, and destruction of the instrument and/or other equipment.
● The operator and/or the responsible authority must carefully read and clearly understand the various precautions for use of
the instrument. Sound knowledge and a keen awareness of electrical hazards are essential when using this instrument.
● If you use this instrument other than as specied, the protection it provides may be compromised, thereby endangering you.
● Do not use the instrument on networks which the voltage or category exceeds those mentioned.
● Do not use the instrument if it appears damaged or otherwise compromised.
● Before each use, check the condition of the insulation on the leads, housing, and accessories. Any item on which the
insulation is deteriorated (even partially) must be set aside for repair or scrapping.
● Before using your instrument, check that it is perfectly dry. If it is wet, it must be thoroughly dried before being connected or
being operated in any way. This includes the terminals and keypad.
● Use only the leads and accessories supplied. Using leads (or accessories) of a lower voltage or category reduces the voltage
or category of the combined instrument and leads (or accessories) to that of the leads (or accessories).
● Always use personal protection equipment.
● Keep your hands away from the terminals of the instrument.
● When handling the leads, test probes, and alligator clips, keep your ngers behind the physical guard.
● Use only the AC power cord and battery pack supplied by the manufacturer. They include specic safety features.
● Some current sensors must not be placed on or removed from bare conductors at hazardous voltages: refer to the manual
and comply with the handling instructions.
Page 4

Your instrument is equipped with a NiMH battery. This technology offers several advantages:
● Long battery charge life for a limited volume and weight.
● Possibility of quickly recharging your battery.
● Signicantly reduced memory effect: you can recharge your battery even if it is not fully discharged.
● Respect for the environment: no pollutant materials such as lead or cadmium, in compliance with the applicable
regulations.
After prolonged storage, the battery may be completely discharged. If so, it must be completely recharged. Your
instrument may not function during part of this recharging operation. Full recharging of a completely discharged battery
may take several hours.
NOTE: In this case, at least 5 charge/discharge cycles will be necessary for your battery to recover 95% of its capacity.
To make the best possible use of your battery and extend its effective service life:
● Only use the charger supplied with your instrument. Use of another charger may be dangerous.
● Only charge your instrument at temperatures between 0° and 40°C.
● Comply with the conditions of use dened in the operating manual.
● Comply with the storage conditions specied in the operating manual.
NiMH technology allows a limited number of charge/discharge cycles depending signicantly on:
● The conditions of use.
● The charging conditions.
Do not dispose of the battery pack with other solid waste. Used batteries must be entrusted to a qualied
recycling company or to a company specialized in processing hazardous materials.
Page 5

TABLE OF CONTENTS
1. BEFORE YOU BEGIN ..................................................................................................................................... 7
1.1 RECEIVING YOUR SHIPMENT .................................................................................................................................................. 7
1.2 ORDERING INFORMATION ....................................................................................................................................................... 7
1.2.1 ACCESSORIES ............................................................................................................................................................... 7
1.2.2 REPLACEMENT PARTS ................................................................................................................................................. 7
1.3 INSTALLING THE BATTERY ....................................................................................................................................................... 8
1.4 CHARGING THE BATTERY ........................................................................................................................................................ 8
1.5 SETTING THE LANGUAGE ........................................................................................................................................................ 8
2. INTRODUCTION .............................................................................................................................................. 9
2.1 DESCRIPTION ............................................................................................................................................................................ 9
2.2 MEASUREMENTS ...................................................................................................................................................................... 9
2.3 DISPLAY .................................................................................................................................................................................... 10
2.4 CONFIGURATION ..................................................................................................................................................................... 10
2.5 OVERALL VIEW .........................................................................................................................................................................11
2.6 ON/OFF BUTTON ..................................................................................................................................................................... 12
2.7 DISPLAY .................................................................................................................................................................................... 12
2.8 CONNECTION TERMINALS ..................................................................................................................................................... 13
2.9 POWER SUPPLY ...................................................................................................................................................................... 14
2.10 STAND ..................................................................................................................................................................................... 14
3. USE ................................................................................................................................................................ 15
3.1 START-UP ................................................................................................................................................................................. 15
3.2 CONFIGURATION (SET-UP MODE) ......................................................................................................................................... 15
3.3 INSTALLATION OF THE LEADS AND CURRENT SENSORS ................................................................................................. 15
3.3.1 CONNECTION PROCEDURE ...................................................................................................................................... 16
3.3.2 DISCONNECTION PROCEDURE ................................................................................................................................ 16
3.4 FUNCTIONS .............................................................................................................................................................................. 17
4. CONFIGURATION ........................................................................................................................................ 18
4.1 CONFIGURATION (SET-UP MENU) ......................................................................................................................................... 18
4.1.1 DATE/TIME .................................................................................................................................................................... 19
4.1.2 DISPLAY ........................................................................................................................................................................ 20
4.1.2.1 BRIGHTNESS....................................................................................................................................................... 20
4.1.2.2 COLORS ............................................................................................................................................................... 20
4.1.2.3 DISPLAY SHUTDOWN ......................................................................................................................................... 21
4.1.2.4 BACKGROUND COLOR (NIGHT MODE) ............................................................................................................ 21
4.1.3 CALCULATION METHODS ........................................................................................................................................... 22
4.1.3.1 NON-ACTIVE QUANTITIES ................................................................................................................................. 22
4.1.3.2 UNIT OF ENERGY ............................................................................................................................................... 23
4.1.3.3 K FACTOR ............................................................................................................................................................ 23
4.1.3.4 PHASE HARMONIC RATIOS ............................................................................................................................... 24
4.1.3.5 LONG-TERM FLICKER ........................................................................................................................................ 24
4.1.4 ELECTRICAL HOOK-UP ............................................................................................................................................... 25
4.1.5 PROBES AND RATIOS ................................................................................................................................................. 29
2
Power Quality Analyzer PowerPad® III Model 8336
Page 6

4.1.5.1 CURRENT PROBES ............................................................................................................................................ 29
4.1.5.2 VOLTAGE RATIOS ............................................................................................................................................... 30
4.1.6 CAPTURE MODE.......................................................................................................................................................... 31
4.1.6.1 TRANSIENT VOLTAGE THRESHOLDS ............................................................................................................... 31
4.1.6.2 TRANSIENT CURRENT THRESHOLDS .............................................................................................................. 32
4.1.6.3 INRUSH CURRENT THRESHOLDS .................................................................................................................... 33
4.1.7 TREND MODE .............................................................................................................................................................. 34
4.1.8 ALARM MODE CONFIGURATION ................................................................................................................................ 37
4.1.9 ERASING MEMORY ..................................................................................................................................................... 38
4.1.10 ABOUT ........................................................................................................................................................................ 39
5. DISPLAY MODES .......................................................................................................................................... 40
5.1 WAVEFORM CAPTURE MODE
5.1.1 TRANSIENT MODE
5.1.1.1 PROGRAMMING AND STARTING A SEARCH .................................................................................................... 41
5.1.1.2 DISPLAYING A TRANSIENT ................................................................................................................................ 42
5.1.1.3 DELETING A TRANSIENTS SEARCH ................................................................................................................. 44
5.1.1.4 DELETING A TRANSIENT .................................................................................................................................... 44
5.1.2 INRUSH CURRENT MODE
5.1.2.1 PROGRAMMING A CAPTURE ............................................................................................................................. 45
5.1.2.2 DISPLAYING CAPTURE PARAMETERS ............................................................................................................. 46
5.1.3 TRUE RMS CURRENT AND VOLTAGE ....................................................................................................................... 47
5.1.4 INSTANTANEOUS INRUSH CURRENT ....................................................................................................................... 49
5.2 HARMONICS MODE
5.2.1 PHASE-TO-NEUTRAL VOLTAGE HARMONICS .......................................................................................................... 51
5.2.2 CURRENT ..................................................................................................................................................................... 53
5.2.3 APPARENT POWER ..................................................................................................................................................... 55
5.2.4 PHASE-TO-PHASE VOLTAGE ..................................................................................................................................... 56
5.2.5 EXPERT MODE ............................................................................................................................................................ 58
5.3 WAVEFORM MODE
5.3.1 RMS MEASUREMENTS ............................................................................................................................................... 60
5.3.1.1 RMS (3U) .............................................................................................................................................................. 61
5.3.1.2 RMS (4V) .............................................................................................................................................................. 61
5.3.1.3 RMS (4A) .............................................................................................................................................................. 62
5.3.1.4 RMS (NEUTRAL) .................................................................................................................................................. 63
5.3.2 MEASUREMENT OF TOTAL HARMONIC DISTORTION (THD) .................................................................................. 63
5.3.2.1 THD (3U) ............................................................................................................................................................... 63
5.3.2.2 THD (4V) ............................................................................................................................................................... 64
5.3.2.3 THD (4A) ............................................................................................................................................................... 64
5.3.3 MEASUREMENT OF THE PEAK FACTOR (CF) .......................................................................................................... 65
5.3.3.1 CF (3U) ................................................................................................................................................................. 65
5.3.3.2 CF (4V) ................................................................................................................................................................. 66
5.3.3.3 CF (4A) ................................................................................................................................................................. 66
5.3.4 MEASUREMENT OF EXTREME AND MEAN VOLTAGE AND CURRENT VALUES
5.3.5 SIMULTANEOUS DISPLAY
5.3.6 PHASOR DIAGRAM DISPLAY
5.4 ALARM MODE
5.4.1 ALARM MODE CONFIGURATION ................................................................................................................................ 71
5.4.2 PROGRAMMING AN ALARM CAMPAIGN .................................................................................................................... 71
................................................................................................................................................................. 51
................................................................................................................................................................. 60
........................................................................................................................................................................... 70
............................................................................................................................................... 40
..................................................................................................................................................... 41
......................................................................................................................................... 45
.............................. 67
...................................................................................................... 68
.................................................................................................. 69
Power Quality Analyzer PowerPad® III Model 8336
3
Page 7

5.4.3 STARTING AN ALARM CAMPAIGN .............................................................................................................................. 71
5.4.4 MANUALLY STOPPING AN ALARM CAMPAIGN ......................................................................................................... 72
5.4.5 DISPLAYING A LIST OF ALARM CAMPAIGNS ............................................................................................................ 72
5.4.6 LIST OF ALARMS ......................................................................................................................................................... 73
5.4.7 DELETING ALARM CAMPAIGNS ................................................................................................................................. 74
5.4.7.1 DELETING A SINGLE ALARM CAMPAIGN .......................................................................................................... 74
5.4.7.2 DELETING ALL ALARM CAMPAIGNS ................................................................................................................. 74
5.5 TREND MODE
5.5.1 PROGRAMMING AND STARTING A RECORDING ..................................................................................................... 74
5.5.2 VIEWING THE RECORDING LIST ............................................................................................................................... 75
5.5.3 DELETING RECORDINGS ........................................................................................................................................... 76
5.5.4 VIEWING RECORDS .................................................................................................................................................... 76
5.5.5 TREND GRAPHS .......................................................................................................................................................... 76
5.6 POWER AND ENERGY MODE ................................................................................................................................................. 85
5.6.1 3L FILTER...................................................................................................................................................................... 85
5.6.1.1 POWER ................................................................................................................................................................ 85
5.6.1.2 QUANTITIES ASSOCIATED WITH POWER ........................................................................................................ 86
5.6.1.3 ENERGY CONSUMED ......................................................................................................................................... 86
5.6.1.4 ENERGY GENERATED ........................................................................................................................................ 87
5.6.2 L1, L2, AND L3 FILTERS ............................................................................................................................................... 88
5.6.2.1 POWERS AND ASSOCIATED QUANTITIES ....................................................................................................... 88
5.6.2.2 ENERGY METERS ............................................................................................................................................... 89
5.6.3 Σ FILTER ....................................................................................................................................................................... 89
5.6.3.1 TOTAL POWERS AND ASSOCIATED QUANTITIES ........................................................................................... 89
5.6.4 TOTAL ENERGY METERS ........................................................................................................................................... 90
5.6.5 STARTING AND STOPPING ENERGY MEASUREMENTS ......................................................................................... 91
5.6.6 RESETTING THE ENERGY MEASUREMENT ............................................................................................................. 91
5.7 SCREEN SNAPSHOTS............................................................................................................................................................. 91
5.7.1 VIEWING A SNAPSHOT ............................................................................................................................................... 92
5.7.2 DELETING A SNAPSHOT ............................................................................................................................................. 92
5.8 HELP
......................................................................................................................................................................................... 92
........................................................................................................................................................................... 74
6. DATAVIEW SOFTWARE ................................................................................................................................ 93
6.1 INSTALLING DATAVIEW ........................................................................................................................................................... 93
6.1.1 USB FLASH DRIVE INSTALL ....................................................................................................................................... 93
6.2 CONNECTING THE MODEL 8336 TO YOUR COMPUTER ..................................................................................................... 96
6.3 OPENING THE CONTROL PANEL ........................................................................................................................................... 96
6.4 CONFIGURING THE INSTRUMENT ........................................................................................................................................ 97
6.4.1 SETUP ........................................................................................................................................................................... 98
6.4.2 SENSORS AND RATIOS .............................................................................................................................................. 99
6.4.3 INSTRUMENT DISPLAY ............................................................................................................................................... 99
6.4.4 ALARM CONDITIONS ................................................................................................................................................. 100
6.4.5 RECORDINGS ........................................................................................................................................................... 101
6.4.6 TRANSIENTS .............................................................................................................................................................. 102
6.4.7 INRUSH ....................................................................................................................................................................... 103
6.5 SCHEDULE ............................................................................................................................................................................. 104
6.6 REAL-TIME DATA .................................................................................................................................................................... 105
6.6.1 TREND ........................................................................................................................................................................ 105
4
Power Quality Analyzer PowerPad® III Model 8336
Page 8

6.6.2 WAVEFORM ................................................................................................................................................................ 105
6.6.3 HARMONICS............................................................................................................................................................... 106
6.6.4 POWER ...................................................................................................................................................................... 106
6.6.5 ENERGY ..................................................................................................................................................................... 107
6.7 DOWNLOADING DATA ........................................................................................................................................................... 107
6.7.1 RECORDINGS ............................................................................................................................................................ 108
6.7.2 SCREEN SNAPSHOTS .............................................................................................................................................. 108
6.7.3 ALARMS ...................................................................................................................................................................... 108
6.7.4 TRANSIENTS .............................................................................................................................................................. 108
6.7.5 INRUSH ....................................................................................................................................................................... 108
6.7.6 EDITING DOWNLOADED DATA ................................................................................................................................. 108
7. MAINTENANCE ........................................................................................................................................... 110
7.1 CLEANING ...............................................................................................................................................................................110
7.2 REPLACING THE BATTERY ....................................................................................................................................................110
7.3 UPDATING SOFTWARE & FIRMWARE ..................................................................................................................................111
8. ICONS, BUTTON & SYMBOLS ................................................................................................................... 112
8.1 FUNCTION BUTTON ICONS ...................................................................................................................................................112
8.2 KEYPAD BUTTONS .................................................................................................................................................................113
8.2.1 FUNCTION BUTTONS (YELLOW BUTTONS) ..........................................................................................................113
8.2.2 NAVIGATION BUTTONS ..............................................................................................................................................11 3
8.2.3 MODE BUTTONS (VIOLET BUTTONS) ......................................................................................................................11 3
8.2.4 OTHER BUTTONS .......................................................................................................................................................114
8.3 ABBREVIATIONS .....................................................................................................................................................................114
9. SPECIFICATIONS ........................................................................................................................................ 116
9.1 REFERENCE CONDITIONS ....................................................................................................................................................116
9.2 ELECTRICAL SPECIFICATIONS .............................................................................................................................................117
9.2.1 VOLTAGE INPUTS .......................................................................................................................................................11 7
9.2.2 CURRENT INPUTS ......................................................................................................................................................117
9.2.3 BANDWIDTH ................................................................................................................................................................117
9.2.4 POWER SUPPLY .........................................................................................................................................................117
9.2.5 ACCURACY SPECIFICATIONS (EXCLUDING CURRENT PROBES) ........................................................................118
9.2.6 CURRENT PROBE ACCURACY (TO BE ADDED TO THE MODEL 8336’S ACCURACY) ........................................ 127
9.2.7 CURRENT PROBES AND SENSORS ........................................................................................................................ 128
9.3 CLASS B UNDER STANDARD IEC 61000-4-30 .................................................................................................................... 129
9.3.1 CONFORMITY OF THE DEVICE ................................................................................................................................ 129
9.3.2 ACCURACY AND MEASUREMENT RANGES ........................................................................................................... 130
9.3.3 REAL-TIME CLOCK ACCURACY ............................................................................................................................... 130
9.4 MECHANICAL SPECIFICATIONS ........................................................................................................................................... 130
9.5 ENVIRONMENTAL SPECIFICATIONS ................................................................................................................................... 131
9.6 SAFETY SPECIFICATIONS .................................................................................................................................................... 131
APPENDIX ....................................................................................................................................................... 132
A.1 HYSTERESIS.......................................................................................................................................................................... 132
A.1.1 SURGE DETECTION.................................................................................................................................................. 132
A.1.2 UNDERVOLTAGE OR BLACKOUT DETECTION ...................................................................................................... 132
A.1.3 MINIMUM SCALE VALUES FOR WAVEFORMS AND MINIMUM RMS VALUES ..................................................... 133
Power Quality Analyzer PowerPad® III Model 8336
5
Page 9

A.1.4 FOUR-QUADRANT DIAGRAM ................................................................................................................................... 133
A.1.5 MECHANISM FOR TRIGGERING TRANSIENT SENSORS ..................................................................................... 134
A.1.6 CAPTURE CONDITIONS IN INRUSH CURRENT MODE .......................................................................................... 134
GLOSSARY OF TERMS .................................................................................................................................. 135
REPAIR AND CALIBRATION .......................................................................................................................... 138
TECHNICAL AND SALES ASSISTANCE ....................................................................................................... 138
LIMITED WARRANTY ..................................................................................................................................... 139
WARRANTY REPAIRS .................................................................................................................................... 139
6
Power Quality Analyzer PowerPad® III Model 8336
Page 10

1. BEFORE YOU BEGIN
1.1 RECEIVING YOUR SHIPMENT
Make sure the contents shipped are consistent with the packing list. Notify your distributor of any missing items. If the
equipment appears damaged, le a claim immediately with the carrier and notify your distributor at once. Save the damaged
packing container to substantiate your claim. Do not use equipment which is damaged or appears to be damaged.
1.2 ORDERING INFORMATION
PowerPad® III Model 8336 (No Probes) ........................................................................................................... Cat. #2136.30
PowerPad® III Model 8336 (w/4 A193-24-BK Sensors) ....................................................................................Cat. #2136.31
PowerPad® III Model 8336 (w/4 MN193-BK Probes) ....................................................................................... Cat. #2136.32
Includes extra large tool bag, soft carrying pouch, 5 ft USB cable, ve 10 ft black voltage leads with alligator clips, twelve
color-coded input ID markers, power adapter 110/230V with US power cord, 9.6V NiMH battery, SD-Card (2GB), quick
start guide, and a USB stick containing DataView® software and user manual.
Only the AmpFlex® sensors are rated 600V CAT IV and IP67. The MN probes are rated 300V CAT IV, 600V CAT III.
1.2.1 ACCESSORIES
10 ft USB Cable ................................................................................................................................................. Cat. #2136.80
AC/DC Current Probe Model SL261* ................................................................................................................ Cat. #1201.51
* Adapter - BNC Adapter (mandatory if using an SL261 w/ the 8336) ........................................................... Cat. #2140.40
AC Current Probe Model MR193-BK................................................................................................................. Cat. #2140.28
AC Current Probe Model MN93-BK................................................................................................................... Cat. #2140.32
AC Current Probe Model SR193-BK ................................................................................................................. Cat. #2140.33
AmpFlex® Sensor 24" Model A193-24-BK ......................................................................................................... Cat. #2140.34
AmpFlex® Sensor 36" Model A193-36-BK ......................................................................................................... Cat. #2140.35
AC Current Probe Model MN193-BK ................................................................................................................ Cat. #2140.36
MiniFlex® Sensor 10" Model MA193-10-BK ...................................................................................................... Cat. #2140.48
AC/DC Current Probe Model J93-BK ................................................................................................................ Cat. #2140.49
1.2.2 REPLACEMENT PARTS
Extra Large Classic Tool Bag ............................................................................................................................Cat. #2133.73
Soft Carrying Pouch .......................................................................................................................................... Cat. #2140.15
Battery 9.6V NiMH ............................................................................................................................................. Cat. #2140.19
(5) Black 10 ft (3M) Leads with (5) Black Alligator Clips .................................................................................... Cat. #2140.43
(1) Black 10 ft (3M) Lead with (1) Black Alligator Clip .......................................................................................Cat. #2140.44
(Leads are rated 600V CAT IV 10A, Clips rated 1000V CAT IV 15A, UL)
Set of 12, Color-coded Input ID Markers ........................................................................................................... Cat. #2140.45
5 ft USB Cable ................................................................................................................................................... Cat. #2140.46
Power Adapter 110/230V with US Power Cord .................................................................................................Cat. #5000.19
Power Quality Analyzer PowerPad® III Model 8336
7
Page 11
1.3 INSTALLING THE BATTERY
WARNING:
● For safety reasons, replace the battery only with the original replacement model (see § 1.2.2).
● Do not expose the battery to heat exceeding 212°F (100°C).
● Do not short-circuit the battery terminals.
● To eliminate all risk of electric shock, disconnect the power supply cord and measurement leads of the
instrument.
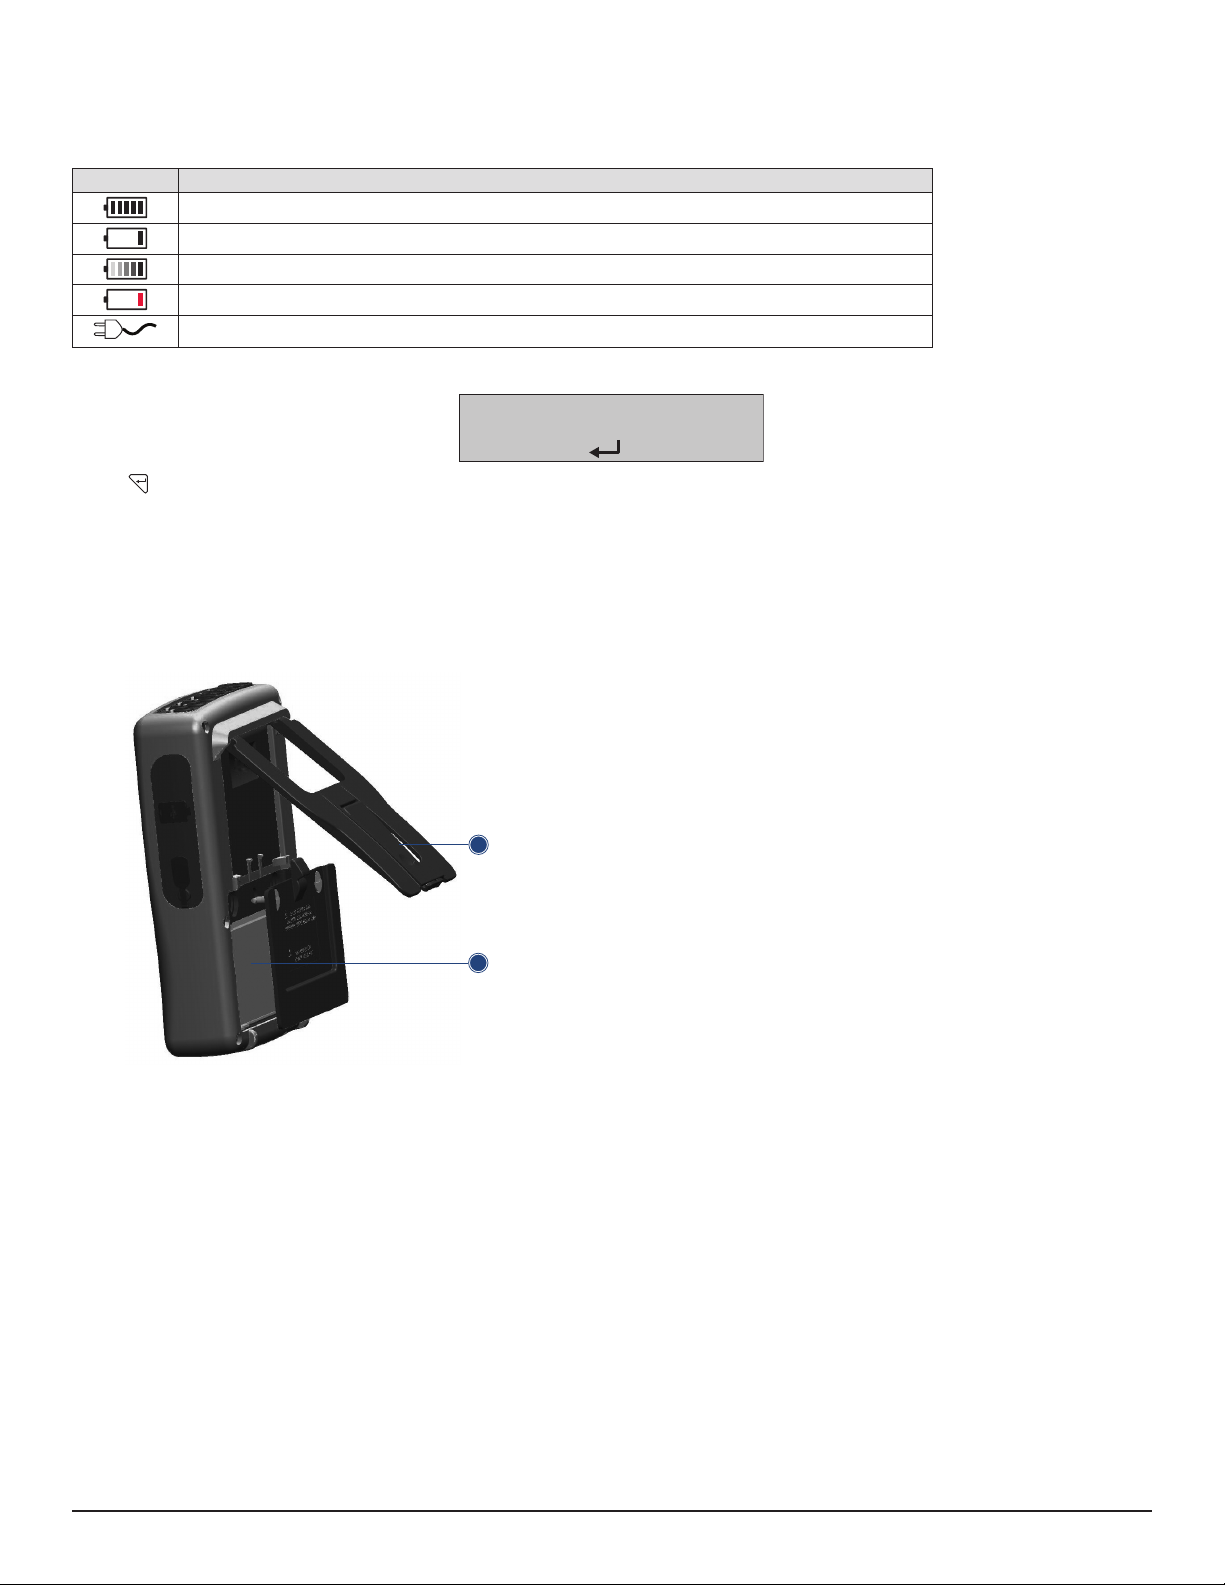
1. Turn the instrument over, raise the stand, and prop it up.
2. Use a coin to unscrew the two quarter-turn screws on the back of the housing.
3. Using a at screwdriver, remove the cover from the compartment.
4. Turn the instrument over and hold the battery as it slides out of its compartment.
5. Disconnect the battery connector without pulling on the wires.
6. Connect the new battery. The connector is error-proofed to prevent reversals of
polarity.
7. Place the battery in its compartment and arrange the wires so that they do not
protrude.
8. Put the battery compartment cover back in place and screw the two screws back in.
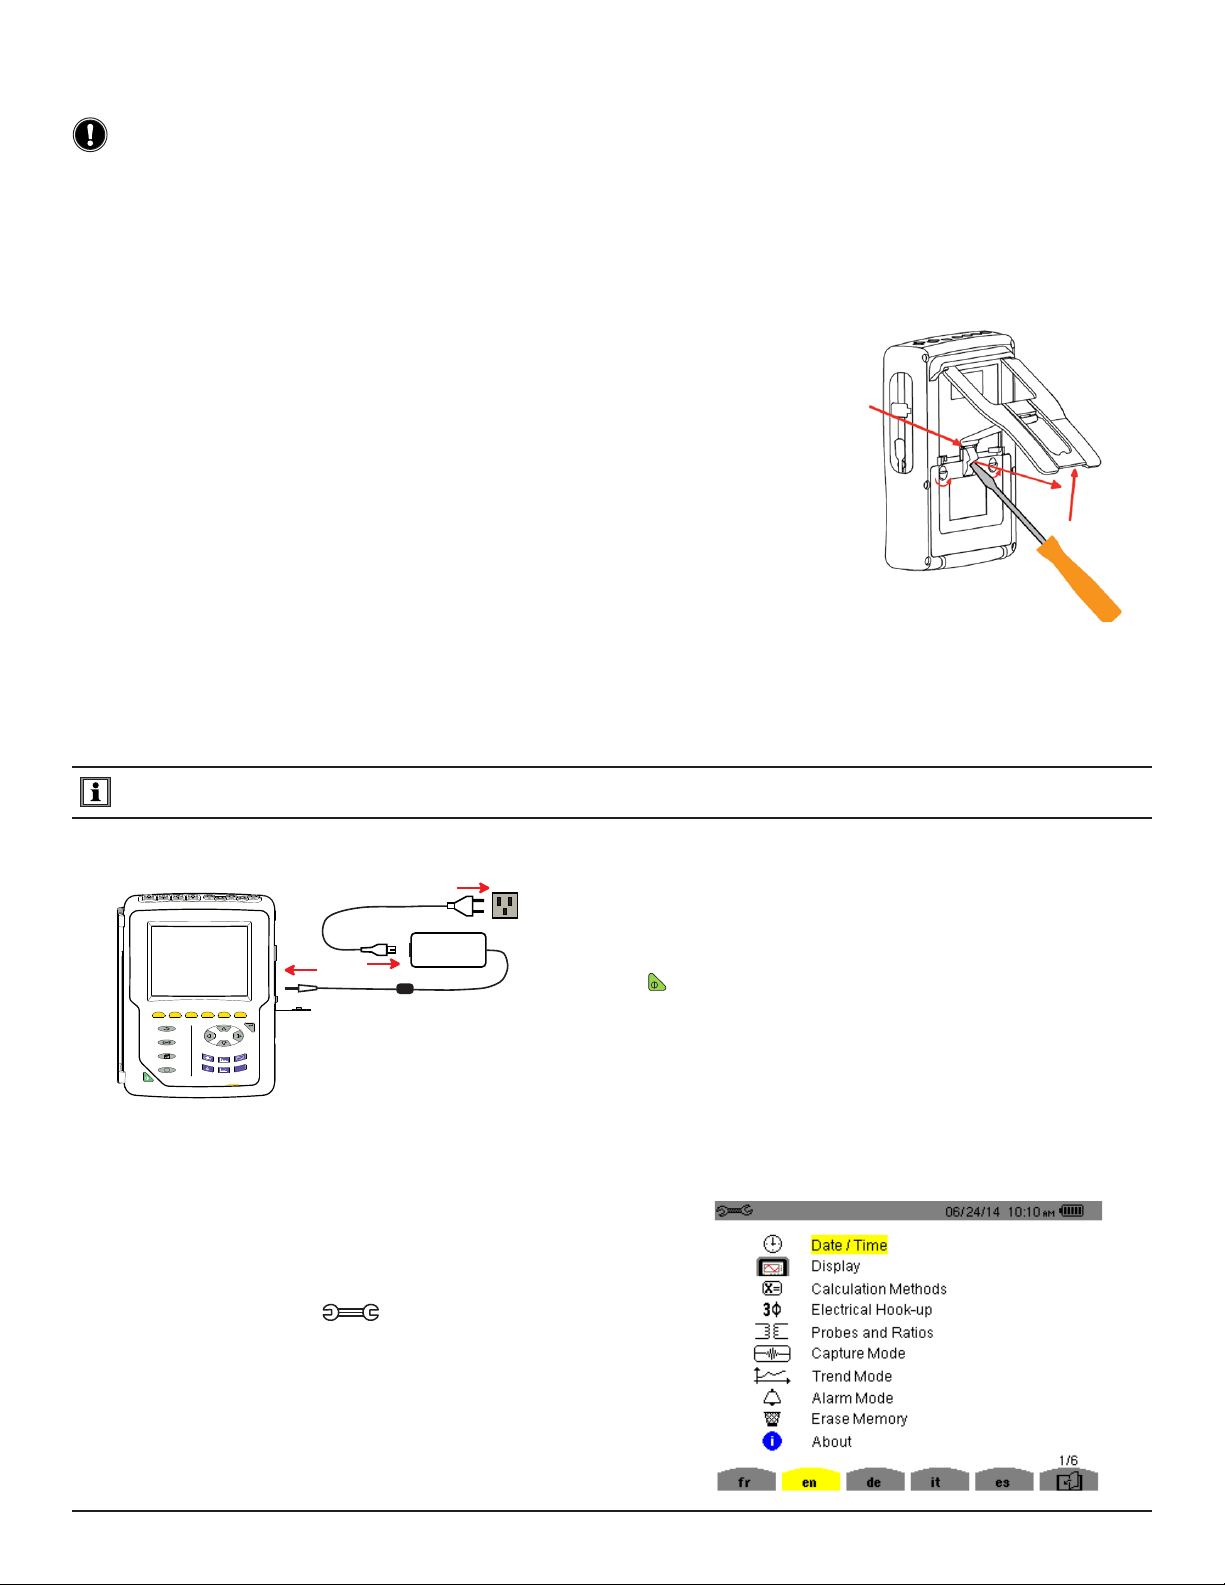
1.4 CHARGING THE BATTERY
Fully charge the battery before the rst use.
NOTE: A full recharge of a completely discharged battery takes approximately 5 hrs.
120V ± 10%, 60Hz
230V ± 10%, 50Hz
To recharge the battery:
■ Remove the cover of the battery charging connector.
■ Connect the supplied power cord to the instrument and AC
power.
■ The button lights and will go out when the power cord is
disconnected.
?
W
1.5 SETTING THE LANGUAGE
■ Before using the device, rst choose the language in which
you want the device to display its message.
■ Press the green button to switch the device on.
■ Press the Conguration
button.
■ Press the yellow button on the device corresponding to the
desired language.
8
Power Quality Analyzer PowerPad® III Model 8336
Page 12

2. INTRODUCTION
2.1 DESCRIPTION
The PowerPad® III Model 8336 is a 3-phase network analyzer with a color graphic display and built-in rechargeable
battery. This instrument can be used to:
● Measure the RMS values, powers, and perturbations on electric distribution networks
● Deliver a snapshot of the principal characteristics of a 3-phase network
● Track the variations of various parameters over time
The measurement accuracy of the instrument is better than 1% (not counting the accuracy due to the current sensors).
The instrument is also very exible, with a choice of sensors allowing measurements ranging from a few milliamperes
(MN193) to several kiloamperes (AmpFlex®). The Model 8336 is compact and impact resistant; its ergonomics and
simple interface make it easy to use. The instrument is intended for technicians and engineers responsible for electrical
installation and network inspection and maintenance.
2.2 MEASUREMENTS
The Model 8336 principal measurements are:
■ The RMS values of AC voltages up to 1000V between terminals. By using ratios, the instrument can measure voltages
up to hundreds of gigavolts.
■ The RMS values of AC currents up to 10,000 amperes (neutral included). By using ratios, the instrument can measure
currents up to hundreds of kiloamperes.
■ The DC components of voltages and currents (neutral included).
■ Minimum and maximum half-cycle RMS voltage and current values (excluding neutral).
■ Peak voltage and current values (neutral included).
■ The frequency of 50Hz and 60Hz networks.
■ Current and voltage peak factors (neutral included).
■ Calculation of the harmonic loss factor (FHL), application to transformers in the presence of harmonic currents.
■ Calculation of the K factor (KF), application to transformers in the presence of harmonic currents.
■ Measurement of total harmonic distortion with respect to the fundamental (THD in %f) of the current and of the voltages
(excluding neutral).
■ Measurement of the total harmonic distortion with respect to the RMS AC value (THD in %r) for the current and the
voltages (neutral included)
■ Active, reactive (capacitive and inductive), non-active, distortion, and apparent power, by phase and cumulative
(excluding neutral).
■ Power factor (PF) and displacement factor (DPF or cos Φ (excluding neutral).
■ Measurement of the RMS distortion value (d) for the current and the voltages (excluding neutral).
■ Short-term voltage icker (PST) (excluding neutral).
■ Measurement of the long-term icker of the voltages (PLT) (excluding neutral).
■ Active, reactive (capacitive and inductive), non-active, distortion, and apparent energy (excluding neutral).
■ Current and voltage harmonics (excluding neutral) up to order 50: RMS value, percentage referred to the fundamental,
(%f) (excluding neutral), or the total RMS value (%r), minimum and maximum and sequence harmonics.
■ Apparent harmonic power up to order 50 (excluding neutral): percentages referred to the fundamental apparent power
(%f) or the total apparent power (%r), minimum and maximum of a rank.
■ Inrush currents, starting of motors.
Power Quality Analyzer PowerPad® III Model 8336
9
Page 13

2.3 DISPLAY
■ Waveforms (voltages and currents)
■ Frequency Bar Chart (voltages and currents)
■ Inrush Current Function: displays parameters useful for study of the starting of a motor
● Instantaneous current and voltage at the instant designated by the cursor
● Maximum instantaneous absolute value of the current and of the voltage (over the entire starting time)
● RMS value of the half-cycle (or lobe) of the current and voltage (excluding neutral) on which the cursor is
positioned
● Maximum half-cycle RMS current (over the entire starting time)
● Instantaneous network frequency at the instant designated by the cursor
● Maximum, mean, and minimum network frequencies (over the entire starting time)
● Time at which starting of motor commenced
■ Screen Captures (50 maximum)
■ Transients Function: Detection and recording of transients (up to 210) between user-dened start and stop dates
and times. Recording of four complete cycles (one before the triggering event and three after) on the eight acquisition
channels.
■ Trend Recording (data logging) Function: 2GB memory with date-stamping and user-dened start and stop dates
for recording, with a maximum of 100 recording sessions. Display, in bar chart or graph form, of the means of many
parameters vs. time, with or without minima and maxima.
■ Alarm Function: List recorded alarms (up to 16,000) exceeding thresholds dened in the conguration menu. User-
dened alarm monitoring start and stop times.
2.4 CONFIGURATION
■ Date and time setting
■ Screen brightness setting
■ Graph colors
■ Display management
■ Night mode
■ Calculation methods (non-active quantities broken down or not, choice of the unit of energy, choice of the coefcients
of calculation of the K factor, choice of reference for the level of harmonics, PLT calculation (sliding or not)
■ Distribution system (single-phase, 2-phase, 3-phase with or without neutral) and of the connection method (standard,
2-element method or 2½-element method)
■ Congure recording, alarms, inrush currents, and transients
■ Delete data (total or partial)
■ Display software and hardware version numbers
■ Language
■ Current sensors detected, not detected, not managed, simulated, or impossible to simulate (2-element connection
method). Set voltage and current ratio, transduction ratios, and sensitivity
10
Power Quality Analyzer PowerPad® III Model 8336
Page 14

2.5 OVERALL VIEW
1
2
6
7
8
3
4
?
5
Figure 2-1
Over molded protective case.
1.
Color TFT 320 X 240 (1/4 OFT) display with graphic representation of system parameters and measurements.
2.
Six (6) function buttons used to modify the display mode.
3.
Four (4) function buttons.
4.
ON / OFF button.
5.
Four (4) current input terminals on the top of the instrument to enable the use of current sensors (MN, SR, AmpFlex®,
6.
MiniFlex®, MR, SL and J93 probes). It is possible to use different current probes per input voltage ratio selectable.
Five (5) voltage input terminals (voltage ratio can be set before recording).
9
10
11
7. USB optically isolated output for conguring, running tests and transferring data to a PC.
8. Input for external power supply and battery charging.
Enter button.
9.
Four (4) buttons that enable movement of the cursor, browsing or the selection of data.
10.
Buttons for directly accessing the 6 display modes.
11.
NOTE: Refer to § 8 for function button descriptions.
Power Quality Analyzer PowerPad® III Model 8336
11
Page 15
2.6 ON/OFF BUTTON
4
The Model 8336 can operate on either battery or on AC power. Pressing the button powers up the instrument. If
the instrument is shut OFF suddenly (line power outage in the absence of the battery) or automatically (battery low), an
information message is displayed when it is next started up.
Pressing the button again turns the instrument OFF. If the instrument is recording, metering energy, or searching for
transients, alarms, and/or inrush current acquisition, it requests conrmation.
Select YES or NO on the corresponding yellow buttons, then press the
button to conrm.
● If NO is selected, recording will continue.
● If YES is selected, the data recorded until that point are nalized and the instrument is turned OFF.
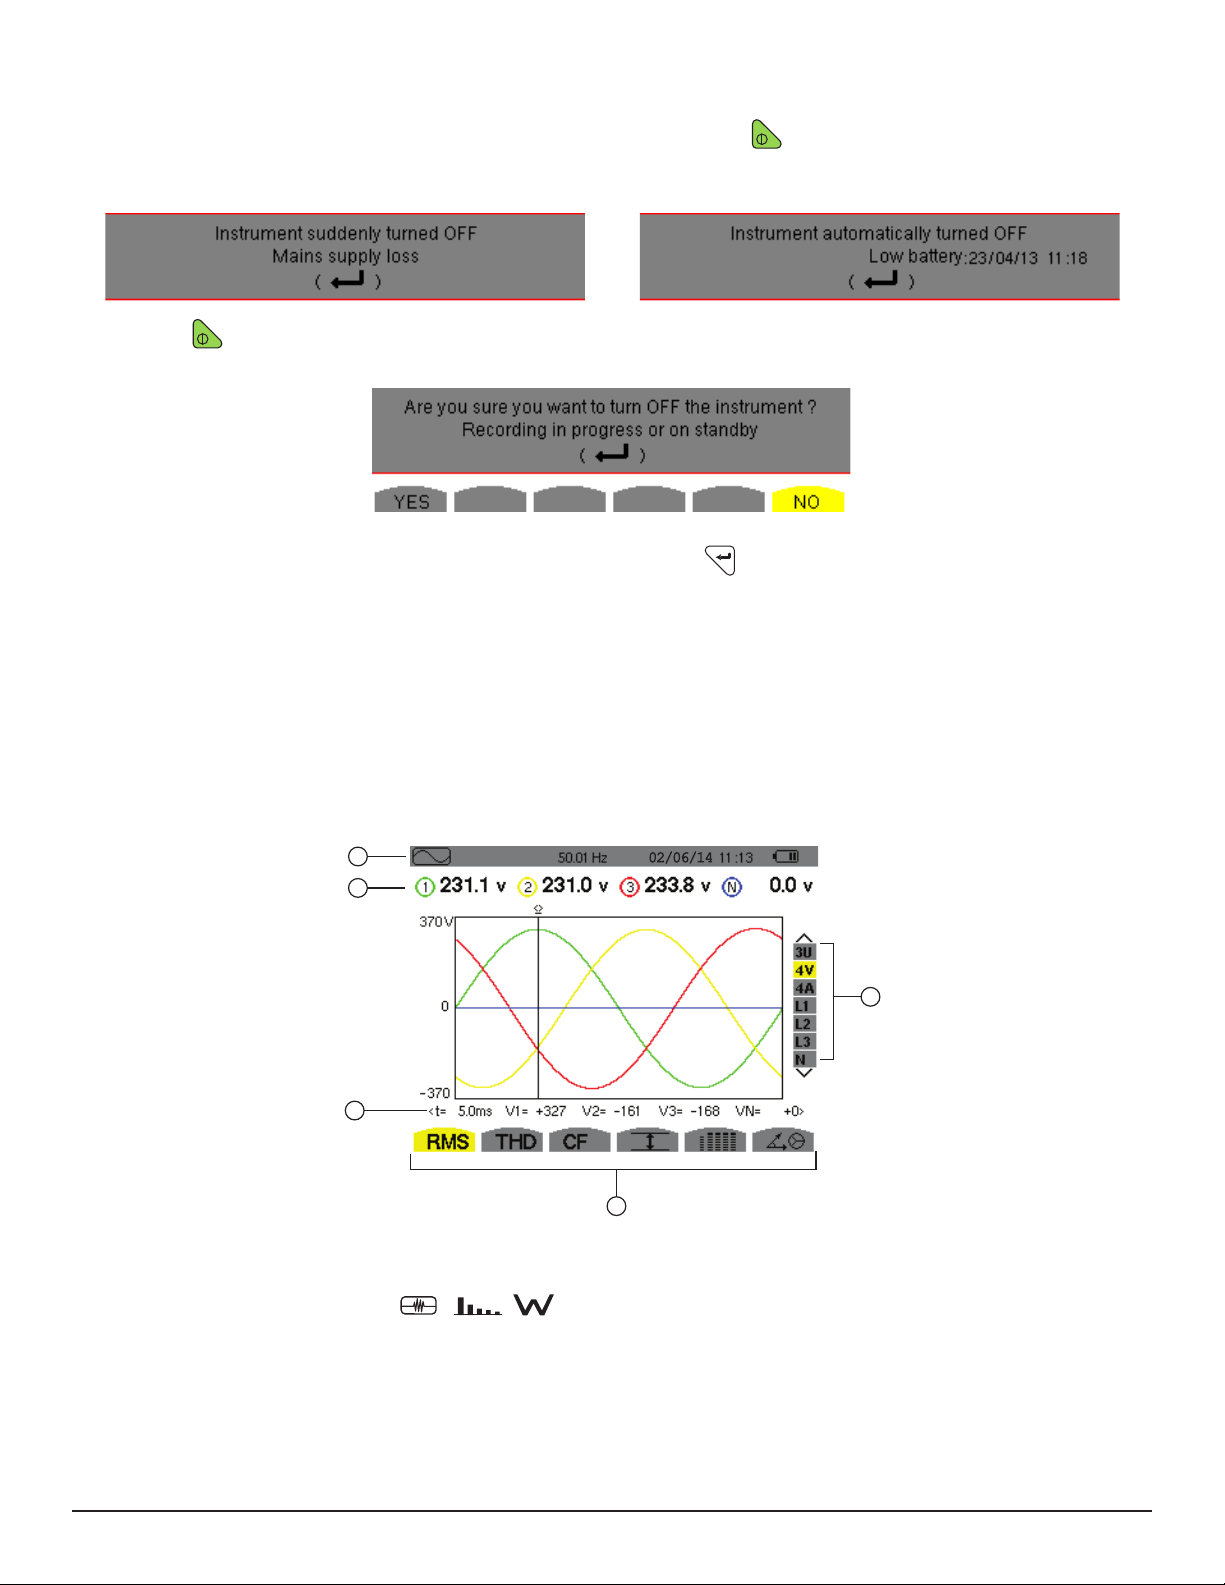
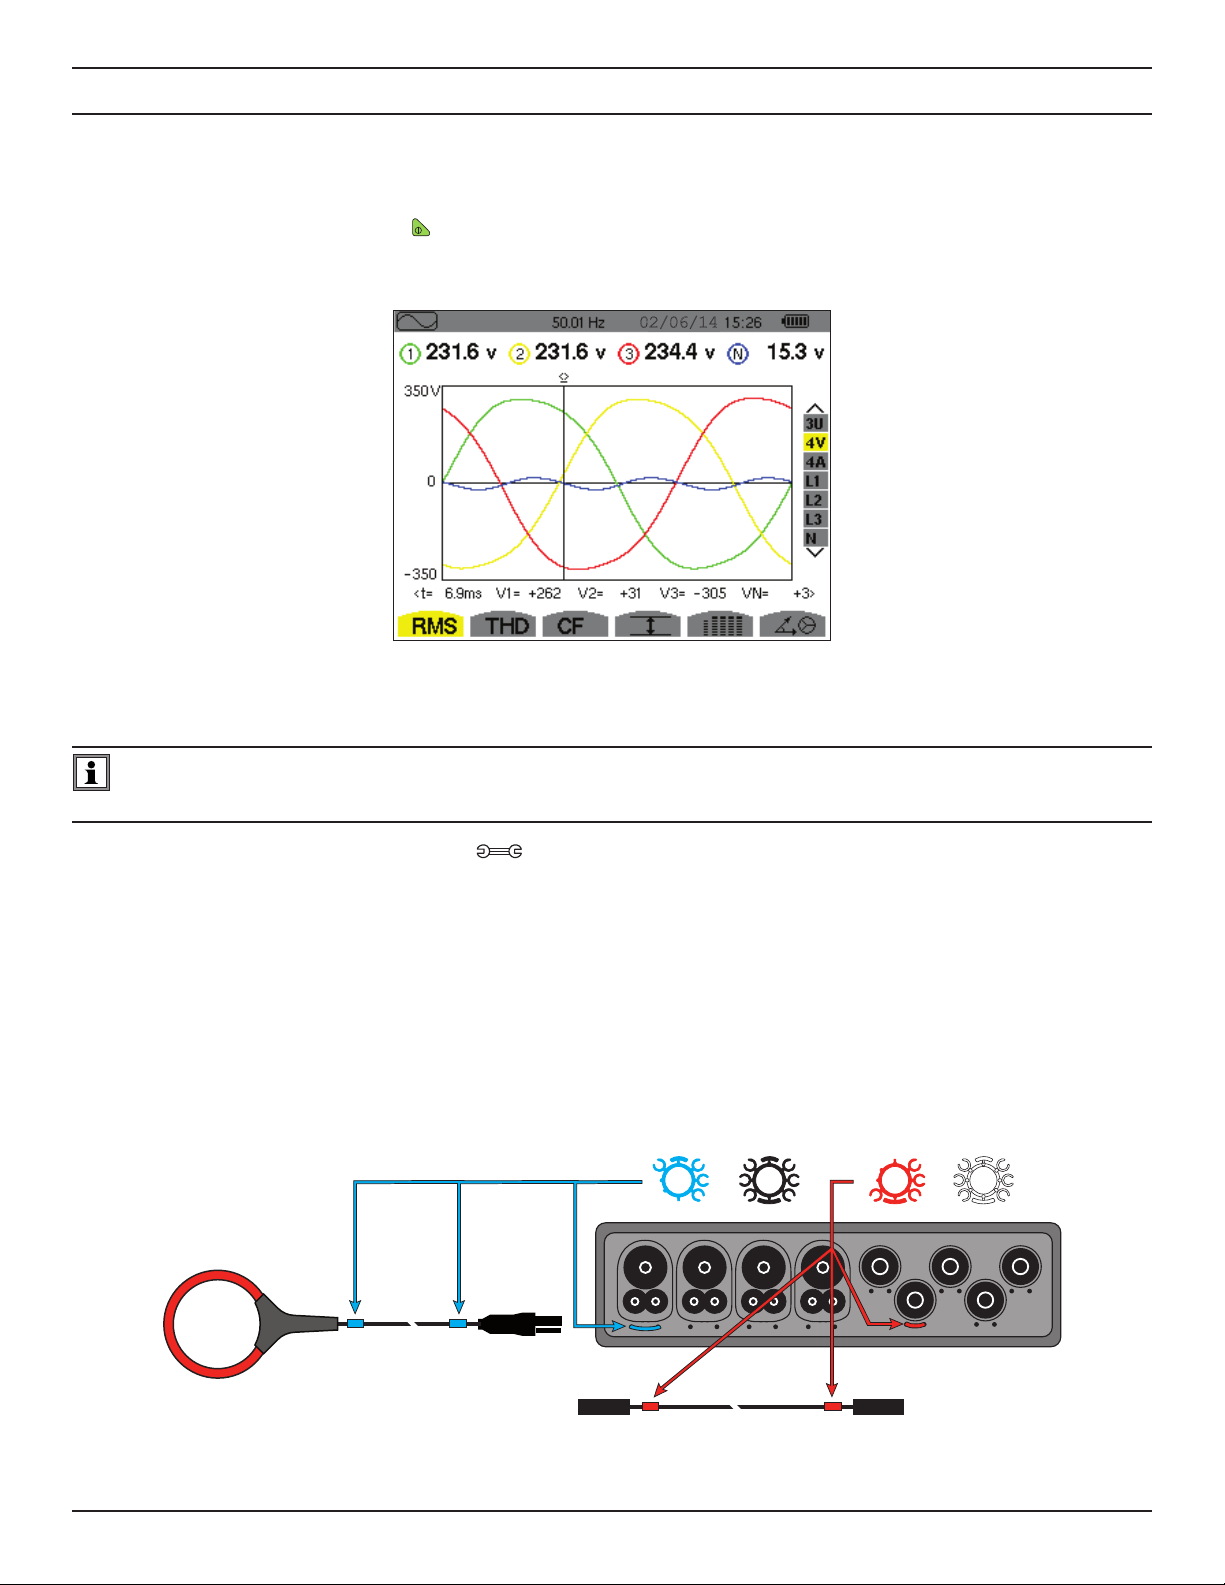
2.7 DISPLAY
The backlit 320x240-pixel (1/4 VGA) graphic TFT screen displays all measurements with their graphs, the parameters of
the unit, the graphs selected, the instantaneous values of the signals, and the type of measurement selected. When the
instrument is powered up, it automatically displays the Waveform screen.
1
2
3
02/06/14
5
1. Top bar on the display, including:
● Symbol of the tested mode ( , , , etc.)
● Frequency of measured signal
● Memory capacity status bar (only available in certain modes)
● Current date and time
● Battery charge status (see § 2.9)
2. Measured RMS values associated with waveforms.
12
Figure 2-2
Power Quality Analyzer PowerPad® III Model 8336
Page 16
3.
Values of signals at an instant “t” at the intersection of cursor and the waveforms. The cursor can be moved along the time
scale by pressing the
◄ and ► buttons
.
4. Measurement selection (refer to § 8).
Calculation of DPF, Tan, KF, Φ, UNB, Min, Max, VAR, Harmonics, PST, and DF parameters and the frequency measurement can only be performed if voltage or current with a frequency of 40 to 70Hz is applied to the Ch1 voltage
input or the A1 current input.
5. Selection of waveforms to be displayed (use the ▲ and ▼ buttons to select):
U: Signies phase-to-phase voltage
V: Signies phase-to-neutral voltage
A: Displays current for each phase
L1, L2, L3: Refer to the phases (A,B,C)
The Auto Power Off function can be turned ON and OFF during instrument conguration (see § 4.1.2.3).
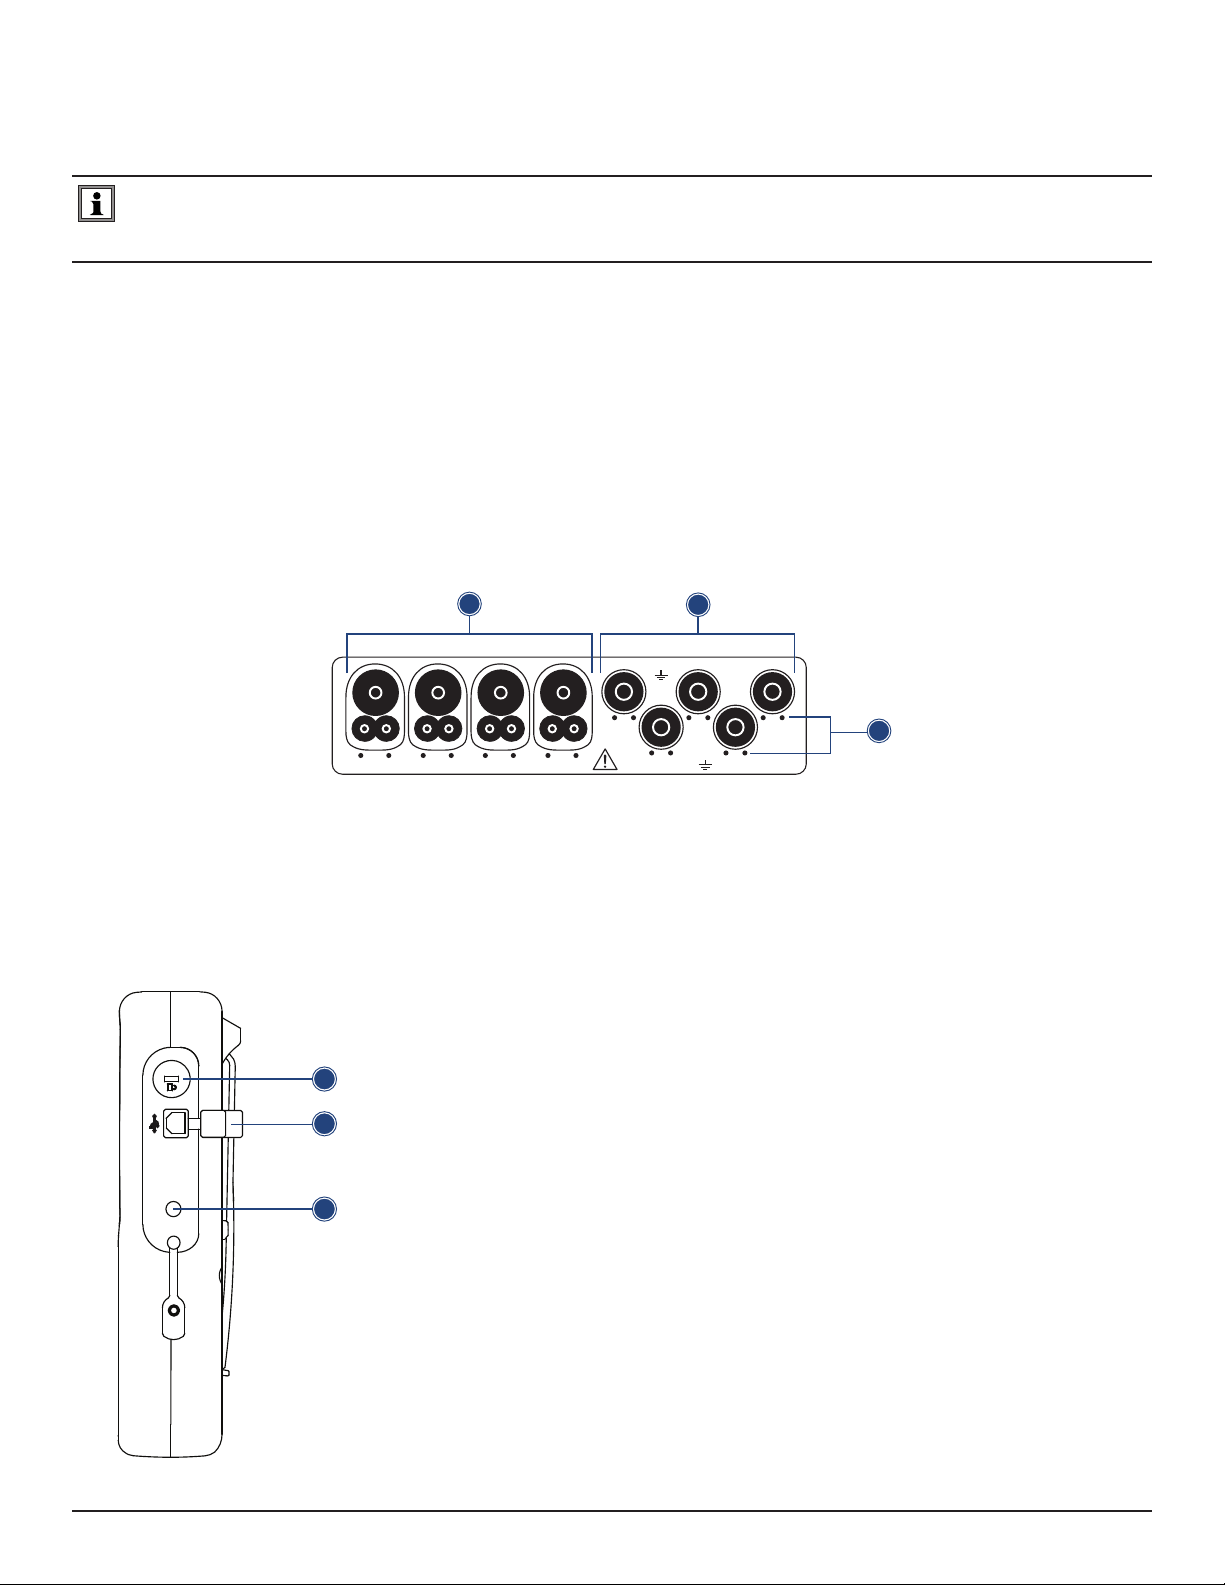
2.8 CONNECTION TERMINALS
1
N/D
L1/A L2/B L3/C N/D 1000V CAT III 600V CAT IV
Figure 2-3
E/GND
2
L1/A
L2/B
L3/C
3
1. Four (4) current input terminals on the top of the instrument to enable the use of current sensors (MN, SR, AmpFlex®,
MiniFlex®, MR, SL & J93 probes).
2. Five (5) voltage input terminals (measures four voltages).
3. Insertion locations for the current and voltage color-coded ID markers.
1. Theft-prevention access port, used to secure the instrument with padlock.
1
2
2. USB connector for connection to a PC.
3. Input for external AC power supply and battery charging.
3
Figure 2-4
Power Quality Analyzer PowerPad® III Model 8336
13
Page 17
2.9 POWER SUPPLY
The battery icon in the top right corner of the screen shows the battery level. The number of bars is proportional to the
charge level.
Icon Battery Charge Status
Battery charged
Low battery
Battery charging
Red bar: Condition of the battery is unknown because it had never been fully charged.
The instrument is connected to AC power using the power cord.
When the capacity of the battery is too low, the following message is displayed:
Low battery
Instrument will soon turn OFF
Press to conrm. The instrument will turn OFF if you do not connect the PowerPad® to AC power (using the power
cord) within one minute of this message appearing.
2.10 STAND
A retractable stand on the back of the Model 8336 can be used to hold the instrument in a tilted position.
Figure 2-5
1. Retractable stand.
2. Battery compartment.
NOTE: The SD card is located under the battery.
1
2
14
Power Quality Analyzer PowerPad® III Model 8336
Page 18
3. USE
02/06/14
3.1 START-UP
To turn the Model 8336 ON, press the button. The button lights up when initially pressed; it then goes OFF if the power
cord is not connected to AC power. During startup, several informational screens appear, displaying data such as the
rmware version and serial number of the instrument. When startup is complete, the Waveform screen is displayed.
Figure 3-1
3.2 CONFIGURATION (SET-UP MODE)
NOTE: The instrument must be congured before each use. The conguration is saved in memory when the instru-
ment is turned OFF.
To display the Conguration screen, press the
NOTE: All congurations can also be modied through DataView® software.
button and follow the instructions in the Conguration chapter (see § 4).
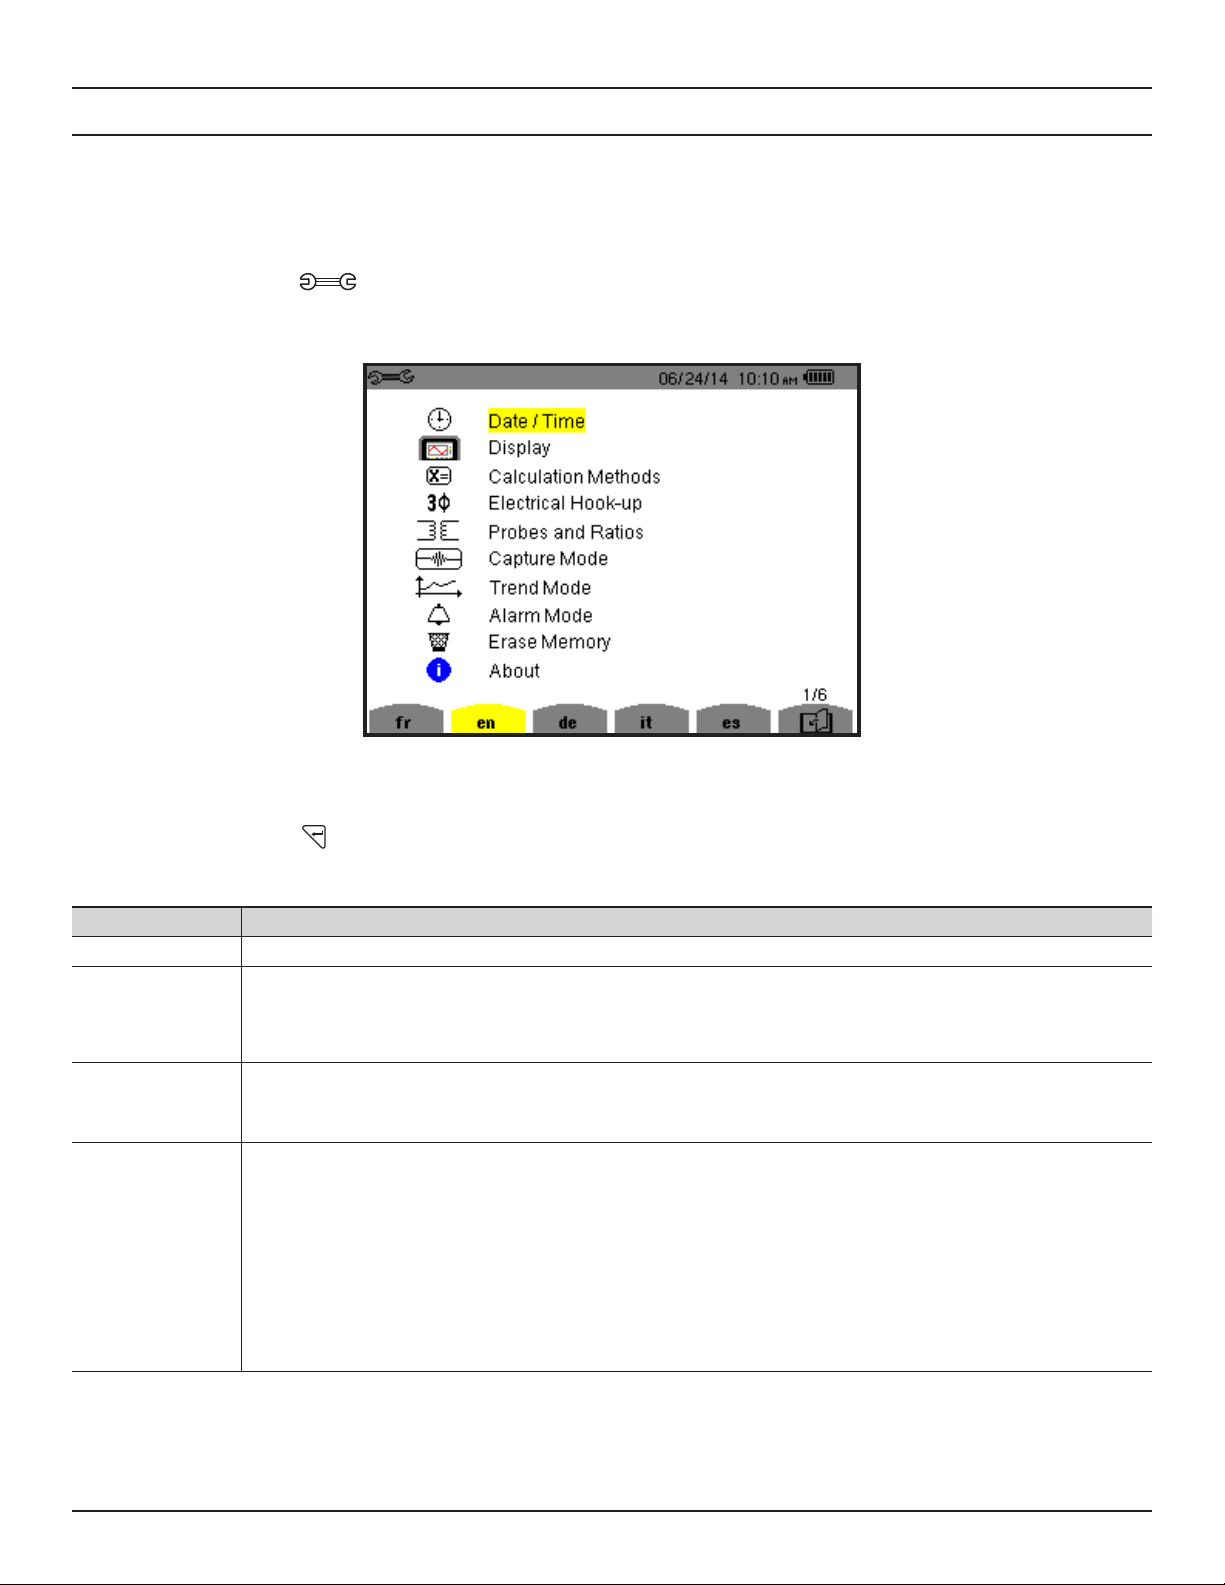
3.3 INSTALLATION OF THE LEADS AND CURRENT SENSORS
Color-coded ID markers are supplied with the PowerPad® to identify the leads and input terminals.
● Detach the appropriate inserts from the color-coded marker and place them in the holes provided under the
terminals (larger inserts for current terminals, smaller inserts for voltage terminals).
● Clip the rings of the same color to the ends of the lead that will connect to the terminal.
● Connect the measurement leads to the terminals of the instrument (see § 2.8).
Power Quality Analyzer PowerPad® III Model 8336
Figure 3-2
15
Page 19

1
2
E/GND
N/D
L1/A L2/B L3/C N/D 1000V CAT III 600V CAT IV
Figure 3-3
L1/A
L2/B
L3/C
3
1. Four (4) current input terminals on the top of the instrument to enable the use of current sensors (MN, SR, AmpFlex®,
MiniFlex®, MR, SL & J93 probes).
2. Five (5) voltage input terminals (measures four voltages).
3. Insertion locations for the current and voltage color-coded ID markers.
NOTE: Remember to dene the transformation ratios of the current sensors and of the voltage inputs (see § 4.1.5).
To make a measurement, the following must be congured and programmed:
■ Calculation method (see § 4.1.3)
■ Electrical hook-up (see § 4.1.4)
■ Ratios of the sensors (see § 4.1.5)
3.3.1 CONNECTION PROCEDURE
1. Turn the instrument ON.
2. Congure the instrument for the measurement to be made and the type of network concerned (see § 4).
3. Connect the leads and current sensors to the unit.
4. Connect the ground and/or neutral lead to the network ground and/or neutral (when it is distributed) and connect the
corresponding current sensor.
5. Connect the L1 phase lead to the network L1 phase and connect the corresponding current sensor.
6. If applicable, repeat the procedure for phases L2 and L3 and for N.
NOTE: Complying with this procedure minimizes connection errors and saves time.
3.3.2 DISCONNECTION PROCEDURE
1. Proceed in the reverse of the order of connection, always nishing by disconnecting the neutral (when distributed).
2. Disconnect the leads and turn the instrument OFF.
16
Power Quality Analyzer PowerPad® III Model 8336
Page 20

3.4 FUNCTIONS
Any screen can be saved (screen snapshot) by pressing the button for three seconds (see § 5.7). You can press the
Help button at any time. The Help screen will inform you about the functions and the symbols used for the current
display mode.
Refer to § 5 for detailed information on the available display modes:
- Waveform Capture
- Harmonics
- Waveform Measurements
- Alarm Recording
- Recording (Trend Mode)
- Power and Energy Measurements
- Screen Snapshot
Power Quality Analyzer PowerPad® III Model 8336
17
Page 21
4. CONFIGURATION
4.1 CONFIGURATION (SET-UP MENU)
The Conguration button
This must be done before each new type of measurement. The conguration settings remain in memory, even after the
instrument is turned OFF.
When working with the Conguration menu, use the arrow buttons (▲ or ▼ or ◄ or ►) to navigate through the menus
and options, then use the button to select and validate your choices.
displays the Conguration menu. This menu enables you to congure the instrument.
Figure 4-1
The Conguration menu allows you to dene the following parameters:
PARAMETER FUNCTION
Date / Time
Display
Calculation
Methods
Electrical Hook-Up
Sets the date and time format (see § 4.1.1)
Adjusts the contrast and brightness of the display (see § 4.1.2.1)
Defines the color of the voltage and current curves (see § 4.1.2.2)
Defines the settings for Auto Power Off (see § 4.1.2.3)
Enables/Disables Night mode settings (see § 4.1.2.4)
Determines if harmonics are used or not used in calculations of reactive quantities (power and energy) - (see § 4.1.3)
• With harmonics: Harmonics are taken into account when calculating reactive parameters
• Without harmonics: Only the fundamental part is used for the calculation of reactive parameters
Determines the type of connection to the network (see § 4.1.4)
• 1-Phase 2-Wire
• 1-Phase 3-Wire
• 2-Phase 2-Wire
• 2-Phase 3-Wire
• 2-Phase 4-Wire
• 3-Phase 3-Wire
• 3-Phase 4-Wire
• 3-Phase 5-Wire
18
Power Quality Analyzer PowerPad® III Model 8336
Page 22
Probes and Ratios
Defines the type of current probe to connect (see § 4.1.5)
• MN93: 200A
• MN193: 100A or 5A (with variable ratio)
• SR193: 1000A
• SL261: 10A and 100A range
• AmpFlex® Sensors: 3000A (measures up to 10kA)
• MiniFlex® Sensors: 3000A
• MR193: 1000AAC/1200ADC
• J93: 3500AAC/5000ADC
• 5A 3-phase adapter (3-channel only)
Capture Mode
Trend Mode
Configures the voltage and current thresholds (see § 4.1.6)
Selects the parameters to record (see § 4.1.7)
(Up to four configurations)
Alarm Mode
Erase Memory
About
Defines the parameters of an alarm (see § 4.1.8)
Deletes configurations, alarm settings, snapshots, and recordings (see § 4.1.9)
Displays the serial number, software and hardware version (see § 4.1.10)
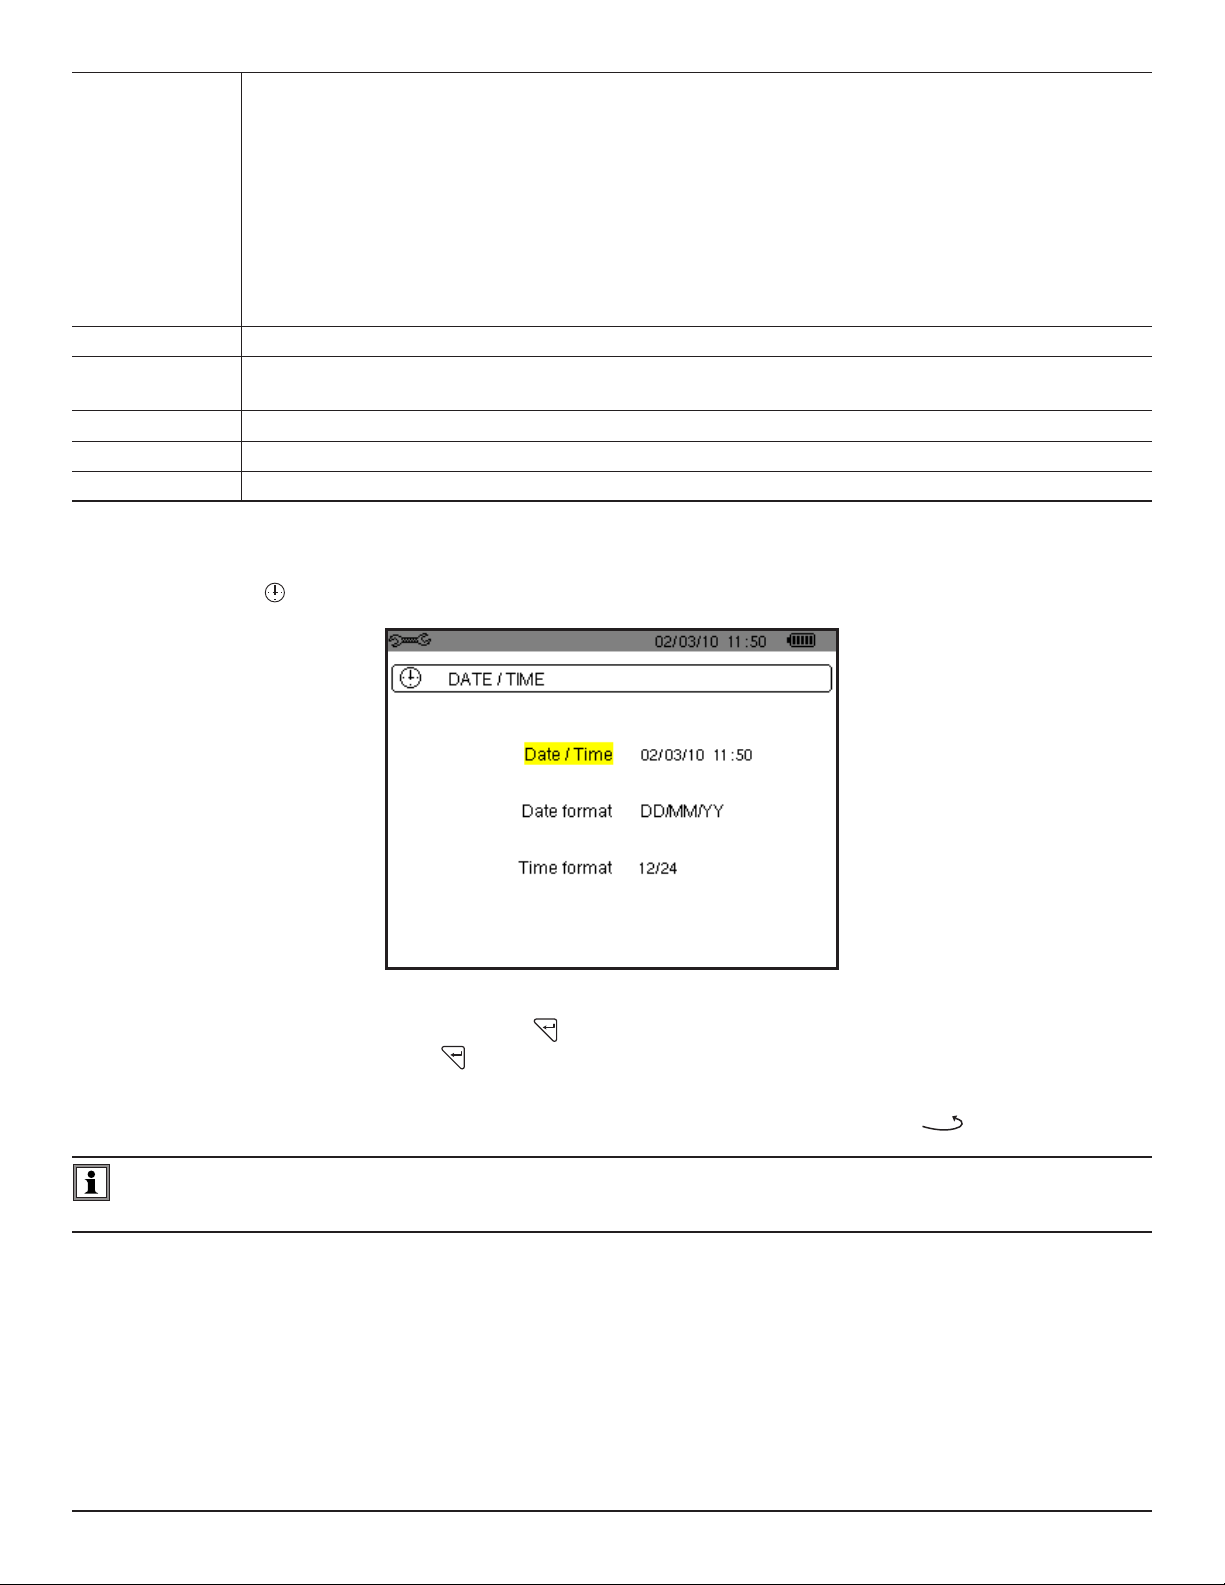
4.1.1 DATE/TIME
The Date/Time menu denes the system date and time. The display is as follows:
Figure 4-2
With the Date/Time eld highlighted in yellow, press . To change a value, press ▲ or ▼. To move from one eld to
another, press ◄ or ►. To conrm, press .
Proceed in the same way for selecting data format (DD/MM/YY or MM/DD/YY) and time format (12/24 or AM/PM).
Changes take effect immediately in the data display. To return to the Conguration menu, press
NOTE: The date and time parameters cannot be congured while the instrument is recording, metering energy, or
searching for transients, alarms, and/or inrush current acquisition.
Power Quality Analyzer PowerPad® III Model 8336
.
19
Page 23
4.1.2 DISPLAY
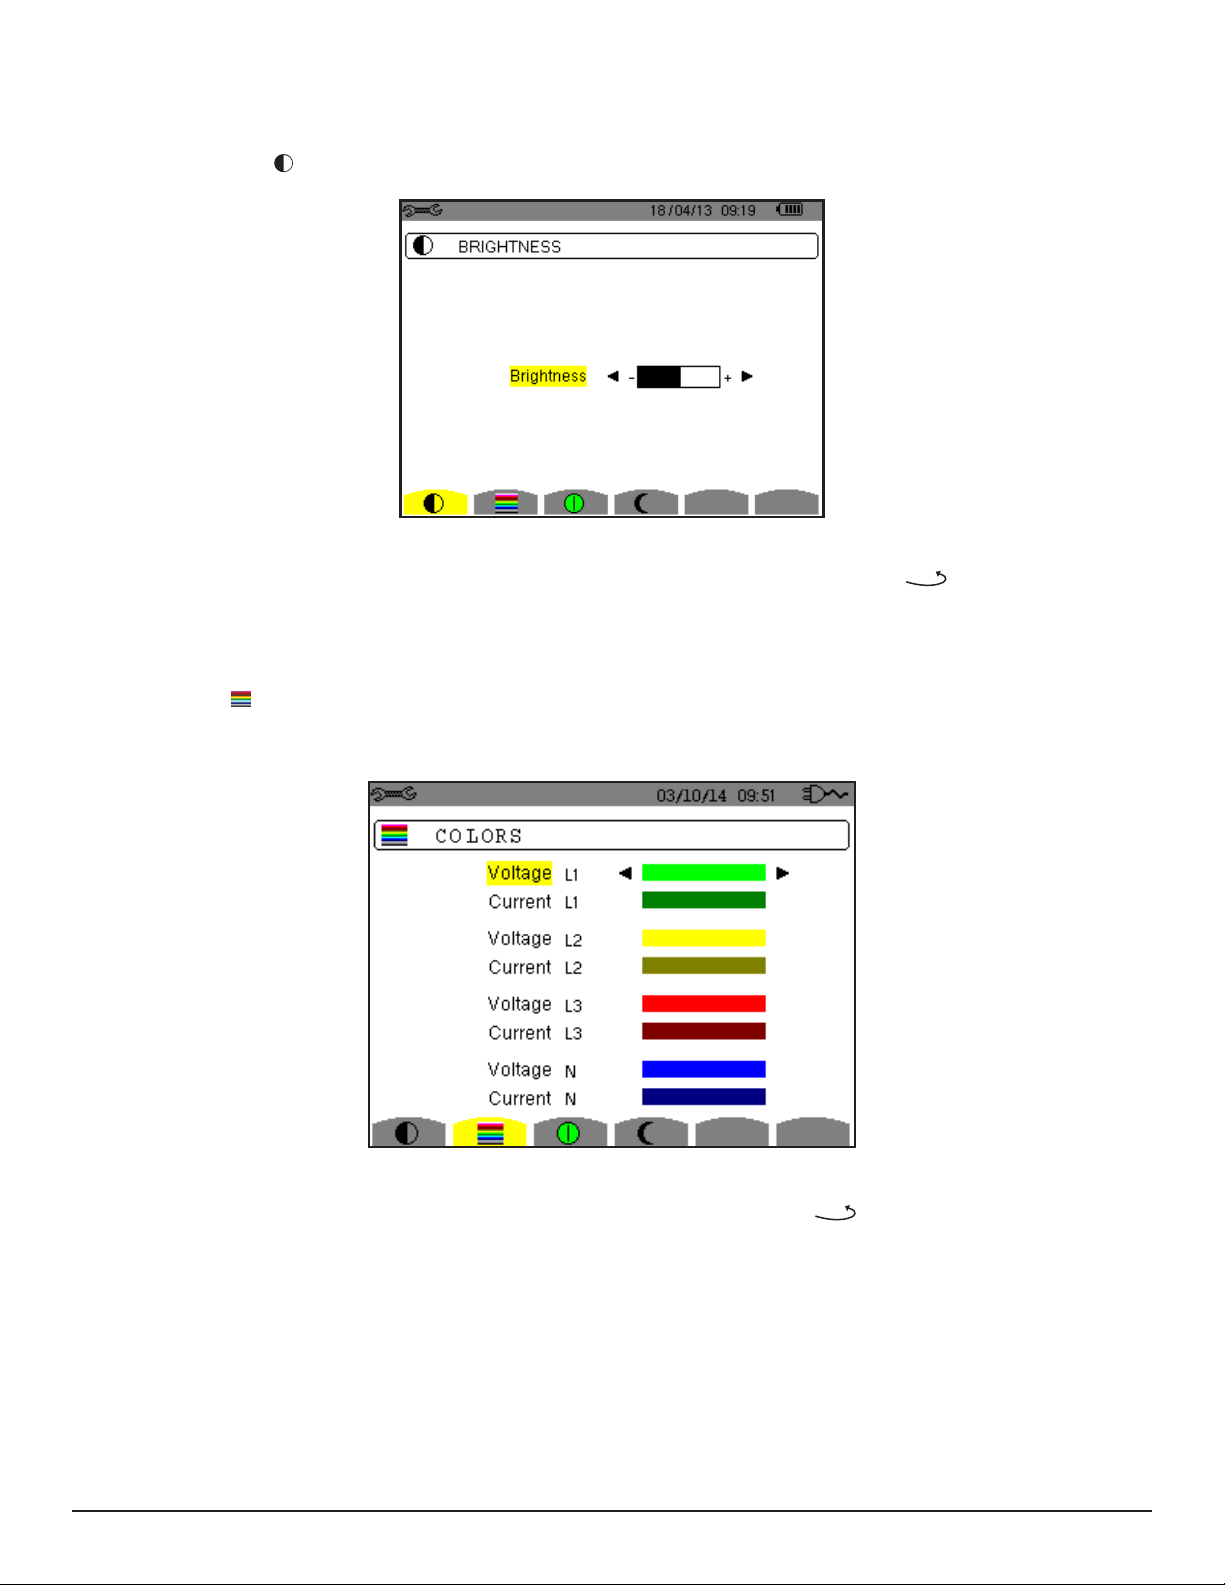
4.1.2.1 BRIGHTNESS
The Brightness button initiates a menu that sets the brightness of the display.
Figure 4-3
Use the ◄ or ► buttons to change the brightness. To return to the Conguration menu, press
.
4.1.2.2 COLORS
The Colors menu is used to dene the colors of the voltage and current traces on the graph. There are 15 colors
available: green, dark green, yellow, orange, pink, red, brown, blue, turquoise blue, dark blue, light grey, grey, dark grey,
and black.
Figure 4-4
Use the arrow buttons to change colors. To return to the Conguration menu, press
20
Power Quality Analyzer PowerPad® III Model 8336
Page 24
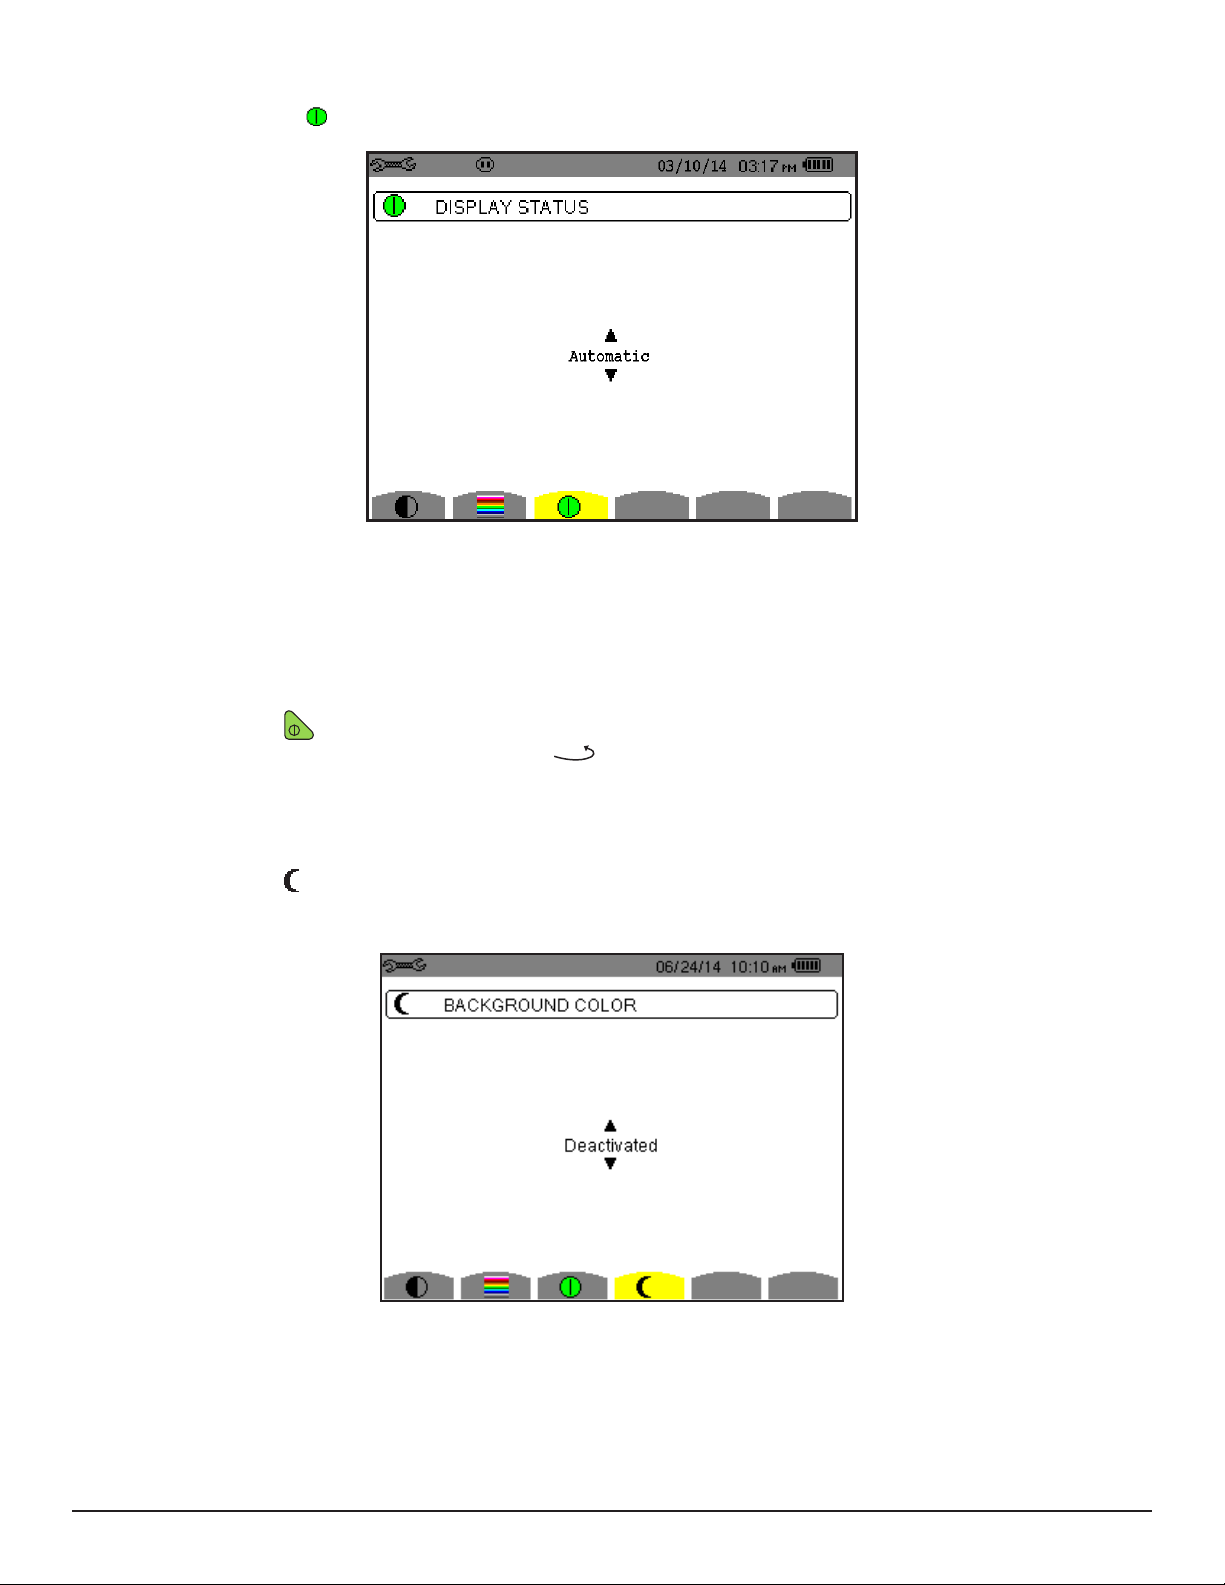
4.1.2.3 DISPLAY SHUTDOWN
The Display Status button displays a menu that denes the display shutdown process.
Figure 4-5
Use the ▲ and ▼ buttons to choose Automatic or Never.
■ In Automatic mode the display turns OFF automatically after:
● 5 minutes of inactivity when the instrument is powered by the battery and a recording is in progress.
● 10 minutes if no recording is in progress.
■ The ON/OFF button blinks to indicate that the instrument is still in operation. Press any button to relight the
display. To return to the Conguration menu, press
.
4.1.2.4 BACKGROUND COLOR (NIGHT MODE)
The Night mode button displays a menu that initiates night mode on the display.
In night mode, the screen displays “reverse” video and all colors are changed.
Figure 4-6
Use the ▲ and ▼ buttons to activate or deactivate night mode.
Power Quality Analyzer PowerPad® III Model 8336
21
Page 25
4.1.3 CALCULATION METHODS
X
=
The Calculation Methods menu
denes:
■ Breakdown or no breakdown of the non-active quantities
■ Unit of energy
■ Reference for the level of harmonics of the phases
■ Coefcients of calculation for the K factor
■ Method of calculation of the long-term icker
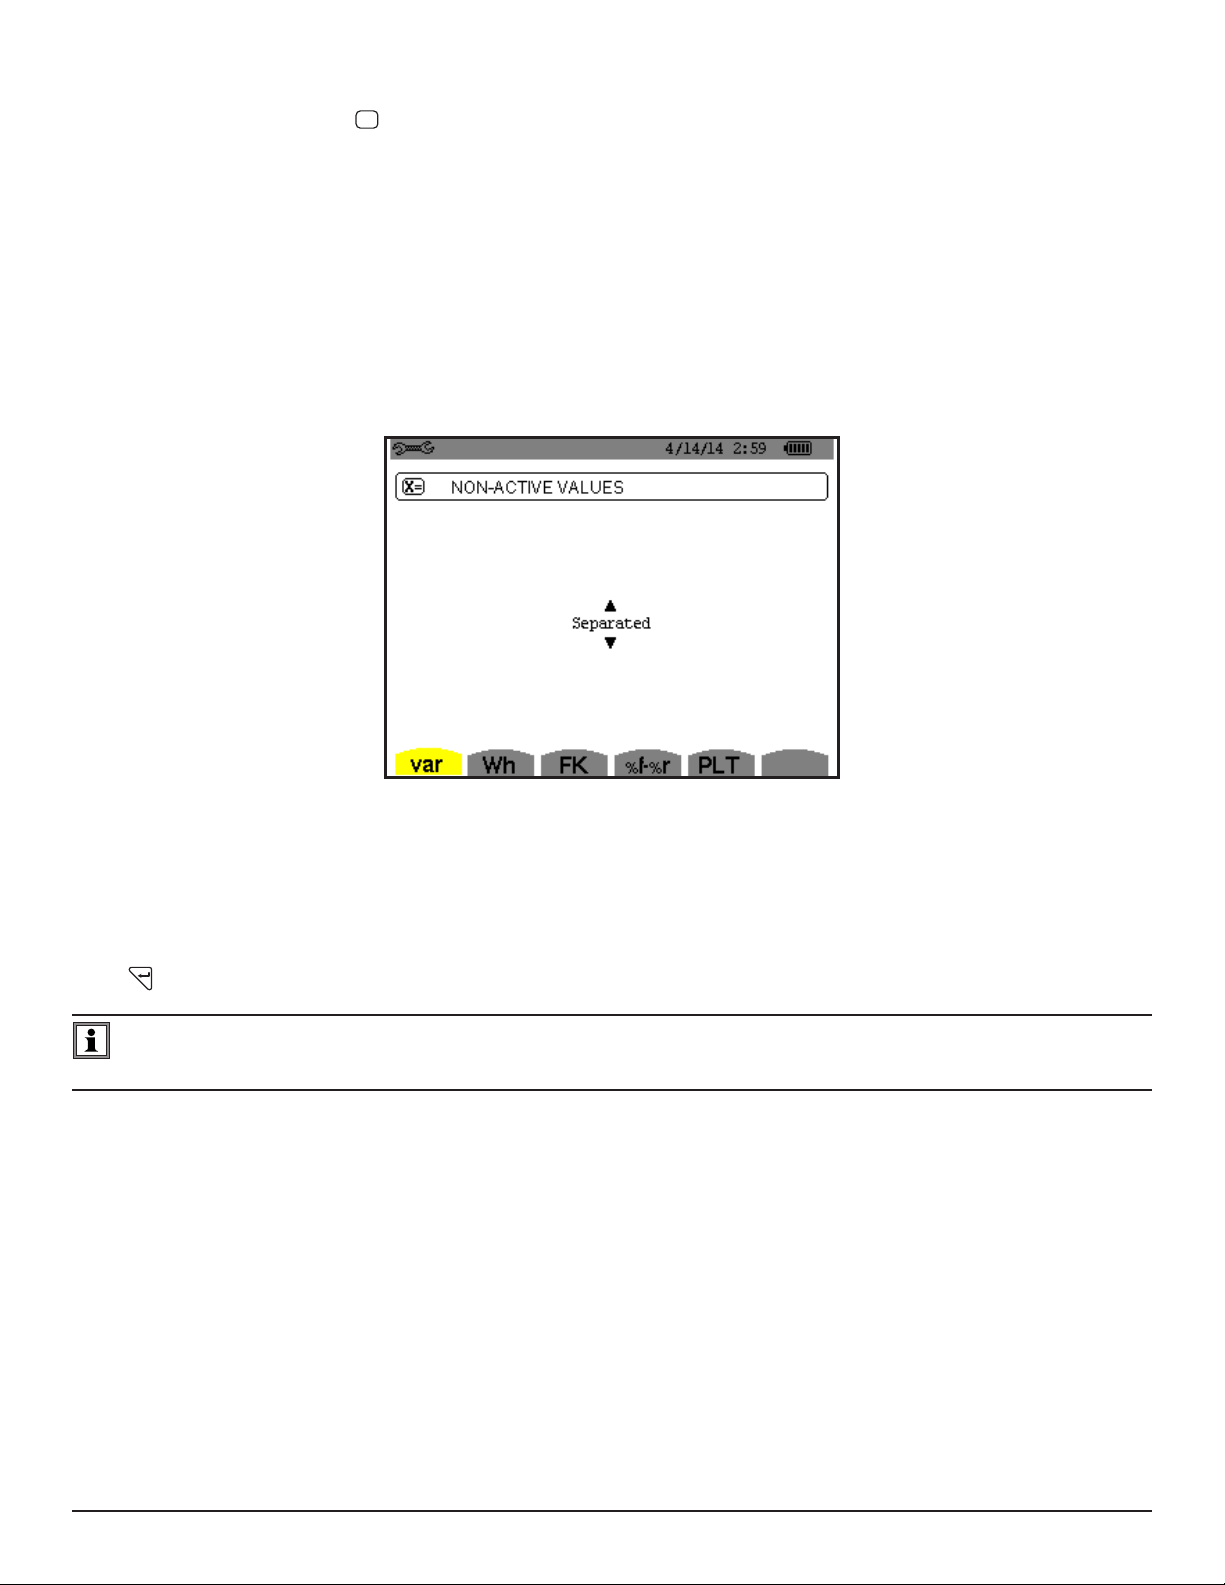
4.1.3.1 NON-ACTIVE QUANTITIES
The var menu is used to choose whether to separate or combine the non-active quantities (power and energy).
Figure 4-7
Use the ▲ and ▼ buttons to select Separated or Combined.
■ Separated: Non-active power N is separated into reactive power (fundamental) Q1 and distorting power D. Non-active
energy Nh is separated into Q1h and Dh.
■ Combined: Non-active power N and non-active energy Nh are displayed.
Press to conrm the selection and return to the Conguration menu.
NOTE: This setting cannot be modied when the instrument is recording, metering energy, and/or searching for
alarms.
22
Power Quality Analyzer PowerPad® III Model 8336
Page 26
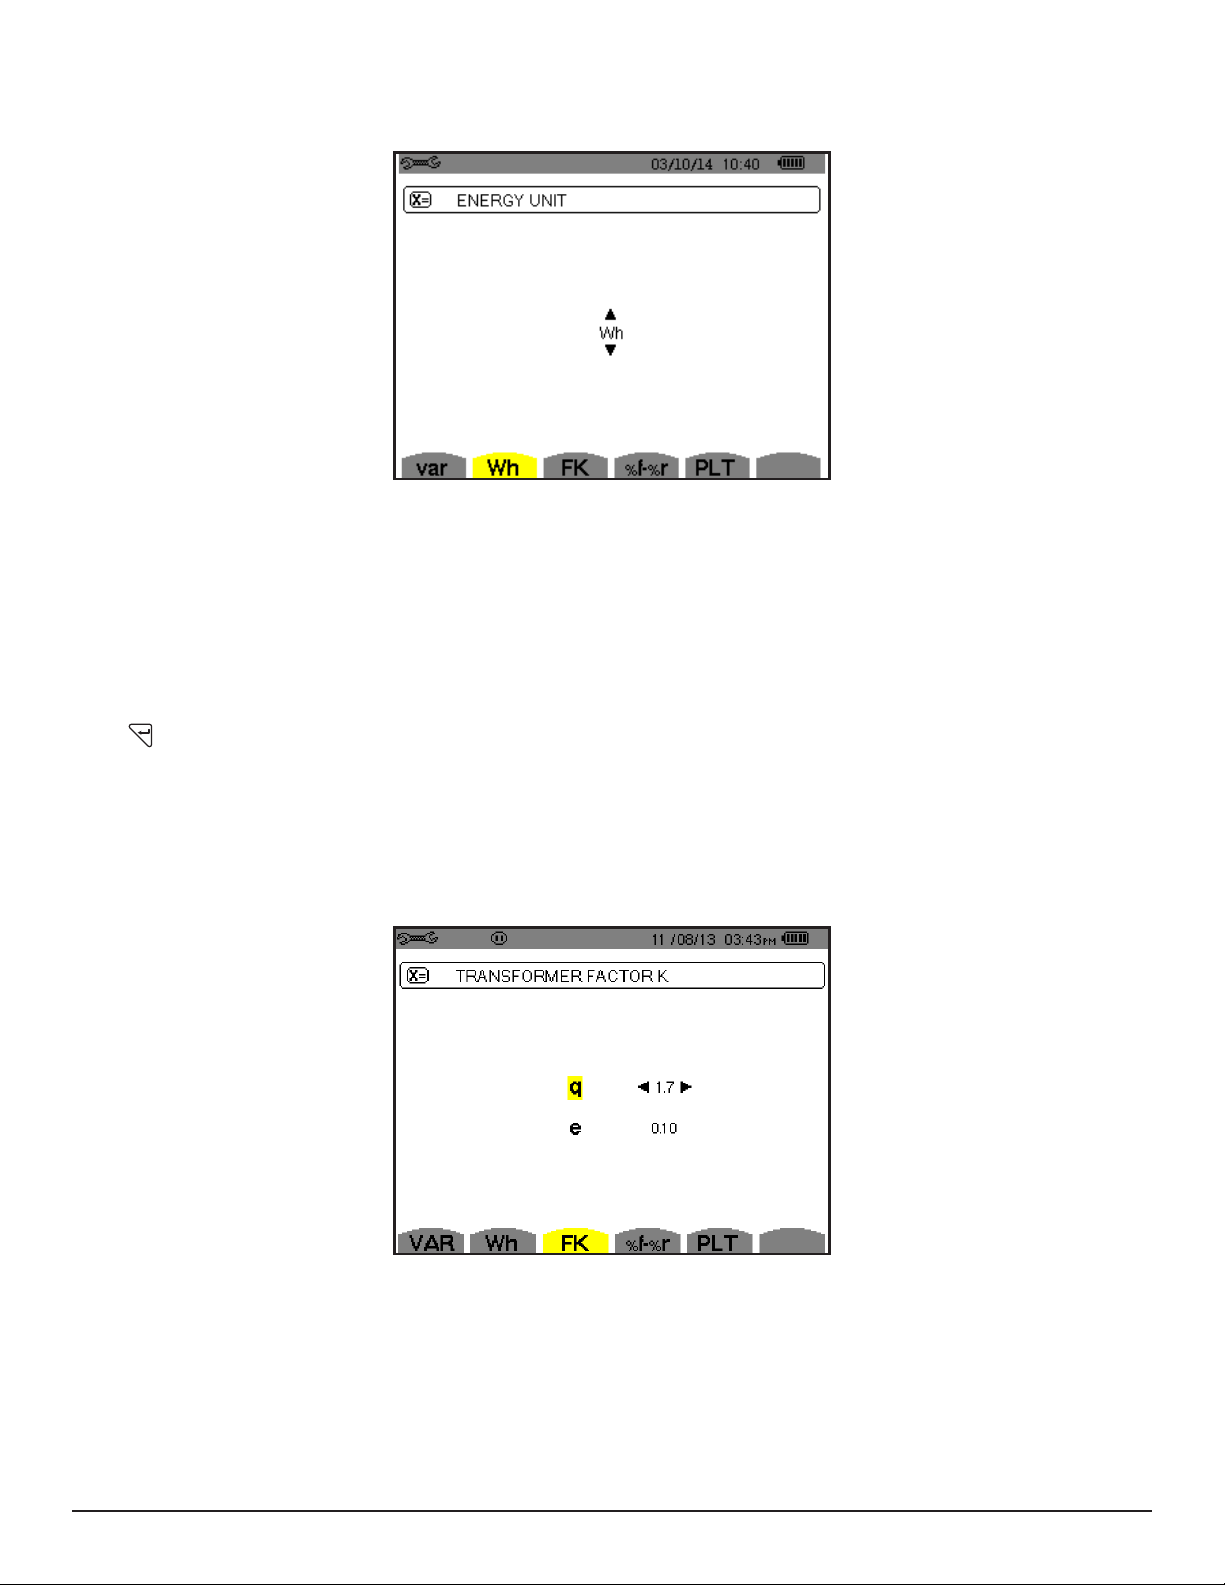
4.1.3.2 UNIT OF ENERGY
The Wh menu denes the unit of energy for displayed data.
Figure 4-8
Use the up and down arrow buttons to select the unit:
● Wh: watt-hour
● J: joule
● toe (nuclear): nuclear tonne oil equivalent
● toe (non-nuclear): non-nuclear tonne oil equivalent
● BTU: British Thermal Unit
Press to conrm the selection and return to the Conguration menu.
4.1.3.3 K FACTOR
The FK menu denes the coefcients used for the calculation of the K factor (Factor K). This value is used for weighting
the harmonic load currents in accordance with their effects on transformer heating. A higher K factor indicates larger
harmonic heating effects.
Figure 4-9
Use the arrow buttons to set the value of coefcients q and e:
● q: exponential constant that depends on the type of winding and the frequency. The value of q can range from
1.5 to 1.7. The value of 1.7 is suitable for transformers having round or square conductors, in all types of winding.
The value of 1.5 is suitable for those in which the low-voltage windings are in tape form.
● e: ratio between the losses linked to eddy currents (at the fundamental frequency) and resistive losses (both
evaluated at the reference temperature). The value of e can range from 0.05 to 0.1.
Power Quality Analyzer PowerPad® III Model 8336
23
Page 27

The default values (q = 1.7 and e = 0.10) are suitable for most applications.
Press to conrm the selection and return to the Conguration menu.
NOTE: This setting cannot be modied when the instrument is recording, and/or searching for alarms.
4.1.3.4 PHASE HARMONIC RATIOS
The %f-%r Phase Harmonics menu denes the reference for the level of harmonics of the phases.
Figure 4-10
Use the ▲ and ▼ buttons to select the reference for the level of harmonics:
● %f: the reference is the value of the fundamental
● %r: the reference is the total value
For harmonics of the V-h, A-h, and U-h phases, the fundamental and total values are RMS values. For harmonics of the
S-h phases, the fundamental and total values are apparent power values.
Press to conrm the selection and return to the Conguration menu.
NOTE: This setting cannot be modied when the instrument is recording, and/or searching for alarms.
4.1.3.5 LONG-TERM FLICKER
The PLT menu denes the method used to calculate long-term icker. This screen denes whether a xed or sliding
window is used to calculate long-term icker (rapid uctuations in the power supply).
24
Figure 4-11
Power Quality Analyzer PowerPad® III Model 8336
Page 28

Use the ▲ and ▼ buttons to choose sliding or non-sliding.
L1
L2
L3
N
V1V2
3V
V2V3
V3V1
ELECTRICAL HOOK-UP
3-phase 5-wire
3Φ
03/10/14 10:26
am
L1
L1
● Sliding: The PLT is calculated every 10 minutes. The rst value is available 2 hours after the instrument is
switched on because it takes 12 values of PST to calculate the PLT.
● Non-sliding: The PLT is calculated every 2 hours.
Press to conrm the selection and return to the Conguration menu.
NOTE: This setting cannot be modied when the instrument is recording, and/or searching for alarms.
4.1.4 ELECTRICAL HOOK-UP
The menu is used to dene how the Model 8336 is connected, according to the type of network.
Figure 4-12
Several electrical diagrams can be selected. Use the arrow buttons to choose a connection. One or more types of network
correspond to each distribution system.
These connection choices allow you to connect the instrument to all existing networks.
Press to conrm the selection and return to the Conguration menu.
NOTE: This setting cannot be modied when the instrument is recording, and/or searching for alarms.
Distribution System Source
Single-phase 2-wire (L1 and N)
L1
N
Single-phase 2-wire non-grounded neutral
Single-phase 3-wire (L1, N and ground)
L1
N
Single-phase 3-wire grounded neutral
N
N
GND
Power Quality Analyzer PowerPad® III Model 8336
25
Page 29
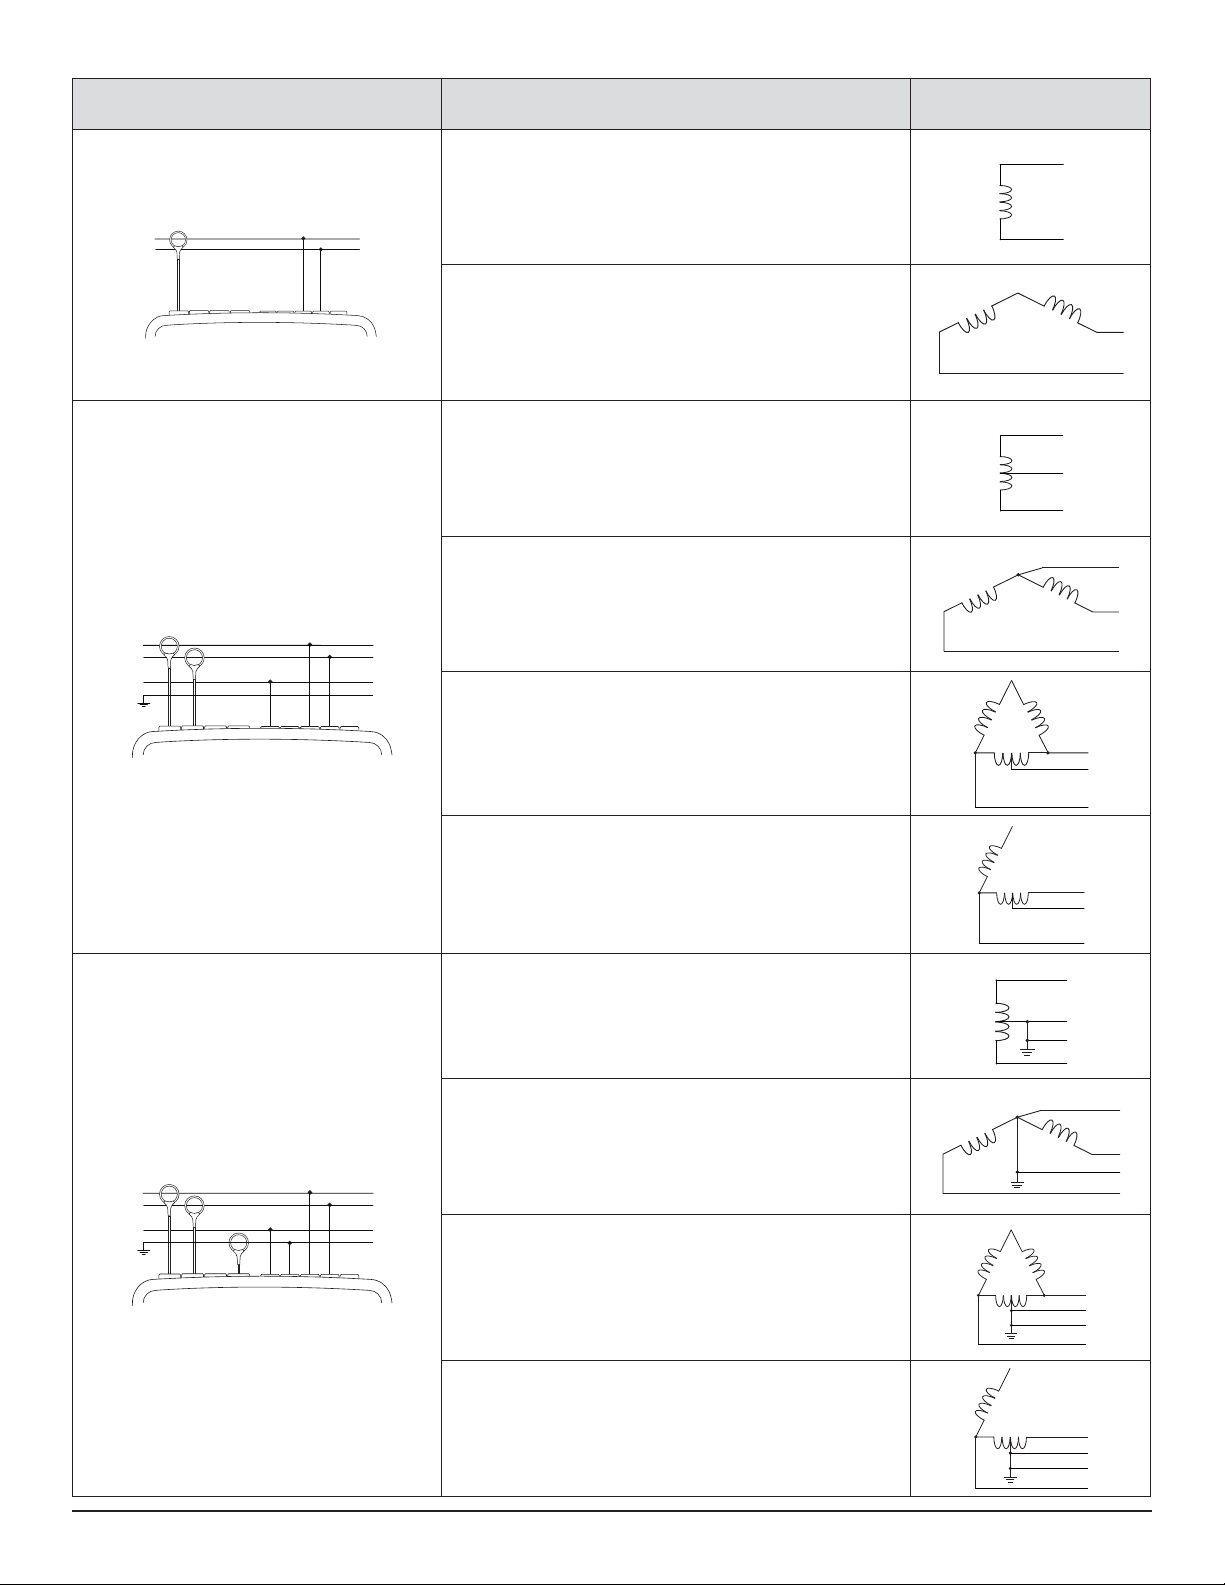
Distribution System Source
L1
L2
L1
N
L1
N
Split-phase 2-wire (L1 and L2)
L1
L2
Split-phase 3-wire (L1, L2 and N)
L1
L2
N
Split-phase 2-wire
3-phase open star 2-wire
Split-phase 3-wire non-grounded neutral
3-phase open star 3-wire non-grounded neutral
3-phase high leg delta 3-wire non-grounded neutral
L2
L1
N
L2
L1
L2
L1
N
Split-phase 4-wire (L1, L2, N and ground)
L1
L2
N
3-phase open high leg delta 3-wire non-grounded neutral
Split-phase 4-wire grounded neutral
3-phase open star 4-wire grounded neutral
3-phase high leg delta 4-wire grounded neutral
N
GND
L2
GND
L2
L1
N
L2
L1
GND
L2
L1
N
L2
3-phase open high leg delta 4-wire grounded neutral
26
Power Quality Analyzer PowerPad® III Model 8336
GND
L1
N
L2
Page 30
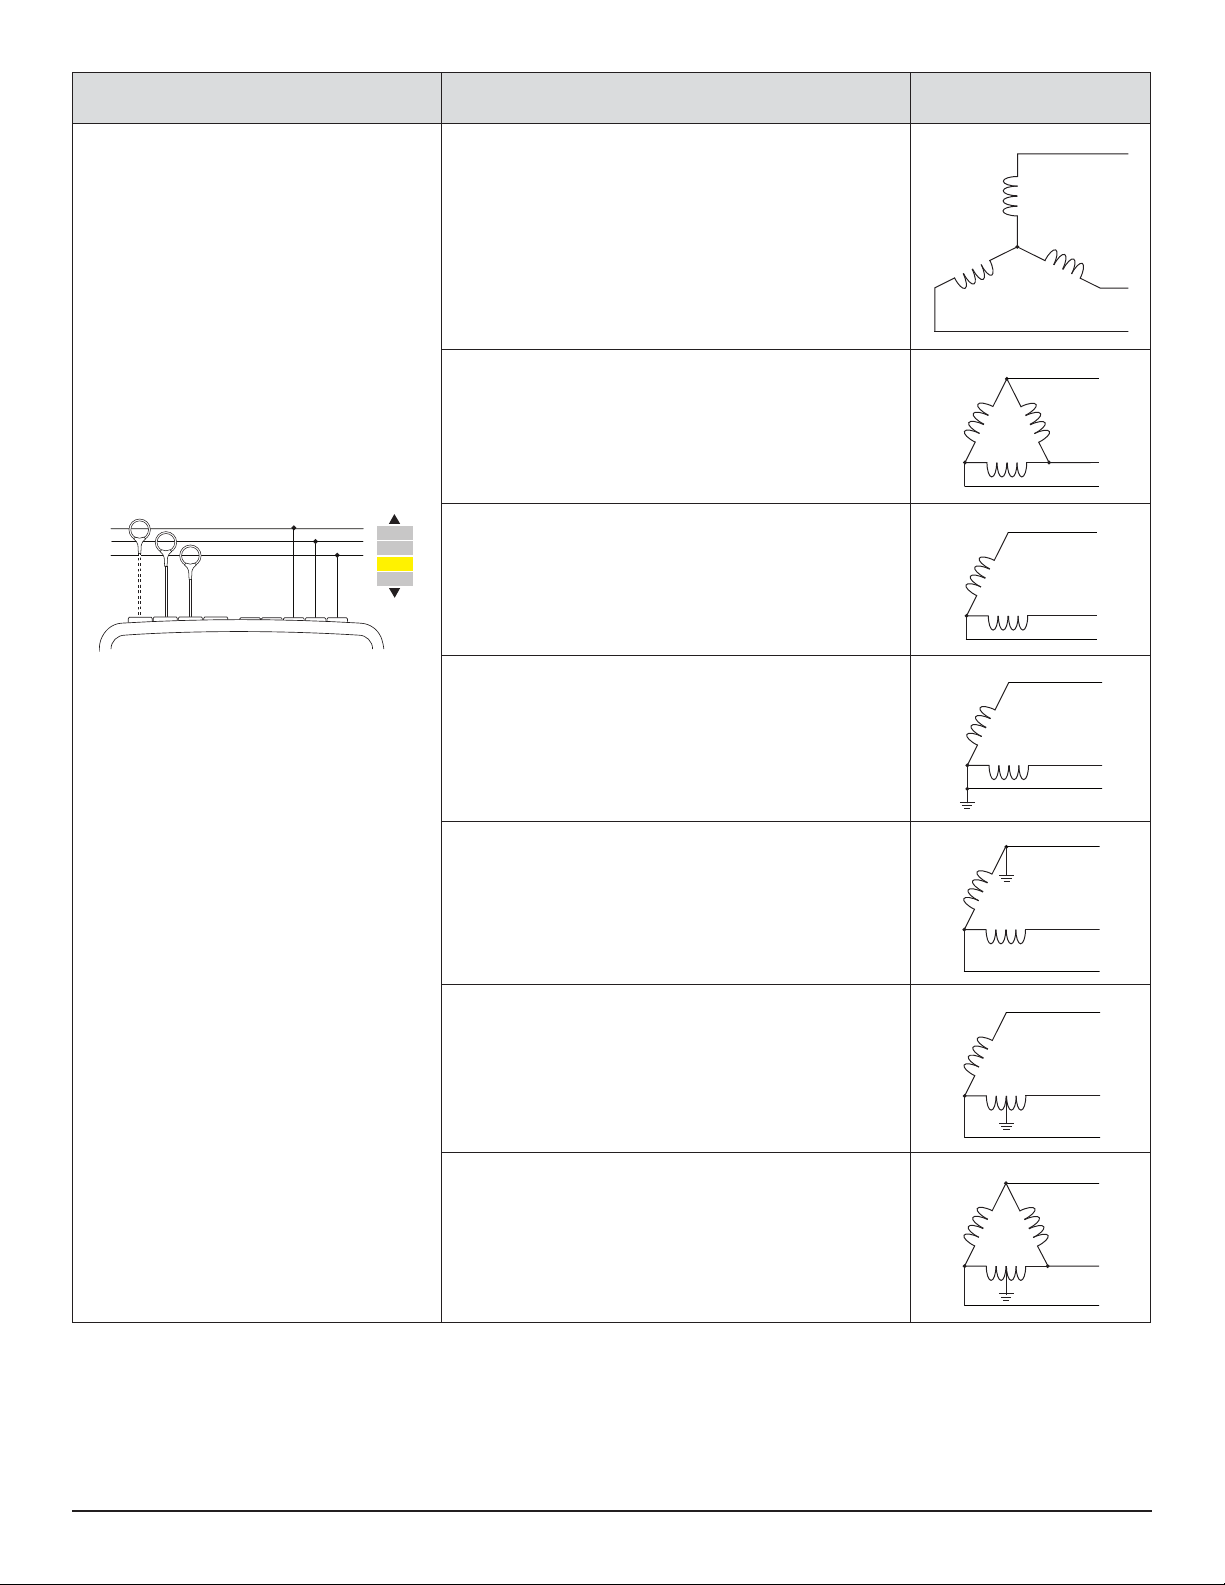
Distribution System Source
L3
L3
L3
L3
3-phase star 3-wire
3-phase delta 3-wire
3-phase 3-wire (L1, L2 and L3)
L1
L2
L1
L2
L1
L2
L3
3A
A1A2
A2A3
A3A1
Indicates which 2 current sensors will be
connected: A1 and A2, or A2 and A3,
or A3 and A1.
Two-wattmeter method or two-element
method or Aron method.
The third sensor is not necessary if the
other two are of the same type, same
range, and same ratio. Otherwise, the third
sensor must be connected to make current
measurements.
L3
3-phase open delta 3-wire
L1
L2
3-phase open delta 3-wire grounded junction of phases
L1
L2
3-phase open delta 3-wire grounded corner of phase
L1
L2
L3
3-phase high leg delta 3-wire
L1
Power Quality Analyzer PowerPad® III Model 8336
3-phase open high leg delta 3-wire
L2
L3
L1
L2
27
Page 31

Distribution System Source
L3
L3
L3
L3
L3
L3
3-phase 4-wire (L1, L2, L3 and N)
L1
L2
L3
N
3V
V1V2
V2V3
V3V1
Indicates which voltages will be connected:
all 3 (3V) or only 2 (V1 and V2, or V2 and
V3, or V3 and V1).
If only two of the three voltages are con-
nected, the three phase voltages must be
balanced (2½-element method)
3-phase star 4-wire non-grounded neutral
3-phase open high leg delta 4-wire non-grounded neutral
3-phase high leg delta 4-wire non-grounded neutral
N
L1
L2
L1
N
L2
L1
N
L2
3-phase 5-wire (L1, L2, L3, N and ground)
L1
L2
L3
N
3V
V1V2
V2V3
V3V1
Indicates which voltages will be connected:
all 3 (3V) or only 2 (V1 and V2, or V2 and
V3, or V3 and V1).
If only two of the three voltages are con-
nected, the three phase voltages must be
balanced (2½-element method)
3-phase star 5-wire grounded neutral
3-phase open high leg delta 5-wire grounded neutral
3-phase high leg delta 5-wire grounded neutral
N
L1
GND
L2
L1
N
GND
L2
L1
N
GND
L2
28
Power Quality Analyzer PowerPad® III Model 8336
Page 32

4.1.5 PROBES AND RATIOS
4.1.5.1 CURRENT PROBES
The screen denes the current probes and ratios.
This menu enables you to dene
■ Current probes (press A)
■ Current ratios (press V or U, depending on set-up)
Figure 4-13
Press A to dene the current probes and ratios. This displays the current probe models detected by the instrument. If a
probe is detected but not managed, an error message is displayed.
For a 3-wire 3-phase set-up where only two of the three current sensors required are connected, if these two sensors are
of the same type and have the same ratio, the instrument simulates the third sensor by assuming the same characteristics
as for the two others. The third sensor will be shown in the list as either being simulated, or impossible to simulate.
The current probe choices that are available are:
MN93 clamp: 200AAC
MN193 clamp: 100 or 5AAC
SR193 clamp: 1000AAC
J93 clamp: 3500AAC/5000ADC
AmpFlex® A193: 100A/6500A/10,000AAC
MiniFlex® MA193: 100A/6500AC
MR193 clamp: 1000A/1200AAC/DC
SL261 clamp: 100A (sensitivity 10mV/AAC/DC)
SL261 clamp: 10A (sensitivity 100mV/AAC/DC)
Three phase adapter: 5AAC
If an MN193 clamp (5A range) or an adapter is used, the current ratio setting is proposed automatically. If an MN193
clamp (5A range), an Adapter, an AmpFlex®, a MiniFlex®, J93 or an SL261 clamp is used; adjustment of the ratio, range,
or sensitivity is proposed automatically.
Use the arrow buttons to dene the ratios between the primary current (1A to 60,000A) and the secondary current (1A,
2A or 5A), then conrm the selections with the button. Note that the primary current cannot be less than the secondary
current.
Power Quality Analyzer PowerPad® III Model 8336
29
Page 33

4.1.5.2 VOLTAGE RATIOS
A second screen, V or U (depending on set-up), denes the voltage ratios. Ratios can be different for each channel, or the
same for all or some channels. These are phase-to-neutral voltage ratios when there is a neutral (indicated by V)...
Figure 4-14
…and phase-to-phase voltage ratios when there is not (indicated by U).
Figure 4-15
Use the ▲ and ▼ buttons to choose the conguration of the ratios.
■ 3U 1/1 or 4V 1/1: all channels have the same 1/1 ratio.
■ 3U or 4V: all channels have the same ratio, to be programmed.
- Press then use the ▲ and ▼ buttons to highlight the ratio in yellow.
- Press then use the arrow buttons to change the ratio. The primary voltage is in kV and the secondary
voltage is in V.
■ 3V + VN: all channels have the same ratio and the neutral has a different ratio. The process is similar to when there is
only one ratio, but you must perform the operation twice.
■ U1+U2+U3 or V1+V2+V3+VN: each channel has a different ratio, to be programmed. The process is similar to when
there is only one ratio, but you must perform the operation several times.
Conrm your selections by pressing . To return to the Conguration menu, press
NOTE: The primary and secondary voltages can each be congured with a multiplier factor of 1/√3. Note also that
you cannot modify ratios if the instrument is recording, metering energy, or searching for transients, alarms, and/or
.
inrush current acquisitions.
30
Power Quality Analyzer PowerPad® III Model 8336
Page 34

4.1.6 CAPTURE MODE
The
Capture mode is used to congure the voltage thresholds, the current thresholds of the transient mode, and the
current thresholds of the inrush current mode.
4.1.6.1 TRANSIENT VOLTAGE THRESHOLDS
The rst
Thresholds screen, displayed by pressing the V icon (or U, for set-ups without a neutral), congures the
voltage thresholds. These thresholds can be the same for all channels or different for some or each of them.
Figure 4-16
To change the voltage thresholds, press .
Use the ▲ and ▼ buttons to choose conguration of the thresholds.
■ 4V or 3U: all channels have the same threshold.
- Press the button, then use the ▲ and ▼ buttons to highlight the value of the threshold in yellow.
- Press the button, then use the arrow buttons to change the threshold. The unit can be V or kV.
■ 3V + VN: all channels have the same ratio and the neutral has a different ratio. Proceed as when there is only one
ratio, but perform the operation twice.
■ V1+V2+V3+VN or U1+U2+U3: each channel has a different ratio, to be programmed. Proceed as when there is only
one ratio, but perform the operation several times.
Conrm your selections by pressing . To return to the Conguration menu, press
NOTE: You cannot modify thresholds in the transient mode if the instrument is searching for transients.
.
Power Quality Analyzer PowerPad® III Model 8336
31
Page 35

4.1.6.2 TRANSIENT CURRENT THRESHOLDS
A second
Thresholds screen, displayed by pressing the A icon, congure the current thresholds (independently of
the current sensors detected by the instrument). The thresholds programmed can be the same for all channels or different
for some or all of them.
Figure 4-17
To change the current thresholds, press . Use the ▲ and ▼ buttons to choose conguration of the thresholds.
■ 4A: all current sensors have the same threshold.
- Press the button, then use the ▲ and ▼ buttons to highlight the value of the threshold in yellow.
- Press the button, then use the arrow buttons to change the threshold. The unit can be A, kA, or mA.
■ 3A + AN: all current sensors have the same threshold and the one connected to the neutral has a different threshold.
Proceed as when there is only one ratio, but perform the operation twice.
■ A1+A2+A3+AN: each current sensor has a different threshold, to be programmed. Proceed as when there is only one
ratio, but perform the operation several times
Conrm your selections by pressing . To return to the Conguration menu, press
NOTE: You cannot modify thresholds in the transient mode if the instrument is searching for transients.
.
32
Power Quality Analyzer PowerPad® III Model 8336
Page 36

4.1.6.3 INRUSH CURRENT THRESHOLDS
A third Thresholds screen, displayed by pressing the button, denes the inrush current thresholds. This involves
setting the triggering threshold and the inrush current capture stopping threshold (the stopping threshold being the
triggering threshold less the hysteresis).
Figure 4-18
To change the inrush current triggering threshold:
■ Press the button.
■ Use the arrow buttons to change the triggering threshold. The unit can be A, kA, or mA.
■ Press , then use the ▲ and ▼ arrows to highlight the hysteresis in yellow.
■ Use the navigation buttons to change the hysteresis.
For more information on the hysteresis, refer to § A.1. Conguring hysteresis at 100% is equivalent to not having a stop
threshold (see § A.1.6)
Conrm your selections by pressing . To return to the Conguration menu, press
NOTE: You cannot modify thresholds in the transient mode if the instrument is searching for transients.
.
Power Quality Analyzer PowerPad® III Model 8336
33
Page 37

4.1.7 TREND MODE
The instrument has a recording function (activated by the button, see § 5.5), used to record measured and calculated
values (Urms, Vrms, Arms, and so on). To display the Trend Mode menu, press
and then select .
Figure 4-19
The Trend Mode menu consists of two pages. The rst page is illustrated in Figure 4-19. To display the next page, press
to display the Conguration menu,
the button.
Figure 4-20
There are four possible programmable congurations: , , , . To navigate through these
congurations, press the or button.
To select a parameter to be recorded, move the yellow cursor to the parameter using the navigation arrow buttons, then
press . Selected parameters are identied by a red spot. The frequency (Hz) is always selected (black spot).
NOTE: If a quantity is displayed in red, it is incompatible with the conguration chosen (connection selected, sen-
sors connected, ratios programmed, reference of the level of harmonics of the phases, breakdown of the non-active
quantities). For example, if no current sensor is connected, all current quantities appear in red.
To select all of the parameters of a page, press the button. To deselect all of the parameters of a page, press the
button.
To change conguration pages, press the
34
or button.
Power Quality Analyzer PowerPad® III Model 8336
Page 38

The recordable values are:
Unit Designation
Urms RMS phase-to-phase voltage
Udc DC phase-to-phase voltage
Upk+ Maximum peak value of phase-to-phase voltage
Upk- Minimum peak value of phase-to-phase voltage
Ucf Crest (peak) factor of phase-to-phase voltage
Uthdf Harmonic distortion of the phase-to-phase voltage with the RMS value of the fundamental as reference
Uthdr Harmonic distortion of the phase-to-phase voltage with the total RMS value without DC as reference
Vrms RMS phase-to-neutral voltage
Vdc DC phase-to-neutral voltage
Vpk+ Maximum peak value of the phase-to-neutral voltage
Vpk- Minimum peak value of the phase-to-neutral voltage
Vcf Crest factor of phase-to-neutral voltage
Vthdf Harmonic distortion of the phase-to-neutral voltage with the RMS value of the fundamental as reference
Vthdr Harmonic distortion of the phase-to-neutral voltage with the total RMS value without DC as reference
Arms RMS current
Adc DC current
Apk+ Maximum peak value of the current
Apk- Minimum peak value of the current
Acf Crest factor of current
Athdf Harmonic distortion of the current with the RMS value of the fundamental as reference
Athdr Harmonic distortion of the current with the total RMS value without DC as reference
P Active power
Pdc DC power
Q1 Reactive power (fundamental)
N Non-active power
D Distortion power
S Apparent power
PF Power factor
cos Φ Cosine of the phase shift of the voltage with respect to the current
(displacement factor or fundamental power factor – DPF)
tan Φ Tangent of the phase shift of the voltage with respect to the current
PST Short-term icker
PLT Long-term icker
FHL Harmonic loss factor
FK K factor
Vunb or
Uunb
Phase-to-neutral voltage unbalance (set-up with neutral). Phase-to-phase voltage unbalance
(set-up without neutral)
Aunb Current unbalance
Hz Network frequency
U-h Harmonics in phase-to-phase voltage
V-h Harmonics in phase-to-neutral voltage
A-h Harmonics in current
S-h Harmonics in power
Power Quality Analyzer PowerPad® III Model 8336
35
Page 39

The last four entries in the preceding table (U-h, V-h, A-h, and S-h) involve the recording of the harmonics of U, V, A, and
S. You can select a range of orders of the harmonics to be recorded (between 0 and 50) for each of these quantities; and
within this range (if desired) only odd harmonics.
NOTE: The level of harmonics of order 01 will be displayed only if they concern values expressed in % r.
To change an order of harmonic:
1. Select the parameter to be recorded (identied by a red spot).
2. Move the yellow cursor to the parameter using the navigation arrow buttons.
3. Conrm the selection by pressing .
4. Change the value using the ▲ and ▼ arrow buttons, then conrm by pressing .
Figure 4-21
NOTE: If a recording is in progress, the associated conguration cannot be modied and the selected values are
identied by black spots.
To return to the Conguration menu, press
.
36
Power Quality Analyzer PowerPad® III Model 8336
Page 40

4.1.8 ALARM MODE CONFIGURATION
The
Alarm mode menu denes the alarms used by the Alarm mode function (see § 5.4 for a complete list of alarms).
To activate an alarm, highlight it using the up and down arrow buttons, then conrm the selection by pressing . The
active alarm is identied by a red spot. An alarm that is not programmed (identied by a question mark “?”) cannot be
activated. To program the alarm, select the parameter, then enter a new value. Conrm the change by pressing .
Figure 4-22
The Alarm mode menu denes:
● Type of alarm
● Order of the harmonic (between 0 and 50), for |S-h|, A-h, U-h and V-h only
● Target of the alarm:
- 3L: 3 phases monitored individually
- N: monitoring of neutral
- 4L: 3 phases and neutral monitored individually
-- Σ: surveillance of the value of the complete system
● Direction of the alarm (>or <) in the case of Hz, Urms, Vrms, Arms, |Udc|, |Vdc|, |Adc|, |Upk+|, |Vpk+|, |Apk+|,
|Upk-|, |Vpk-| and |Apk-|.
● Triggering threshold of the alarm (value and unit for Urms, Vrms, Arms, |Udc|, |Vdc|, |Adc|, |Upk+|, |Vpk+|, |Apk+|,
|Upk-|, |Vpk-|, |Apk-|, |P|, |Pdc|, |Q1| or N, D and S).
● Triggering delay, or minimum duration above or below the alarm threshold: in minutes or seconds or, in the case
of Vrms, Urms and Arms (excluding the neutral), in hundredths of a second.
● Hysteresis: 1%, 2%, 5% or 10% (see § A.1).
To go from one page to the other, press the
or button. Each overshoot of an alarm will be recorded in a
campaign of alarms.
NOTE: A red alarm indicates the programmed quantity and/or target is incompatible with the conguration chosen
(connection selected, sensors connected, ratios programmed, calculation methods chosen).
The alarms on the level of harmonics of order 01 concern only the values expressed in % r.
If a search for alarms is in progress, the activated alarms cannot be modied and are identied by black dots. How-
ever, new alarms (not yet programmed or not activated) can be activated.
To return to the Conguration menu, press
Power Quality Analyzer PowerPad® III Model 8336
.
37
Page 41

4.1.9 ERASING MEMORY
The Erase Memory menu partially or totally deletes data recorded in the instrument.
Figure 4-23
■ To select an item to be deleted, highlight it using the arrow buttons, then conrm the selection by pressing .
A red dot appears identifying the item to be deleted. To select all items, press . To deselect all items, press .
■ To proceed with the deletion, press the button, then conrm by pressing .
■ To return to the Conguration menu, press
WARNING: Which deletions are possible depends on the recordings in progress (recording, metering of energy,
search for transients, alarms, and/or inrush current acquisition).
.
38
Power Quality Analyzer PowerPad® III Model 8336
Page 42

4.1.10 ABOUT
The About menu displays information concerning the instrument.
Figure 4-24
Power Quality Analyzer PowerPad® III Model 8336
39
Page 43

5. DISPLAY MODES
To select parameters in all modes, use the ◄ ►▲▼ buttons to move to the desired parameter and use the button to
conrm selections.
5.1 WAVEFORM CAPTURE MODE
The Waveform capture menu enables you to display and to capture transients and inrush currents. It contains two submodes:
■ Transient mode (see § 5.1.1)
■ Inrush current mode (see § 5.1.2)
Figure 5-1
To select the sub-mode, highlight either Transient or Inrush current using the ▲ and ▼ buttons, then press .
To return to the Waveform Capture screen, press .
40
Power Quality Analyzer PowerPad® III Model 8336
Page 44

5.1.1 TRANSIENT MODE
The Transient menu is used to record transients, look up the list of recorded searches and the list of transients they
contain, or erase them. You can record up to 7 detections and 210 transients.
When the Transient mode is selected, the display screen will depend on the following conditions:
if … then …
no record has been made the Detection Schedule screen is displayed
transients have been recorded the List of Seaches for Transients screen is displayed
5.1.1.1 PROGRAMMING AND STARTING A SEARCH
To program the search for a transient, select Transient by pressing the button in the Waveform Capture screen (see
Figure 5-1). The Detection Schedule screen is displayed.
Figure 5-2
Item Function
1
Reminder of the mode used
2
Display of sub-mode used
3
Flashing icon: indicates that the search has been started
4
Memory indicator. Black area = used memory; White area = available memory
5
Transients search start time
6
Transients search end time
7
Number of transients
8
Name of transient
9
Display a list of searches; Program a search; Start a search
To program a search for a transient, enter the start date and time, the stop date and time, the number of transients to
search for, and the name of the search.
To change an item, move the yellow cursor to it using the ▲ and ▼ buttons, then conrm the selection with the
button. Change the value using the ◄ ►▲▼ arrow buttons, then press . The name can be up to eight characters
long. Several searches can bear the same name. The available alphanumeric characters are uppercase letters from A
through Z and the digits 0 through 9. The last ve names assigned (in the transient, trend, and alarm modes) are stored in
memory. When a name is entered, it may then be completed automatically.
NOTE: The start date and time must be later than the current date and time. The stop date and time must be later
than the start date and time.
Power Quality Analyzer PowerPad® III Model 8336
41
Page 45

After you program the search, start it by pressing the button. The icon on the status bar blinks to indicate that the
search is underway. While the search is active, the button replaces the button and can be used to stop the search
before it is nished.
The message “Detection on standby” is displayed until the start time of the search is reached. When the search starts,
this message is replaced by the message “Detection in progress.” When the stop time is reached, the Detection schedule
menu returns with the button displayed. You can now program another search. During a search for transients, only the
stop date eld can be modied. It is automatically highlighted in yellow.
To return to the Waveform capture screen, press .
5.1.1.2 DISPLAYING A TRANSIENT
To display the recorded transient, proceed as follows:
To display the recorded transients, press button. The Detection List screen is displayed.
Figure 5-3
Item Function
1
The displayed value indicates the page number and the number of pages.
These icons let you browse through the previous and next screens. Press the yellow buttons corresponding to these icons to display
2
the pages.
If the stop date is in red, it means that it does not match the stop date initially programmed, because either:
● There is a power supply problem (battery low or disconnection from AC power)
● The number of transients has been reached, thereby ending the search
To select a search for transients, move the cursor to it using the ▲ and ▼ buttons. The selected search is bolded. Conrm
by pressing . The screen then displays a list of transients.
42
Power Quality Analyzer PowerPad® III Model 8336
Page 46

1
5
2
3
4
Figure 5-4
Item Function
1
Transient name, number, date, time and triggering channel of transient.
2
Activates/deactivates the choice of a transient list display filter.
3
The displayed value indicates the page number and the number of pages.
These icons let you browse through the previous and next screens. Press the yellow buttons corresponding to these icons to display
4
the pages.
Transient display filter:
- : displays the 4 single voltages during the transient (here in a 5-wire 3-phase connection)
- 4V: displays the 4 single voltages during the transient (here in a 5-wire 3-phase connection)
5
- 4A: displays the 3 currents and the neutral current during the transient
- L1, L2 or L3: displays the current and the single voltage successively in relation to phases 1, 2 and 3
- N: displays neutral
To select a transient, move the cursor to it using the ▲ and ▼ buttons. The selected eld is bolded.
Validate with the . button. The screen then displays the transients in graph form.
1
5
2
3
Power Quality Analyzer PowerPad® III Model 8336
6
4
Figure 5-5
43
Page 47

Item Function
1
Location in the record of the zone displayed.
2
Instantaneous value of the signals according to the position of the cursor on the scale. To move the cursor use the ◄ and ► buttons.
3
Move cursor to one period of the signal before transient triggering time.
4
Move cursor to transient triggering time.
5
Number assigned to displayed graph (e.g. 1 is highlighted indicating channel V1 triggered capture of the transient)
6
To return to the Transient List screen, press .
5.1.1.3 DELETING A TRANSIENTS SEARCH
You can remove a stored search for transients from memory.
To do this, when the Detection List screen is displayed (see Figure 5-3), select the search to be deleted. Then press the
button, and press to conrm the deletion. Note that you can delete a transient search only if it is not actively in
progress. To return to the Waveform capture screen, press .
: Zoom In - Press this button to zoom in. : Zoom Out - Press this button to zoom out.
NOTE: The selection lter is dynamic and depends on the connection chosen. For example, the selection lter lists
(3U, 3A) for a 3-wire 3-phase set-up.
5.1.1.4 DELETING A TRANSIENT
When the Transient List screen is displayed (see Figure 5-3), select the transient to be deleted. The selected transient is
bolded. Next, press the button, and then press to conrm the deletion. To return to the Waveform capture screen,
press .
44
Power Quality Analyzer PowerPad® III Model 8336
Page 48

5.1.2 INRUSH CURRENT MODE
3
1
2
4
7
5
6
While in Waveform
mode, the Inrush current
sub-mode is used to capture (record) Inrush currents (voltage
and current waveforms, network frequency, half-cycle RMS voltages and currents except for the neutral) and to view and
delete the recordings.
When Inrush Current mode is selected, the screen displayed will depend on the following conditions:
if … then …
no capture has been made the Capture Schedule screen is displayed
captures have been made the Capture Parameters screen is displayed
5.1.2.1 PROGRAMMING A CAPTURE
To program the capture of an Inrush current, proceed as follows:
■ At the Waveform Capture screen (Figure 5-1), select Inrush Current. The Capture Schedule screen is displayed.
Figure 5-6
Item Function
1
Icons for the mode and sub-mode.
2
Rapid programming and start of capture.
3
Shortcut to the Configuration menu to set triggering thresholds.
When triggering filter appears in red it is not available due to incompatibility with the configuration (connection, type of sensors, or
4
current ratio).
5
Displays the parameters of the capture.
6
Programs the capture.
confirms programming of a capture.
7
To quickly start recording, press the button. Recording starts immediately with a current threshold of 0A and a
hysteresis of 100%. Note that the rapid starting of an inrush current modies the conguration of the current threshold.
To program a capture, enter the triggering lter (3A, A1, A2, or A3), the start date and time, and the recording mode (RMS
+ PEAK or RMS only).
:
: deletes a capture (this icon is displayed if a capture has been made).
● The RMS + PEAK recording mode is used to produce a trend recording of the half-period RMS values and a
trend recording of the samples (envelopes and waveforms). The maximum duration of such a recording depends
on the network frequency; on average the duration is approximately one minute.
● In the RMS only recording mode, the recording of the samples is eliminated in favor of a longer maximum capture
duration. This mode records only the half-period RMS values and its maximum duration is about ten minutes.
Power Quality Analyzer PowerPad® III Model 8336
45
Page 49

To modify an item, move the yellow cursor to it using the ▲ and ▼ buttons
, then conrm the selection with the
button.
Change the value using the arrow buttons, then conrm again.
NOTE: For more information on the triggering lter, refer to § A.1.6. You cannot program an alarm campaign if an
inrush current capture is in progress.
After you program the capture, start it by pressing the button. The icon on the status bar blinks to indicate that the
capture is underway. While the capture is active, the button replaces the button and can be used to stop the capture
before it is nished.
NOTE: The voltage must be present before the inrush current for a stable and correct frequency lock.
The message “Capture pending” is displayed until the start time is reached and the triggering conditions are satised. It is
then replaced by the message “Capture in progress”. The memory status indicator appears at the top of the screen. The
indicator disappears when the capture is completed.
Figure 5-7
If the capture is terminated with a stop event (see conditions in § A.1.6) or if the recording memory of the instrument is full,
the capture stops automatically.
NOTE: The instrument can keep in memory only a single inrush current capture. If you wish to make another capture,
you must delete the previous one.
To return to the Waveform Capture screen, press .
5.1.2.2 DISPLAYING CAPTURE PARAMETERS
To display the characteristics of the capture, press . The Capture parameters screen appears.
Figure 5-8
When a capture duration is displayed in red, it has been cut short for one of the following reasons:
● power supply problem (battery low)
● memory full
● measurement error
● incompatibility between the quantity monitored and the conguration of the instrument (e.g. withdrawal of a
current sensor)
Choose the type of display, RMS or PEAK, by pressing the yellow button corresponding to the icon. The instrument then
displays the graphs.
46
Power Quality Analyzer PowerPad® III Model 8336
Page 50

NOTE: The PEAK button is not displayed when the inrush current capture recording mode is RMS only.
In the PEAK display, the available information is:
● The instantaneous current and voltage at the time indicated by the cursor (in a “waveform” representation).
● The maximum instantaneous current and voltage in the half-cycle indicated by the cursor (in an “envelope”
representation).
● The maximum instantaneous absolute value of the current and voltage (over the entire capture).
In the RMS display, the available information is:
● The instantaneous frequency at the time indicated by the cursor.
● The minimum, mean, and maximum instantaneous values of the frequency over the entire capture.
● The RMS current and voltage in the half-cycle (or lobe) on which the cursor is positioned.
● The maximum half-cycle RMS current and voltage (over the entire capture).
A voltage must be present on the phase before the motor start-up for a stable and correct frequency control.
5.1.3 TRUE RMS CURRENT AND VOLTAGE
RMS mode displays the record of the trend of the true half-cycle RMS current and voltage, and the frequency trend graph.
The display depends on the type of selection lter:
● 3V: displays the three voltages during the inrush current capture for set-ups with neutral
● 3U: displays the three voltages during the inrush current capture for set-ups without neutral
● 3A: displays the three currents during the inrush current capture
● L1, L2, L3: display the current and voltage in phases 1, 2, and 3 respectively (for set-ups with neutral only)
● Hz: displays the evolution of the network frequency vs. time
The following section show four display examples.
3A RMS DISPLAY SCREEN FOR A 3-PHASE CONNECTION WITH NEUTRAL
1
2
Figure 5-9
Item Function
1
Instantaneous value cursor; change values with the cursor using the ◄ and ► buttons
2
Scale of values
- Maximum half-period RMS value of the Inrush current capture
3
- Indicator of number attributed to the displayed curve
- Value of the measured current
3
4
5
Power Quality Analyzer PowerPad® III Model 8336
47
Page 51

- t: relative time position of the cursor
4
(t = 0 corresponds to the start of the Inrush capture)
- Values at the position of the cursor. In the example shown in Figure 5-9, A1, A2, and A3 are the RMS values of currents 1, 2, and 3.
: Zoom Out - Zooms out on the graph at the current cursor position
5
: Zoom In - Zooms in on the graph at the current cursor position
3A RMS DISPLAY SCREEN (3-PHASE CONNECTION WITHOUT NEUTRAL)
Figure 5-10
L1 RMS DISPLAY SCREEN FOR A 3-PHASE CONNECTION WITH NEUTRAL
Figure 5-11
NOTE: Filters L2 and L3 are used to display the recording of the true half-cycle RMS current and voltage of phases
2 and 3. The screen is identical to the one displayed for lter L1.
The , , , and buttons are used to go to the rst occurrence of a minimum or maximum voltage or
current value.
48
Power Quality Analyzer PowerPad® III Model 8336
Page 52

RMS DISPLAY SCREEN IN HZ FOR A THREE-PHASE CONNECTION WITHOUT NEUTRAL
Figure 5-12
The
and
buttons allow you to go to the rst occurrence of a minimum or maximum frequency value.
5.1.4 INSTANTANEOUS INRUSH CURRENT
PEAK mode is used to display the envelopes and waveforms of the inrush current capture. The PEAK display of an inrush
current capture provides two possible representations:
● envelope
● waveform
The change from one of these representations to the other is automatic, as a function of the zoom level. If zoom in is high
enough, the representation is of the “waveform” type. The display depends on the type of display lter:
● 4V: displays the four voltages during the inrush current capture for set-ups with neutral (for a waveform type
display only).
● 3U: displays the three voltages during the inrush current capture for set-ups without neutral (for a waveform type
display only).
● 4A: displays the four currents during the inrush current capture (for a waveform type display only).
● L1, L2 or L3: display the voltage and current of phases 1, 2, and 3, respectively (only for set-ups with neutral and
for a waveform type display).
● N: displays the neutral current and neutral voltage during the inrush current capture (for a waveform type display
only).
● V1, V2, V3: displays the three voltages during the inrush current capture for set-ups with neutral (for an envelope
type display only).
● U1, U2, U3: displays the three voltages during the inrush current capture for set-ups without neutral (for an
envelope type display only).
● A1, A2, A3: displays the three currents during the inrush current capture (for an envelope type display only).
Power Quality Analyzer PowerPad® III Model 8336
49
Page 53

The following section shows two display examples.
4
3
1
2
4A PEAK DISPLAY SCREEN FOR A 5-WIRE 3-PHASE CONNECTION
Figure 5-13
Item Function
1
- MAX |PEAK|: maximum instantaneous absolute value of inrush current capture
2
- Scale of values in amperes
- Number assigned to the displayed graph. In this example circle 3 is filled indicating that channel A3 triggered capture of the inrush
3
current.
- t: relative time position of the cursor (t = 0 corresponds to the start of the Inrush capture)
4
- Values at the position of the cursor. In this example, A1, A2, A3: instantaneous values of currents 1, 2, and 3 at the position of the
cursor
A1 PEAK display screen for a 3-phase connection without neutral
In the case shown below, there is enough zoom out to force the envelope type of representation.
Figure 5-14
Item Function
1
Instantaneous value cursor; change values with the cursor using the ◄ and ► buttons
- t: relative time position of the cursor (t = 0 corresponds to the start of the Inrush capture)
2
- Values at the position of the cursor. In the example shown in Figure 5-14, A1: maximum instantaneous current of the half-cycle
identified by the cursor
3
- MAX: maximum instantaneous absolute value of the Inrush current capture
NOTE: Filters A2 and A3 display the record of the current envelope of phases 2 and 3. The screen is identical to the one
displayed for lter A1.
50
Power Quality Analyzer PowerPad® III Model 8336
Page 54

5.2 HARMONICS MODE
The Harmonics mode displays a representation of the harmonic levels of the voltage, current, and apparent power, order
by order. It can be used to determine the harmonic currents produced by nonlinear loads, and analyze problems caused
by harmonics according to their order (overheating of neutrals, conductors, motors, and so on).
Figure 5-15
● V - Phase-to-neutral voltage
● A - Harmonics of the current
● S - Apparent power of the harmonics
● U - Phase-to-phase voltage harmonics
● The and buttons allow the user to zoom in or out, in increments of 2%, 5%, 10%, 20%, 50% and 100%.
5.2.1 PHASE-TO-NEUTRAL VOLTAGE HARMONICS
The V sub-menu displays the harmonics of the phase-to-neutral voltage only for sources having a neutral.
NOTE: The choice of curves to be displayed depends on the type of connection (see § 4.1.4):
● Single-phase, 2-wire: no choice (L1)
● Single-phase, 3-wire: L1, N
● Split-phase, 3-wire: 2L, L1, L2
● Split-phase, 4-wire: 2L, L1, L2, N
● 3-phase, 4-wire: 3L, L1, L2, L3, -,+
● 3-phase, 5-wire: 3L, L1, L2, L3, N, -,+
The examples shown in the following sections were obtained with a 5-wire 3-phase connection.
Power Quality Analyzer PowerPad® III Model 8336
51
Page 55

3L PHASE-TO-NEUTRAL VOLTAGE HARMONICS
3
1
2
3
1
2
Item Function
Data about harmonic indicated by cursor:
V-h03: harmonic number
%: level of harmonics with fundamental RMS value as reference (%f) or (total) RMS value as reference (%r).
1
V: RMS voltage of harmonic
+000°: phase shift with respect to fundamental (order 1).
Harmonic selection cursor; change values with the cursor using the ◄ and ►buttons
2
Horizontal axis indicates orders of harmonics.
Level of harmonic is given as a percentage with respect to fundamental or total RMS value.
3
DC: DC component. 1 to 25: harmonics of order 1 to 25. When cursor exceeds order 25, order 26 to 50 appears.
Figure 5-16
Display in expert mode -.+ (on the right-hand side) is available for 3-phase hookups by pressing the ▲ and ▼ buttons.
L1 PHASE VOLTAGE HARMONICS
Figure 5-17
Item Function
Data about harmonic indicated by cursor:
V-h03: harmonic number
%: level of harmonics with fundamental RMS value (%f) or (total) RMS value (%r) as reference
V: RMS voltage of harmonic
1
-143°: phase shift with respect to fundamental (order 1)
max – min: maximum and minimum levels of harmonic. Reset when harmonic number is changed or is pressed
THD: total harmonic distortion
Vd: RMS distortion voltage
52
Power Quality Analyzer PowerPad® III Model 8336
Page 56

Harmonic selection cursor; change values with the cursor using the ◄ and ►buttons
3
1
2
2
Horizontal axis indicates orders of harmonics
Level of harmonic is given as a percentage with respect to fundamental or to total RMS value
3
DC: DC component
1 to 25: harmonics of order 1 to 25. When the cursor exceeds order 25, order 26 to 50 appears
NOTE: Filters L2 and L3 display the harmonics of the phase-to-neutral voltage for phases 2 and 3, respectively. The screen is
identical to the one displayed for lter L1.
There is no phase shift or distortion value for the neutral channel.
5.2.2 CURRENT
The A sub-menu displays the harmonics of the current.
3L CURRENT HARMONICS
Figure 5-18
Item Function
Data about harmonic indicated by cursor:
A-h05: harmonic number
%: level of harmonics with fundamental RMS value (%f) or (total) RMS value (%r) as reference
1
A: RMS current of harmonic
+179°: phase shift with respect to fundamental (order 1)
Harmonic selection cursor; change values with the cursor using the ◄ and ►buttons
2
Horizontal axis indicates orders of harmonics
Level of harmonic is given as a percentage with respect to the fundamental or to the total RMS value
3
Range DC: DC component
1 to 25: harmonics of order 1 to 25. When the cursor exceeds order 25, order 26 to 50 appears
Power Quality Analyzer PowerPad® III Model 8336
53
Page 57

L1 CURRENT HARMONICS
3
1
2
Item Function
Data about harmonic indicated by cursor:
A-h05: harmonic number
%: level of harmonics with fundamental RMS value (%f) or (total) RMS value (%r) as reference
A: RMS current of harmonic
1
+178°: phase shift with respect to fundamental (order 1)
max – min: maximum and minimum levels of harmonic. Reset when harmonic number is changed or pressed
THD: total harmonic distortion
Ad: RMS distortion current
Harmonic selection cursor; change values with the cursor using the ◄ and ►buttons
2
Horizontal axis indicates orders of harmonics
Level of harmonic is given as a percentage with respect to the fundamental or to the total RMS value
3
Range DC: DC component
1 to 25: harmonics of order 1 to 25. When the cursor exceeds order 25, order 26 to 50 appears
Figure 5-19
NOTE: Filters L2 and L3 display the current harmonics of phases 2 and 3, respectively. The screen is identical to the one
displayed for lter L1.
There is no phase shift or distortion value for the neutral channel.
54
Power Quality Analyzer PowerPad® III Model 8336
Page 58

5.2.3 APPARENT POWER
The S sub-menu displays the harmonics of the apparent power, for all connections except 3-wire 3-phase. The horizontal
axis indicates the orders of the harmonics. The bars of the bar chart above the horizontal center line signify harmonic
power consumed, those below it harmonic power generated.
3L APPARENT POWER HARMONICS
1
2
3
Figure 5-20
Item Function
S-h03: harmonic number
%: level of harmonics with fundamental apparent power (%f) or (total) apparent power (%r) as reference
+006°: phase shift of voltage harmonic with respect to current harmonic
1
: energy generated for this harmonic
: energy consumed for this harmonic
Harmonic selection cursor; change values with the cursor using the ◄ and ►buttons
2
Horizontal axis indicates orders of harmonics.
Harmonic level is percentage of fundamental apparent or (total) apparent power
3
Range DC: DC component
1 to 25: harmonics of order 1 to 25. When cursor exceeds order 25, order 26 to 50 appears
L1 APPARENT POWER HARMONICS
1
2
Power Quality Analyzer PowerPad® III Model 8336
Figure 5-21
3
55
Page 59

Item Function
Data about harmonic indicated by cursor:
S-h03: harmonic number
%: level of harmonics with fundamental RMS value (%f) or (total) RMS value (%r) as reference
1
A: RMS current of harmonic
+45°: phase shift of the voltage harmonic with respect to the current harmonic
max – min: maximum and minimum levels of harmonic. Reset when harmonic number is changed or pressed
Harmonic selection cursor; change values with the cursor using the ◄ and ►buttons
2
Horizontal axis indicates orders of harmonics.
Level of harmonic is given as a percentage with respect to the fundamental or to the total RMS value.
Range DC: DC component
3
1 to 25: harmonics of order 1 to 25. When the cursor exceeds order 25, order 26 to 50 appears
: energy consumed for this harmonic
NOTE: Filters L2 and L3 display the apparent power of the harmonics for phases 2 and 3, respectively. The screen is identical to
the one displayed for lter L1.
5.2.4 PHASE-TO-PHASE VOLTAGE
The U sub-menu is available for all connections except 2- or 3-wire single-phase. This sub-menu displays the harmonics
of the phase-to-phase voltage.
3L PHASE-TO-PHASE VOLTAGE HARMONICS
1
2
Item Function
U-h03: harmonic number
%: level of harmonics with fundamental apparent power (%f) or (total) apparent power (%r) as reference
1
V: RMS voltage of harmonic
+000°: phase shift with respect to fundamental (order 1)
Harmonic selection cursor; change values with the cursor using the ◄ and ►buttons
2
Horizontal axis indicates orders of harmonics.
Harmonic level is percentage of fundamental apparent or (total) apparent power
3
Range DC: DC component
1 to 25: harmonics of order 1 to 25. When cursor exceeds order 25, order 26 to 50 appears
3
Figure 5-22
56
Power Quality Analyzer PowerPad® III Model 8336
Page 60

L1 PHASE-TO-PHASE VOLTAGE HARMONICS
3
1
2
Item Function
Data about harmonic indicated by cursor:
U-h03: harmonic number
%: level of harmonics with fundamental RMS value (%f) or (total) RMS value (%r) as reference
V: RMS voltage of harmonic
1
+000°: phase shift with respect to fundamental (order 1)
max – min: maximum and minimum levels of harmonic. Reset when harmonic number is changed or by pressing
THD: total harmonic distortion
Ud: phase-to-phase RMS distortion voltage
Harmonic selection cursor; change values with the cursor using the ◄ and ► buttons
2
Horizontal axis indicates orders of harmonics.
Level of harmonic is given as a percentage with respect to the fundamental or to the total RMS value.
3
Range DC: DC component
1 to 25: harmonics of order 1 to 25. When the cursor exceeds order 25, order 26 to 50 appears
Figure 5-23
NOTE: Filters L2 and L3 display the harmonics of the phase-to-neutral voltage for phases 2 and 3, respectively. The screen is
identical to the one displayed for lter L1.
Power Quality Analyzer PowerPad® III Model 8336
57
Page 61

5.2.5 EXPERT MODE
The Expert mode is available with a 3-phase connection only. It displays the inuence of the harmonics on heating
the neutral and on rotating machines. To display the expert mode press the ▲ or ▼ button. The selection is highlighted in
yellow and the screen simultaneously displays the expert mode.
From this screen, two sub-menus are available:
● V for 3-phase set-ups with neutral or U for the 3-phase set-up without neutral
● A for the expert mode in current
NOTE: The breakdown into sequences shown in the following gure is valid only in the case of a balanced load.
PHASE-TO-NEUTRAL VOLTAGE EXPERT MODE
For 3-phase set-ups with neutral, the V sub-menu displays the inuence of the harmonics of the phase-to-neutral voltage
on the heating of the neutral and on rotating machines.
Figure 5-24
■ Column One: The harmonics inducing a negative sequence.
■ Column Two: Those inducing a zero sequence.
■ Column Three: Those inducing a positive sequence.
■ %: Level of harmonics with fundamental RMS value as reference (%f) or the (total) RMS value as reference (%r)
For 3-phase set-ups without neutral, the U sub-menu displays the inuence of the harmonics of the phase-to-phase
voltage on the heating of revolving machines.
58
Power Quality Analyzer PowerPad® III Model 8336
Page 62

CURRENT EXPERT MODE
The A sub-menu displays the inuence of current harmonics on heating the neutral and on rotating machines.
Figure 5-25
■ Column One: The harmonics inducing a negative sequence.
■ Column Two: Those inducing a zero sequence.
■ Column Three: Those inducing a positive sequence.
■ %: Level of harmonics with fundamental RMS value as reference (%f) or the (total) RMS value as reference (%r)
Power Quality Analyzer PowerPad® III Model 8336
59
Page 63

5.3 WAVEFORM MODE
The Waveform mode displays the current and voltage graphs, along with the values measured and those calculated from
the voltages and currents (except for power, energy, and harmonics). This is the screen that appears when the instrument
is powered up.
Figure 5-26
Item Function
RMS
THD
Measurement of the true RMS value
Measurement of total harmonic distortion
CF
Measurement of the peak factor
Display of Min/Max, RMS and peak values (see § 5.3.4)
Simultaneous display of the following measurements: RMS, DC, THD, CF, PST, PLT, FHL and FK (see § 5.3.5)
Display of phasor (Fresnel) diagram of signals (see § 5.3.6)
5.3.1 RMS MEASUREMENTS
This sub-menu displays the waveforms over a period of the measured signals and the true effective values of the voltage
and the current.
The choice of graphs to be displayed depends on the type of electrical connection that was set up during the conguration (see § 4.1.4).
● Single-phase, 2-wire or Split-phase, 2-wire: no choice (L1)
● Single-phase, 3-wire:
- For RMS, THD, CF, and : 2V, 2A, L1, N
- For : no choice (L1)
● Split-phase, 3-wire:
- For RMS, THD, CF, and : U, 2V, 2A, L1, L2
- For : 2V, 2A, L1, L2
● Split-phase, 4-wire:
- For RMS, THD, CF, and : U, 3V, 3A, L1, L2, N
- For : 2V, 2A, L1, L2
● 3-phase, 3-wire: 3U, 3A
● 3-phase, 4-wire: 3U, 3V, 3A, L1, L2, L3
● 3-phase, 5-wire:
- For RMS, THD, CF, and : 3U, 4V, 4A, L1, L2, L3, N
- For : 3U, 3V, 3A, L1, L2 and L3
60
Power Quality Analyzer PowerPad® III Model 8336
Page 64

5.3.1.1 RMS (3U)
02/06/14
This screen displays the three phase-to-phase voltages of a 3-phase system.
02/06/14
1
Figure 5-27
Item Function
Instantaneous value cursor; change values with the cursor using the ◄ and ► buttons
1
RMS phase-to-phase voltages
2
Instantaneous value of the signals at the intersection of the cursor and the curves
t: time relative to the start of the period (expressed in milliseconds)
U1: instantaneous phase-to-phase voltage between phases 1 and 2 (U12)
3
U2: instantaneous phase-to-phase voltage between phases 2 and 3 (U23)
U3: instantaneous phase-to-phase voltage between phases 3 and 1 (U31)
2
3
5.3.1.2 RMS (4V)
This screen displays the three phase-to-neutral voltages and the neutral-to-ground voltage of a 3-phase system.
2
1
3
Figure 5-28
Power Quality Analyzer PowerPad® III Model 8336
61
Page 65

Item Function
3
2
1
02/06/14
Instantaneous value cursor; change values with the cursor using the ◄ and ► buttons
1
Effective phase-to-neutral voltages
2
Instantaneous value of the signals at the intersection of the cursor and the curves
t: time relative to the start of the period (expressed in milliseconds)
V1: instantaneous phase-to-neutral voltage of curve 1
3
V2: instantaneous phase-to-neutral voltage of curve 2
V3: instantaneous phase-to-neutral voltage of curve 3
VN: instantaneous neutral voltage
5.3.1.3 RMS (4A)
This screen displays the three phase currents and the neutral current of a 3-phase system.
Figure 5-29
Item Function
Instantaneous value cursor; change values with the cursor using the ◄ and ► buttons
1
RMS currents
2
Instantaneous value of the signals at the intersection of the cursor and the curves
t: time relative to the start of the period (expressed in milliseconds)
A1: instantaneous current of phase 1
3
A2: instantaneous current of phase 2
A3: instantaneous current of phase 3
AN: instantaneous neutral voltage
62
Power Quality Analyzer PowerPad® III Model 8336
Page 66

5.3.1.4 RMS (NEUTRAL)
02/06/14
This screen displays the neutral voltage relative to ground and the neutral current.
1
Figure 5-30
Item Function
Instantaneous value cursor; change values with the cursor using the ◄ and ► buttons
1
Effective values of RMS voltage and current
2
Instantaneous value of the signals at the intersection of the cursor and the graphs
t: time relative to the start of the period (expressed in milliseconds)
3
VN: instantaneous neutral voltage
AN: instantaneous neutral current
2
3
NOTE: Filters L1, L2, and L3 display the current and voltage in phases 1, 2, and 3, respectively. The screen is identical to
the one displayed for the neutral.
5.3.2 MEASUREMENT OF TOTAL HARMONIC DISTORTION (THD)
The THD sub-menu displays the waveforms of the signals measured over one full cycle and the total voltage and current
harmonic distortion. The levels are displayed either with the fundamental RMS value as reference (%f) or with the RMS
value without DC as reference (%r), depending on which reference is chosen in the Conguration menu.
5.3.2.1 THD (3U)
This screen displays the phase-to-phase voltage waveforms for one period and the total harmonic distortion values.
2
1
Power Quality Analyzer PowerPad® III Model 8336
Figure 5-31
3
63
Page 67

Item Function
Instantaneous value cursor; change values with the cursor using the ◄ and ► buttons
1
Harmonic distortion rate for each curve
2
Instantaneous value of the signals at the intersection of the cursor and the curves
t: time relative to the start of the period (expressed in milliseconds)
U1: instantaneous phase-to-phase voltage between phases 1 and 2 (U12)
3
U2: instantaneous phase-to-phase voltage between phases 2 and 3 (U23)
U3: instantaneous phase-to-phase voltage between phases 3 and 1 (U31)
5.3.2.2 THD (4V)
This screen displays the phase-to-neutral voltage waveforms for one period and the total harmonic distortion values.
2
1
3
Figure 5-32
Item Function
Instantaneous value cursor; change values with the cursor using the ◄ and ► buttons
1
Harmonic distortion rate for each curve
2
Instantaneous value of the signals at the intersection of the cursor and the curves
t: time relative to the start of the period (expressed in milliseconds)
V1: instantaneous phase-to-neutral voltage of curve 1
3
V2: instantaneous phase-to-neutral voltage of curve 2
V3: instantaneous phase-to-neutral voltage of curve 3
VN: instantaneous value of the neutral voltage
5.3.2.3 THD (4A)
This screen displays the phase current waveforms for one period and the total harmonic distortion values.
2
1
64
3
Figure 5-33
Power Quality Analyzer PowerPad® III Model 8336
Page 68

Item Function
Instantaneous value cursor; change values with the cursor using the ◄ and ► buttons
1
Harmonic distortion rate for each curve
2
Instantaneous value of the signals at the intersection of the cursor and the curves
t: time relative to the start of the period (expressed in milliseconds)
A1: instantaneous current of phase 1
3
A2: instantaneous current of phase 2
A3: instantaneous current of phase 3
AN: instantaneous value of the neutral current
Note: Filters L1, L2, L3 and N display the total current and voltage harmonic distortion for phases 1, 2, and 3, and the
neutral channel respectively.
5.3.3 MEASUREMENT OF THE PEAK FACTOR (CF)
The CF sub-menu displays the waveforms of the signals measured over one period and the voltage and current peak factors.
5.3.3.1 CF (3U)
This screen displays the phase-to-phase voltage waveforms of one period and the peak factors.
02/06/14
2
1
Item Function
1
Instantaneous value cursor; change values with the cursor using the ◄ and ► buttons
2
Peak factor for each curve
Instantaneous value of the signals at the intersection of the cursor and the graphs
t: time relative to the start of the period (expressed in milliseconds)
3
U1: instantaneous voltage peak factor between phases 1 and 2 (U12)
U2: instantaneous voltage peak factor between phases 2 and 3 (U23)
U3: instantaneous voltage peak factor between phases 3 and 1 (U31)
3
Figure 5-34
Power Quality Analyzer PowerPad® III Model 8336
65
Page 69

5.3.3.2 CF (4V)
This screen displays the phase-to-neutral voltage waveforms of one period and the peak factors.
2
1
3
Figure 5-35
Item Function
1
Instantaneous value cursor; change values with the cursor using the ◄ and ► buttons
2
Peak factor for each curve
Instantaneous value of the signals at the intersection of the cursor and the curves
t: time relative to the start of the period (expressed in milliseconds)
V1: instantaneous phase-to-neutral voltage of phase 1
3
V2: instantaneous phase-to-neutral voltage of phase 2
V3: instantaneous phase-to-neutral voltage of phase 3
VN: instantaneous phase-to-neutral voltage of the neutral
5.3.3.3 CF (4A)
This screen displays the current waveforms of one period and the peak factors.
1
Figure 5-36
Item Function
Instantaneous value cursor; change values with the cursor using the ◄ and ► buttons
1
Peak factor for each curve
2
Instantaneous value of the signals at the intersection of the cursor and the graphs
t: time relative to the start of the period (expressed in milliseconds)
A1: instantaneous current of phase 1
3
A2: instantaneous current of phase 2
A3: instantaneous current of phase 3
AN: instantaneous value of the neutral current
2
3
NOTE: Filters L1, L2, L3 and N display the total current and voltage harmonic distortion for phases 1, 2, and 3, and the
neutral channel respectively.
66
Power Quality Analyzer PowerPad® III Model 8336
Page 70

5.3.4 MEASUREMENT OF EXTREME AND MEAN VOLTAGE AND CURRENT VALUES
The sub-menu displays the RMS, maximum, minimum and average values for voltage and current, as well as the
instantaneous positive and negative voltage and current peaks.
NOTE: The display screen varies depending on which value is selected.
● 3U: Displays the one-second mean and half-cycle maximum and minimum RMS values and the instantaneous
positive and negative phase-to-phase voltage peaks.
● 4V: Displays the one-second mean and half-cycle maximum and minimum RMS values and the instantaneous
positive and negative peaks of the phase-to-neutral voltages and of the neutral.
● 4A: Displays the one-second mean and half-cycle maximum and minimum RMS values and the positive and
negative instantaneous peak values of the phase and neutral currents.
● L1/L2/L3: Displays the one-second mean and half-cycle maximum and minimum RMS values and the
instantaneous positive and negative peaks of the phase-to-neutral voltage and of the current of phase 1.
● N: Displays the RMS values and the positive and negative instantaneous peaks of the neutral relative to ground.
Figure 5-37
The columns display the values relative to each voltage, current or neutral graph.
Item Function
MAX
RMS
NOTE: The MAX and MIN RMS measurements are calculated every half-period (e.g. every 10ms for a signal at 50Hz).
The measurements are refreshed every 250ms.
To reset the MIN and MAX on the display, press the button.
Power Quality Analyzer PowerPad® III Model 8336
Maximum RMS phase-to-phase voltage since the instrument was turned ON or the last time button is pressed.
True RMS phase-to-phase voltage
MIN
Minimum RMS phase-to-phase voltage since the instrument was turned ON or the last time button is pressed.
PK+
Maximum (positive) peak phase-to-phase voltage since instrument was turned ON or the last time button is pressed.
PK-
Minimum (negative) peak phase-to-phase voltage since instrument was turned ON or the last time button is pressed.
67
Page 71

5.3.5 SIMULTANEOUS DISPLAY
The sub-menu displays all the voltage and current measurements (RMS, DC, THD, CF, PST, PLT, FHL and FK).
NOTE: The display screen varies depending on which value is selected.
● 3U: Displays the RMS, DC, THD and CF values of the phase-to-phase voltages.
● 4V: Displays the RMS, DC, THD, CF, PST and PLT values of the phase-to-neutral voltages and of the neutral.
● 4A: Displays the RMS, DC, THD, CF, FHL and FK values of the phase and neutral currents.
● L1/L2/L3: Displays the RMS, DC, THD, CF, PST and PLT values of the phase-to-neutral voltage and of the
current, the DC and PST parameters of the phase-to-neutral voltage, and the DC value (if the current sensor
allows) and FK of the current for phase 1.
● N: This screen displays the RMS, THD and CF voltage and current of the neutral, the DC component of the
neutral voltage, and (if the current sensor allows) the DC component of the neutral current.
Figure 5-38
Item Function
RMS
DC
THD
CF
PST
PLT
FHL
FK
NOTE: The DC value of the current of phase 1 is displayed only if the associated current sensor can measure direct
current. L2 and L3 provide the simultaneous display of the current and voltage for phases 2 and 3, respectively.
True effective value of voltage or current
Direct component
Total harmonic distortion rate
Peak factor calculated in relation to the displayed waveform
Short-term flicker calculated over 10 minutes
Long-term flicker calculated over 2 hours
Harmonic loss factor for oversizing of transformers relative to harmonics
K factor - Oversizing of transformers relative to harmonics
68
Power Quality Analyzer PowerPad® III Model 8336
Page 72

5.3.6 PHASOR DIAGRAM DISPLAY
The
sub-menu displays a vector representation of the fundamentals of the voltages and currents. It indicates their
associated quantities (modulus and phase of the vectors) and the unbalances of the voltages and currents.
NOTE: The display screen varies depending on which value is selected.
● 3U: Displays a vector representation of the fundamentals of the phase-to-phase voltages and of the currents. It
indicates their associated quantities (modulus and phase of the phase-to-phase voltage vectors) and the voltage
unbalance. The reference vector of the representation (at 3 o’clock) is U1.
● 3V: Displays a vector representation of the fundamentals of the phase-to-neutral voltages and of the currents. It
indicates their associated quantities (modulus and phase of the phase-to-neutral voltage vectors) and the voltage
unbalance. The reference vector of the representation (at 3 o’clock) is V1.
● 3A: Displays a vector representation of the fundamentals of the phase-to-neutral voltages and of the currents. It
indicates their associated quantities (modulus and phase of the current vectors) and the current unbalance. The
reference vector of the representation (at 3 o’clock) is A1.
● L1/L2/L3: Displays a vector representation of the fundamentals of the phase-to-neutral voltages and the currents
of one phase. It indicates their associated quantities (modulus and phase of the current and phase-to-neutral
voltage vectors). The reference vector of the representation (at 3 o’clock) is the current vector.
Figure 5-39
Item Function
U1, U2, U3
V1, V2, V3
A1, A2, A3
φ
12
φ
23
φ
31
φ
VA
Unb
NOTE: L2 and L3 display vector representations of the fundamentals of the phase-to-neutral voltages and the currents of
phases 2 and 3, respectively. They indicate their associated quantities (modulus and phase of the current and phase-toneutral voltage vectors of phases 2 and 3, respectively). The reference vector of the representation (at 3 o’clock) is the
current vector (A2 and A3, respectively).
Power Quality Analyzer PowerPad® III Model 8336
Absolute values of the voltages at fundamental frequency
Absolute values of the voltages at fundamental frequency
Absolute values of the current at fundamental frequency
Phase displacement of phase 1 relative to phase 2
Phase displacement of phase 2 relative to phase 3
Phase displacement of phase 3 relative to phase 1
Phase displacement of voltage (V) relative to current (A)
Unbalance of line voltages
69
Page 73

5.4 ALARM MODE
The Alarm mode detects overshoots of thresholds on each of the following parameters:
Hz
Urms
Vrms
Arms
|Udc|
|Vdc|
|Adc|
|Upk+|
|Vpk+|
|Apk+|,
|Upk-|
|Vpk-|
|Apk-|
Ucf
Vcf
Acf
Uthdf
Vthdf
Athdf
Uthdr
Vthdr
Athdr
|P|
|Pdc|
|Q1| or N
D
S
|PF|
|cos Φ
|tan Φ
PST
PLT
FHL
FK
Vunb (or Uunb for a 3-phase source without neutral)
Aunb
U-h
V-h
A-h
|S-h|
(See also the table of abbreviations in § 8.3)
The alarm thresholds must:
● have been programmed in the Conguration / Alarm mode screen (see § 4.1.8)
● be active (marked with a red spot on that same screen)
NOTE: Stored alarms can subsequently be transferred to a PC via the DataView data analysis program (see § 6).
You can capture over 16,000 alarms.
When the Alarm mode button . is pressed, the Detection Schedule screen will appear:
Item Measurement Type
Displays the Alarm mode configuration sub-menu
Displays alarm campaigns
Programs an alarm
Validates the programming of an alarm (after is selected, the icon appears)
Manually stops an alarm that is in progress
70
Figure 5-40
Power Quality Analyzer PowerPad® III Model 8336
Page 74

5.4.1 ALARM MODE CONFIGURATION
To program/display alarms, they must rst be congured (see § 4.1.8).
The
Alarm Mode conguration submenu displays the list of alarms congured (see § 4.1.8). This shortcut button
lets you dene or change alarm congurations. Press to return to the Detection Schedule (Programming a
Campaign) screen.
5.4.2 PROGRAMMING AN ALARM CAMPAIGN
The Detection Schedule screen species the start and stop times for an alarm campaign.
Figure 5-41
To program an alarm campaign, enter the start date and time, the stop date and time, and the name of the campaign.
To modify an item, move the yellow cursor to it using the up and down arrow buttons, then validate with the button.
Change the value using the arrow buttons, then validate again.
The name can be up to eight characters long. Several campaigns can have the same name. Allowable characters are
uppercase letters A through Z and digits 0 through 9. The last ve names assigned (in the transient, trend, and alarm
modes) are kept in memory. When a name is entered, it can then be completed automatically.
NOTE: The start date and time must be later than the current date and time. The stop date and time must be later
than the start date and time. You cannot program an alarm campaign if an inrush current capture is in progress.
5.4.3 STARTING AN ALARM CAMPAIGN
After the settings are entered, the campaign can be started by pressing the button. The icon on the status bar
blinks to indicate that the campaign has been started. The button replaces the button and can be used to stop the
campaign before it is nished.
Alarms in progress (not yet ended) are recorded in the campaign if their duration is equal to or greater than their
programmed minimum duration. The message “Campaign on standby” is displayed until the start time is reached. It is
then replaced by the message “Campaign running.”
When the stop time is reached, the Detection Schedule screen returns with the button. You can then program another
campaign.
NOTE: During an alarm campaign, only the stop date eld can be modied. It is automatically highlighted in yellow.
Power Quality Analyzer PowerPad® III Model 8336
71
Page 75

5.4.4 MANUALLY STOPPING AN ALARM CAMPAIGN
2 3
1
An alarm can be manually stopped before the stop date and time by pressing the icon’s yellow button. The OK icon will
reappear in the same location.
5.4.5 DISPLAYING A LIST OF ALARM CAMPAIGNS
To display the list of campaigns performed, press the button. The Detection List screen is displayed.
Figure 5-42
Item Function
1
Name of the campaign
2
Start date and time of the campaign
3
Stop date and time of the campaign
If the stop date of the campaign is in red, it does not match the stop date initially programmed for one of the following
reasons:
● Power supply problem (battery low or disconnection of the instrument supplied by AC power only).
● Memory is full.
72
Power Quality Analyzer PowerPad® III Model 8336
Page 76

5.4.6 LIST OF ALARMS
To select a campaign, move the cursor to it using the ▲ and ▼ arrow buttons. The selected eld is bolded. Then validate
with the button. The instrument then displays the alarms in list form.
2 3 4 5
1
Figure 5-43
Item Function
1
Alarm date and time
2
Target of alarm detected
3
Type of alarm detected
4
Minimum or maximum (configuration dependent) of alarm detected
5
Dynamic filter (connection type dependent)
If an alarm duration is displayed in red, it was cut short for one of the following reasons:
● Power supply problem (battery low)
● Manual stoppage of the campaign by pressing or by turning the instrument OFF
● Memory is full
● Measurement error
● Incompatibility between the quantity monitored and the conguration of the instrument (for example withdrawal of
a current sensor)
In the last two cases, the minimum or maximum (whichever is applicable) s also displayed in red. To return to the
Detection List screen, press .
Power Quality Analyzer PowerPad® III Model 8336
73
Page 77

5.4.7 DELETING ALARM CAMPAIGNS
3 6
5
4
1
2
5.4.7.1 DELETING A SINGLE ALARM CAMPAIGN
When the list of campaigns performed is displayed (see Figure 5-42), select the campaign to be deleted by moving the
cursor to it using the up and down arrow buttons. The selected campaign is bolded. Then press the button. Press
to conrm the deletion or to cancel.
NOTE: You cannot delete an alarm campaign in progress.
5.4.7.2 DELETING ALL ALARM CAMPAIGNS
Erasing all alarm campaigns from memory is performed via the Conguration menu, in the Erase Memory sub-menu (see
§ 4.1.9).
5.5 TREND MODE
5.5.1 PROGRAMMING AND STARTING A RECORDING
The Trend mode records changes to parameters previously specied in Trend mode conguration screen (see §
4.1.7). Pressing this button displays the Recording Schedule screen.
Figure 5-44
Item Function
1
Memory card usage
2
Rapid programming and starts a recording
3
Shortcut to the Trend Mode configuration screen
4
The screen species the characteristics of a recording (see Figure 5-44). To quickly start a recording, press the
button. Recording starts immediately; all measurements are recorded every second until the memory or completely full.
The conguration displayed is .
74
Displays a list of recordings
5
Programs a recording
6
Starts a recording
Power Quality Analyzer PowerPad® III Model 8336
Page 78

To program a recording, set the parameters listed in the Recording Schedule screen:
● Set-up identies the conguration
through .
● Start denes the time and date when the recording starts. The start date and time must be later than the current
date and time.
● Stop species when the recording ends. This must be later than the start date and time.
● Period is the time over which the measurements of each recorded value are averaged (arithmetic mean).
Allowable values are 1s, 5s, 20s, 1min, 2min, 5min, 10min, and 15min.
● Name can be up to eight characters long. Several recordings can have the same name. Allowable characters are
uppercase A through Z and the numbers 0 through 9. The last ve names assigned (in the transient, trend, and
alarm modes) are kept in memory. When a name is entered, it can then be completed automatically.
To modify an item, move the yellow cursor to it using the up and down arrow buttons, then press the button. Change
the value using the arrow buttons, then press again to conrm.
After you nish setting the parameters, start the recording by pressing the button. If not enough memory is available,
an error message appears informing you of this. The icon in the status bar blinks to indicate that recording has begun.
NOTE: The button replaces the button and can be used to stop the recording before it is nished.
The “Recording on standby” message is displayed until the start time is reached. It is then replaced by the message
“Recording running.” When the stop time is reached, the Recording Schedule screen returns with the button
displayed. You can then program a new recording. During the recording of a trend, only the stop date eld can be
modied. It is automatically highlighted in yellow.
5.5.2 VIEWING THE RECORDING LIST
The Recording List submenu displays the recording list already made..
21 3 4
Figure 5-45
Item Function
1
Recording name
2
Memory usage (black indicates % of memory used)
3
Recording start time
4
Recording end time
If the stop date is in red, it does not match the stop date initially programmed because of a power supply problem (battery
low or disconnection of the instrument from AC power).
Power Quality Analyzer PowerPad® III Model 8336
75
Page 79

5.5.3 DELETING RECORDINGS
When the list of records is displayed (see Figure 5-45), select the recording to be deleted using the ▲ or ▼ button. The
selected recording is bolded. Press the button. Press the button to conrm deletion, or the button to cancel.
5.5.4 VIEWING RECORDS
When the list of records is displayed (see Figure 5-45), use the up and down arrow buttons to select the record to be
displayed. The selected recording is bolded. Press to validate.
1 2
Figure 5-46
Item Function
1
Types of measurement chosen upon configuration
2
Displays additional pages of parameters
If a measurement does not appear in the tabs, it was incompatible with the conguration chosen (connection, types
of sensors, ratios programmed). For example, if the calculation mode chosen during the programming is “Non-active
Quantities not separated” (see § 4.1.3), the D tab does not appear. Press the appropriate yellow button to display a
specic graph.
5.5.5 TREND GRAPHS
1
2
3
4
76
Figure 5-47
Power Quality Analyzer PowerPad® III Model 8336
Page 80

Item Function
1
Position of viewing window in the record
2
Date indicated by the cursor position
3
Indicates that this screen is a partial view of the trend graph. There are other screens before and after this screen.
4
Use the ▲ and ▼ arrow buttons to move the cursor.
The display period of this graph is one minute. Since the period of the record is one second, each point on the graph
corresponds to a value recorded in a one-second window once per minute. There is therefore a substantial loss of
information (59 values out of 60), but the display is rapid.
NOTE: Values of the cursor in red indicate saturated values. Black dashes indicate erroneous values. Red dashes
indicate values that are not calculated (following the end of calculation of the MIN-MAX-AVG mode when is
pressed).
1 2
Figure 5-48
Item Function
1
Indicates that the MIN-AVG-MAX mode is active
2
Changes the scale of the display between 1 minute and 5 days
The display period of the graph shown in Figure 5-48 is one minute. With the MIN-AVG-MAX mode activated, each point
of this graph represents the arithmetic mean of 60 values recorded every second. This graph is therefore more precise
than the graph shown in Figure 5-47, since there is no loss of information. It is slower, however.
To stop the calculation of the MIN-AVG-MAX mode, press .
NOTE: While MIN-AVG-MAX mode is being calculated, a progress bar is displayed for this calculation in the status
strip instead of the recording display window positioning bar. The MIN-AVG-MAX mode is not available while a trend
is being recorded.
To return to the Recording Parameters screen, press .
Power Quality Analyzer PowerPad® III Model 8336
77
Page 81

1
Figure 5-49
2
Item Function
1
Places cursor on first occurrence of minimum value
2
Places cursor on first occurrence of maximum value
Pressing the or button automatically sets “zoom in” to the highest level (the display period is identical to the
recording period) and deactivates the MIN-AVG-MAX mode if previously activated.
4
1
2
3
Figure 5-50
Item Function
1
Graph of MAX
2
Graph of AVG
3
Graph of MIN
4
Values at cursor position (MIN-AVG-MAX)
The display period of the graph shown in Figure 5-50 is one minute. Each point of the AVG graph represents the
arithmetic mean of 60 values recorded every second. Each point of the graph of the MAX represents the maximum of
the 60 values recorded every second. Each point of the graph of the MIN corresponds to the minimum of the 60 values
recorded every second. This display is therefore more precise than the one illustrated in Figure 5-49.
78
Power Quality Analyzer PowerPad® III Model 8336
Page 82

Figure 5-51
For each of the phases (L1, L2, and L3), at each recording of a value over one second (recording period), the instrument
also records the minimum half-cycle RMS value over one second and the maximum half-cycle RMS value over one
second. These are the three graphs shown in Figure 5-51.
Figure 5-52
This graph differs slightly from the one shown in Figure 5-51 because, with the MIN-AVG-MAX mode, there is no loss of
information.
NOTE: For the quantities (P, Pdc, VAR, S, D, PF, cos Φ and tan Φ) and for a 3-phase source without neutral, only the
total quantities are represented.
Figure 5-53
This graph is an example of tan Φ (L1) without MIN-AVG-MAX for a 3-phase connection with neutral.
Power Quality Analyzer PowerPad® III Model 8336
79
Page 83

Figure 5-54
This graph is an example of tan Φ (L1) with MIN-AVG-MAX.
1
Figure 5-55
Item Function
1
Sum of powers of the three phases is presented in bar graph form.
2
Changes the scale of display between 1 minute and 5 days.
2
For the energy graphs, the quantities are expressed in Wh, J, toe, or BTU, depending on the unit chosen in the
conguration of the instrument (see § 4.1.3.2).
Figure 5-56
This graph (Figure 5-56) differs slightly from the previous one because, with the MIN-AVG-MAX mode, there is no loss of
information.
80
Power Quality Analyzer PowerPad® III Model 8336
Page 84

The MIN-AVG-MAX mode can be activated for the powers to be displayed (above the graph) the mean power value at the
cursor date along with the maximum and minimum power values. Note that, in contrast with the other quantities, only the
bar chart of mean values is represented.
1
2
Figure 5-57
3
Item Function
1
Start date of selected period
2
Energy calculation mode. Pressing this button lets you define the start of the selection.
3
Date indicated by cursor (defines end date of selected period). Use the ◄ and ► buttons to move the cursor.
The display period of this bar chart is one minute. Since the recording period is one second, each bar of this bar chart
represents a value recorded in a one-second window once a minute. The energy calculation mode determines the sum of
the powers on the selected bars.
Figure 5-58
With the MIN-AVG-MAX mode activated, the display differs slightly from the previous one because there is no loss of
information.
Power Quality Analyzer PowerPad® III Model 8336
81
Page 85

1
2
3
4
Figure 5-59
Item Function
1
Position of viewing window in record.
2
Date defined by cursor position.
3
Indicates that this screen is a partial view of the trend graph. There are other screens before and after this visible screen.
4
Use the ◄ and ► buttons to move the cursor.
The period of display of this graph is two hours. Since the recording period is one second, each point of this graph
represents a value recorded every second taken every two hours. There is therefore a substantial loss of information
(7199 out of 7200), but the display is rapid.
1
Figure 5-60
Item Function
1
Indicates MIN-AVG-MAX mode has been activated.
This graph differs considerably from the one illustrated by Figure 5-59 in that MIN-AVG-MAX mode is activated. Each
point of the AVG curve represents the arithmetic mean of 7,200 values recorded every second. Each point of the graph
of the MAX represents the maximum of the 7,200 values recorded every second. Each point of the graph of the MIN
corresponds to the minimum of the 7,200 values recorded every second. This display is therefore more precise, because
there is no loss of information, but it is slower.
82
Power Quality Analyzer PowerPad® III Model 8336
Page 86

Item Function
1
You can stop the loading of recorded values and calculation of the values displayed at any time by pressing this button.
Item Function
1
Dashes indicate that the value is not available at the cursor position because it was not calculated.
1
Figure 5-61
1
Figure 5-62
Display of the record is not complete because construction was stopped before the end.
Figure 5-63
Item Function
1
Changes the scale of the display between 1 minute and 5 days.
Power Quality Analyzer PowerPad® III Model 8336
1
83
Page 87

The display has not been stopped and is therefore complete.
The following table indicates the time needed to display the graph on screen as a function of the width of the display
window for a recording period of one second:
Width of display window
(60 points or increments)
5 days 2 hours
2.5 days 1 hour
15 hours 15 minutes
10 hours 10 minutes
5 hours 5 minutes
1 hour 1 minute
20 minutes 10 seconds
5 minutes 5 seconds
1 minute 1 second
Grid increment
Typical waiting time for
display with the
MIN-AVG-MAX mode
deactivated
11 seconds
6 seconds
2 seconds
2 seconds
1 second
1 second
1 second
1 second
1 second
Typical waiting time for display
MIN-AVG-MAX mode
1 minute 15 seconds
These times can be long; you can stop the display at any time by pressing .
You can also, at any time, press:
● or to change the scale of the display
● ◄ or ► to move the cursor
● ▲ or ▼ to change the display lter
NOTE: Pressing these buttons may restart the loading and/or calculation of the values from the beginning.
with the
activated
10 minutes
5 minutes
50 seconds
25 seconds
8 seconds
2 seconds
1 second
1 second
84
Power Quality Analyzer PowerPad® III Model 8336
Page 88

5.6 POWER AND ENERGY MODE
The Power and Energy button displays power and energy measurements. The sub-menus available depend on
which lter is selected:
■ For 2- and 3-wire single-phase connections and for the 2-wire 2-phase connection, only L1 is available. The lter is
therefore not displayed; but the display is the same as for L1.
■ For the 3-wire 3-phase connection, only the Σ lter selection is available. The lter is therefore not displayed, but the
display is the same as for Σ.
5.6.1 3L FILTER
5.6.1.1 POWER
The W... sub-menu is used to display power.
Figure 5-64
Item Function
P (W)
Pdc (W)
Q1 (var)
D (var)
S (VA)
W...
PF...
Wh...
On the right side of the screen are a set of lters: 3L, L1, L2, L3, and Σ. Use the ▲ and ▼ buttons to choose the lter.
The values displayed on the Power and Energy screens are dependent on which of these lters is selected; different data
will appear for different lters. The following sections describe how these screens appear for the 3L, L1/L2/L3 (all three
display the same elds), and Σ lters.
Active power
DC power ( only if a DC current sensor is connected)
Reactive power
Distortion power
Apparent power
Power
Power Factor (this button is only available for the 3L filter)
Energy Meters (this button is not available for the 3L filter)
Energy consumed (active, reactive, and apparent power) (this button is only available for the 3L filter)
Energy generated (active, reactive, and apparent power) (this button is only available for the 3L filter)
NOTE: This screen corresponds to the choice “non-active quantities separated” in the AR tab of the Calculation Meth-
ods menu in Conguration mode. If the choice is “non-active quantities combined” the D label (distortion power) does
not appear, and Q1 is replaced by N. This non-active power is unsigned and has no inductive or capacitive effect.
Power Quality Analyzer PowerPad® III Model 8336
85
Page 89

5.6.1.2 QUANTITIES ASSOCIATED WITH POWER
The PF... sub-menu displays the quantities associated with power.
Figure 5-65
The values in this screen are as follows:
Item Function
PF
Power factor
cos Φ
tan Φ
Φ-VA
Fundamental power factor (also called DPF - displacement factor)
Tangent of phase shift
Phase shift of voltage with respect to current
5.6.1.3 ENERGY CONSUMED
The Energy Consumed sub-menu displays the meters of energy consumed by the load.
Figure 5-66
NOTE: This screen corresponds to the choice “non-active quantities separated” in the VAR tab of the Calculation
Methods menu in Conguration mode. If the choice is “non-active quantities combined” Dh does not appear and Q1h
is replaced by Nh. This non-active energy has no inductive or capacitive effect.
86
Power Quality Analyzer PowerPad® III Model 8336
Page 90

Item Function
Ph (Wh)
Pdch (Wh)
Q1h (varh)
Dh (varh)
Sh (VAh)
Active energy consumed
DC energy (only if a DC current sensor is connected)
Reactive energy consumed
Distortion energy.
Apparent energy consumed
Inductive reactive effect
Capacitive reactive effect
5.6.1.4 ENERGY GENERATED
The Energy Generated screen displays the meters of the energy generated by the load.
Figure 5-67
NOTE: This screen corresponds to the choice “non-active quantities separated” in the VAR tab of the Calculation
Methods menu in Conguration mode. If the choice is “non-active quantities not separated” Dh does not appear and
Q1h is replaced by Nh. This non-active energy has no inductive or capacitive effect.
Power Quality Analyzer PowerPad® III Model 8336
87
Page 91

5.6.2 L1, L2, AND L3 FILTERS
5.6.2.1 POWERS AND ASSOCIATED QUANTITIES
The W... sub-menu displays the power and associated quantities.
Figure 5-68
The values in this screen are as follows:
Item Function
P (W)
Pdc (W)
Q1 (var)
D (var)
S (VA)
PF
cos Φ
tan Φ
Φ-VA
Filters L2 and L3 display the same information for phases 2 and 3.
Active power
DC power
Reactive power
Distortion power
Apparent power
Power factor
Fundamental power factor (also called DPF - displacement factor)
Tangent of the phase shift
Phase shift of voltage with respect to current (Φ is displayed for the 2-wire 2-phase set-up.
NOTE: This screen corresponds to the choice “non-active quantities separated” in the VAR tab of the Calculation
Methods menu in Conguration mode. If the choice is “non-active quantities combined” D (distortion power) does not
appear and Q1 is replaced by N. This non-active energy has no inductive or capacitive effect.
Φ-UA is displayed for the 2-wire 2-phase set-up.
88
Power Quality Analyzer PowerPad® III Model 8336
Page 92

5.6.2.2 ENERGY METERS
The Wh... sub-menu displays the energy meters.
The values in this screen are as follows:
Item Function
Meters of the energy consumed by the load
Meters of the energy generated by the load
Figure 4-69
Filters L2 and L3 display the same information for phases 2 and 3.
5.6.3 Σ FILTER
5.6.3.1 TOTAL POWERS AND ASSOCIATED QUANTITIES
When the Σ lter is selected, the W... sub-menu displays the powers and associated quantities.
Figure 4-70
NOTE: This screen corresponds to the choice “non-active quantities separated” in the VAR tab of the Calculation
Methods menu in Conguration mode. If the choice is “non-active quantities combined” D does not appear and Q1 is
replaced by N. This non-active energy has no inductive or capacitive effect.
Filters L2 and L3 display the same information for phases 2 and 3.
Power Quality Analyzer PowerPad® III Model 8336
89
Page 93

Item Function
P (W)
Pdc (W)
Q1 (var)
D (var)
S (VA)
PF
cos Φ
tan Φ
Φ-VA
Total active power
Total DC power
Total reactive power
Total distortion power
Total apparent power
Total power factor
Total fundamental power factor (also called DPF - displacement factor)
Total tangent
Phase shift of voltage with respect to current (Φ is displayed for the 2-wire 2-phase set-up.
5.6.4 TOTAL ENERGY METERS
The Wh... sub-menu displays the energy meters.
Figure 4-71
Item Function
Meters of the energy consumed by the load
Meters of the energy generated by the load
Ph (Wh)
Pdch (Wh)
Q1h (varh)
Dh (varh)
Sh (VAh)
NOTE: This screen corresponds to the choice “non-active quantities separated” in the VAR tab of the Calculation
Methods menu in Conguration mode. If the choice is “non-active quantities combined” Dh does not appear and Q1h
is replaced by Nh. This non-active energy has no inductive or capacitive effect.
For the 3-wire 3-phase set-up, only the display of total quantities is available; the method of calculation of the powers
used is the two-wattmeter method.
Total active energy consumed
Total DC energy (only if a DC current sensor is connected)
Total reactive energy consumed
Total distortion energy.
Total apparent energy consumed
Total inductive reactive effect
Total capacitive reactive effect
90
Power Quality Analyzer PowerPad® III Model 8336
Page 94

5.6.5 STARTING AND STOPPING ENERGY MEASUREMENTS
To start a measurement:
1. Press the button while in an energy display ( , , or Wh...). The date and time at which the measuring
starts will appear in the upper left corner of the screen, and the icon on the screen blinks to indicate that energy
metering is in progress.
2. To stop the measurement, press the button. The date and time at which the measuring stops will appear in the
upper right corner of the screen. The icon is also replaced by the by icon.
3. To resume metering, press the button again.
NOTE: If no recording is in progress, disconnecting the energy metering results in the appearance of the blinking
icon in the status bar (in place of the icon).
5.6.6 RESETTING THE ENERGY MEASUREMENT
To reset the measurement, press the press the button to stop metering. Then press the button, and then to
conrm. All energy values (consumed and generated) are reset.
5.7 SCREEN SNAPSHOTS
The button enables you to take up to 50 screen snapshots and display the recorded snapshots. Saved screens can
then be downloaded to a PC using DataView.
Press the button for approximately three seconds to shoot any screen displayed on the instrument. When a screen
snapshot is taken, the icon of the active mode ( , , , , , , ) in the top strip of the display unit is
replaced by the icon. You can then release the button. The instrument can record only 50 screen snapshots. If you
want to record a 51st screen, the instrument informs you that snapshots must be deleted by displaying the icon in
place of .
1
2
4
3
Figure 5-72
Item Function
1
Available image memory. Black represents memory used.
2
List of saved snapshots. Each icon represents the type of screen recorded. It is followed by the date and time of the screen snapshot.
3
Icons for browsing through the screen pages.
4
Displays a list of snapshots.
NOTE: These screens can be downloaded to a computer using DataView
Power Quality Analyzer PowerPad® III Model 8336
®
91
Page 95

5.7.1 VIEWING A SNAPSHOT
■ A short press (about 1s) on the button gives access to the menu of snapshots that have been saved.
■ Use the arrow buttons to select the snapshot.
■ The date and time of the selected snapshot are bolded. Press to display the selected snapshot.
■ Press to return to the list of screen snapshots.
5.7.2 DELETING A SNAPSHOT
■ Select the snapshot that you want to delete using the arrow buttons.
■ Press the button and conrm the deletion by pressing .
To leave the screen without deleting any alarm, press the button.
5.8 HELP
Press this button to obtain help for the currently displayed mode.
To exit the Help mode, press the button once again.
92
Power Quality Analyzer PowerPad® III Model 8336
Page 96

6. DATAVIEW SOFTWARE
DataView is a software program that enables a PC to connect to and interact with a variety of AEMC instruments,
including the Model 8336. As its name implies, a primary purpose of DataView is to view data that has been recorded by
the instrument and displayed on the PC. With DataView you can:
● Connect PC to the instrument
● Download data
● Display and analyse data
● Generate reports
● Export to a spreadsheet
● Congure the instrument from the PC
6.1 INSTALLING DATAVIEW
DO NOT CONNECT THE INSTRUMENT TO THE PC BEFORE INSTALLING THE SOFTWARE AND DRIVERS.
When you purchase an AEMC instrument supported by DataView, the software is included as part of the product package.
DataView program les are stored on a USB stick.
NOTE: When installing, the user must have Administrative access rights during the installation. The users access
rights can be changed after the installation is complete. DataView must be reinstalled for each user in a multi-user
system.
6.1.1 USB FLASH DRIVE INSTALL
1. Insert the USB stick into an available USB port (wait for driver to be installed).
2. If Autorun is enabled then an AutoPlay window should appear as shown.
Figure 6-1
NOTE: If Autorun is disabled, it will be necessary to open Windows Explorer, then locate and open the USB stick drive
labeled “DataView” to view the les on the drive.
Power Quality Analyzer PowerPad® III Model 8336
93
Page 97

3. In the AutoPlay window, select Open Folder to view les.
4. Double-click on Setup.exe from the opened folder view to launch the DataView setup program.
NOTE: Depending on your operating system, the User Account Control dialog box may be displayed. Conrm when
prompted to proceed.
5. A Set-up window, similar to below, will appear.
Figure 6-2
There are several different options to choose from. Some options(*) require an internet connection.
● DataView, Version x.xx.xxxx - Installs DataView onto the PC.
● *Adobe Reader - Links to the Adobe® website to download the most recent version of Adobe® Reader to the
computer. Adobe® Reader is required for viewing PDF documents supplied with DataView.
● *DataView Updates - Links to the online DataView software updates to check for new software version releases.
● *Firmware Upgrades - Links to the online rmware updates to check for new rmware version releases.
● User Manuals - Shows a list of instrument related documents that you can view. Adobe® Reader is required for
viewing PDF documents supplied with DataView.
6. DataView, Version x.xx.xxxx option should be selected by default. Select the desired language and then click on
Install.
7. The Installation Wizard window will appear. Click Next.
8.
Read the terms of the license agreement. If agreeable, indicate your acceptance and click Next.
9. In the Customer Information window, enter a Name and Company, then click Next.
10.
In the Setup Type window that appears, select either Complete to install DataView les in the default directory, or
Custom to choose a directory. Then click Next.
11. The Select Features window appears. This enables you to select the DataView Control panels you want to install.
94
Power Quality Analyzer PowerPad® III Model 8336
Page 98

Figure 6-3
Select Power & Quality Analyzers and any other instrument control panel(s) that you want to install. You can also deselect
any Control Panel that you do not need. Then click Next.
NOTE: The PDF-XChange option must be selected to be able to generate PDF reports from within DataView.
12. In the Ready to Install the Program window, click on Install.
13. If the instrument selected for installation requires the use of a USB port, a warning box will appear, similar to Figure
6-4. Click OK.
Figure 6-4
NOTE: The installation of the drivers may take a few moments. Windows may even indicate that it is not responding,
however it is running. Please wait for it to nish.
14. When the drivers are nished installing, the Installation Successful dialog box will appear. Click on OK.
15. Next, the Installation Wizard Complete window will appear. Click on Finish.
16. A Question message box appears next. Click Yes to read the procedure for connecting the instrument to the USB
port on the computer.
NOTE: The Set-up window remains open. You can now select another option to download (e.g. Adobe® Reader), or
close the window.
Power Quality Analyzer PowerPad® III Model 8336
95
Page 99

17. Restart your computer, then connect the instrument to the USB port on the computer.
18. After the instrument is connected to the computer, the Found New Hardware dialog box appears. Windows will
complete the driver installation process automatically.
Shortcuts for DataView and each instrument Control Panel selected during the installation process will appear on your
desktop. The shortcut icon for the Control Panel for the Model 8336 will appear as and be labeled “PowerPad III”.
NOTE: If you connected your instrument to the computer before installing the software and drivers, you may need to
use the Add/Remove Hardware utility to remove the instrument driver before repeating the process.
6.2 CONNECTING THE MODEL 8336 TO YOUR COMPUTER
The Model 8336 is supplied with a USB cable required for connecting the instrument to the computer.
To connect the instrument to your computer:
1. Connect the USB cable to the port on the front panel of the instrument.
2. Connect the other end of the USB cable to a USB port on your computer.
3. Turn the instrument on.
You are now ready to use the DataView® software with the Model 8336.
6.3 OPENING THE CONTROL PANEL
To open the PowerPad III Control Panel:
1. Double-click the PowerPad III shortcut icon ( ) created on your desktop during DataView installation.
2. In the Menu bar at the top of the Control Panel interface, click Instrument.
3. From the drop-down menu, select Connect an Instrument. The Connect an Instrument Wizard screen appears.
Figure 6-5
The Model 8336 to which you are connected should appear in the Instrument drop-down list. Select the instrument’s
name and click Next.
4. The computer connects with the instrument. During this process a progress bar may appear on the screen. When
the connection is established, the message “Instrument has been identied, select Finish to continue” appears. Click
Finish to exit the Connect an Instrument Wizard.
96
Power Quality Analyzer PowerPad® III Model 8336
Page 100

The Control Panel user interface consists of multiple components for displaying, modifying, saving, and navigating data
recorded on the Model 8336.
Figure 6-6
The Control Panel user interface consists of multiple components for displaying, modifying, saving, and navigating data
recorded on the Model 8336.
■ At the very top of the Control Panel is the title bar. The title bar displays the name of the application and the path to
the open data le (if any).
■ Below the title bar is the menu bar. The menu bar contains six drop-down menus: File, Edit, View, Instrument, Tools,
and Help. Each command in these drop-down menus is associated with the menu name. For example, instrument
specic commands are listed under the Instrument menu.
■ Below the menu bar is the toolbar. The toolbar contains iconic representations of menu commands; each icon
performs the same function as its associated menu command when selected.
■ Below the toolbar and to the left is the navigation tree frame. The navigation tree operates much like Windows
Explorer does when exploring the folders on your computer. The selected entry in the navigation tree determines
what information is displayed in the data frame to the right. For example, selecting the My Open Sessions entry in
the navigation tree displays a list of the open sessions (if any) in the data frame. Other data shown in the data frame
includes data recorded from the instrument (recordings, photographs, alarms, transients, inrush), real-time data
currently being reported by the instrument (trend, waveform, harmonics. power, energy), campaigns, and DataView
reports.
■ Below the navigation and data frames is the status bar. The status bar displays a single line of help information (to the
left) and instrument connection status (to the right).
6.4 CONFIGURING THE INSTRUMENT
The PowerPad III Control Panel also enables you to congure every aspect of the Model 8336. Each eld is identical to
the programmable features available from the instrument’s front panel itself. Several of the functions are congured by
typing the appropriate value in the eld provided. Others are congured by clicking the available radio button or icon. To
congure the instrument, select Instrument from the menu bar, and then click Congure. This displays the Congure
Instrument dialog box.
Power Quality Analyzer PowerPad® III Model 8336
97
 Loading...