

Page 1
User Manual
ENGLISH
POWER CLAMP-ON METER
607
Page 2

2
Page 3

CONTENTS
PRECAUTIONS FOR USE .................................................................................. 7
MEASUREMENT CATEGORIES ......................................................................... 8
RECEIVING YOUR SHIPMENT ........................................................................... 8
ORDERING INFORMATION ................................................................................ 8
1 PRESENTATION .......................................................................................... 9
1.1 THE ROTARY SWITCH .............................................................................. 10
1.2 THE FUNCTION BUTTONS ....................................................................... 11
1.3 THE DISPLAY .............................................................................................. 12
1.3.1 Display Symbols ........................................................................... 12
1.3.2 Measurement Capacity Exceeded (OL) ........................................ 13
1.4 THE TERMINALS ........................................................................................ 14
2 THE BUTTONS ........................................................................................... 15
2.1
2.2 (YELLOW) BUTTON (second function) .............................................. 16
2.3
2.4 BUTTON .............................................................................................. 17
2.5 BUTTON .............................................................................................. 18
2.5.1 Normal Mode ................................................................................ 18
2.5.2 The MAX/MIN Mode + Activation of the HOLD Mode ................... 19
2.5.3 Access to the True Inrush® Mode ( set switch to ) .......... 19
2.6
2.6.1 Normal Mode ................................................................................ 20
2.6.2 Harmonic Order Display or + ................................. 20
2.6.3 The Hz Function + Activation of the HOLD Mode ......................... 21
3 USE ............................................................................................................. 22
3.1 INSTALLING THE BATTERIES .................................................................. 22
3.2 TURNING THE CLAMP-ON METER ON ................................................... 22
3.3 TURNING THE CLAMP-ON METER OFF ................................................. 22
3.4 CONFIGURATION ....................................................................................... 23
3.4.1 Auto Power Off .............................................................................. 23
3.4.2 Configuring the Current Threshol d for True InRush® .................... 23
3.4.3 Configuring the Recording Durat ion .............................................. 24
3.4.4 Erasing Recordings from Memory ................................................. 24
3.4.5 Default Configuration .................................................................... 24
3.5 VOLTAGE MEASUREMENT (V) ................................................................ 25
3.6 CONTINUITY TEST ............................................................................... 26
3.7 RESISTANCE MEASUREMENT ............................................................ 27
3.8 CURRENT MEASUREMENT (A) ................................................................ 27
3.8.1 AC Measurement .......................................................................... 27
BUTTON .............................................................................................. 15
BUTTON .............................................................................................. 16
BUTTON ............................................................................................. 20
3
Page 4

DC or AC+DC Measurement ........................................................ 28
3.8.2
3.9 STARTING CURRENT OR OVERCURRENT (True InRush®)
MEASUREMENT .................................................................................................... 30
3.10 POWER MEASUREMENTS W, VA, var AND PF ...................................... 32
3.10.1 Single-Phase Power Measurement ............................................... 32
3.10.2 Balanced 3-Phase Power Measurement ....................................... 33
3.10.3 Four Quadrant Diagram ................................................................ 34
3.11 ENERGY METERING MEASUREMENT ................................................... 35
3.12 FREQUENCY MEASUREMENT (Hz) ........................................................ 38
3.12.1 Frequency Measurement (V) ........................................................ 38
3.12.2 Frequency Measurement (A) ........................................................ 39
3.13 MEASUREMENT OF THD AND DISPLAY OF HARMONICS ORDER .... 39
3.13.1 Measurement of the THD (V) ........................................................ 39
3.13.2 Measurement of the THD (A) ........................................................ 40
3.13.3 Display of Individual Harmonics & Frequency Of Fundamental. ... 41
3.14 RECORDING OF MEASUREMENTS ........................................................ 42
3.15 Connecting to a Computer ........................................................................... 42
3.15.1 Bluetooth Connection .................................................................... 42
3.15.2 Pairing the Instrument to the Computer ........................................ 43
3.16 Turning Bluetooth ON/OFF .......................................................................... 46
3.17 Recording Data ............................................................................................ 46
3.17.1 Starting a Recording Session ........................................................ 46
3.17.2 Stopping a Recording Session ...................................................... 46
3.18 Downloading Recorded Data ....................................................................... 47
3.19 Erasing Data from Memory .......................................................................... 47
3.20 Data Storage ................................................................................................ 47
3.20.1 Trend Measurements .................................................................... 47
3.20.2 Recording with Memory Cleared ................................................... 47
3.20.3 Recording with a Partial or Full Memory ....................................... 48
3.20.4 Memory Filled During Recording Session ..................................... 48
3.21 SOFTWARE INSTALLATION ..................................................................... 48
3.21.1 Installing DataView® ...................................................................... 48
3.22 Opening the DATAVIEW Control Panel ...................................................... 51
3.23 Using the Control Panel ............................................................................... 51
3.24 Displaying Real-time Status Information ...................................................... 54
3.25 Resizing and Saving Real-time Window Layouts ........................................ 54
3.26 Downloading Recorded Instrument Data .................................................... 55
3.27 Power Clamp Meter Template ..................................................................... 57
4 SPECIFICATIONS ...................................................................................... 62
4.1 REFERENCE CONDITIONS ....................................................................... 62
4.2 SPECIFICATIONS UNDER THE REFERENCE CONDITIONS ................ 62
4.2.1 DC Voltage Measurement ............................................................. 62
4.2.2 AC Voltage Measurement ............................................................. 63
4.2.3 AC+DC Voltage Measurement ...................................................... 63
4.2.4 DC Current Measurement ............................................................. 64
4.2.5 AC Current Measurement ............................................................. 64
4.2.6 AC+DC Intensity Measurement .................................................... 65
4.2.7 True Inrush® Measurement ........................................................... 65
4.2.8 Calculation of the crest factor (CF) ............................................... 66
4
Page 5

Calculation of the RIPPLE in DC ................................................... 66
4.2.9
4.2.10 Continuity Measurement ............................................................... 66
4.2.11 Resistance Measurement ............................................................. 66
4.2.12 Active DC Power Measurements .................................................. 67
4.2.13 Active AC Power Measurements .................................................. 67
4.2.14 Active AC+DC Power Measurements ........................................... 69
4.2.15 Measurement of Apparent AC Po wer ........................................... 69
4.2.16 Measurement of Apparent AC+DC Power .................................... 70
4.2.17 Measurement of Reactive AC Power ............................................ 70
4.2.18 Measurement of Reactive AC+DC Power ..................................... 71
4.2.19 Calculation of the Power Factor (PF) ............................................ 71
4.2.20 Calculation of the Displacement P ower Factor (DPF) ................... 72
4.2.21 Frequency Measurements ............................................................ 72
4.2.22 Specifications in THDr .................................................................. 73
4.2.23 Specifications in THDf ................................................................... 73
4.2.24 Harmonic Measurement Specifications ......................................... 73
4.3 ENVIRONMENTAL CONDITIONS ............................................................. 74
4.4 MECHANICAL SPECIFICATIONS .............................................................. 74
4.5 POWER SUPPLY ........................................................................................ 74
4.6 COMPLIANCE WITH INTERNATIONAL STANDARDS ............................ 75
4.7 ENVIRONMENTAL VARIATIONS .............................................................. 76
5 MAINTENANCE .......................................................................................... 77
5.1 WARNING: ................................................................................................... 77
5.2 CLEANING ................................................................................................... 77
5.3 REPLACEMENT OF THE B ATTER IES ...................................................... 77
6 REP AIR AND CAL IBRATION .................................................................... 78
7 TECHNICAL AND SALES ASSISTANCE .................................................. 78
8 LIMITED WARRANTY ................................................................................ 79
9 WARRANTY REPAIRS .............................................................................. 79
5
Page 6

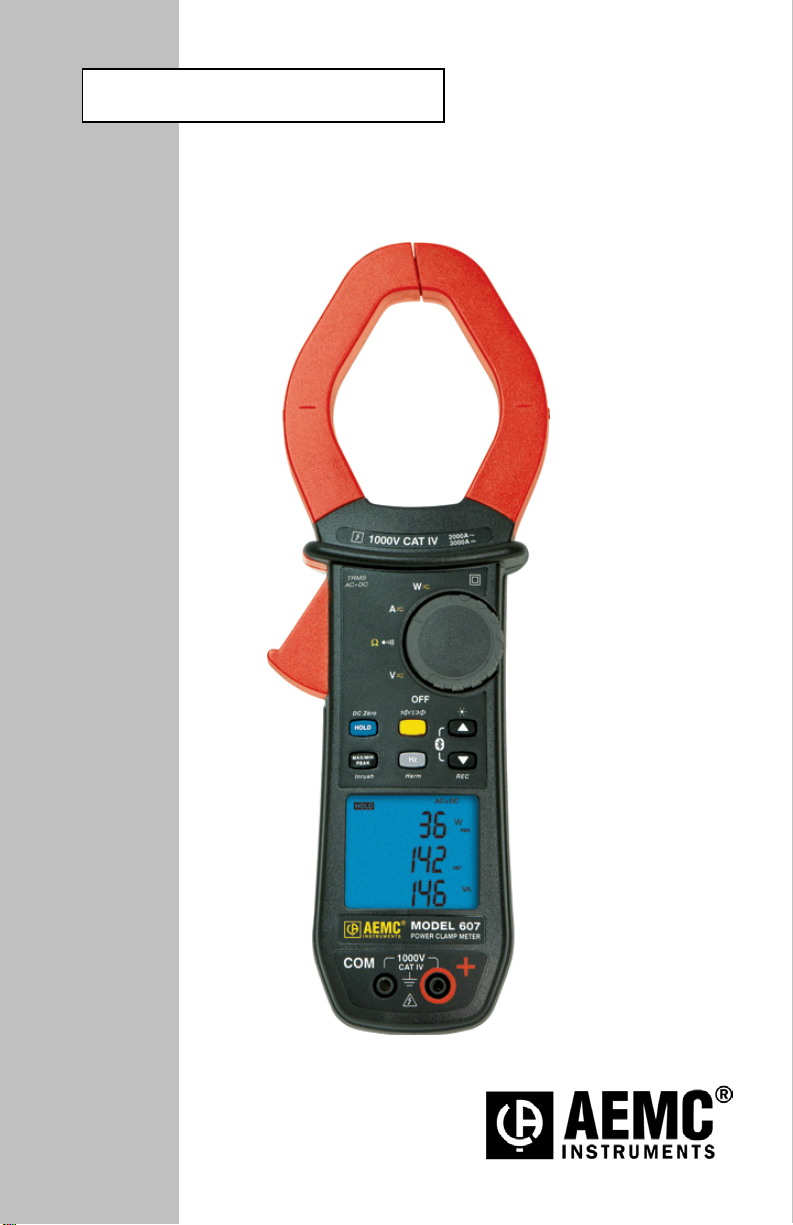
Thank you for purchasing a Model 607 Clamp-on Meter.
For best results from your instrument and for your safety, read the enclosed
operating instructions carefully an d comply with the precautions for use. These
products must be only used by qualified and trained users.
Meanings of the symbols used on the device
CAUTION - Risk of Danger! Indicates a WARNING and that the operator
must refer to the user manual for instructions before operating the
instrument in all cases where this symbol is marked.
Risk of electric shock. The voltage at the parts marked with this symbol may
be dangerous.
Refers to a type A current sensor. This symbol signifies that application
around and removal from HAZARDOUS LIVE conductors is permitted.
1.5 V battery
The CE marking indicates compliance with European directives
Double insulation or reinforced insulation
In the European Union, this product is subject to a separate collection
system for recycling electrical and electronic components In accordance
with directive WEEE 2002/96/EC
AC – Alternating current
AC and DC – Alternating and direct current
Ground/Earth
6
Page 7

PRECAUTIONS FOR USE
This device complies with safety standards IEC-61010-1 and 61010-2-032 for voltages of
1000V in category IV at an altitude of less than 2000m, indoors, with a degree of pollution
not exceeding 2.
These safety instructions are intended to ensure the safety of persons and proper operation
of the device.
The operator and/or the responsible authority must carefully read and clearly
understand the various precautions to be taken in use.
If this instrument is used other than as specified, the protecti on it provides may be
compromised, thereby endangering you.
Do not use the instrument in an explosive atmosphere or in the presence of flammable
gases or fumes.
Do not use the instrument on networks of which the voltage or category exceeds those
mentioned.
Do not exceed the rated maximum voltages and currents between terminals or with
respect to earth.
Do not use the instrument if it appears to be damaged, inc omplete, or not properly
closed.
Before each use, check the condition of the insulation on the leads, housing, and
accessories. Any element of which the insulation is deteriorated (even partiall y) must
be set aside for repair or scrapped.
Use leads and accessories rated for voltages and categories at least equal to those of
the instrument. If not, an accessory of a lower category lowers the category of the
combined Clamp + accessory to that of the accessory.
Observe the environmental conditions of use.
Do not modify the instrument and onl y use factory replacement parts. Repairs and
adjustments must be done by approved qualified personnel.
Replace the batteries as soon as the symbol appears on the displa y of the unit.
Disconnect all leads before opening the battery compartment cover.
Use personal protective equipment when conditions require.
Keep your hands away from the unused terminals of the instrument.
When handling the test probes, alligator clips, and clamp ammeters, keep your fingers
behind the physical guard.
As a safety measure, and to avoid repeated overloads on the inputs of the device,
configuration operations should only be performed when the device is disconnected
from all dangerous voltages.
7
Page 8

MEASUREMENT CATEGORIES
Definitions of the measurement categories:
CAT II: Circuits directly connected to the low-voltage installation.
Example: power supply to household electrical appliances and portabl e tools.
CAT III: Power supply circuits in the installation of the building.
Example: distribution panel, circuit-breakers, fixed industrial machines or
devices.
CAT IV: Circuits s upplying the low-voltage installation of the building.
Example: power lines, meters, and protection devices.
RECEIVING YOUR SHIPMENT
Upon receiving your shipm ent, make sure that the contents are consistent wi th the
packing list. Notify your d istributor of any missing it ems. If the equipm ent appears
to be damaged, file a cla im immediat ely with t he carrier a nd notif y your distrib utor
at once, giving a detailed descript ion of any damage. Save the damaged packing
container to substantiate your claim.
ORDERING INFORMATION
Clamp-on Meter Model 607 .......................................................... Cat. #2139.61
Includes set of 2 color-coded silicone insulated te st leads, test probes and alligator clips,
hard carrying case, 4x1.5V AA b atteries, Bluetooth adapter, safety information sheet and a
USB stick supplied with product user manual and DataView
Replacement Parts:
Hard Carrying Case ......................................................................... Cat. #2139.73
Set of 2 Color-coded Silicone Tes t Leads, Test Probes
and Alligator Clips ........................................................................... Cat. #2152.05
8
®
software.
Page 9
1
3
2
7
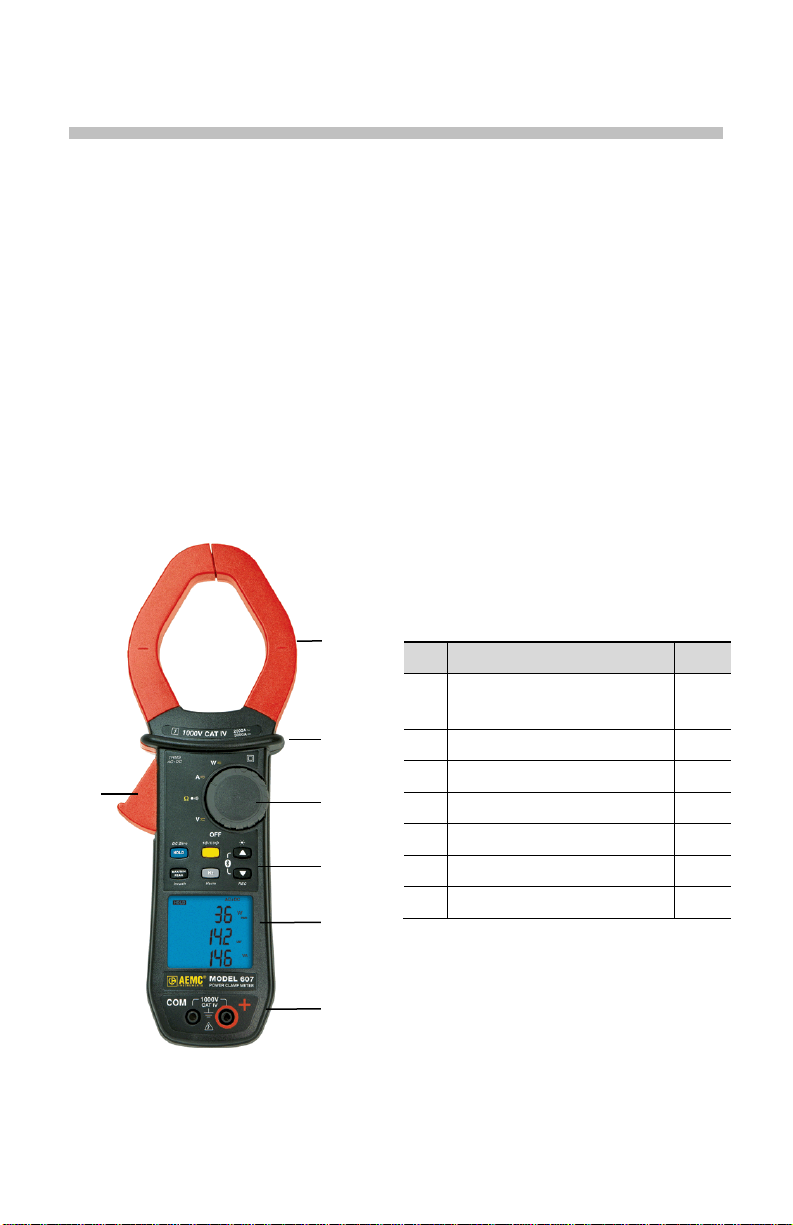
1 PRESENTATION
The Clamp-on Meter Model 607 is a profes sional elec trical m easuring inst rument
that combines the following funct i ons :
Current measurement
InRush current / overcurrent (True InRush
Voltage meas urement
Frequency measurement
Harmonic distortion (THD) measurement
Harmonic rank value (A and V) up to the 25th
Continuity test with buzzer
Resistance measurement
Power (W, VA, v ar and PF) and Energy measurements
Crest Factor (CF), the Displacement Power Factor (DPF) and RIPPLE
measurement
Recording of data in memory; wireless transfer via Bluetooth to a PC
Item
1
2 Physical Guard 3 Rotary Function Switch 1.1
4 Function Buttons 2
5 Backlit Display 1.3
4
5
6 Input Terminals 1.4
7 Trigger -
®
) measurement
Designation See §
Jaws with centering marks
(see connection principles)
3.5 to
3.13
6
Figure 1: Clamp-on Meter Model 607
9
Page 10
1 2 3 4 5
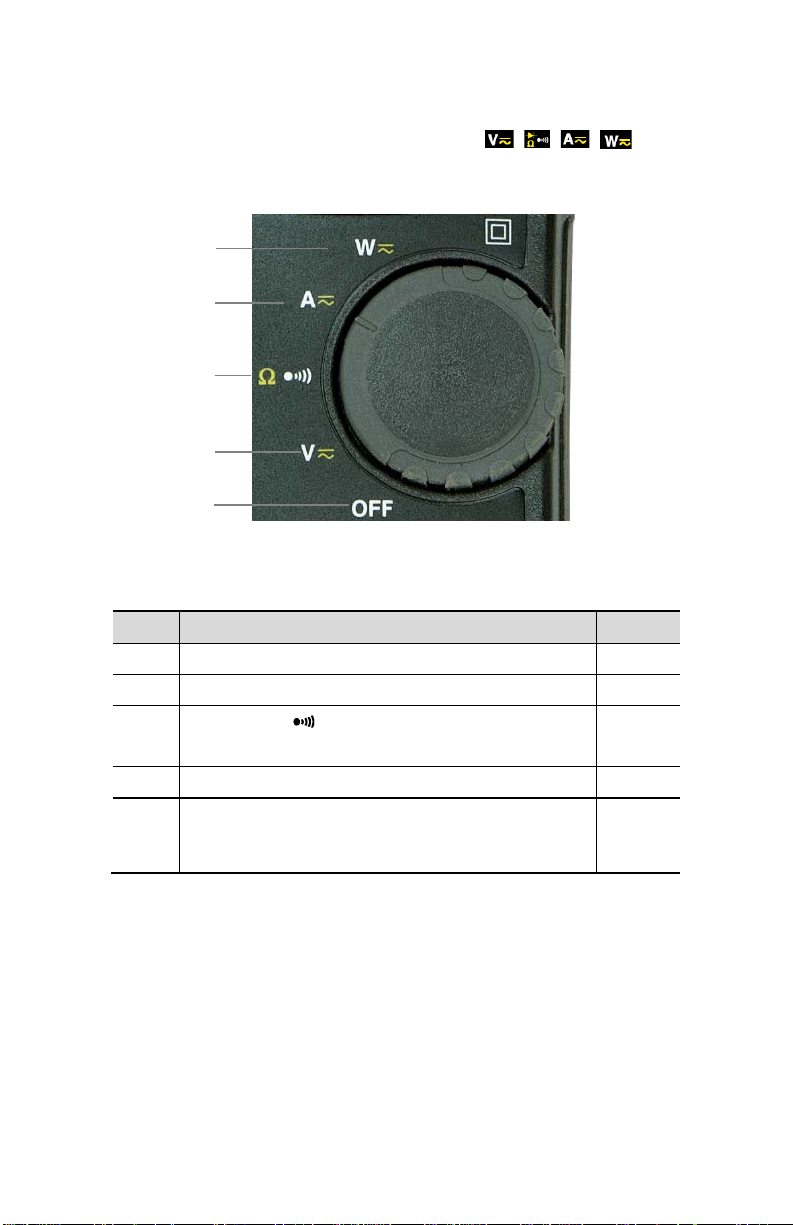
1.1 THE ROTARY SWITCH
The rotary switch has five pos itions. T o access the , , , functions,
set the switch to the desired function. The functions are described in the table
below.
Figure 2: The Function Rotary Switch
Item Function See §
1 OFF mode – Turns the clamp-on meter off 3.3
2 AC, DC, AC+DC voltage measurement (V) 3.5
Continuity test
3
Resistance measurement Ω
4 AC, DC, AC+DC current measurement (A) 3.8
Power measurements (W, var, VA) AC, DC, AC+ DC
6
Power factor (PF), displacement power factor (DPF), and
Energy Calculation
3.6
3.7
3.10
10
Page 11
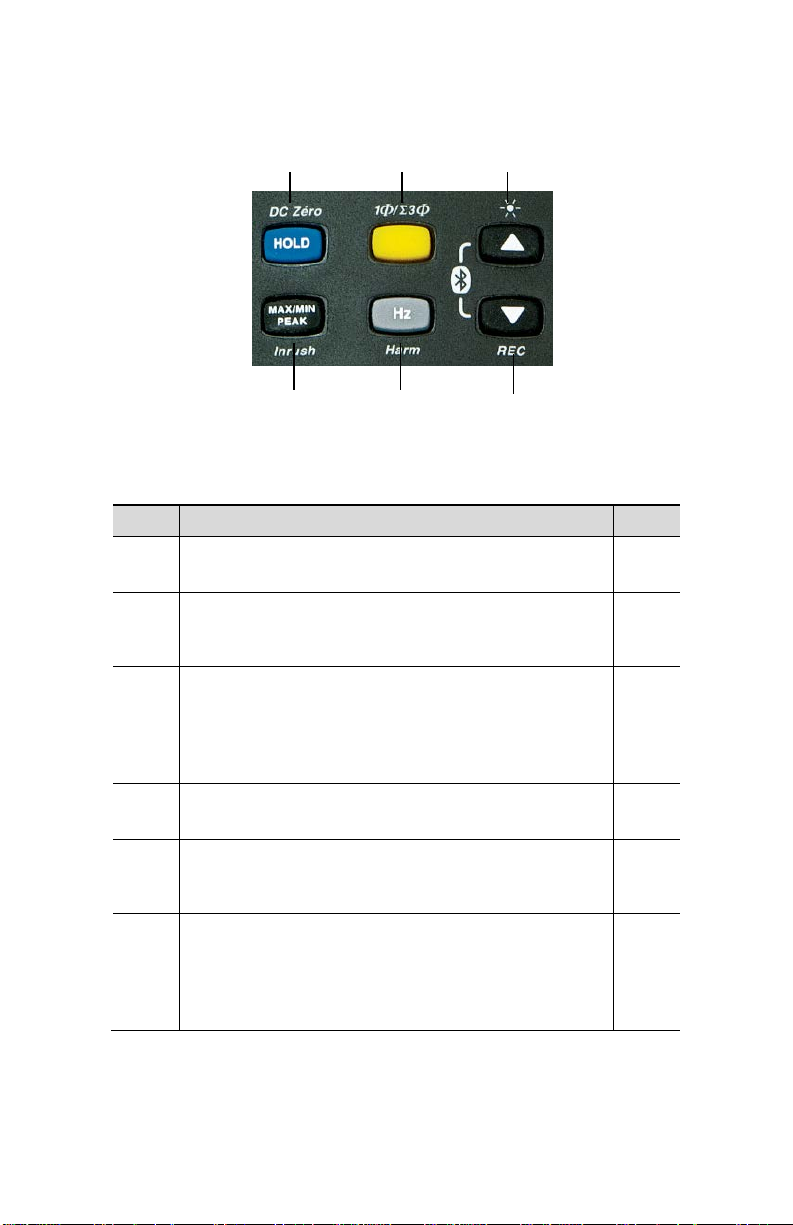
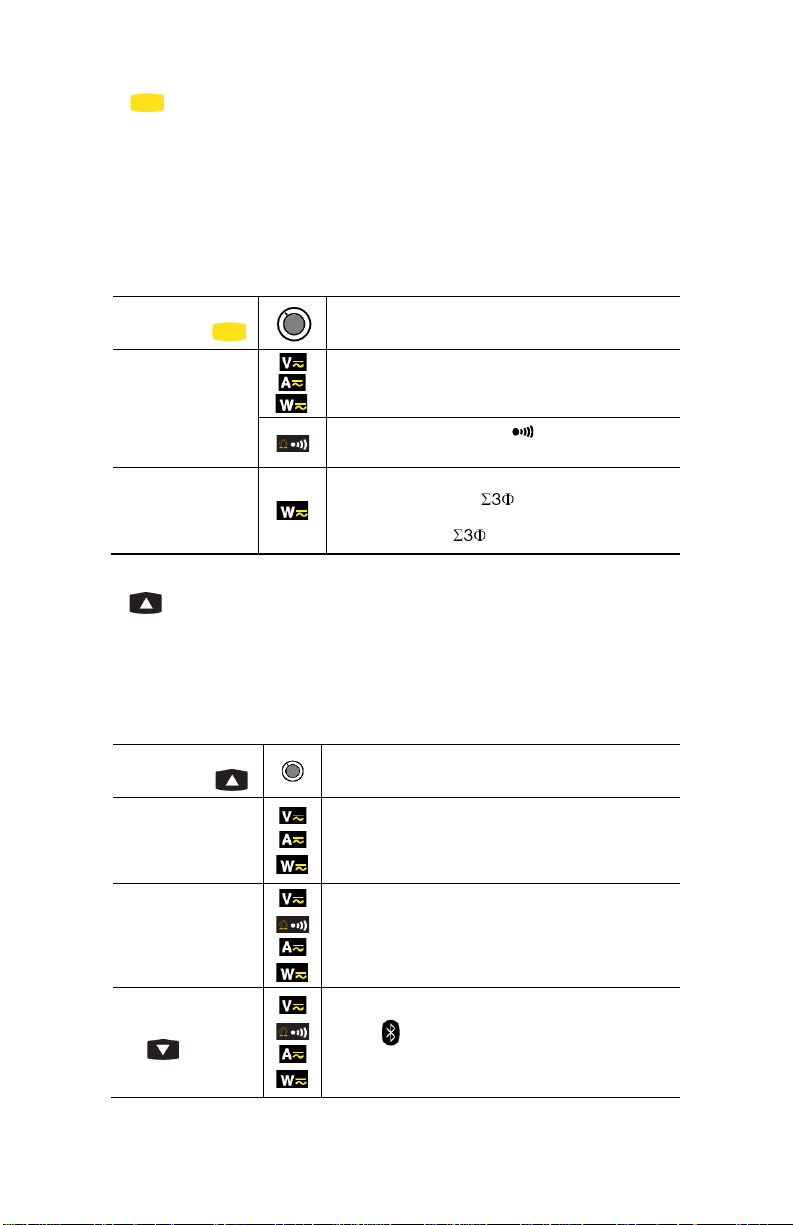
1.2 THE FUNCTION BUTTONS
1 2 3
4 5 6
Figure 3: The Function Buttons
Item Function See §
Holds the last value on the display
1
Zero correction A
Selects the type of measurement and configuration
functions (AC, DC, AC+DC)
2
Selection of single-phase or 3-phase measurement
Enables/disables display backlighting
Scrolls up the of orders of harmonics or of pages of results
3
in W, MAX/MIN/PEAK
Enables/disables Bluetooth wireless transfer (in combination
with 6)
Enables/disables the MAX/MIN/PEAK mode
4
Enables/disables the True InRush
Measures frequency (Hz), total harmonic distortion (THD),
and orders of harmonics
5
Enables/disables the energy metering mode
Scrolls down the orders of harmonics or of pages of results
in W, MAX/MIN/PEAK
6
Enables/disables recording of current data in memory
Enables/disables Bluetooth wireless transfer (in combination
with 3)
DC/AAC+DC/WDC/WAC+DC
®
mode in A
2.1
3.8.2
2.2
2.3
2.5
2.6
2.4
11
Page 12
AC+DC
Alternating and direct current
PEAK+
Maximum peak value
PEAK-
5 2 1
4
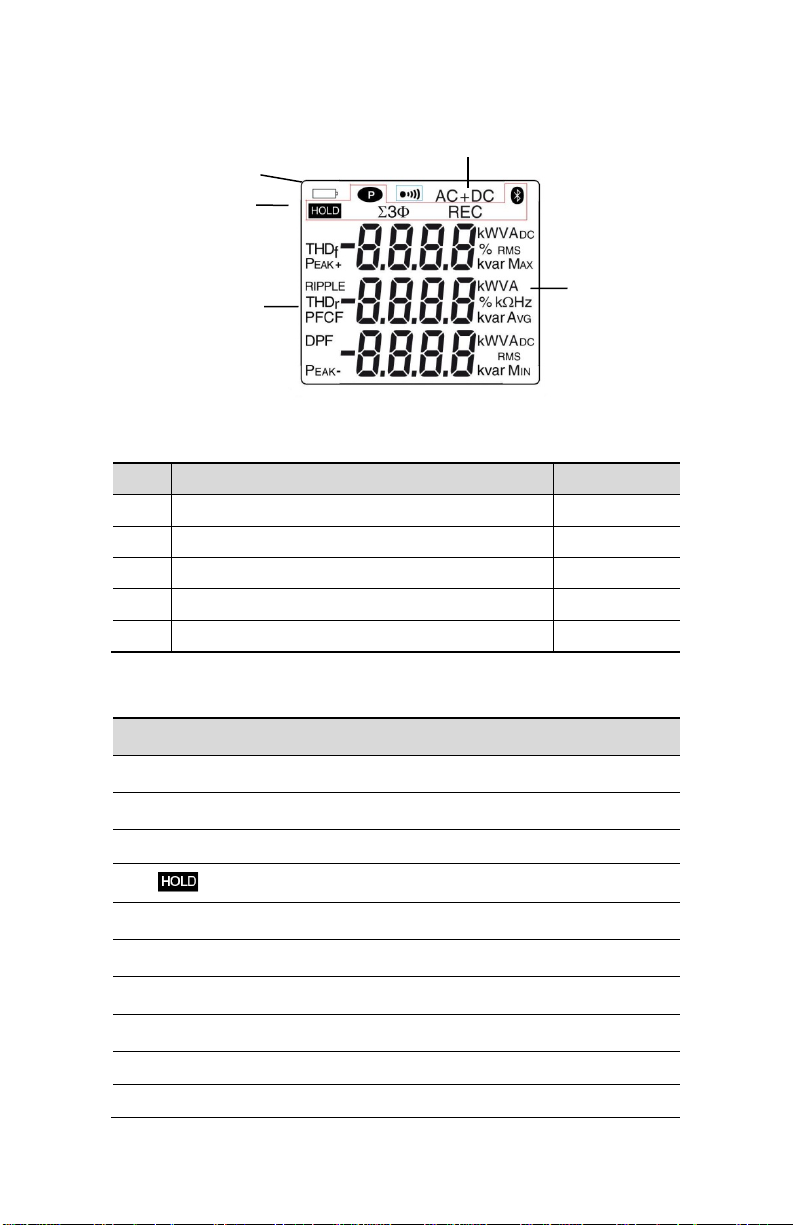
1.3 THE DISPLAY
3
Figure 4: The Display
Item Function See §
1 Mode selection display 2
2 Active measurement value and unit display 3.5 to 3.13
3 Display of the MAX/MIN/PEAK modes 3.10
4 Type of measurement (AC or DC) 2.2
5 Low battery indication 5.2
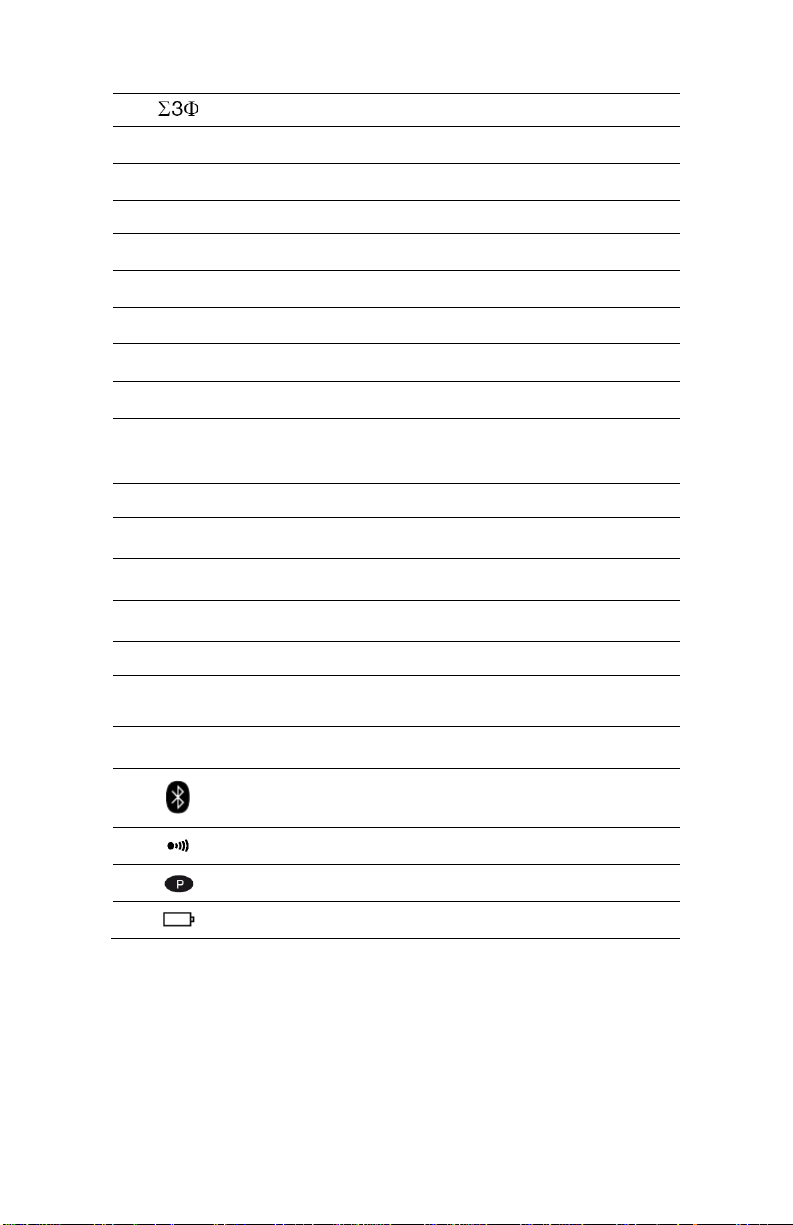
1.3.1 Display Symbols
Symbol Description
AC Alternating current or voltage
DC Direct current or voltage
RMS RMS value
Max Maximum DC or RMS value
Min Minimum DC or RMS value
AVG Mean RMS value
Storage of the values and display hold
Minimum peak value
12
Page 13
Balanced total 3-phase power measurement
W
var
Reactive power
VA
PF
Power factor
THDf
Total harmonic distortion with respect to the fundamental
Total harmonic distortion with respect to the true RMS
value of the signal.
V Volt
Hz Hertz
Active power
A Ampere
% Percentage
Ω Ohm
m Milli- prefix
k Kilo- prefix
Apparent power
DPF Displacement power factor (cos φ)
CF Crest factor
RIPPLE Ripple (in DC)
THDr
REC Recording in memory
Bluetooth wireless communication
Continuity test
Auto power off disabled
Low battery indicator
1.3.2 Measurement Capacity Exceeded (OL)
The OL (Over Load) symbol is displayed when the display capacity is exceeded.
13
Page 14
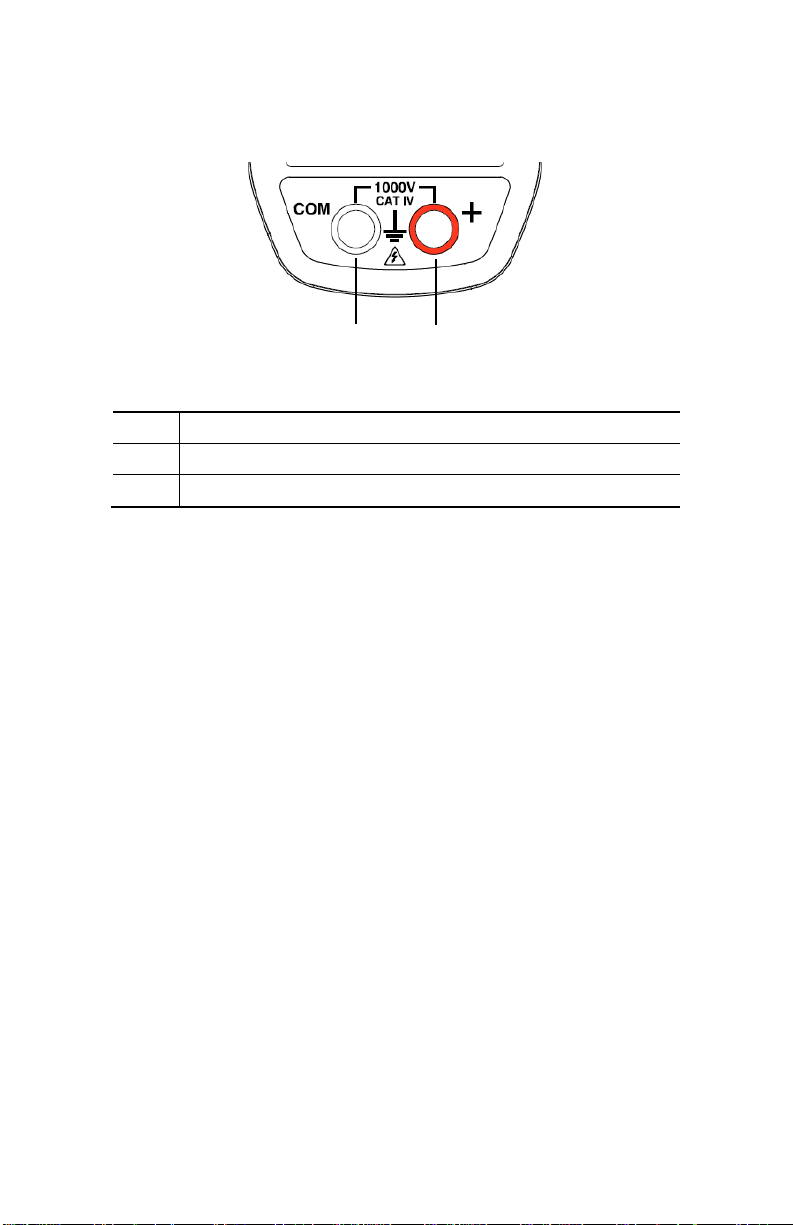
1.4 THE TERMINALS
The terminals are used as follows:
1 2
Figure 5: The Terminals
Item Function
1
COM (black) Input Terminal Jack
2 + Positive (red) Input Terminal Jack
14
Page 15
ADC
W
AC+DC
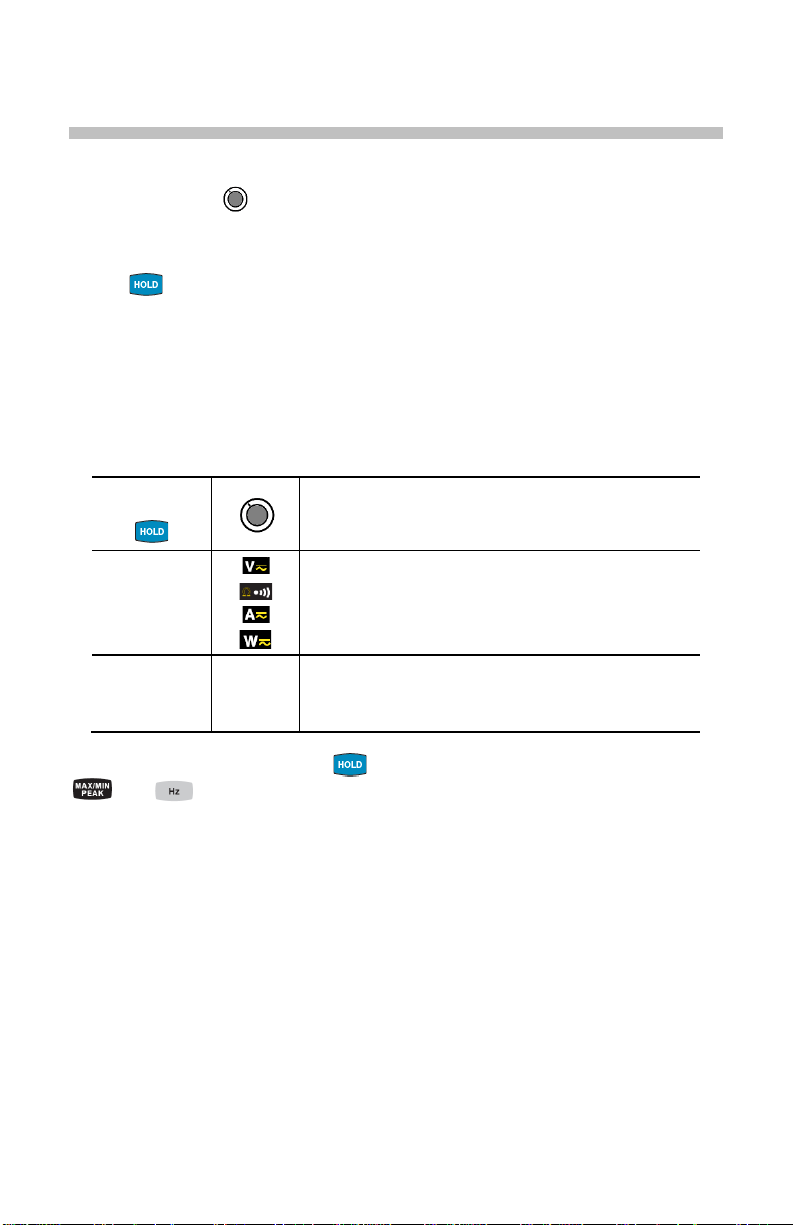
2 THE BUTTONS
The buttons respond differently to short, long, and sustained presses.
In this section, the icon represents the possibl e positions of the switch for the
button’s functionality.
2.1
BUTTON
This button is used to:
Store and look up the last values acquired specific to each funct i on (V, A,
Ω, W) according to the specific modes previous ly activated
(MAX/MIN/PEAK, Hz, THD). The present display is then maintai ned while
the detection and acquisition of new values continues.
Perform automatic zero correction in
Successive
presses on
long
(> 2 sec)
A
W
AC+DC
DC
First press: Holds the last value displayed
Second press: Returns to normal display mode (the
value of each new measurement is displayed)
Performs automatic zero correction (see 3.9.2)
NOTE: This mode operates if the MAX/MIN/PEAK or
HOLD modes (short press) are first de activated
See § 2.5.3 and § 2.6.3 for the button functionality in combination with the
and buttons.
ADC/
AC+DC
Function
and WDC/
(see § 3.9.2).
AC+DC
15
Page 16
2.2 (YELLOW) BUTTON (SECOND FUNCTION)
This button is used to select the t ype of m easureme nt (AC, DC, AC+DC) and the
second functions marked in yellow next to t he relevant positions of the swit c h.
It can also be used to modify the default values in the configuration mode
(see § 3.4).
NOTE: This button is invalid in the MAX/MIN/PEAK and HOLD modes.
Successive
presses on
short
long (>2 sec)
- Selects AC, DC or AC+DC. Depending on
your choice, the screen displays AC, DC or
AC+DC
- Toggles the continuity and Ohm Ω
modes
- Displays the total 3-phase power of a
balanced system ( is displayed). Press
again to return to the display of the singlephase power ( is off)
Function
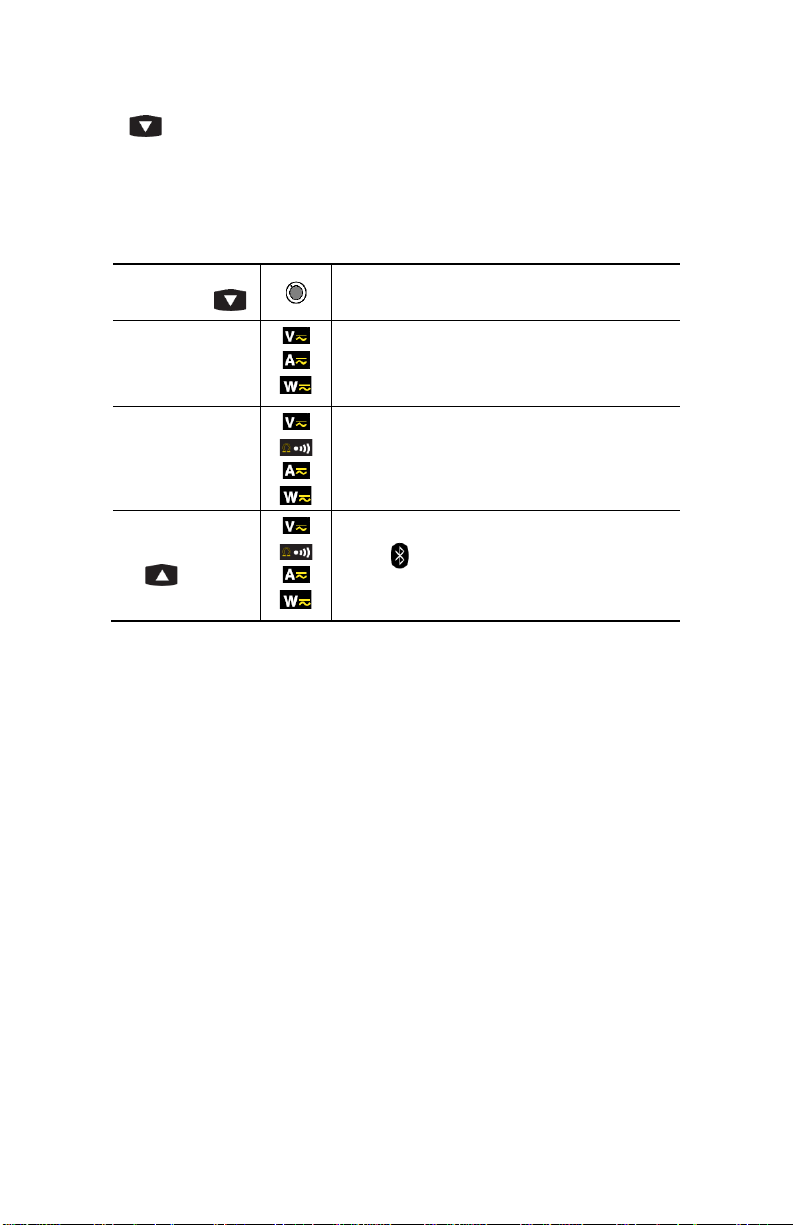
2.3
This button is used to:
BUTTON
Scroll up through the order of harmonic s or successive pages up
Activate the backlighting
Activate the Bluetooth function
Successive
presses on
short
long (> 2 sec)
combined with the
button
- Scrolls through the various pages of
measurement results, depending on the
function and possibly the active mode
(MAX/MIN/PEAK or THD/Harmonics)
- Enables/disables the backlighting of the
display
NOTE: The backlight turns off automatically
after 2 minutes
- Activates Bluetooth wireless communication
- The symbol is the displayed
NOTE: Activation of the Bluetooth mode
automatically stops the recording of the data
Function
16
Page 17
combined with the
2.4 BUTTON
This button is used to:
Scroll down through the orders of harmonics or successive pages
Activate the recording of the data
Activate the Bluetooth function
Successive
presses on
short
- Scrolls through the various pages of
- Enables/disables the recording of the data
- The REC symbol is then displayed
long (> 2 sec)
button
NOTE: When the recording memory is full, the
REC symbol flashes
- Activates Bluetooth wireless communication
- The symbol is the displayed
NOTE: Activation of the Bluetooth mode
automatically stops the recording of the data
measurement results, depending on the
function and possibly the active mode
(MAX/MIN/PEAK or THD/Harmonics)
… serve
17
Page 18
Displays MAX/AVG and MIN
ending on the mode, AC or
DC, the crest factor (CF), harmonics,
, it
is not possible to exit from the
mode. The HOLD
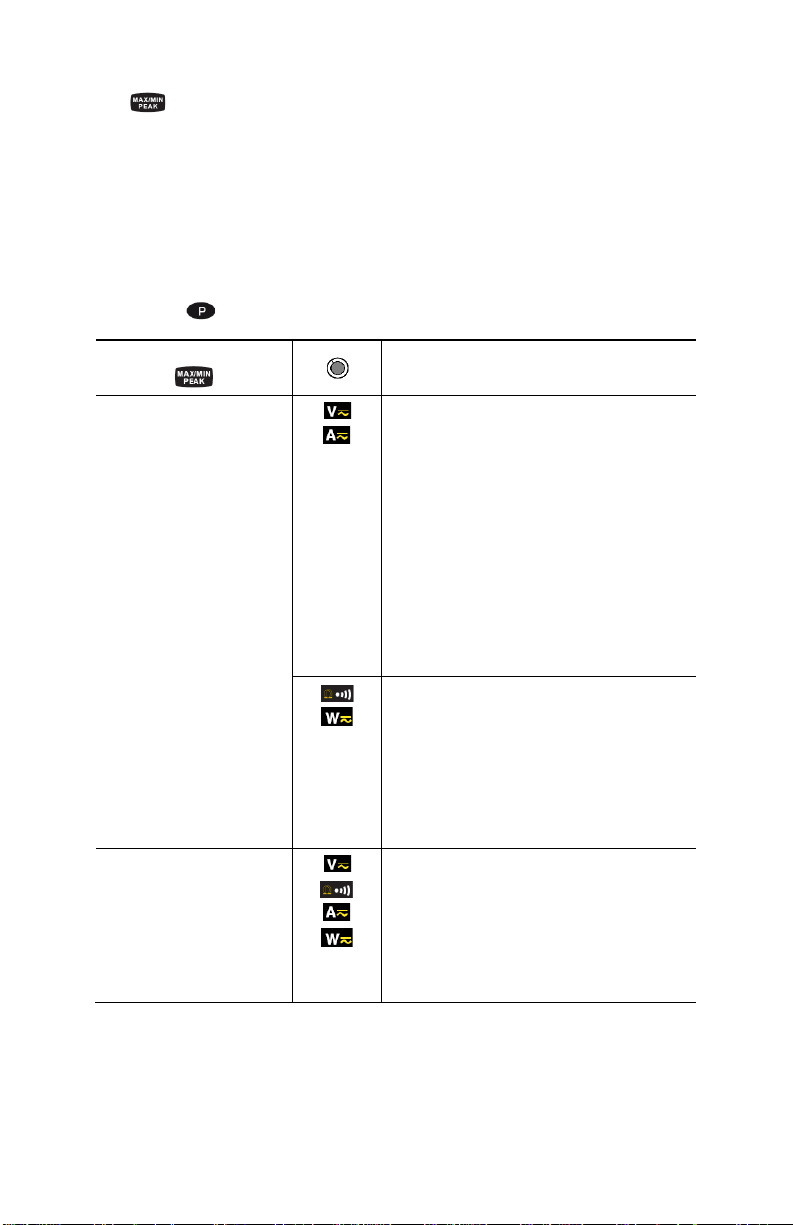
2.5 BUTTON
2.5.1 Normal Mode
This button activates the detection of the MAX, MIN, PEAK+, PEAK- or AVG values
of the measurements made.
Max and Min are the extreme mean values in DC and the extrem e RMS values in
AC. Peak+ is the maximum instantaneous peak and Peak- is the minimum
instantaneous peak.
NOTE: In this mode, the Auto Po wer Off function of the device is automat ically
disabled. The symbol is displayed on the screen.
Successive presses on
short
First press: Activates detection of the
MAX/MIN/AVG and PEAK values and
displays MAX/AVG and MIN values
Second press: Displays the PEAK+,
AVG, and PEAK- values (on a second
screen)
Third press:
values without exiting from the mode (the
values already detected are not erased)
NOTE: Dep
frequency, and RIPPLE are also available
Function
long (> 2 sec)
- Activates the detection of
MAX/MIN/AVG values
- Displays the MAX, MIN and AVG value
successively
- Returns to the display of the present
measurement without exiting from the
mode (the values already detected are
not erased)
- Exits the MAX/MIN/PEAK mode. The
values previously recorded are then
erased
NOTE: If the HOLD functi on is enabled
MAX/MIN/PEAK
function must first be disabled first.
18
Page 19
detected.
this sequence
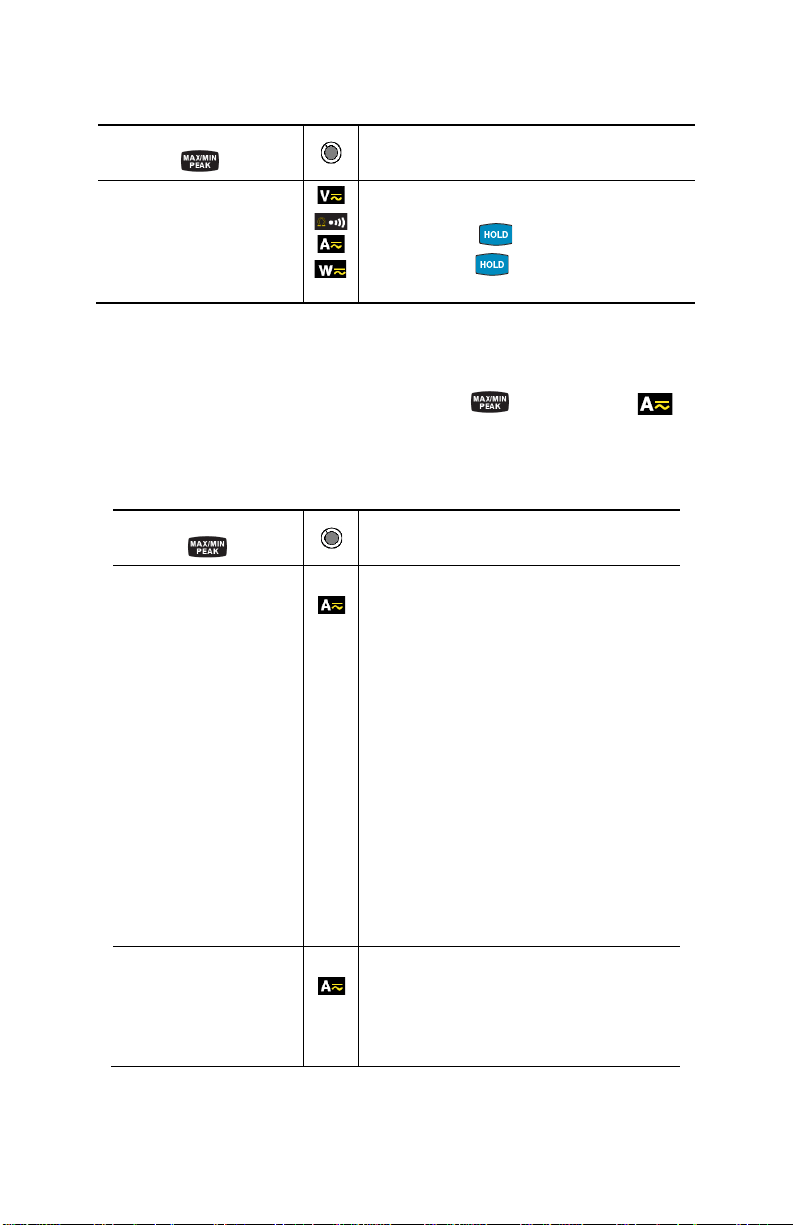
2.5.2 The MAX/MIN Mode + Activation of th e HOLD Mode
Successive presses on
short
- Displays the MAX, AVG, MIN and
PEAK+, AVG, PEAK- values detected
before the button was pressed
- When the button is pressed, the
Function
last value is held on the display
NOTE: The HOLD function does not interrupt the acquisition of new MAX, MIN, PEAK
values
2.5.3 Access to the True Inrush® Mode ( set switch to )
This button allows measurement of t he True Inrush® current (starting current, or
overcurrent in steady-state operati on) for AC or DC current only (not operat ional
in AC+DC).
Successive presses on
long (>2 sec)
short (<2 sec)
Note: A short press
is functional only if a True
InRush value has been
- First press: Enters the True InRush
mode
- "Inrh" is displayed for 3s (the
backlighting blinks)
- The triggering threshold is displayed for
5s (the backlighting is steady)
- "------" is displayed and the "A" symbol
flashes (backlighting turns off)
- After detection and acquisition, the
InRush current measurement is
displayed, after the calculations stage
"------" (backlighting off)
NOTE: The A symbol flashes to indicate
"surveillance" of the signal
- Second press: Exits the True InRush®
mode (returns to simple current
measurement)
- Displays the PEAK+ value of the current
- Displays the PEAK- value of the current
- Displays the RMS True InRush
NOTE: The A symbol is displayed during
Function
®
®
current
19
Page 20
2.6
BUTTON
This button is used to display the frequ ency measur ements of a sign al, of po wer,
of the levels and orders of harmonics.
NOTE: This button is not functional in the DC mode.
2.6.1 Normal Mode
presses on
Successive
short
long (>2 sec)
Displays:
- The frequency of the signal, the RMS
measurement, and the DC component
- The crest factor CF, the RMS measurement,
and the DC component
- Enters or exits the THD calculation and
display mode
- Displays the THDf, the THDr, and the RMS
value
- The and buttons are used to display
each order of harmonic (25 orders, from h01
to h25), with the associated harmonic
distortion (with respect to the fundamental)
and the RMS value of order hxx
- NOTE: Order hdC (displayed in the DC and
AC+DC modes) is the DC component; order
h01 is the fundamental
- Starts/Stops the energy metering mode
- Displays the various energy parameters
- The and buttons are used to display
the status and energy metering measurement
results pages
Function
2.6.2 Harmonic Order Display or +
Successive
presses on
short
- First press: Displays the frequency of the
harmonic order previously selected using the
or buttons, instead of order hxx
- Second press: Restores the display of order
(hxx or hdC)
20
…serve
Page 21

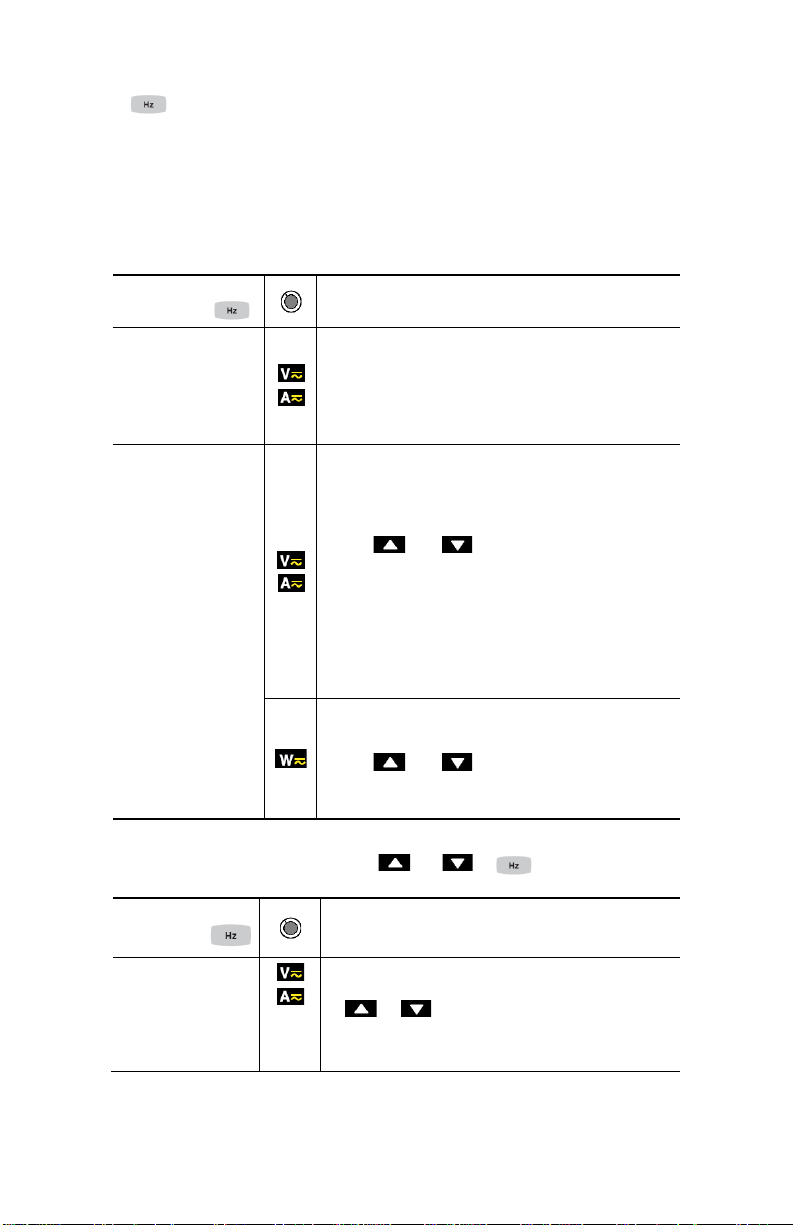
2.6.3 The Hz Function + Activation o f the HOLD Mode
Successive
presses on
short
- Stores and displays the frequency with the
RMS value and the DC component, then on
a 2nd consecutive page, the crest factor CF
- NOTE: The values displayed are those
measured before the button is pressed
Function
21
Page 22
3 USE
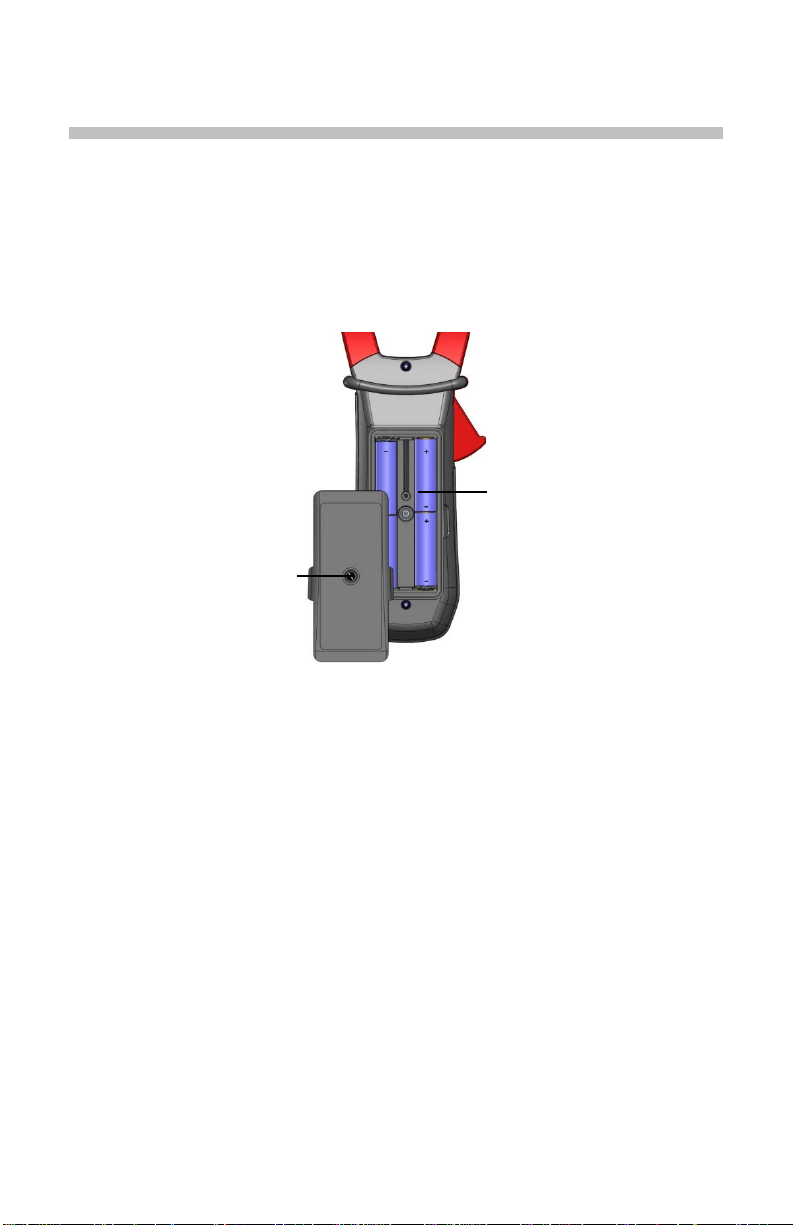
3.1 INSTALLING THE BATTERIES
Insert the batteries supplied with the device as follows:
1. Using a screwdriver, unscrew the battery compartment cover (item 1)
from the back of the housing.
2. Insert the 4x1.5V AA batteries supplied (item 2), observing polarities.
3. Close the battery compartment cover and screw it onto the housing.
2
1
Figure 6 : The Battery Compartmen t
3.2 TURNING THE CLAMP-ON METER ON
• With the rotary switch set in the OFF position, turn the switch to the
desired function. The display lights (all symbols) f or a few seconds (see
§1.3), then the screen of the function chosen is displayed.
• The clamp-on meter is now ready to make measurements.
3.3 TURNING THE CLAMP-ON METER OFF
The clamp-on meter can be turned off in two ways:
• Manually - Turn the switch to the OFF position.
• Automatically - After ten minutes with no act ivit y, the i nstrum ent will tur n
OFF. Thirty (30) seconds before the device is switched off, an audible
signal sounds intermittently. To r e-activate the device, pres s any button
or turn the rotary switch.
22
Page 23

3.4 CONFIGURATION
As a safety measure, and to a void r ep eat ed over l oads on t he i np uts of t he meter,
configuration operations should only be performed when the meter is
disconnected from all dangerous voltages.
3.4.1 Auto Power Off
The Auto Power Off feature is enabled by default. To disable it, perform the
following:
1. In the OFF position, hold the button down whil e turning the switch
to until the "full screen" dis pl ay ends and a b eep is emit ted. T he
symbol is displayed.
2. When the button is released, the dev ice is in the vol tmeter funct ion
in the normal mode.
3. To return to Auto Power Off, turn the clamp-on meter OFF and then
back ON again.
3.4.2 Configuring the Current Thresh ol d for True InRush® Measurement
To configure the triggering cur rent threshold of the True InRush
1. In the OF F position, hold the
button down while turning the s witch
to until the "full screen" display ends and a beep is emitted. The
display will indicate the per centage overshoot to apply to the measured
current to determine the measurement triggering threshold.
The value stored by default is 10%, representing 110% of the
established current measured. The possible values are 5%, 10%, 20%,
50%, 70%, 100%, 150%, and 200%.
2. To change the threshold, press the
flashes; each pres s on the
(yellow) button displays the next value.
(yellow) button. The value
To record the chosen threshold, apply a long press (>2s) on the
(yellow) button. A confirmation beep is emitted.
To exit from the configuration mode, turn the switch to another setting. The
chosen threshold is stored and a double beep is emitted.
NOTE: The starting (InRush) c urrent me asurement triggering threshol d is f ixe d a t
1% of the least sensitive range. T his value i s 1% of 99. 99A or 1A. This thr eshold
is not adjustable.
®
measurement:
23
Page 24
3.4.3 Configuring the Recording Duration
1. In the OFF position, hold the (yello w) button down while turning
the switch to , until the end of the "full screen" display and the
emission of a beep, to enter the configur ation mode. The display will
then indicate the recording inter v al .
NOTE: The default val ue is 60 seco nds. Possi ble values rang e from 1 second t o
600 seconds (10 minutes).
2. To change the recording inte rval, press the (yellow) button. The
right-hand digit blinks. Each press on the (yellow) button
increments its value. To go to t he next digit , apply a lo ng press ( >2s) to
the (yellow) butt on.
3. When the desired unit is disp layed, turn the switch to another set ting.
The unit chosen is stored and a double b eep is emitted.
3.4.4 Erasing Recordings from Memory
To erase a recording from memor y, perform the following:
NOTE: Make sure there is no voltage on the input terminals.
1. In the OFF position, hold the (yellow) button down while turning the
switch to .
2. The device emits a beep after erasing the r ecords in memory. The "rSt"
and "rEC" symbols are displayed.
3. The device then switches to normal continuity measurement.
3.4.5 Default Configuration
To reset the clamp-on meter to its default parameters (factory configuration):
1. In the OFF position, hold the (yellow) button down while turning the
switch to , until the " full screen" display ends and a be ep is emitted.
The "rSt" symbol is displayed.
2. After 2 s, the clamp-on meter emits a dou ble beep, the n all of the digita l
symbols of the screen are displayed until the (yellow) button is
released. The default paramet ers are then restored:
• Recording interval = 60 seconds
• Continuity detection threshol d = 40Ω
• True InRush triggering threshold = 10%
24
Page 25

Display
Quantity
1st row
Voltage V RMS
2nd row
DC RIPPLE in %
3rd row
DC voltage component, VDC
3.5 VOLTAGE MEASUREMENT (V)
To measure voltage, proceed as follows:
1. Set the switch to .
2. Connect the black lead to the COM terminal and the re d lead to the " +"
terminal.
3. Connect the test probes or the alligator clips to the circuit to be
measured. The device selects AC or DC automatically according to
which measured value is larg er. The AC or DC symbol displ ays blinking
in auto detect mode.
To select AC, DC or A C+DC manually, press the (yellow) button to toggle
between them. The symbol corresponding to the choice will then display.
The measured value is displayed:
In DC
25
Page 26

Display
Quantity
1st row
Total RMS voltage V RMS or TRMS
2nd row
Crest factor (CF)
3rd row
DC voltage component, VDC
In AC and AC+DC
3.6 CONTINUITY TEST
Warning: Before performing the test, make sure that the circuit is off and all
capacitors have been discharged.
1. Set the switch to ; the symbol is displayed.
2. Connect the black lead to the COM terminal and the red le ad to the "+"
terminal.
3. Connect the test probes or the allig ator clips t o the circuit or component
to be measured.
An audible signal is emitted if there is continuity and the measured value is
displayed on the screen.
26
Page 27

3.7 RESISTANCE MEASUREMENT Ω
Warning: Before making a resistance measurement , make s ure that t he circ uit is
off and all capacitors have been disch arged.
1. Set the switch to and press the (yellow) button. T he Ω symbol
is displayed.
2. Connect the black lead to the COM terminal and the red le ad to the "+"
terminal.
3. Connect the test probes or the allig ator clips t o the circuit or component
to be measured.
The measured value is displayed on the screen.
3.8 CURRENT MEASUREMENT (A)
The jaws are opened by pressing the tr igger on t he body of the meter. The arro w
on the jaws of the clamp-on meter (see t he following diagram) should point in the
presumed direction of current flow, from the generator to the load. Make sure that
the jaws have closed correctly after clamping around the conductor.
NOTE: The measurement results are opt imal when the conductor is cent ered in
the jaws (aligned with the centeri ng m arks).
The device selects AC or DC automat ic all y a cc ordi ng to which measured value is
larger. The AC or DC symbol displays blinking in auto detect mode.
3.8.1 AC Measurement
For an AC current measurement, proceed as follows:
1. Set the switch to and select AC by pressing the (yellow
button). The AC symbol is displayed.
2. Clamp the jaws around the conductor to be measured. The device
selects AC or DC automatically.
27
Page 28

Display
Quantity
1st row
RMS current A RMS
2nd row
Crest factor (CF)
3rd row
DC current component ADC
The measured values are displaye d on the screen.
3.8.2 DC or AC+DC Measurement
Set the switch to and select DC if t he display does not indicate "0"; the DC
zero must be corrected first.
Step 1: Correction of DC Zero
Important: The clamp must not be closed on the conductor during the DC zero
correction. Hold the clamp in t he same position during the whole procedure so
that the correction value will be exact.
Press the button unti l the device emits a double beep an d displays a value
near "0". The correction value is stored until the clamp is powered do wn.
NOTE: The correction is eff ected only if the value disp layed is < ±20A, otherwise
the value displayed blinks an d is not st or ed. T he c lamp mu s t be r ec ali brat ed ( s ee
§ 5.3)
28
Page 29

Display
Quantity
1st row
Current A RMS
2nd row
DC RIPPLE in %
3rd row
DC current component ADC
Step 2: Make a Measurement
1. The switch is set to . Select DC or AC+DC by pressing the
(yellow) button until the desired choice is reached.
2. Clamp the jaws around the conductor to be measured.
The measured values are displaye d:
In DC:
29
Page 30

Display
Quantity
1st row
Total RMS current in A RMS or TRMS
2nd row
Crest factor (CF)
3rd row
DC current component ADC
Display
Quantity
1st row
“Inrh”
2nd row
True Inrush value in A
3rd row
Triggering threshold in A
In AC and AC+DC:
3.9 STARTING CURRENT OR OVERCURRENT (True InRush®) MEASUREMENT
NOTE: The measurement can be made onl y in AC or DC mode (AC+DC mode
disabled).
To measure a starting current or overcurrent, proceed as follows:
1. Set the switch to , correct the DC zero (see §3.9.2), then clamp t he
jaws around the conductor to be measured.
2. Perform a long press on the
displayed, along with the triggering threshold. The clamp then awaits
detection of the True InRush
®
current. "------" is displayed and the A
symbol flashes.
3. After detection and acquisition for 100 m s, the RMS value of the True
InRush
®
current is displayed. Pressing the button will display the
PEAK+/PEAK- values subsequently.
4. A long press on the button or a change of function on the rot ary
switch will exit the True InRush
®
mode.
NOTE: The triggering threshold in A is 20A if t he initi al curr ent is z ero (st arting of
installation). For an establish ed current (overload in an installation) see §3.4.2.
button. The InRh symbol is
30
Page 31

PEAK:
Display Quantity
1st row “Inrh”
2nd row PEAK+ or PEAK- value in A
3rd row Triggering threshold in A
31
Page 32

Display
Quantity
2nd row
Reactive power var (AC or AC+DC)
3rd row
Apparent power VA (AC or AC+DC)
3.10 POWER MEASUREMENTS W, VA, VAR AND PF
This measurement is possible in single-phase or in balanced 3-phase.
NOTE: If performing DC or AC+DC power measurements, correct the DC zero in
current first (see § 3.8.2)
For the power factor (PF) and VA and var, the measurements possible are only
available in AC or AC+DC modes.
3.10.1 Single-Phase Power Measurement
1. Set the switch to and select VA, var, or PF by pressing the
button until the desired choice is reached.
2. The device automatically displays AC+DC. To select AC, DC, or
AC+DC, press the (yellow button) until the desired choice is
reached.
3. Connect the black lead to the COM terminal and the red le ad to the "+"
terminal.
4. Connect the test probes or the alligator clips of the black lead on the
neutral (N), then those of the red lead on the L phase.
5. Clamp around only the corresponding conductor, respecting the
direction.
The measurement is displayed on scr een.
1st row Active power W (DC, AC or AC+DC)
32
Page 33

If the red lead is
connected…
…and the black lead is
connected
…then the clamp is on the
conductor
To the L1 phase
to the L2 phase
of the L3 phase
To the L2 phase
to the L3 phase
of the L1 phase
To the L3 phase
to the L1 phase
of the L2 phase
3.10.2 Balanced 3-Phase Power Measurement
1. Set the switch to .
2. Press the (yellow) button until the symbol is displayed.
3. The device automatically displays AC+DC. To select AC, DC, or
AC+DC, press the (yellow) button until the desired choice is
reached.
4. Connect the black lead to the COM terminal and the red le ad to the "+"
terminal.
5. Connect the leads and the clamp to the circ uit as follows:
NOTE: The arrow on the jaws of the clamp (s ee the di agr a m bel o w) must poi nt i n
the presumed direction of flo w of the current from the source (producer) to t he
load (consumer).
33
Page 34

Consumed
Generated
The measurement is displayed on scr een.
NOTE: 3-phase power on a balance d 4-wire network can also be measured by
proceeding in the same way, or by proceeding as for the measurement on a
single-phase network, then mult iplying the value by three.
3.10.3 Four Quadrant Diagram
In order to correctly determine the sign of the activ e and r eac tive p owers, refer to
the diagram below, which determ ines:
- positive active power (W) = power consumed
- negative active power = power generated
- reactive power (var) and active power of the same sign = inductive
power
- reactive power and active power of opposite signs = capacitive power
34
Page 35

3.11 ENERGY METERING MEASUREMENT
The Energy Metering measurement is available in W for the AC and AC+DC
quantities.
The energy meters start and totalize the various types of energy (the eight
energy meters - 4 meters of ener g y cons um ed and 4 met er s of ener gy g ener ate d
- are started).
To measure the energy metering, proceed as follows:
1. Set the switch to .
2. Press the (long press). Start-up screen 1 in the E nergy Metering
mode appears. The display reads “ C ounting Off”.
3. Connect the black lead to the COM terminal and the red lead to the “+”
terminals.
4. Place the test probes or the alligator clips of the black lead on the
neutral (N), then those of the red lead on the L phase.
5. Clamp around only the corresponding conductor, respecting the
direction of current flow (see §3.10) .
6. To start the metering, press the (yello w) button. The display reads
“Counting On".
The metering sequence is as follows:
I- --->
---> --->I
I<-------------------------------------|
35
Page 36

1 : hours (h)
The status of each meter is:
- On <=> metering in operation
- Of f <=> metering stopped (values of the met ers 0)
- Stop <=> metering stopped (values of the meters pres er ved)
Hour meter page:
2 : minutes (n)
3 : seconds (s)
The duration of the metering uses t he following format: XXXh (for hours) XXm
(for minutes) XXs (for seconds)
NOTE: Beyond 999h 59m 59s "---h--m--s" is displa yed, but the internal metering
duration keeps running correctly.
View of the set of screens concerning Energy measurement by short presses on
or buttons:
36
Page 37

Conventions:
Load designates the consumed energy by the load (W+)
Load C designates the capacitive react i v e energy (W+ and var-)
Load L designates the inductive reactiv e energy (W+ and var+)
Supp designates the energy generated by the load (W-)
Supp C designates the capacitive reactive energy (W- and var-)
Supp L designates the inductive reactive energy (W- and var+)
7. To access the screens concerning the energies received by the load
(« Load side »), press the button to view each screen that has the
term “LoAd at the bottom of the screen.
The sequence of use is as follows:
I- Load h W ---> Load L h VAR ---> Load C h VAR ---> Load h VA ---> I
I <----------------------------------------------------------------------------------------- I
Example of « LOAD side » screen
8. To access the screens concerning th e energies generated by the load
and therefore received by the source ("Supply side"), press the
button to view the screens that have the t erm “SuPP at the bot tom
of the screen.
The sequence of use is as follows:
I - Supp h W ---> Supp L h VAR ---> Supp C h VAR ---> Supp h VA ---> I
I <------------------------------------------------------------------------------------------- |
37
Page 38

Example of « SUPP side » screen
The energy displays use the following formats:
- [000.1 ; 999.9]
- [1.000 k ; 9999 k]
- [10.0 M ; 999 M]
- [1.00 G ; 999 G]
3.12 FREQUENCY MEASUREMENT (HZ)
The frequency measurement is available in V, W and A for AC and AC+DC
measurements. The measurement is based on a count of zero crossings
(positive-going edges).
3.12.1 Frequency Measurement (V)
To measure the frequency in voltage, proceed as follows:
1. Set the switch to and press the button. The Hz symbol is displayed.
2. Select AC by pressing the (yellow) button u ntil the desired choice
is reached.
3. Connect the black lead to the COM terminal and the red le ad to the "+"
terminal.
4. Connect the test probes or the alligator clips to the circuit to be
measured.
The measured value is displayed on the screen.
38
Page 39

3.12.2 Frequency Measurement (A)
1. Set the switch to and press the button. The Hz symbol is
displayed.
2. Select AC or AC+DC by pressing th e (yellow) button until desired
choice is reached.
3. Clamp the jaws around the conductor to be measured.
The measured value is displayed on the screen.
3.13 MEASUREMENT OF THE TOTAL HARMONIC DISTORTION (THD) AND DISPLAY OF THE ORDER OF HARMONICS ORDER
The device measures the total harmonic distortion with respect to the
fundamental (THDf), the total har monic distortion with respect to the true RMS
value of the signal (THDr) in voltag e and in c urrent , then t he l evel (with respect to
the fundamental), frequency, and RMS v alue of each order of harmonic.
The frequency of the fundamental is determined by digital filtering and FFT for
the network frequencies of 50, 60, 400, and 800Hz.
3.13.1 Measurement of the THD (V)
1. Set the switch to and press and hold (>2s) the button. The
, THDr and V RMS symbols are displayed.
THD
f
2. Connect the black lead to the COM terminal and the red le ad to the "+"
terminal.
3. Place the test probes or the alli gator clips on the t erminals of the cir cuit
to be measured.
39
Page 40

The measurement is displayed on screen.
3.13.2 Measurement of the THD (A)
1. Set the switch to and press and hold (>2s) the button. The
, THDr and A RMS symbols are displayed.
THD
f
NOTE: first press the yellow button t o place the meter in AC current
measurement mode.
2. Apply the clamp to only the conductor conc erned.
The measurement is displayed on screen.
40
Page 41

3.13.3 Display of the Individual Harmonics and of the Frequency of
the Fundamental From DC to the 25
th
.
In the context of measurement of the T HDs in voltage ( § 3.13.1) and i n current
(§ 3.13.2):
1. Press the b utton. Order “hdC” is displayed (DC component), only in
DC or AC+DC. The harmonics of higher orders are displayed
sequentially as the button is pressed repeatedly. The button
can be pressed to return to the previous order.
2. The button can be pressed to displ ay the f requenc y of the order o f
harmonic concerned.
41
Page 42

(10 mn)
V, A, Ω
1000
16 minutes
160 hours
W
3 minutes
35 hours
THD
300
5 minutes
55 hours
Harmonics
470
8 minutes
80 hours
3.14 RECORDING OF MEASUREMENTS
The power meter allows recording of the data/measurements using the REC
function. The default recording inter val is 60 seconds. It can be configured (s ee
§3.4.3) from 1 second to 600 seconds (10 minutes).
1. First, select the function to be measured using the rotary switch, then
apply a long press (> 2s) to the button. The REC symbol is
displayed. Recording of the measurement starts. The data recorded is
in the format: "MAX value – AVG Value – MIN V alue – Unit – Mode"
(AC or AC+DC).
NOTE: The meter does not record pure DC measurements
2. To stop recording, apply a long press (> 2s) to the button. T he REC
symbol disappears.
NOTE: Recording is interrupted automatically when the memory of the devi c e i s
full (REC symbol is flashing) or Bluetooth wireless communication is activated
(§3.15)
Type of
data
Max. number of
records
200
Max. recording time at 1s
intervals
Max. recording time
at 600s intervals
3.15 CONNECTING TO A COMPUTER
3.15.1 Bluetooth Connection
The Model 607 is equipped with Bluetooth connectivity for downloading
displaying and deleting recorded data in the instrument’s memory.
The instrument is supplied with a Bluetooth USB ad apter for use with computers
without Bluetooth capability. If this is the case, connect the adapter to an
available USB port on your computer. The default Windows driver will
automatically install the device.
The instrument must be paired to the computer before connecting to the
software. The pairing procedure varies depending on your operating system,
Bluetooth equipment and driver sof tware.
NOTE: The informatio n in the follo wing sections are o nly necessary t he first ti me
an instrument is connected, or when the Bluetooth USB adapter has been
removed then reconnected.
42
Page 43

607
3.15.2 Pairing the Instrument to the Computer
The following steps are for pairing using Windows Vista/Windows 7:
1. In the active measurement function, press the and buttons
simultaneously. The symbol will appear in the upper right corner of
the display.
2. Connect the supplied Bluetooth USB Adapter into an available USB
port. Windows will install any necessary driver s automatically.
3. A Bluetooth symbol, similar to thi s , will appear in the system tra y at
the bottom of your screen once the driver is installed.
4. Right click on the icon and select “Add a Device”.
5. In the “Add a Device” window, select the instr ument you wish to connec t
to and select “Next”.
43
Page 44

NOTE: Depending on the Bluetooth setup and operating system, it may be
necessary to enter a passkey to finalize the instrument connection. If so, the
default passkey is: 0000.
1. If asked for a pairing code select the “Enter the Device’s pairing
code”.
2. Enter the pairing code as shown belo w and select “Next”
44
Page 45

3. Once the instrument has been successfully added to the computer, a
window similar to the one below will be displayed. Select “Close”.
4. You should see the Device listed in the Bluetooth devices window.
45
Page 46

1. Launch the Dataview
®
Control Panel using the icon placed on the
desktop during software inst a ll atio n. Refer t o sect ion 3.2 2 f or DataV i e w
software installation. The instrument should automatically connect if
only one power meter is paired. If more than one instrument is paired,
select the instrument you wish to connect to from the dr op-down list in
the connection window.
2. Selecting OK will establish the connection between the power meter
and the DataView
®
software. It is now possible to view the instrument
status and downloaded data. If data is present in the instrument’s
memory, the software will automatically start downloading once
connected.
3.16 TURNING BLUETOOTH ON/OFF
The Bluetoot h can only be turned on or off when the instrument is not recording.
To enable the Bluetooth press the and keys simultaneously. The
symbol should be displayed in the upper right corner of the display. To disable
Bluetooth press the and keys simultaneously the symbol will turn off.
3.17 RECORDING DATA
3.17.1 Starting a Recording Session
NOTE: A new r ecording c annot be start ed if t he memor y is f ull or if the Bluetooth
is active.
1. Configure the instrument as desc r i bed in section 3.4.
2. Select the measurement function t o be recorded us ing the rotar y switch
and connect the instrument to the meas urement source
3. Press the REC button for >2s to start a r ec ording.
4. The REC indication will remai n solid when there is available memor y or
it will blink if the memory is full.
5. If the memory is partially full then it is possible to start another
recording. The duration of the recording will depend on the available
memory.
®
3.17.2 Stopping a Recording Session
1. Press and hold the REC button for >2s
2. The REC indication will not be displaye d if a recording is not active.
46
Page 47

3.18 DOWNLOADING RECORDED DATA
Recorded measurements stored i n the instrument are transferred t o a computer
via the download command in the DataView
®
Control Panel.
3.19 ERASING DATA FROM MEMORY
Erasing data from the instrument’s memory can be performed in two ways.
Erasing the Memory using the YELLOW button and rotary
switch:
1. Turn the instrument “OFF”.
2. Press and hold the YELLOW button while rotating the rotary switch to
the “Ω” position.
3. Release the YELLOW button when RST REC is displayed t o erase the
memory.
Erasing the Memory using the DataView® Control Panel:
1. Connect the instrument to t he computer and launch the Power Clamp
Meter Control Panel.
2. Select View Recorded Data from the Inst rument menu.
3. In the “Recorded Data in Instrument” window select the “Select All”
button and click on “Delete All” to er as e the memory.
3.20 DATA STORAGE
The Model 607 captures Trend measurements at a user specified interval.
The approximate number of d ata points that can be recorded with the memor y
cleared
3.20.1 Trend Measurements
The Model 607 stores the measurement of each of the inputs. In addition, the
user can define the storage rate and typ e of measurement.
3.20.2 Recording with Memory Cleared
When a recording starts, the power meter will continue t o record until one of t he
following occurs:
• The memory becomes full.
• A manual press of the RE C button for >2s is performed.
• The battery voltage is not sufficient to keep the instrument powered.
47
Page 48

3.20.3 Recording with a Partial or Full Memory
It is possible to have more than one recording provided there is sufficient
memory. The duration of the addit ional recording will depend on the sam ple rate
of the recording, amount of memory left and type of recording.
3.20.4 Memory Filled During Recording Session
If the memory becomes full, the REC indication on the display will blink. It will be
necessary to download and erase t he memory before a new recording can be
started.
3.21 SOFTWARE INSTALLATION
®
3.21.1 Installing DataView
USB Flash Drive Install
1. Insert the USB stick into an available USB port (wait for driver to be
installed).
2. If Autorun is enabled then an AutoPlay window should appear as shown.).
3. A Set-up window will appear.
NOTE: If Autorun is disabled, it will be necessary to open Windows Explorer,
then locate and open the USB s tick drive labeled “D ataView” to vie w the files on
the drive.
4. In the AutoPlay window, select “Open f older to view files”.
5. Double-click on Setup.exe from the opened folder view to launch the
DataView setup program. A Set-up window, similar to the one below, will
appear.
48
Page 49

There are several different options to choose from. Some options
(*)
require an
internet connection.
• DataView, Versio n x.xx.xxxx - Installs DataView
®
• *Adobe Reader - Links to the Adobe
website to download the
®
onto the PC.
most recent version of Adobe® Reader to the computer. Adobe®
Reader is required for viewing PDF documents supplied with
DataView
• *DataView Updates - Links to the online DataView
®
.
®
software
updates to check for new software version releases.
• *Firmware Upgrades - Links to the online firmware updates to
check for new firmware version releases.
• Documents - Shows a list of instrument related documents that
you can view. Adobe
documents supplied with DataView
®
Reader is required for viewing PDF
®
.
6. DataView, Version x.xx.xxxx option should be selected by default.
Select the desired language and then c lick on Install.
7. The Installation Wizard window will appear. Click Next.
8. To proceed, accept the terms of the license agreement and click Next.
9. In the Customer Information wind ow, enter a Nam e and Compan y, then
click Next.
10. In the Setup Type window that appears, select the “Complete” radio
button option, then click Next.
11. In the Select Features window that appears, select the instrument’s
control panel that you want to install, then click Next.
NOTE: The PDF-XChange option must be selected to be able to generat e PDF
reports from within DataView
®
.
49
Page 50

407 and 607
12. In the Ready to Install t he Program window, click on Install.
13. If the instrument selected f or install ation req uires the use of a USB port,
a warning box will appear, similar to below. Click OK.
NOTE: The installation of the drivers m ay take a few moments. Windows may
even indicate that it is not r esponding, ho wever it is running. Ple ase wait for it t o
finish.
14. When the drivers are finished installing, the Installation Successful
dialog box will appear. Click OK.
15. Next, the Installation Wizard Complete window will appear. Click Finish.
16. A Question dialog b ox ap pear s ne xt. Click Yes to read the procedure for
connecting the instrument to the USB port on the computer.
50
Page 51

607
NOTE: The Setup window remains o pen. You may now select another
option to download (e.g. Adobe® Reader), or close the window.
17. Restart your computer, then pair the instrument to the computer as
described in section 3.15.
Shortcuts for DataView® and each instrum ent control panel selected during the
installation process have been add ed to your desktop.
3.22 OPENING THE DATAVIEW CONTROL PANEL
To open the Power Meter Control Panel:
• Double-click the icon that was created during installation, located on the
desktop.
• The Connection window appears.
NOTE: If only one power meter is connected to the c omputer, it will be selected
and a connection will be established automatically.
The Connection window lists the c onnected instrument in the Instrumen t dropdown list.
If multiple units are attached, select the desired unit.
Once the desired instrument has been s elected, cl ick OK and the Control Panel
will attempt to connect to the instr um ent and download any data.
NOTE: The default layout can be changed by moving and resizing each window.
3.23 USING THE CONTROL PANEL
The Control Panel is used to vie w the instrument status, download, view and
erase the memory. It is also used to generate reports in DataView® and export
the recorded data into an excel format.
To open the Control Panel, either click on the Control Panel option from
DataView’s Instrument menu or select the control panel icon placed on the
desktop during the installation.
51
Page 52

607
607
The main menu at the top of the screen lists the following commands:
File
• Open
• Sa ve As
• Create DataView Report
• Create Spreadsheet
• Edit Session Properties
• Print - prints the selected real-time window.
• Print Preview - provides a preview of the real-time window to be
printed.
• Print Setup - displays a Print Setup window allowing you to select a
destination printer and change v arious printing options.
• Exit - closes the control panel.
View
• Trend – N/A
• Waveform – N/A
• Harmonic – N/A
• Power – N/A
• Toolbar – Basic<>Advanced – Displays or hides the toolbar icons
commonly used or shows all icons
• Status Bar – Shows the toolbar at the bottom of the control panel
window which displays connection status
• Status Screen – Opens a window that displays the instrum ent status
52
Page 53

Instrument
• Connect - establishes a connection.
• Disconnect - closes a connection.
• Configure – N/A
• View Recorded Data – Open a window to display the recordings
present in the instrument.
• Download All Recorded D ata – Downloads the instruments memor y to
the PC
• Set Clock – N/A
Tools
• Colors - allows the user t o specify the default colors t o be assigned to
graph traces associated with specif ic trend measurements and change
the graph background color.
• Options - allows the us er to specif y default param eters when dis pla ying
data.
• Recover Data - allows the user to load an instrument specific .icp file.
Window
• Cascade - arrange all windows into a stack, with each window offset
slightly.
• Tile - display all windows equally sized without overlapping.
• Load Layout - Loads a user saved layout
• Save Layout – Allows the user to save a custom layout for later use.
• Restore Default Layout – Arranges the windows to a default layout.
NOTE: In addit ion, a list of open real-t ime windows is displa yed at the bottom of
the Window menu. Selecting one of these options will activate the associated
real-time window. This is useful when other windows hide a desired window.
Help
• Help topics - display the main Control Panel help topic.
• Help About - displays the About dialog box.
53
Page 54

607
3.24 DISPLAYING REAL-TIME STATUS INFORMATION
Downloaded data and instrument status is displayed in the Control Panel.
Figure 4-10
Recorded Data from the Instrument
Status:
• Connection - shows if instrument is connected/ disconnected
• Model - instrument’s model identifi cation number
• Communication – shows connection type and baud rate
• ID – displays the Model, Serial #, Firmware and Hardware Version
3.25 RESIZING AND SAVING REAL-TIME WINDOW LAYOUTS
The windows can also be resized and arran ged to suit your needs by using the
mouse pointer. To move a window, simply click and hold on the title bar, then
drag to the desired location. To r esize a windo w, click and dr ag the corner of the
window.
Once you have all of your windows in a desired location, you can save your
layout for future use.
To Save a Layout:
• Go to Window > Save Layout. Type in a name for the layout and select
the folder that you wish to save it in. Clic k on Save.
To Load a Layout:
• Go to Window > Load Layout. Locate and select a previously saved
layout file. Click on Open.
54
Page 55

3.26 DOWNLOADING RECORDED INSTRUMENT D ATA
Recorded measurements stored i n the instrument are transferred t o a computer
via the download command in the Contro l Panel. Assuming a recording session
has been started and stoppe d, the instrument should have at least one rec orded
measurement inside it.
To Download a Recording:
• Select Download All Recorded Data from the Instrument menu. This
begins the transfer of recorded data to the computer. A window
displaying the transfer progress will be displayed.
• Once the transf er is complete, a Date/Time window appears. Enter th e
Date and start time of the rec ording. Note: This can be changed at a
later time using the Recording Parameter button in the viewed data
window.
• Once a Date/Time is writte n, the R ecord ed Data i n In strumen t window
will display the recording. To dis play the data in a graph or list format,
select the desired recording and select View.
• From the “View” window you can select what to view using the radio
buttons and view the data in a list for mat b y selecti ng the “V iew as Li st”
checkbox. There are other o ptions to Print the data directly, export to
excel or Create a Dataview report.
55
Page 56

• The Start Date and Time of the recording can also be modified
using the Recording Parameters button.
56
Page 57

607
607
3.27 POWER CLAMP METER TEMPLATE
Refer to the DataView® Help files for detailed information about using the
templates.
607 Template
The Trend Summary Report template generates a view with a worksheet for
each recorded parameter and a cover page.
You can move between the worksheets b y selecting the desired worksh eet from
the worksheet tabs at the bottom of t he view (just above the status bar).
The first worksheet is the Cover Sheet and provides information about the
recording session. The following i llustrates the Cover Sheet:
57
Page 58

The Cover Sheet is used as a cover sheet for the report and contains the
following frames:
• Text Box - containi ng the text “Trend Summary Report”.
• Session Summary - containing the name of the database used to
generate the report.
• Session Summary - containing operator information.
• Session Summary - co ntaining test site information.
• Session Summary - containing operator comments.
®
• OLE - containing the AEMC
Instruments logo.
Using the associated properties window customizes each of these frames. The
properties window for a fram e is displayed by selecting t he frame, then selecting
the Properties command from the Fr am e menu.
The next few worksheets are used to view the recorded trend channels and
contains the following frames:
• Channel List
• Channel Graph
• Trend Summary
• Meter
The following figure illustrates the Trend List worksheet.
58
Page 59

Channel Graph Frame
A Channel Graph frame provides a graphic al look i nto the dat abase it is at tached
to. The database is attached to t he Trend Graph frame when it is cr eated. This
can be done manually by placing a graph frame or automatically when using a
template.
The graph frame provides addit ional tools for viewing the underlying databas e.
These tools provide zoom an d pan operations. In addit ion, individual traces and
waveform snapshots can be selected us ing the Select Frame tool.
Normally, the Select Frame tool is used to select a frame for modification. In
addition to selecting the Graph fram e, this tool is used to se lect individual t races.
A trace is selected if any par t of it is drawn within a fe w screen pixels of where
the selection tool is when the left m ouse button is pressed.
When a trace is selected, handles similar to those of the frame handles are
drawn over the trace. If more than one trace is drawn within the proximity of t he
selection tool, when clicked again, the next trace will be selected. This will
continue until all traces withi n the selection tools proximity have been s elected.
59
Page 60

At which point, clicking the left mouse button again will select the fir st trace and
the process will repeat.
Frames can be linked together so that when you select a trace or line in one
frame another frame shows additional information about the selection. For
example when selecting a trace in the graph the trend summary list will be
updated to list the sample points f or the selected trace.
Linking frames can create a compl ex interaction b etween frames. For additional
information refer to the DataVie w
the main DataView
®
application.
®
users guide ac cessible from t he help menu of
This template contains the following linked frame types:
• Session Summary
• Channel List
• Meter
• Trend Summary List
The channels selected for dis play and the display properties can be changed at
any time using the Channel Graph Properties window. The Channel Graph
Properties window can be displayed by right-clicking the mouse pointer while
positioned over the Graph frame, then selecting Properties from the pop-up
menu.
The display extents of the C hannel Graph f rame can be chang ed by using z oom
and pan operations. By zooming and panning you change the starting and
ending times of the displayed data. By changing the startin g and ending display
times, you can zoom in, zoom out, pan left and right, pan to star t and pan to the
end of the measurement data.
To change the display extents of a graph f rame, s elect the frame usi ng either t he
frame selection tool
or Zoom Tool
. Next, use a zoom or pan
command from the Zoom menu, or from t he toolbar. B y clicking a nd dragg ing the
Zoom Tool across the desired area of the graph, yo u can select a n area to zoo m
in on.
Channel List Frame
The Channel List frame is a f rame attached to either a Channe l Graph or MicroGraph frame. In the case of thi s template, the pare nt is a Channel Gra ph frame.
The Channel List frame displays a te xtual list summar y of the channels ava ilable
in the recording. Each summary line contains user-specified parameters of a
specific channel recording.
You can specify the displayed parameters and gener al display options using the
Channel List Properties dialog box.
You can step between list entr ies. Selecting Pan To Start, displays the first list
entry. Selecting Pan To End, displays the last list entry. Selecting the Step Right
or Step Left, d isplays the next or pr evious list entr y. When stepping thro ugh the
60
Page 61

list entries, the selection will move from each entry for the associated channel.
In addition to stepping throu gh the list with the tool bar, yo u can select a spec ific
entry listed using the mouse pointer. The text for the selected entry will be
highlighted, indicating which entry in the list is currently sele c ted.
Session Summary Frame
The Session Summary frame is a fr ame attached to the Channel Graph frame.
This frame displays a textual summar y of its parent frame. You can customize
the summary text displayed, using the Session Summary Properties dialog
box. This dialog box is displayed by right-clicking on the frame and selecting
Properties from the pop-up menu, or by double-clicking on the frame.
The Trend template contains Sess ion Summary frames displaying the followin g
information:
• Start time and duration of the recorded data and the instrument’s
identification codes. This fra me is in the upper right corner of the first
worksheet.
• Database containing the file name and location of the recording data
• Operator informati on
• Test site information
• Operator comments
The text displayed in the session s ummary frames is static as long as the dat a
within the associated databas e remains static. Session Summar y frames do not
provide the interactive operations available in the Channel Graph and Trend
Summary List frames.
Meter Frame
The Meter frame is a frame link ed to the Channel Graph fr ame. The Met er frame
displays the values of samples at a specific location on the graph. Left-clicking on
the graph displays a black vertical bar. The sam ple values displaye d in the m eter
frame are associated with the time at the location of this vertical bar. Left-clicking
at other areas of the graph will mov e the ver tical bar and u pdate the Meter f rame
accordingly.
Text Box Frame
A Text Box frame displays text at a give n location on the page. The text within
the frame is static, in that it does not change. It only changes when you change
it. This template contains a T ext B o x loc ate d at the t op of the worksheet. The text
displayed within this frame is the t itle of thi s report (T rend Summar y Repor t). The
text, font and other frame properties can be changed using the Text Box
Properties dialog box.
61
Page 62

Measurement Range
0.00 to 99.99V
100.0 to 999.9V
1000V (1)
Range
0.00 to 9.99V
± (1% R +3cts)
Resolution
0.01V
0.1V
1V
10MΩ
4 SPECIFICATIONS
4.1 REFERENCE CONDITIONS
Quantities of Influence Reference Conditions
Temperature: 23°C ±2°C
Relative humidity: 45% to 75%
Supply voltage: 6.0V ±0.5V
Frequency range of the applied signal: 45 to 65Hz
Sine wave: pure
Peak factor of the applied alternating signal: √2
Position of the conductor in the clamp: centered
Adjacent conductors: none
Alternating magnetic field: none
Electric field: none
4.2 SPECIFICATIONS UNDER THE REFERENCE CONDITIONS
Accuracy is expressed in ± (x% of the reading (R) + y counts (ct)).
4.2.1 DC Voltage Measurement
Specified Measurement
Accuracy
Input Impedance
Note (1) Above 1000V, a repetitive beep indicates that the voltage being
0 to 100% of the measurement range
± (1% R +10cts)
10.00 to 99.99V
± (1% R +3cts)
measured is greater than the safety voltage for which the device is
guaranteed. The display indicates " OL".
62
Page 63

Measurement
Range
0.15 to
99.99V
100.0 to
999.9V
1000V RMS
1400V peak (1)
Specified
Range (2)
0.15 to 9.99V
± (1% R +3cts)
Resolution
0.01V
0.1V
1V
Input Impedance
10MΩ
0.15 to
99.99V
100.0 to
999.9V
1000V RMS (1)
1400V peak
Specified Measurement
Range
Accuracy
0.15 to 9.99V
± (1% R +3cts)
Resolution
0.01V
0.1V
1V
Input impedance
10MΩ
4.2.2 AC Voltage Measurement
Measurement
Accuracy
± (1% R +10cts)
10.00 to 99.99V
0 to 100% of the measurement range
± (1% R +3cts)
Note (1) Above 1000V (RMS), a repetitive beep indicates that the voltage
being measured is greater than the safety voltage for which the
device is guaranteed. The display indicates "OL".
- Bandw i dth in AC = 3 kHz
Note (2) Any value between zero and the min. threshold of the measurement
range (0.15V) is forced to show "----" on the display.
Specific Specifications in MAX/MIN mode (from 10Hz to 1kHz, and from
0.30V in AC):
• Accuracy: add 1% R to the values of the table above.
• Capture of the extreme: approximately 100ms.
4.2.3 AC+DC Voltage Measurement
Measurement Range (2)
0 to 100% of the measurement range
Note (1) The display indicates "OL" above 1000V ( 1400V in PEAK mode).
Above 1000V (DC or RMS), a repetitive beep indicates that the
voltage being measured is greater t han the safety voltage for which
the device is guaranteed.
- Bandw i dth in AC = 3 kHz
Note (2) Any value between zero a nd the min. threshold of the measurement
range (0.15V) is forced to "----" on the display.
± (1% R +10cts)
10 to 99.99V
63
± (1% R +3cts)
Page 64

Measurement
Range (2)
0.00 to
99.99A
100.0 to
999.9A
1000 to
3000A (1)
Specified
Range
2000A
± (3.5% R +3 pt)
Resolution
0.01A
0.1A
1A
Measurement
Range (2)
0.15 to
99.99A
100.0 to
999.9A
1000 to
2000A (1)
Specified
Range
1000 to 1500A
± (2% R +5cts)
Resolution
0.01A
0.1A
1A
Specific Specifications in MAX/MIN mode in Voltage
(from 10Hz to 1kHz in AC and AC+DC):
• Accuracy: add 1% R to the values of the previous table.
• Capture of the extreme: approximately 100ms.
Specific Specifications in PEAK mode in voltage
(from 10Hz to 1kHz in AC and AC+DC):
• Accuracy: add 1.5% R to the values in the previous table.
• PEAK capture time: 1ms m i n. to 1.5ms max.
4.2.4 DC Current Measurement
Measurement
Accuracy (2)
(zero corrected)
Note (1) The display indicates “+OL” above 3000A.
Note (2) The residual current at zero depends on the remanence. It can be
4.2.5 AC Current Measurement
Measurement
Accuracy ± (1% R +10cts) ± (1% R +3cts)
Note (1) The display indicates "OL" above 300 0A (in PEAK mode) . T he "-" and
Note (2) In AC, any value between zero and the min. threshold of the
0 to 100% of the measurement range
± (1.5% R +3 pt)
to 2500ADC
2000
± (1% R +10cts) ± (1% R +3c t s)
± (2.5% R +3 pt)
2500 to 3000ADC
corrected by the “DC zero” function of the HOLD button.
0 to 100% of the measurement range
± (1.5% R +3cts)
1500 to 2000A
"+" signs are not managed.
- Bandw i dth in AC = 1 kHz
measurement range (0.15A) is for ced to show “----“ on the display.
- Residual current at zero <150mA.
64
Page 65

AC: 1000 to 2000A
1000 to 3000A (1)
Specified
Range
Accuracy (2)
2000A
± (3.5% R +3cts)
Resolution
0.01A
0.1A
1A
Measurement Range
20 to 2000AAC
20 to 3000ADC
Specified Measurement Range
0 to 100% of the measurement range
Accuracy
± (5% R +5cts)
Resolution
1A
4.2.6 AC+DC Intensity Measurement
Measurement
Range (2)
0.15 to
99.99A
100.0 to
999.9A
DC or PEAK:
Measurement
(zero corrected)
± (1% R +10cts) ± (1% R +3cts)
0 to 100% of the measurement range
± (1.5% R +3cts)
to 2500ADC
2000
± (2.5% R +3cts)
2500 to 3000ADC
Note (1) The display indicates "+OL" above 3000A (in PEAK mode). The "-"
and "+" signs are not managed.
- Bandw i dth in AC = 1 kHz
Note (2) In AC, any value between zero and the min. threshold of the
measurement range (0.15A) is for ced to show "----" on the display.
- Residual current at zero:
- In DC: depends on the remanence. This can be corrected by the
"DC zero" function of the HOLD button
- In AC: <150mA
Specific Specifications in MAX/MIN mode
(from 10Hz to 1kHz in AC and AC+DC):
• Accuracy: add 1% R to the values of the table above.
• Capture of the extreme: approximately 100ms.
Specific characteristics in PEAK mode in current
(from 10Hz to 400Hz in AC and AC+DC):
• Accuracy: add 1.5% R to the values in the tables above.
• PEAK capture time: 1ms min. to 1.5ms max.
4.2.7 True Inrush® Measurement
Specific Specifications in PEAK mode in True InRush®
(from 10Hz to 1kHz in AC ):
• Accuracy: add ± (1.5% R +0.5A) to the values in the table above.
• PEAK capture time: 1ms min. to 1.5ms max.
65
Page 66

Measurement range
1.00 to 3.50
3.51 to 5.99
6.00 to 10.00
Specified
(from 5V or 5A)
Accuracy (zero
corrected in ADC)
Resolution
1ct
Measurement range
0.1 to 99.9%
100.0 to 1000%
Specified Measurement
2VDC)
Accuracy
± (5% R +10cts)
Resolution
0.1
Measurement Range
0.0 to 999.9Ω
Open-circuit Voltage
≤ 3.6V
Measurement Current
550µA
Accuracy
± (1% R +5cts)
Buzzer Triggering Threshold
40Ω
0.0 to
999.9Ω
1000 to
9999Ω
10.00 to
99.99kΩ
Specified Measurement
Range
1 to 100% of the
measurement range
0 to 100% of the
measurement range
Accuracy
± (1% R +5cts)
Resolution
0.1Ω
1Ω
10Ω
Open-circuit Voltage
≤ 3.6V
Measurement Current
550µA
100µA
10µA
4.2.8 Calculation of the crest factor (CF)
Measurement Range
0 to 100% of the measurement range
± (2% R +2cts) ± (5% R +2cts) ± (10% R +2cts)
NOTE: Peak values limited to 1500V or 3000A
4.2.9 Calculation of the RIPPLE in DC
Range (from 3ADC and
2 to 100% of the
measurement range
0 to 100% of the
measurement range
NOTE: If one of the terms for the calculat ion of the RIPPLE is displayed as "OL",
or forced to zero, the RIPPLE displa yed is an indeterminate value, "----".
4.2.10 Continuity Measurement
4.2.11 Resistance Measurement
Measurement Range (1)
Note (1) Above the maximum display value, the display unit indicates "OL".
The "-" and "+" signs are not managed.
66
Page 67

Measurement
Range (2)
0 to
9999W
10.00 to
99.99kW
100.0 to
999.9kW
1000 to
3000kW (1)
Specified
Range
Accuracy (3)
1000A
± (4.5% R +10cts)
1000A
± (4.5% R +3cts)
Resolution
1W
10W
100W
1000W
Measurement
Range (2) (4)
5 to
9999W
10.00 to
99.99kW
100.0 to
999.9kW
Specified
Range
1 to 100% of the
range
1000A
± (2% R +10cts)
1000A
± (2% R +3cts)
Resolution
1W
10W
100W
1000W
Specific Specifications in MAX/MIN mode:
• Accuracy: add 1% R to the values of the previous table
• Capture of the extreme: approximately 100ms.
4.2.12 Active DC Power Measurements
Measurement
1 to 100% of the
measurement range
± (2% R +10cts)
1000 to 2000A
± (2.5% R +10cts)
2000
to 2500ADC
± (3.5% R +10cts)
2500 to 3000ADC
0 to 100% of the
measurement range
± (2% R +3cts)
1000 to 2000A
± (2.5% R +3cts)
2000
to 2500A
DC:
± (3.5% R +3cts)
2500 to 3000A
DC:
Note (1) - Display of OL or ± OL
- Above 3000kW in single-phase (1000V x 3 000A).
Note (2) Any applied voltage greater than 1000V causes the emission of an
intermittent alarm beep to report a dangerous overload.
Note (3) The measurement result may be affected by an instability linked to the
current measurement (approximately 0.1A).
Example: For a power measurement made at 10A, the instability of the
measurement will be 0.1A/10A or 1%.
4.2.13 Active AC Power Measurements
1000kW (1)
Measurement
measurement
of the measurement range
0 to 100%
Accuracy (3)
Note (1) - Display of OL above 2000kW in single-phase (1000V x 3000A).
- Bandwidth in AC in voltage = 3 kHz, in current = 1 kHz
Notes (2) and (3) of the previous § apply.
67
Page 68

Consumed
Generated
Note (4) Any power measured less th a n 5W is regar d ed as zero and causes the
display of dashes "----"
If the voltage is less tha n 0.15V or if the curr ent is l ess than 0. 15A, th e
power measured is regarded as zero and causes the display of "----"
Note 5 The active powers are positive for power consumed and n egative for
power generated.
Note 6 The signs of the active and reactive powers and power factor are
defined by the four-quadrant rule:
The diagram below sums up the signs of t he power as a function of the
phase angle between V and I:
Quadrant 1: Active power P sign + (pow er consumed)
Quadrant 2: Active power P sign - (power generated)
Quadrant 3: Active power P sign - (power generated)
Quadrant 4: Active power P sign + (power consumed)
Note (7) In balanced three-phas es, with deformed signals (THD and
harmonics), uncertainties are guaranteed since Ф > 30°. Additional
errors are following, depending of THD:
Add +1% for 10% < THD < 20%
Add +3% for 20% < THD < 30%
Add +5% for 30% < THD < 40%
68
Page 69

Measurement
Range (2) (4)
5 to
9999W
10.00 to
99.99kW
100.0 to
999.9kW
1000 to
3000kW (1)
Specified
Range
Accuracy (3)
1000A
± (4.5% R +10cts)
1000A
± (4.5% R +3cts)
Resolution
1W
10W
100W
1000W
10.00kVA
99.99kVA
100.0kVA
999.9kVA
1000 kVA
2000 kVA (1)
Specified
Range
Accuracy (3)
1000A
± (2.5% R +10cts)
1000A
± (2.5% R +3cts)
Resolution
1VA
10VA
100VA
1000VA
4.2.14 Active AC+DC Power Measurements
Measurement
1 to 100% of the
measurement range
± (2% R +10cts)
1000 to 2000A
± (2.5% R +10cts)
2000
to 2500ADC
± (3.5% R +10cts)
2500 to 3000ADC
0 to 100% of the measurement range
± (2% R +3cts)
1000 to 2000A
± (2.5% R +3cts)
2000
to 2500ADC
± (3.5% R +3cts)
2500 to 3000ADC
Note (1) - Display of OL above 3000kW in single-phase (1000V x 3000A)
- Bandwidth in AC in voltage = 3 kHz, in current = 1 kHz
Notes (2), (3), (4), (5) (6) and (7) of the previous § apply
4.2.15 Measurement of Apparent AC Power
Measurement
Range (2) (4)
Measurement
5VA to
9999VA
1 to 100% of the
measurement range
to
to
0 to 100%
of the measurement range
to
Note (1) - Display of O.L above 2000 kVA in single-phase (1000V x 200 0A).
- Bandwidth in AC in voltage = 3 kHz, in current = 1 kHz
Notes (2), (3) and (4) of the previous § apply
± (2% R +10cts)
1000 to 2000A
± (2% R +3cts)
1000 to 2000A
69
Page 70

Measurement
Range (2) (4)
5 to
9999VA
10.00 to
99.99kVA
100.0 to
999.9kVA
1000 to
3000kVA (1)
Specified
Range
Accuracy (3)
1000A
± (4.5% R +10cts)
1000A
± (4.5% R + 3cts)
Resolution
1VA
10VA
100VA
1000VA
Measurement
Range (2) (4)
5 to
9999 var
10.00 to
99.99 kvar
100.0 to
999.9 kvar
1000 to
2000 kvar (1)
Specified
Range
Accuracy
1000A
± (2.5% R +10cts)
1000A
± (2.5% R +3cts)
Resolution
1 var
10 var
100 var
1 kvar
4.2.16 Measurement of Apparent AC+DC Power
Measurement
1 to 100% of the
measurement range
± (2% R +10cts)
1000 to 2000A
± (2.5% R +10cts)
to 2500ADC
2000
± (3.5% R +10cts)
2500 to 3000ADC
of the measurement range
0 to 100%
± (2% R +3cts)
1000 to 2000A
± (2.5% R +3cts)
to 2500ADC
2000
± (3.5% R + 3cts)
2500 to 3000ADC
Note (1) - Display of OL above 3000 kVA in single-phase (1000V x 3000A).
- Bandwidth in AC in voltage = 3 kHz, in current = 1 kHz
Notes (2), (3) and (4) of the previous § apply
4.2.17 Measurement of Reactive AC Power
Measurement
(3) (7)
1 to 100% of the
measurement range
± (2% R +10cts)
1000 to 2000A
of the measurement range
0 to 100%
± (2% R +3cts)
1000 to 2000A
Note (1) - Display of OL above 2000 kvar in single-phase (1000V x 2000A).
- Bandwidth in AC in voltage = 3 kHz, in current = 1 kHz
Notes (2), (3) and (4) of the previous § apply
Note 5 In single-phase, the sign of the reactive power is determined by the
Note 6 - Signs of reacti v e powers according to the four-quadr ant rule (§4.2.12):
Quadrant 1: Reactive power Q sign +
Quadrant 2: Reactive power Q sign +
Quadrant 3: Reactive power Q sign Quadrant 4: Reactive power Q sign –
Note (7) Measurement stabilization ~8 sec
phase lead or lag between the V and I signs, while in balanced threephase, it is determined by the calcul ation on the samples.
70
Page 71

1000 to
(1)
Specified
Range
Accuracy (3)
1000A
± (4.5% R+10cts)
1000A
± (4.5% R+3cts)
Resolution
1 var
10 var
100 var
1 kvar
Measurement Range (1)
0.00 to +1.00
Specified Measurement
Range
0 to 50% of the
measurement range
50 to 100% of the
measurement range
Accuracy (2)
± (3% R +3cts)
± (2% R +3cts)
Resolution
0.01
4.2.18 Measurement of Reactive AC+DC Power
Measurement
Range (2) (4)
5 to
9999 var
10.00 to
99.99 kvar
100.0 to
999.9 kvar
3000 kvar
Measurement
(7)
1 to 100% of the
measurement range
± (2% R +10cts)
1000 to 2000A
± (2.5% R +10cts)
2000 to 2500A
DC
± (3.5% R+10cts)
2500 to 3000ADC
0 to 100% of the measurement range
± (2% R +3cts)
1000 to 2000A
± (2.5% R +3cts)
2000 to 2500A
DC
± (3.5% R+3cts)
2500 to 3000ADC
Note (1) - Display of OL above 3000 kvar in single-phase (1000V x 3000A).
- Bandwidth in AC in voltage = 3 kHz, in current = 1 kHz
Notes (2), (3) , (4), (5), (6) and (7) of the previous § apply
Specific characteristics in MAX/MIN mode in power
(from 10Hz to 1kHz in AC and AC+DC):
• Accuracy: add 1% R to the values in the table above.
• Capture time: approximately 100ms
4.2.19 Calculation of the Power Factor (PF)
Note (1) If one of the terms in the calculation of the power factor is displayed
as "OL", or forced to zero, the display of the power factor is an
indeterminate value "----".
Note (2) In balanced three-phases, w i th deformed signals (THD and
harmonics), uncertainties are guaranteed since Ф > 30°. Additional
errors are following, depending of THD:
Add +1% for 10% < THD < 20%
Add +3% for 20% < THD < 30%
Add +5% for 30% < THD < 40%
NOTE: The PF is always positive
Specific characteristics in MAX/MIN mode (from 10Hz to 1kHz):
• Accuracy: add 1% R to the values in the table above.
• Capture time: approximat ely 100ms.
71
Page 72

Measurement Range (1)
0.00 to +1.00
Specified measurement Range
(from 1AAC)
Accuracy (2) (3)
± (5% R +2cts)
Resolution
0.01
Measurement
Range (1)
5.0 to
999.9Hz
1000 to
9999Hz
10.00 to
19.99kHz
Specified
Range
Accuracy
± (0.4% R + 1ct)
Resolution
0.1Hz
1Hz
10Hz
Measurement Range (1)
5.0 to 1999Hz
Specified Measurement Range
1 to 100% of the measurement range
Accuracy
± (0.4% R + 1ct)
Resolution
0.1Hz
4.2.20 Calculation of the Displacement Power Factor (DPF)
0 to 100% of the measurement range
Note (1) If one of the terms in the calc ulation of the DPF is displ ayed as "OL", or
forced to zero, the display of the DPF is an indeterminate value "----".
Note (2) of the previous § apply
Note (3) Measurement stabili zati on ~8 sec
NOTE: The DPF is always positive. It’s equivalent to |cos Φ|
Specific characteristics in MAX/MIN mode (from 10Hz to 1kHz):
• Uncertainties: add 1% R to the values in the table above.
• Capture time: approximat ely 100ms.
4.2.21 Frequency Measurements
4.2.21.1 Voltage
Measurement
4.2.21.2 Current
Note (1) In MAX/MIN mode, the operating range is limited to 1kHz.
If the level of the signal is too low (<10% of the range, or V<8V or
I<9A) or if the frequency is less than 5Hz, the device cannot
determine the frequency and displays "----".
Specific Specifications in MAX/MIN mode (from 10Hz to 1kHz):
• Accuracy: add 1% R to the values of the table above.
• Capture of the extreme: approximately 100ms.
1 to 100% of the
measurement range
72
0 to 100% of the
measurement range
Page 73

Measurement Range
0.0 to 100%
Specified Measurement
Range
0 to 100%
of the measurement range
Accuracy
± (5% R ±2cts) in voltage
± (5% R ±5cts) in current
Resolution
1%
Measurement Range
0.0 to 1000%
Specified Measurement
Range
0 to 100%
of the measurement range
Accuracy
± (5% R ±2cts) in voltage
± (5% R ±5cts) in current
Resolution
1%
Measurement Range in Voltage
Per §4.2.2 and §4.2.3
Measurement Range in Current
Per §4.2.5 and §4.2.6
AC: harmonics of orders 1 to 25
component
- 0 to 25 times the fundamental frequency,
of an 800Hz network
Stability of the Current and Voltage
Display
Level >10% and order <13: ±(5% R ±2cts)
Level <10% and order >13: ±(15% R ±2cts)
4.2.22 Specifications in THDr
4.2.23 Specifications in THDf
Note : The display is "----" if the input signal is too low (V<8V or I<9A) or if
the frequency is less than 5Hz.
Specific characteristics in MAX/MIN mode in THD (from 10Hz to 1kHz):
• Accuracy: add 1% R to the values in the table above.
• Capture of t he ext r eme: approximately 100ms
4.2.24 Harmonic Measurement Specifications
Harmonic Range
Frequency Analysis Band
Accuracy on the RMS value of the
harmonic (zero corrected in A
Note: The display is "----" if the input signa l is too low (U<8V or I<9A) or if the
frequency is less than 5Hz.
DC)
AC+DC: all orders from 1 to 25, plus the DC
from among the network frequencies 5 0,
60, and 400Hz
- 0 to 12 times the fundamental frequency
± (1% R ±2cts)
Level >10% and order >13: ±(10% R ±2cts)
Level <10% and order <13: ±(10% R ±2cts)
73
Page 74

Polycarbonate
Clamping diameter: 2.36" (60mm)
LCD display unit
Dimension: 1.6 x 1.9" (41 x 48mm)
- Specific characteristics in MAX/MIN mode in THD (from 10Hz to 1kHz):
• Accuracy: add 1% R to the values in the tables above.
• Capture time o f the extreme: approximately 100ms
4.3 ENVIRONMENTAL CONDITIONS
Conditions Operating Storage
Temperature -4° to +131°F
(-20° to +55°C)
Relative humidity (RH) ≤90% up to 131°F (55°C) ≤90% up to 158°F (70°C)
-40° to +158°F
(-40° to +70°C)
4.4 MECHANICAL SPECIFICATIONS
Housing
Jaws
Screen
Dimension 11.65 x 4.37 x 1.61" (296 x 111 x 41mm)
Weight 1.4 lbs (640g) with batteries
Rigid polycarbonate shell with over-molded elastomer
covering;
Opening: 2.36" (60mm)
Blue backlighting
UL94 V1
4.5 POWER SUPPLY
Batteries 4x1.5V AA LR6
Battery Life >350 hours (without bac klighting and Bluetooth)
Auto Power Off After 10 minutes with no switch and/or button activity
74
Page 75

4.6 COMPLIANCE WITH INTERNATIONAL STANDARDS
Compliant with standards IEC-61010-1,
Electric safety
IEC-61010-2-30, and IEC-61010-2-32:
1000V CAT IV.
Electromagnetic
compatibility
Mechanical strength Free fall: 2m (in accordance with standard I EC-68-2-32)
Level of protection of
the housing
Compliant with standard EN-61326-1
Classification: residential environment
Housing: IP54 (per standard IEC-60529)
Jaws: IP40
75
Page 76

Condition
of influence
Range of
influence
Measurement
influenced
Influence
Typical MAX
Temperature
V AC
Humidity
V
Frequency
Position of the
conductor in the
jaws
(f
Any position on
A-W
Adjacent
conductor
carrying a
current of 150 A
DC or RMS
Conductor
jaws
Conductor
enclosed by the
clamp
Application of a
voltage of the
clamp
Peak factor (1)
1.4 to 3.5
1400 V peak
PF (inductive
and capacitive)
0.2 and I ≥ 20A
1% R + 1 ct
4.7 ENVIRONMENTAL VARIATIONS
10% to 90%RH
≤
400 Hz)
-4° to +131°F
(-20 to +55°C)
10 Hz to 1 kHz
1 kHz to 3 kHz
10 Hz to 400 Hz
400 Hz to 1 kHz
the internal
perimeter of the
jaws
touching the
external
perimeter of the
0 to 500 A DC
or RMS
V DC
A*
Ω
W AC
W DC
A
Ω
W
V
A
(<2000A DC or
1400A AC)
(>2000A DC)
A-W 40 dB 30 dB
V < 1 ct 1 ct
-
0.1% R/10°C
1% R/10°C*
-
-
0.15% R/10°C
≤
1 ct
-
0.2% R
0.25% R
1% R + 1 ct
8% R + 1 ct
1% R + 1 ct
4% R + 1 ct
2% R
8% R
0.5% R/10°C + 2cts
1.5% R/10°C + 2cts*
0.1% R/10°C
0.1% R/10°C + 2 cts
0.2% R/10°C + 2 cts
0.3% R/10°C + 2 cts
0.1R + 1 ct
0.1% R + 2 cts
0.3% R + 2 cts
0.5% R + 2 cts
1% R + 1 ct
9% R + 1 ct
1% R + 1 ct
5% R + 1 ct
4% R + 1 ct
Full-scale
*Note in Temperature: Influenc e s pecified until 1000 A DC
0 to 1000 V DC
to 3000 A peak
0.7 and I ≥ 5A
0.5 and I
or RMS
limited
≥
10A
A-W
A (AC-AC+DC)
V (AC-AC+DC)
W 0.5%R
76
<
1 ct 1 ct
1% R
1% R
3% R + 1 ct
3% R + 1 ct
3% R + 1 ct
8% R + 1 ct
Page 77

5 MAINTENANCE
5.1 WARNING:
• Remove the test leads on any input before opening the case.
• Do not operate the clamp-on meter without a battery case cover.
• To avoid electrical shock, do not attempt to perform any servicing
unless you are qualified to do so.
• To avoid electrical shock and/or damag e to the instrument, do not get
water or other foreign agents into the probe.
5.2 CLEANING
Disconnect everything connected to the device and set the switch to
•
OFF.
Use a soft cloth moistened with soapy water. Rinse with a damp cloth
•
and dry quickly using a dry cloth or for ced air.
Dry completely before putting bac k into use.
•
5.3 REPLACEMENT OF THE BATTERIES
The symbol indicates that t he batteri es are low. When this symbol appears
on the display unit, the batteries must be replaced. The measurements and
specifications are no longer guaranteed.
To replace the batteries, proceed as f ollows:
1. Disconnect the measurement leads fr om the input terminals.
2. Set the switch to OFF.
3. Using a screwdriver, unscrew the b attery compartment cover from the
back of the housing (see §3.1).
4. Remove the used batteries and replace t hem with 4x1.5V AA batteries,
observing the polarities.
5. Close the battery compartment cover and s crew it onto the housing.
77
Page 78

6 REP AIR AND CALIBRA TION
To ensure that your instrument meets factory specifications, we recommend
that it be submitted to our factory Service Center at one-year intervals for
recalibration, or as required by other standards or internal procedures.
For instrument repair and calibration:
You must contact our Service Center for a Customer Service Authorization
number (CSA#). This will ensure that when your instrument arrives, it will be
tracked and processed promptly. Please write the CSA# on the outside of
the shipping container. If the instrument is returned for calibration, we need
to know if you want a standard calibration, or a calibration traceable to
N.I.S.T. (includes calibration certificate plus recorded calibration data).
Chauvin Arnoux
15 F araday Drive
Dover, NH 03 820 US A
Tel: (800) 945-2362 (Ext. 360)
(603) 749-6434 (Ext. 360)
Fax: (603) 742-2346 or (603) 749-6309
repair@aemc.com
(Or contact your authorized distributor)
Costs for repair, standard calibration, and calibration traceable to N.I.S.T. are
available.
NOTE: All customers must obtain a CSA# before returning any
instrument.
®
, Inc. d.b.a. AEMC® Instruments
7 TECHNICAL AND SALES ASSISTANCE
If you are experiencing any technical problems, or require any assistance
with the proper operation or application of your instrument, please call, mail,
fax or e-mail our technical support hotline:
Chauvin Arnoux
200 F oxborou gh Boulevard
Foxborough, MA 02035, USA
Phone: (800) 343-1391
(508) 698-2115
Fax: (508) 698-2118
techsupport@aemc.com
www.aemc.com
NOTE: Do not ship instruments to our Foxborough, MA address.
®
, Inc. d.b.a. AEMC® Instruments
78
Page 79

8 LIMITED WARRANTY
The Model 607 is warranted to the owner for a period of three years from
the date of original purchase against defects in manufacture. This limited
warranty is given by AEMC
®
Instruments, not by the distributor from
whom it was purchased. This warranty is void if the unit has been
tampered with, abused or if the defect is related to service not performed
by AEMC
®
Instruments.
Full warranty coverage and product registration is available on our
website at www.aemc.com/warranty.html
.
Please print the online Warranty Coverage Information for your
records.
If a malfunction occurs within the three-year period, you may return the
instrument to us for repair, provided we have your warranty registration
information on file or a proof of purchase. AEMC
option, repair or replace the faulty material.
®
Instruments w ill, at its
REGISTER ONLINE AT: www.aemc.com
9 WAR RA NTY REPAIRS
What you must do to return an Instrument for Warranty Repair:
First, request a Customer Service Authorization Number (CSA#) by
phone or by fax from our Service Department (see address below), then
return the instrument along with the signed CSA Form. Please write the
CSA# on the outside of the shipping container. Return the instrument,
postage or shipment pre-paid to:
®
Chauvin Arnoux
, Inc. d.b.a. AEMC® Instruments
15 Faraday Drive • Dover, NH 03820 USA
Tel: (800) 945-2362 (Ext. 360)
(603) 749-6434 (Ext. 360)
Fax: (603) 742-2346 or (603) 749-6309
repair@aemc.com
Caution: To protect yourself against in-transit loss, we recommend you
insure your returned material.
NOTE: All customers must obtain a CSA# before returning any
instrument.
79
Page 80

Chauvin Arnoux®, Inc. d.b.a AEMC® Instruments
99-MAN 100371 v6 11/15
15 Faraday Drive • Dover, NH 03820 USA
www.aemc.com
 Loading...