

Page 1

Page 2

ROBERT HALF TECHNOLOGY 2006 SALARY GUIDE
TABLE OF CONTENTS
From the Chairman 1
Understanding the Salary Data 2
IT Employment Outlook 3
Skills in Demand 4
Areas of Investment 5
The Role of Certification in Hiring 7
IT Salaries – United States 9
Regional Hiring Trends – United States 12
IT Salaries – Canada
Regional Hiring Trends – Canada 20
Staffing for Success 22
The Leading Resource 24
Office Directory inside back cover
echnology is a registered trademark of Robert Half International Inc.
t Half T
Rober
All other trademarks used in this booklet are registered in the names of their respective owners.
17
Page 3

OBERT HALF TECHNOLOGY 2006 SALARY GUIDE
R
FROM THE CHAIRMAN
Dear Colleague:
Businesses today must make judicious hiring decisions
while at the same time enhancing their ability to retain top
talent at every level of the organization. This is especially
important in the information technology (IT) field as the
economy gains momentum and demand for technical
expertise increases. Firms with access to the most current
salary and employment trend information will be in the best
position to recruit and hire the talent they need to meet new challenges and pursue
growth opportunities.
To help companies make informed hiring decisions, Robert Half Technology is pleased
to provide the
guide is based on extensive research conducted in our offices, our company’s ongoing
surveys of chief information officers (CIOs) and the accumulated expertise of our
account executives.
Robert Half Technology 2006 Salary Guide for North America. The
2006 Salary Guide is one of the many resources we offer to the businesses and
Our
professionals we serve. We look forward to assisting you with your project and fulltime staffing needs through our more than 100 locations in North America and Europe.
For more information about our services, please visit our website,
www.rht.com.
Sincerely,
Max Messmer
Chairman and CEO
PAGE 1
Page 4

ROBERT HALF TECHNOLOGY 2006 SALARY GUIDE
UNDERSTANDING THE
SALARY DATA
Organizations of all sizes and in all industries use the
Salary Guide
appropriate compensation levels for IT
staff and to prepare annual budgets and
business plans. In addition, educational
institutions and government agencies,
such as the U.S. Department of Labor’s
Bureau of Labor Statistics, refer to the
guide for research purposes.
Robert Half Technology
to help them determine
COMPILING THE DATA
The following pages provide comprehensive data on average starting salaries for
IT professionals, as well as a review of
trends and developments that are expected to impact the field. Information for
the
Salary Guide is derived from a wide
range of sources, including:
• The thousands of project and full-time
placements made by Robert Half
Technology professionals throughout
North America
• The expected demand for certain posi-
tions and skill sets
• An analysis of last year’s projections
• A review of actual starting salaries in
2005
• An extrapolation of current trends into
2006
Salary ranges reflect compensation at the
time of hire only and do not take into
account other aspects of an employee’s
compensation package, such as bonuses
and incentives. The
not report on continuing or ongoing salary
ranges since seniority, performance, work
ethic and other hard-to-measure factors
can affect pay as individual work histories develop.
Salary Guide does
ADJUSTING SALARIES FOR
LOCAL MARKETS
The salaries listed in the guide are
national averages and can be localized
for more than 75 markets across North
America by referring to the Regional
Hiring Trends sections beginning on Page
12 for the United States and Page 20 for
Canada. Please speak with your Robert
Half Technology representative for further
assistance in determining starting salary
ranges for your area.
PAGE 2
Page 5

ROBERT HALF TECHNOLOGY 2006 SALARY GUIDE
IT EMPLOYMENT OUTLOOK
Business leaders continue to view information technology as a means to increase
productivity and gain a competitive
advantage. During the recent recession,
however, firms also looked to their IT
departments for cost savings and additional efficiencies. Spending levels were
reduced, and many hiring managers were
forced to cut staff.
products and restarting projects. To
successfully move forward with these
initiatives, technology executives are
once again hiring – in many cases filling
positions for the first time since the end
of the dot-com boom. Managers are
carefully evaluating their key requirements and adding full-time staff only
when they identify a continuing need.
Short-term initiatives and workload
Today, businesses across North America
are upgrading systems, developing new
spikes are being addressed with the
help of project professionals.
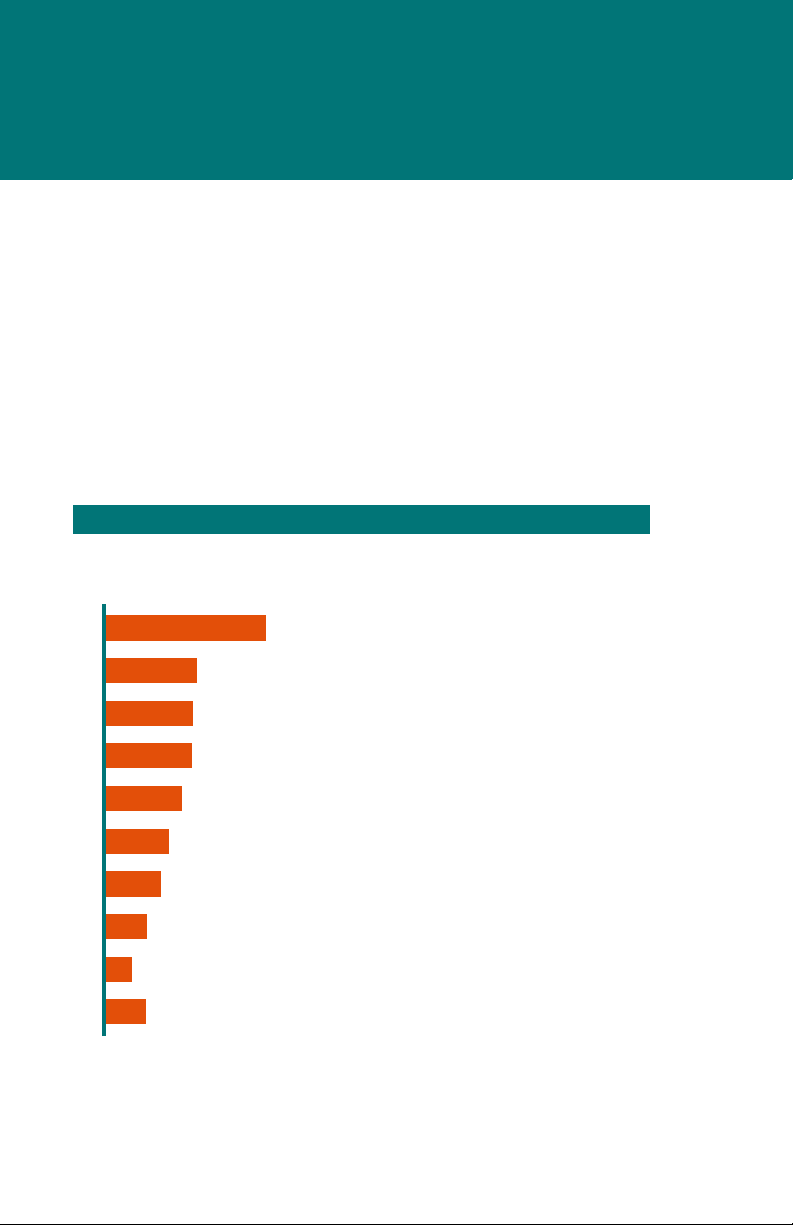
HOTTEST TECHNOLOGY JOBS
CIOs were asked, “Within your IT department, which single job area is
experiencing the most growth?” Their responses:
17%
NETWORKING
6%
PROJECT
MANAGEMENT
17%
HELP DESK/
END-USER SUPPORT
8%
INTERNET/INTRANET
DEVELOPMENT
10%
INFORMATION
SECURITY
DATA/DATABASE
11%
MANAGEMENT
Source: Robert Half Technology IT Hiring Index and Skills Report, June 9, 2005
12%
APPLICATIONS
DEVELOPMENT
19%
OTHER/DON’T KNOW
PAGE 3
Page 6

ROBERT HALF TECHNOLOGY 2006 SALARY GUIDE
IT EMPLOYMENT OUTLOOK
As a result of this renewed employment
activity, job candidates with in-demand
skill sets are receiving multiple offers, and
systems analyst and IT auditor, will see
base compensation increases of up to
11 percent.
companies are accelerating the hiring
process to avoid losing the best people to
competing firms. This trend is expected
to continue throughout 2006.
SKILLS IN DEMAND
According to Robert Half Technology’s IT
Hiring Index and Skills Report
, which
includes responses from more than 1,400
To further enhance their recruitment and
retention efforts, many businesses are
reassessing their compensation packages. As a result, starting salaries in the
United States are projected to increase
an average of 3 percent over last year.
High-demand positions, such as business
chief information officers, networking and
help desk/end-user support consistently
rank as the job categories experiencing
the most growth within IT departments.
Windows administration (2000, 2003, XP)
is the skill set most in demand among
CIOs, research shows.
HOTTEST TECHNOLOGY SKILLS
CIOs were asked, “Which of the following technical skill sets are most in demand
within your IT department?” Their responses:
77% WINDOWS ADMINISTRATION
48% WIRELESS NETWORK MANAGEMENT
47% SQL SERVER MANAGEMENT
43% CISCO NETWORK ADMINISTRATION
29% CHECK POINT FIREWALL ADMINISTRATION
Source: Robert Half Technology IT Hiring Index and Skills Report, June 9, 2005.
CIOs were allowed multiple responses.
PAGE 4
Page 7

OBERT HALF TECHNOLOGY 2006 SALARY GUIDE
R
IT EMPLOYMENT OUTLOOK
While technical expertise remains an
important criterion when evaluating candidates, CIOs also are placing greater
weight on nontechnical skills. With
companies’ increasing reliance on technology to support and drive their businesses,
the role of IT professionals has become
much more prominent, and they are frequently looked to for strategic guidance.
It’s common, for example, for those in
technology to be asked to make a case for
or against a particular upgrade or hardware purchase, which requires excellent
communication skills and a fundamental
Capital expenditures – Firms across all
industries are replacing desktop systems
and software to avoid the cost of maintenance and support of older systems.
Launches of new versions of popular
Microsoft products in 2006 also may
impact IT spending.
Development of web applications –
The Web is being woven into every
aspect of business and providing for
enhanced levels of collaboration,
customer service, customization, streamlining and management.
As a result of renewed employment
activity, job candidates with in-demand
skill sets are receiving multiple offers.
understanding of the firm’s business
needs. These skills are an important factor in ensuring that the IT department
meets the diverse requirements of the
individuals and business units it serves.
AREAS OF INVESTMENT
The following initiatives are among those
driving information technology hiring:
Network security – The safeguarding of
internal systems remains critical for companies of all sizes. CIOs seek individuals
who can manage an enterprisewide security strategy, including the assessment of
network vulnerabilities, virus protection
and intrusion detection.
Business intelligence – This broad category of applications and technologies is
growing rapidly as organizations seek to
collect, store, analyze and provide access
to data that assists systems users in
making better business decisions.
Wireless communication – IT executives are increasing their investment in
wireless applications as they recognize
the potential benefits of mobile solutions.
As a result, their departments are charged
with suppor
portable e-mail devices, smart phones and
other tools.
ting users of tablet computers,
PAGE 5
Page 8
ROBERT HALF TECHNOLOGY 2006 SALARY GUIDE
IT EMPLOYMENT OUTLOOK
Regulatory requirements – The
Sarbanes-Oxley Act of 2002 has had a
significant impact on technology departments within publicly traded companies
as well as nonpublic firms. IT professionals are required to assess information
systems for potential vulnerabilities and
help implement and manage procedures
IT PRIORITIES
CIOs were asked “Which of the following initiatives are the highest priorities for
that contribute to achieving sound inter-
nal control over financial reporting.
Additional regulations affecting IT depart-
ments in various industries include the
Health Insurance Portability and
Accountability Act (HIPAA), the USA
PATRIOT Act and the Graham-Leach-Bliley
Act, among others.
your IT department in the next 12 months?” Their responses:
35% NETWORK SECURITY IMPROVEMENTS
16% OPERATING-SYSTEM UPGRADE/INSTALLATION
15% DATABASE UPGRADE/INSTALLATION
15% CUSTOMER RELATIONSHIP MANAGEMENT
13% DATA STORAGE AND BACKUP
11% HARDWARE PURCHASES
10% WIRELESS COMMUNICATIONS
8% ERP UPGRADE/INSTALLATION
6% DEVELOPMENT OF E-BUSINESS APPLICATIONS
8% OTHER/DON’T KNOW
Source: Robert Half Technology survey of more than 1,400 CIOs from companies with more than 100 employees.
CIOs were allowed multiple responses.
PAGE 6
Page 9

OBERT HALF TECHNOLOGY 2006 SALARY GUIDE
R
THE ROLE OF CERTIFICATION
IN HIRING
For managers hiring technology professionals, certification is an important consideration. But how much value should
be placed on it? The answer isn’t always
clear and frequently depends on the
needs of the IT department.
THE CERTIFICATION
ADVANTAGE
Certification provides an employer clear
evidence of an individual’s familiarity
with a particular technology or practice.
Certification also demonstrates initiative
on the part of the applicant because he
or she has invested the extra effort to
obtain it. In addition, some employers
view certification as essential to a lifelong learning process.
THE ROLE OF EXPERIENCE
Certification is of greatest value when
it is accompanied by practical work
experience. For example, a job candidate
who possesses a Microsoft Certified
Database Administrator designation is
highly marketable, but one who also has
spent five years working with Microsoft
systems and has a track record of completing projects on time and under budget
is eminently more desirable to prospective employers.
CIOs want to hire individuals with a
track record of successful projects.
Consequently, they seek candidates who
not only possess the right technological
skills but also know how to put those
skills to practical use to deliver timely,
esults.
quality r
PAGE 7
Page 10

OBERT HALF TECHNOLOGY 2006 SALARY GUIDE
R
THE ROLE OF CERTIFICATION IN HIRING
VENDOR NEUTRAL VS.
VENDOR SPECIFIC
Employers often inquire about the difference between vendor-neutral and vendorspecific certification. The answer is best
described as a depth-versus-breadth
issue. If the position requires someone
will be the best fit. On the other hand,
businesses that need an IT professional
who knows a variety of programs and
technologies would seek to hire someone
who possesses a vendor-neutral certifi-
cation, such as CompTIA’s Network+
designation.
certification is of greatest value when it is
accompanied by practical work experience.
who possesses an intricate knowledge of
a particular program or technology, then
a candidate who either has years of
experience with that program or has a
vendor-specific designation supporting it
In the end, certification should play a role
in hiring, but it is only one of many fac-
tors. There is no substitute for a candi-
date’s actual work experience and a
record of success on past projects.
PAGE 8
Page 11

ROBERT HALF TECHNOLOGY 2006 SALARY GUIDE
IT SALARIES – UNITED STATES
Job Title 2005 2006 % Change
ADMINISTRATION
Chief Information Officer (CIO) $114,000 - $191,250 $114,750 - $196,000 1.8%
Chief Technology Officer (CTO) $ 95,250 - $149,000 $ 96,750 - $153,000 2.3%
Chief Security Officer (CSO) $ 90,750 - $134,000 $ 95,250 - $138,750 4.1%
Vice President of Information Technology $104,250 - $150,500 $104,750 - $154,000 1.6%
Information Technology Manager $ 80,250 - $112,250 $ 81,500 - $113,750 1.4%
APPLICATIONS DEVELOPMENT (a)
Manager $ 75,750 - $105,750 $ 78,250 - $108,000 2.6%
Project Manager $ 71,250 - $ 93,750 $ 72,750 - $ 99,250 4.2%
Systems Analyst $ 61,500 - $ 82,500 $ 62,500 - $ 84,750 2.3%
Applications Architect $ 74,500 - $105,750 $ 77,250 - $108,000 2.8%
Business Systems Analyst $ 56,000 - $ 80,500 $ 58,750 - $ 84,750 5.1%
Developer/Programmer Analyst $ 52,500 - $ 83,250 $ 55,250 - $ 86,750 4.6%
Lead Applications Developer $ 68,750 - $ 93,000 $ 72,000 - $ 98,250 5.3%
Technical Writer $ 42,750 - $ 64,750 $ 45,000 - $ 67,000 4.2%
CONSULTING & SYSTEMS INTEGRATION
Director $ 86,000 - $121,250 $ 87,500 - $127,000 3.5%
Practice Manager $ 85,250 - $113,750 $ 85,750 - $118,250 2.5%
Project Manager/Senior Consultant $ 73,250 - $ 96,000 $ 75,000 - $ 99,500 3.1%
Staff Consultant $ 53,750 - $ 74,000 $ 54,500 - $ 76,500 2.5%
IT Auditor $ 63,250 - $ 81,750 $ 67,000 - $ 94,250 11.2%
(a) Add 5 percent for C++ development skills, 7 percent for Java development skills, 5 percent for Visual Basic development skills, 10 percent for C# devel-
opment skills and 10 percent for Visual Basic .NET development skills.
PAGE 9
Page 12

ROBERT HALF TECHNOLOGY 2006 SALARY GUIDE
IT SALARIES – UNITED STATES
Job Title 2005 2006 % Change
DATA/DATABASE ADMINISTRATION (b)
Database Manager $ 81,250 - $110,250 $ 82,750 - $113,750 2.6%
Database Developer $ 66,250 - $ 97,750 $ 69,750 - $101,250 4.3%
Database Administrator $ 67,750 - $ 95,500 $ 68,250 - $ 98,750 2.3%
Data Analyst/Report Writer $ 51,250 - $ 68,000 $ 54,000 - $ 71,250 5.0%
Data Architect $ 76,750 - $106,750 $ 78,500 - $108,250 1.8%
Data Modeler $ 67,250 - $ 89,500 $ 67,250 - $ 93,250 2.4%
Data Warehouse Manager $ 82,000 - $104,500 $ 83,750 - $107,250 2.4%
Data Warehouse Analyst $ 70,750 - $ 93,250 $ 72,500 - $ 95,250 2.3%
Business Intelligence Analyst $ 71,250 - $ 94,250 $ 71,250 - $ 99,750 3.3%
QUALITY ASSURANCE (QA) & TESTING (c)
QA/Testing Manager $ 64,750 - $ 86,750 $ 67,250 - $ 88,250 2.6%
QA Analyst/Tester $ 50,250 - $ 66,750 $ 51,500 - $ 70,250 4.1%
INTERNET & E-COMMERCE (d)
Senior Web Developer $ 68,000 - $ 96,750 $ 69,250 - $ 97,250 1.1%
Web Developer $ 51,750 - $ 74,250 $ 53,250 - $ 77,500 3.8%
Web Administrator $ 48,250 - $ 70,250 $ 48,500 - $ 72,000 1.7%
Web Designer $ 43,750 - $ 68,250 $ 45,250 - $ 70,000 2.9%
Electronic Data Interchange (EDI) Specialist $ 53,750 - $ 74,500 $ 55,250 - $ 77,000 3.1%
E-Commerce Analyst $ 58,250 - $ 82,750 $ 60,500 - $ 84,500 2.8%
Messaging Administrator $ 48,000 - $ 68,000 $ 50,000 - $ 69,500 3.0%
NETWORKING/TELECOMMUNICATIONS (e)
Network Architect $ 71,750 - $105,500 $ 75,000 - $109,500 4.1%
Network Manager $ 64,250 - $ 86,000 $ 66,750 - $ 89,500 4.0%
Network Engineer $ 61,250 - $ 88,250 $ 64,750 - $ 89,750 3.3%
LAN/WAN Administrator $ 47,000 - $ 68,500 $ 49,000 - $ 70,750 3.7%
Telecommunications Manager $ 64,500 - $ 84,500 $ 66,250 - $ 87,250 3.0%
Telecommunications Specialist $ 46,250 - $ 65,500 $ 46,250 - $ 68,750 2.9%
(b) Add 10 percent for Oracle database skills, 10 percent for Microsoft SQL Server skills and 7 percent for IBM DB2 database skills.
(c) Add 5 percent for performance testing skills (e.g., Mercury Interactive tools).
(d) Add 7 percent for Java development skills, 10 percent for Java 2 Enterprise Edition development skills, 5 percent for Cold Fusion development skills,
7 percent for XML/Web services development skills, 5 percent for Active Server Page development skills, 10 percent for DCOM/COM/ActiveX development skills, 10 percent for C# development skills, 10 percent for Visual Basic .NET development skills and 5 percent for WebLogic clustering
administration skills.
(e) Add 12 percent for Cisco network administration skills, 10 percent for LINUX/UNIX administration skills, 5 percent for Windows 2000/2003/XP
administration skills and 10 percent for Voice over Internet Protocol administration skills.
PAGE 10
Page 13

OBERT HALF TECHNOLOGY 2006 SALARY GUIDE
R
IT SALARIES – UNITED STATES
Job Title 2005 2006 % Change
OPERATIONS
Manager $ 50,750 - $ 67,750 $ 51,250 - $ 69,750 2.1%
Computer Operator $ 27,250 - $ 39,500 $ 28,000 - $ 40,250 2.2%
Mainframe Systems Programmer $ 50,250 - $ 67,500 $ 51,750 - $ 69,250 2.8%
SECURITY (f)
Data Security Analyst $ 68,250 - $ 93,000 $ 71,250 - $ 96,750 4.2%
Systems Security Administrator $ 67,500 - $ 92,750 $ 69,250 - $ 97,250 3.9%
Network Security Administrator $ 63,750 - $ 90,500 $ 67,500 - $ 94,750 5.2%
SOFTWARE DEVELOPMENT (g)
Product Manager $ 77,000 - $104,250 $ 77,250 - $106,250 1.2%
Software Engineer $ 63,250 - $ 92,750 $ 65,250 - $ 95,750 3.2%
Software Developer $ 55,000 - $ 88,250 $ 57,250 - $ 90,250 3.0%
TECHNICAL SERVICES, HELP DESK & TECHNICAL SUPPORT (h)
Manager $ 59,000 - $ 85,500 $ 61,500 - $ 87,000 2.8%
Desktop Support Analyst $ 44,500 - $ 63,250 $ 45,000 - $ 63,500 0.7%
Systems Administrator $ 47,250 - $ 70,500 $ 49,000 - $ 72,500 3.2%
Help Desk Level 3 $ 41,000 - $ 53,750 $ 41,750 - $ 53,750 0.8%
Help Desk Level 2 $ 32,500 - $ 42,750 $ 32,750 - $ 43,000 0.7%
Help Desk Level 1 $ 26,250 - $ 36,750 $ 27,250 - $ 36,750 1.6%
Instructor/Trainer $ 43,250 - $ 65,500 $ 43,500 - $ 66,500 1.1%
PC Technician $ 27,750 - $ 40,750 $ 28,250 - $ 41,250 1.5%
Business Continuity Analyst $ 60,500 - $ 90,750 $ 62,500 - $ 93,500 3.1%
(f) Add 12 percent for Cisco network administration skills, 10 percent for LINUX/UNIX administration skills and 10 percent for Check Point firewall
administration skills.
cent for C++ development skills, 7 percent for Java development skills, 7 percent for XML/Web services development skills, 5 percent
Add 5 per
(g)
(h) Add 12 percent for Cisco network administration skills, 10 percent for LINUX/UNIX administration skills and 5 percent for Windows 2000/2003/XP
ver Page development skills, 5 percent for Visual Basic development skills, 10 percent for DCOM/COM/ActiveX development skills,
for Active Ser
10 percent for C# development skills and 10 percent for Visual Basic .NET development skills.
administration skills.
PAGE 11
Page 14

ROBERT HALF TECHNOLOGY 2006 SALARY GUIDE
REGIONAL HIRING TRENDS –
UNITED STATES
The salary ranges provided in the previous pages reflect the national averages for
each position. Approximate salary ranges for your market can be calculated using the
formula below and variance index numbers for specific cities (see Pages 13-16). The
average salary index for all U.S. cities is 100.
To determine the estimated salary range for a position in your area, follow the process
outlined below:
CALCULATING THE LOCAL SALARY RANGE
Example: web designer in Dallas
1.
Locate the position “web designer” on Page 10 and your city’s index number. (The
index number for Dallas is 105.0.)
2. Move the decimal point in the index number two places to the left (1.050).
3. Multiply the low end of the national salary range ($45,250) by the index number as
a percentage (from step two).
($45,250 x 1.050 = $47,513)
4. Repeat step three using the high end of the salary range ($70,000).
5. The approximate starting salary range for a web designer in Dallas is $47,513 to
$73,500.
The index figures should be used as a guide in determining actual compensation. A
number of factors, including company size, employee benefits, the candidate’s skill set
and current market conditions, can impact starting salaries. Please consult an account
executive with Robert Half Technology for help refining salary packages to match local
conditions.
PAGE 12
Page 15

ROBERT HALF TECHNOLOGY 2006 SALARY GUIDE
REGIONAL HIRING TRENDS – UNITED STATES
NEW ENGLAND
Connecticut, Maine, Massachusetts, New Hampshire, Rhode Island, Vermont
Leading Industries:
Retail, Software and Information Technology Services, Banking and Financial Services
Positions in Demand:
Project Manager, Business Systems Analyst, Help Desk Specialist
Selected Local Variances:
Boston, MA . . . . . . . . . . . .123.9
Hartford, CT . . . . . . . . . . . .108.1
Manchester, NH . . . . . . . .115.3
New Haven, CT . . . . . . . . .107.5
Source: U.S. Department of Labor’s Bureau of Labor Statistics and Robert Half Technology. Note that city index figures are reflective of all industries
and are not specific to the information technology field. For more information on average salaries in your city, contact the Robert Half Technology office
nearest you.
Portland, ME . . . . . . . . . . . .95.0
Providence, RI . . . . . . . . . .110.0
Springfield, MA . . . . . . . . . .92.0
Stamford, CT . . . . . . . . . . .121.4
PAGE 13
Page 16

ROBERT HALF TECHNOLOGY 2006 SALARY GUIDE
REGIONAL HIRING TRENDS – UNITED STATES
MIDDLE ATLANTIC
New Jersey, New York, Pennsylvania
Leading Industries:
Manufacturing, Real Estate, Banking and Financial Services
Positions in Demand:
Help Desk Specialist, Developer/Programmer Analyst, Software Developer
Selected Local Variances:
Buffalo, NY . . . . . . . . . . . . . .88.5
New York, NY . . . . . . . . . . .150.0
Paramus, NJ . . . . . . . . . . .121.2
Philadelphia, PA . . . . . . . . .115.0
Pittsburgh, PA . . . . . . . . . . . .95.5
Rochester, NY . . . . . . . . . . . .94.1
SOUTH ATLANTIC
Delaware, District of Columbia, Florida, Georgia, Maryland, North Carolina, South Carolina,
Virginia, West Virginia
Leading Industries:
Real Estate, Hospitality and Tourism, Manufacturing
Positions in Demand:
Applications Architect, Help Desk Specialist, Network Security Administrator
Selected Local Variances:
Atlanta, GA . . . . . . . . . . . .112.6
Baltimore, MD . . . . . . . . . .103.0
Charlotte, NC . . . . . . . . . .102.0
Greenville, SC . . . . . . . . . . .97.2
Orlando, FL . . . . . . . . . . . . .102.0
Raleigh, NC . . . . . . . . . . . .102.0
Washington, D.C. . . . . . . . .126.0
Wilmington, DE . . . . . . . . .100.0
Miami, FL . . . . . . . . . . . . . .114.0
WEST NORTH CENTRAL
Iowa, Kansas, Minnesota, Missouri, Nebraska, North Dakota, South Dakota
Leading Industries:
Business Services, Real Estate, Manufacturing
Positions in Demand:
Help Desk Specialist, LAN/WAN Administrator, Network Engineer
Selected Local Variances:
Des Moines, IA . . . . . . . . . .95.0
Kansas City, MO . . . . . . . . . .98.2
Omaha, NE . . . . . . . . . . . . . .94.0
St. Louis, MO . . . . . . . . . . .100.0
Minneapolis, MN . . . . . . . .104.0
Source: U.S. Department of Labor’s Bureau of Labor Statistics and Robert Half Technology. Note that city index figures are reflective of all industries
and are not specific to the information technology field. For more information on average salaries in your city, contact the Robert Half Technology office
nearest you.
PAGE 14 PAGE 15
Page 17

ROBERT HALF TECHNOLOGY 2006 SALARY GUIDE
REGIONAL HIRING TRENDS – UNITED STATES
EAST NORTH CENTRAL
Illinois, Indiana, Michigan, Ohio, Wisconsin
Leading Industries:
Banking and Financial Services, Manufacturing, Real Estate
Positions in Demand:
Project Manager, Applications Architect, Help Desk Specialist
Selected Local Variances:
Chicago, IL . . . . . . . . . . . . .123.0
Cincinnati, OH . . . . . . . . . . .96.4
Cleveland, OH . . . . . . . . . . .95.9
Detroit, MI . . . . . . . . . . . . .103.5
Indianapolis, IN . . . . . . . . .101.0
Milwaukee, WI . . . . . . . . .100.0
Columbus, OH . . . . . . . . . . .95.0
WEST SOUTH CENTRAL
Arkansas, Louisiana, Oklahoma, Texas
Leading Industries:
Energy, Construction, Real Estate
Positions in Demand:
Developer/Programmer Analyst, Help Desk Specialist, Web Administrator
Selected Local Variances:
Austin, TX . . . . . . . . . . . . . .105.0
Dallas, TX . . . . . . . . . . . . .105.0
Fayetteville, AR . . . . . . . . . .95.0
Houston, TX . . . . . . . . . . . .106.5
Little Rock, AR . . . . . . . . . . .91.0
Midland, TX . . . . . . . . . . . . .87.7
New Orleans, LA . . . . . . . . .84.1
Oklahoma City, OK . . . . . . . .87.0
San Antonio, TX . . . . . . . . . .93.0
Tulsa, OK . . . . . . . . . . . . . . .86.0
EAST SOUTH CENTRAL
Alabama, Kentucky, Mississippi, Tennessee
Leading Industries:
Business Services, Real Estate, Legal Services
Positions in Demand:
Developer/Programmer Analyst, Applications Architect, Network Engineer
Selected Local Variances:
Birmingham, AL . . . . . . . . . .93.5
Chattanooga, TN . . . . . . . . .95.0
Knoxville, TN . . . . . . . . . . . .88.0
Louisville, KY . . . . . . . . . . . .92.5
Memphis, TN . . . . . . . . . . . .95.0
Nashville, TN . . . . . . . . . . . .94.5
Lexington, KY . . . . . . . . . . . .84.1
Source: U.S. Department of Labor’s Bureau of Labor Statistics and Robert Half Technology. Note that city index figures are reflective of all industries
and are not specific to the information technology field. For more information on average salaries in your city, contact the Robert Half Technology office
nearest you.
PAGE 15
Page 18

OBERT HALF TECHNOLOGY 2006 SALARY GUIDE
R
REGIONAL HIRING TRENDS – UNITED STATES
MOUNTAIN
Arizona, Colorado, Idaho, Montana, Nevada, New Mexico, Utah, Wyoming
Leading Industries:
Real Estate, Business Services, Legal Services
Positions in Demand:
Developer/Programmer Analyst, Help Desk Specialist, Software Engineer
Selected Local Variances:
Albuquerque, NM . . . . . . . .87.0
Boise, ID . . . . . . . . . . . . . . . .85.6
Denver, CO . . . . . . . . . . . . .102.5
Phoenix, AZ . . . . . . . . . . . .104.0
Reno, NV . . . . . . . . . . . . . .100.0
Salt Lake City, UT . . . . . . . .100.0
Las Vegas, NV . . . . . . . . . .100.0
PACIFIC
Alaska, California, Hawaii, Oregon, Washington
Leading Industries:
Hospitality and Tourism, Real Estate, Banking and Financial Services
Positions in Demand:
Help Desk Specialist, Developer/Programmer Analyst, Systems Administrator
Selected Local Variances:
Honolulu, HI . . . . . . . . . . . . .93.0
Irvine, CA . . . . . . . . . . . . . .125.0
Los Angeles, CA . . . . . . . .125.0
Ontario, CA . . . . . . . . . . . .104.0
Portland, OR . . . . . . . . . . . .98.0
San Diego, CA . . . . . . . . . .115.0
San Francisco, CA . . . . . . .130.0
San Jose, CA . . . . . . . . . . .126.4
Seattle, WA . . . . . . . . . . . .115.0
Spokane, WA . . . . . . . . . . . .79.1
Sacramento, CA . . . . . . . . .107.5
Source: U.S. Department of Labor’s Bureau of Labor Statistics and Robert Half Technology. Note that city index figures are reflective of all industries
and are not specific to the information technology field. For more information on average salaries in your city, contact the Robert Half Technology office
est you.
near
PAGE 16 PAGE 17
Page 19

OBERT HALF TECHNOLOGY 2006 SALARY GUIDE
R
IT SALARIES – CANADA
Job Title 2005 2006 % Change
ADMINISTRATION
Chief Information Officer (CIO) $116,750 - $167,500 $118,250 - $172,000 2.1%
Chief Technology Officer (CTO) $101,000 - $147,000 $104,750 - $150,250 2.8%
Vice President of Information Technology $104,250 - $168,500 $106,750 - $176,000 3.7%
Information Technology Manager $ 84,250 - $111,000 $ 84,750 - $115,000 2.3%
APPLICATIONS DEVELOPMENT (a)
Manager $ 72,000 - $105,250 $ 74,250 - $104,250 0.7%
Project Manager $ 67,000 - $ 94,500 $ 67,750 - $ 98,250 2.8%
Systems Analyst $ 58,750 - $ 80,750 $ 57,250 - $ 82,250 0.0%
Applications Architect $ 69,750 - $ 91,250 $ 73,250 - $ 94,250 4.0%
Business Systems Analyst $ 56,750 - $ 79,500 $ 59,250 - $ 84,250 5.3%
Developer/Programmer Analyst $ 50,500 - $ 77,000 $ 51,000 - $ 77,750 1.0%
Lead Applications Developer $ 60,750 - $ 80,750 $ 64,250 - $ 84,250 4.9%
Technical Writer $ 39,250 - $ 57,000 $ 40,750 - $ 59,500 4.2%
CONSULTING & SYSTEMS INTEGRATION
Director $ 76,000 - $111,750 $ 79,500 - $114,250 3.2%
Practice Manager $ 78,000 - $104,000 $ 77,750 - $106,000 1.0%
Project Manager/Senior Consultant $ 72,500 - $ 93,250 $ 71,250 - $ 98,250 2.3%
Staff Consultant $ 48,250 - $ 61,750 $ 51,250 - $ 63,750 4.5%
IT Auditor $ 59,250 - $ 80,250 $ 61,750 - $ 87,500 7.0%
DATA/DATABASE ADMINISTRATION (b)
Database Manager $ 77,250 - $ 99,250 $ 77,750 - $102,750 2.3%
Database Developer $ 53,500 - $ 81,250 $ 55,500 - $ 82,750 2.6%
Database Administrator $ 61,750 - $ 84,750 $ 62,250 - $ 86,000 1.2%
Data Analyst/Report Writer $ 55,000 - $ 75,000 $ 56,750 - $ 78,750 4.2%
Data Architect $ 69,250 - $ 95,250 $ 71,750 - $ 98,250 3.3%
Data Modeler $ 59,500 - $ 90,750 $ 63,250 - $ 88,250 0.8%
Data Warehouse Manager $ 76,000 - $ 95,000 $ 78,500 - $ 96,750 2.5%
Data Warehouse Analyst $ 64,750 - $ 87,250 $ 65,250 - $ 87,750 0.7%
Business Systems Analyst $ 55,000 - $ 75,000 $ 58,250 - $ 80,250 6.5%
(a) Add 5 percent for C++ development skills, 7 percent for Java development skills, 5 percent for Visual Basic development skills, 10 percent for C#
development skills and 10 per
(b) Add 10 percent for Oracle database skills, 10 percent for Microsoft SQL Server skills and 7 percent for IBM DB2 database skills.
y ranges listed above ar
Note: All salar
isual Basic .NET development skills.
cent for V
e in Canadian dollars.
PAGE 17
Page 20

ROBERT HALF TECHNOLOGY 2006 SALARY GUIDE
IT SALARIES – CANADA
Job Title 2005 2006 % Change
QUALITY ASSURANCE (QA) & TESTING (c)
QA/Testing Manager $ 60,000 - $ 82,750 $ 62,750 - $ 89,500 6.7%
QA Analyst/Tester $ 53,000 - $ 73,250 $ 54,250 - $ 77,750 4.6%
INTERNET & E-COMMERCE (d)
Senior Web Developer $ 62,000 - $ 90,500 $ 64,250 - $ 92,000 2.5%
Web Developer $ 51,750 - $ 68,500 $ 51,750 - $ 70,500 1.7%
Web Administrator $ 45,750 - $ 66,250 $ 46,250 - $ 67,000 1.1%
Web Designer $ 57,500 - $ 75,000 $ 58,000 - $ 75,500 0.8%
Electronic Data Interchange (EDI) Specialist $ 54,250 - $ 79,750 $ 54,750 - $ 80,250 0.7%
E-Commerce Analyst $ 48,750 - $ 72,750 $ 49,250 - $ 74,250 1.6%
Messaging Administrator $ 42,500 - $ 60,750 $ 45,000 - $ 60,500 2.2%
NETWORKING/TELECOMMUNICATIONS (e)
Network Architect $ 64,250 - $ 92,000 $ 66,500 - $ 92,500 1.8%
Network Manager $ 64,750 - $ 85,000 $ 65,250 - $ 87,250 1.8%
Network Engineer $ 57,250 - $ 82,000 $ 58,750 - $ 82,000 1.1%
LAN/WAN Administrator $ 44,750 - $ 65,250 $ 46,500 - $ 65,500 1.8%
Telecommunications Manager $ 63,500 - $ 83,750 $ 64,250 - $ 86,000 2.0%
Telecommunications Specialist $ 51,750 - $ 67,500 $ 52,000 - $ 68,750 1.3%
OPERATIONS
Manager $ 53,250 - $ 63,000 $ 54,250 - $ 64,250 1.9%
Computer Operator $ 30,750 - $ 40,750 $ 31,000 - $ 41,500 1.4%
Mainframe Systems Programmer $ 54,500 - $ 75,750 $ 56,000 - $ 76,250 1.4%
(c) Add 5 percent for performance testing skills (e.g., Mercury Interactive tools).
(d) Add 7 percent for Java development skills, 10 percent for Java 2 Enterprise Edition development skills, 5 percent for Cold Fusion development skills,
7 percent for XML/Web services development skills, 5 percent for Active Server Page development skills, 10 percent for DCOM/COM/ActiveX development skills, 10 percent for C# development skills, 10 percent for Visual Basic .NET development skills and 5 percent for WebLogic clustering administration skills.
(e) Add 12 percent for Cisco network administration skills, 10 percent for LINUX/UNIX administration skills, 5 percent for Windows 2000/2003/XP
administration skills and 10 percent for Voice over Internet Protocol administration skills.
Note: All salary ranges listed above are in Canadian dollars.
PAGE 18 PAGE 19
Page 21

ROBERT HALF TECHNOLOGY 2006 SALARY GUIDE
IT SALARIES – CANADA
Job Title 2005 2006 % Change
SECURITY (f)
Data Security Analyst $ 67,000 - $ 90,250 $ 68,250 - $ 96,250 4.6%
Systems Security Administrator $ 61,500 - $ 88,250 $ 63,750 - $ 91,250 3.5%
Network Security Administrator $ 68,500 - $ 97,500 $ 69,250 - $102,500 3.5%
SOFTWARE DEVELOPMENT (g)
Product Manager $ 75,250 - $103,750 $ 77,500 - $105,750 2.4%
Software Engineer $ 57,250 - $ 84,000 $ 58,750 - $ 87,000 3.2%
Software Developer $ 47,750 - $ 77,250 $ 48,750 - $ 78,750 2.0%
TECHNICAL SERVICES, HELP DESK & TECHNICAL SUPPORT (h)
Manager $ 68,000 - $ 84,750 $ 67,750 - $ 86,250 0.8%
Desktop Support Analyst $ 51,250 - $ 65,250 $ 51,750 - $ 65,250 0.4%
Systems Administrator $ 43,500 - $ 66,250 $ 46,000 - $ 66,750 2.7%
Help Desk Level 3 $ 47,750 - $ 61,500 $ 49,250 - $ 62,750 2.1%
Help Desk Level 2 $ 36,250 - $ 47,250 $ 36,500 - $ 48,250 2.4%
Help Desk Level 1 $ 29,500 - $ 38,250 $ 30,250 - $ 38,750 1.8%
Instructor/Trainer $ 46,000 - $ 63,250 $ 47,750 - $ 65,500 3.7%
PC Technician $ 46,500 - $ 57,250 $ 46,000 - $ 58,250 0.5%
Business Continuity Analyst $ 51,250 - $ 85,000 $ 57,000 - $ 87,250 5.9%
(f) Add 12 percent for Cisco network administration skills, 10 percent for LINUX/UNIX administration skills and 10 percent for Check Point firewall
administration skills.
(g) Add 5 percent for C++ development skills, 7 percent for Java development skills, 7 percent for XML/Web services development skills, 5 percent
for Active Server Page development skills, 5 percent for Visual Basic development skills, 10 percent for DCOM/COM/ActiveX development skills,
10 percent for C# development skills and 10 percent for Visual Basic .NET development skills.
(h) Add 12 percent for Cisco network administration skills, 10 percent for LINUX/UNIX administration skills and 5 percent for Windows 2000/2003/XP
administration skills.
Note: All salary ranges listed above are in Canadian dollars.
PAGE 19
Page 22

OBERT HALF TECHNOLOGY 2006 SALARY GUIDE
R
REGIONAL HIRING TRENDS –
CANADA
CANADIAN EMPLOYMENT
OUTLOOK
Technology executives in Canada –
chiefly those within the legal services, oil
and gas, and business services sectors –
are increasing IT hiring activity in response
to economic growth. As in the United
States, companies are experiencing
heightened demand for highly skilled
candidates. In fact, individuals possessing
in-demand specialties – particularly those
with a combination of well-developed soft
skills, strong business fundamentals and
technical expertise – are receiving multiple
offers. Experienced .NET developers, IT
auditors and data security analysts are
among the most highly sought candidates.
IT executives in the Vancouver area –
particularly those within the energy, oil
and gas, and software development
industries – are seeking project managers,
software architects and business intelligence specialists. Ottawa is experiencing
IT employment growth within the federal
government, healthcare and education
sectors. Many CIOs in Toronto and
Calgary are adopting the .NET platform
t of broader initiatives to replace
as par
outdated technologies. This is fueling
demand in these areas for C# and Visual
Basic .NET development skills.
CALCULATING LOCAL
SALARIES
The salary ranges listed in this guide are
national averages. To calculate local
salary ranges, apply the equation outlined
on Page 21 or contact one of our account
executives for assistance in refining com-
pensation packages for your market. A
number of factors – including company
size, employee benefits, the candidate’s
skill set and current market conditions –
can impact starting salaries. Therefore,
the salary variance index figures should
be used only as a guide in determining
actual compensation. For salary ranges
more specific to your market and industry,
please contact your local office.
Provided on the following page are salary
variance index numbers for selected
cities. Information in that section is
based on data provided by our recruiting
and staffing experts in our Canadian
offices, as well as our company’s ongoing
national surveys, independent research
and data from Statistics Canada. The
average salary variance number for all
Canadian cities is 100.
PAGE 20
Page 23

ROBERT HALF TECHNOLOGY 2006 SALARY GUIDE
REGIONAL HIRING TRENDS – CANADA
To determine the estimated salary range for a position in your area, follow the steps
outlined below:
Example: network manager in Ottawa
1.
Locate the position “network manager” on the chart on Page 18 and your city’s
salary variance index number listed below. (The salary variance index number
for Ottawa is 99.5.)
2. Move the decimal point in the index number two places to the left (.995).
3. Multiply the low end of the national salary range ($65,250) by the index number
as a percentage (from step two).
($65,250 x .995 = $64,924)
4. Repeat step three using the high end of the salary range ($87,250).
5. The approximate starting salary range for a network manager in Ottawa is $64,924
to $86,814.
CANADIAN LOCAL VARIANCES
Calgary . . . . . . . . . . . . . . . . . . . . . .103.9
Edmonton . . . . . . . . . . . . . . . . . . . . .95.5
Montréal . . . . . . . . . . . . . . . . . . . . .98.3
Ottawa . . . . . . . . . . . . . . . . . . . . . . .99.5
Toronto . . . . . . . . . . . . . . . . . . . . . .105.1
Vancouver . . . . . . . . . . . . . . . . . . .102.5
Winnipeg . . . . . . . . . . . . . . . . . . . . .95.1
Source: Statistics Canada and Robert Half Technology
Note: Please contact one of our account executives for salary information regarding
cities not listed above.
PAGE 21
Page 24

ROBERT HALF TECHNOLOGY 2006 SALARY GUIDE
STAFFING FOR SUCCESS
Achieving appropriate IT staffing levels
continues to be a challenge and an
opportunity as companies seek to
capitalize on avenues for growth while
remaining within budget limitations.
Overhiring can compromise a firm’s
competitiveness and possibly lead to
layoffs should the business experience a
slowdown. At the same time, not hiring
enough people can jeopardize client
service levels and cause an organization
to miss valuable opportunities to capture
market share. Adding to the dilemma,
businesses that continue to expect
employees to accomplish more without
additional support may see burnout
among essential staff.
How can firms find the proper balance?
One solution is the development of a
strategic staffing plan that builds in flexibility through a blend of full-time and
project-based technology employees.
An increasing number of businesses are
discovering that augmenting core IT staff
with highly skilled project professionals
offers them a cost-effective way to bring
together the specialized experience they
need for both short- and long-term initia-
tives. This approach allows companies to
adapt rapidly to market changes without
assuming the fixed costs associated with
hiring full-time staff until there is a sus-
tainable need to do so. When that time
arrives, companies that have engaged
temporary workers often find them to be
excellent candidates for full-time posi-
tions since their on-the-job performance
can be evaluated over an extended period
of time.
THE VALUE OF
SPECIALIZATION
The best way for businesses to find
experienced project professionals who
can supplement the efforts of core staff
and immediately address IT needs is to
enlist the assistance of a staffing firm
that specializes in the field. Robert Half
Technology is the leader in placing highly
skilled IT professionals, and our account
executives can quickly develop targeted
solutions for each client’s individual
needs.
We have built extensive networks in the
local business communities we serve.
PAGE 22
Page 25

ROBERT HALF TECHNOLOGY 2006 SALARY GUIDE
STAFFING FOR SUCCESS
We also have longstanding national
alliances with highly respected organizations, including:
• Help Desk Institute
• Microsoft
• Association of Information Technology
Professionals
Our relationships with these organizations offer us a unique advantage in
locating candidates with the specialized
expertise to help companies boost productivity and grow their businesses.
Robert Half Technology is a division of
Robert Half International Inc. (NYSE symbol: RHI), the world’s leader in specialized
staffing services. We are proud to be the
exclusive staffing sponsor of Dress for
Success, a nonprofit organization that
provides assistance to low-income
women transitioning from unemployment
to self-sufficiency. Robert Half
Technology has more than 100 offices
throughout North America and Europe
and offers online recruiting and job
search services at
www.rht.com.
STAFFING OPTIONS
CIOs were asked, “When using outside staffing services for IT needs, do you
generally prefer on-site supplemental staff working under your supervision
or total-project outsourcing?”
Their responses:
20%
A COMBINATION
OF BOTH
66%
SUPPLEMENTAL
STAFF WORKING
UNDER YOUR
SUPERVISION
Source: Robert Half Technology survey of more than 1,100 CIOs from companies with more than 100 employees
14%
TOTAL PROJECT
OUTSOURCING
PAGE 23
Page 26

ROBERT HALF TECHNOLOGY 2006 SALARY GUIDE
THE LEADING RESOURCE
Robert Half Technology has built a reputation as the leading resource for IT employment and management trends and advice.
Each year, our firm conducts targeted
research and publishes articles, booklets,
white papers and other informational tools
to assist job seekers in finding meaningful
employment and companies in locating the
talent they need to remain competitive.
ADVICE BOOKLETS AND
WHITE PAPERS
In addition to our annual Salary Guide,
Robert Half Technology produces a number
of complimentary publications to help IT
professionals navigate the hiring and jobsearch processes. These resources include
What You Should Know About Background
Checks
, How to Check References When
References are Hard to Check
Creating Compensation and Benefits
Packages for Today’s Technology
Professionals
.
and
BOOKS AND COLUMNS
RHI chairman and CEO Max Messmer is a
widely published workplace expert, whose
popular advice column,
syndicated by Scripps-Howard News
Service. He also is the author of
Motivating Employees For Dummies;
Human Resources Kit For Dummies;
Managing Your Career For Dummies; Job
Resumania®, is
Hunting For Dummies,
The Fast Forward MBA in Hiring (all pub-
lished by John Wiley & Sons, Inc.).
2nd Edition; and
NATIONAL SURVEYS
Robert Half Technology conducts regular
surveys of executives and professionals
throughout North America to provide our
clients and candidates with up-to-date
information about the employment market.
Since 1995, our quarterly
Technology IT Hiring Index and Skills
Report
has forecast national hiring levels
and now includes information on IT
employment trends in major metropolitan
areas.
Robert Half
PROFESSIONAL DEVELOPMENT
OPPORTUNITIES
Robert Half Technology is committed to the
professional development of our consultants. Through our web-based training program, we provide them with the resources
necessary to enhance both their technical
and professional skills. This includes 24hour online access to more than 2,500
interactive educational courses covering
topics ranging from .NET and project management to business fundamentals and
interpersonal skills.
For more information about our many
resources, please visit
www.rht.com.
PAGE 24
Page 27

OFFICE DIRECTORY
UUNNIITTEEDD SSTTAATTEES
ARIZONA
Phoenix . . . . . . . . . . . . . . . . .(602) 224-2486
ARKANSAS
Fayetteville . . . . . . . . . . . . . .(479) 444-7152
CALIFORNIA
Glendale . . . . . . . . . . . . . . . .(818) 553-1354
Irvine . . . . . . . . . . . . . . . . . . .(949) 476-0879
La Jolla . . . . . . . . . . . . . . . . .(858) 558-6990
Oakland . . . . . . . . . . . . . . . . .(510) 839-5975
Ontario . . . . . . . . . . . . . . . . . .(909) 945-2272
Pleasanton . . . . . . . . . . . . . .(925) 847-1522
Sacramento . . . . . . . . . . . . .(916) 922-3147
San Francisco . . . . . . . . . . .(415) 434-4940
San Jose . . . . . . . . . . . . . . . .(408) 271-9063
San Mateo . . . . . . . . . . . . . .(650) 573-0551
Stockton . . . . . . . . . . . . . . . .(209) 474-0119
Westlake Village . . . . . . . . .(805) 496-5305
Westwood . . . . . . . . . . . . . . .(310) 209-6838
COLORADO
Colorado Springs . . . . . . . . .(719) 532-0222
Denver . . . . . . . . . . . . . . . . . .(303) 296-2345
CONNECTICUT
Hartford . . . . . . . . . . . . . . . . .(860) 278-0300
Stamford . . . . . . . . . . . . . . . .(203) 356-9500
DELAWARE
Wilmington . . . . . . . . . . . . . .(302) 791-0171
DISTRICT OF COLUMBIA
Washington, D.C. . . . . . . . .(202) 626-0250
FLORIDA
Fort Lauderdale . . . . . . . . . .(954) 763-5578
Jacksonville-Downtown . . .(904) 997-9960
Miami-Coral Gables . . . . . .(305) 774-7860
Orlando . . . . . . . . . . . . . . . . .(407) 426-9438
Tampa . . . . . . . . . . . . . . . . . .(813) 301-8942
West Palm Beach . . . . . . . .(561) 366-1093
GEORGIA
Atlanta-Buckhead . . . . . . . .(404) 221-2500
ILLINOIS
Chicago . . . . . . . . . . . . . . . . .(312) 616-7974
Hoffman Estates . . . . . . . . . .(847) 839-9387
Northbrook . . . . . . . . . . . . . .(847) 480-1774
Oakbrook Terrace . . . . . . . .(630) 368-0316
INDIANA
Indianapolis . . . . . . . . . . . . .(317) 687-3275
IOWA
Cedar Rapids . . . . . . . . . . . .(319) 362-8606
Des Moines . . . . . . . . . . . . . .(515) 282-6876
KANSAS
Overland Park . . . . . . . . . . . .(913) 339-9849
KENTUCKY
Louisville . . . . . . . . . . . . . . . .(502) 394-0525
MARYLAND
Baltimore . . . . . . . . . . . . . . . .(410) 783-6290
Bethesda . . . . . . . . . . . . . . . .(240) 497-1042
S
MASSACHUSETTS
Boston . . . . . . . . . . . . . . . . . .(617) 439-3000
Burlington . . . . . . . . . . . . . . .(781) 505-4031
MICHIGAN
Grand Rapids . . . . . . . . . . . .(616) 451-7000
Southfield . . . . . . . . . . . . . . .(248) 372-7501
Troy . . . . . . . . . . . . . . . . . . . .(248) 689-4290
MINNESOTA
Bloomington . . . . . . . . . . . . .(952) 831-6888
Minneapolis . . . . . . . . . . . . .(612) 359-4960
MISSOURI
St. Louis-Creve Coeur . . . . .(314) 205-1770
NEBRASKA
Omaha . . . . . . . . . . . . . . . . . .(402) 493-4933
NEVADA
Las Vegas . . . . . . . . . . . . . . .(702) 866-2869
NEW HAMPSHIRE
Manchester . . . . . . . . . . . . .(603) 647-6200
NEW JERSEY
Mount Laurel . . . . . . . . . . . .(856) 439-9595
Paramus . . . . . . . . . . . . . . . .(201) 843-7776
Parsippany . . . . . . . . . . . . . .(973) 292-2652
Princeton . . . . . . . . . . . . . . . .(609) 987-8010
Woodbridge . . . . . . . . . . . . .(732) 634-9211
NEW MEXICO
Albuquerque . . . . . . . . . . . . .(505) 888-6225
NEW YORK
Albany . . . . . . . . . . . . . . . . . .(518) 432-7442
Hauppauge . . . . . . . . . . . . . .(631) 231-1603
New York-Midtown . . . . . .(212) 687-7072
Rochester . . . . . . . . . . . . . . .(585) 232-4140
Uniondale . . . . . . . . . . . . . . .(516) 357-2506
White Plains . . . . . . . . . . . .(914) 761-7300
NORTH CAROLINA
Charlotte . . . . . . . . . . . . . . . .(704) 342-7982
Raleigh . . . . . . . . . . . . . . . . . .(919) 782-5111
OHIO
Akron . . . . . . . . . . . . . . . . . . .(330) 253-8160
Cincinnati . . . . . . . . . . . . . . .(513) 621-6890
Cleveland . . . . . . . . . . . . . . .(216) 621-6633
Columbus . . . . . . . . . . . . . . .(614) 365-7442
Dayton . . . . . . . . . . . . . . . . . .(937) 224-7442
Worthington . . . . . . . . . . . . .(614) 854-0020
OKLAHOMA
Oklahoma City . . . . . . . . . . .(405) 236-0202
Tulsa . . . . . . . . . . . . . . . . . . . .(918) 493-2411
OREGON
Portland . . . . . . . . . . . . . . . . .(503) 222-0946
PENNSYLVANIA
King of Prussia . . . . . . . . . .(610) 337-3650
Philadelphia . . . . . . . . . . . . .(215) 568-1513
Pittsburgh . . . . . . . . . . . . . . .(412) 471-0888
RHODE ISLAND
Providence . . . . . . . . . . . . . .(401) 273-4000
SOUTH CAROLINA
Greenville . . . . . . . . . . . . . . .(864) 232-7442
TENNESSEE
Memphis-Downtown . . . . .(901) 524-0769
Memphis-East . . . . . . . . . . .(901) 759-2332
Nashville-West End . . . . . . .(615) 385-1977
TEXAS
Austin-Downtown . . . . . . . .(512) 477-3389
Dallas-Downtown . . . . . . . .(214) 468-9191
Dallas-Galleria . . . . . . . . . . .(972) 503-3787
Fort Worth . . . . . . . . . . . . . . .(817) 336-1818
Houston-Galleria . . . . . . . . .(713) 993-1888
Houston-The Woodlands . . . .(28 1) 68 1-3046
San Antonio . . . . . . . . . . . . .(210) 696-1134
Westchase . . . . . . . . . . . . . .(832) 242-0175
UTAH
Salt Lake City . . . . . . . . . . . .(801) 364-5490
VIRGINIA
Richmond-West . . . . . . . . . .(804) 747-9500
Tysons Corner . . . . . . . . . . .(703) 847-0271
WASHINGTON
Seattle . . . . . . . . . . . . . . . . . .(206) 749-9260
WISCONSIN
Madison-West . . . . . . . . . . .(608) 827-8882
Milwaukee . . . . . . . . . . . . . .(414) 271-9670
INTERNATIONAL OFFICES
CCAANNAADDA
A
ALBERTA
Calgary . . . . . . . . . . . . . . . . . . .(403) 237-7500
Edmonton . . . . . . . . . . . . . . . . .(780) 426-6642
BRITISH COLUMBIA
Vancouver . . . . . . . . . . . . . . . .(604) 688-5256
ONTARIO
Mississauga . . . . . . . . . . . . . . .(905) 273-4092
North York . . . . . . . . . . . . . . . .(416) 227-0581
Ottawa . . . . . . . . . . . . . . . . . . .(613) 236-7442
Toronto . . . . . . . . . . . . . . . . . . .(416) 350-8143
CCZZEECCHH RREEPPUUBBLLIIC
Prague . . . . . . . . . . . . . .011-420-2-9633-8633
C
CORPORATE OFFICE
ROBERT HALF TECHNOLOGY
2884 Sand Hill Road
Menlo Park, California 94025 USA
(650) 234-6000
rht.com
Page 28

A Robert Half International Company
2884 Sand Hill Road, Menlo Park, California 94025 USA
© 2005 ROBERT HALF TECHNOLOGY EOE
RHT-1005-3646
 Loading...