

Page 1

Page 2
Spacelabs Medical: ADVANCED ELECTROCARDIOGRAPHY
ADVANCED
ELECTROCARDIOGRAPHY
Stanley 1. Anderson, MB
Department of Cardiology
Alfred Hospital
Prahran, Victoria, Australia 3181
Robert L. Burr, MSEE, PhD
University of Washington
Health Science Building
Nursing Research Office
Seattle, Washington 98195
W. Gregory Downs, BSE
Research Biomedical Engineer
Division of Cardiology
University Hospitals of Cleveland
Cleveland, Ohio 44106
Carol Jacobson, RN
Cardiovascular Clinical Specialist
Swedish Hospital Medical Center
Seattle, Washington 98104
Paul Lander, PhD
Assistant Professor of Medicine
The University of Oklahoma
Health Sciences Center
Oklahoma City, Oklahoma 73104
G. Ali Massumi, MD
Adult Cardiology
Texas Heart Institute
Houston, Texas 77030
David M. Mitvis, MD
Professor of Medicine
University of Tennessee
The Health Sciences Center
Memphis, Tennessee 38163
James C. Perry, MD
Associate in Pediatric Cardiology
Children’s Heart Institute
San Diego, CA 92123
Carlos Rizo-Patron, MD
Adult Cardiology
Texas Heart Institute
Houston, Texas 77030
Page 3
This book is part of the SpaceLabs Medical Biophysical
Measurement Book Series for biomedical and clinical
professionals. The series is an educational service of
SpaceLabs Medical, a leading provider of patient
monitoring and clinical information systems.
0 SpaceLabs Medical, Inc., 1995
First printing, 1992
Second printing, 1995
All rights reserved.
No part of this book may be reproduced by any means
or transmitted or translated into a machine language
without the written permission of the publisher.
All brands and product names are trademarks of their
respective owners.
Published by SpaceLabs Medical, Inc.,
Redmond, Washington, U.S.A.
Printed in the United States.
ISBN O-9627449-3-X
Page 4

TABLE OF CONTENTS
Spacelabs Medical: ADVANCED ELECTROCARDIOGRAPHY
Page
INTRODUCTION . . . . . . . . ..t........................................... 1
1.0
1.1
1.2
1.3
1.4
1.5
1.6
1.7
1.8
1.9
2.0
2.1
2.2
2.3
2.4
LEAD SYSTEMS ......................................
by Stanley T. Anderson, MB
Standard IL’-Lead Electrocardiogram ......................... 3
1 .I .1 Additional Leads ......................................... 3
1.12 Lead Problems ............................................ .7
1.1.3 Lead Presentation
Vectorcardiography .................................................. 11
Po2ar
Cf7rdiogrnphy ..................................................
Monitoriny: .............................................................. 13
1.4.1
Bedside
1.42 Exercise Testing ......................................... 13
1.4.3 Holter Monitoring
1.4.3.1 Continuous Monitoring ............ .15
1.4.3.2
Body Surface Mappil?g .............................................
Magnetocardiography .............................................. 17
Sij@Azleraged Electrocardiography ...................... 17
12.Lead Electrocardiogram Reconstruction ..............
Vectorcardiogram
....................................................... 13
Intermittent Monitoring.. .......... .15
Recorlstructiorl ............................ 19
........................................ 7
..................................... 15
3
11
15
17
CARDIAC RHYTHM
INTERPRETATION ................................
by Carol Jacobson, RN
Interpretation of Cardiac Rhythm Strips
Rkythms Originating in the Sinus Node
22.1 Normal Sinus
2.2.2 Sinus Bradycardia
2.2.3 Sinus Tachycardia
2.2.4 Sinus Arrhythmia ..................................... .25
2.2.5 Sinus Arrest..
Arrhythmias Originating in the Atria .................... .26
2.3.1 Premature Atria1 Complex ....................... 26
2.3.2 Wandering Atria1 Pacemaker
2.3.3 Multifocal Atria1 Tachycardia ................. .28
2.3.4 Atria1 Tachycardia and Paroxysmal
Atria1 Tachycardia
2.3.5 Atria1 Flutter .............................................. 29
2.3.6 Atria1 Fibrillation ...................................... .30
Arrhythmias
2.4.1 Premature Junctional Complex..
2.4.2 Junctional Rhythm
Originating
Rhythm .............................. 23
....................................
.................................... .24
.............................................. 25
.................................... .29
in the AVJunction.. ...... ..3 1
....................................
.................. 21
................ .23
................. .27
............. .31
21
.24
32
2.5
2.6
2.7
3.0
3.1
3.2
Page
Supraventricular Tachycardia ................................. .33
Arrhythmias Originating in the Ventricles
2.6.1 Premature Ventricular Complex ............ .33
2.6.2 Ventricular Tachycardia
2.6.3 Ventricular Fibrillation ............................ ,35
2.6.4 Accelerated Ventricular Rhythm ............ .35
2.6.5 Ventricular Asystole ................................ .36
AV Blocks ................................................................ 37
2.7.1 First-Degree AV Block ............................. .37
2.7.2 Second-Degree AV Block ........................ .37
2.7.2.1 Mobitz Type I Second-Degree
AV Block (Wenckebach) ........... .37
2.7.2.2
2.7.3 High Grade AV Block
2.7.4 Third-Degree AV Block ........................... .40
Mobitz Type II Second-Degree
AV Block ..................................... .38
.............................. .39
............. .33
.......................... .34
ARRHYTHMIA DETECTION
ALGORITHMS.. ......................................... 41
by W. Gregory Downs, BSE
Typical Applications
Defection Algorithms
3.1.1 Dedicated Arrhythmia
Monitoring System..
3.1.2 Holter Monitoring
3.1.3 Other Electrocardiographic Monitors ... ..4 3
3.1.4 Automatic Implantable Cardioverter-
Defibrillator ............................................... .43
Signal Processing .................................................... .43
3.2.1
Noise Sources..
3.2.1.1 Power Line Interference
3.2.1.2 Muscle Artifact.. ......................... .4l
3.2.1.3 Electrode Contact Noise ............ .44
3.2.1.4 Baseline Wander ........................ .44
3.2.1.5
3.2.2 Noise Removal ......................................... .45
3.2.3 Noise Detection
3.2.3.1 Primary Issues in Noise
3.2.4 Sample Rate ............................................... 47
3.2.5 Transformations ....................................... .47
3.2.6 Beat Detection
3.2.7 Feature Extraction .................................... .51
3.2.7.1
3.2.7.2 Frequency Domain Features .... .51
3.2.8 Beat Classification ..................................... 51
3.2.8.1
of
Arrhythmia
............................................... 42
................................. .42
..................................... 42
.......................................... .43
(60
Hz or 50 Hz) ......................... .43
Noise From a Single Electrode .45
......................................... 45
Detection/Rejection .................... 47
........................................... .51
Time Domain Features .............. .51
Template Match (Correlation)
Algorithms ................................. .51
Page 5
TABLE OF CONTENTS
3.3
3.4
4.0
4.1
4.2
4.3
4.4
4.5
4.6
5.0
5.1
5.2
3.3
5.4
Page
3.2.8.2 Feature Extraction (Cluster
3.2.8.3 Hybrid Algorithms
3.2.8.4 Rhythm Analysis
3.2.9 Pacemaker Spike Detection ...................... 55
3.2.10 Ventricular Fibrillation ............................. 55
3.2.11 Lead Selection ............................................
Alprifhm Verification
Current Trends in Arrhythmia Monitoring
3.4.1 Multiple Leads ...........................................
3.4.2 Improved Noise Rejection
3.4.3 ST Segment Monitoring ............................ 59
3.4.4 Incorporation of Other Parameters
3.4.5 P Wave Detection ...................................... 59
ST SEGMENT ANALYSIS
by David M. Mirvis, MD
Normal ST Segment and T
Basic Effects ofMyocardia1 Ischrmia
4.2.1 Hemodynamic Consequences of
Coronary Obstruction ............................... 63
4.2.2 Electrophysiologic Effects of
Myocardial Ischemia
4.2.3 Injury Currents .......................................... 63
Elecfrocurdic)~rapllic Efircts of
Myocardial lschemia ................................................ 64
4.3.1 DC-Coupled Amplifiers
4.3.2 AC-Coupled Amplifier ............................. 64
Recording E/ecfrocardiop’aphic Effects
of Myocardial Ischemia ........................................... .65
4.4.1 ECG Lead Systems
4.4.2 Amplifier and Monitor Systems .............
4.4.3 Analysis Systems ....................................... 67
Electrocardiographic Features
of Transient Ischemia ............................................... 68
Clinical Significance of Transient
ST Segment Depressiol7 .......................................... .68
Analysis) Algorithms ................. 53
....................
........................ 53
............................................. 57
........................
.............................
Wazv
........................
.................................
........................... 64
.................................... 65
.53
55
.57
............
.............
.59
........
.61
37
59
61
61
63
.67
PEDIATRIC
ELECTROCARDIOGRAPHY.. .....
by James C. Perry, MD
Heart Rate ................................................................ 69
Intervals and Leads
Cardiac Malposition
Effects of Congenital Hearf Defects .......................... 73
.................................................. 71
................................................. 71
.a
5.5
5.6
6.0
6.1
6.2
6.3
6.4
6.5
6.6
6.7
7.0
7.1
7.2
Page
Pediatric Arrhythmias..
5.5.1 Fetal Arrhythmias ....................................
5.5.2 Chaotic Atria1 Tachycardia..
5.5.3 Bradycardia in the Newborn.. .................
5.5.4 Developmental Aspects of WolffParkinson-White Syndrome and
Supraventricular
5.5.5 Junctional Ectopic
5.5.6 Permanent Junctional Reciprocating
Tachycardia ................................................ 81
5.5.7 Ventricular Tachycardia ........................... 83
5.3.8 Permanent Pacing Systems in Children.. 83
Pediatric Electrophysiology Studies ......................... 85
HEART RATE VARIABILITY..
by Robert L. Burr, MSEE, PhD
Physiologic Models for Heart Rate
Variability Analysis ................................................. 89
Heart Rate Definifion Problems ............................... 89
Which to Use: Heart Rate or Heart Period? ............
Time- Wei,qhfing Versus Beat- Weighting of
Statistical Summaries .............................................
Heart Rafe Variability Measures .............................
6.5.1 Kleiger Global Standard Deviation
6.5.2 Magid Statistic ..........................................
6.5.3 SDANN ...................................................... 97
6.5.4 Ewing BB50, pNNSD, RMSSD ................
6.5.5 Frequency Versus Beatquency
6.5.6 Traditional Versus Autoregressive
Model-Based Spectral Analysis
Idenfification of Nonsinus Beats ............................. 106
Heart Rate Variability as a Measure
in Clinical Environment
............................................ 75
.75
....................
Tachycardia
Tachycardia
........................................ 109
.................. 81
...............
................
.75
.79
.81
.86
......
........
,101
............
.92
.95
.96
.96
.96
.97
.99
LATE POTENTIALS AND THE
ELECTROCARDIOGRAM
by Paul Lander, PhD
Recording the High-Resolufion
Electrocardiogram ................................................. ,111
7.1.1 Registration ............................................. 113
7.1.2 Amplification and Filtering
7.1.3 Sampling ................................................. 113
7.1.4 Isolation ....................................................
Signal Averaging ................................................... 115
7.2.1 Triggering
7.2.2 Signal Averaging Techniques
7.2.3 Noise Monitoring .................................... 119
................................................
................... 113
................ 118
,111
...........
115
117
Page 6

TABLE OF CONTENTS
Spacelabs Medical : ADVANCED ELECTROCARDIOGRAPHY
7.3
7.4
7.5
8.0
8.1
8.2
8.3
Page
Time Domain Analysis
Electrocardiogram . . . . . . . . . . . . . . . . . . . . . . 121
7.3.1 Filtering . . . . . . . . . . . . . . . . . . . . . . . . . . . . . . . . . . . . . . . . . . . . . . . . . . . 123
7.32 Vector Magnitude Transform . .._.......... 127
7.3.3 Automatic Measurements . .._____ 127
Inferprefafio~z of Lntc Potentials . .._..._._._..._........... 129
Frequency Domain Analysis of
the High-Resolution Ekcfrocardiogram . . .._........ 129
7.5.1 Techniques .._____....................................... 133
7.5.2 Spectrotemporal Mapping . . . . . . .._______..... 133
of
the HigIt-Resolufion
ELECTROPHYSIOLOGY 134
by G. Ali Massumi, MD
and Carlos Rizo-Patron, MD
Electrophysiology Equipment
Requirements . . . . . ..___._....._.....................................,. 135
8.1.1 Recording Devices . . . . . . . . . . . . . . . . . . . . . . . . 133
8.1.2 Stimulator for Cardiac Pacing _____..__.___,,, 133
Surfncc Elecfro~rams
Infracavifary Elecfrograrns . . . . . . . . . . . 137
. . . . . . . . . . . . . . . . . . . 137
Page
8.4
8.5
8.6
8.7
8.8
8.9
8.10
9.0
10.0
11.0
12.0
13.0
Programmed Sfinrnlution
Cardiac Mapping ................................................... 139
Radiofrequency Cafhefer Ablation
Transesophageal Pacing and Recording ................. 141
Cardioversion ......................................................... 143
Defibrillation .......................................................... 143
Implanfable Cardioverfer-Defibrillator .................. ,143
ABBREVIATIONS ................................ ,147
REFERENCES ........................................
ILLUSTRATION CREDITS .......... ,155
BIBLIOGRAPHY ....................................
GLOSSARY
...................................... ,137
.......................... 141
................................................
INDEX . . . . . . . . . . . . . . . . . . . . . . . . . . . . . . . . . . . . . . . . . . . . . . . . . . . . . . . . . .
149
156
162
166
Page 7

Page 8
Spacelabs Medical : ADVANCED ELECTROCARDIOGRAPHY
INTRODUCTION
In the last 20 years, we have seen remarkable innovations in the diagnosis and treatment of cardiac disorders. Many of these result from the continued development of medical diagnostic instrumentation,
particularly the improved interpretation and analysis of electrocardiograms. This book focuses on the
enhancements of the electrocardiogram and its recording systems and the computer-based applications
that have been developed over the past two decades.
Section 1.0 reviews the fundamentals of
applications. Vectorcardiography, exercise testing, and assorted monitoring techniques are also discussed.
Section 2.0 provides an overview of the electrical physiology of the heart and a guide to the interpre-
tation of rhythm from electrocardiographic monitors.
Section 3.0 focuses on algorithms for arrhythmia detection and how their rapid advancement in realtime monitoring applies to current medical trends. Arrhythmia detection has become easier for the clinician, but increased use of these systems requires an understanding of how signal processing, noise removal, and beat detection relate to the patient’s condition.
Another specialized medical application of the electrocardiogram is ST segment analysis. Section 4.0
discusses various aspects of ST segment analysis, including the effects of myocardial ischemia, coronary
blockage, and transient ischemia.
Pediatric electrocardiography requires special considerations by the clinician and the biomedical
equipment technician. Adult criteria do not apply to newborns, infants, or youngsters. Section 5.0 de-
scribes the particular exceptions and parameters that must be understood when assessing pediatric patients’ heart rate as well as cardiac anomalies, defects, and other problems. Biplane fluoroscopy, an essential correlate of pediatric electrophysiologic studies, is also reviewed.
Heart rate variability has become a major noninvasive monitoring parameter for the influence of the
nervous system on the human heart. Section 6.0 summarizes the physiologic models for heart rate variability studies and the mathematical considerations
S’ection 7.0 emphasizes how late potentials relate to the high resolution electrocardiogram, a product
of advances in computer technology. The mathematical variables and theoretical concepts that led to this
application are presented.
Slection 8.0 describes
they apply to the clinical monitoring of the human
physiology equipment as well as the interpretations of the resulting electrograms.
the
achievements of research and application studies in electrophysiology as
the
standard 12-lead electrocardiogram and leads for specific
that
apply to its use in patient monitoring.
heart.
This section reviews the current used for electro-
Page 9
Page 10
1.0
Spacelabs Medical: ADVANCED ELECTROCARDIOGRAPHY
An electrocardiographic lead is a pair of polar terminals connected to electrodes. The heart
approximates a double dipole layer, and the time-varying electrical field produced propagates to the surface of the body.
To reach the recording electrodes on the surface, the electrical field must pass through
various tissues. This results in differing intensity of signals produced at equidistant points
from the cardiac source. The display of electrical activity recorded, therefore, depends on
the site of electrode placement and the lead configuration.
1.1
Standamll2-Lead Electrocardiogram
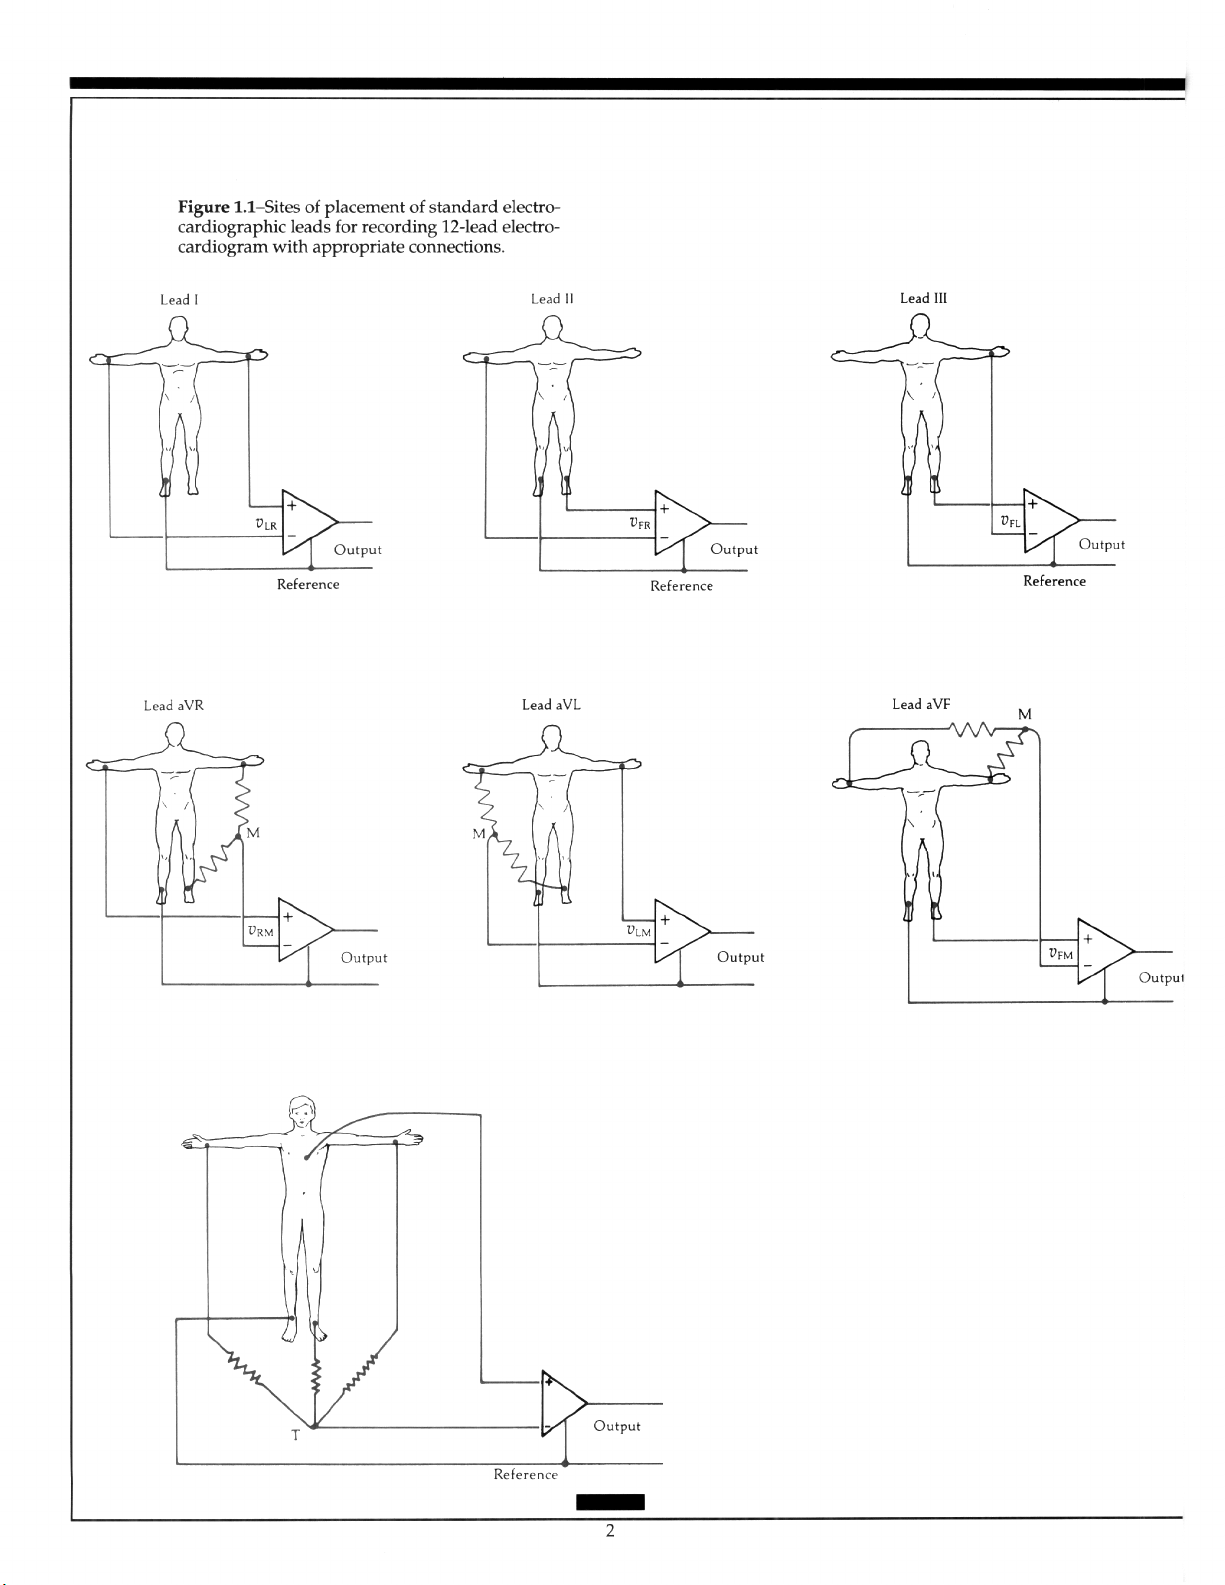
The reference electrode is attached to the right leg. Leads I, II, and III are bipolar leads introduced by Einthoven.’ The augmented limb leads aVR, aVL, and aVF were introduced
by Goldberger, who found that, by removing the exploring electrode from Wilson’s central terminal, the amplitude increased on these “unipolar” limb leads.‘,” The precordial
leads, V,-V,, are “unipolar” with the electrode position on the torso following the convention of the American Heart Association.” A detailed discussion of leads is in an earlier
publication in the Biophysical Measurement series entitled
A. Rawlings.5 Figure 1.1 shows site placement of standard electrocardiographic leads.
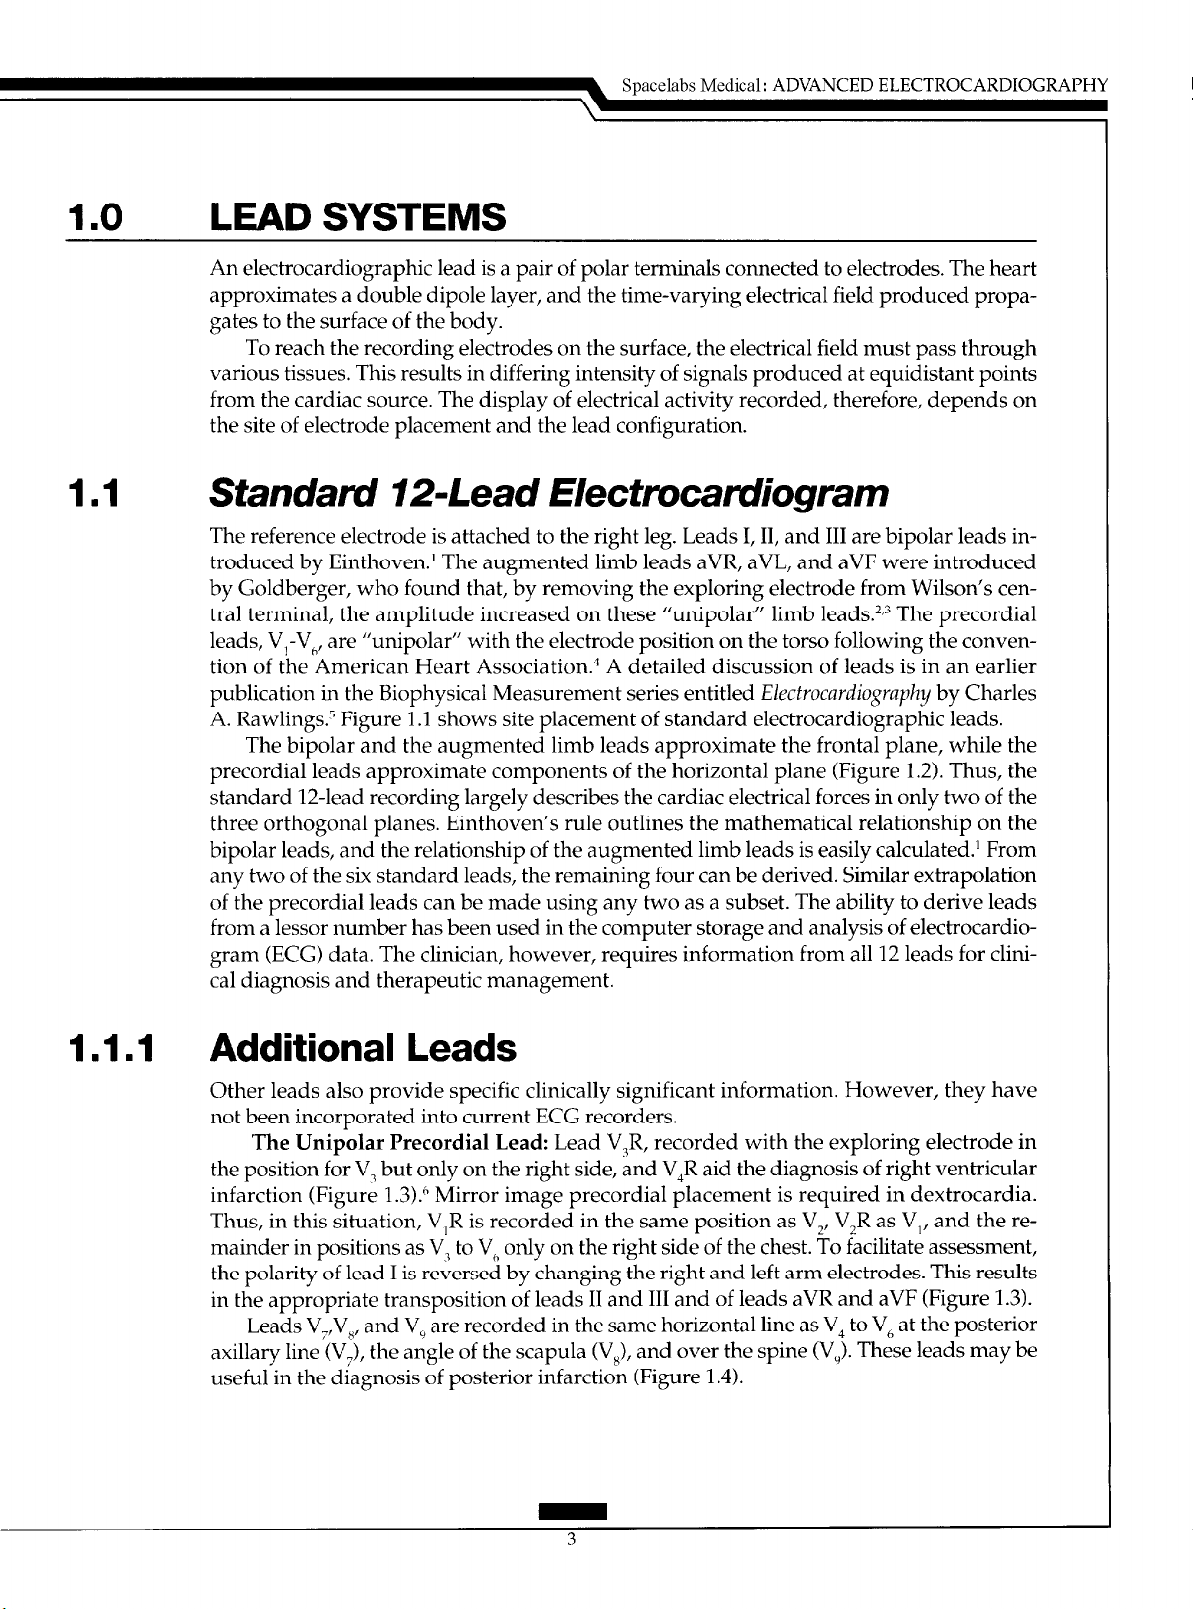
The bipolar and the augmented limb leads approximate the frontal plane, while the
precordial leads approximate components of the horizontal plane (Figure 1.2). Thus, the
standard 12-lead recording largely describes the cardiac electrical forces in only two of the
three orthogonal planes. Einthoven’s rule outlines the mathematical relationship on the
bipolar leads, and the relationship of the augmented limb leads is easily calculated.’ From
any two of the six standard leads, the remaining four can be derived. Similar extrapolation
of the precordial leads can be made using any two as a subset. The ability to derive leads
from a lessor number has been used in the computer storage and analysis of electrocardiogram (ECG) data. The clinician, however, requires information from all 12 leads for clinical diagnosis and therapeutic management.
1.1.1 Additional Leads
Electroclzrdiugrapky
by Charles
Other leads also provide specific clinically significant information. However, they have
not been incorporated into current ECG recorders.
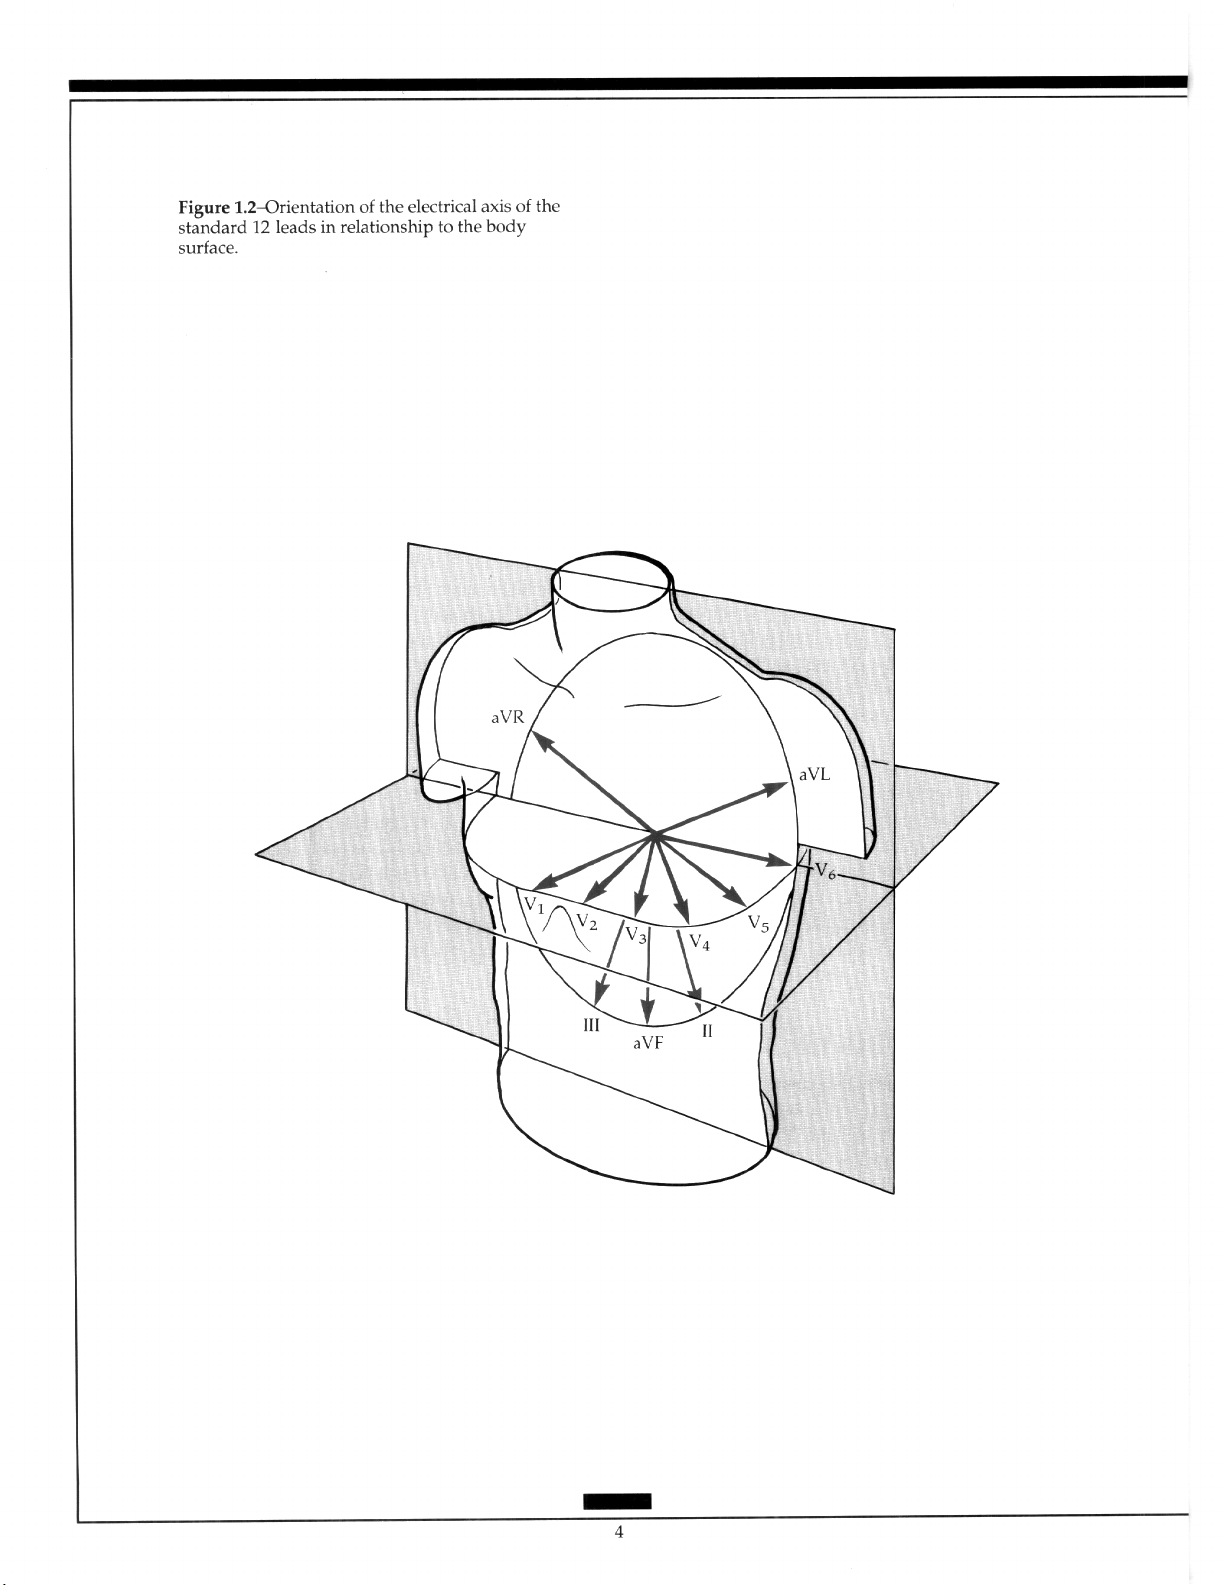
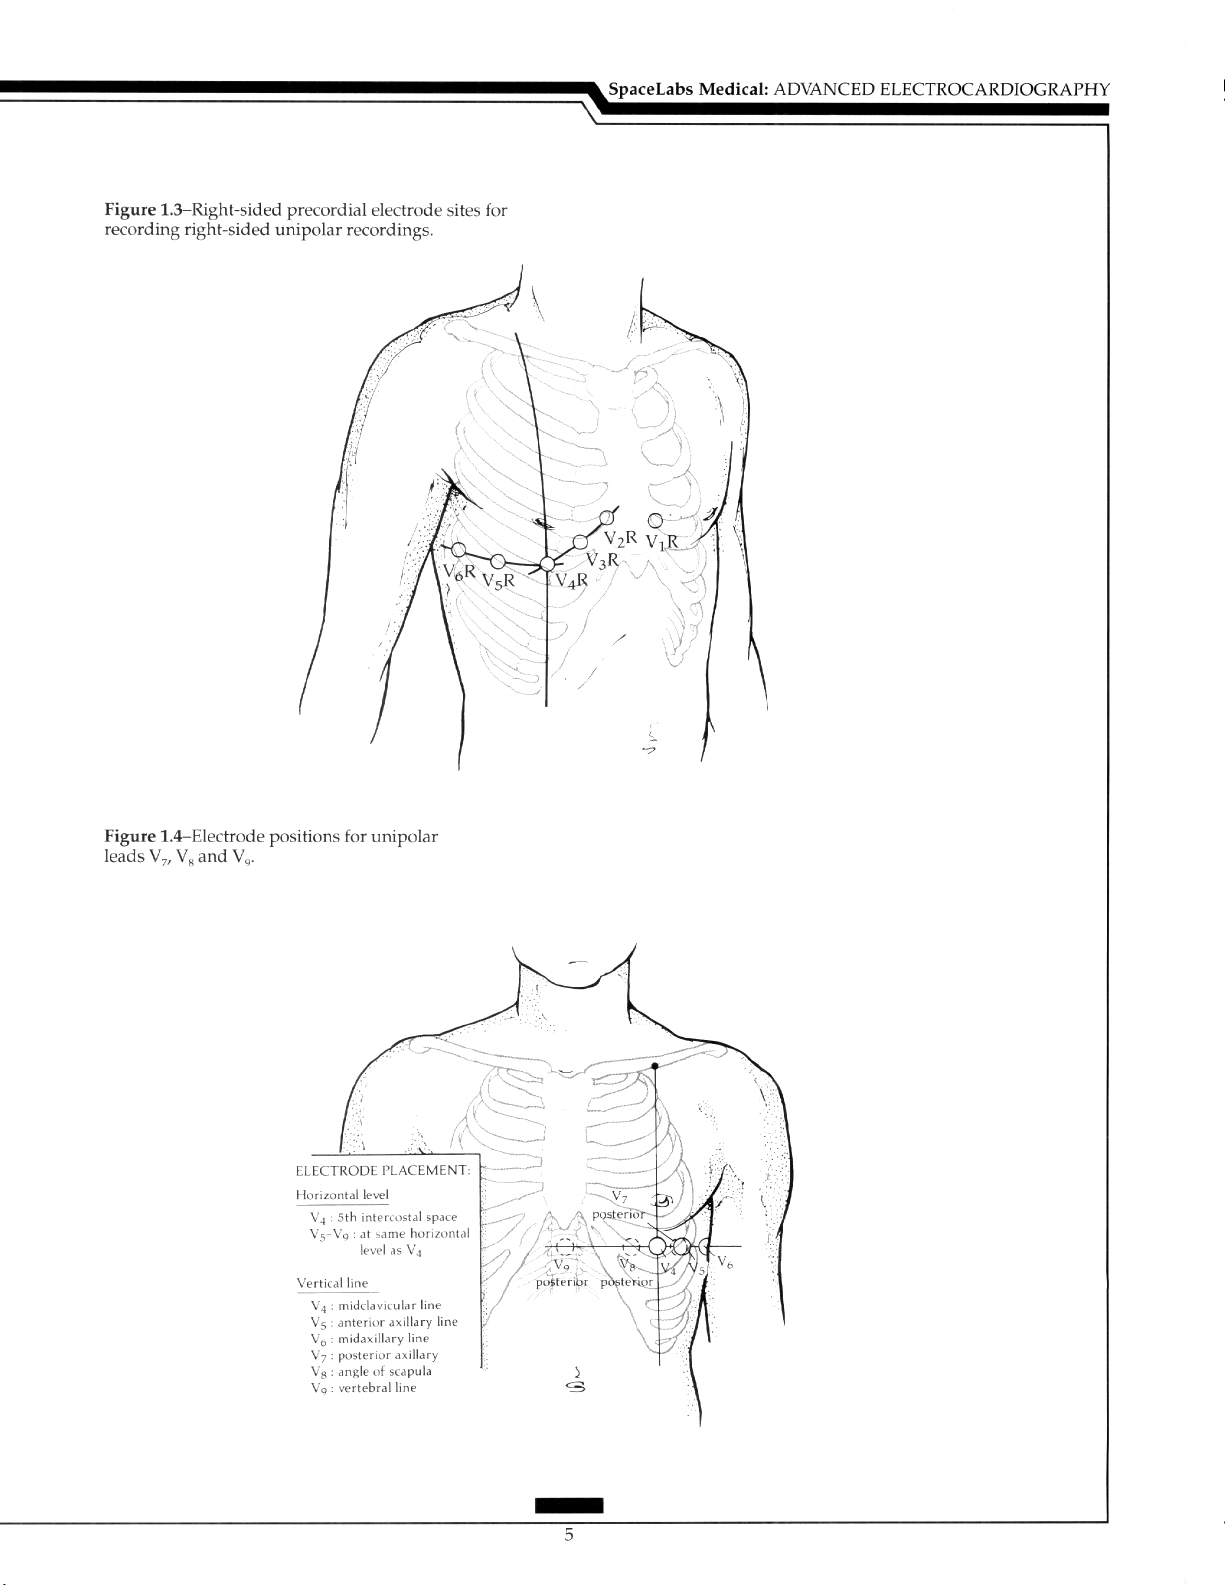
The Unipolar Precordial Lead: Lead V,R, recorded with the exploring electrode in
the position for V, but only on the right side, and V,R aid the diagnosis of right ventricular
infarction (Figure 1.3).h Mirror image precordial placement is required in dextrocardia.
Thus, in this situation, V,R is recorded in the same position as V,, V,R as V,, and the remainder in positions as V, to V, only on the right side of the chest. ?o facilitate assessment,
the polarity of lead I is reversed by changing the right and left arm electrodes. This results
in the appropriate transposition of leads II and III and of leads aVR and aVF (Figure 1.3).
Leads V;,V,, and V, are recorded in the same horizontal line as V, to V, at the posterior
axillary line (VJ, the angle of the scapula (V,), and over the spine (V,). These leads may be
useful in the diagnosis of posterior infarction (Figure 1.4).
Page 11
Page 12
Page 13
Page 14

Spacelabs Medical: ADVANCED ELECTROCARDIOGRAPHY
Occasionally, clinicians may wish to record in other lead positions, such as one
interspace higher. No accepted nomenclature exists to describe these leads. Therefore,
careful annotation should be made to avoid confusion, especially when serial tracings are
compared.
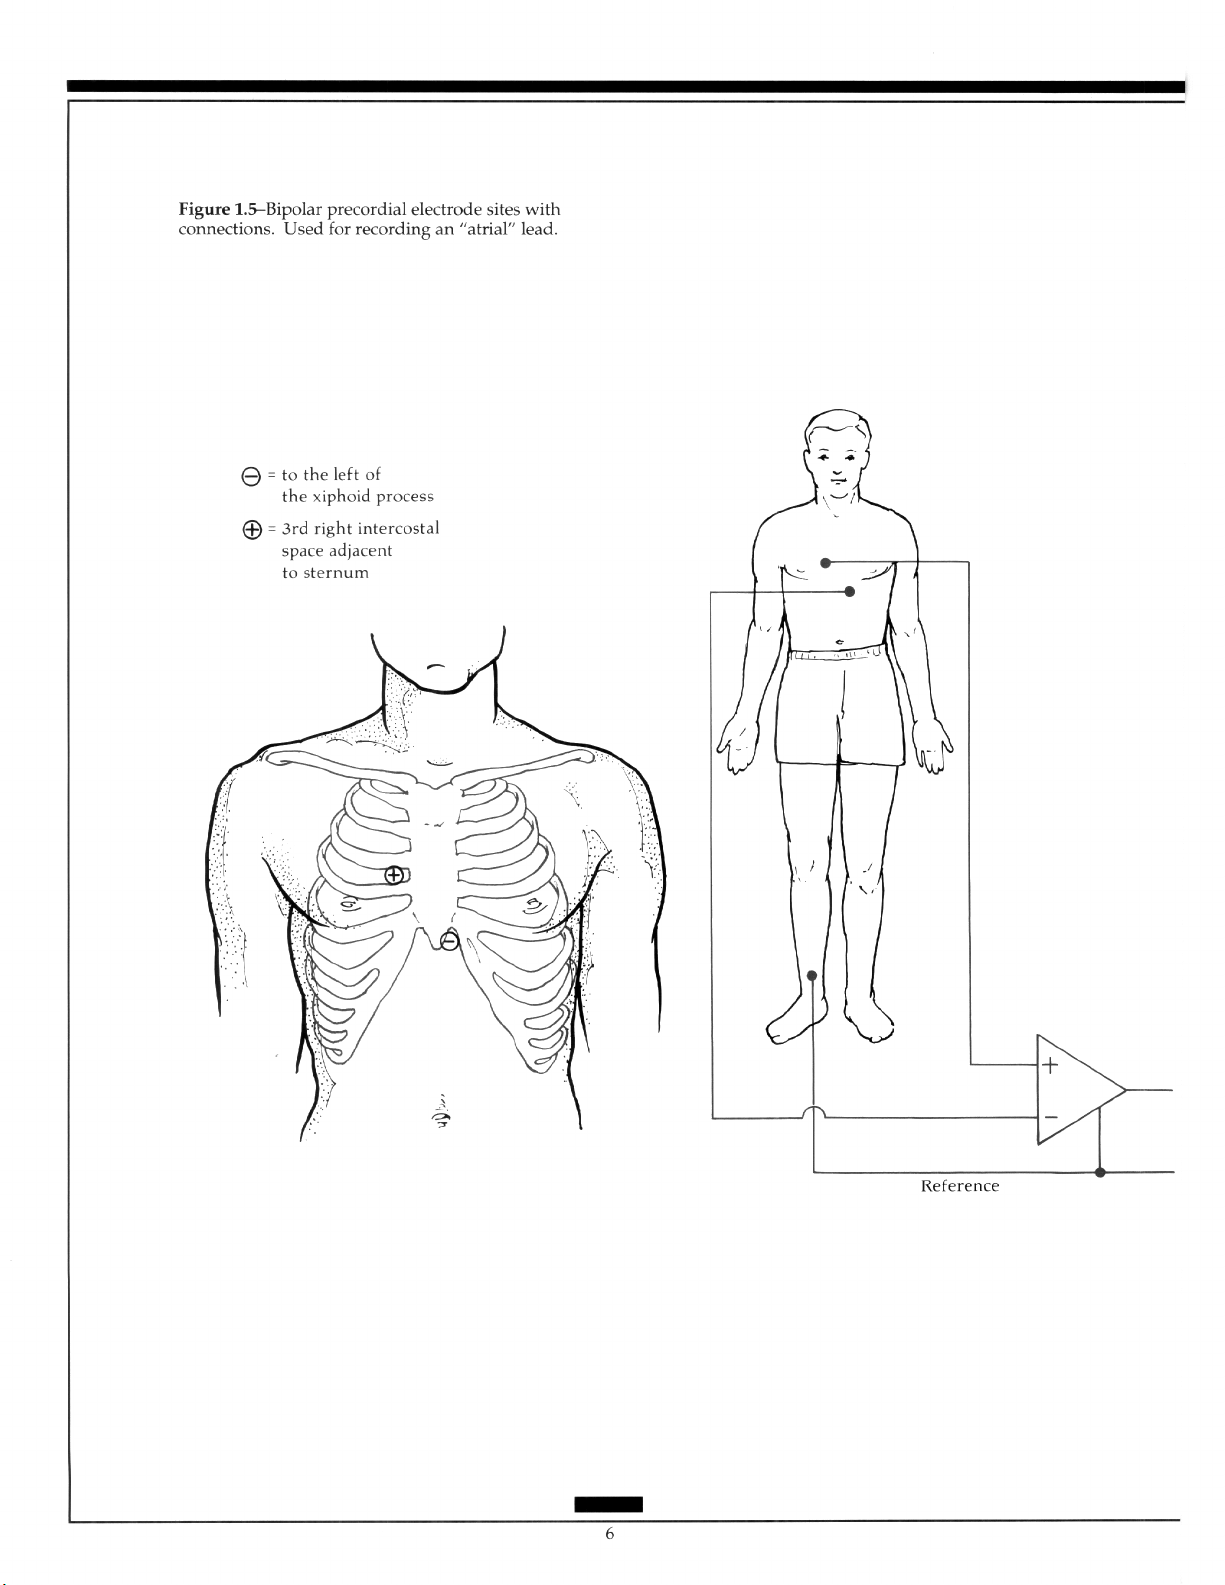
The Bipolar Precordial Lead: A lead, sometimes called the atria1 lead, is recorded
from the right of the sternum in the third interspace to the xiphoid process of the sternum
to aid detection of atria1 activity. Usually used for monitoring, an atria1 lead can provide
additional information in the differentiation of rhythm disturbances when combined with
the standard ECG (Figure 1.5).
In Europe, the Nehb leads are occasionally used to access atria1 activity. This presentation consists of three bipolar leads with the placement of the electrodes on the second rib
at the junction with the sternum, the posterior axillary line at the level of the apex of the
scapula, and on the left front of the chest at the level of the scapular apex.7
The Semi-Orthogonal Lead: The X, Y, and Z leads are available on some three-channel recorders and will be discussed later.
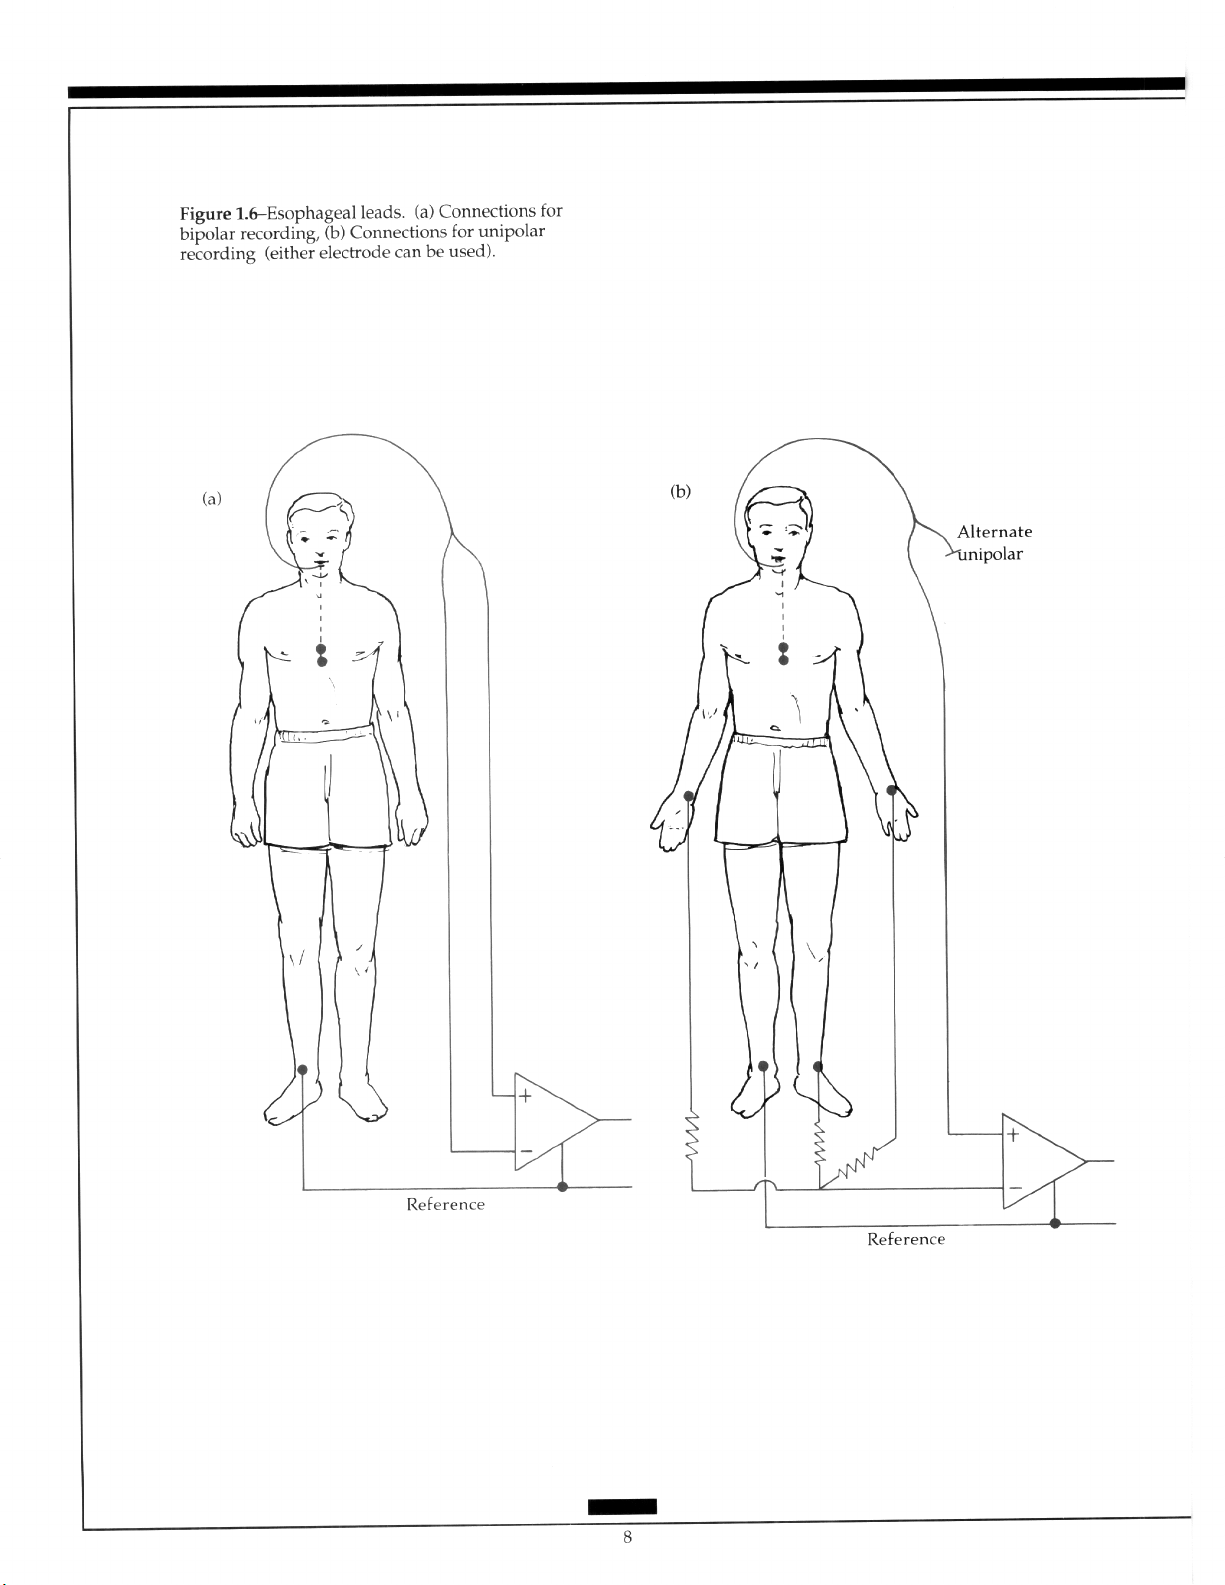
Other Leads: In the diagnosis of broad complex tachyarrhythmias, the use of unipolar
or bipolar esophageal recordings in association with standard leads facilitates identification of separate atria1 and ventricular activity (Figure 1.6). Post cardiac surgery epicardial
electrodes are often placed to assess pacing in the postoperative period. These electrodes
can record either unipolar atria1 or ventricular electrograms, or can combine this information into a bipolar electrogram.
1 .I .2 Lead Problems
Misplacement of electrodes is the most commonly recognized problem associated with
the limb leads. Reversal of the arm leads causes inversion of lead I, with reversal of II and
III, and reversal of leads aVR and aVL. The components of lead II or III may be reversed,
or all three leads may be rotated clockwise or counterclockwise producing specific patterns that are important to recognize to avoid false interpretations? Mispositioning of the
exploring chest electrode high on the precordium or the reversal of leads can make interpretation difficult, particularly when serial comparisons are necessary.
The electrodes may be placed on any part of the arms or the left leg as long as they are
below the shoulders in the former and below the inguinal fold anteriorly and the gluteal
fold posteriorly in the Iatter.9 When it is not possible to place the electrodes accordingly,
such as with an amputation or severe bums, another more proximal placement should be
used.
I. 1.3 Lead Presentation
The standard X&lead presentation commonly uses limb leads in the order I, II, III, aVR,
aVL, aVF, and the precordial leads V, through Vg. This is done either by grouping the
leads into subsets of three displayed horizontally or in groups of six displayed vertically.
Fumagalli introduced the concept of presenting aVR as - aVR and a more logical sequencing of the standard leads.lO This presentation, subsequently popularized by
Cabrera and represented in the American literature by Dower and colleagues, offers a way
to use the available information more readily and turns the aVR from a relatively ignored
lead into a very useful one.iill*
7
Page 15
Page 16
Page 17
Page 18
Spacelabs Medical : ADVANCED ELECTROCARDIOGRAPHY
1.2
Vectorcamliography
Electrical activity radiates from the heart in all directions. Thus, a record of it in three
planes that are at right angles to each other should contain more information than the
standard surface recording. The recording of electrical activity in three planes requires the
use of leads that represent the frontal, horizontal, and sagittal planes and is known as
vectorcardiography. When the lead configuration closely approximates this situation, the
leads are said to be orthogonal. For convenience of lead application (due to a reluctance to
abandoning the 12-lead ECG tracing), a semiorthogonal system was developed.lh
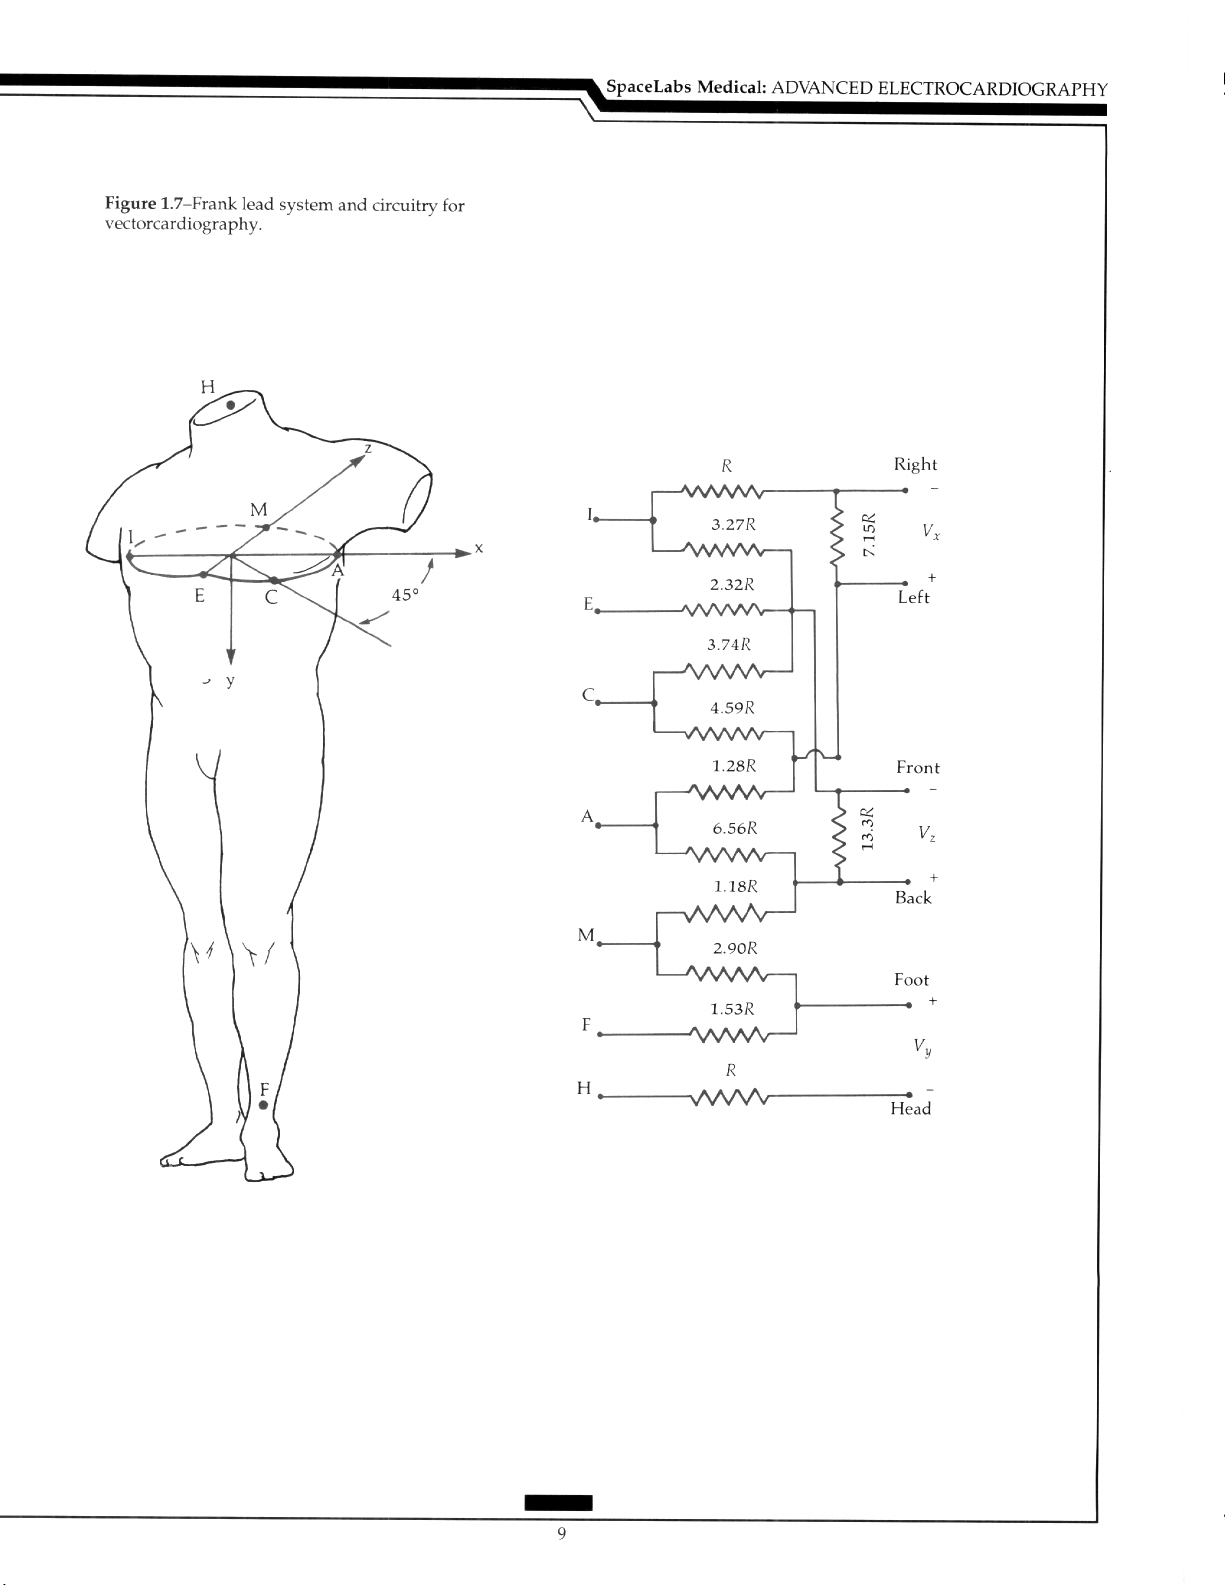
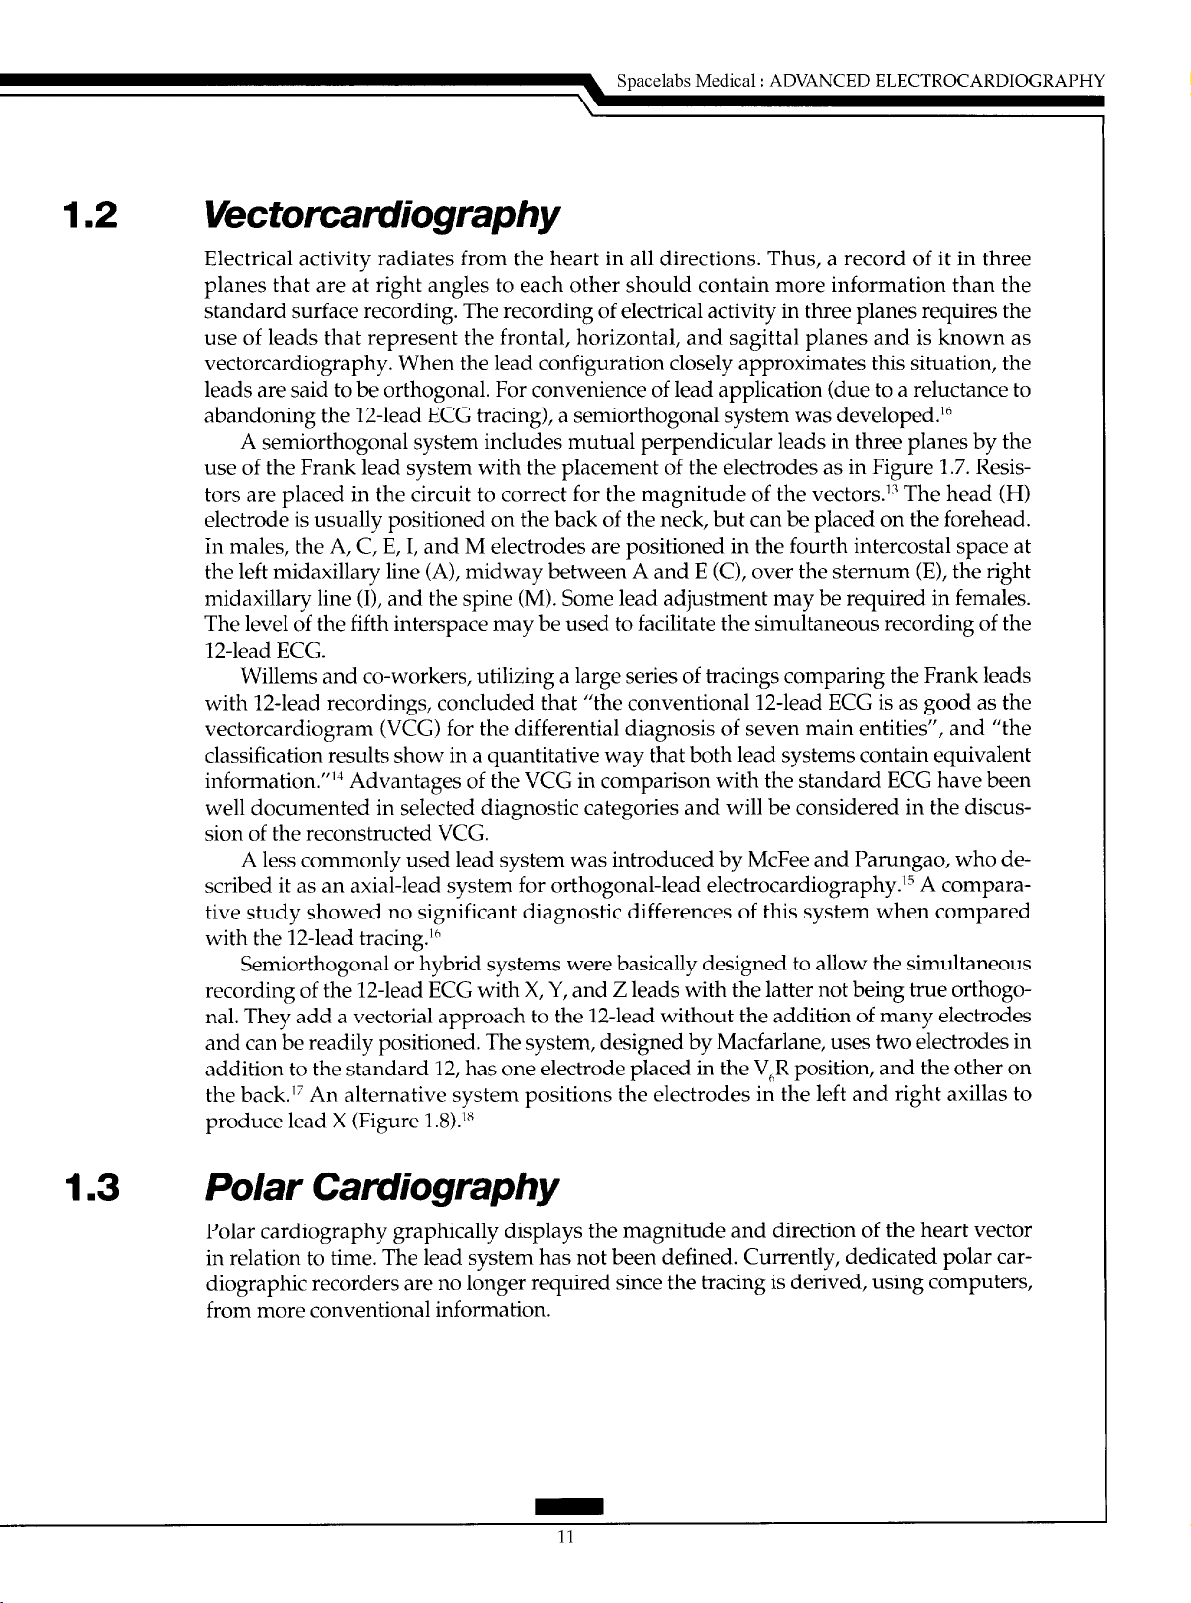
A semiorthogonal system includes mutual perpendicular leads in three planes by the
use of the Frank lead system with the placement of the electrodes as in Figure 1.7. Resistors are placed in the circuit to correct for the magnitude of the vectors.‘” The head (H)
electrode is usually positioned on the back of the neck, but can be placed on the forehead.
in males, the A, C, E, I, and M electrodes are positioned in the fourth intercostal space at
the left midaxillary line (A), midway between A and E (C), over the sternum (El, the right
midaxillary line (I), and the spine (Ml. Some lead adjustment may be required in females.
The level of the fifth interspace may be used to facilitate the simultaneous recording of the
12-lead ECG.
Willems and co-workers, utilizing a large series of tracings comparing the Frank leads
with 12-lead recordings, concluded that “the conventional 12-lead ECG is as good as the
vectorcardiogram (VCG) for the differential diagnosis of seven main entities”, and “the
classification results show in a quantitative way that both lead systems contain equivalent
information.“” Advantages of the VCG in comparison with the standard ECG have been
well documented in selected diagnostic categories and will be considered in the discussion of the reconstructed VCG.
A less commonly used lead system was introduced by McFee and Parungao, who described it as an axial-lead system for orthogonal-lead electrocardiography.‘5 A comparative study showed no significant diagnostic differences of this system when compared
with the 12-lead tracing.‘(’
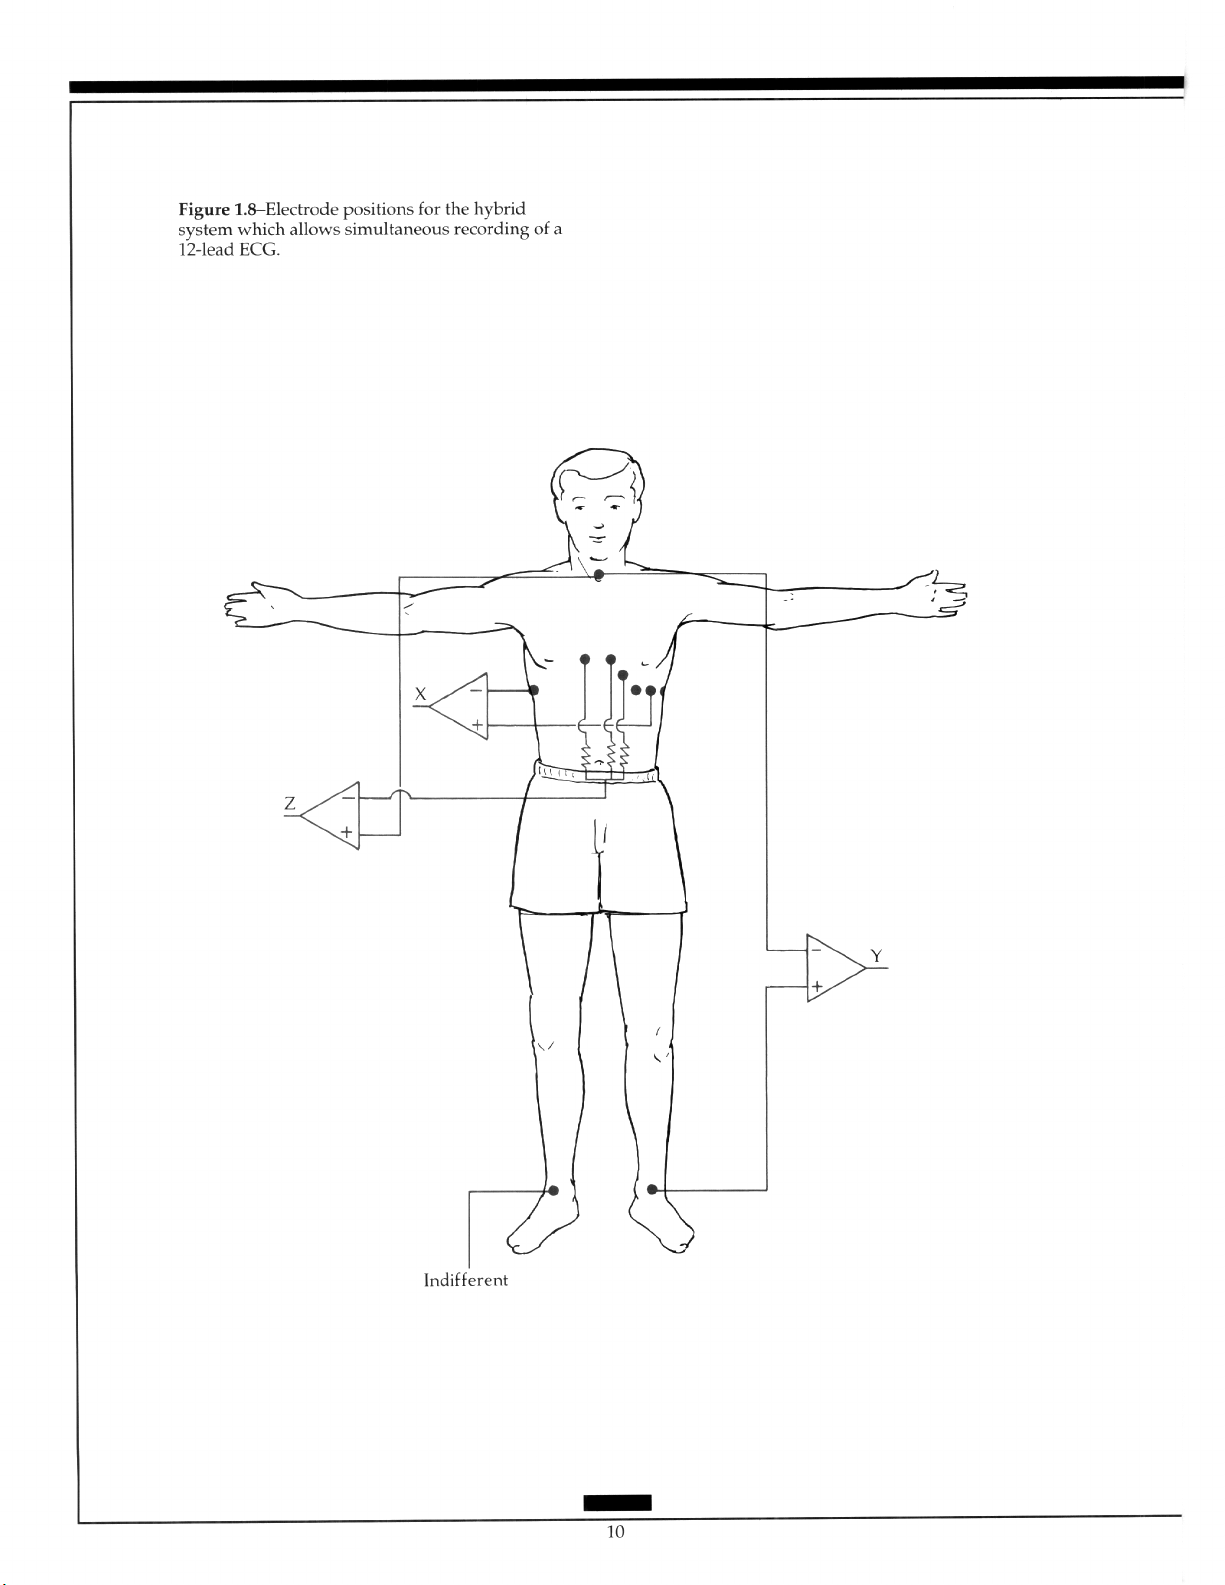
Semiorthogonal or hybrid systems were basically designed to allow the simultaneous
recording of the 12-lead ECG with X, Y, and Z leads with the latter not being true orthogonal. They add a vectorial approach to the 12-lead without the addition of many electrodes
and can be readily positioned. The system, designed by Macfarlane, uses two electrodes in
addition to the standard 12, has one electrode placed in the V,R position, and the other on
the back.” An alternative system positions the electrodes in the left and right axillas to
produce lead X (Figure 1.81.”
1.3
Polar Camliography
Polar cardiography graphically displays the magnitude and direction of the heart vector in relation to time. The lead system has not been defined. Currently, dedicated polar cardiographic recorders are no longer required since the tracing is derived, using computers, from more conventional information.
Page 19
Page 20
1.4 Monitoring
1.4.1 Bedside
Monitoring is most commonly used in patients with coronary artery disease in whom
rhythm disturbances occur with a high frequency. Monitoring can be performed in a coronary care unit, an intensive care unit, an operating room, or in transit to one of these areas.
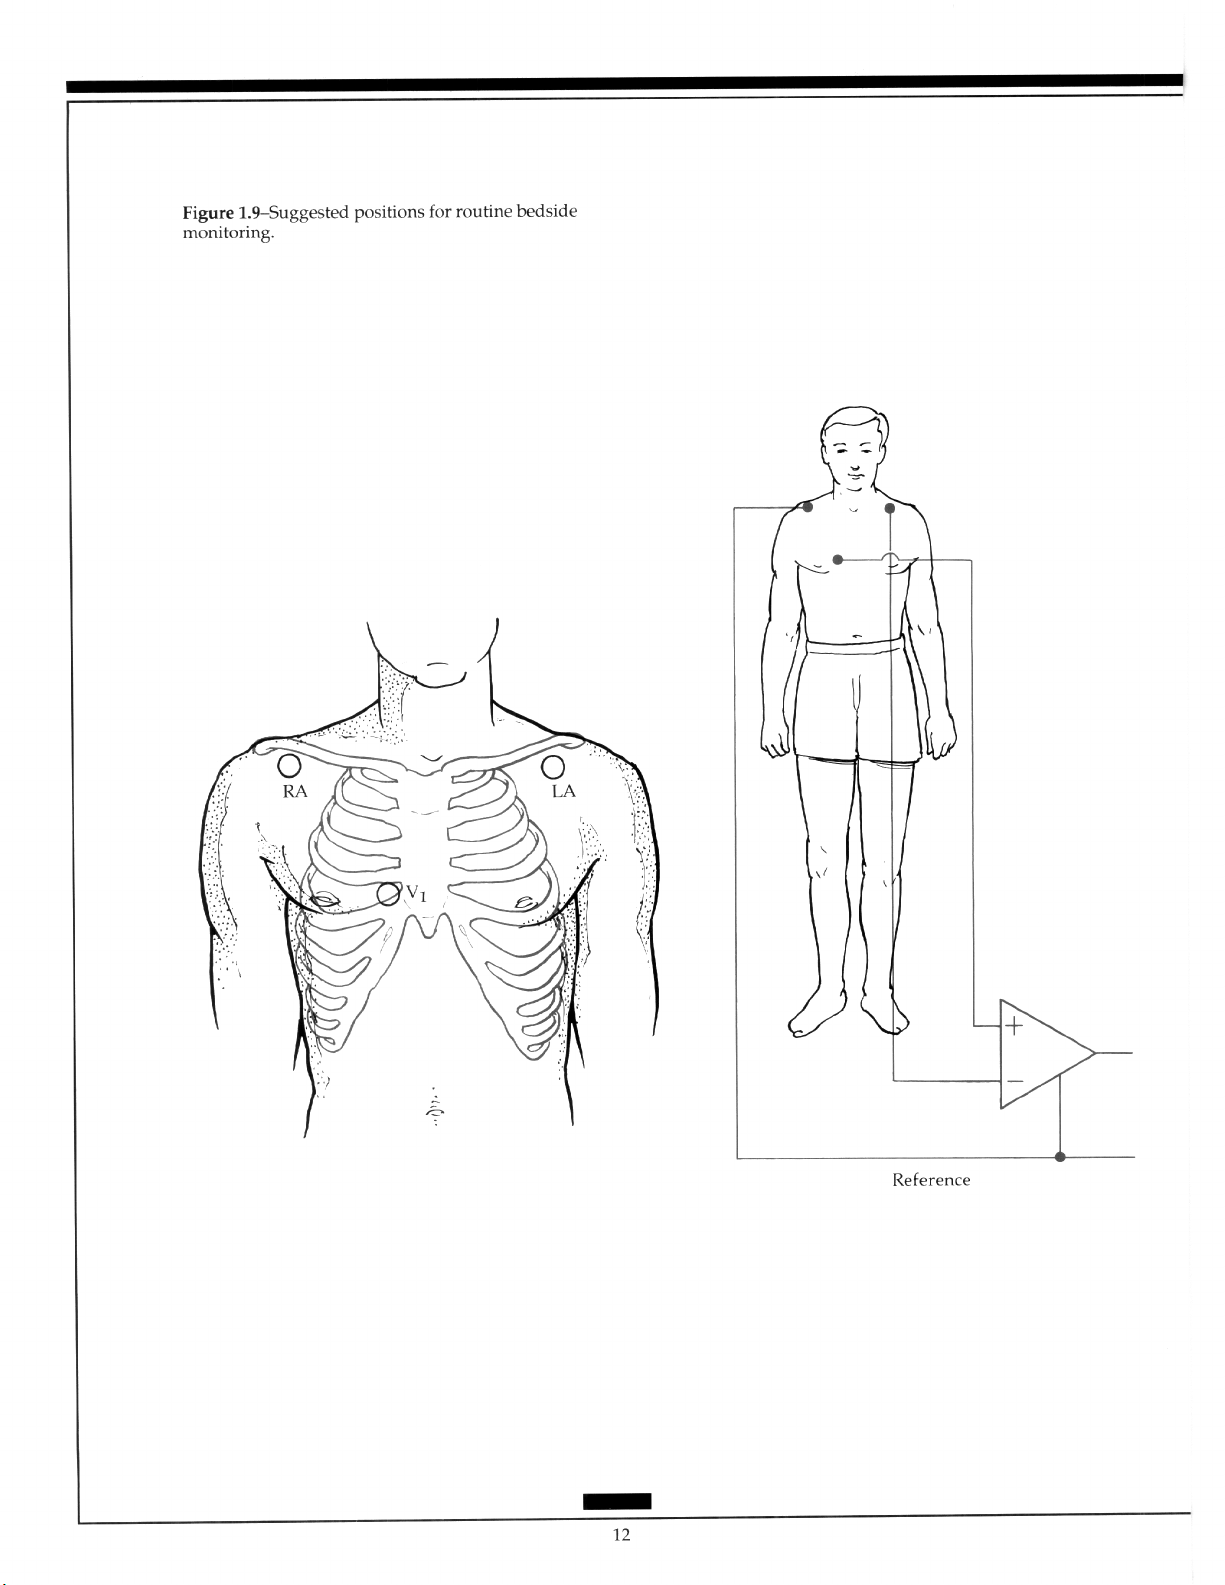
The left parasternal window should remain available for the possible use of an external
defibrillator and to allow easy access for clinical examination of the heart. Thus, Marriott
and Fogg designed a modified bipolar lead (MCL,).‘” The neutral, or ground, electrode is
placed under the outer aspect of the right clavicle, the positive electrode in the position of
V,, and the negative electrode near the left shoulder (Figure 1.9). This configuration usually permits good visualization of atria1 activity. Since alternate precordial positions are
sometimes needed, bipolar leads with the positive electrode placed near the apex or on
the lower left rib cage can be used.
1.4.2 Exercise Testing
Spacelabs Medical: ADVANCED ELECTROCARDIOGRAPHY
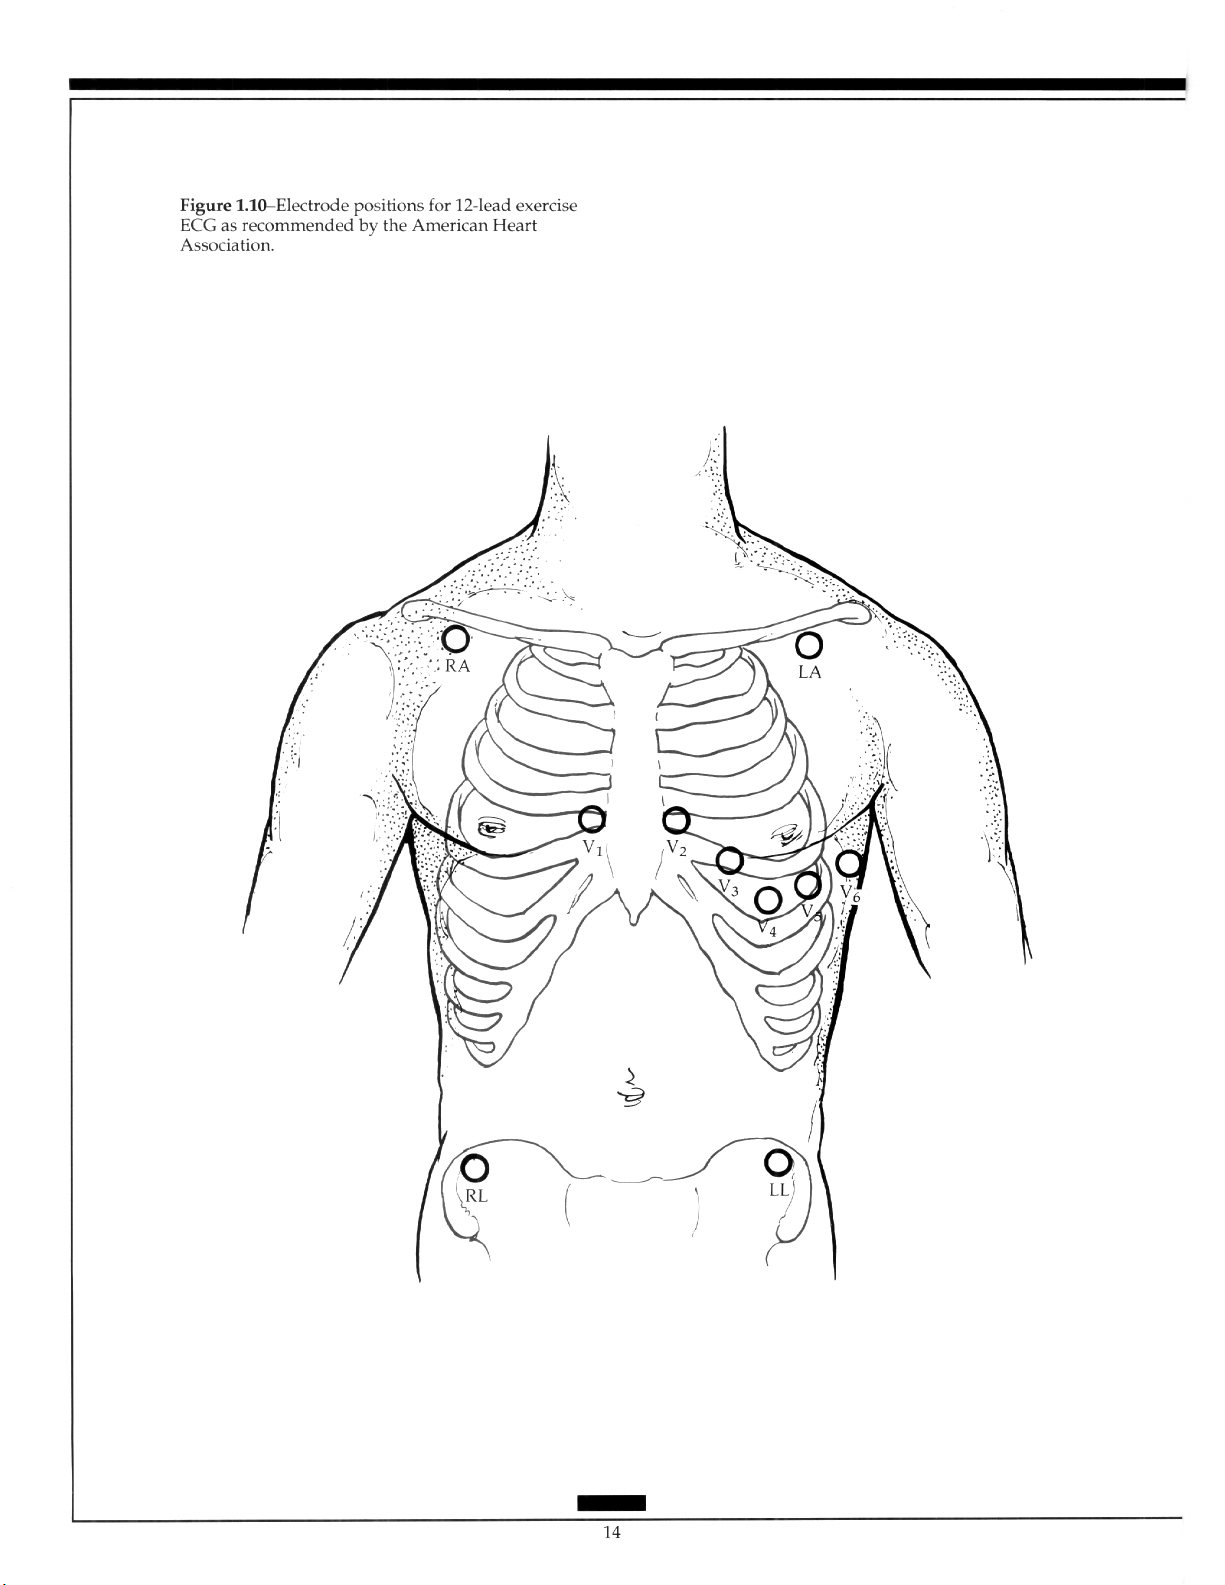
Monitoring the standard 12-lead ECG usually recorded during exercise is not practical because of motion artifact introduced into the limb leads. Mason and Likar recommended
moving the limb leads centrally, with little effect on the 12-lead recording.?” They also
moved the right arm electrode to the right infraclavicular fossa, medial to the deltoid insertion and 2 cm below the medial end of the clavicle, the left arm electrode to a similar
position below the left clavicle, the left leg electrode midway between the costal margin
and the iliac crest in the anterior axillary line, and the right leg electrode on the midthigh.
Subsequently, the use of the right leg electrode positioned in the region of the right iliac
fossa has become standard (Figure l.lO).*’
Significant differences between the standard ECG and the 12 leads recorded by the
above methods before and during exercise suggests that such tracing should be labelled as
“torso positioned” or “nonstandard.“?’ A study comparing the recommended lead positions with those of the standard 12-lead ECGs showed that inferior and posterior infarcts
were lost in 69% and 31% of the recordings, respectively. Use of electrodes placed on the
proximal portions of the right and left arm have produced 12-lead ECGs more closely resembling the standard tracing.‘? Subsequent investigation has shown that differences
along the left arm were accentuated relative to those along the right arm and, along the
left leg, an anterior site showed less deviation than did a more lateral site?”
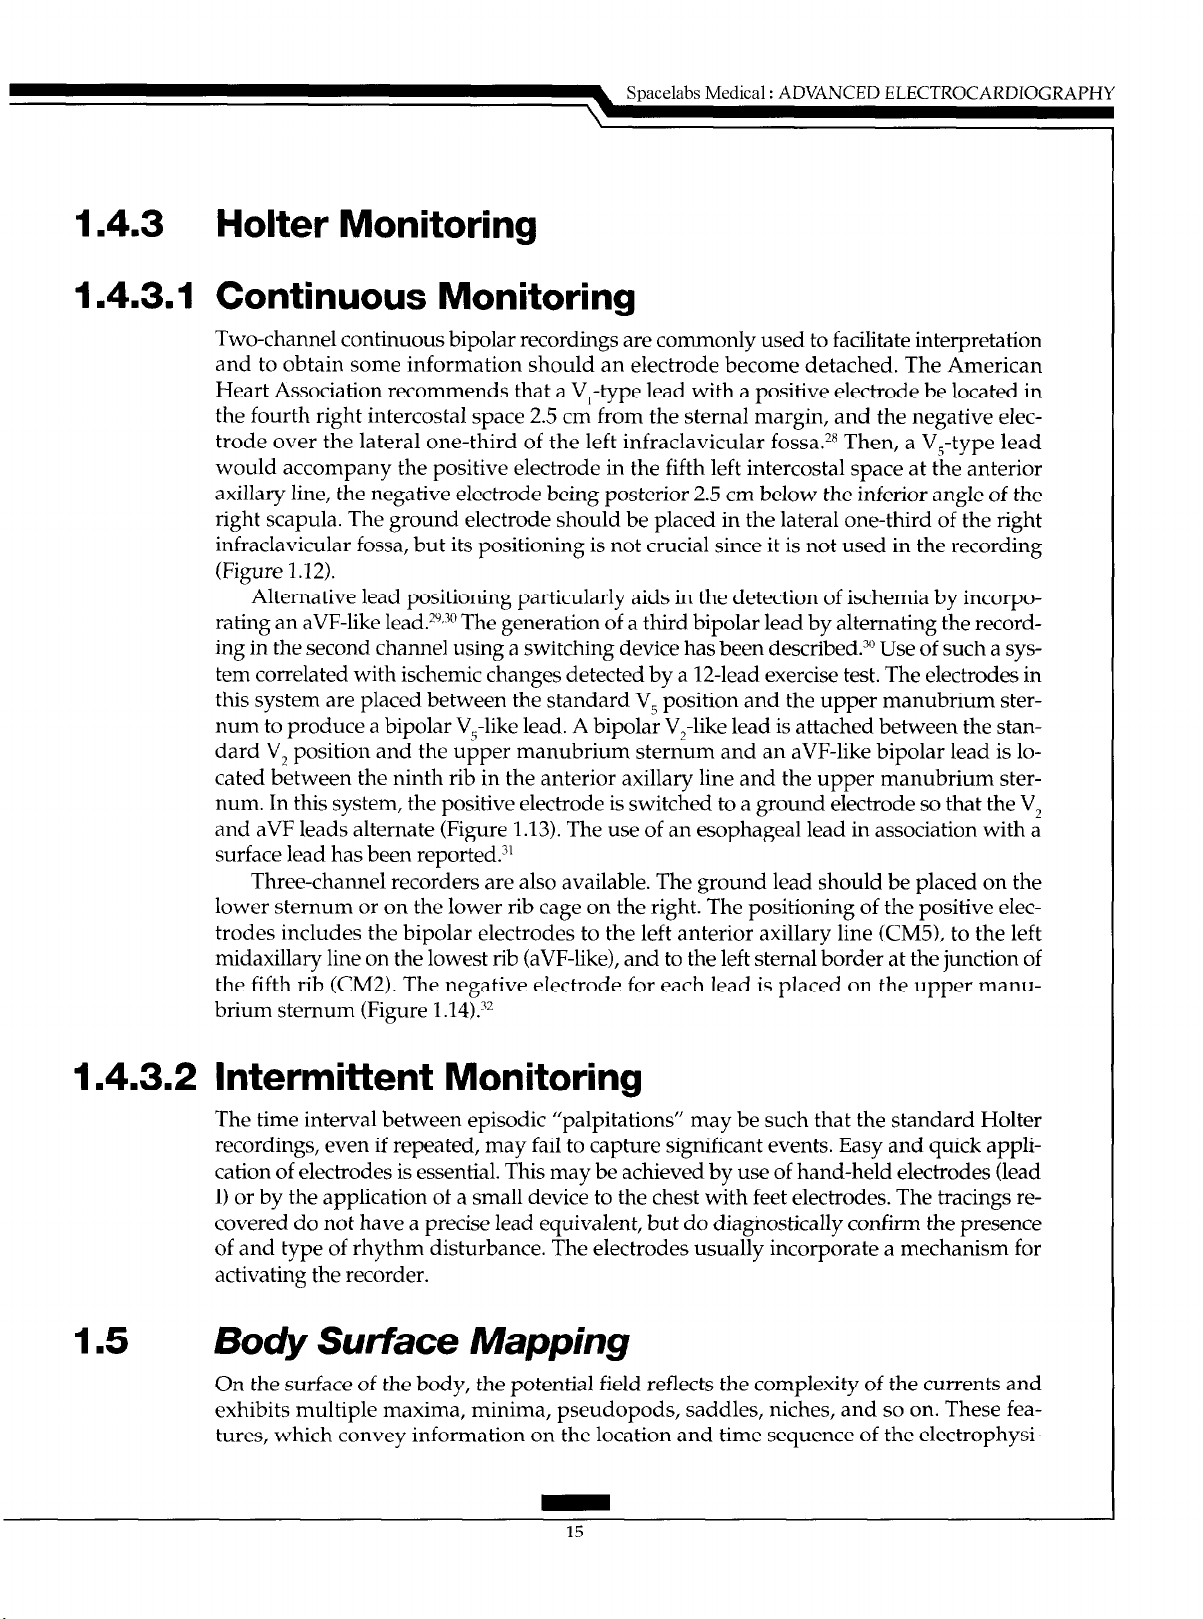
Ease of placement and reduction of motion artifact has led to the popular use of bipolar precordial recordings during exercise. Usually the positive electrode is positioned at
the V5 level, the negative electrode being in a similar position on the right of the chest
(CC5), on the manubrium (CM5), on the head (CH5), on the right arm (CR5), or the right
shoulder (CS5). The CM5 position is less sensitive than the V, or the CC5 and has a more
negative J point and a more positive slope? When a single lead is used, then V, is the
most sensitive for the detection of ischemia. However, the failure to detect ischemia with
this lead alone is not specific (Figure 1.11).2h
The use of the Frank orthogonal system has not found a significant following.‘” Thus,
body surface potential mapping is experimental at presentz7
13
Page 21
Page 22
1.4.3 Holter Monitoring
1.4.3.1 Continuous Monitoring
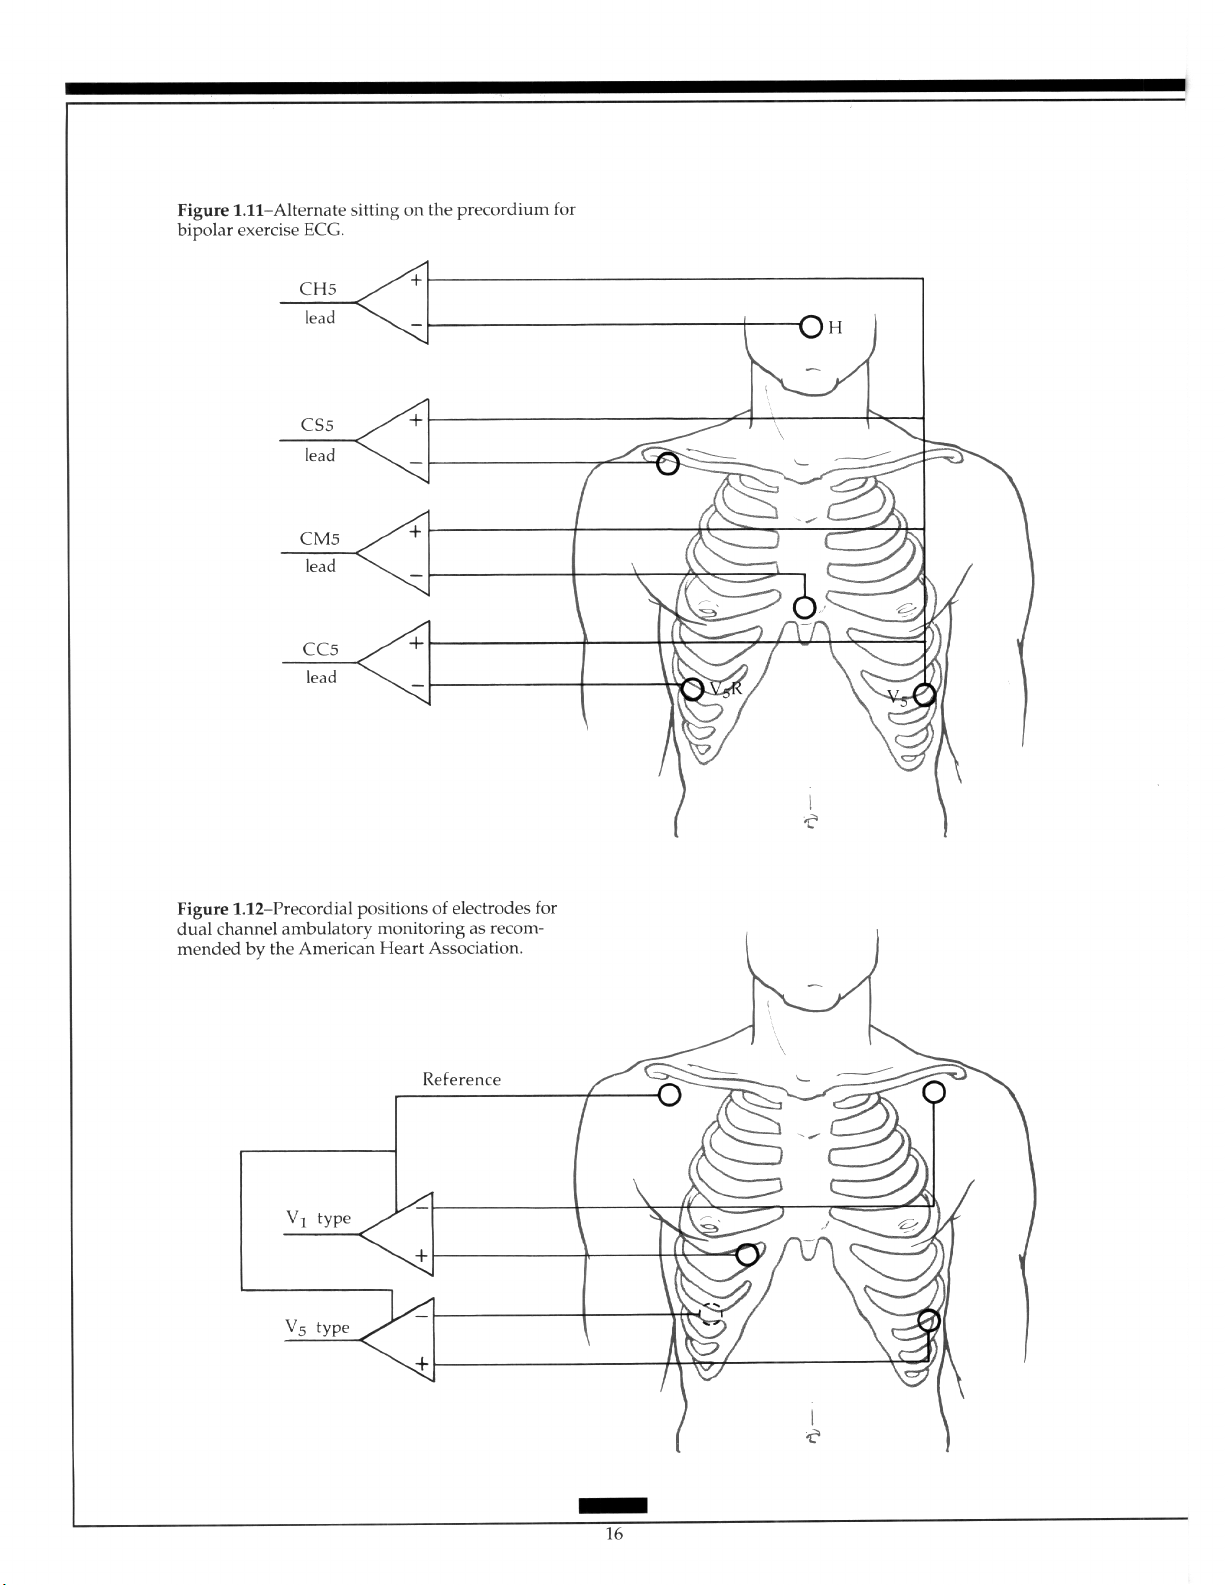
Two-channel continuous bipolar recordings are commonly used to facilitate interpretation
and to obtain some information should an electrode become detached. The American
Heart Association recommends that a V,-type lead with a positive electrode be located in
the fourth right intercostal space 2.5 cm from the sternal margin, and the negative elec-
trode over the lateral one-third of the left infraclavicular fossa.2H Then, a V,-type lead
would accompany the positive electrode in the fifth left intercostal space at the anterior
axillary line, the negative electrode being posterior 2.5 cm below the inferior angle of the
right scapula. The ground electrode should be placed in the lateral one-third of the right
infraclavicular fossa, but its positioning is not crucial since it is not used in the recording
(Figure 1.12).
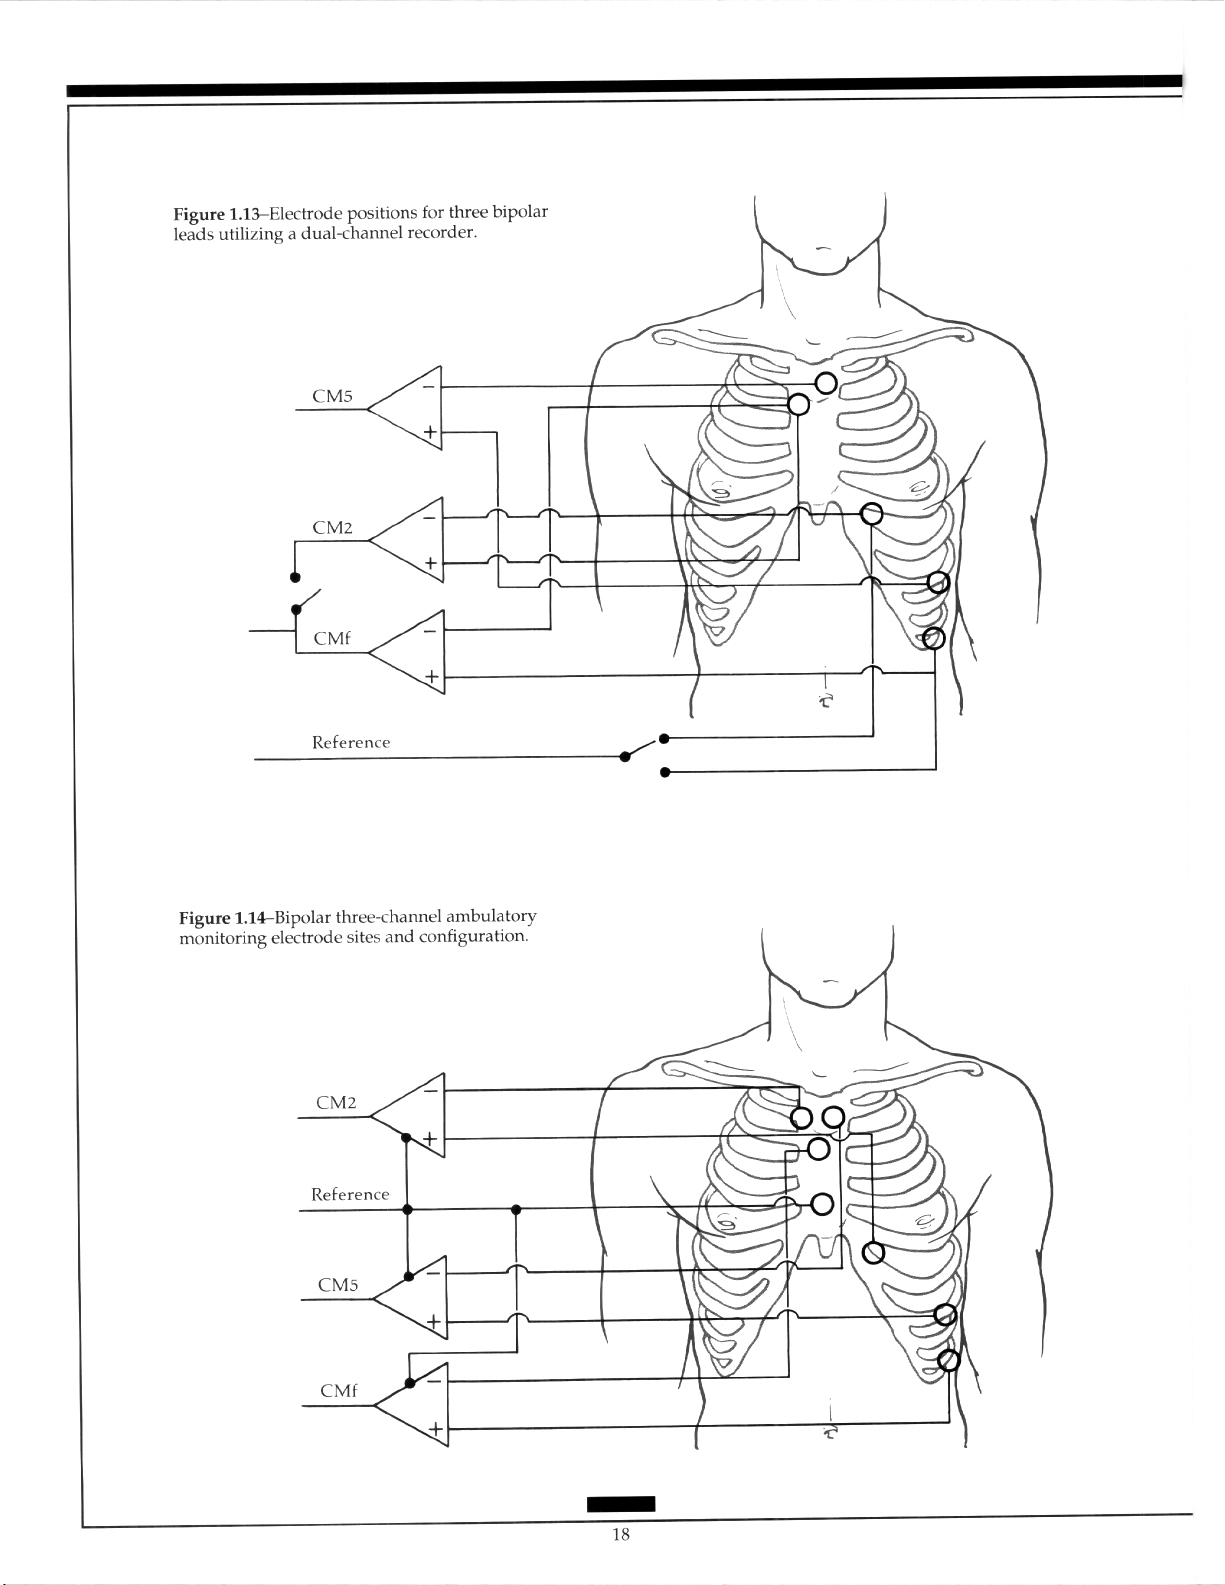
Alternative lead positioning particularly aids in the detection of ischemia by incorpo-
rating an aVF-like lead. 2y~3” The generation of a third bipolar lead by alternating the recording in the second channel using a switching device has been described.30 Use of such a sys-
tem correlated with ischemic changes detected by a 12-lead exercise test. The electrodes in
this system are placed between the standard V, position and the upper manubrium sternum to produce a bipolar V,-like lead. A bipolar V,-like lead is attached between the standard V, position and the upper manubrium sternum and an aVF-like bipolar lead is located between the ninth rib in the anterior axillary line and the upper manubrium sternum. In this system, the positive electrode is switched to a ground electrode so that the V,
and aVF leads alternate (Figure 1.13). The use of an esophageal lead in association with a
surface lead has been reported.“’
Three-channel recorders are also available. The ground lead should be placed on the
lower sternum or on the lower rib cage on the right. The positioning of the positive electrodes includes the bipolar electrodes to the left anterior axillary line (CM5), to the left
midaxillary line on the lowest rib (aVF-like), and to the left sternal border at the junction of
the fifth rib (CM2). The negative eIectrode for each lead is placed on the upper manu-
brium sternum (Figure 1.14).32
Spacelabs Medical : ADVANCED ELECTROCARDIOGRAPHY
1.4.3.2 Intermittent Monitoring
The time interval between episodic “palpitations” may be such that the standard Holter
recordings, even if repeated, may fail to capture significant events. Easy and quick application of electrodes is essential. This may be achieved by use of hand-held electrodes (lead
I) or by the application of a small device to the chest with feet electrodes. The tracings recovered do not have a precise lead equivalent, but do diagnostically confirm the presence
of and type of rhythm disturbance. The electrodes usually incorporate a mechanism for
activating the recorder.
1.5 Body Surface Mapping
On the surface of the body, the potential field reflects the complexity of the currents and
exhibits multiple maxima, minima, pseudopods, saddles, niches, and so on. These fea-
tures, which convey information on the location and time sequence of the electrophysi-
Page 23
Page 24
Spacelabs Medical : ADVANCED ELECTROCARDIOGRAPHY
1.6
1.7
ological events of the heart, are often located in areas not explored by the
trocardiographic leads.“” Body surface mapping has developed as a research tool and has
not been widely accepted as a clinical tool.
The number of recording sites on the chest varies from 12 (i.e., 4 by 3), to 242, the
distance between the electrodes being related to the number of electrodes and whether or
not recording is extended on to the posterior aspects of the chest.%35 Since such
in number and position exists, detailed features of each system must be selected on an
individual basis. The value of continued use of this technique, as shown in a recent study,
lies in the understanding gained about the relationship between pathology and the genera-
tion of the electrical signals recorded in the standard 12-lead ECG.36
12
classical elec-
variation
Magnetocamliography
The magnetic field of the heart was first detected in 1963.37 The magnetic signals are weak,
particularly since the exploring magnet is not directly applied to the surface of the heart.
The use of magnetic signals has not yet reached a clinically applicable stage.
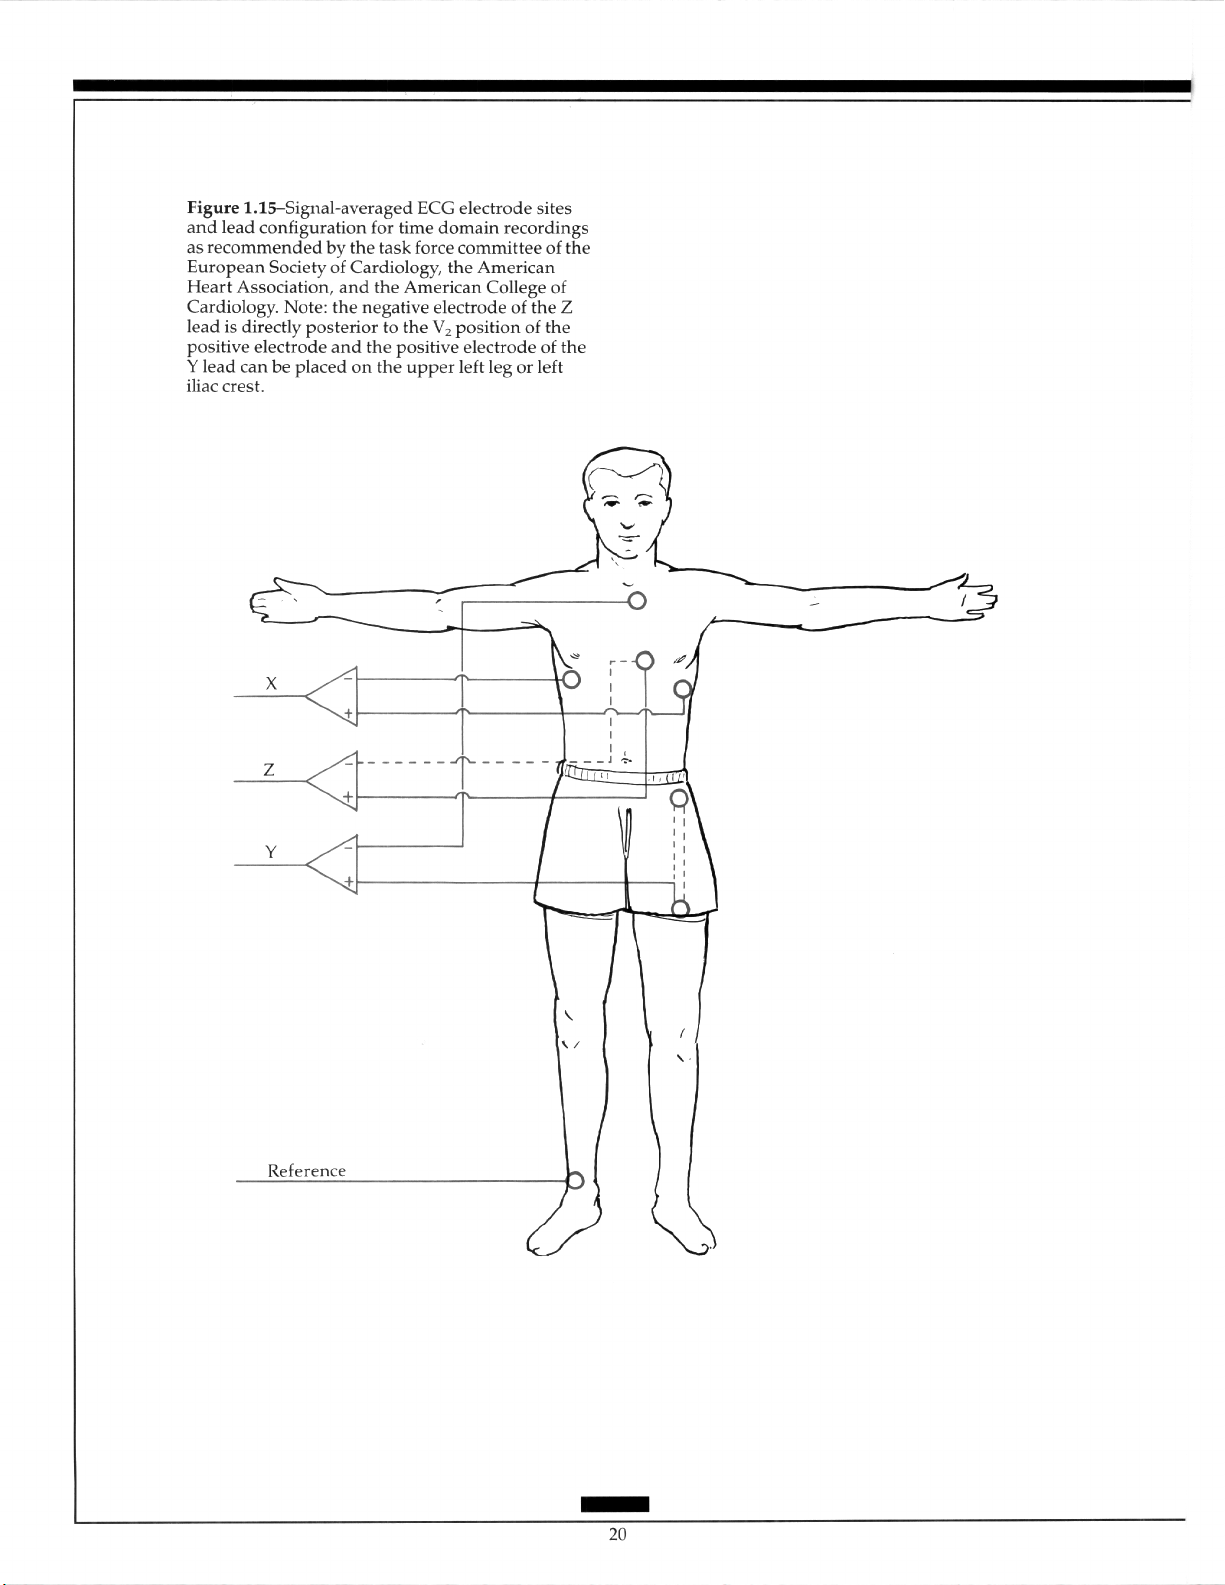
Signal-Averaged Electrocardiography
The detection of ventricular late potentials using high-resolution or signal-averaged electrocardiography has had prognostic significance for the development of ventricular
arrhythmias.“8 A modified or hybrid orthogonal lead system, which is as sensitive as body
surface mapping, is most commonly used. 39 The standard lead configuration recommended in the time domain is an XYZ system with the X-lead electrodes placed in the
fourth intercostal space in both midaxillary lines, the Y-lead electrodes on the superior aspect of the manubrium and the upper left leg or left iliac crest, and the Z-lead electrodes in
the V, position and directly posterior from V, on the left side of the vertebral column (Figure l.l5).“O Comparison with bipolar precordial leads of various types has shown a more
prolonged QR!S with the XYZ system and the detection of more abnormal measurements
with
the
bipolar precordial leads.“’
The results of high-resolution electrocardiography are lead-dependent. Accordingly,
criteria and approaches established with one lead system may not be applicable to other
systems. The Frank leads and modified uncorrected orthogonal leads have been used in
the frequency domain. Additional studies are required to determine the optimal lead system.“O
1.8
12-Lead Electrocardiogram Reconstruction
The standard 12-lead ECG remains the most commonly used for cardiac investigation because of the simplicity of the equipment required, the short amount of time needed to obtain the tracing, the amount of information recorded, and the relatively low cost of the
procedure. This does not devalue other expressions of cardiac electrical activity. These offer solutions or potential solutions to signs of disturbed pathology, particularly in relation
to time, such as exercise electrocardiography, Holter monitoring, or fixed monitoring. The
contributions that have and will be made by the more research-orientated techniques cannot be underemphasized.
17
Page 25
Page 26
Spacelabs Medical : ADVANCED ELECTROCARDIOGRAPHY
Because of the usefulness of the standard ECG, attempts have been made to recon-
struct the electrical information present in other forms of recording, The clinical applica-
tions of accurately reproducing such recordings would be of major value in exercise electrocardiography and in monitoring situations in which a potentially changing pattern of
the QRS or the ST-T wave occurs over a relatively short period of time.
The electrical activity recorded at the surface depends on the geometry and resistive
properties of the passive volume conductors between the source of the activity and the
site of recording. Considering the anatomical position of the heart as assessed by magnetic
resonance imaging, shifts of only 0.5 cm in relation to the V, lead have been shown to alter
the reconstructed ECG, the magnitude of the error relating to the activation sequence.“*
The effect of alteration of the limb lead positions on the standard ECG has been discussed
in the section on exercise testing with clear differences observed on the left arm electrode
compared with the right arm electrode and with the anterior electrode compared with lateral positioning on the left leg.?”
The problems of ECG reconstruction are of considerable magnitude. Even with slight
variations occurring in the anatomical surface relationship over time, individual variations in body contour, nonuniformity of the passive volume conductors, and the recording used for derivation may not contain all the information. Reconstruction from orthogonal XYZ leads has shown minor differences between the derived tracing and the 12-lead
ECG. The former correlates better with the clinical situation, and significant differences in
amplitude do not influence patient treatment.““fM
An example of the potential value of ECG reconstruction relates to the time-dependent changes in the ST segment seen during brief coronary occlusion. This situation
shows that changes determining the true magnitude and extent of the ST segment in the
12-lead ECG, as conventionally recorded, need to be established.32
1.9
Vectorcamliogram Reconstruction
Vectorcardiography has proved a very useful tool, particularly in the understanding of
the QRS complex. Chou, in reviewing the value of vectorcardiography, indicates that it is
more reliable than the ECG in the diagnosis of atria1 enlargement and right ventricular
hypertrophy.@ In addition, it is more sensitive than the ECG in the diagnosis of myocardial infarction, particularly inferior myocardial infarction. M,43 Using criteria developed in
association with the ECG and recorded with a three-channel recorder so that important
features of the vector QRS loop can be predicted, Warner and colleagues showed improved ability to diagnose inferior myocardial infarction.46
Reconstruction of the VCG from the standard 12-lead ECG, rather than recording both
separately, has merit in selected cases with considerable economic savings while retaining
the benefits of the information from ECG waveforms and providing additional diagnostic
data. Edenbrandt and Pahlm compared three methods of VCG reconstruction and concluded that the inverse transformation matrix of Dower to be the best method of syntheses.4i Subsequently, this method has been shown to be comparable to a regression technique.M The ability to derive additional information and the enhancement of electrocar-
diographic understanding by use of VCGs reconstructed from the standard ECG avoid
the need for additional leads. Such methods could become accepted practice in selected
cases if incorporated into current ECG systems.
Page 27
Page 28
Spacelabs Medical : ADVANCED ELECTROCARDIOGRAPHY
2.0 CARDIAC RHYTHM INTERPRETATION
The heart consists of two main types of cells: muscle cells and conduction cells. Atria1 and
ventricular muscle cells are responsible for contraction of the heart’s chambers. Specialized conduction cells function to initiate and spread the electrical impulse through the
heart. The electrical impulse generated in the conduction system stimulates the muscle
cells to contract.
Depolarization refers to the electrical excitation of the heart resulting from the flow of
ions across the membrane of cardiac cells. This wave of excitation spreads from cell to cell
through the conduction system and into the muscle cells, providing the signal for them to
contract.
Repolarization returns the heart to its electrical resting state,
across the cardiac cell membrane. Once
larization.
The refractory period is the amount of time after depolarization when the heart cannot
respond to another stimulus. Cardiac cells must repolarize before they can depolarize
again. The refractory period occurs in two phases: (1) the absolute refractory period immediately following depolarization during which the heart cannot respond to another
stimulus and (2) the relative refractory period following the absolute refractory period
during which the heart can respond to a stronger than normal stimulus but with abnormally slow conduction.
Automaticity describes the ability of certain parts of the heart to initiate an impulse
without an external stimulus, or spontaneously depolarize. Conductivity refers to propa-
gation of an impulse from cell to cell within the heart. Contractility means the ability of
cardiac muscle cells to shorten, or contract, in response to the electrical stimulus. Aberrant
conduction refers to abnormal conduction of the impulse through the ventricles.
An arrhythmia is any cardiac rhythm that is not normal sinus rhythm at a normal rate.
Arrhythmias can arise from the atria, AV node, or ventricles. Or, they can occur when
conduction of the impulse from the atria to
the
heart is repolarized it can again undergo depo-
the
ventricles becomes abnormal.
again
due to ion flow
2.1
Interpretation of Camliac Rhythm Strips
An electrocardiogram (ECG) is a graphic recording of the electrical activity produced by
depolarization and repolarization of the heart. The ECG is recorded on standard graphic
ECG paper divided into small and large boxes. The horizontal axis of ECG paper mea-
sures time and the vertical axis records voltage. The standard system uses 25 mm / set as
the dimensional unit. Each small box (lmm x lmm) on the horizontal equals 0.04 second;
one large box (consisting of five small boxes) equals 0.20 second. Vertically, each small box
equals 0. ImV, one large box (five small boxes) equals 0.5 mV. Marks in the top margin of
most ECG paper divide it into 3-second time periods.
A rhythm strip should be analyzed in an organized manner to aid in arrhythmia interpretation. The following steps are suggested:
Regularity: Determine if
to calculate heart rate. If the rhythm appears irregular, determine if the irregularity is random or patterned (that is, repetitive groups of beats separated by pauses).
the
rhythm is regular or irregular. This information is needed
Page 29
Page 30
SpaceLabs Medical: ADVANCED ELECTROCARDIOGRAPHY
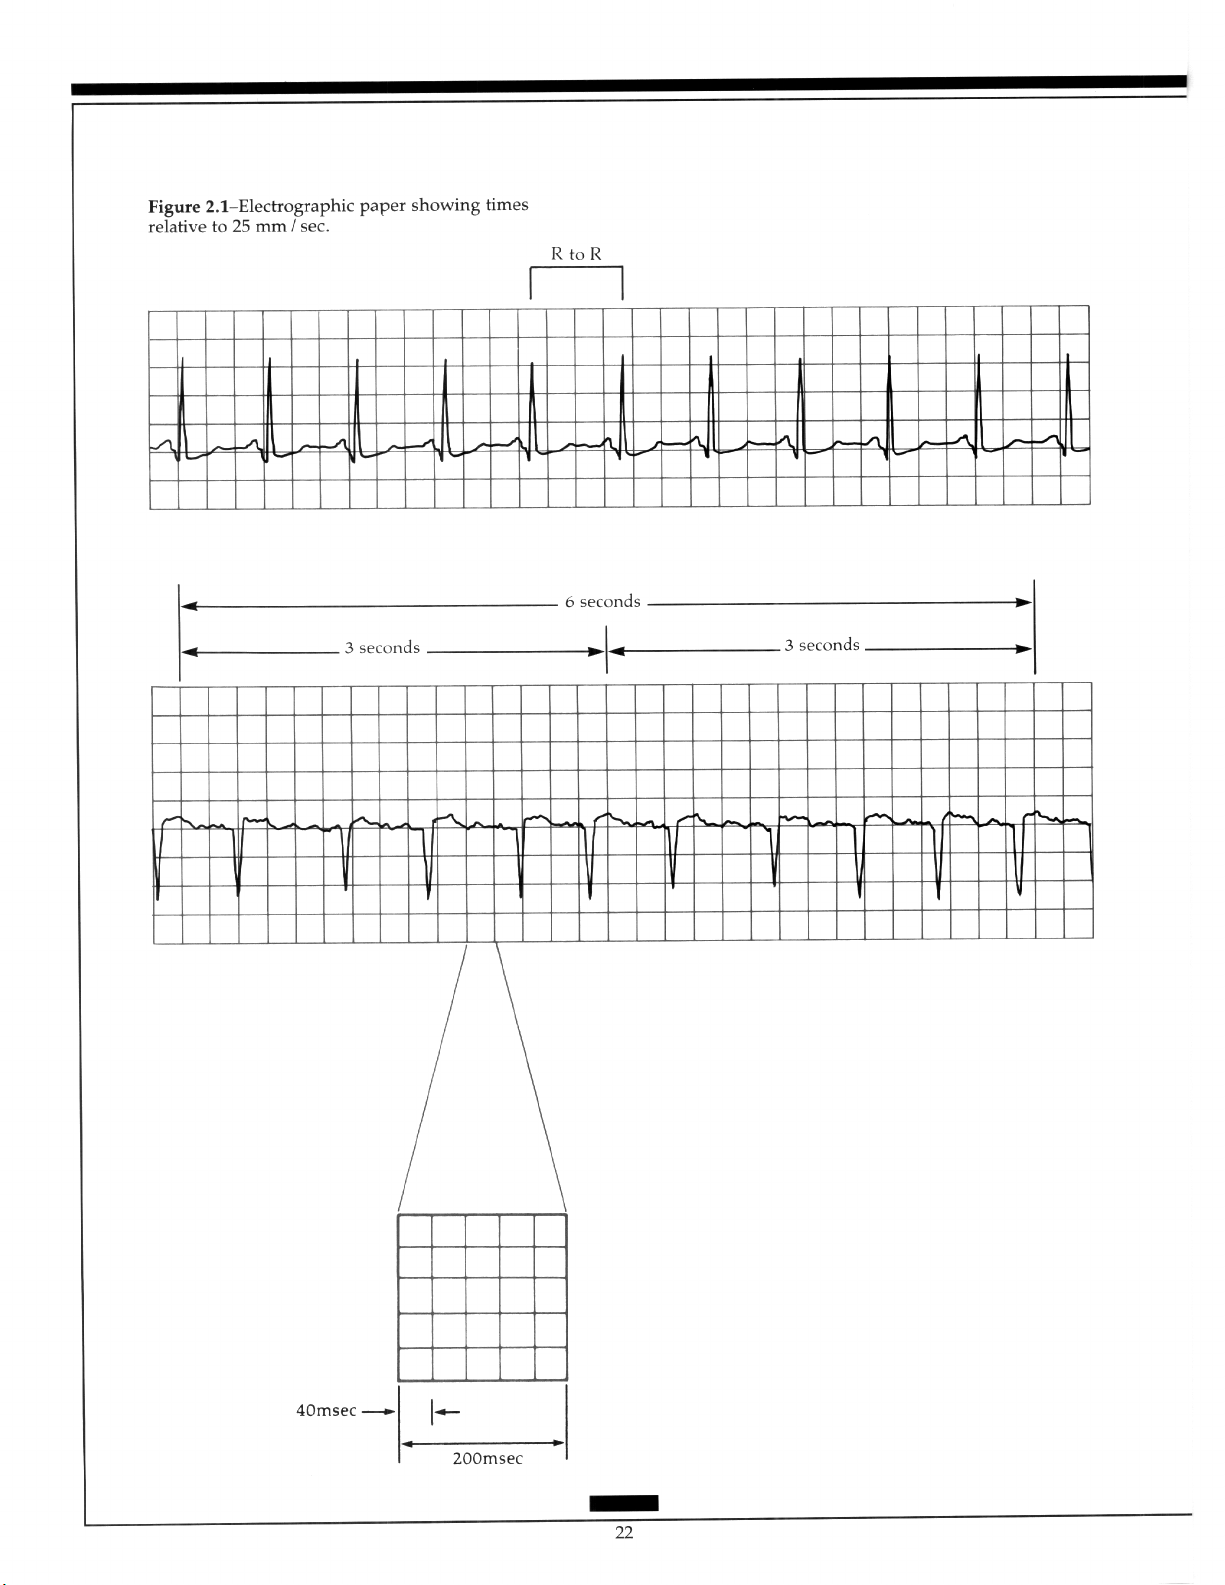
Rate: Heart rate can be obtained from the ECG strip by several methods. If the rhythm
is regular, any of the following three methods can be used (Figure 2.1). Calculate atria1 rate
in the same way, using P waves instead of R waves:
1. Count the number of small boxes between two R waves and divide that number into
1500 (since there are 1500 small boxes in a l-minute strip of ECG paper).
2. Count the number of large boxes between two R waves and divide that number into
300 (since there are 300 large boxes in a l-minute strip of ECG paper).
3. If the rhythm is regular or irregular, count the number of R-R intervals in a 6-second
strip and multiply that number by 10.
P Waves: Locate I’ waves and determine if they all look alike and if they have a consis-
tent relationship to QRS complexes (that is, one P wave before every QRS; two or more I’
waves before each QRS; or random occurrence of I’ waves relative to QRS complexes).
PR Interval: Measure the PR interval of several complexes in a row to determine if it is
of normal duration and consistent for all complexes. A normal PR interval is 0.12 to 0.20
second.
QRS Width: Measure the QRS complex and determine if it is normal or wide. A nor-
mal QRS width is 0.04 to 0.10 second.
2.2
Rhythms Originating in the Sinus Node
2.2.1 Normal Sinus Rhythm
The sinus node normally fires at a regular rate of 60 to 100 beats per minute (bpm). The
impulse spreads from the sinus node through the atria and to the AV node, where it encounters a slight delay before it travels through the bundle of His, right and left bundle
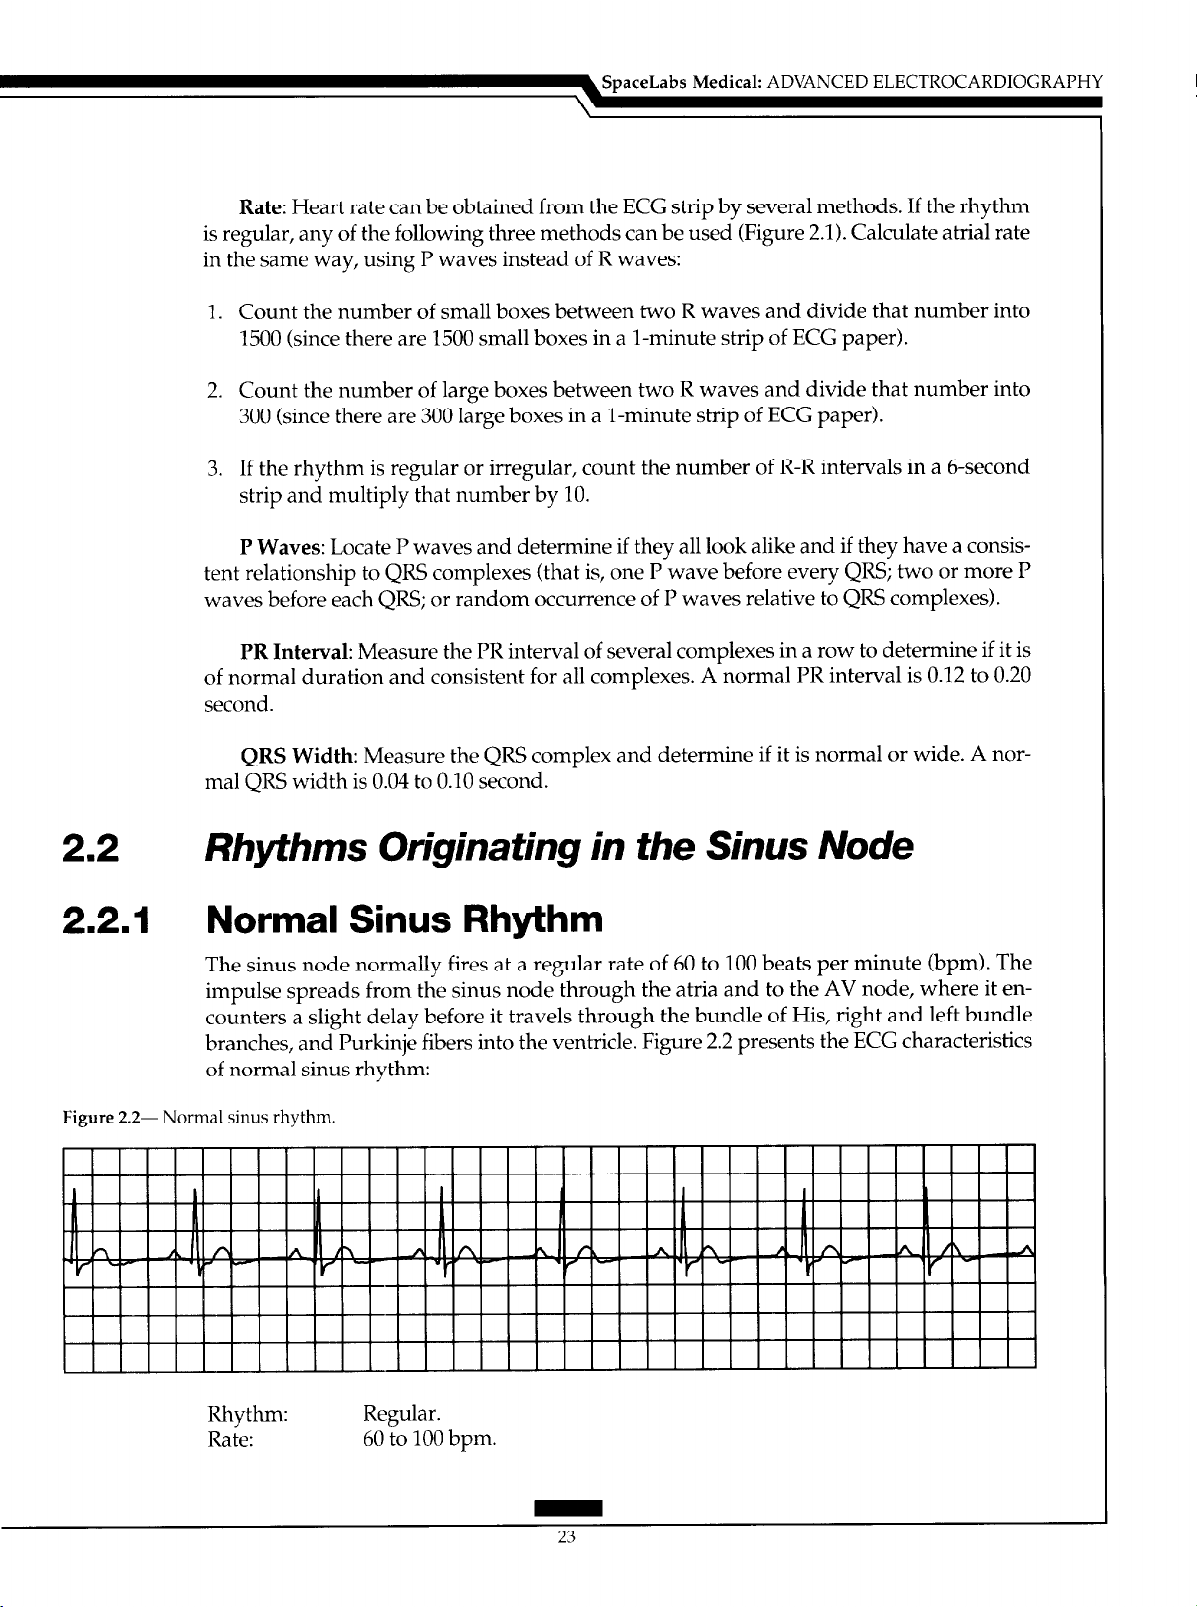
branches, and Purkinje fibers into the ventricle. Figure 2.2 presents the ECG characteristics
of normal sinus rhythm:
Figure 2.2- Normal sinus rhythm.
Rhythm: Regular.
Rate: 60 to 100 bpm.
23
Page 31
P waves: Precede every QRS complex and have a consistent shape.
PR interval: Usually normal (0.12 to 0.20 second).
QRS complex: Usually normal (0.04 to 0.10 second).
Conduction: Normal through the atria, AV node, and ventricle.
2.2.2 Sinus Bradycardia
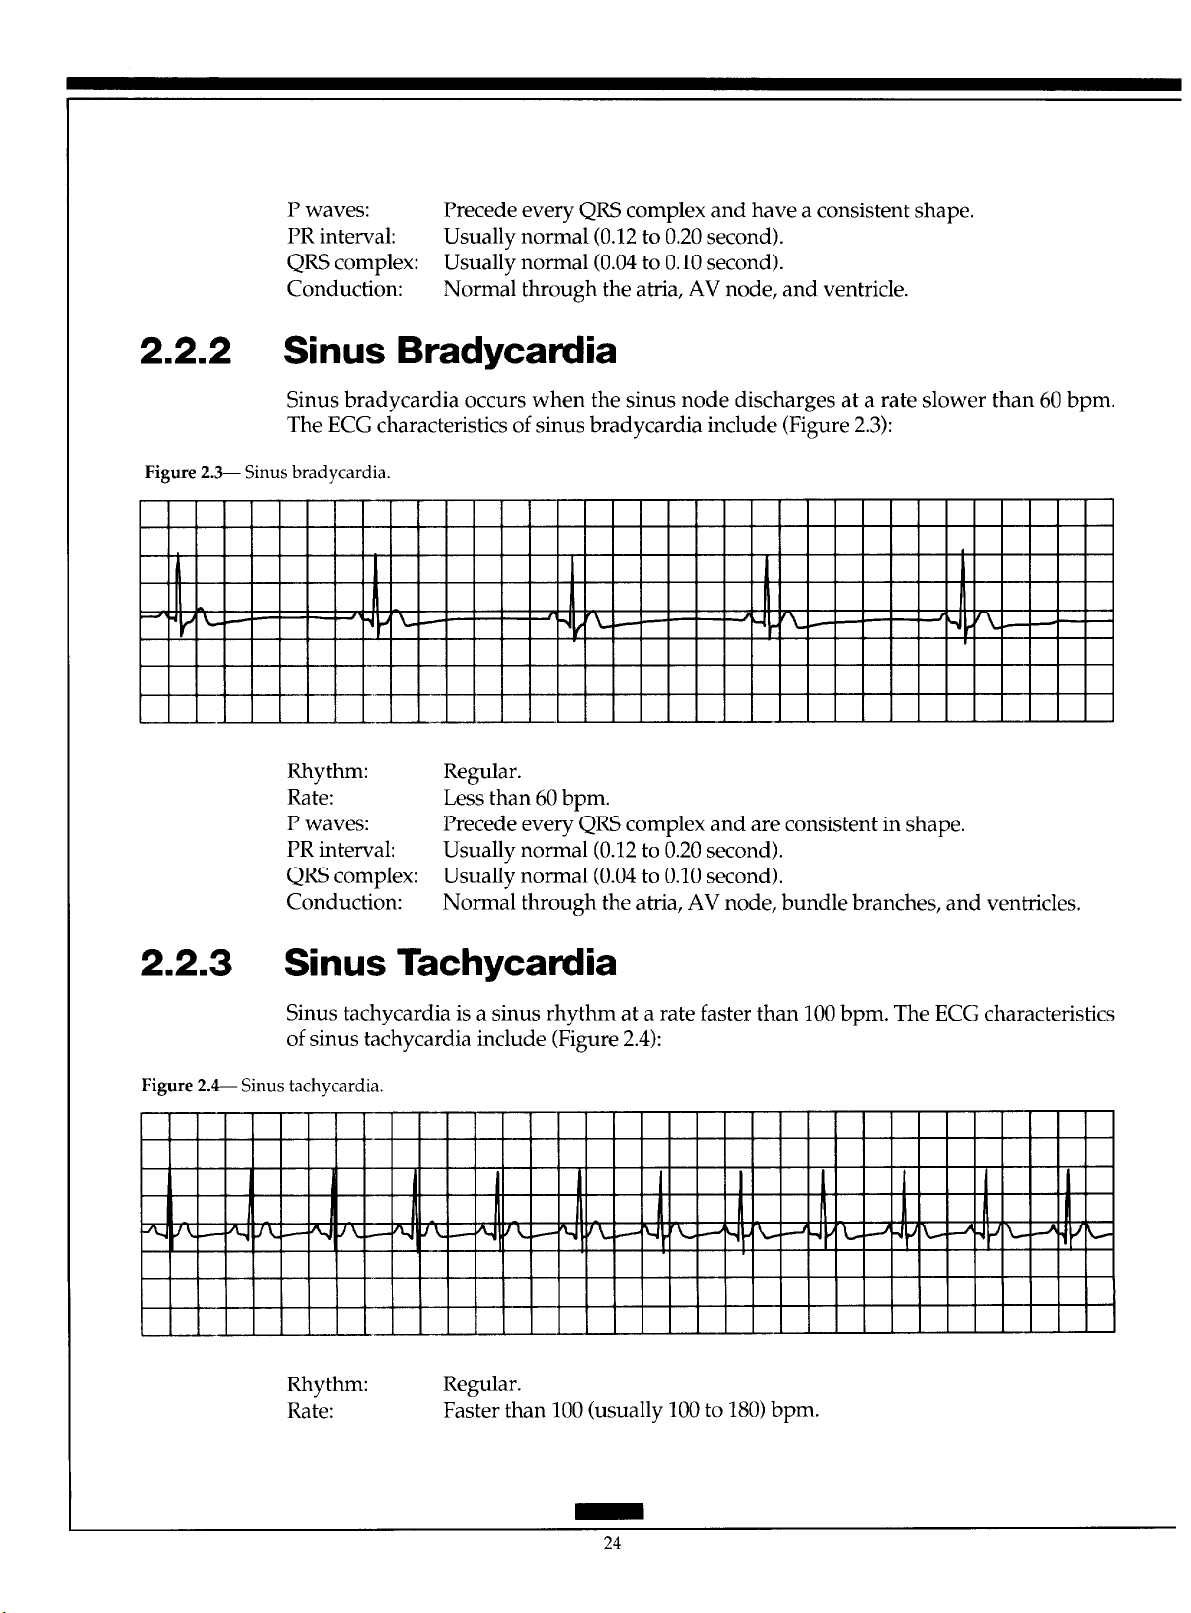
Sinus bradycardia occurs when the sinus node discharges at a rate slower than 60 bpm.
The ECG characteristics of sinus bradycardia include (Figure 2.3):
Figure 2.3- Sinus bradycardia.
llllllllllllllllllllllllllllllll~
I I I I I I I I I I I I I I I I I
I.1 I I I I I
I.1
I I
I
I I I I I
I I
I I I I I I I I I I I I I I I
Rhythm:
Rate:
P waves: Precede every QRS complex and are consistent in shape.
PR interval: Usually normal (0.12 to 0.20 second).
QRS complex: Usually normal (0.04 to 0.10 second).
Conduction:
Regular.
Less than 60 bpm.
Normal through the atria, AV node, bundle branches, and ventricles,
2.2.3 Sinus Tachycardia
Sinus tachycardia is a sinus rhythm at a rate faster than 100 bpm. The ECG characteristics
of sinus tachycardia include (Figure 2.4):
Figure 2. 4- Sinus tachycardia.
Rhythm:
Rate:
Regular.
Faster than 100 (usually 100 to 180) bpm.
24
Page 32

P waves: Precede every QRS complex and have a consistent shape, and may be
buried in the preceding T wave.
PR interval: Usually normal; may be difficult to measure if I’ waves are buried in T
waves.
QRS complex: Usually normal.
Conduction: Normal through the atria, AV node, bundle branches, and ventricles.
2.2.4 Sinus Arrhythmia
Sinus arrhythmia occurs when the sinus node discharges irregularly. Other than a phasic
increase and decrease in rate, sinus arrhythmia looks like normal sinus rhythm. The following characteristics are typical of sinus arrhythmia (Figure 2.5):
Figure 2.5-- Sinus arrhythmia.
SpaceLabs Medical: ADVANCED ELECTROCARDIOGRAPHY
Rhythm:
Rate: 60 to 100 bpm.
P waves: Precede every QRS complex and have a consistent shape.
I’R interval:
QRS complex:
Conduction:
Irregular; phasic increase and decrease in R-R interval (rate).
Usually normal.
Usually normal.
Normal through the atria, AV node, bundle branches, and ventricles.
2.2.5 Sinus Arrest
Sinus arrest occurs when sinus node automaticity is depressed and impulses do not occur
when expected. This results in the absence of a I’ wave at the time it should occur. The
QRS complex will also be missing unless a junctional or ventricular pacemaker escapes. If
only one sinus impulse fails to form, the condition is usually termed sinus pause. Sinus arrest is characterized by the following ECG changes (Figure 2.6):
25
Page 33

Figure 2.&- Sinus arrest.
2.3
Rhythm:
Rate:
P waves:
PR interval:
QRS complex
Conduction:
Irregular due to absence of sinus node discharge.
Atrial-usually within normal range but may fail into bradycardia range
if several sinus impulses fail to form; ventricular-usually within normal
range but may fall into bradycardia range if several sinus impulses fail to
form and no junctional or ventricular escape beats occur.
Present when sinus node is firing and absent during periods of sinus arrest. When present, the I’ waves precede every QRS complex and are
consistent in shape.
Usually normal when P waves are present.
Usually normal when sinus node is functioning and absent during periods of sinus arrest unless escape beats occur. If ventricular escape beats
occur, the QRS complex is wide.
Normal through the atria, AV node, bundle branches, and ventricles
when the sinus node fires. When the sinus node fails to form impulses,
there is no conduction through the atria. If a junctional escape beat occurs, ventricular conduction is usually normal. If a ventricular escape
beat occurs, conduction through the ventricles is abnormally slow.
Arrhythmias Originating in the Atria
Atria1 arrhythmias originate in the atria1 myocardium and indicate irritability in the atria.
Atria1 arrhythmias include premature atria1 complexes (PACs), wandering atria1 pacemaker (WAP), atria1 tachycardia, multifocal atria1 tachycardia (MAT), atria1 flutter, and
atria1 fibrillation.
2.3.1 Premature Atrial Complex
Premature atria1 beats occur when an irritable focus in the atria fires before the next sinus
impulse is due. The ECG characteristics of PACs include (Figure 2.7):
26
Page 34

Figure 2.7- Premature atria1 complex W’AC).
Rhythm:
Rate: Usually within normal range.
P waves: Precede every QRS complex. Configuration of the premature I’ wave dif-
PR interval: May be normal or long, depending on the prematurity of the beat. Very
QRS complex: May be normal, aberrant (wide) or absent, depending on the prematurity
Conduction: PACs travel through the atria differently from sinus impulses because
Usually regular except when PACs occur, resulting in early beats.
fers from that of the sinus I’ waves because the premature impulse originates in a different part of the atria and depolarizes them in a different
way. Very early I’ waves may be buried in the preceding T wave.
early PACs may conduct with a long PR interval.
of the beat. If the bundle branches have repolarized completely following
the previous contraction they conduct the early impulse normally, resulting in a normal QRS. If a PAC occurs before the bundle branches have
completely repolarized, the impulse may conduct aberrantly and the
QRS will be wide. If the PAC occurs very early before the bundle
branches or ventricles have repolarized, the impulse will not conduct to
the ventricles and the QRS is absent.
they originate from a different spot. Conduction through the AV node,
bundle branches, and ventricles is usually normal unless the PAC is very
early.
2.3.2 Wandering Atrial Pacemaker
WAP occurs when the site of impulse formation “wanders” from the sinus node to pacemakers in the atria or when the atria and the AV junction compete with each other for
control of the heart. The morphology of I’ waves varies because the atria depolarize differently when they are activated from different sites. WAI’s are characterized by (Figure 2.8):
27
Page 35

Figure 2.8- Wandering atria1 pacemaker.
II
I
Y m Y
Rhythm: May be slightly irregular.
Rate: 60 to 100 bpm.
P waves: Exhibit varying shapes (upright, flat, inverted, notched) as impulses
originate in different parts of the atrium or junction. At least three differ-
ent I’ waves should exist to be classified as a WAP.
PR interval: May vary depending on proximity of the pacemaker to the AV node.
QRS complex: Usually normal.
Conduction:
Conduction through the atria varies as the atria undergo depolarization
from different locations. Conduction through the bundle branches and
ventricles is usually normal.
2.3.3 Multifocal Atrial Tachycardia
MAT represents the rapid firing of several ectopic atria1 foci at a rate faster than 100 bpm.
The ECG characteristics of MAT include (Figure 2.9):
Figure 2.9- Multifocal atria1 tachycardia (MAT).
t-em-
I I I I I I II I I I II Y
Rhythm: Usually irregular.
Rate: Greater than 100 bpm.
P waves: Vary in shape because they originate in different locations in the atria. At
least three different I’ waves must exist to be classified as MAT; usually
precede each QRS complex, but some may be blocked in the AV node.
PR interval:
May vary depending on proximity of each ectopic atria1 focus to the AV
node.
QRS complex: Usually normal.
28
Page 36

SpaceLabs Medical: ADVANCED ELECTROCARDIOGRAPHY
Conduction: Usually normal through the AV node and ventricles. Aberrant ventricu-
lar conduction may occur if an impulse moves into the ventricles before
they have repolarized completely.
2.3.4 Atrial Tachycardia and Paroxysmal Atrial Tachycardia
Atria1 tachycardia is a rapid atria1 rhythm occurring at a rate of 150 to 250 bpm. When the
arrhythmia abruptly starts and terminates, the term “paroxysmal atria1 tachycardia” is
used. When the atria1 rate is rapid, the AV node may begin to block some of the impulses
attempting to travel through it to protect the ventricles from excessively rapid rates. This
results in atria1 tachycardia with AV block. The ECG characteristics of atria1 tachycardia
include (Figure 2.10):
Figure 2.1& Atria1 tachycardia.
IY I III III I I, I I” II,, .I I I, I I,, I,, I I, I I, I I,, I, I II I I II I I, I ,,I
II I III Ill I II I Ill I II I ill I II I III III I II I II I II I II I II I v-1 II I II I III I
Rhythm: Regular unless variable block occurs at the AV node.
Rate: Atria1 rate is 150 to 250 bpm.
P waves: Differ in configuration from sinus I’ waves because they originate in the
atria.
PR interval: May be shorter than normal but often difficult to measure because of hid-
den P waves.
QRS complex: Usually normal but may be wide if aberrant conduction occurs.
Conduction:
Usually normal through the AV node and into the ventricles. In atria1
tachycardia with AV block some atria1 impulses do not conduct to the
ventricles. Aberrant ventricular conduction may occur if atria1 impulses
move into the ventricles before the ventricles have completely repolarized.
2.3.5 Atrial Flutter
In atria1 flutter, the atria are depolarized at very rapid rates of 250 to 350 times per min-
utes. At such quick atria1 rates, the AV node usually blocks at least half of the impulses to
protect the ventricles from excessive rates. Atria1 flutter most often occurs at a rate of 300
bpm, and since the AV node usually blocks half of those impulses, ventricular rates of 150
bpm are quite common. Atria1 flutter is characterized by (Figure 2.11):
Page 37

Figure 2.11- Atria1 flutter
Rhythm:
Rate:
P waves:
PR interval:
QRS complex:
Conduction:
Atria1 rhythm is regular; ventricular rhythm may be regular or irregular
due to varying AV block.
Atria1 rate is 250 to 350 bpm, most commonly 300 bpm. The ventricular
rate varies depending on amount of block at the AV node, often occurs at
150 bpm with 2:l conduction and rarely 300 bpm with 1:l conduction.
Ventricular rates can fall within the normal range when atria1 flutter is
treated with appropriate drugs.
F waves (flutter waves) are seen, characterized by a very regular,
“sawtooth” complex; when 2:l conduction occurs F waves may not be
readily apparent.
May be consistent or may vary.
Usually normal; aberration can occur.
Variable conduction through the AV node, resulting in block of many of
the atria1 impulses. Conduction through the ventricles may be aberrant if
impulses reach them before they have completely repolarized.
2.3.6 Atrial Fibrillation
Atria1 fibrillation is an extremely rapid and disorganized pattern of depolarization in the
atria, with atria1 rates above 400 bpm. Atria1 fibrillation is characterized by (Figure 2.12):
Figure 2.12-Atria1 fibrillation.
Rhythm: Irregular; one of the distinguishing features of atria1 fibrillation is the
marked irregularity of the ventricular response.
Page 38

Spacelabs Medical : ADVANCED ELECTROCARDIOGRAPHY
Rate:
P waves:
PR interval:
QRS complex:
Conduction:
Atria1 rate is 400 to 600 bpm or faster. Ventricular rate varies depending
on the amount of block at the AV node. In new atria1 fibrillation, the ven-
tricular response is usually quite rapid at 160 to 200 bpm; in treated atria1
fibrillation, the controlled ventricular rate occurs in the normal range of
60 to 100 bpm.
Not present; atria1 activity is chaotic with no formed atria1 impulses visible. Irregular F waves often occur, varying in size from coarse to very
fine.
Not measurable since no P waves occur.
Usually normal; aberration is common.
Intra-atria1 conduction is disorganized and very irregular. Most of the
atria1 impulses are blocked within the AV node; impulses conducted
through the AV node usually proceed normally through the ventricles. If
an atria1 impulse reaches the bundle branch system before it has completely repolarized, aberrant intraventricular conduction can occur.
Arrhythmias Originating in the AV Junction
Cells surrounding the AV node in the AV junctional area have automaticity and can initiate impulses and control the heart’s rhythm. Junctional arrhythmias include premature
junctional complexes (PJC), junctional rhythms, and junctional tachycardia.
Junctional beats and junctional rhythms can appear in three ways on the ECG de-
pending on the location of the junctional pacemaker and the speed of conduction of the
impulse into the atria and ventricles.
When a junctional focus fires, the wave of depolarization spreads backward (retrograde) into the atria as well as forward (antegrade) into the ventricles. If the impulse arrives in the atria before it arrives in the ventricles, the ECG shows a P wave (usually inverted because the atria depolarize from bottom to top) immediately followed by a QRS
complex as the impulse reaches the ventricles. In this case, the PR interval is very short,
usually 0.10 second or less.
If the junctional impulse reaches both the atria and ventricles at the same time,
only a QRS complex is seen on the ECG because the ventricles are much larger than the
atria. Only ventricular depolarization is observed, even though the atria are also depolarized.
If the junctional impulse reaches the ventricles before it reaches the atria, the QRS
complex precedes the I’ wave on the ECG. Again, the P wave usually inverts because of
retrograde atria1 depolarization, and the RP interval (distance from the beginning of the
QRS to the beginning of the following P wave) is short.
2.41.1 Premature Junctional Complex
PJCs result from an irritable focus in the AV junction that fires before the next sinus impulse is due. The PJCs have the following ECG characteristics (Figure 2.13):
Page 39
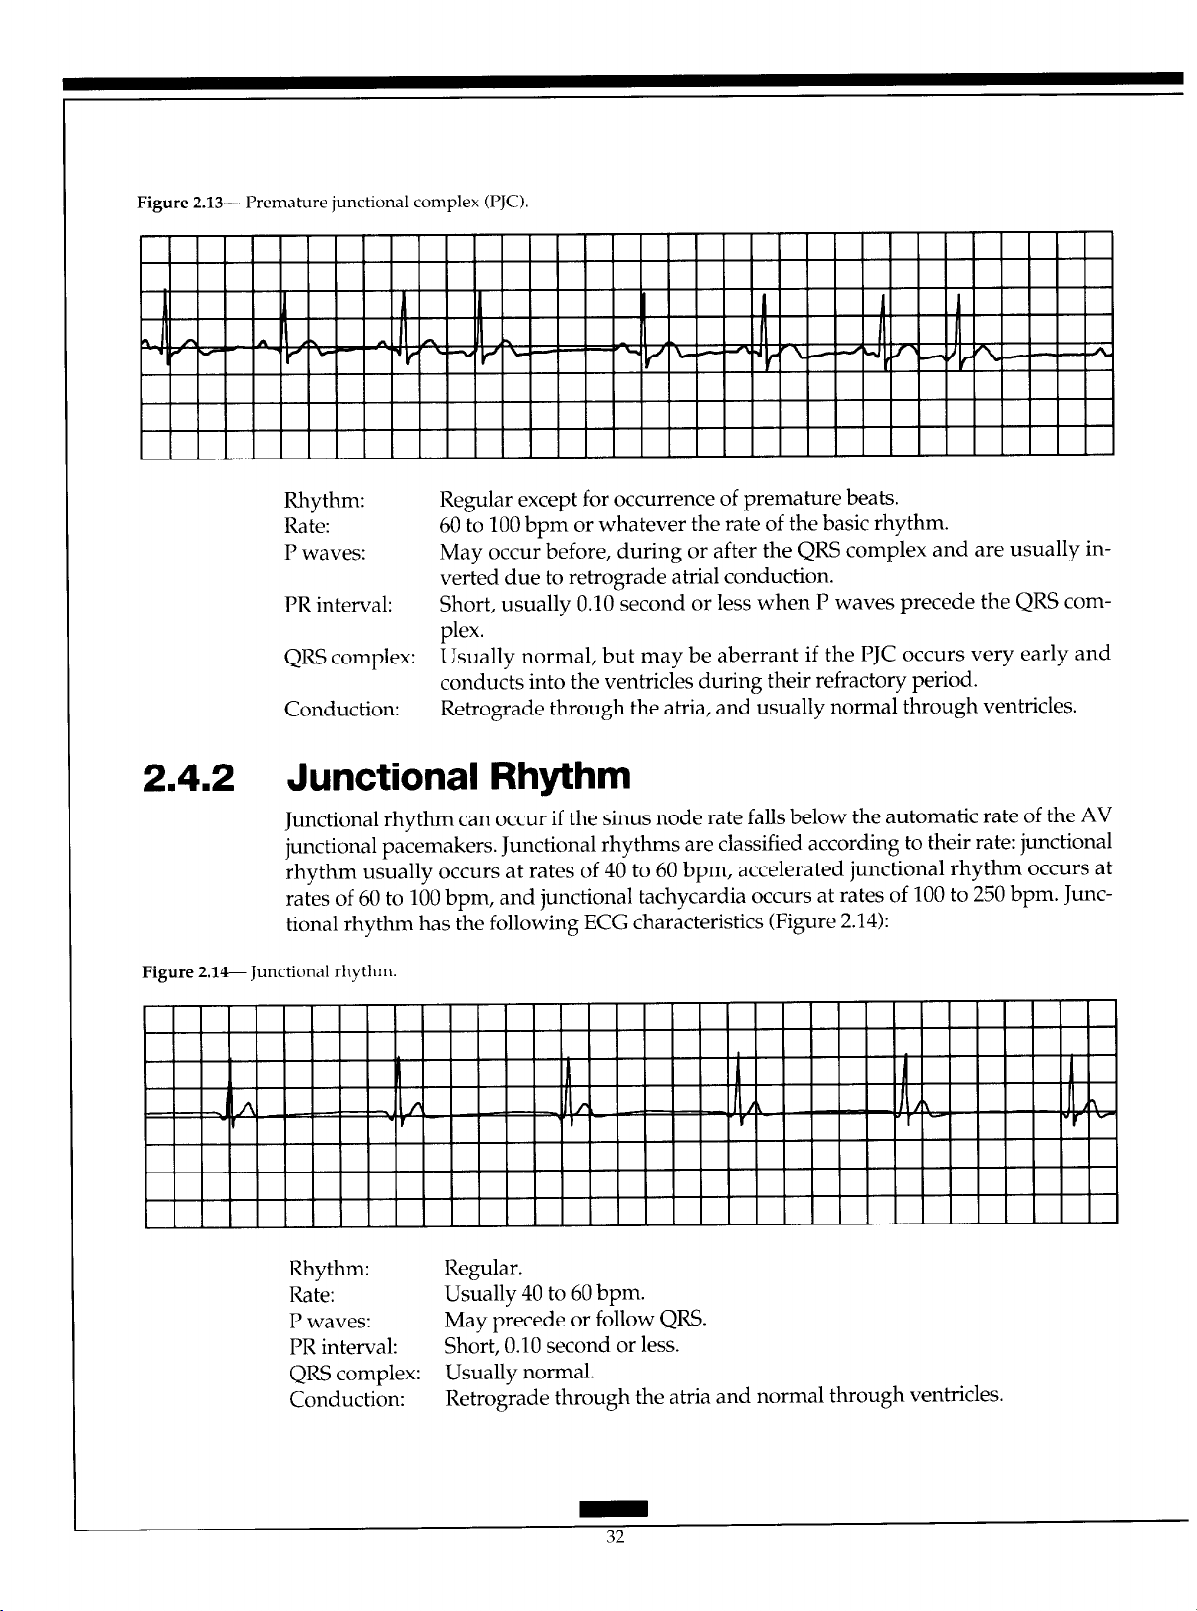
Figure 2.13- Premahue junctional complex U’JC).
Rhythm: Regular except for occurrence of premature beats.
Rate: 60 to 100 bpm or whatever the rate of the basic rhythm.
P waves: May occur before, during or after the QRS complex and are usually in-
verted due to retrograde atria1 conduction.
PR interval:
QRS complex: Usually normal, but may be aberrant if the PJC occurs very early and
Conduction: Retrograde through the atria, and usually normal through ventricles.
Short, usually 0.10 second or less when P waves precede the QRS com-
plex.
conducts into the ventricles during their refractory period.
2.4.2 Junctional Rhythm
Junctional rhythm can occur if the sinus node rate falls below the automatic rate of the AV
junctional pacemakers. Junctional rhythms are classified according to their rate: junctional
rhythm usually occurs at rates of 40 to 60 bpm, accelerated junctional rhythm occurs at
rates of 60 to 100 bpm, and junctional tachycardia occurs at rates of 100 to 250 bpm. Junc-
tional rhythm has the following ECG characteristics (Figure 2.14):
Figure 2.14-Junctional rhythm.
Rhythm: Regular.
Rate: Usually 40 to 60 bpm.
P waves:
PR interval:
QRS complex: Usually normal.
Conduction:
May precede or follow QRS.
Short, 0.10 second or less.
Retrograde through the atria and normal through ventricles.
32
Page 40

SpaceLabs Medical:
ADVANCED ELECTROCARDIOGRAPHY
2.5
2.6
Supraventricular Tachycadia
Supraventricular tachycardia (SVT) describes narrow QRS tachycardias when the exact
mechanism for the tachycardia cannot be determined from the surface ECG. SVT indicates that the rhythm originates above the bifurcation of the bundle of His (within the
atria or AV junction), and that the ventricles are depolarized via the normal His-Purkinje
system. Rhythms defined as SVT include sinus tachycardia, atria1 tachycardia, atria1 flutter, atria1 fibrillation, and junctional tachycardia. Two other arrhythmias, AV nodal re-entrant tachycardia and circus movement tachycardia utilizing an accessory pathway, are
also commonly considered SVT. It is important to distinguish SVT from ventricular
tachycardia because this has implications for acute and long-term therapy for the
arrhythmia.
Arrhythmias Originating in the Ventricles
Ventricular arrhythmias originate in the ventricular muscle or Purkinje system. These are
considered more dangerous than other arrhythmias because of their potential to severely
limit cardiac output. Ventricular arrhythmias include WCs, accelerated ventricular
rhythm, ventricular tachycardia, ventricular flutter, ventricular fibrillation, and ventricular asystole.
2.6.1 Premature Ventricular Complex
WCs occur when an irritable focus in the ventricles fires before the next sinus impulse is
due. The WCs themselves are not harmful but may indicate increasing ventricular irrita-
bility, which can lead to more serious ventricular arrhythmias. The WCs have the follow-
ing ECG characteristics (Figure 2.15):
Figure 2.1% Premature ventricular complex (PVC).
Page 41
Rhythm:
Rate:
P waves:
PR interval:
QRS complex:
Conduction:
Irregular because of the early beats.
60 to 100 bpm or the rate of the basic rhythm.
Not related to the PVCs; sinus rhythm is usually not interrupted, so sinus
P waves can occur regularly throughout the rhythm. The P waves may
occasionally follow PVCs due to retrograde conduction from the ven-
tricle back through the atria; these P waves appear inverted on the ECG.
Not present before most PVCs. If a P wave happens by coincidence to
precede a PVC, the PR interval is short.
Wide and bizarre; greater than 0.10 second in duration; may vary in morphology if it originates from more than one focus in the ventricles (multi-
focal) and/or takes a different propagation pathway (multiform).
Impulses originating in the ventricles conduct through the ventricles
from muscle cell to muscle cell rather than through Purkinje fibers, re-
sulting in wide QRS complexes. Some PVCs may conduct retrograde
inl:o the atria, resulting in inverted I’ waves following the PVC. When the
sinus rhythm is undisturbed by PVCs, the atria depolarize normally.
2.6.2 Ventricular Tachycardia
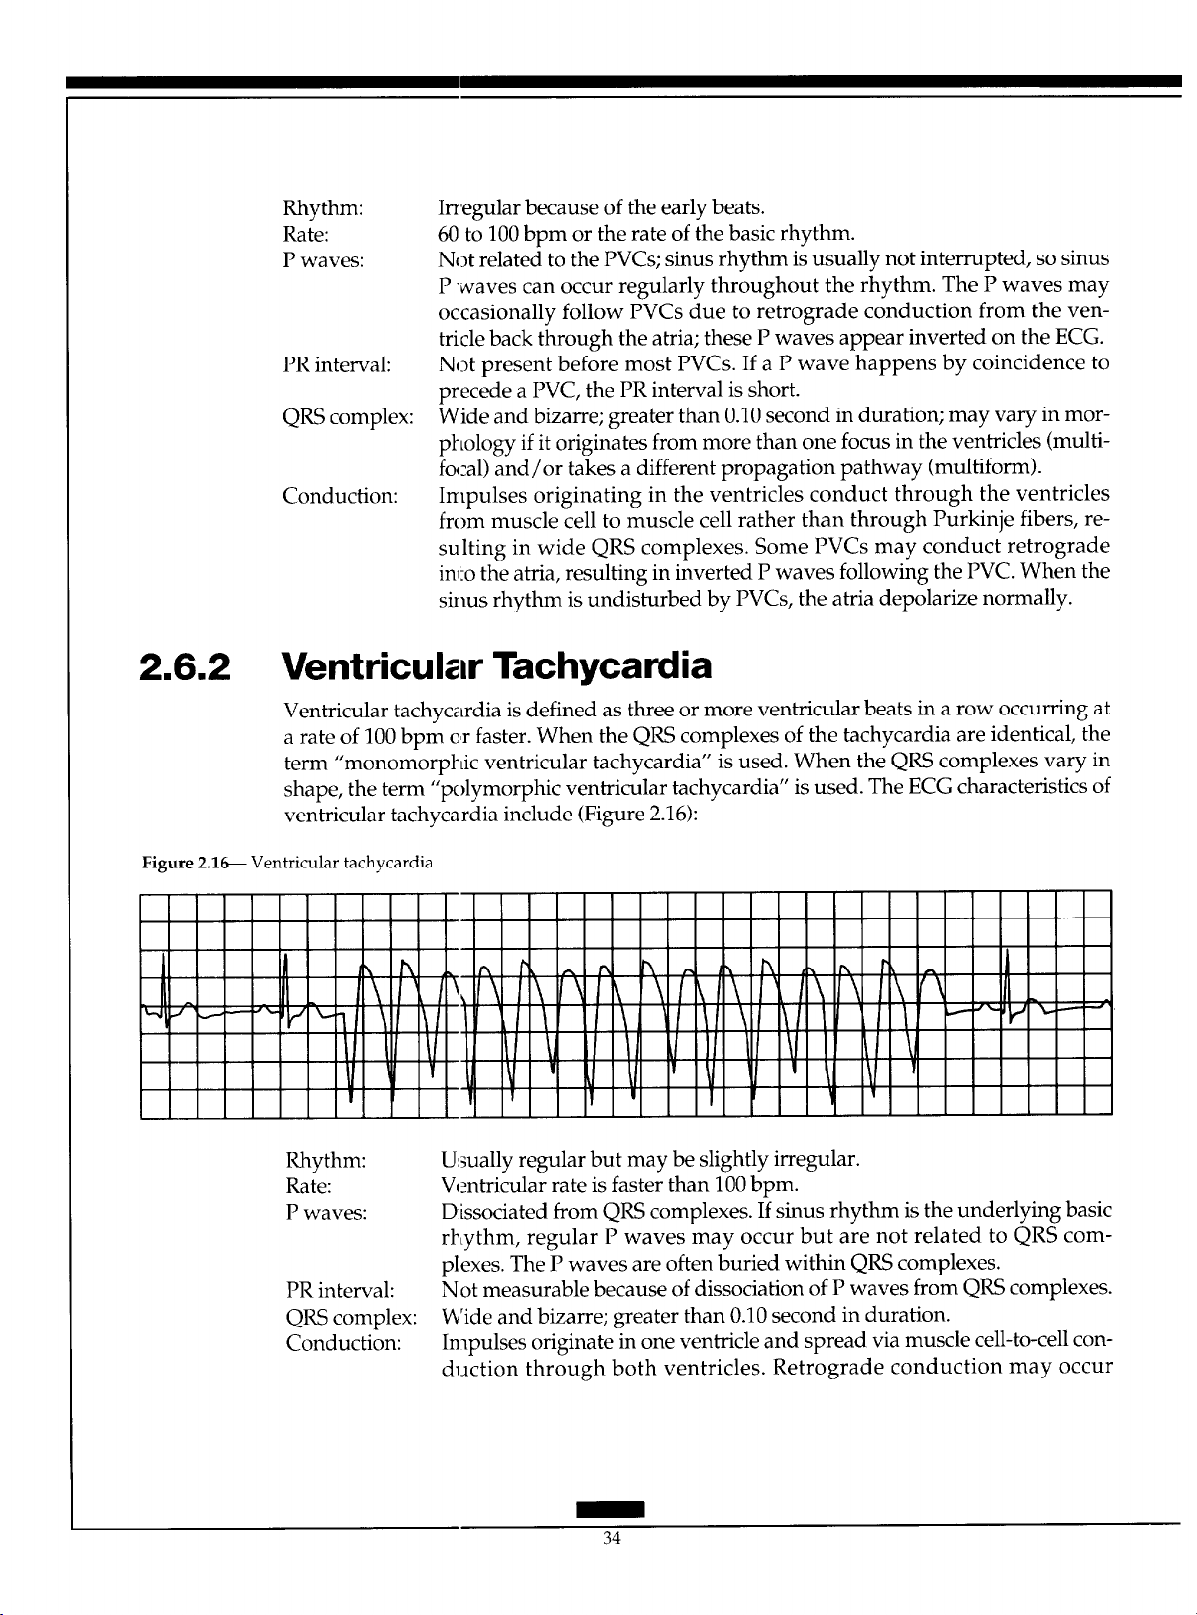
Ventricular tachycardia is defined as three or more ventricular beats in a row occurring at
a rate of 100 bpm c’r faster. When the QRS complexes of the tachycardia are identical, the
term “monomorphic ventricular tachycardia” is used. When the QRS complexes vary in
ventricular tachycardia include (Figure 2.16):
’ shape, the term “polymorphic ventricular tachycardla ” is used. The ECG characteristics of
Figure 2.16 Ventricular tachycardia.
Rhythm: U:sually regular but may be slightly irregular.
Rate: Ventricular rate is faster than 100 bpm.
P waves: Dissociated from QRS complexes. If sinus rhythm is the underlying basic
PR interval: Not measurable because of dissociation of P waves from QRS complexes.
QRS complex: b’ide and bizarre; greater than 0.10 second in duration.
Conduction: Impulses originate in one ventricle and spread via muscle cell-to-cell con-
rhythm, regular P waves may occur but are not related to QRS com-
plexes. The P waves are often buried within QRS complexes.
duction through both ventricles. Retrograde conduction may occur
Page 42
through the atria, but more often the sinus mode continues to fire regularly and depolarize the atria normally. Rarely, one of these sinus impulses may conduct normally through the AV node and into the ventricle
before the next ectopic ventricular impulse fires, resulting in a normal
QRS complex called a “capture beat”. Occasionally, a “fusion beat” may
occur as the ventricles depolarize via a descending sinus impulse and the
ventricular ectopic impulse simultaneously, resulting in a QRS complex
that appears different from both the normal beats and the ventricular
beats.
2.6i.3 Ventricular Fibrillation
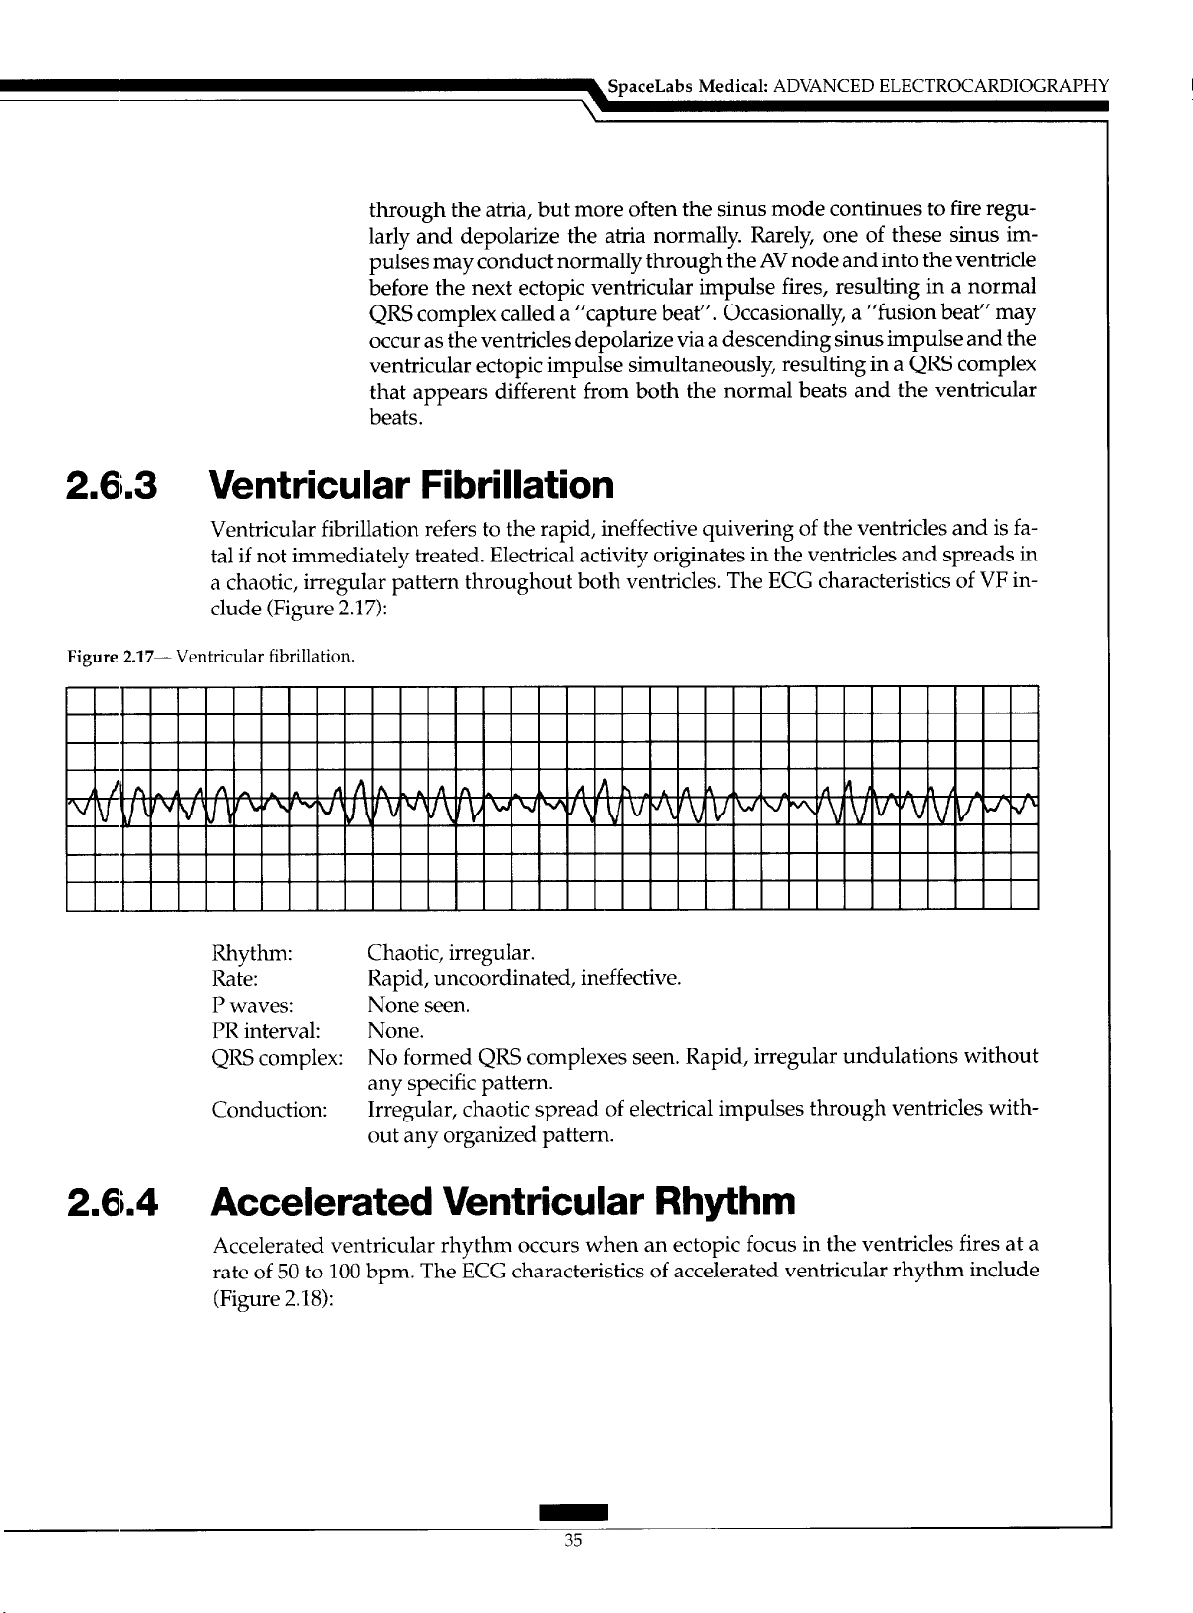
Ventricular fibrillation refers to the rapid, ineffective quivering of the ventricles and is fatal if not immediately treated. Electrical activity originates in the ventricles and spreads in
a chaotic, irregular pattern throughout both ventricles. The ECG characteristics of VF include (Figure 2.17):
Figure 2.17- Ventricular fibrillation.
SpaceLabs Medical: ADVANCED ELECTROCARDIOGRAPHY
I I I
Rhythm: Chaotic, irregular.
Rate: Rapid, uncoordinated, ineffective.
P waves: None seen.
PR interval: None.
QRS complex: No formed QRS complexes seen. Rapid, irregular undulations without
any specific pattern.
Conduction: Irregular, chaotic spread of electrical impulses through ventricles with-
out any organized pattern.
I I I I I I I I I I I I I I I I I I I I
2.6.4 Accelerated Ventricular Rhythm
Accelerated ventricular rhythm occurs when an ectopic focus in the ventricles fires at a
rate of 50 to 100 bpm. The ECG characteristics of accelerated ventricular rhythm include
(Figure 2.18):
Page 43
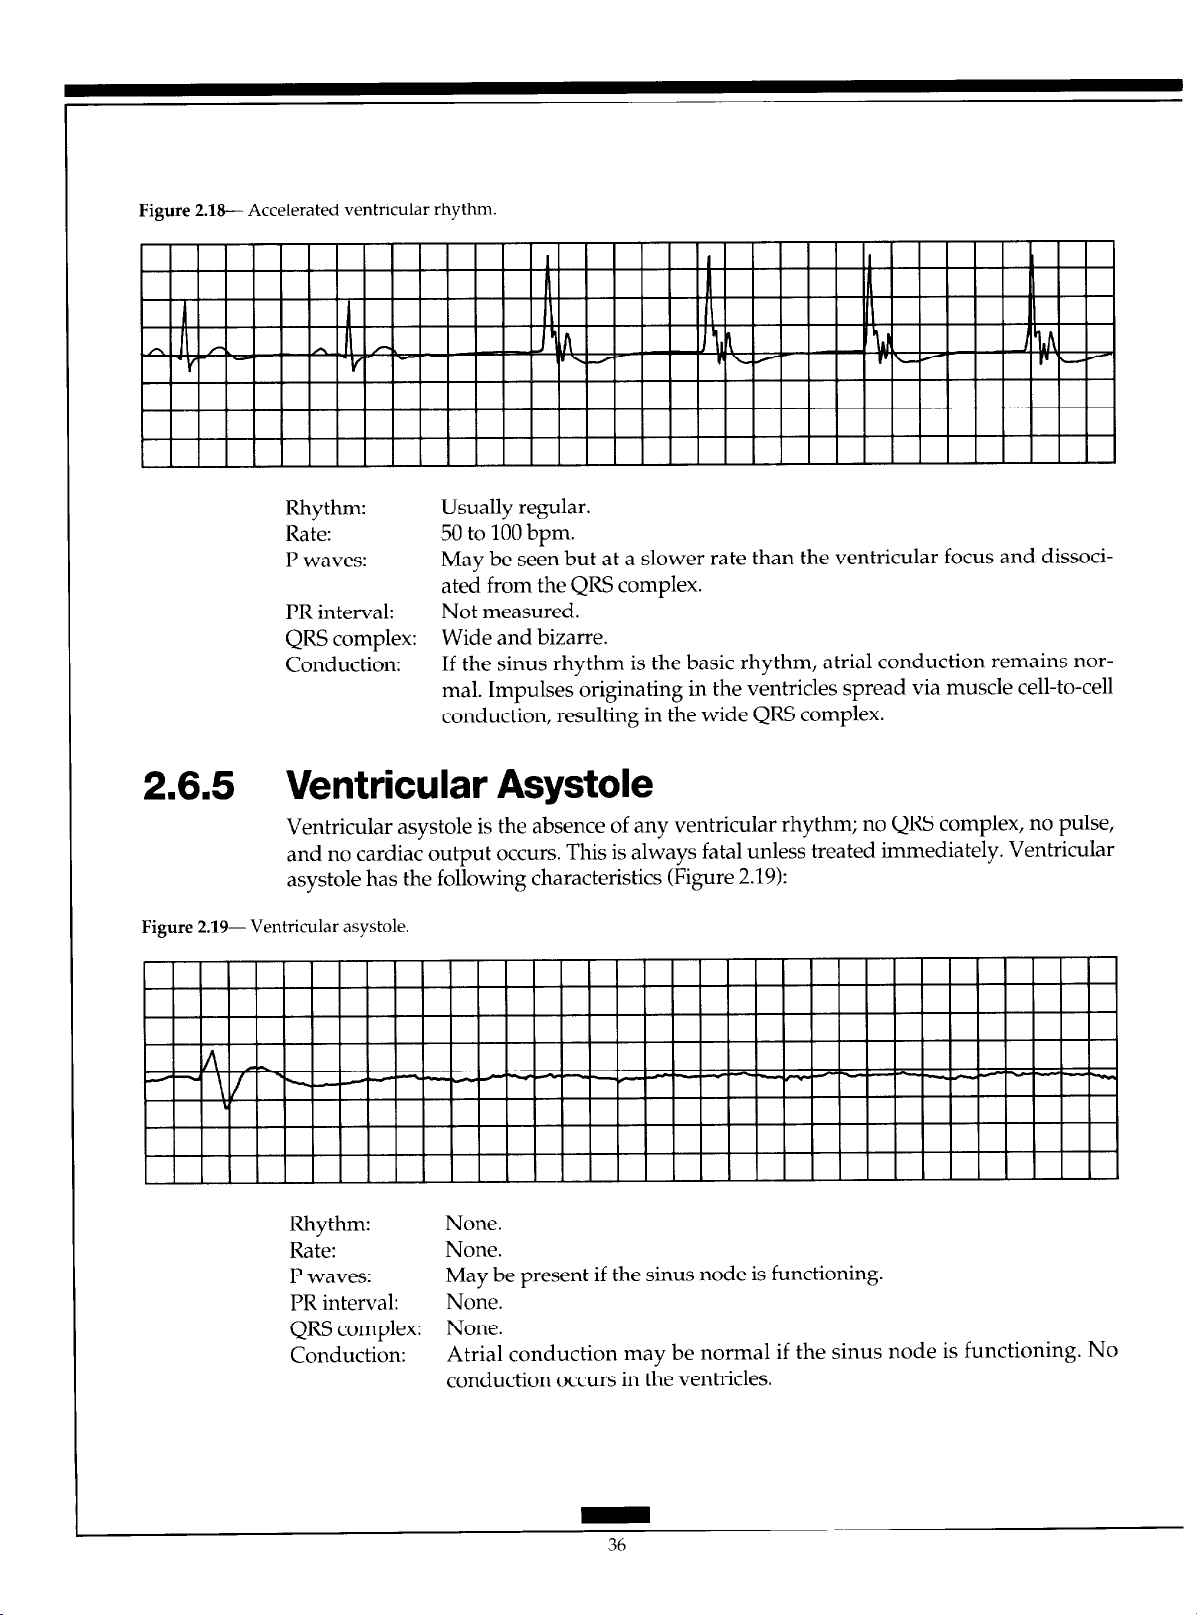
Figure 2.18-- Accelerated ventricular rhythm.
Rhythm: Usually regular.
Rate: 50 to 100 bpm.
P waves: May be seen but at a slower rate than the ventricular focus and dissoci-
ated from the QRS complex.
PR interval: Not measured.
QRS complex: Wide and bizarre.
Conduction: If the sinus rhythm is the basic rhythm, atria1 conduction remains nor-
mal. Impulses originating in the ventricles spread via muscle cell-to-cell
conduction, resulting in the wide QRS complex.
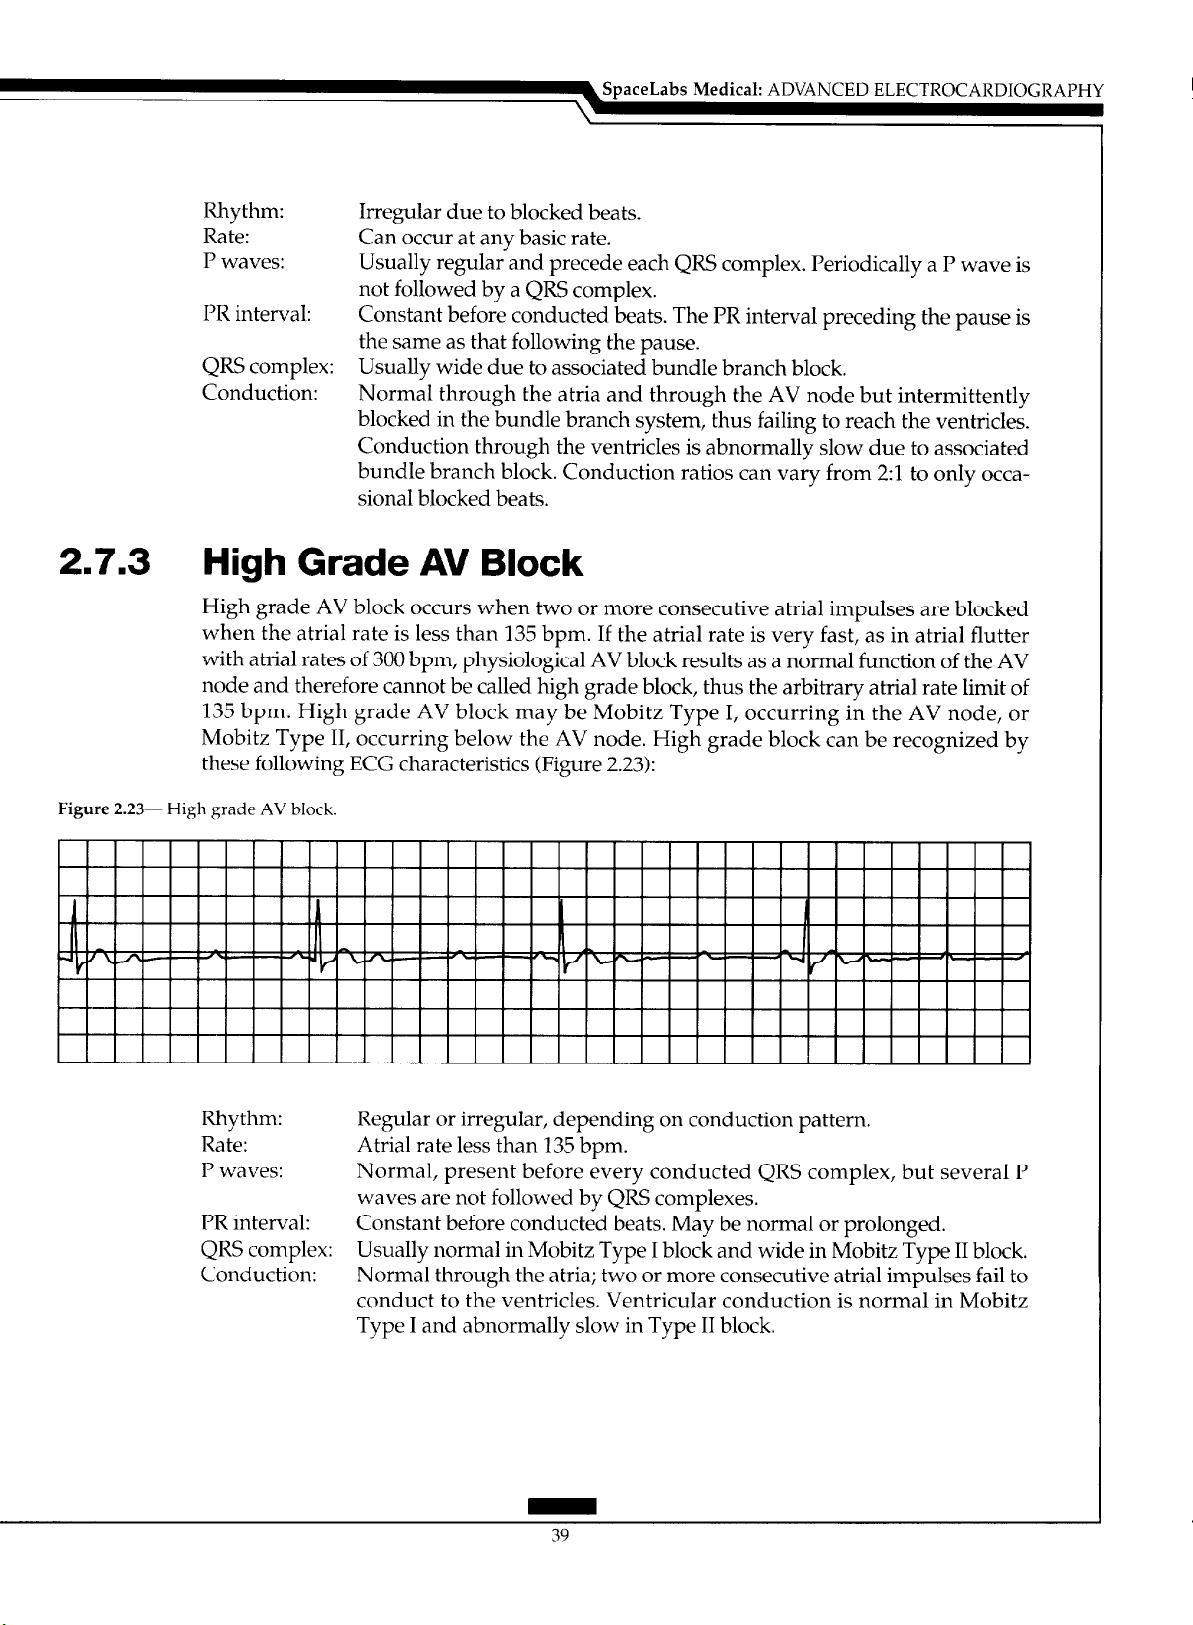
2.6.5 Ventricular Asystole
Ventricular asystole is the absence of any ventricular rhythm; no QRS complex, no pulse,
and no cardiac output occurs. This is always fatal unless treated immediately. Ventricular
asystole has the following characteristics (Figure 2.19):
Figure 2.19- Ventricular asystole.
Rhythm: None.
Rate: None.
P waves: May be present if the sinus node is functioning.
PR interval: None.
QRS complex: None.
Conduction:
Atria1 conduction may be normal if the sinus node is functioning. No
conduction occurs in the ventricles.
36
Page 44

2.7 AV Blocks
The term “AV block” describes arrhythmias in which delayed or failed conduction of
supraventricular impulses :into the ventricles occurs. AV blocks are classified according to
the location of the block and to the severity of the conduction abnormality.
2.7.1 First-Degree AV Block
First-degree AV block is defined as prolonged AV conduction time of supraventricular
impulses into the ventricles. This delay usually occurs within the AV node, and all impulses conduct to the ventricles, but with delayed conduction times (longer PR intervals).
First-degree AV block can be recognized by the following ECG characteristics (Figure
2.201:
Figure 2.2& First-degree AV block.
SpaceLabs Medical: ADVANCED ELECTROCARDIOGRAPHY
Rhythm: Regular.
Rate:
P waves: Normal, precede every QRS complex.
PR interval: Prolonged above 0.20 second.
QRS complex: Usually normal.
Conduction:
Can occur at any sinus rate, usually 60 to 100 bpm.
Normal through the atria, delayed through the AV node, and normal
through the ventricles.
2.7.2 Second-Degree AV Block
Second-degree AV block occurs when one atria1 impulse at a time fails to be conducted to
the ventricles. Second-degree AV block falls into two distinct categories: Mobitz Type I
block, usually occurring in the AV node, and Mobitz Type II block, occurring below the
AV node in the bundle of His or the bundle branch system.
2.7.2,1 Mobitz Type I Second-Degree AV Block
(Wenckebach)
Mobitz Type I second-degree AV block, often referred to as Wenckebach, is a progressive
increase in conduction times of consecutive atria1 impulses into the ventricles until one impulse fails to conduct, or is “dropped”. This appears on the ECG as the gradual lengthening of PR intervals until one I’ wave fails to conduct and is not followed by a QRS complex, resulting in a pause after which the cycle repeats itself. Mobitz Type I second-degree
AV block has the following ECG characteristics (Figure 2.21):
Page 45

Figure 2.21- Mobitz Type I second-degree AV block (also called Wenckebach).
lllllllllllllllllllllllr lllllllll
Rhythm: Irregular; overall appearance of the rhythm demonstrates “group beat-
ing” (groups of beats separated by pauses).
Rate:
P waves: Normal; some I’ waves are not conducted to the ventricles, but only one
PR interval: Gradually lengthens in consecutive beats. The PR interval preceding the
QRS complex: Usually normal unless an associated bundle branch block occurs.
Conduction:
Can occur at any sinus or atria1 rate.
at a time fails to conduct.
pause is longer than that following the pause.
Normal through the atria, but progressively delayed through the AV
node until an impulse fails to conduct. Ventricular conduction is normal.
Conduction ratios can vary, with ratios as low as 2:l (every other I’ wave
is blocked) up to high ratios such as 15:l (every 15th I’ wave is blocked).
2.7.2.2 Mobitz Type II Second-Degree AV Block
Mobitz Type II second-degree AV block is the sudden failure of conduction of an atria1
impulse to the ventricles without progressive increases in conduction time of consecutive
P waves. Mobitz Type II block occurs below the AV node and is usually associated with
bundle branch block; therefore, the dropped beats are usually a manifestation of bilateral
bundle branch block. This form of block appears on the ECG much the same as Mobitz
Type I block except that no progressive increase in PR intervals occurs before the blocked
beats. Mobitz Type II block is less common, but more serious, than Mobitz Type I block.
Mobitz Type II second degree AV block has the following ECG characteristics (Figure
2.22):
Figure 2.22- Mobitz Type II second-degree AV block.
11111111111111 I I I
11 I
* II
/- -‘-
LJ LJ
I I I I I I I I I I I I I I
I ll l l l
-1
I I
Page 46
Rhythm: Irregular due to blocked beats.
Rate: Can occur at any basic rate.
P waves: Usually regular and precede each QRS complex. Periodically a P wave is
not followed by a QRS complex.
PR interval: Constant before conducted beats. The PR interval preceding the pause is
the same as that following the pause.
QRS complex: Usually wide due to associated bundle branch block.
Conduction: Normal through the atria and through the AV node but intermittently
blocked in the bundle branch system, thus failing to reach the ventricles.
Conduction through the ventricles is abnormally slow due to associated
bundle branch block. Conduction ratios can vary from 2:l to only occa-
sional blocked beats.
2.7.3 High Grade AV Block
High grade AV block occurs when two or more consecutive atria1 impulses are blocked
when the atria1 rate is less than 135 bpm. If the atria1 rate is very fast, as in atria1 flutter
with atria1 rates of 300 bpm, physiological AV block results as a normal function of the AV
node and therefore cannot be called high grade block, thus the arbitrary atria1 rate limit of
135 bpm. High grade AV block may be Mobitz Type I, occurring in the AV node, or
Mobitz Type II, occurring below the AV node. High grade block can be recognized by
these following ECG characteristics (Figure 2.23):
SpaceLabs
Medical: ADVANCED ELECTROCARDIOGRAPHY
Figure 2.23- High grade AV block
Rhythm: Regular or irregular, depending on conduction pattern.
Rate: Atria1 rate less than 135 bpm.
P waves: Normal, present before every conducted QRS complex, but several P
PR interval: Constant before conducted beats. May be normal or prolonged.
QRS complex: Usually normal in Mobitz Type I block and wide in Mobitz Type II block.
Conduction: Normal through the atria; two or more consecutive atria1 impulses fail to
waves are not followed by QRS complexes.
conduct to the ventricles. Ventricular conduction is normal in Mobitz
Type I and abnormally slow in Type II block.
Page 47

2.7.4 Third-Degree AV Block
Third-degree AV block is complete failure of conduction of all atria1 impulses to the ven-
tricles. In third-degree AV block, complete AV dissociation occurs. The atria are usually
under the control of the sinus node or an atria1 pacemaker and the ventricles are controlled by either a junctional or ventricular pacemaker. Third-degree AV block demonstrates the following ECG criteria (Figure 2.24):
Figure 2.26 Third-degree AV block (complete block).
I I I I I I I I I I I I I I I I I I I I I I I I
Rhythm: Regular.
Rate: Atria1 rate is usually normal, the ventricular rate less than 45 bpm.
P waves:
PR interval: No consistent PR intervals because no relationship exists between the P
QRS complex: Normal if ventricles controlled by a junctional pacemaker, but wide if
Conduction: Normal through the atria. All impulses are blocked at the AV node or in
Normal but dissociated from QRS complexes.
waves and QRS complexes.
controlled by a ventricular pacemaker.
the bundle branches, so there is no conduction into the ventricles. Intraventricular conduction is normal if a junctional escape rhythm occurs
and abnormally slow if a ventricular escape rhythm occurs.
Page 48

Page 49

3.1 Typical Applications of Arrhythmia Detection Algorithms
3.1 .I Dedicated Arrhythmia Monitoring System
In its most common use, that of a dedicated arrhythmia monitor, an arrhythmia detection
algorithm processes an ECG signal from a patient who is connected via a cable to a bed-
side monitor or wearing a telemetry transmitter. The arrhythmia monitor should detect all
abnormal occurrences in the ECG and notify the clinician by means of an audible alarm, a
visual alarm, and/or a hard-copy printout if any life-threatening arrhythmias occur.
These arrhythmia detection algorithms commonly detect abnormal (ectopic) QRS complexes without distinguishing between ventricular and supraventricular beats, VF, runs of
ventricular tachycardia (VT), runs of supraventricular tachycardia, pauses, and asystole.
Monitoring ST segment activity for detection of myocardial ischemia is also becoming increasingly common. Frequently, the arrhythmia monitor forms a part of a larger integrated patient monitoring system which may also measure blood pressures (invasive and
noninvasive), cardiac output, blood oxygen level, temperature, respiration, and other parameters. It is also usually connected by a computer communication network to other
monitors in the same hospital unit, other areas of the hospital, or even outside the hospital, thus allowing remote access to the arrhythmia information.
An arrhythmia detection algorithm for this application must run in real-time, never
fail to trigger an alarm if a life-threatening event occurs, and provide some degree of storage and user review capability.
3. I .2 Holter Monitoring
A Holter monitor is a small recording device that stores ECG waveforms for 24 or 48
hours on a magnetic cassette tape or in solid-state computer memory. This monitor is usually employed to obtain a comprehensive picture of ECG during normal daily activity.
The stored information is then analyzed at high speed by a Holter scanner that can pro-
duce a full disclosure printout (a very compressed view of the entire 24 or 48-hour pe-
riod), complete arrhythmia information, and ST segment information.
The off-line nature of a Holter scanner arrhythmia algorithm provides a major advantage over an algorithm in a real-time application. Questionable segments of data can be
examined several times using different processing techniques. Sections of intermittent
noise can be scanned both forward and backward, allowing more accurate detection of
the end of a noise event and quicker return to processing. Since a user reviews all the
scanner’s decisions and can override any beat classification, the algorithm can be less
stringent in its definition of noise. This permits the user to delete noise that the algorithm
has classified as ectopy while minimizing the potential for loss of useful information.
Alarms for specific arrhythmias would be meaningless in an off-line arrhythmia detection
algorithm since the ECG is usually processed hours or days after it actually occurred.
Another less common type of Holter monitor is the event recorder, which contains a
real-time arrhythmia detection algorithm. Only abnormal events are stored in its digital
memory, therefore no full disclosure ECG is available.
Page 50

SpaceLabs Medical: ADVANCED ELECTROCARDIOGRAPHY
3.1.3
3.1.4
3.2
Other Electrocardiographic Monitors
These include diagnostic 1.2-lead, ST segment monitoring, heart rate variability (HRV),
and late potential devices. Although these devices are not arrhythmia monitors as such,
abnormal beats must be detected in order to achieve accurate readings of the desired
parameter since each of these tests is defined for nonectopic beats only. Typically, the ST
segment and late potential tests employ some signal averaging in their algorithms. Any
abnormal beats that are included in the signal averaging can skew the results and perhaps
even obscure the parameter being measured.
Automatic Implantable Cardioverter-
Defibrillator
With the recent advent of i-he automatic implantable cardioverter-defibrillator (AICD),
there has been a great deal of interest in optimizing the algorithms which detect VF and
VT from eIectrodes implanted in the myocardium. The algorithm in each AICD must de-
tect the onset of VF or VT \rery accurately and very quickly in order to trigger defibrillation or cardioversion.
Signal Processing
The goal of signal processing as it relates to arrhythmia detection is to eliminate as much
noise as possible while retaining as much of the actual ECG signal information as possible.
In order to remove the noise from the signal, it is necessary to understand the characteristics of both the ECG signal and the potential forms of noise.
3.2. I
3.2.1 .I
Noise Sources
Power Line Interference (60 Hz or 50 Hz)
Most monitoring systems have a notch filter that removes this very common type of interference (Figure 3.2).
Figure 3.2- (a) Power line interference (b) Removed by a notch filter
Page 51

3.2.1.2 Muscle Artifact
Contraction of a muscle under an ECG electrode will cause noise to appear in the ECG signal, as shown in Figure 3.3. Unfortunately, this type of noise has a bandwidth similar to
the ECG signal and, therefore, cannot be eliminated by simple filtering. Placement of the
electrodes over areas with relatively little skeletal muscle can minimize the amount of
muscle tremor artifact.
Figure 3.3- Noise resulting from muscle contraction.
3.2.1.3 Electrode Contact Noise
Any disturbance of the electrical signal path from the body to the ECG amplifier will
cause extensive pin-to-pin noise that completely obscures the actual ECG waveform. This
is most often caused by an electrode in poor
adhesive, lack of good skin preparation, or absence of conducting gel between the electrode and the skin. Another frequent cause of electrode contact type noise is a partial
break in the wire that connects the electrode to the patient ECG cable or a loose connection
between this wire and the patient cable. Figure 3.4 shows typical noise resulting from poor
electrode
Figure 3.P Typical noise resulting from poor electrode contact.
contact.
-l-u
lil!-l
3.2.1.4 Baseline Wander
contact
with the skin, perhaps due to poor
Low-frequency wander of the ECG signal can be caused by respiration or patient movement (Figure 3.5).
44
Page 52

SpaceLabs Medical: ADVANCED ELECTROCARDIOGRAPHY
Figure 3.5-Low-frequency wander in ECG signal.
3.2.1.5 Noise From a Single Electrode
Electrode contact noise and muscle tremor usually originate from one electrode site. If the
noise persists, its source can be traced to a specific electrode using the knowledge of how
each lead is derived from each electrode. For example, if noise appears on leads II and III,
but lead I is clean, then the noise must be originating from the left leg electrode. If noise is
present in all leads, then it is possible that the right leg electrode is faulty since it is used by
all leads as the reference ground.
3.2.2 Noise Removal
If it were necessary for arrhythmia detection algorithms to make decisions based on pre-
set definitions of “normal” and “abnormal”, as is the case in a diagnostic 12-lead ECG,
then it would be necessary to analyze a bandwidth that preserves all the features of the
original ECG signal (about 0.0 Hz to 500 Hz). 51 However, arrhythmia monitoring’s task is to
distinguish differences in beats from a given patient’s dominant rhythm and morphology.
Therefore, no real need exists to carefully preserve all of the features of the original wave-
form in signal processing. A rather narrow bandwidth that removes low frequency base-
line wander, as well as a large part of the muscle tremor noise, can be used (Figure 3.6).
However, extreme overfiltering of an ECG waveform can also be counterproductive.
Narrow, large amplitude noise spikes may be slurred, giving them longer duration and
smoother features. This can cause a spike, that is clearly noise in the unfiltered or minimally filtered ECG, to look like an actual QRS complex when it reaches the arrhythmia algorithm (Figure 3.7).
3.2.3 Noise Detection
An arrhythmia detection algorithm should recognize when the noise content of the ECG
becomes so great that it obliterates the signal content, and stop attempting to detect beats
until an adequate ECG signal returns. One of the most common ways of detecting an
unprocessable signal is to determine if an electrode no longer makes good contact with the
skin. Contact quality can be easily determined by constantly measuring the resistance be-
tween any two electrodes. Although the resistance from a new properly applied and
maintained electrode through the body to another good electrode is fairly high, it still is
45
Page 53

Figure %&Lead II with muscle tremor and baseline
wander; then same segment after a bandpass filter
(3 to 15 Hz).
Figure 3.7~In the top tracing, the momentary spike
is clearly noise, but in the lower tracing, which has
been passed through a 3 to 15 Hz filter, what was
obviously a dominant beat now appears to be an
abnormal beat.
Page 54

Spacelabs Medical: ADVANCED ELECTROCARDIOGRAPHY
much lower than if either of the electrodes is off the body (infinite resistance), partially detached, or dried out. A continuity check to determine the quality of electrode contact is frequently performed in the preamplifier hardware, which passes the information on to the
software algorithm.
The most common “noise detector” in arrhythmia detection algorithms is a simple
routine that checks the unfiltered ECG for some common noise situations, such as signal
saturation at either the high or low limit of the amplifier, high frequency muscle artifact
indicated by a large number of crossings of the zero line, or sudden large amplitudedeflection of the baseline.
3.2.3.1 Primary Issues in Noise Detection/Rejection
The designer of an arrhythmia detection algorithm faces three major dilemmas concerning noise:
1. What is the best way to quantify/recognize noisy sections of ECG data?
2. What level of noise should the algorithm allow before it stops processing?
3. After an algorithm stops processing due to noise, how does it know when to start
again?
3.2.4 Sample Rate
The sampling rate of arrhythmia detection systems ranges from a low of 100 samples per
second (sps) to a high of 500 sps. Naturally, with the lower sampling rates, higher frequency events and features will be lost; but for detection of typical premature ventricular
beats, higher frequency components are not required.
3.2.5 Transformations
In addition to noise removal and detection, preprocessing of the ECG signal can also take
the form of an algorithm that performs some real-time analysis and transforms the data
stream into another waveform that can be more easily analyzed by the beat detection and
classification algorithms. A preprocessor known as Amplitude-Zone-Time-Epoch-Coding
(AZTEC) was developed in the late 1960s. This algorithm compresses high sampling rate
information into a series of straight line segments that can then be processed by later algo-
rithm stages in an effectively much lower sampling rate (Figure 3.8).‘2
AZTEC was designed to minimize low-amplitude high-frequency noise and, at the
same time, reduce data rate while retaining necessary information about the QRS complexes. Although this preprocessor is no longer employed in modern arrhythmia detection algorithms, it was the first widely used preprocessor and strongly influenced subsequent arrhythmia systems.
Page 55

Figure 3.8-An ECG trace before (top) and after
(bottom) AZTEC transformation. The period
between beats, which contains little useful informa-
tion, is compressed into a single straight line.
Figure 3.9%Beat is detected each time the voltage
crosses a threshold, which is a fraction of the
average peak amplitude.
Page 56

SpaceLabs Medical: ADVANCED ELECTROCARDIOGRAPHY
Table 3.1-Time Domain Features
(a) Height
The height of a candidate beat is measured as the maximum-minimum voltage in
the region of interest. The maximum and minimum voltages may be determined
from the whole beat or from a part of the beat. In the example at right, they are measured from the entire beat.
(b) Width or Duration
The width of a beat can be measured from onset to offset of
in the example at right, or at a point of higher voltage, such as the beat detection
threshold. This second method produces a smaller value for beat width, but is more
immune to error. The terms width and duration are used interchangeably, the difference being that width is thought of as the feature measured on a strip chart printout
of an ECG and duration as
chart paper speed.
(13 Area
The calculation of area can also be performed in several different ways. The total
absolute area from onset to offset may be measured as shown at right, or the measurement may be of total positive area, total negative area, the difference between positive
and negative area, or area above the beat detection threshold.
(d) DC Offset
DC offset is a calculated parameter which indicates whether a beat is primarily
positive or negative. Using
a value of 0 indicates that the beat is evenly positive and negative,
value indicating positive deflection and negative value indicating negative deflection.
the
actual feature being measured, independent of strip
the
beat at right, the DC offset is (A-B)/(A+B). Therefore,
the
QRS complex, as
with a
positive
(a)
DLI
(b)
LLl
(cl
ml
(d)
&
A
B
Om ’
(e) Maximum and Minimum Slope
The maximum and minimum values of the first derivative can be used as sepa-
rate features since they represent the maximum upslope and downslope during the
QRS complex.
Polarity or Direction or Orientation
These three terms all indicate whether a beat is primarily positive or negative.
Time (premature or late)
Both the R-R interval preceding a beat and the interval following a beat can be
considered features and may be used by some algorithms as such.
P-R interval
If P-wave detection is being performed, then this internal can be considered a feature.
Shape
Measurement of shape is performed in conjunction with correlation analysis.
Some arrhythmia detection algorithms extract only shape. The part of the beat used
for shape analysis varies from algorithm to algorithm and can include as much as the
entire beat (with P and T waves), or as little as a particular portion of the QRS complex.
e)
&
1st Derivative
Page 57

Page 58
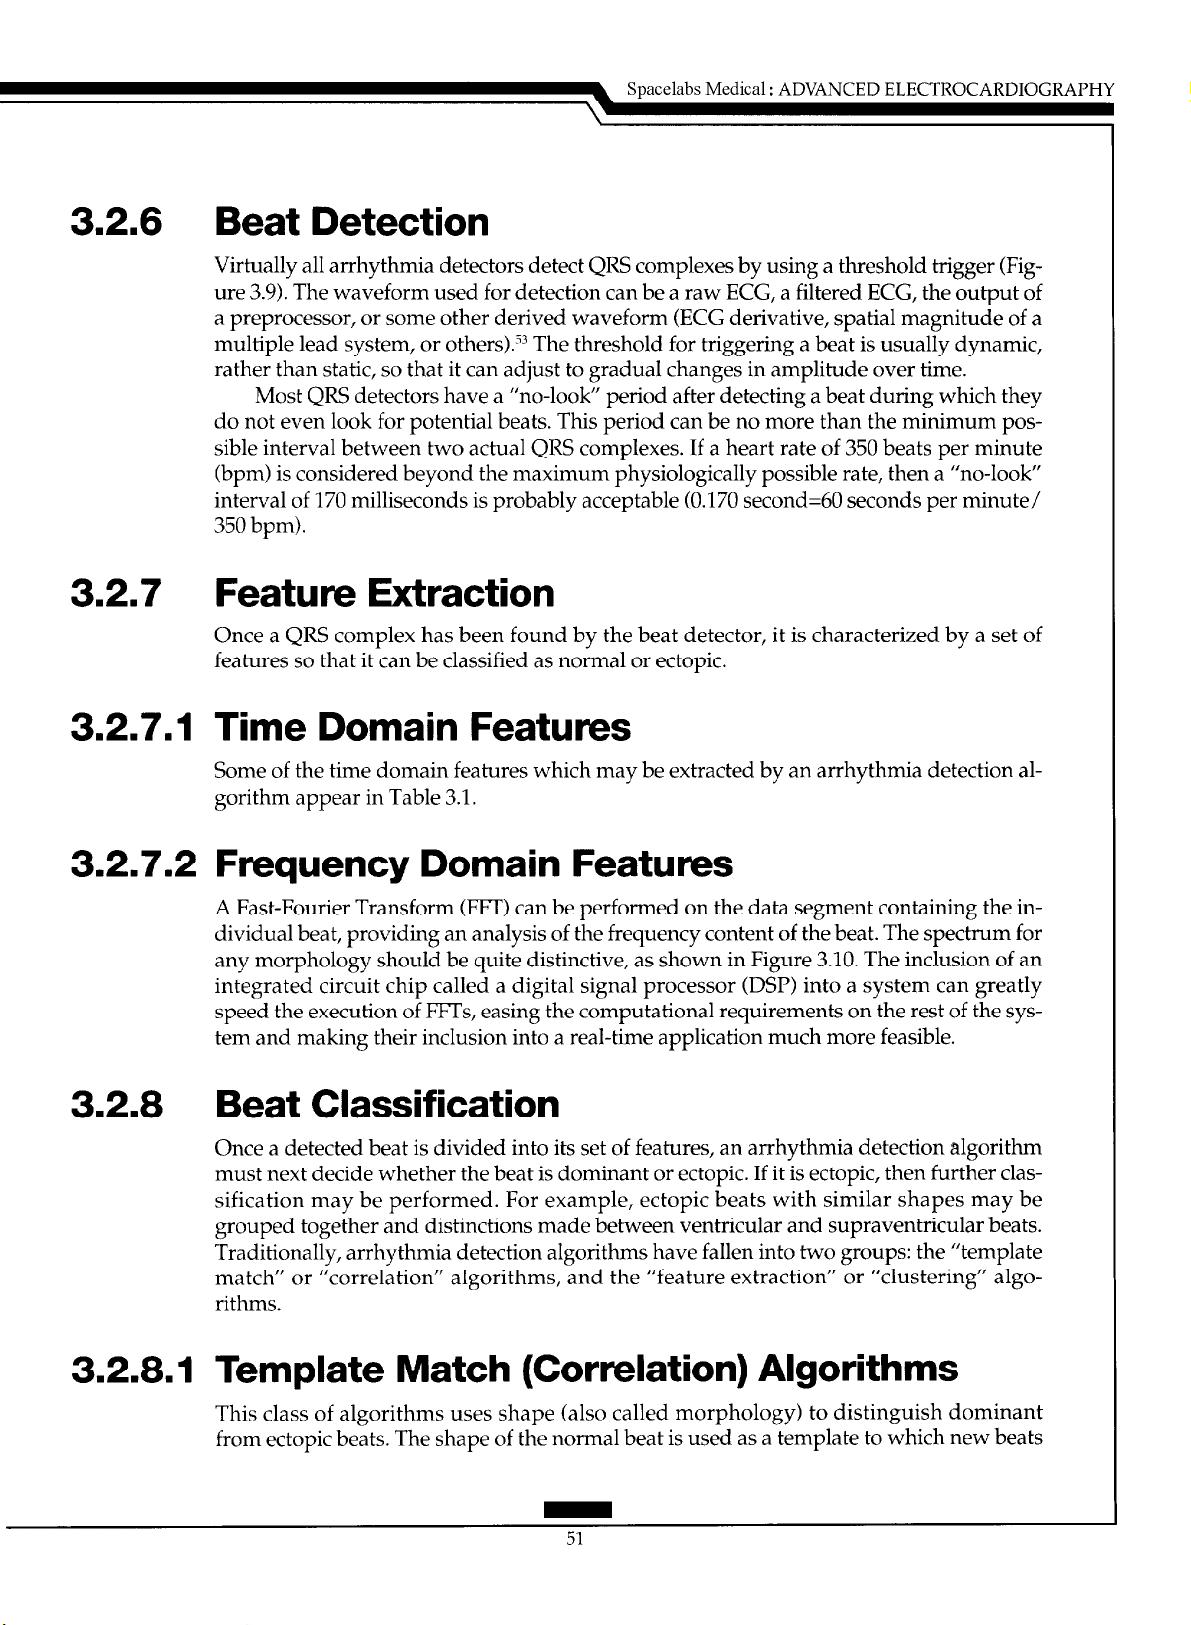
3.2.6 Beat Detection
Virtually all arrhythmia detectors detect QRS complexes by using a threshold trigger (Figure 3.9). The waveform used for detection can be a raw ECG, a filtered ECG, the output of
a preprocessor, or some other derived waveform (ECG derivative, spatial magnitude of a
multiple lead system, or others).‘3 The threshold for triggering a beat is usually dynamic,
rather than static, so that it can adjust to gradual changes in amplitude over time.
Most QRS detectors have a “no-look” period after detecting a beat during which they
do not even look for potential beats. This period can be no more than the minimum possible interval between two actual QRS complexes. If a heart rate of 350 beats per minute
(bpm) is considered beyond the maximum physiologically possible rate, then a “no-look”
interval of 170 milliseconds is probably acceptable (0.170 second=60 seconds per minute/
350 bpm).
3.2.7 Feature Extraction
Once a QRS complex has been found by the beat detector, it is characterized by a set of
features so that it can be classified as normal or ectopic.
Spacelabs Medical : ADVANCED ELECTROCARDIOGRAPHY
3.2.7.1 Time Domain Features
Some of the time domain features which may be extracted by an arrhythmia detection algorithm appear in Table 3.1.
3.2.7.2 Frequency Domain Features
A Fast-Fourier Transform (FIT) can be performed on the data segment containing the individual beat, providing an analysis of the frequency content of the beat. The spectrum for
any morphology should be quite distinctive, as shown in Figure 3.10. The inclusion of an
integrated circuit chip called a digital signal processor (DSP) into a system can greatly
speed the execution of FITS, easing the computational requirements on the rest of the system and making their inclusion into a real-time application much more feasible.
3.2.8 Beat Classification
Once a detected beat is divided into its set of features, an arrhythmia detection algorithm
must next decide whether the beat is dominant or ectopic. If it is ectopic, then further classification may be performed. For example, ectopic beats with similar shapes may be
grouped together and distinctions made between ventricular and supraventricular beats.
Traditionally, arrhythmia detection algorithms have fallen into two groups: the “template
match” or “correlation” algorithms, and the “feature extraction” or “clustering” algorithms.
3.2.8.1 Template Match (Correlation) Algorithms
This class of algorithms uses shape (also called morphology) to distinguish dominant
from ectopic beats. The shape of the normal beat is used as a template to which new beats
51
Page 59
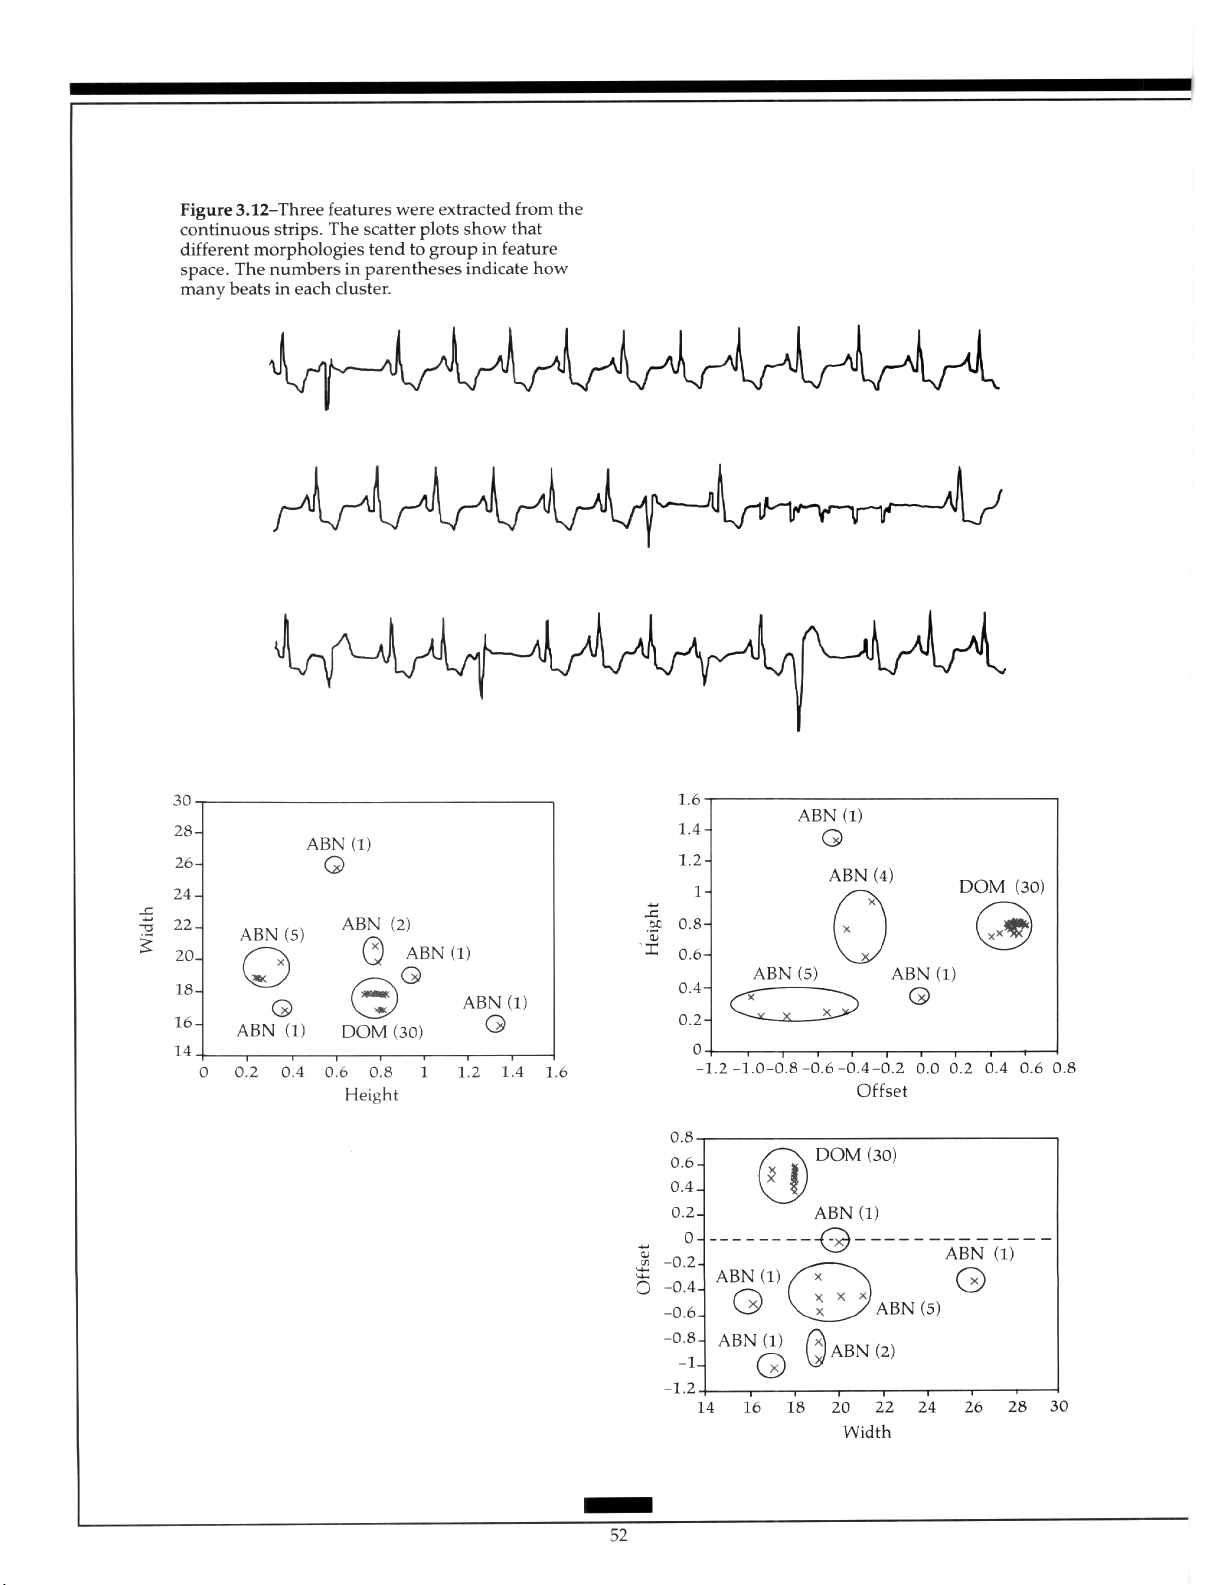
Page 60

are compared. When a beat violates the dominant template, as shown in Figure 3.11, it is
classified as ectopic.
The template match type of comparison has the advantage of being very intuitive,
since the algorithm is performing essentially the same procedure that a human observer
would use through a visual comparison of the shapes of two beats. Template matching
has one disadvantage in that the correlation procedures used to distinguish differences in
shape are somewhat mathematically intensive and therefore require a fast computer system to achieve real time processing. Another disadvantage relates to the implementation
of the correlation calculation. To make an accurate determination of the correlation between two waveforms, they must be aligned very carefully. The algorithm must find a
stable fiducial point within each beat that acts as a landmark to enable exact alignment of
like-shaped beats. The simplest landmark is the maximum amplitude, but several others
exist that are less sensitive to error, such as the point of maximum positive, or negative,
slope.
3.2.8.2
Feature Extraction (Cluster Analysis)
Algorithms
An arrhythmia detection algorithm that uses only features, as opposed to shape, can dis-
tinguish dominant from ectopic beats by finding the “clusters” in the parameter space.
With only two parameters under consideration (n=2), the visual analogy is simple, as
shown in Figure 3.12.
This process of looking for clusters is valid for any number of parameters, although
when more than three parameters are used, the traditional graphical representation is no
longer possible.
The advantages of using only feature extraction in a beat classification algorithm include relative simplicity from a computational standpoint, and a reduction in importance
of subtle changes in dominant morphology which may cause a dominant beat to violate a
template. The use of multiple parameters buffers the effect of any single feature.
The obvious disadvantage to using feature extraction rather than template matching is
that the beat morphology is no longer an explicit part of the decision-making process. This
means that the algorithm is not analogous to the method which a trained human observer
would use in separating dominant and ectopic beats.
3.2.8.3 Hybrid Algorithms
A frequent compromise to the dilemma of whether to use template matching or feature
extraction for classification of beats is to use a hybrid of the techniques. Generally, the template match is the most important element in deciding whether a beat is dominant or ectopic, but multiple features can be used with varying degrees of importance to assist in the
final decision. This combination of the two methods of beat classification takes the advantages of each method while attempting to minimize the disadvantages.
3.2.8.4 Rhythm Analysis
In addition to morphologic information and extracted features, the timing of each beat in
relation to its surrounding beats is an important factor in classifying beats as dominant or
Page 61

Figure 3.13-The event between the third and fourth
beats can be rejected with a high degree of confidence since it is interpolated (does not interrupt the
normal rhythm) and it falls late in the interval
between the two normal sinus beats.
Figure 3.14-A single-lead arrhythmia monitor using
lead III would determine this PVC to be a pause,
since its amplitude is almost 0 in that lead. However, multiple-lead monitoring could easily deter-
mine that this is a PVC.
Page 62
Spacelabs Medical : ADVANCED ELECTROCARDIOGRAPHY
ectopic. Physiologically impossible occurrences can be ignored. For example, if two ectopic beats are detected between two on-time dominant beats, then these ectopic beats are
probably isolated noise events which have passed through the front-end noise detection
rather than an interpolated couplet (Figure 3.13).
Rhythm analysis also encompasses the relatively simple post-beat classification definitions of pauses (a longer than usual time between consecutive dominant beats),
supraventricular tachycardia (several consecutive dominants at an accelerated rate), and
VT (several consecutive ectopic beats at an accelerated rate).
3.2.9 Pacemaker Spike Detection
Detection of pacemaker spikes generally is not an issue in development of an arrhythmia
detection algorithm. This task is usually performed by a special hardware circuit that analyzes the raw analog ECG signal. The digitally-sampled signal lacks the high-frequency,
low-amplitude information necessary to reliably detect pacer spikes from surface elec-
trodes. Accurate detection of pacemaker spikes by the front end is very helpful to the
arrhythmia algorithm since paced beats have a distinct morphology often different from
the unpaced dominant and should not be grouped with ectopic morphologies.
3.2.10 Ventricular Fibrillation
Due to their life-threatening nature, VF and VT must always be found by an arrhythmia
detection system. To decrease the response time of a system to VF, the ECG signal is fre-
quently passed through the VF algorithm before being sent on to the beat detector or even
the signal processing section. Various techniques have been proposed over the years to
detect VF, many using a combination of time domain and frequency domain information,
with heavy emphasis on the latter?,.”
The older algorithms were developed using surface electrodes and since the ECG sig-
nal has different characteristics when viewed using implanted electrodes, new algorithms
have been required. The incidence of false VF/VT alarms for AICD algorithms must be
nearly 0, because any detection of VF or VT causes the defibrillator or cardioverter to discharge, resulting in pain to the patient and shorter battery life. Since batteries must be replaced by surgical procedure, this consideration is not trivial.
3.2.11 Lead Selection
Arrhythmia detection algorithms can function using any ECG lead (or combination of
leads in a multiple-lead system) because discrimination of dominant and ectopic beats is
independent of any absolute definitions and detection of VF is not lead-dependent. In a
multiple-lead system, lead selection should attempt to provide orthogonal information to
the arrhythmia monitor. Using orthogonal leads, an ectopic beat that occurs in a direction
perpendicular to one of the monitored leads (resulting in very low amplitude) has higher
amplitude in the other lead(s) (Figure 3.14). For this reason, the default leads in most twolead arrhythmia monitoring systems are II and V,.
Page 63
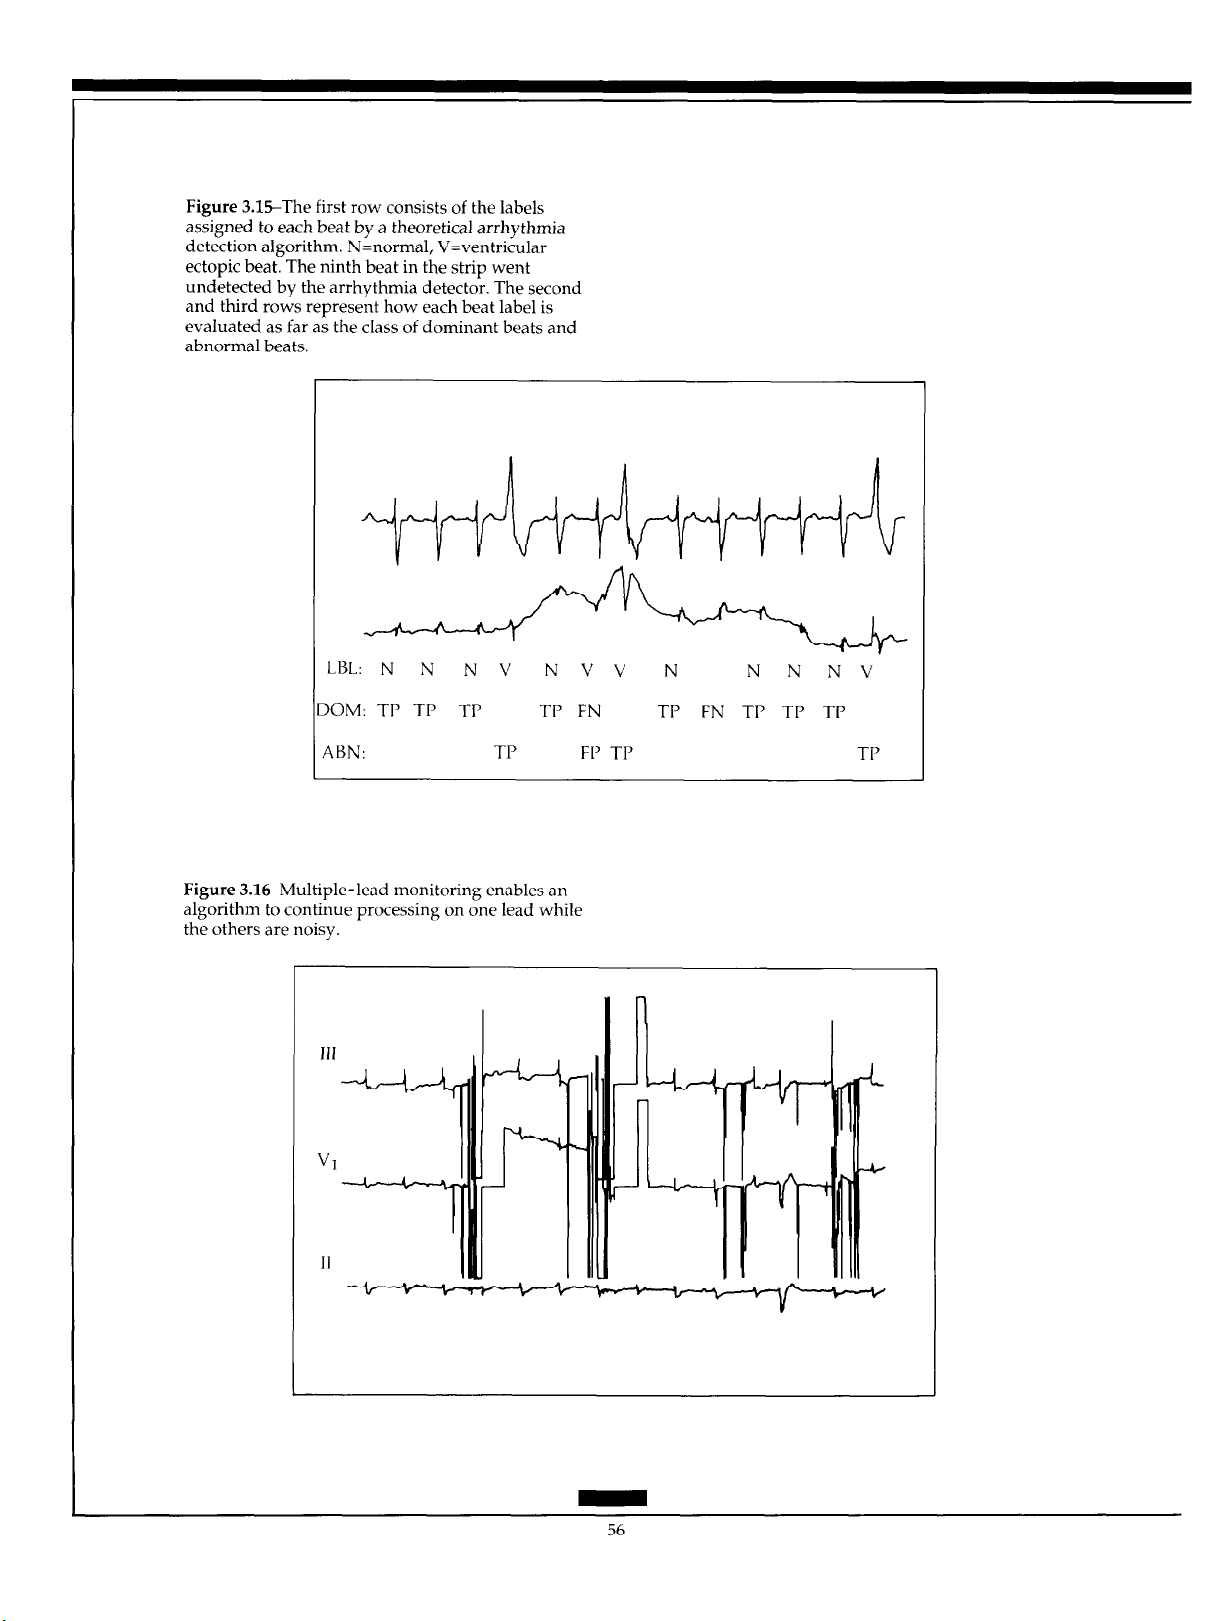
Figure 3.X-The first row consists of the labels
assigned to each beat by a theoretical arrhythmia
detection algorithm. N=normal, V=ventricular
ectopic beat. The ninth beat in the strip went
undetected by the arrhythmia detector. The second
and third rows represent how each beat label is
evaluated as far as the class of dominant beats and
abnormal beats.
LBL: N N N V
DOM: TP TP TP TP FN l-l’ FN 7-J’ TP TP
ABN: TP FP TJ’ TP
Figure 3.1GMultiple-lead monitoring enables an
algorithm to continue processing on one lead while
the others are noisy.
JJJ
NVV N
N
N NV
56
Page 64

Spacelabs Medical : ADVANCED ELECTROCARDIOGRAPHY
3.3
Algorithm Verification
Three terms commonly used in evaluation of arrhythmia detection algorithms are defined
below:
True Positive (TP): An event occurred and was accurately detected.
False Negative (FN): An
False Positive (JS’): No
Figure 3.15 shows a strip of ECG, some sample classifications by a hypothetical
(and very poor) arrhythmia detection algorithm, and the evaluation of each event. An ideal
algorithm would have 100% TP, 0% FN, and 0% FP. The impact of FNs and FPs on user
confidence is very strong, especially with respect to VF and VT. If an arrhythmia
toring system misses any occurrence of VF or VT (FN), then users may never trust that
system.
Two large databases of annotated ECG data containing a very wide variety of
arrhythmias and noise are currently available. The American Heart Association (AHA)
database contains 160 separate 3.5 hour, two-channel Holter-type tapes or digital files.5h
For
each
file, the last 30 minutes are completely annotated with beat labels and rhythm information.
ment and in-house testing of arrhythmia algorithms, while the other half is kept by the
Emergency Care Research Institute (ECRI) for periodic evaluations of available systems.
Another database, developed at the Massachusetts Institute of Technology and Beth Israel
Hospital, consists of 48 (30-minute) two-channel digital files obtained from Holter record-
ings.s7
The Association for the Advancement of Medical Instrumentation (AAMI) has published a set of recommendations for testing ventricular arrhythmia detection algorithms to
be used in conjunction with the standard available annotated databases.5R
When examining any statistics of arrhythmia algorithm performance, it is crucial for
the user to know whether the algorithm was developed using the same database which
was used for evaluation. If this is the case (that is, retrospective rather than prospective
evaluation), then the statistical data is not necessarily a true indication of how well the algorithm performs in actual use on prospective ECG data. For this reason, the ECRI evaluations of arrhythmia detection systems using the confidential half of the AHA database
should be considered the best available assessment of device performance.
One
half of
event
occurred and was not correctly detected by the device.
event
actually occurred, but one was detected by the device.
this
database is available for general distribution to aid in develop-
moni-
Current Trends in Arrhythmia Monitoring
3.4.1 Multiple Leads
Many current real-time arrhythmia monitors have now implemented algorithms which
enable them to process the ECG in two leads, as has been the case for Holter monitoring
for some time. Dual-lead monitoring increases the likelihood that
transient noise there will exist one processable lead (Figures 3.16 and 3.17) while decreasing the likelihood that an ectopic event will be of such low amplitude in all monitored
leads that it will be missed (Figure 3.14).
even
during periods of
Page 65

Figure 3.17-Noise originating from the RA elec-
trode would cause any arrhythmia system not
monitoring lead III to mcorrectly decide that this
rhythm is ventricular tachycardia. This noise was
caused by a respiratory therapy treatment known as
“clapping”.
Figure 3.1%Excessive contact noise on the ECG
leads completely obscures the QRS complexes, but it
is obvious from the continued normal rhythm of the
blood pressure pulses that a normal ECG rhythm is
present under the noise.
Page 66

Spacelabs Medical : ADVANCED ELECTROCARDIOGRAPHY
With faster, more powerful microprocessors available it is likely that arrhythmia de-
tection algorithms will soon be able to process more than two leads, thus increasing accu-
racy and reducing FPs.
3.4.2 Improved Noise Rejection
Detection and classification of QRS complexes on a perfectly clean ECG signal is a relatively simple process, one performed quite adequately by most current arrhythmia monitoring systems. What truly separates the useful algorithms from the less useful ones is
how they deal with a signal of less than ideal quality. Improvement of noise handling algorithms will undoubtedly be an issue in the future development of arrhythmia detection
algorithms. This is true not only for dedicated arrhythmia monitoring systems, but also
for arrhythmia algorithms in devices that monitor other electrocardiographic diagnostic
parameters such as late potentials, heart rate variability, and ST segment levels.
3.4.3 ST Segment Monitoring
To accurately measure ST segment changes over time, all ectopic beats and all normal
beats even slightly corrupted by noise must be eliminated from analysis. Any
nondominant beats that are included in ST segment analysis can skew the results since the
ST segment deviation for an abnormal beat is likely to be much different than that of the
dominant morphology and is meaningless to any trending of myocardial ischemia.
3.4.4 Incorporation of Other Parameters
If arterial blood pressure is being monitored concurrent with arrhythmia detection in the
same patient bedside monitor, the beat onset and rhythm information present in the blood
pressure waveform can aid the arrhythmia detection algorithm. One useful situation is
shown in Figure 3.18, in which the ECG tracing is totally useless due to intermittent
electrode contact noise. In a normal arrhythmia detection algorithm there would be no
cardiac rhythm information available at all. However, analysis of the arterial pressure
tracing clearly demonstrates that the heart is still beating at a normal rate.
3.4.5
P Wave Detection
Clinically, a major limitation of all current arrhythmia monitoring systems is their inability
to provide any information about atria1 activity due to the very small amplitude of the I’
wave relative to the QRS complex. The I’ wave is frequently obscured by even a minor
level of baseline noise. No methods for reliable I’ wave detection from surface electrodes
placed in the standard configuration have yet been developed. For an arrhythmia monitor
to perform its function to the highest degree, it must detect all arrhythmias, ventricular
(QRS complex) and supraventricular (I’ wave). Some early ECG monitoring algorithms
attempted to detect I’ waves by searching backwards from a detected QRS complex for
the preceding P wave.
be somewhat more feasible since adequate I’ wave amplitude is more likely to be present
in one of several available leads than in a single lead.
4y With the advent of multiple lead systems, I’ wave detection may
Page 67

Figure 4.1-A typical cardiac action potential.
-9OmV
Figure 4.2-(a) Transmembrane action potentials
recorded simultaneously from an endocardial and
epicardial cell on the normal left ventricle.
(b) Schematic representation of intracellular
potentials in endocardial and epicardial cells at the
moment of the vertical line in the top panel.
(a)
w-w--
Endocardium
(b)
-4OmV
----
Epicardium
-----w-----m
------------
I
I
-6OmV
I
60
Page 68

Spacelabs Medical : ADVANCED ELECTROCARDIOGRAPHY
ST SEGMENT ANALYSIS
The heart normally undergoes a repetitive sequence of electrical activation (depolarization) followed by recovery (repolarization). Potentials generated by activation of the ventricles produce the QRS complex of the electrocardiogram (ECG). The ST segment and T
wave reflect potentials generated by the repolarization of the cardiac ventricles. This section examines the importance of monitoring changes in ST segment produced by transient
myocardial ischemia. Specific areas reviewed include the physiologic mechanisms underlying the production of the normal ST segment and T wave, the abnormalities in these
processes resulting from myocardial ischemia, how these abnormalities affect the ECG,
how these abnormalities can be recorded, and the clinical significance of ECG changes.
4.1
Normal ST Segment and T Wave
Action potentials recorded from cardiac cells have a characteristic appearance (Figure 4.1).
Activity begins from a baseline level determined by the transmembrane resting potential
or phase 4 potential. During this period, the inside of the cell is negative in relation to the
cell exterior, having a normal transmembrane potential gradient of approximately -90
mV. Activation of the cell results in a rapid shift in intracellular potential to positive values, producing the upstroke or phase 0 of the action potential. Intracellular potentials then
fall back to negative levels as the cell repolarizes or recovers. This occurs in three phases:
an initial brief rapid phase (phase 11, followed by a prolonged relatively stable period
(phase 2 or plateau phase), and a final period of rapidly falling potential (phase 3).
The normal ST segment is produced by differences in the duration of action potentials
across the ventricular wa11.5’ Normally, action potentials are shorter near the epicardial
surface than near the endocardium (Figure 4.2). Thus, cells near the epicardium complete
repolarization before endocardial cells.
The differences in recovery times result in potential differences between cells across
the ventricular wall (Figure 4.2). Cells near the epicardium that recover more rapidly have
intracellular potentials that are more negative than do cells near the endocardium that recover later. Positive currents then flow in intracellular space from more positive (less repolarized) to more negative (more repolarized) cells.
Intracellular current flow thus proceeds from endocardium to epicardium. An electrocardiographic electrode over the heart or on the body surface senses current flowing toward it and registers positive potentials. Hence, the normal ST segment is positive and the
normal T wave is upright.
4.2
Basic Effects of Myocardial Ischemia
Myocardial ischemia results from an insufficient supply of oxygen and other nutrients to
meet the metabolic demands of cardiac tissue. When flow cannot maintain the normal
functions of the cell but can sustain cell life, myocardial ischemia occurs. If oxygen supply
is reduced to lower levels at which cell life cannot be maintained, myocardial infarction
develops.
Ischemia can result from an increase in oxygen demand in myocardial tissues, a reduction in coronary artery blood flow or, most commonly, a combination of both factors.bO
The three major determinants of oxygen demand are heart rate, myocardial contractility,
61
Page 69

Page 70

Spacelabs Medical: ADVANCED ELECTROCARDIOGRAPHY
and the magnitude of mechanical tension developed in the ventricular wall during con-
traction. Increases in any of these parameters raises oxygen demand. Coronary blood flow
can be reduced by a chronic arterial obstruction such as that produced by coronary atherosclerosis or thrombosis, or by transient reductions in the diameter of the arterial lumen
induced by increases in tone of the muscle in the arterial wall, i.e., vasoconstriction.
4.2.1
Hemodynamic Consequences of Coronary Obstruction
Under normal conditions, blood flow to the ventricular wall rises as oxygen demand in-
creases.hu For example, during exercise, myocardial blood flow can increase by 600% as
heart rate and contractility rise. Myocardial ischemia does not, therefore, develop even
though oxygen demand markedly increases. However, in the presence of a coronary artery obstruction, the magnitude of the achievable flow increase is limited. Blood flow at
rest may be adequate to meet the needs of the myocardium, but, when oxygen demand
during exercise exceeds the ability of flow to increase, myocardial ischemia develops.
Normally, blood flow is evenly distributed across the ventricular wall. Reductions in
coronary blood flow or increases in oxygen demand produce a redirection of blood flow
away from the inner wall of the ventricles. Epicardial flow is maintained until coronary
flow reaches levels near 0. Thus, with both supply-dependent and demand-dependent
ischemia, the subendocardium is first jeopardized and subendocardial ischemia develops.
Transmural ischemia, with reductions in flow to all layers of the ventricular wal1, develops only with more severe reductions in flow.
4.2.2 Electrophysiologic Effects of Myocardial lschemia
Myocardial &hernia affects cellular electrophysiologic properties in characteristic ways
(Figure 4.3).h’ First, the transmembrane resting potential of ischemic cells rises to less negative values and cells are partially depolarized. Resting membrane potentials rise from nor-
mal levels of near -90 mV to less negative values of approximateIy -60 to -65 mV within
minutes of coronary occlusion.
Second, action potential duration is shortened. This begins within minutes of coronary
blockage and reaches maximal levels within 30 minutes. This abnormality reflects abbreviation of the plateau phase of the action potential waveform as well as an acceleration of
the fall in potential during phase 3. Thus, subendocardial ischemia shortens inner wall
action potential durations to reverse the normal transmural recovery gradient. The
ischemic inner wall now recovers before the normal outer wall (Figure 4.3).
4.2.3 Injury Currents
Partial depolarization and shortened action potential duration generate potential gradients between ischemic and neighboring normal cells.
flow of injury currents between regions (Figure 4.3).
During phase 4 of the action potential, the intracellular resting potential of ischemic
cells is less negative to the more negative normal cells (Figure 4.3). This potential gradient
61 These potential gradients result in
63
Page 71

is eliminated when both the ischemic and normal regions are activated and the injury current ceases to flow. Because these currents flow only during electrical diastole, they are
termed diastolic injury currents.
The shortening of ischemic action potential duration causes the intracellular potential
of ischemic cells to become more negative during phases 2 and 3 than in normal cells. Intracellular positive current then flows from normal to ischemic cells during electrical systole to create systolic injury currents (Figure 4.3). Thus, the direction of the systolic injury
current is opposite that of the diastolic injury current.
4.3
4.3.1
EIectmcaniiographic Effects of
Myocamlial lschemia
Injury currents can be detected by electrocardiographic leads placed on the body surface.
The pattern observed varies, however, depending on the type of ECG amplifier used. A
direct, or DC, coupled amplifier commonly operates in standard voltmeters to measure
the absolute level of voltage in a circuit. The potential at one electrode is measured in volts
relative to a 0 reference or ground potential.
Most clinical ECG systems have a capacitor-coupled stage in the amplifier. Hence,
they are known as capacitor coupled, or AC-coupled, amplifier systems. This capacitor
prevents conduction of DC current but allows passage of alternating, or AC, current. Because the DC level of the ECG record is eliminated, ECG voltages cannot be measured
relative to a segment of the ECG waveform defined as the baseline level. The TP segment
(that is, the interval between the end of the I’ wave and the beginning of the QRS complex)
is normally selected as the baseline reference level against which other wave amplitudes
are evaluated.
DC-Coupled Amplifiers
Figure 4.4 represents a unipolar ECG electrode over an ischemic zone, connected to a DC-
coupled amplifier. Diastolic injury currents flow from ischemic subendocardial cells to
normal subepicardial cells, i.e., toward the electrode. They thus produce a positive potential shift in the amplifier output during electrical diastole during the TQ segment (Figure
4.4). The recording returns to baseline levels once depolarization begins and remains at
that level until recovery is complete at the end of the T wave.
Systolic currents are directed from normal subepicardial to ischemic subendocardial
cells and away from the electrode. They thus generate negative potentials in the ECG
waveform during the period of electrical systole, the ST-T interval (Figure 4.4a). The recorded ST segment is depressed. Hence, a DC-coupled ECG recording exhibits TQ segment elevation followed by ST segment depression.
4.3.2 AC-Coupled Amplifier
The rise in the absolute magnitude of TQ segment potentials generated by diastolic injury
currents cannot be directly measured in AC-coupled systems because this interval serves
as the baseline level. However, because diastolic injury currents cease once ischemic and
normal tissue are activated, the ST-T interval occurs at a lower potential level than the TP
Page 72

Spacelabs Medical : ADVANCED ELECTROCARDIOGRAPHY
segment. This appears as relative, or apparent, or secondary ST segment depression in the
AC-coupled output.
Systolic injury currents also produce a negative shift in the ST segment. This shift oc-
curs as a direct or primary ST segment depression. Hence, both systolic and diastolic in-
jury currents summate to produce ST segment depression in capacitor-coupled recordings
from a unipolar electrode on normal tissue overlying an ischemic zone (Figure 4.4). This
ST segment depression results from both primary and secondary ST depression and is the
hallmark of subendocardial myocardial ischemia.hl
4.4
4.4.1
Recomling Hectmcamliographic Effects
of Myocardial Ischemia
ST segment analysis can be performed in several clinical settings. First, ST segment abnor-
malities can be monitored in patients hospitalized in coronary care units, intensive care
units, operating rooms, emergency rooms, or similar monitored units. Such patients commonly have unstable angina pectoris, acute myocardial infarction, or recent cardiovascular surgery. Second, ST segment potentials can be computed from long-term (24 to 72
hours) tape recordings of ECG rhythms in ambulatory patients, i.e., long-term electrocardiographic recording or Holter monitoring. Important instrumentation requirements
must be met in each clinical setting to ensure accurate recordings.
ECG Lead Systems
Myocardial ischemia generally occurs as a regional event produced by narrowing of a
coronary artery that supplies a particular area of the heart. The resulting electrophysio-
logic abnormalities produce electrocardiographic changes in electrodes topographically
related to the injured area. Because lesions can form in vessels supplying any area of the
heart, recording electrodes must reside on body surface locations that permit detection of
relevant electrocardiographic information from all cardiac regions.
A complete sampling of all cardiac areas would require hundreds of electrodes, a
technically impossible situation in most clinical settings. Specific leads can be designed,
however, that permit detection of ischemic abnormalities from most large areas of the
heart. Leads that sample all three major axes of the cardiac electrical field (anterior-posterior, right-left, and superior-inferior) can detect abnormalities from all cardiac regions.62
Most commonly, leads approximating lead V, or V, in the anterior-posterior axis, lead V,
in the right-left axis, and lead aVF in the superior-inferior axis are best suited for ST seg-
ment analysishZsh3
Such a lead system may be constructed in coronary care units using electrode locations originally designed for exercise stress tests as depicted in Figure 1 .lO.& The ECG patterns recorded from these leads are very similar to those registered by standard ECG systems. Although many monitoring systems permit surveillance of only one lead at a time,
recommendations that two leads be simultaneously monitored have been made.@ Addi-
tional leads may be needed for particular purposes.
For ambulatory monitoring, two leads are commonly recorded (Figure 1.14).63 One
lead, similar to lead V,, is constructed from electrodes placed on the fourth right intercostal space 1 inch from the sternal margin (positive pole) and on the lateral one-third of the
65
Page 73

Page 74
Spacelabs Medical : ADVANCED ELECTROCARDIOGRAPHY
left infraclavicular fossa (negative pole) and 1 inch below the inferior angle of the right
scapula on the posterior torso (negative electrode).
4.4.2 Amplifier and Monitor Systems
Electronic characteristics of
for the recording of ST segment abnormalities. The ST segment has a frequency content
considerably lower than that of the QRS complex. Hence, particular attention must be
given to all components that
include patient-related elements, electrode systems, and amplifiers.
The major patient-related elements are respiration and body motion. Low-frequency
chest wall movements cause baseline wander that can either mimic or obscure true transient ST segment shifts. Inadequate skin preparation before attaching electrodes and insecure electrode placement can also increase electrode interface noise to cause excessive
baseline drift. Optimal recordings require applying electrodes away from muscular areas
and bony prominences to reduce motion artifacts. Cleaning the skin
mild abrasives removes oils and dead layers of cells that increase impedance. Final measured impedance should measure less than 5000 ohms, and preferably less than 3500
ohms.6W
Amplifier characteristics are critical, especially frequency response and phase re-
sponse. The common low-frequency limit of monitoring amplifiers of 0.5 Hz can significantly distort the ST segment and may artifactually produce ST segment shifts.bs,h6 Using
the same low-frequency cutoff of 0.05 Hz recommended for diagnostic electrocardiographs is best.@ Strict adherence to this requirement can, however, cause so much baseline
wander it makes the monitor useless. A system with an amplitude response that is flat to
a few tenths of 1.0 Hz may be adequate if linearity between phase shift and frequency response is maintained. Specific recommendations of a task force of the American Heart Association, for example, include an amplitude response that is flat to within 0.5 decibel (dB)
to 1 .O Hz and a -3 dB cutoff of less than 0.33 Hz if the system has a phase response at least
as good as a linear 0.05 Hz single-pole amplifier system.h2 Frequency modulated (FM) tape
recorder systems with frequency responses flat to essentially 0.0 Hz are not required.
the
amplifier and associated hardware are critically important
can
attenuate low frequency interference. These components
with
alcohol and
4.4.3 Analysis Systems
Virtually all ST segment analysis systems rely on computerized processing of the ECG signal. Automated analysis systems must accurately detect all significant ST segment shifts
(i.e., have high sensitivity) without including artifact (i.e.,
specific conditions should be met by these systems. The automated system must select an
appropriate baseline period (usually during the TP segment or PR segment) and identify
the end of the QRS complex (the J point) to accurately quantify the potential at a particular
instant during the ST segment. Most systems allow the user to specify the exact baseline
and analysis time points. The ST segment shifts should likewise be used only on normally
conducted complexes and not on ectopic beats.
Finally, it cannot be overemphasized that the clinical effectiveness of the monitoring
system depends on the expertise of the user regardless of the sophistication of the hardware and software. Adequate and recurrent training of technical, as well as professional,
staff remains absolutely essential for successful operation in a clinical environment.
67
have
high specificity). Several
Page 75
4.5 Hectrocamliographic Features
of Transient Ischemia
Ischemic ST segments, characteristically depressed, are horizontal or flat in shape (Figure
4.5). The ST depression can occur with or without T wave inversion. The T waves can be
inverted in the absence of ST segment depression. Diagnostic criteria for an ischemic episode require 0.1 mV of flat or downsloping ST segment depression 80 msec after the J
point that lasts 60 to 90 seconds or longer. Such flat depression is rare in normal subjects.
Less commonly, ST segment elevation occurs rather than depression, and is largely limited to patients with unstable angina pectoris or acute myocardial infarction.
Most episodes last less than 5 minutes, although some
number of episodes per day varies widely. In patients with stable angina pectoris, for example, ischemic episodes number up to 25 per day with a total duration of 1 to over 400
minutes per 24-hour period. hX A marked increase in frequency occurs during the first two
to four waking hours of the day.hy
can
last several hours. The
4.6
Clinical Significance of Transient
ST Segment Depression
Ischemic ST depression can be detected in
in a very small minority of healthy subjects. 70 It is particularly common in patients with
stable and unstable angina and in those experiencing the onset of acute myocardial
infarction (Figure 4.6).
The presence of ST segment shifts on ambulatory ECG has a high specificity (over
90%) but only a moderate sensitivity (37% to 54%) for identifying patients with underly-
ing coronary artery disease. 68,70 Many episodes of transient ischemia occur during physical
and mental activity.” The incidence is greater during more intense activities. For example,
performing various forms of mental arithmetic is particularly provocative. However,
many
episodes develop at rest or with only mild exertion. Transient ischemia begins by either increases in oxygen demand produced by rises in heart rate or blood pressure or by
decreases in myocardial blood flow produced by vasoconstriction.72
Most episodes are not associated with symptoms, and thus they represent silent myocardial ischemia.” In patients with stable angina pectoris, over 85% of episodes are painless and approximately 45% of patients have only painless ischemia. Hypotheses have
been proposed explaining why most episodes do not produce pain. This mechanism may
be particularly relevant in diabetics with peripheral neuropathy. A greater percentage of
these patients have only silent episodes than do other patient populations. The degree of
ischemia during painless episodes can be less than during painful attacks. Painful episodes last longer, are associated with greater ST segment depression, and, in some studies,
cause greater left ventricular dysfunction than painless ones.
As many as one third of patients with transient ST segment depression develop ven-
tricular arrhythmias during the ischemic episodes.
frequent ischemic episodes, longer episodes with ectopy, and greater ST depression than
other episodes.
Myocardial ischemia-whether symptomatic or asymptomatic-is an important
prognostic factor in patients with stable angina pectoris. The incidence of death, infarction,
most
patients with coronary artery disease and
73 Patients with arrhythmias have more
68
Page 76

Spacelabs Medical : ADVANCED ELECTROCARDIOGRAPHY
unstable angina, or need for surgical revascularization is much greater in patients with
ECG evidence of transient ischemia.75
In patients with unstable angina, the total duration of ischemic ST depression directly
correlates with extent of coronary artery disease and with development of acute infarction
or death. Patients with over 60 minutes of ischemia per day have a particularly poor outcome; over 90% develop acute infarction or require revascularization.76
Similarly, the presence of transient ischemic episodes during the early or late postinfarction period is a poor prognostic sign .77,78 Recurrent infarction occurs more commonly
in those with ischemia during hospitalization. Patients with ischemic ST segment shifts after infarction have a much higher prevalence of death, reinfarction, or unstable angina
than those without ischemia. Thus, transient ischemia indicates a poor prognosis in all
forms of symptomatic coronary artery disease.
Finally, transient ischemic ECG changes during the preoperative and early postoperative period after noncardiac surgery is a poor prognostic sign.” These changes are most
frequent after vascular surgery and on the third postoperative day. Severe postoperative
ischemic complications, including unstable angina, infarction, and death, occur almost
only in patients with ischemic episodes; patients with postoperative ischemia have over a
nine-fold greater risk of such events than do those without transient ischemia.
5.0
5.1
PEDIATRIC ELECTROCARDIOGRAPHY
Pediatric arrhythmias have some similarities in the electrocardiographic appearance and
subsequent interpretation to adult electrocardiographic characteristics. However, differences in the underlying substrate, clinical presentation, electrocardiographic appearance,
and subsequent therapy of many pediatric arrhythmias remain important.
This section describes some of the electrocardiographic differences between children
and adults that have direct bearing on age-appropriate electrocardiogram (ECG) interpretation.
Heatt Rate
One of the most elementary diagnoses made from the surface ECG is that of heart rate.
This simple interpretation can become a quagmire for the observer unaccustomed to the
developmental spectrum of normal heart rates seen in infants and children. The range of
“normal” heart rates varies as a function of age, presumably due to both postnatal adaptations to circulatory changes and the plasticity of cardiovascular control by the autonomic
nervous system (Table 5.1).
69
Page 77
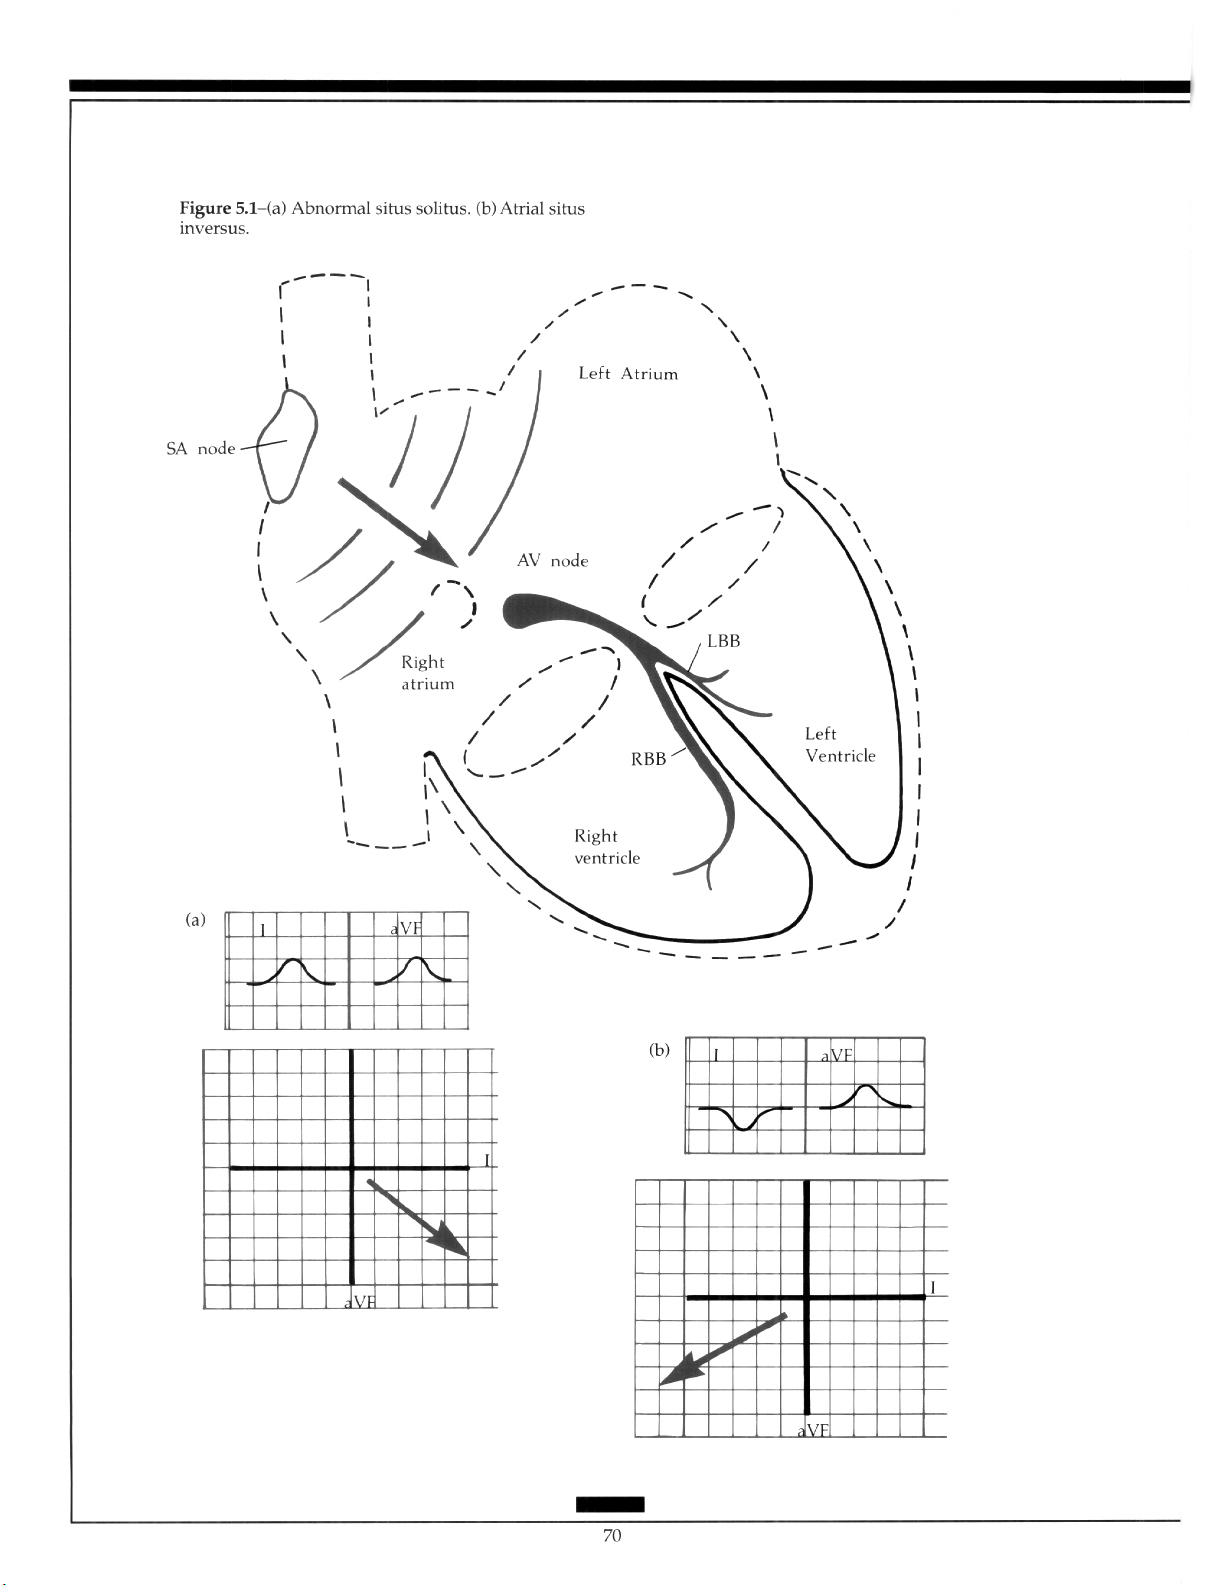
Page 78
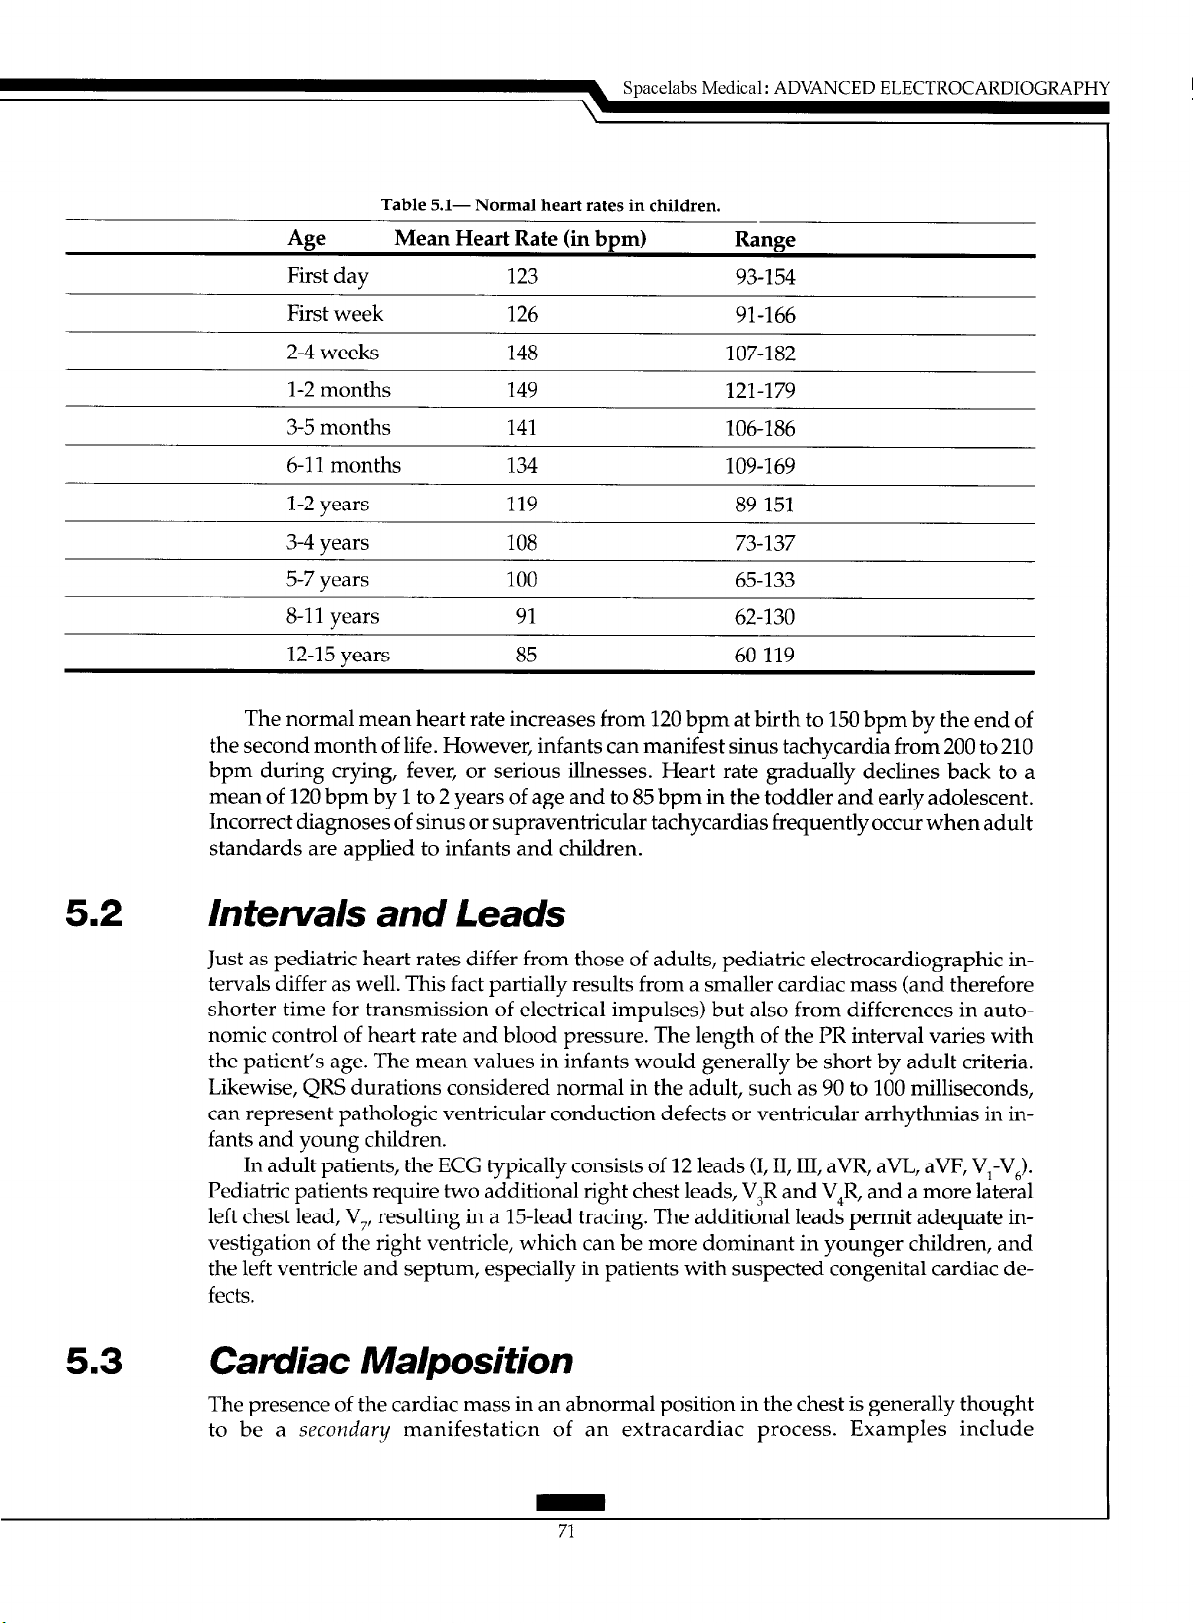
Table
5.1- Normal heart rates in children.
Spacelabs Medical :
ADVANCED
ELECTROCARDIOGRAPHY
49
First day
First week 126 91-166
2-4 weeks 148 107-182
l-2 months 149 121-179
3-5 months 141 106-186
6-l 1 months 134 109-169
l-2 years 119 89-151
3-4 years 108
5-7 years 100 65-133
8-11 years 91 62-l 30
12-15 years 85 60-119
The normal mean heart rate increases from 120 bpm at birth to 150 bpm by the end of
the second month of life. However, infants can manifest sinus tachycardia from 200 to 210
bpm during crying, fever, or serious illnesses. Heart rate gradually declines back to a
mean of 120 bpm by 1 to 2 years of age and to 85 bpm in the toddler and early adolescent.
Incorrect diagnoses of sinus or supraventricular tachycardias frequently occur when adult
standards are applied to infants and children.
Mean Heart Rate (in bpm) Range
123 93-154
73-137
5.2
5.3
Intervals and Leads
Just as pediatric heart rates differ from those of adults, pediatric electrocardiographic intervals differ as well. This fact partially results from a smaller cardiac mass (and therefore
shorter time for transmission of electrical impulses) but also from differences in autonomic control of heart rate and blood pressure. The length of the PR interval varies with
the patient’s age. The mean values in infants would generally be short by adult criteria.
Likewise, QRS durations considered normal in the adult, such as 90 to 100 milliseconds,
can represent pathologic ventricular conduction defects or ventricular arrhythmias in infants and young children.
In adult patients, the ECG typically consists of 12 leads (I, II, III, aVR, aVL, aVF, V,-V,).
Pediatric patients require two additional right chest leads, V3R and V,R, and a more lateral
left chest lead, V,, resulting in a 15-lead tracing. The additional leads permit adequate investigation of the right ventricle, which can be more dominant in younger children, and
the left ventricle and septum, especially in patients with suspected congenital cardiac defects.
Camliac Ma/position
The presence of the cardiac mass in an abnormal position in the chest is generally thought
to be a secondary manifestation of an extracardiac process. Examples include
Page 79
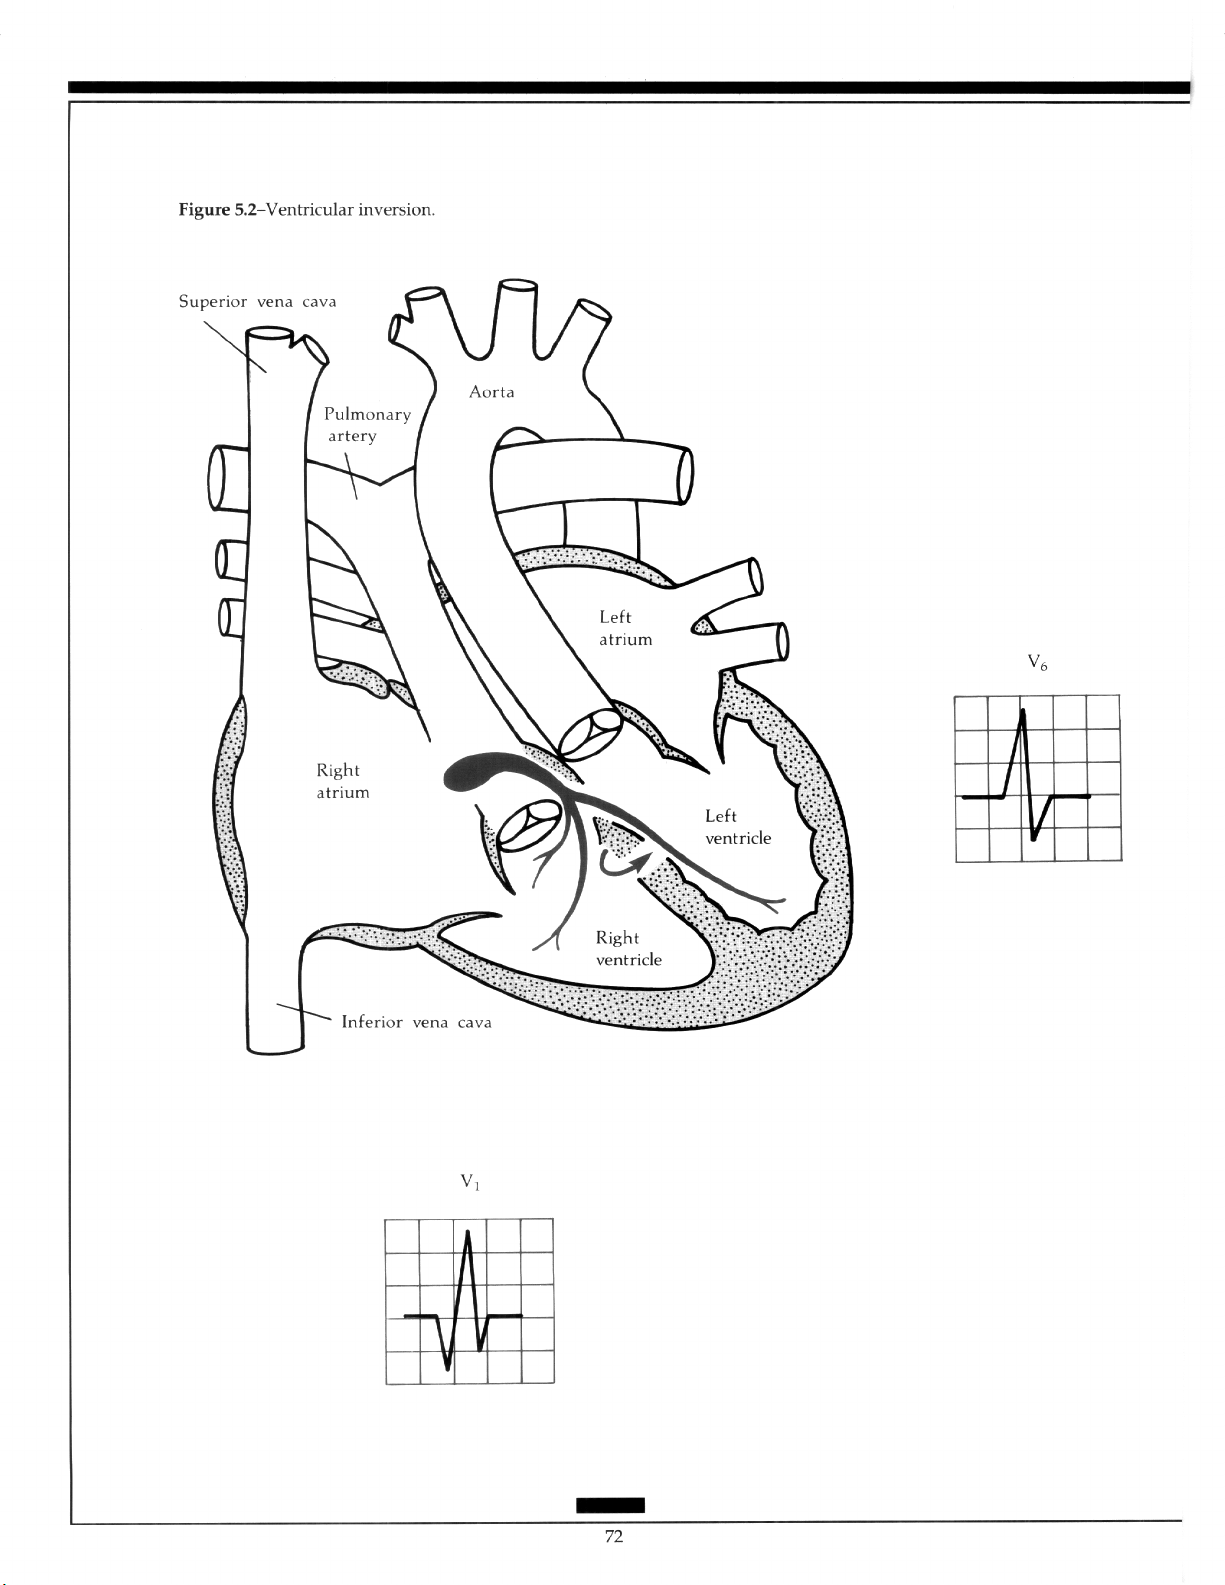
Page 80

Spacelabs Medical : ADVANCED
pneumothorax, pneumonectomy, pectus excavatum, kyphoscoliosis, and lung hypoplasia. Many forms of congenital cardiac defects also present with concomitant primary cardiac malpositions. These malpositions may involve the atria or ventricles, alone or in combination.
In most cases of abdominal situs solitus (the liver and inferior vena cava on the right
side, the spleen and abdominal aorta on the left), the atria are concordant and the normal
I’ wave vector reflects the spread of activation from the high right atrium to the left and
downward (Figure 5.la). However, when atria1 situs inversus occurs, the resulting P wave
is negative in lead I and positive in lead aVF (Figure 5.lb).
Several types of congenital cardiac defects may also be present with abnormalities of
ventricular position. With normal ventricular position, the bulk of the ventricular mass
consists of left ventricular myocardium and is located to the left and inferior. Again, agedependent changes occur in ventricular mass, especially in the neonatal period, that result
in differing R and S wave amplitudes in the precordial chest leads. The major cause is the
change from a relative hypertrophy of the newborn right ventricle in the first weeks of life
(reflecting in utero pressure volume relationships) to a dominant left ventricular mass.
The electrocardiographic definition of “dextrocardia” requires the presence of greater
voltage (R plus S) in the right chest leads V,R or V,R than the transitional chest leads V, or
V,. This results from the greater cardiac mass being located in the right side of the chest. A
recording of full right chest leads, V,R through V,R, should be made in this situation.
Other manifestations of ventricular malpositions include “reversed” septal depolarization with initial septal Q waves in the right chest leads and absent Q waves on the left.
The reversal can result from ventricular inversion, in which the morphologic left ventricle
lies on the right side receiving blood from the right atrium and pumping to the pulmonary artery. The right ventricle resides on the left, receiving blood from the left atrium and
emptying into the aorta (Figure 5.2). The condition is also called l-transposition of the
great arteries or “corrected” transposition. The conduction system “travels” with the ventricles, so septal depolarization proceeds from left ventricle to right ventricle, and from
right to left on the surface ECG. The septal Q wave therefore is noted in the right
precordial leads.
ELECTROCARDIOGRAPHY
5.4
Effects of Congenital Heart Defects
The entire spectrum of congenital malformations of the heart is too broad to review in this
section. The reader should consult several excellent textbooks on the subject.8°-82 However,
notable examples of structural congenital heart defects result in specific electrocardiographic abnormalities that warrant discussion.
Structural congenital heart defects can occur in an abundance or paucity of cardiac
mass. In the newborn infant, several specific ECG findings can point toward specific diagnoses. For example, many defects can result in a relative underdevelopment of the left
ventricle in utero (hypoplastic left heart syndrome)(Figure 5.3a). The ECG then shows a
paucity of left-sided ventricular forces. Leftward deviation of the frontal plane QRS axis
(0 to -90°) in a newborn with Down’s syndrome highly suggests the presence of an atrioventricular septal defect (AV canal defect). Left axis deviation in an infant with cyanosis
can indicate the presence of tricuspid atresia (Figure 5.3b). In this condition, left axis deviation in AV canal defect can develop from elongation of fibers of the left anterior fascicle or
shortening of the left posterior fascicle. Left axis in tricuspid atresia may be due to hypertrophy of the basal portion of the left ventricle.
73
Page 81
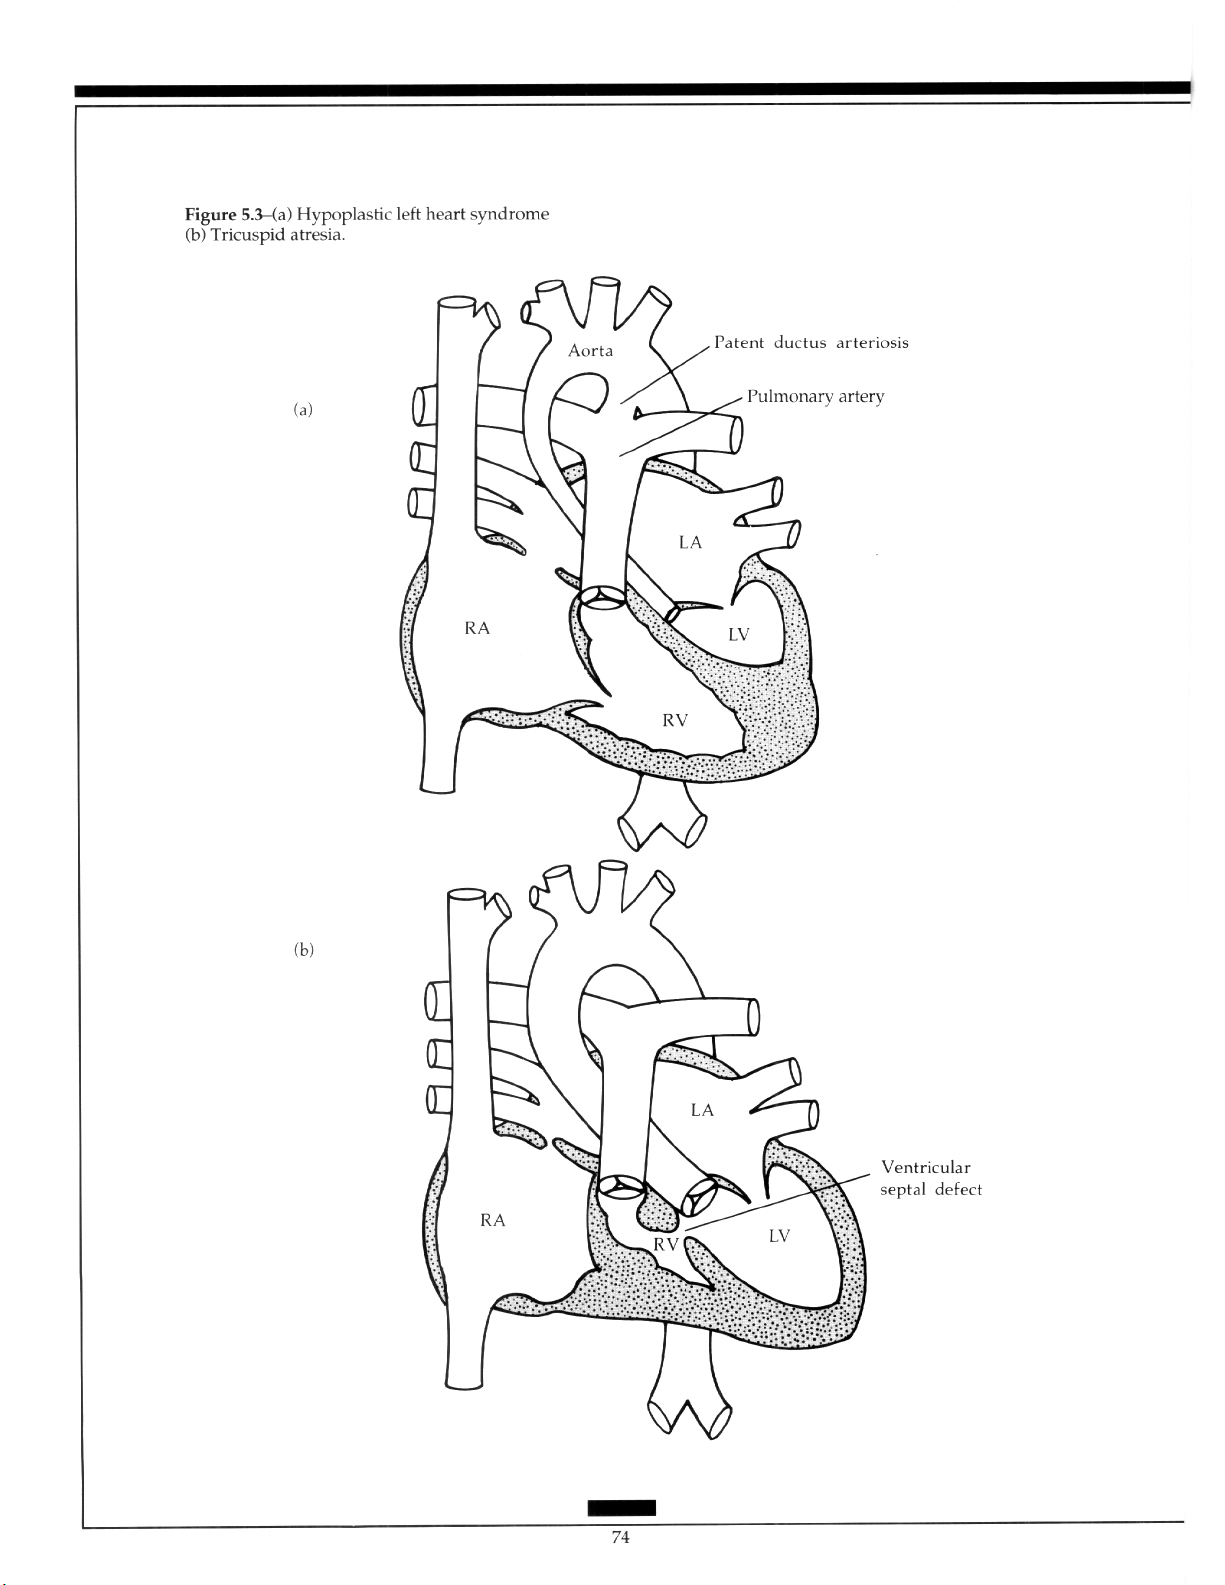
Page 82

5.5 Pediatric Arrhythmias
5.5.1 Fetal Arrhythmias
The diagnosis and management of fetal cardiac arrhythmias is a relatively new area in pediatric cardiology. Currently, diagnosis of fetal arrhythmias is done using fetal Doppler
echocardiography, rather than true fetal electrocardiographic interpretation.*” The ability
to diagnose fetal arrhythmias depends on two essential points: determination of cardiac
rate and analysis of rhythm. Doppler echocardiography can yield fetal ventricular inflow
and outflow velocity patterns which imply atria1 and ventricular contraction, respectively.
Interval analysis of these flow patterns is then used to deduce the underlying atria1 and
ventricular relationships during tachycardia and arrive at an assumed “electrocardiographic” diagnosis. Obtaining simultaneous flow patterns is often difficult and diagnosis
becomes one of making the ‘best guess”.
Fetal bradycardia generally is defined as a rate below 100 bpm and tachycardia as a
rate consistently above 220 bpm. Other echocardiographic findings helpful in determining
the severity of fetal arrhythmias include pericardial effusion, chamber dilation, hypertrophy, prolonged periods of bradycardia, and other evidence of hydrops that reflect inutero congestive heart failure (for example, ascites, scalp edema, and decreased fetal
movement).
Obviously, one would rather obtain a direct fetal cardiac electrical signal to diagnose
fetal arrhythmias. The problems in this area are many, predominantly due to the small
amplitude of fetal cardiac electrical potentials and fetal position and movement.84,85 The
maternal cardiac signal can be eliminated by means of blanking or subtraction. Filtering of
the overall signal to eliminate unwanted noise can distort the lower amplitude and low
frequency components of the fetal signal as well, so the end result,is suboptimal. Further
research is required to make fetal electrocardiography a practical and applicable tool for
the pediatric cardiologist.
Using fetal Doppler echocardiography, one can reliably diagnose premature atria1 and
ventricular contractions, atria1 flutter/atria1 tachycardia, complete atrioventricular block,
supraventricular tachycardia with a 1:l atria1 ventricular relationship, and junctional/ventricular tachycardia. Although interval measurements can discriminate between accessory
pathway tachycardias and atrioventricular node reentry tachycardia, a precise determination of the mechanism of the many types of supraventricular tachycardias is not possible
using Doppler alone.
Spacelabs Medical : ADVANCED ELECTROCARDIOGRAPHY
5.5.2 Chaotic Atrial Tachycardia
Chaotic atria1 tachycardia in an infantile arrhythmia that, when manifested, exhibits atria1
rates in the range from 200 to 500 bpm (Figure 5.4). Multiple I’ wave morphologies and the
rhythm can appear as atria1 ectopic tachycardia, rapid atrial flutter, and atria1 fibrillation
all in the same patient. High-grade atrioventricular block is a frequent finding, but ventric-
ular rates can still be very fast. The arrhythmia appears to be a transient phenomenon,
disappearing by 18months of age in the majority of patients. Though difficult to treat, class
IC antiarrhythmic agents appear to be most efficacious.
the arrhythmia are unknown, but it may be secondary to an “atria1 myocarditis” or due to
changes in the ability of atria1 muscle to initiate and maintain rapid tachyarrhythmias at
75
86,87 The cause and mechanism of
Page 83

Page 84

Figure [i&Congenital complete atrioventricular
block with a narrow QRS (junctional rhythm).
Page 85

Page 86

Spacelabs Medical: ADVANCED ELECTROCARDIOGRAPHY
various stages of development. The ECG manifestations of chaotic atria1 tachycardia blur
the distinctions between classic notions of automatic, triggered, macro-reentrant and
micro-reentrant arrhythmias.
55.3 Bradycardia in the Newborn
The diagnosis of sinus bradycardia is age dependent. The newborn with a heart rate of 70
or 80 bpm may have sinus bradycardia, whereas this is a perfectly acceptable heart rate for
an adult. As a rough guide, potentially significant bradycardia consists of less than 70
bpm for an infant, less than 50 bpm for a child, and less than 40 bpm for an adolescent.
The P waves should have the standard frontal plane axis of 0 to 90” to infer a sinus mechanism (assuming a normal heart).
Bradycardia in the newborn nursery is a frequent cause of concern. The most common
cause is blocked premature atria1 contractions (PACs). A careful inspection for I’ waves
“hidden” in the T waves often is necessary and requires a full 15-lead ECG (Figure 5.5).
Bedside monitor strips are inadequate for appropriate diagnosis. The overwhelming ma-
jority of blocked PACs resolve without therapy or symptoms.
Congenital complete AV block (CCAVB) consists of independent atial and ventricular
rhythms (Figure 5.6). Up to 20% of patients with this rhythm also have prolongation of the
corrected QT interval and can have a higher risk of sudden death.88 In approximately one
third of cases of CCAVB, an underlying congenital cardiac malformation exists, such as ltransposition of the great arteries, “single ventricle”,
pid atresia and coarctation. In the infant with a normal heart, a relationship can occur
between CCAVB and overt maternal collagen vascular disease (lupus erythematosus) or
positive serum assays for maternal antibodies (anti-Rho).
presence of these antibodies in AV node tissue and disruption of the AV node-bundle of His
region have been found.
As stated earlier, CCAVB can be diagnosed in the fetus. Ventricular rates with
CCAVB vary from one patient to the next and in individuals, depending on autonomic
tone. Escape rates can be junctional or ventricular. Generally, ventricular rates under 50
bpm in an infant necessitate placement of an epicardial pacing system. Some stressed infants require pacing despite more rapid ventricular rates (55 to 60 bpm). Pacing for the fe-
tus with CCAVB may be necessary because of hydrops and either prematurity or too
great a risk of delivery. Investigations are underway to develop a maternal
transabdominal fetal epicardial pacing system.
Careful measurement of the corrected QT interval (QTc = QT /RR) must be made in
the infant with sinus bradycardia, since bradycardia is a frequent finding in newborns
with long QT syndrome (Figure 5.7). Additionally, a 2:l AV block may be present. Patients
with long QT syndrome are at risk for ventricular tachycardia, ventricular fibrillation, and
torsade de pointes (Figure 5.8).
atrioventricular septal defects, tricus-
89Histochemical evidence for the
Page 87

Page 88

Spacelabs Medical : ADVANCED ELECTROCARDIOGRAPHY
5.5.4 Developmental Aspects of Wolff-ParkinsonWhite Syndrome and Supraventricular
Tachycardia
Supraventricular tachycardia (SVT) associated with an accessory connection is the most
common mechanism of SVT in childhood. Many reports suggest that Wolff-ParkinsonWhite syndrome (WI’W) and SVT disappear in the first year of life. Others report that SVT
recurs sometime later.
The clinical course of 140 patients with SVT and WPW was reviewed at Texas
Children’s Hospital?O
appeared in 93% by 8 months of age. In nearly one third of these 93%, it reappeared at an
average age of 8 years. If SVT occurred in a patient over the age of 5 years, it persisted in
more than 75%. The location of the accessory connection did not affect the recurrence rate.
Additionally, the age at recurrence was not affected by concomitant antiarrhythmic drug
therapy.
These findings lend credence to the notion that autonomic or hormonal changes in the
mechanisms of cardiovascular control affect the time course of SVT in young patients. The
mean age of SVT recurrence is similar to that at which the symptom complex of mitral
valve prolapse first appears, vasodepressor syncope begins to emerge, and T waves invert
in the right precordial leads.
Among patients whose SVT appeared at 0 to 2 months of age, it dis-
5.5.5 Junctional Ectopic Tachycardia
Junctional ectopic tachycardia (JET) can be either congenital or acquired following surgery
for congenital heart defects. Mortality rates for congenital JET are very high (approximately 33%) despite aggressive therapy.91 The surface ECG usually is characteristic: rapid,
narrow QRS complexes at 150 to 400 bpm with atrioventricular dissociation. However,
JET can also manifest “exit block” with sudden 1:l conduction and rates greater than 300
bpm (Figure 5.9). If occasional sinus beats occur, the surface QRS morphology should be
similar to that seen during tachycardia, otherwise a diagnosis of ventricular tachycardia is
made.
The underlying mechanism of JETremains unclear, but appears to involve abnormal
automaticity. The therapy of congenital JET is controversial. High dose amiodarone, class
IC antiarrhythmic drugs, and pacing have been used with varying success. Intravenous
amiodarone has also proven effective.
5.5.6 Permanent Junctional Reciprocating Tachycardia
Permanent junctional reciprocating tachycardia (PJRT) is an incessant SVT found in
young children. 92-94 As its name implies, it does not disappear with age. The ECG during
PJRT shows a long R-P tachyarrhythmia with characteristic deep and inverted P waves in
leads II, III, aVF, and the left precordial leads V,-V, (Figure 5.10). The rate of PJRT varies
through the day and with activity, but is generally in the range of 150 to 180 bpm. The
PJRT results in a secondary cardiomyopathy.
Although the ECG manifestation of PJRT is quite remarkable, four other tachyar-
rhythmias can have a similar appearance: a low atria1 ectopic tachycardia, “atypical” (fast-
81
Page 89
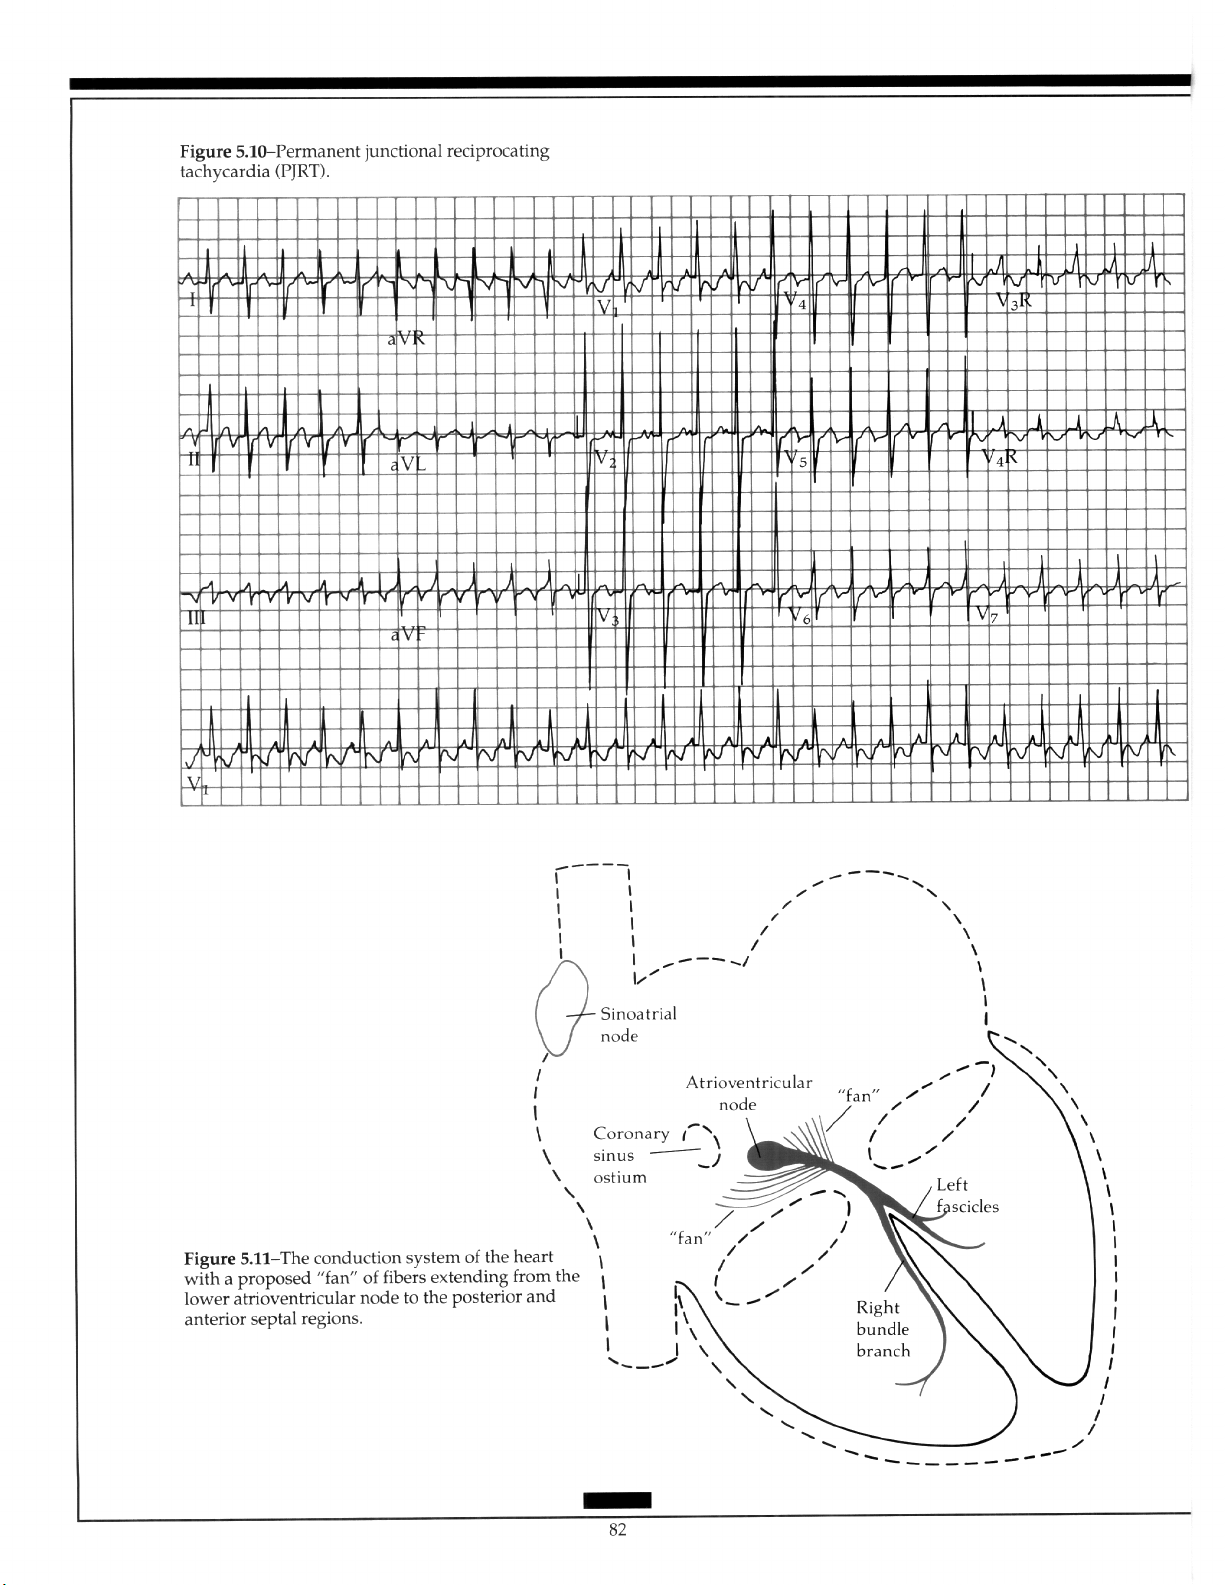
Page 90
slow) atrioventricular node re-entry tachycardia, atria1 flutter with 2:l AV conduction,
and SVT using a slowly conducting retrograde pathway in the right anterior region of the
heart.
Electrophysiologic studies and operative mapping techniques have localized the atria1
insertion point of the retrograde fiber to the mouth of the coronary sinus. Pathology examinations have revealed a serpiginous fiber in this region in one patient.‘” The actual
mechanism of tachycardia may involve a spectrum of SVTs from “atypical” AV node reentry to PJRT due to a “fan” of fibers with variable retrograde conduction spanning the
posterior septal-AV node area (Figure 5.11). The tachycardia responds to Class IC
antiarrhythmic drugs, operative therapy (cryoablation of the retrograde limb) or, more recently, transcatheter radio frequency ablation.8h,9s,9h
5.5.7 Ventricular Tachycardia
Infant VT is a rare condition and is most often associated with ventricular hamartomas.“7
The VT in infants can present, disturbingly, as a very rapid rhythm with a narrow QRS of
80 to 100 milliseconds (Figure 5.12). The diagnosis depends on demonstration of a different QRS complex during sinus beats on the 15-lead ECG. The most common picture is one
of a right bundle branch block pattern with left-axis deviation associated with a tumor
(hamartoma or Purkinje cell tumor) in the posterior left ventricle.‘*
The child with a congenital heart defect has a very good chance of not only surviving
initial cardiac repair of the defect, but of having an excellent hemodynamic result. As
these children grow, however, many develop late postoperative arrhythmias and an appreciable incidence of late sudden death results following repair of particular lesions.98-101
Speculation has pointed toward the development of myocardial scars (both atria1 and
ventricular) to account for the substrate of tachycardia. Lesions prone to late postoperative
arrhythmia include tetralogy of Fallot, double outlet right ventricle, ventricular septal defect, aortic valve stenosis, transposition of the great arteries, and Ebstein’s malformation of
the tricuspid valve.
The mechanisms underlying postoperative arrhythmias are unknown. However, triggered ectopy may initiate the sustained re-entrant arrhythmias. The underlying scar can
provide the necessary myocardial inhomogeneity with autonomic changes around the
time of adolescence contributing as well.
Spacelabs Medical : ADVANCED ELECTROCARDIOGRAPHY
5.58 Permanent Pacing Systems in Children
A complete discussion of pediatric issues in cardiac pacing is beyond the scope of this
section. References are provided for the interested reader. io2-io4 However, several important points can be made.
The first issue is that of life-long pacing. In adults, the placing of a permanent pacing
system considers an average additional 20 years of life expectancy. In children, the requirements for adequate cardiac pacing can span more than 50 to 60 years. Therefore, generator
battery life (and how to prolong it as much as possible), the effects of growth on lead
position, the ability to remove and replace leads after several years use, reuse of pacemaker
pockets and venous access, size of both generators and leads in smaller patients, and the
changing heart rate requirements during normal growth and development must be considered. The indications for implanting permanent pacing systems therefore cannot be
simple extensions of those formulated for adult patients.
83
Page 91
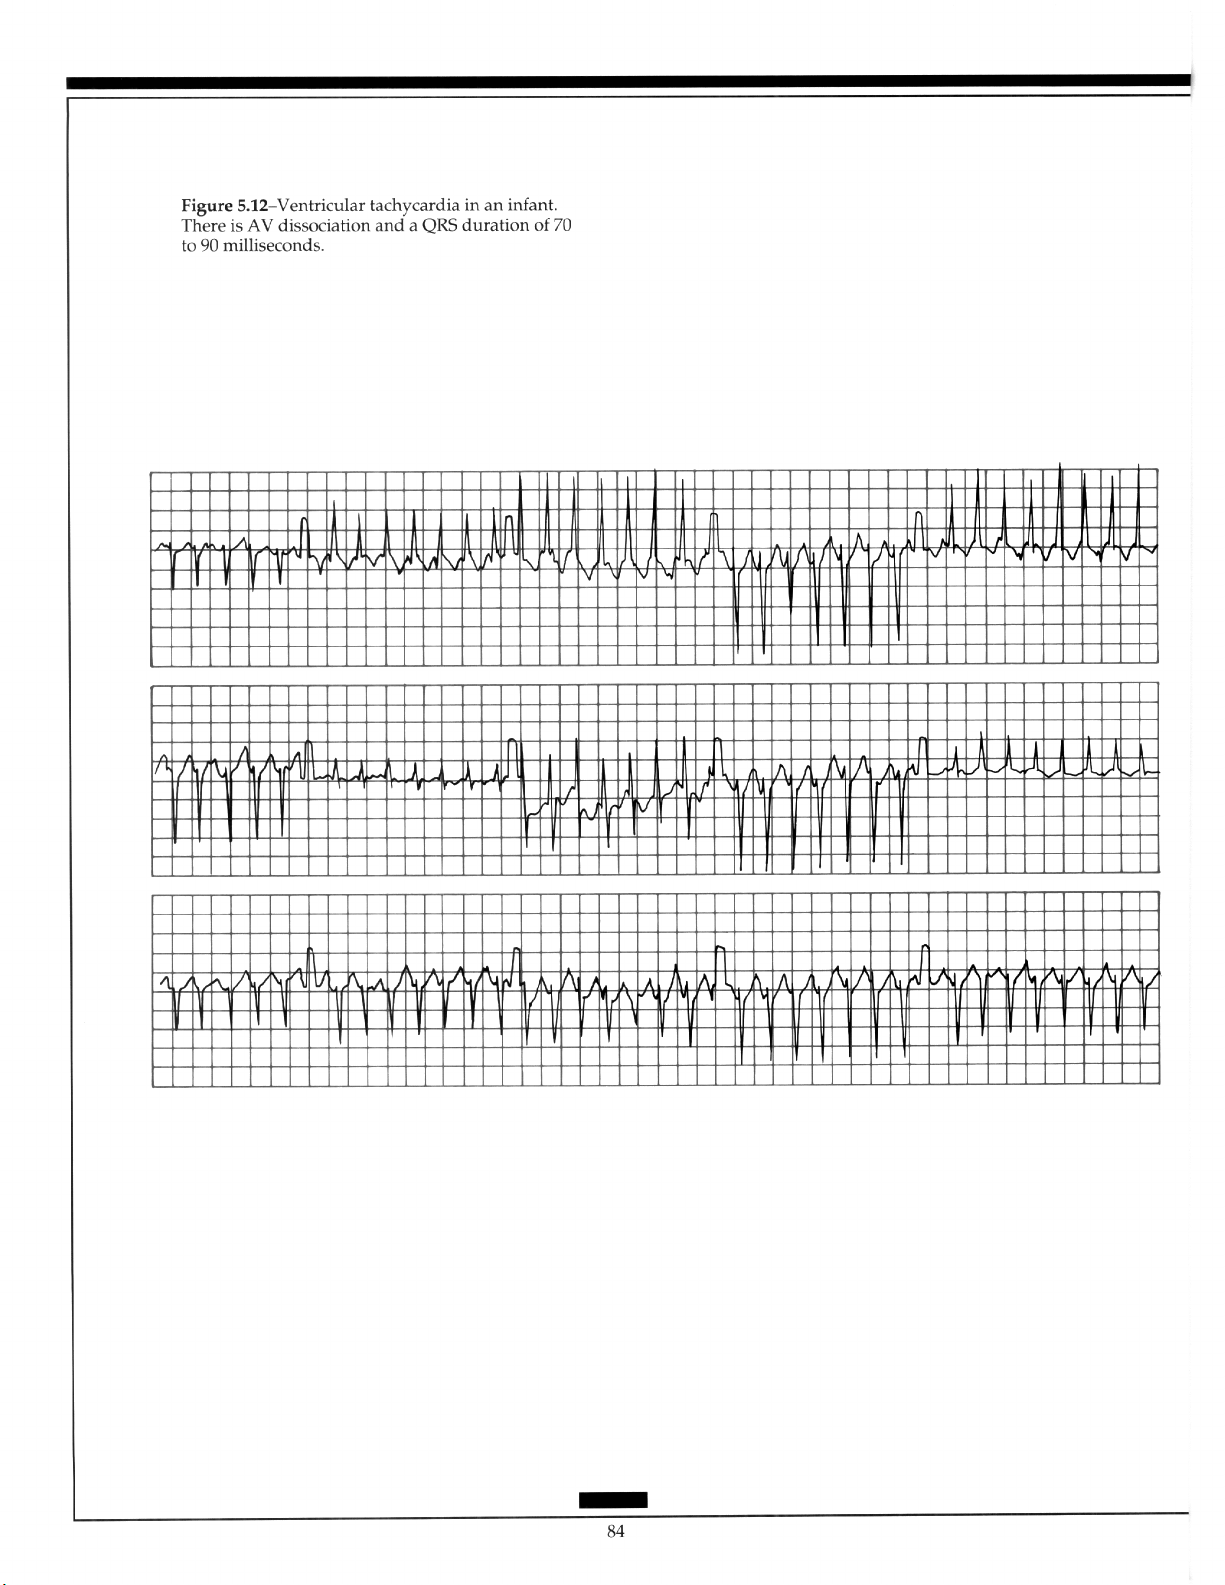
Page 92

Spacelabs Medical : ADVANCED ELECTROCARDIOGRAPHY
5.6 Pediatric Electmphysiology Studies
Biplane fluoroscopy is essential to performing pediatric electrophysiologic (EP) studies
safely. The infant or child’s heart is dramatically smaller than that of an adult and very
slight manipulation of an intracardiac catheter can result in large catheter position
changes and potential cardiac perforation. Biplane fluoroscopy allows instantaneous localization of the catheter tip and safe movement within the heart and vessels.
Sedation is an additional consideration. Even adolescents typically cannot remain still
for adequate intracardiac electrogram recording and smaller children often require heavy
sedation. The effect of sedative agents on the desired EP measurements must be taken into
account, since conduction and recovery times can be altered significantly. The continuous
measurement of the blood pressure is an important part of pediatric EP studies. Small
children can develop significant hypotension during induction of tachyarrhythmias.
Manipulation of electrode catheters within the heart requires training in pediatric electrophysiology. Special catheters for pediatric EP studies generally are 5 or 6 French diameter with electrodes spaced 2 or 5 mm apart. Size 4 French catheters often are used in in-
fants.
Since mapping of left-heart structures occasionally becomes imperative for investiga-
tion of atria1 ectopic tachycardias and VTs (beyond a simple coronary sinus approach),
use of the transseptal technique is helpful, especially in children. Mapping of these areas
in adults generally occurs by a retrograde arterial approach. This approach is neither safe
nor practical in children, due to the smaller caliber of the femoral artery and the greatly
increased potential for postcatheterization arterial complications. The transseptal approach allows access to the left atrium and left ventricle without damage to the femoral
artery. The use of a “steerable” El? catheter generally permits extensive left-heart mapping
from this approach.
The indications for pediatric El’ study vary from institution to institution.lo5 Those
currently used at Children’s Hospital San Diego are shown in Table 5.2. With the development of radio frequency techniques for the elimination of tachyarrhythmias, these indications are changing rapidly.
Page 93
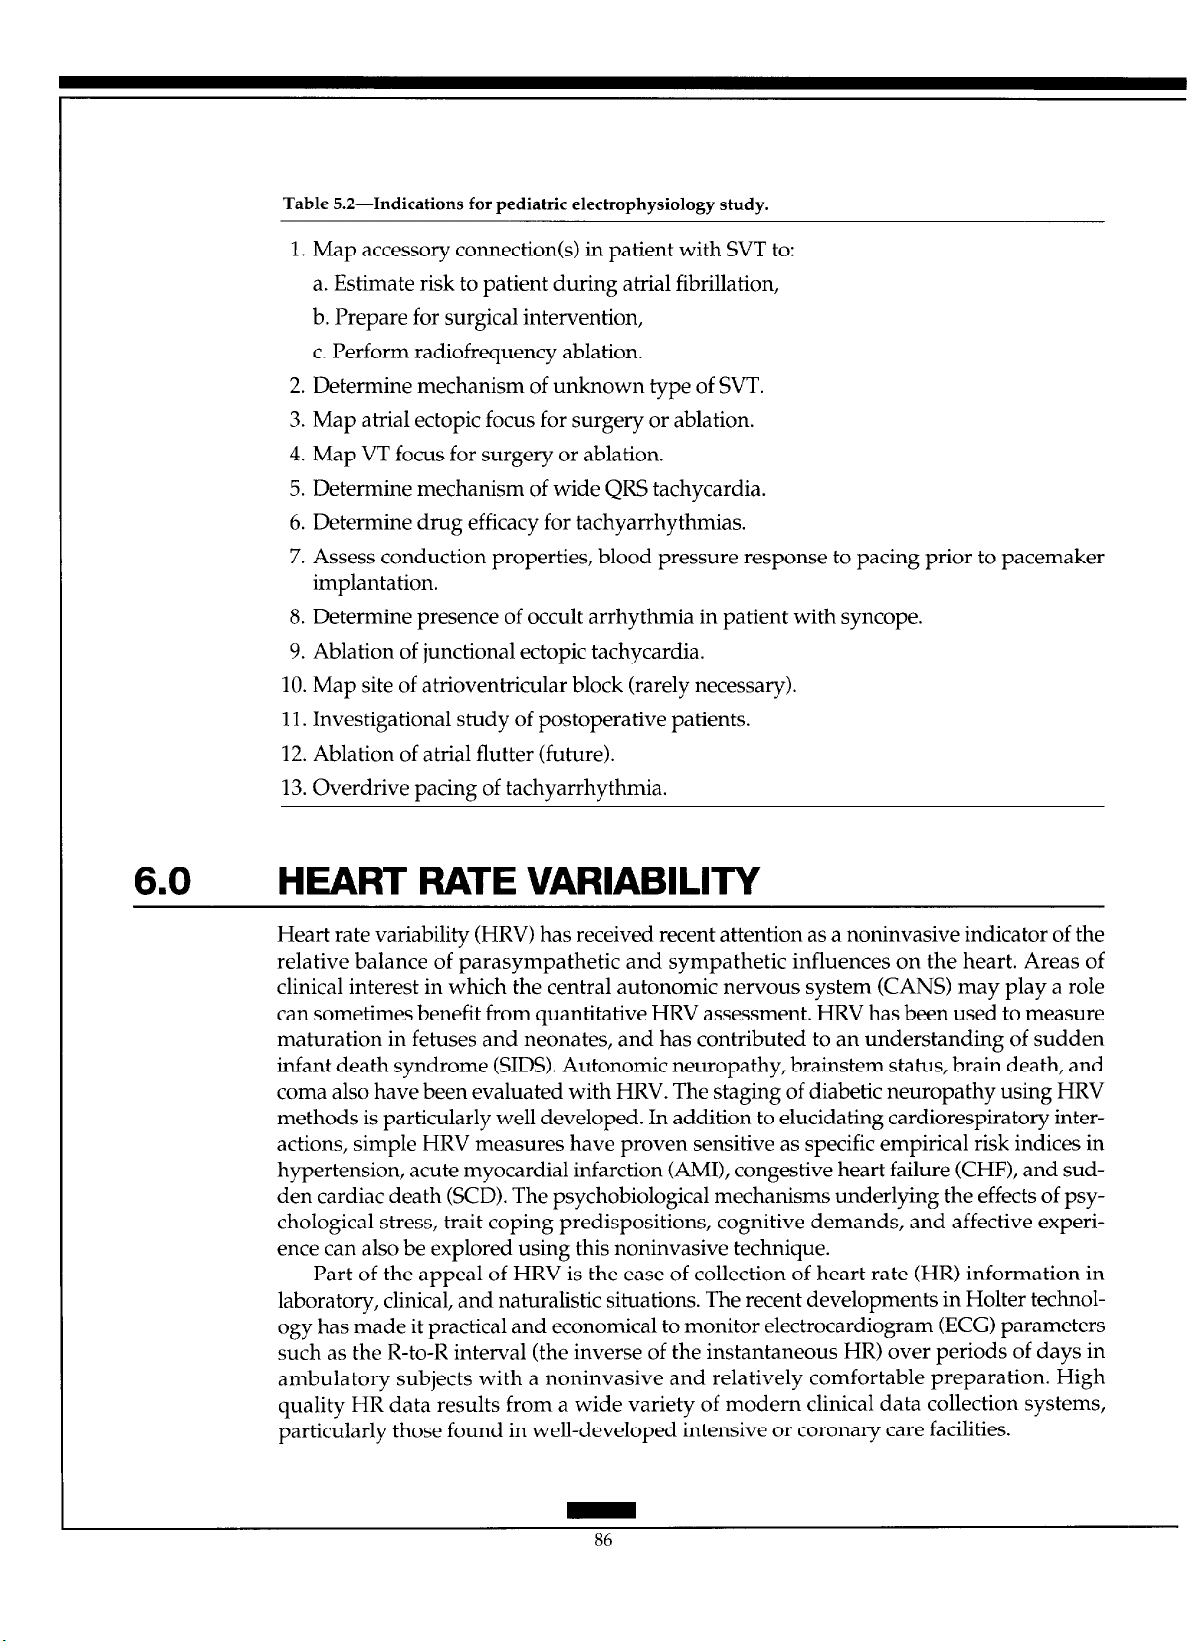
Table 5.2-Indications for pediatric electrophysiology study.
1. Map accessory connection(s) in patient with SVT to:
a. Estimate risk to patient during atria1 fibrillation,
b. Prepare for surgical intervention,
c. Perform radiofrequency ablation.
2. Determine mechanism of unknown type of WT.
3. Map atria1 ectopic focus for surgery or ablation.
4. Map VT focus for surgery or ablation.
5. Determine mechanism of wide QRS tachycardia.
6. Determine drug efficacy for tachyarrhythmias.
7. Assess conduction properties, blood pressure response to pacing prior to pacemaker
implantation.
8. Determine presence of occult arrhythmia in patient with syncope.
9. Ablation of junctional ectopic tachycardia.
10. Map site of atrioventricular block (rarely necessary).
11. Investigational study of postoperative patients.
12. Ablation of atria1 flutter (future).
13. Overdrive pacing of tachyarrhythmia.
6.0
HEART RATE VARIABILITY
Heart rate variability (HRV) has received recent attention as a noninvasive indicator of the
relative balance of parasympathetic and sympathetic influences on the heart. Areas of
clinical interest in which the central autonomic nervous system (CANS) may play a role
can sometimes benefit from quantitative HRV assessment. HRV has been used to measure
maturation in fetuses and neonates, and has contributed to an understanding of sudden
infant death syndrome (SIDS). Autonomic neuropathy, brainstem status, brain death, and
coma also have been evaluated with HRV. The staging of diabetic neuropathy using HRV
methods is particularly well developed. In addition to elucidating cardiorespiratory interactions, simple HRV measures have proven sensitive as specific empirical risk indices in
hypertension, acute myocardial infarction (AMI), congestive heart failure (CHF), and sudden cardiac death (SCD). The psychobiological mechanisms underlying the effects of psychological stress, trait coping predispositions, cognitive demands, and affective experience can also be explored using this noninvasive technique.
Part of the appeal of HRV is the ease of collection of heart rate (HR) information in
laboratory, clinical, and naturalistic situations. The recent developments in Holter technology has made it practical and economical to monitor electrocardiogram (ECG) parameters
such as the R-to-R interval (the inverse of the instantaneous HR) over periods of days in
ambulatory subjects with a noninvasive and relatively comfortable preparation. High
quality HR data results from a wide variety of modern clinical data collection systems,
particularly those found in well-developed intensive or coronary care facilities.
86
Page 94

Spacelabs Medical: ADVANCED ELECTROCARDIOGRAPHY
The term “arrhythmia” often carries negative connotations, and indeed many serious
disturbances of heart rhythm and waveform morphology are so labeled. However, the
novice clinician soon learns that some arrhythmias are normal in healthy subjects. In fact,
a moderate amount of respiratory sinus arrhythmia (RSA) is viewed as evidence of good
cardiovascular health. An RSA is a particular patterned sequence of changes in heart
interbeat interval that is coupled in a complex way to respiratory behavior. The coupling
is mediated by central autonomic neural mechanisms of theoretical and clinical interest.
Physiology textbooks, emphasizing principles of homeostasis, often imply that a wellregulated system is always one with minimal variation, and that fluctuations in HR, particularly when metabolic demand appears constant, are undesirable. However, regulating
HR at a precise constant value may be less beneficial than maintaining tight control of
blood pressure. Also, maintaining the capacity for responsive control of blood pressure to
body areas critical for life under the most adverse metabolic, vasostatic, and psychologic
conditions appears more adaptive. HR is an intervening variable in homeostatic control
loops in the body, its general regulation an incidental consequence of more pervasive optimization criteria.
At the most basic level, HRV is the beat-by-beat change in the length of each heart
interbeat interval. Statistical characterization of HRV ranges from measures of distributional spread like the familiar standard deviation to the cutting edge of methods research
in nonstationary multivariate time-series analysis. Under ideal conditions, time series and
power spectral analyses of the R-to-R interval sequence allow the fractionation of the effects of sympathetic and parasympathetic influences on the heart rhythm. These analyses
effectively identify and quantify RSA, a mode of variability considered almost purely
parasympathetic in origin. The HR signal is very sensitive to perturbation from many biological and psychological sources. Statistical properties of the dynamic state of the HR
may provide noninvasive indices of central autonomic function, a theoretically important,
but generally difficult, dimension in many comprehensive health science models.
This section reviews some of the better known measures for heart rhythm analysis
and discusses the practical issues associated with their implementation. Simple systems
models of the physiology of the innervation of the heart are introduced and the basic concepts of instantaneous heart period (HP) and HR are defined. Issues related to the choice
of HR or HP as the fundamental unit of analysis are explored, with the distinctions between time-weighted versus beat-weighted statistical summaries addressed. A variety of
HRV measures relevant to 24-hour ambulatory Holter ECG monitoring include variancebased measures, magnitude of change measures, and spectral analysis approaches. Four
types of spectral analysis exist, depending on the decision to analyze the HP data sequences in real time or in beat time and to use traditional nonparametric Fourier spectral
estimates or parametric autoregressive model-based spectral estimates.
The application of nonlinear dynamic systems analysis techniques to empirical HRV
data, including chaos theory approaches, is briefly discussed. The most serious problem in
HRV analysis may relate to the identification, labeling, and appropriate treatment of
nonsinus beats. A number of other issues regarding the validity and comparability of
HRV measures in realistic clinical settings are also described.
Page 95
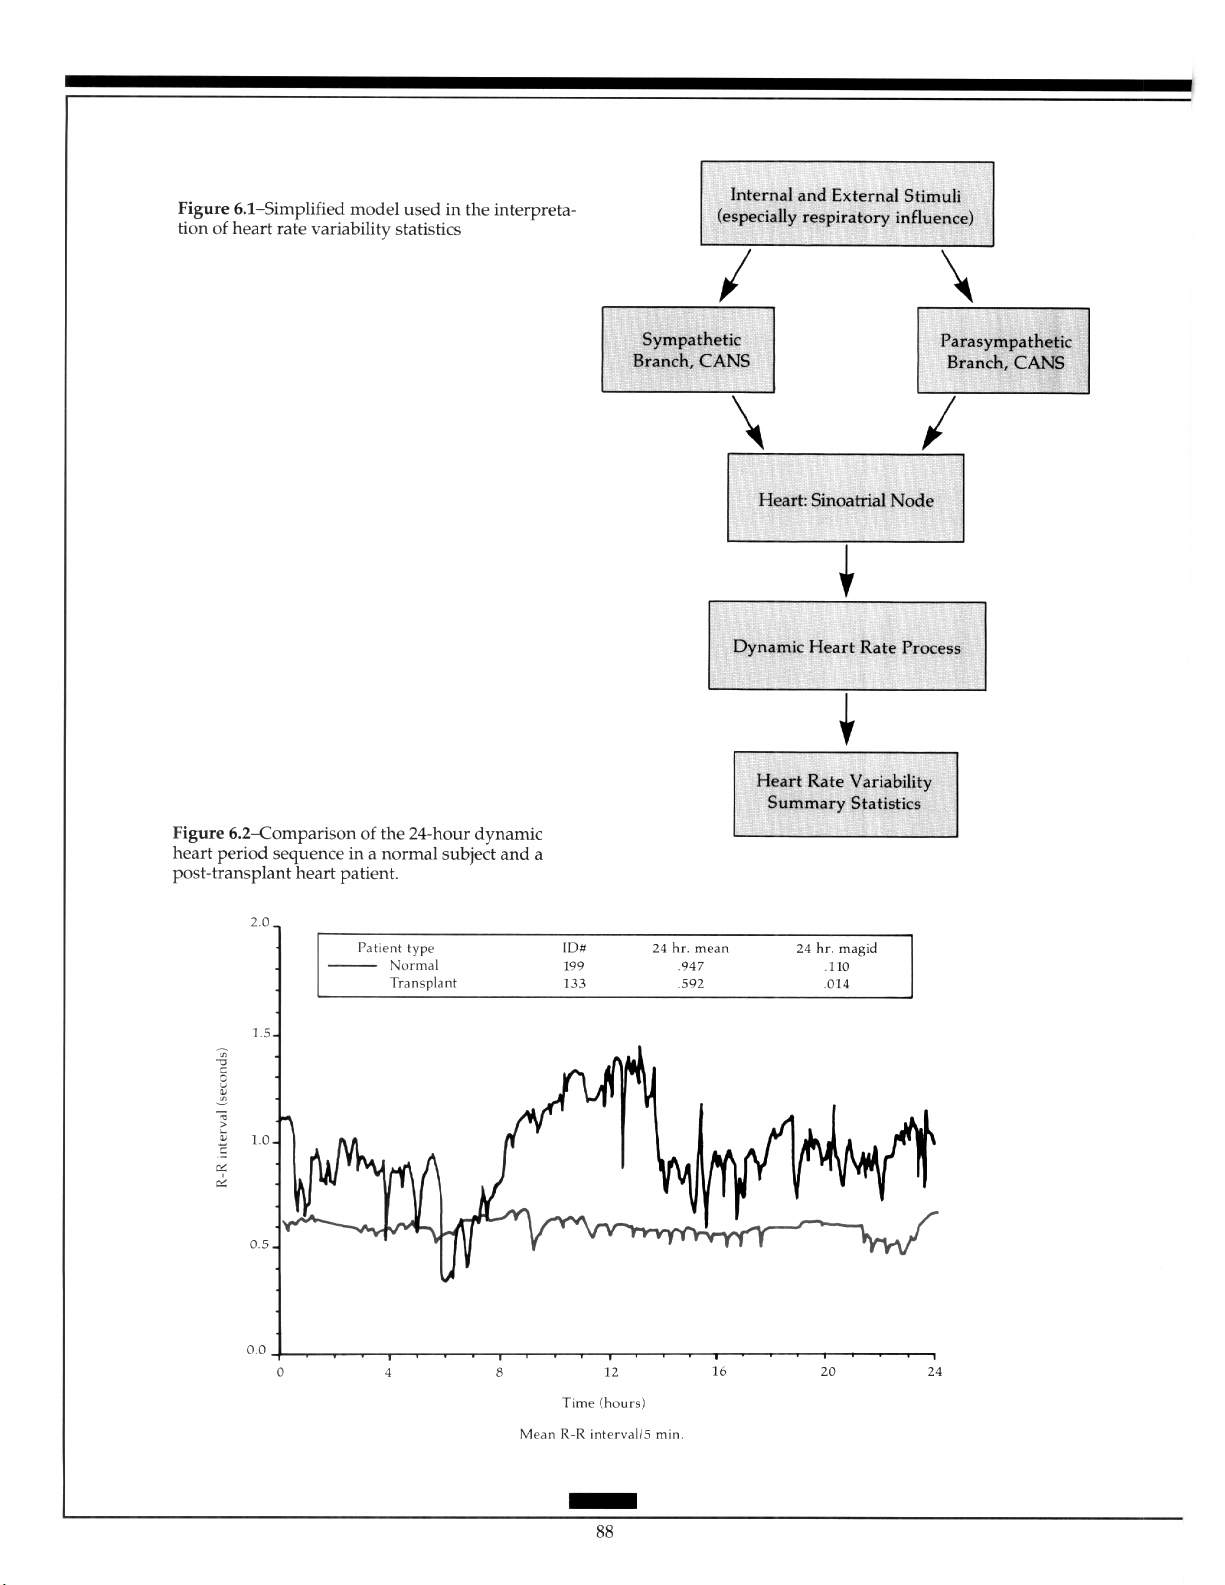
Page 96

Spacelabs Medical: ADVANCED ELECTROCARDIOGRAPHY
6.1
Physiologic Models for Heart Rate
Variability Analysis
Interpretation of HRV studies is based on a simple model of the initiation of the heart beat.
It assumes that dynamic variations in the “normal” beats represent the influence of exogenous and endogenous stimuli on the sinoatrial node, as mediated by the CANS. The statistics of normal heart rhythm can then serve as an indirect indicator of modulation of the
inputs to the CANS, the gross function of the CANS itself, or a combination of the two.
The model is used to interpret the spectral analysis-based HRV measures because it describes the independent influence on the sinoatrial node of the anatomically distinct sympathetic and parasympathetic branches of the CANS (Figure 6.1). The relative balance of
these autonomic mediators is of theoretical interest in clinical cardiology.
Since the impinging neural sources of variation and CANS transfer characteristics cannot be independently isolated with current noninvasive techniques, careful experimental
controls or averaging heuristics must be employed to make separate inferences about
these domains from the observable heart rhythm data. However, significant perturbation
of the stimuli field or neural function can be easily interpreted. For example, phasic psychological stressors and diabetic neuropathy are associated with consistent heart rhythm
modifications. Figure 6.2 illustrates the radical extremes of CANS control of the heart, contrasting the large-scale HR variation of the normal subject with the rigidity of the heart
rhythm of the post-heart transplant patient.
The model glosses over many details, including the specialized structure of the CANS,
interactions with the broader autonomic nervous system, and its influence on the periphery, basic cardiac mechanics of preload and after-load, blood pressure, temperature, respiration, acid-base balance, state of oxygenation, ventilation, physical activity, psychosocial
context, and normally mediated facilitating mechanisms. The model implies that a large
portion of the endogenous variations result from feedback control mechanisms (e.g.,
blood pressure control) in which the CANS and/or the heart rhythm are active partici-
pants. Because of the integration of many essential body functions in the CANS, and of the
critical role of the heart in the maintenance of circulatory function, most homeostatic processes influence, and are influenced by, cardiac rhythm properties.
6.2
Heart Rate Definition Problems
One of the issues in HRV studies is the operational definition of the instantaneous HR, or
the instantaneous HP. HR is conventionally given in beats per minute (bpm), a unit that
evokes the image of the clinical behavior of sampling HR by actually counting the number
of heart beats within a l-minute interval. Clinicians often shorten the observation window
from 60 seconds to 15 seconds and then multiply the counted beats by a factor of four to
estimate the desired quantity, sacrificing precision for speed. Thus, the traditional clinical
definition of HR is a count of events per unit time, with the events typically on the order of
a second apart. A number of problems occur with defining instantaneous HR as a limiting
condition of the traditional clinical concept. The idea of an instantaneous rate, continuously defined at every point in time, appears logically inconsistent. Even if definable, it
remains essentially unknowable in the sense of being impossible to infer from measured
data.
89
Page 97

Page 98

Spacelabs Medical: ADVANCED ELECTROCARDIOGRAPHY
Practically, the instantaneous HR must be defined from a series of discrete events corresponding to the beating of the heart. This discrete event series itself is usually derived
from fiducial features of the raw ECG waveform or pulse plethysmography local blood
volume waveform. The former source provides a more detailed chronology of the
microevents of the heart beat. The arrival time of a beat, and time interval from the last
beat supply somewhat irregularly spaced information about short-term fluctuations in
heart rhythm.
The use of HRV measures in research usually relates to theoretical models about autonomic control of the heart and its influence on the timing of the initiation of depolarization. Thus, most researchers base the definition of the interbeat interval (IBI) on the distance between adjacent P waves to reflect as closely as possible the statistics of the firing of
the sinoatrial pacemaker node (Figure 6.3a). However, the P-to-P interval is much more
difficult to empirically define than the R-to-R interval, particularly from noisy low-frequency Holter recordings of ambulatory subjects (Figure 6.3b). Most HRV studies, and essentially all those done using ambulatory ECG monitoring technology, employ the R-to-R
interval as the fundamental metric.
The R-to-R intervals decoded from the actual ECG can be put into a beat length sequence in which the continuous length of each cardiac cycle is an interval measure, indexed by the integer beat sequence number. Each R-to-R interval can be inverted to a beatspecific equivalent HR, which can represent the equivalent rate that would have been observed if all the heart beats in a 60-second period had exactly that length. A beat-oriented
data structure composed of a sequence of R-to-R intervals or instantaneous equivalent
HRs is the fundamental unit of analysis for many common HRV summary statistics (Figure 6.3~).
The beats are not evenly spaced in time, however. If the analysis requires association
with other real-time events in the body, such as respiration, the beat length vector may require an association with another vector to indicate exactly when in real-time each beat
occurred. Philosophical problems arise in deciding whether the length of the beat is associated with the timing of the R wave that initiated the beat interval, or of the R wave that
defined its end, or somewhere in between. The consequence of choosing the wrong end of
the interval is an HR-dependent phase shift between the interval (rate) sequence and
other real-time physiological states.
A continuous function can be defined at every point in time by interpolating a curve
through the unevenly spaced set of (time, interval) ordered pairs corresponding to each
beat. This function, while artificially constructed, satisfies some of the operational require-
ments for an instantaneous HP or HR signal (Figure 6.3d). The interpolated function can
be as simple as a sample-and-hold in which the value of the previous interval is held constant until the next R wave arrives, creating an unlikely discontinuous stair-step approximation. This definition of the time function often is built into the electronic circuitry of biomedical instrumentation for the generation of a recordable analog output signal corresponding to HR. A linear interpolation between beats uses straight line segments to connect the irregularly spaced samples. But the slope or derivative of the function remains
discontinuous at the points where the line segments intersect with different angles at the
observed data values. Although many higher order polynomial and trigonometric interpolations exist, a number of HRV researchers employ cubic splices, the basis for the algorithms used by most computer graphics packages to draw visually pleasing smooth
curves through data points. As discussed in a later section, evenly spaced time series of
91
Page 99

HP (rate) data are commonly resampled from these interpolated curves to use the readily
available time series modeling and spectral analysis software packages (Figure 6.3e).
Which to Use: Hearf Rate or Heart Period?
One of the first decisions a researcher studying HRV must make is to select the fundamen-
tal unit of measurement: instantaneous HP or instantaneous HR. Both are reciprocally defined and carry the same theoretical information when used as instantaneous measures.
But both can have very different statistical properties when aggregated within and across
subjects. Instantaneous HP is commonly measured in milliseconds, or thousandths of a
second, quantifying the temporal interval of the cardiac cycle. When derived from ECG
signals, the period is noted as the duration between repetition of features in the ECG
waveform, typically successive R waves. Instantaneous HR is measured in bpm and represents the equivalent bpm that would have been measured if that particular cardiac cycle
rate had been maintained exactly throughout a full 60-second period.
The mathematical representation of the one-to-one relationship between these quanti-
ties is given by the equations:
HR(beats / min) = bO(sec / min)x
HP(ms / beat) = bO(sec / min)x
While the relationship is a simple one, it is also nonlinear, which has stimulated a great
deal of discussion about the relative merits of the two measures. From the one-to-one
mapping through a slight nonlinearity, both measures carry the same information. However, at the level of practical science, some concerns about the distinctions exist. For example, if a researcher wishes to incorporate some measure of heart rhythm in a complex
theoretical linear model with a number of other biopsychosocial dimensions, an overt assumption is that all the model variables must bear a linear relationship to each other. But
if HR actually has linear relationships to the other variables in the model, then it is a mathematical tautology that HP cannot have linear relationships with the same variables. Similarly, if HP actually has a linear relationship to any study variable, then HR must have a
nonlinear relationship with the same variable. This conclusion was noted by Graham and
Jackson, who nevertheless remarked that the distortions introduced by the moderate
nonlinearity may not be important in most applications.‘“” However, Khachaturian and
co-workers have suggested that using HR instead of HP in some applications may significantly distort relationships.‘”
erally exhibits more linear behavior than HR.lU7
Measurement error becomes complex by the nonlinear relationship between period
and rate. A uniform 1 bpm error corresponds to about a 24 ms error at 50 bpm, but only a
6 ms error at 100 bpm. Likewise, a uniform 100 ms error is equivalent to a 5 to 7 bpm error
at 1000 m&eat, but a substantial 20 bpm error at 500 ms/beat. It is preferable to have the
measurement error variance approximately homogeneous across the variations of heart
rhythm that are likely to occur in the study under the set of clinical assessments.
Another issue closely related to linearity is the normality (Gaussian@) of the distribu-
tions of HR and HP representations of heart rhythm activity. A latent assumption of many
Similarly, Jennings, and colleagues have found that HP gen-
lOOO(ms / set)
HP(ms / beat)
lOOO(ms / set)
HR(beats / min)
Equation 6.3
Equation 6.2
92
Page 100
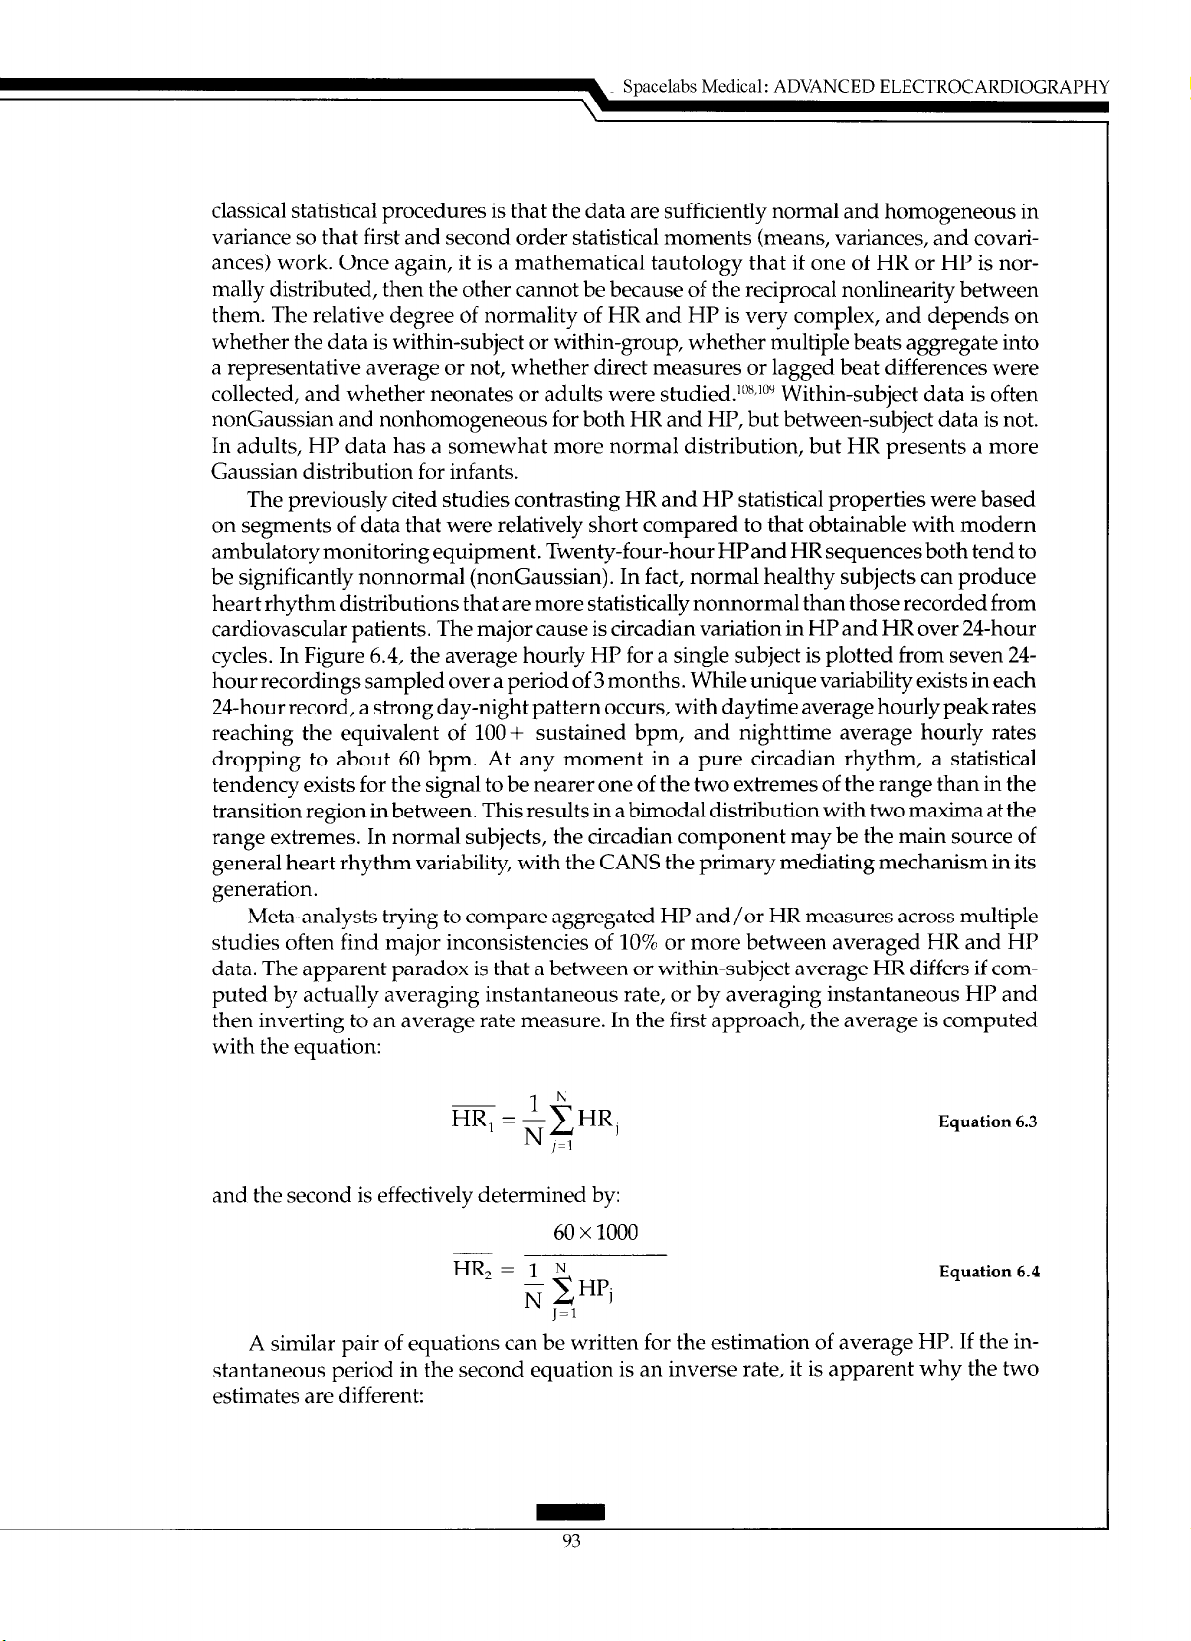
Spacelabs Medical: ADVANCED ELECTROCARDIOGRAPHY
classical statistical procedures is that the data are sufficiently normal and homogeneous in
variance so that first and second order statistical moments (means, variances, and covariantes) work. Once again, it is a mathematical tautology that if one of HR or HP is normally distributed, then the other cannot be because of the reciprocal nonlinearity between
them. The relative degree of normality of HR and HP is very complex, and depends on
whether the data is within-subject or within-group, whether multiple beats aggregate into
a representative average or not, whether direct measures or lagged beat differences were
collected, and whether neonates or adults were studied. lox~‘Oy Within-subject data is often
nonGaussian and nonhomogeneous for both HR and HP, but between-subject data is not.
In adults, HP data has a somewhat more normal distribution, but HR presents a more
Gaussian distribution for infants.
The previously cited studies contrasting HR and HP statistical properties were based
on segments of data that were relatively short compared to that obtainable with modern
ambulatory monitoring equipment. Twenty-four-hour HPand HR sequences both tend to
be significantly nonnormal (nonGaussian). In fact, normal healthy subjects can produce
heart rhythm distributions that are more statistically nonnormal than those recorded from
cardiovascular patients. The major cause is circadian variation in HP and HR over 24-hour
cycles. In Figure 6.4, the average hourly HP for a single subject is plotted from seven 24hour recordings sampled over a period of 3 months. While unique variability exists in each
24-hour record, a strong day-night pattern occurs, with daytime average hourly peak rates
reaching the equivalent of 100-t sustained bpm, and nighttime average hourly rates
dropping to about 60 bpm. At any moment in a pure circadian rhythm, a statistical
tendency exists for the signal to be nearer one of the two extremes of the range than in the
transition region in between. This results in a bimodal distribution with two maxima at the
range extremes. In normal subjects, the circadian component may be the main source of
general heart rhythm variability, with the CANS the primary mediating mechanism in its
generation.
Meta-analysts trying to compare aggregated HP and/or HR measures across multiple
studies often find major inconsistencies of 10% or more between averaged HR and HP
data. The apparent paradox is that a between or within-subject average HR differs if computed by actually averaging instantaneous rate, or by averaging instantaneous HP and
then inverting to an average rate measure. In the first approach, the average is computed
with the equation:
~ lh
HR, = $HRl
Equation 6.3
I-1
and the second is effectively determined by:
60 x 1000
HR, = I N
N xHPi
J=l
A similar pair of equations can be written for
the
estimation of average HP. If the in-
stantaneous period in the second equation is an inverse rate, it is apparent why the two
estimates
are different:
Equation 6.4
 Loading...