

Page 1
TM
Inside:
- Introduction
- Getting Started
- Configuring eyeMonitor
- Using eyeMonitor
- Creating Reports
eye
Monitor
Enterprise Ad Insertion Monitoring
Operations Manual
purely digital
cr ea te . mo ve . p la y. s ave.
Page 2

Intentionally Left Blank
Page 3

© 2006 Adtec Digital All rights reserved.
This document may not, in whole or in part, be copied, photocopied,
reproduced and translated, or reduced to any electronic medium or
machine-readable form without prior consent in writing from Adtec
Digital.
All examples with names, company names, or companies that appear
in this manual are imaginary and do not refer to, or portray, in name or
substance, any actual names, companies, entities, or institutions. Any
resemblance to any real person, company, entity, or institution is purely
coincidental.
Every effort has been made to ensure the accuracy of this manual.
However, Adtec Digital makes no warranties with respect to this
documentation and disclaims any implied warranties of merchantability
and fitness for a particular purpose. Adtec Digital shall not be liable for
any errors or for incidental or consequential damages in connection
with the furnishing, performance, or use of this manual or the examples
herein. The information in this document is subject to change without
notice.
Trademarks
eyeMonitor™ is a trademarks of Adtec Digital. Other product and
company names may be trademarks or registered trademarks of their
respective companies.
Document Date: eyeMonitor_1106_M
Page 4

Table of Contents
Chapter 1 - Introduction
Overview ..............................................................
Applications ...........................................................4
Benefits ................................................................
Availability ...........................................................
Requirements ........................................................
Options .................................................................5
Chapter 2 - Getting Started
General Instructions ..............................................
Installer Instructions ..............................................6
Map a Network Drive - Client PC Installation only ..
Initial Setup ..........................................................7
TBGS ..............................................................7
Client PC ..........................................................7
Users ...................................................................8
Screen Lay
eyeMonitor Screen Layout .......................................
Chapter 3 - Configuring eyeMonitor
Setting your Data Source Path
Customizing Your Content ..................................... 10
Headend Configuration: ...................................
Verification Types:
Monitor Refresh Options:
Customizing Your View ..........................................12
Color Configuration:
Scrolling Options: ..........................................13
Grid Tiling Options: ......................................... 13
Channel Tiling: ............................................... 13
out .......................................................8
: .............................. 10
.......................................... 12
................................ 12
....................................... 12
10
Chapter 5 - Creating Reports
4
4
5
5
Appendix
6
6
9
Encode List ....................................................18
Conflict List ....................................................
Current Alarms ............................................... 19
Schedule Report .............................................
Verification Report ...........................................
Discrepancy Report .........................................
A Contacting Customer Support ................23
B TBGS/adManage Technical Reference ......25
C Ad Insertion Enterprise Solution ............. 26
C1 Traffic and Billing Central ...................... 28
C2 Connected Headend ............................. 29
C3 Satellite Serviced Headend ...................30
C4 Disconnected Headend ......................... 31
D CCMS Schedule Format .........................32
E Verification Status Codes ...................... 33
F Duet Log Trace Messages ..................... 34
G Standard Operating Procedures ............. 38
18
20
20
21
Chapter 4 - Using eyeMonitor
Monitoring Headends & Spots ................................14
Break Detail: .................................................14
Right Click Menu Options: ................................ 15
Spot Search ........................................................16
Advanced Features ...............................................
Tools ..................................................................
Launch autoDialer: .......................................... 17
17
17
Page 5

Intentionally Left Blank
Page 6

Chapter 1 - Introduction
Overview
The Adtec eyeMonitor software provides real-time, enterprise-
wide system monitoring of commercial ad insertion. Ease of use and
convenient single screen monitoring makes eyeMonitor the ideal choice
for monitoring multiple headends and channels. Features include a
graphical status of all headends and channels with detailed analysis
and reporting just a click away. Prioritized alarms and comprehensive
reporting streamlines trouble shooting and daily operation data. With
convenient single-screen exception monitoring, eyeMonitor allows you
to keep an eye on the entire enterprise locally or remotely.
Applications
• Cable Ad Insertion: Monitor all ad insertion channels and
headends from one screen with highlighted status of all scheduled
events.
Benefits
• Enterprise Monitoring: eyeMonitor provides a bird’s eye view of all
ad insertion channels within multiple headends giving you critical status
at a glance.
• Detailed Reports: Whether you are troubleshooting or tracking
your daily activity, eyeMonitor provides on-screen and print reporting
of discrepancies, missing media, daily verifications and ad insertion
schedule confirmation.
• One-Click Analysis: Click on any scheduled avail to view the details
and verification results, including the actual daily verification file.
• Real Time Functionality: eyeMonitor provides visible real-time
status and highlights exceptions so that corrections can be made quickly
and easily.
• Broadcast Ad Insertion: eyeMonitor provides master control and
status of all ad insertion headends and channels with the flexibility to
make last minute schedule changes.
• Digital Ad Insertion: Use eyeMonitor with any mix of Duet and
DPI ad insertion channels for an integrated view of all analog and
digital networks.
4
• Catch Missing Media: Each headend in eyeMonitor features a count
down timer that displays how much time is left before missing material
is needed for air.
Chapt e r 1 - I n t r o d u ct i o n
Page 7

Availability
eyeMon
itor is provided as an available option to the Adtec Traffic
Billing and Gateway Server (TBGS). The eyeMonitor software comes
with a site license that can be installed on any network connected
computer in the enterprise. It uses ODBC database and Windows
mapped drive connectivity to the TBGS Server.
Requirements
Use of this software requires the following:
• LAN connectivity to the Adtec Traffic and Billing Gateway Server
with adManage.
• Windows XP: Intel Core Duo or AMD processor at 2 GHz; 1 GB
memory
• Minimum Monitor Requirement: 22” monitor, 1280 X 1024 screen
resolution. Recommended Monitor Requirement: 30” monitor. 1920 X
1440 screen resolution.
• 32 Bit graphics card.
Options
TBGS - 1RU
TBGS - 2RU
Option Description
• 400 Watt power supply
• Two Hot Swap SATA hard drives
• Software RAID 1 (Mirroring)
> 160 GB storage capacity
• Dual Gigabit Ethernet NICs
• Pentium 4 Intel Server mother board
• Intel remote Server management
• Windows 2000 Server
• ServeU FTP Server
• mySQL Database version 4.1.20
• Adtec adManage application
• Physical 19” x 1.7” x 25.7” 30 Lbs.
• Dual 550 Watt Hot Swap power
supplies
• Four Hot Swap SATA hard drives
• Hardware RAID 5
> 400 GB storage capacity (1.5 TB
max)
• Dual Gigabit Ethernet NICs
• Pentium 4 Intel Server mother board
with 1GB RAM.
• Intel remote Server management
• Windows 2000 Server
• ServeU FTP Server
• mySQL Database version 4.1.20
• Adtec adManage application
• Physical 19” x 3.4” x 25.7” 35 Lbs.
adManage
autoDialer
The adManage traffic and media
management application is at the core
of the Adtec enterprise management
of commercial insertion systems. The
application is optionally available to
support Interconnects and provides
schedule merging, verification splitting
and detailed real time network analysis
and alarms. The web based interface of
adManage is ideal for local or remote
access via any web browser. The SQL
database provides rock solid stability
and rapid access to real time system
data. A full complement of user definable
alarms provides notification via e-mail,
text messaging, paging as well as visual
alarming via the browser.
The autoDialer application provides
redundancy for LAN or WAN schedule
distribution, verification and log file
retrieval from the headends and
central office. It can also be used with
disconnected headends to manage
schedules and verifications.
5Chapt e r 1 - I n t r o d u ct i o n
Page 8
Chapter 2 - Getting Started
General Instructions
Before installing the eyeMonitor software, make sure that the
TBGS is up and running and that you have completed user configuration
within the adManage application. The usernames, passwords and user
levels assigned in adManage have the same status in eyeMonitor. Please
refer to the adManage documentation for adding and managing users.
Installer Instructions
Map a Network Drive - Client PC Installation only
To install eyeMonitor on a client Windows PC (not the TBGS) you
will need to be on the same TCP/IP network with accessibility to the
TBGS and will need to map a network drive to the TBGS data folder
before installing the software.
To map a network drive:
1. Right click Start > Explore.
2. Enter \\IPA in the address field where IPA is the IP address of the
TBGS server. (Use the format XXX.XXX.XXX.XXX.)
You may now run the eyeMonitor software installer.
The process for
installing the software on the Client PC or the TBGS server is the
same .
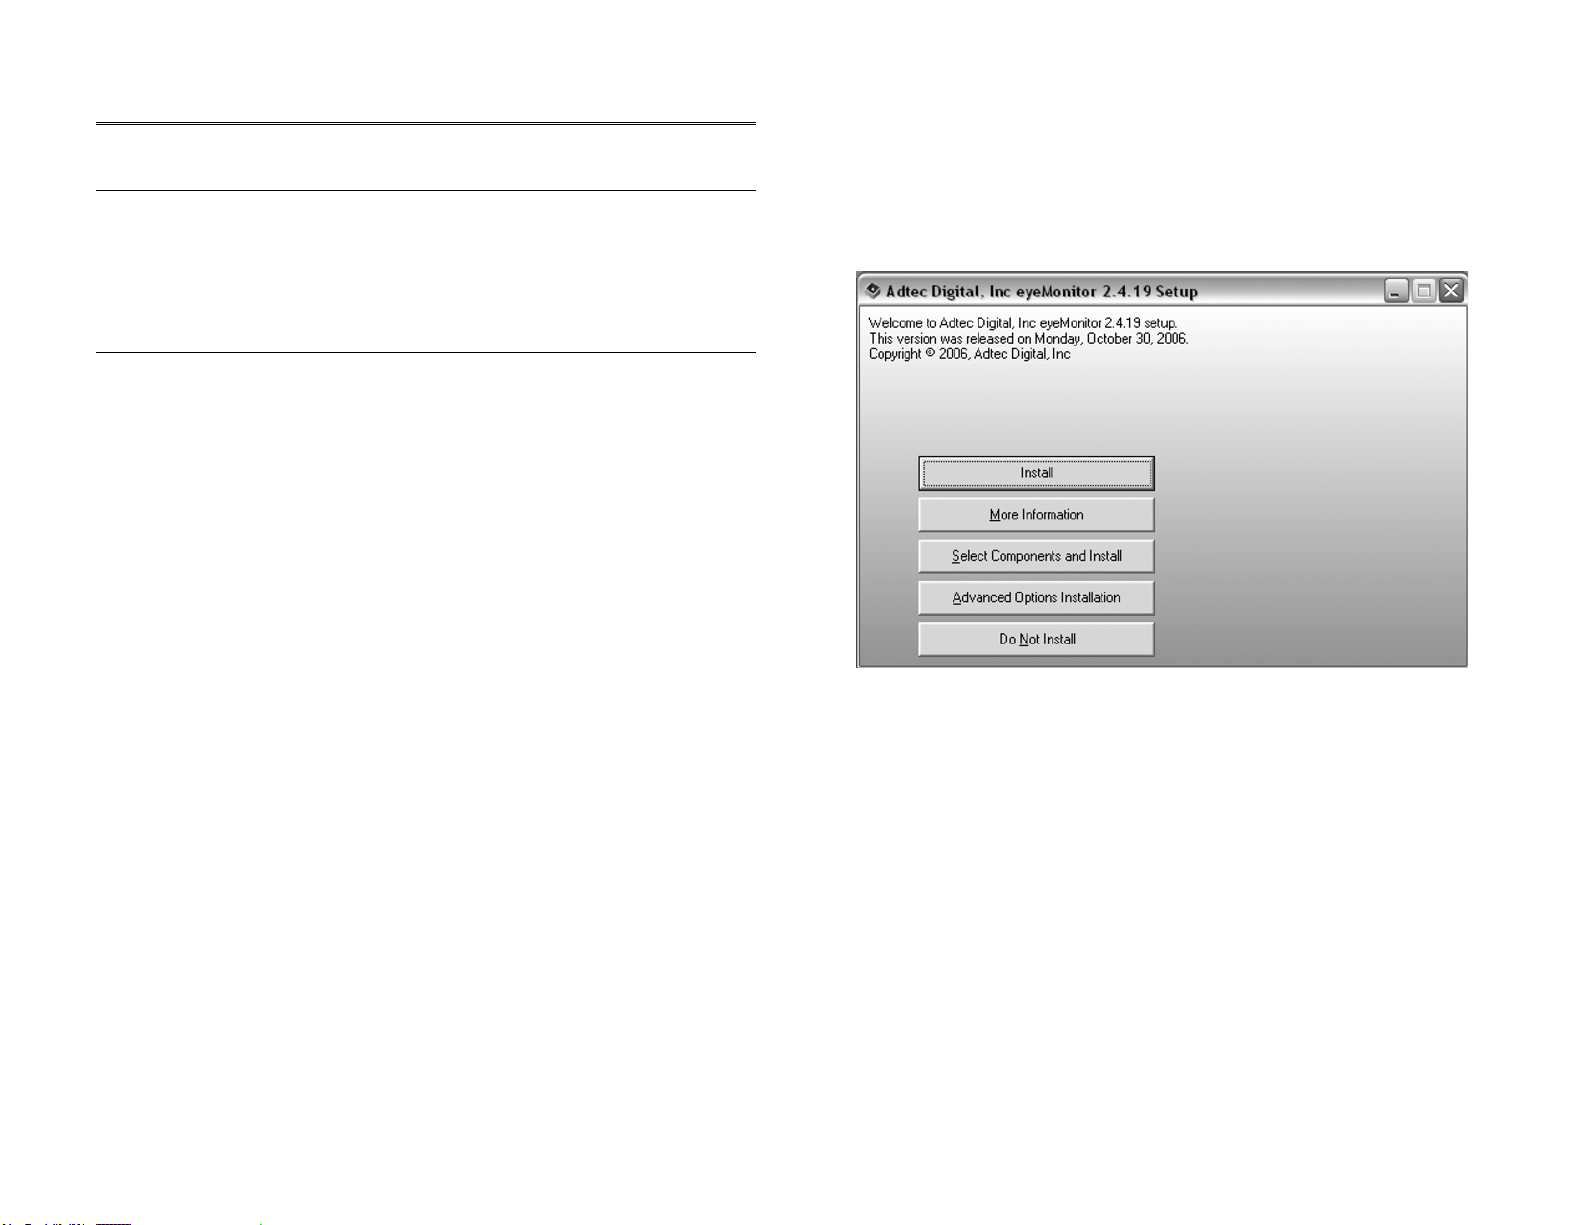
Installation Options
Insert the eyeMonitor Software CD into your CD Drive. When the
installer launches, you will need to select one of the following four
options for installation. (Figure 2.1)
3. Right click on the shared TBGS folder on the server and select
“Map Network Drive” from the drop down menu.
4. Enter a Drive letter. Use one that is available (typically X:\) and
select “Reconnect at logon”.
6
Figure 2.1
Install (recommended) - This option will install eyeMonitor using default
settings.
More Information - Provides you with release notes for the current version
and the ability to print them.
Select Components and Install - You may select which components of the
product you wish to install. You can run this option after an installation has
completed to add or remove components.
Advanced Options Installation - Allows you to designate specific folders for
the Program Files, Common Files and Start Menu items.
Do Not Install - Closes the install application.
Once you have completed the installation process, you will need
launch eyeMonitor and set several configuration values.
Chapt e r 2 - Ge t t i n g St a r t e d
Page 9
Initial Setup
Launch eyeMonitor by double-clicking the icon on the desktop or
browse to Start > All Programs > Adtec > eyeMonitor. You will be
prompted to complete the Initial Setup.
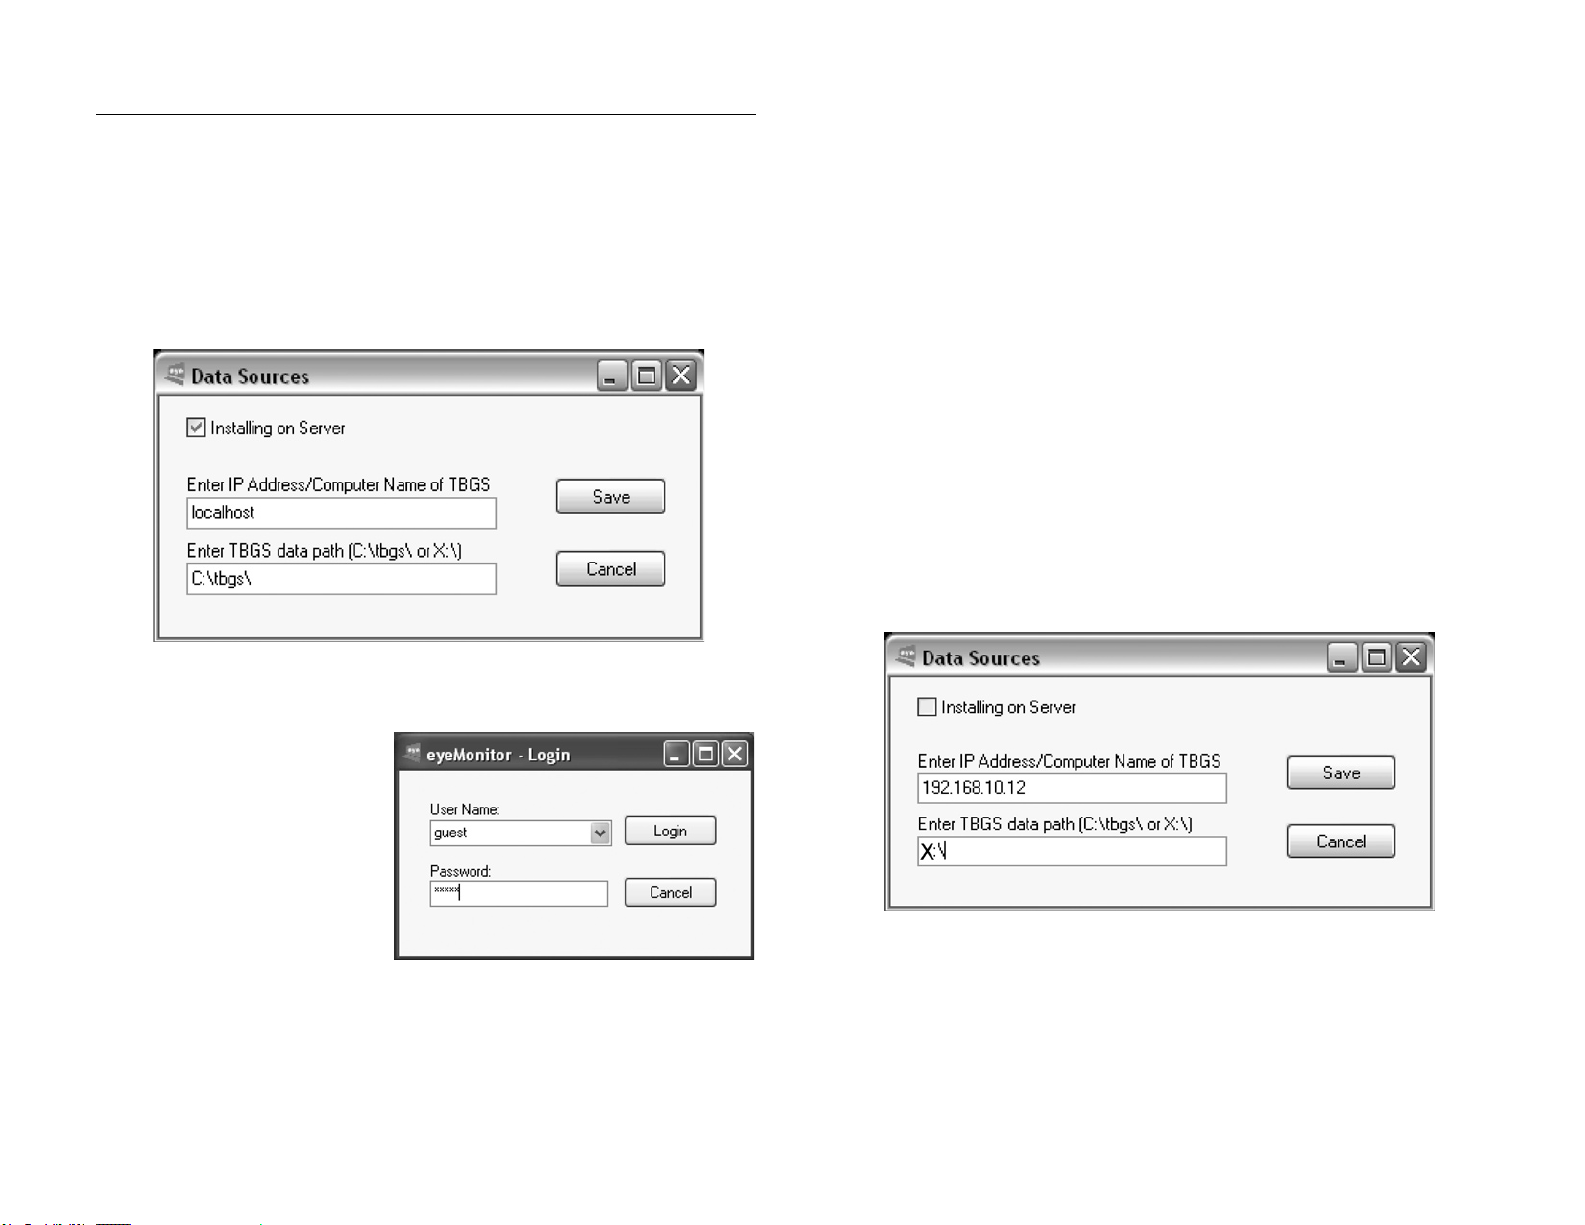
TBGS
If installing eyeMonitor on the TBGS, you will need to confirm that
the Installing on Server check box at the top of the Data Sources
pop-up IS checked. This will fill the input boxes with the default
Computer Name and Default Path. Click on the Save button to save
these settings. (Figure 2.2)
Figure 2.2
Client PC
If you are installing eyeMonitor on a Client PC, you will need to
make sure that the Installing on Server check box IS NOT checked
at the top of the Data Sources pop-up and then enter the correct
information for the IP Address/Computer Name and the Data Path for
the TBGS. (Figure 2.4)
The IP Address is the address given to the TBGS. Do not include
any leading or trailing back slashes when entering the address. See
example below. If you do not enter this address correctly, you will not
be able to login to the database once you restart the application, but
will be prompted with this window again.
The Data Path is the mapped network drive to the TBGS. In the
event that you enter the TBGS Data Path incorrectly or you loose
connectivity to your mapped network drive, you will receive a
message stating that the Data Path does not exist. If this is the
case, you will need to confirm that your network drive is correctly
mapped and then re-establish the data path connection from within
the eyeMonitor application by going to Configure >Data Sources. See
Chapter 3 - Configuring eyeMonitor for more detail.
Click on the Save button to save these settings and then relaunch
eyeMonitor.
You will be asked to restart
eyeMonitor for these
setting to take effect.
Relaunch eyeMonitor and
you will be asked to login
using your username and
password. (Figure 2.3)
Figure 2.3
Figure 2.4
If the TBGS data folder is not mapped correctly, you will experience
the following issues.
You will be unable to view verification files.
The Encode List Report will show all content as missing.
The Missing Content Report will not show MVL status
You will not be able to access merged schedules for Scheduled Spot Replace.
The Schedule Report will not display schedules status correctly and you will
not be able to view schedules.
7Chapt e r 2 - Ge t t i n g St a r t e d
Page 10

Users
The usernames and passwords assigned for adManage users
are the same username and passwords that they should use within
eyeMonitor. On the login screen, you will see that the options for
username are generated from adManage and placed in a selection drop
down box. As with adManage, there are three levels of access. Below
are the permissions granted to each level.
Administrator - Administrators have full access to all functions and
configuration variables within eyeMonitor.
Standard - Standard users may make break modifications and replace
spots but cannot make configuration changes.
Guest - Guest users have read-only access.
Screen Layout
If this is your first time logging in, notice that eyeMonitor
automatically loads all available headends. These headends have been
configured and are maintained through the adManage application.
In the next chapter you will be able to modify how your headend
monitor displays data as well as the type of data to display. An overall
view of a typical set up would look like the example on the following
page, (Figure 2.5). Familiarize yourself with the terms used to describe
the screen components as they will be used throughout this document.
Note: When viewing the current day, each channel will center align to
the current event. You have the ability to view past and future breaks for
the schedule day.
8
Chapt e r 2 - Ge t t i n g St a r t e d
Page 11
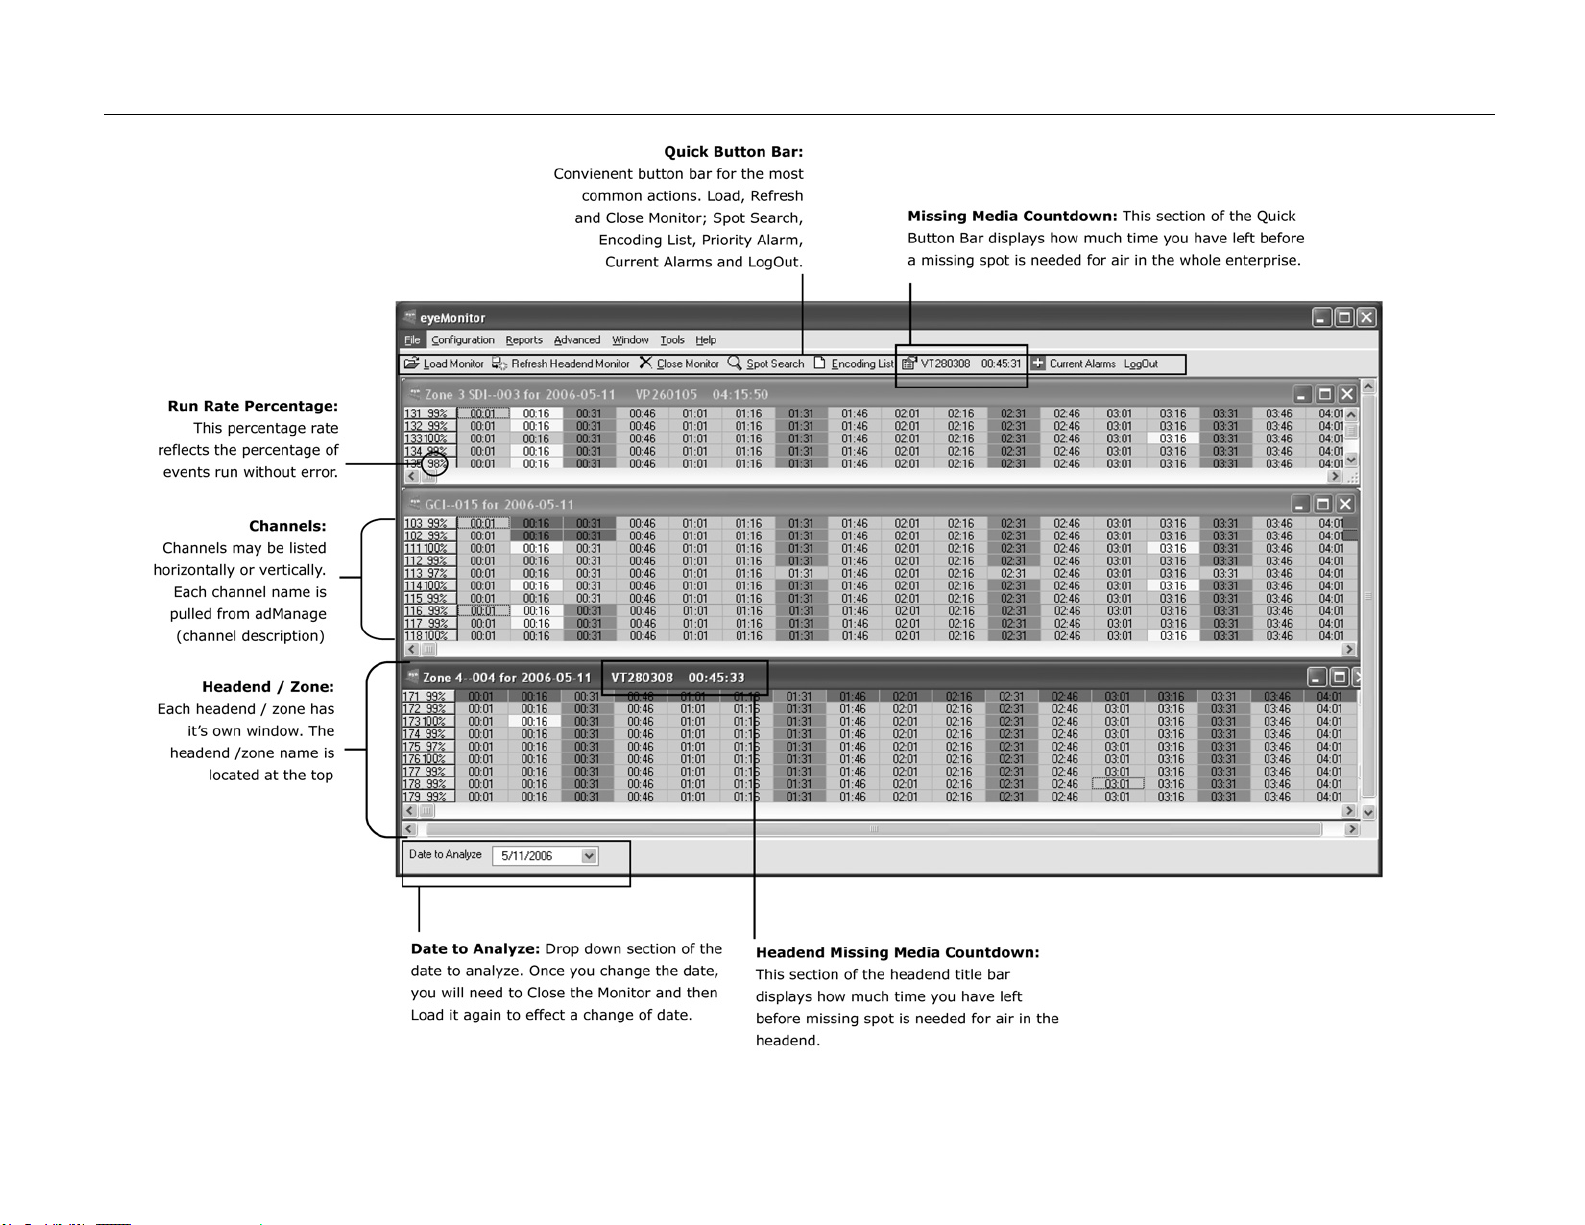
eyeMonitor Screen Layout
Figure 2.5
9Chapt e r 2 - Ge t t i n g St a r t e d
Page 12
Chapter 3 - Configuring eyeMonitor
You will need administrator access to make changes to the
configuration of eyeMonitor.
Setting your Data Source Path:
The Data Path is the mapped network drive to the TBGS and is
configured upon initial setup. If you receive the message during setup
that TBGS data paths do not exist or you have lost connectivity to your
network drive, you will need to re-establish the connection to the drive
(see Chapter 2 - Installer Instructions) and then configure your data
path correctly before using eyeMonitor. From the Configuration Menu,
select Data Sources (Figure 3.1)
Customizing Your Content
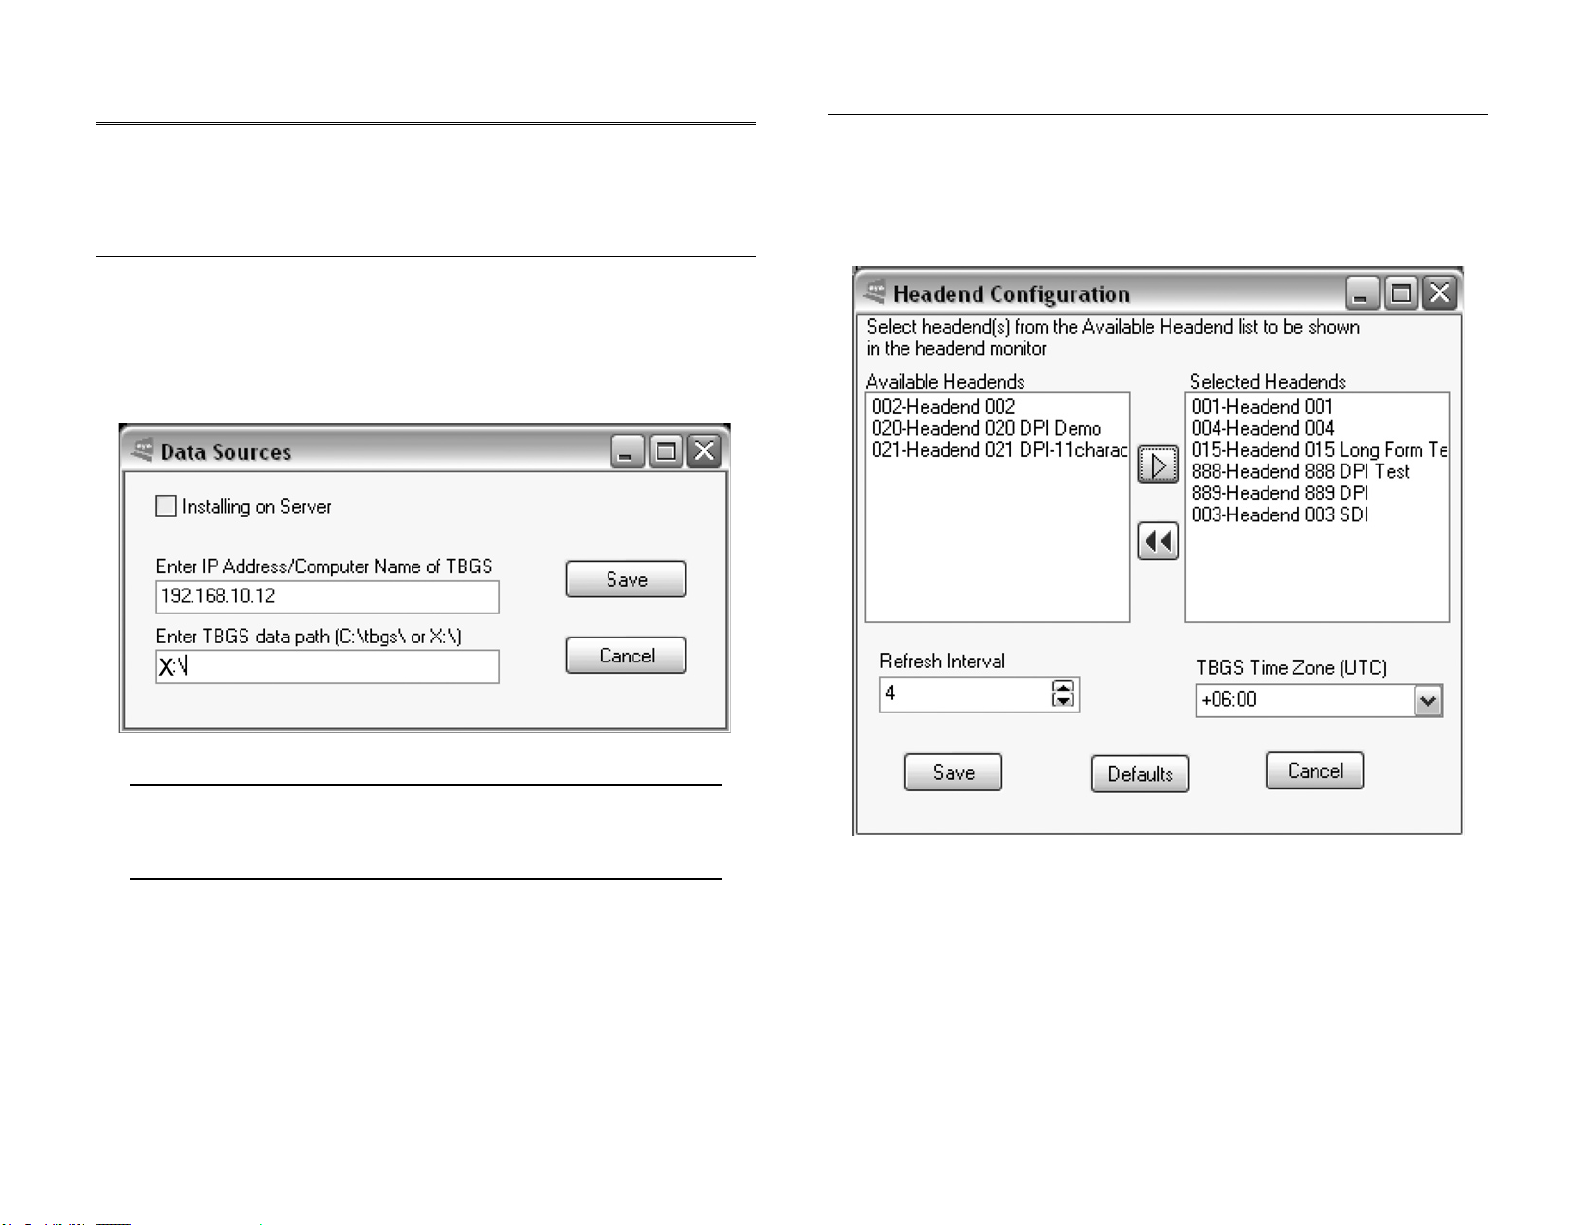
Headend Configuration:
To configure your content, begin by selecting the headends
you wish to view. From the Configuration Menu, select Headend
Configuration (Figure 3.2) The Headend Monitor Configuration panel
allows you to set up the headends you would like to display within the
monitor.
Figure 3.1
Note: When configuring your data source from within the eyeMonitor
application, do not edit the IP Address of the TBGS. The fact that you are
logged in means that it is valid.
Correct the TBGS data path if needed, and click on the Save button
to save these settings. You will need to Logout of eyeMonitor and
relaunch for the changes to take effect.
If the TBGS data folder is not mapped correctly, you will experience
the following issues.
You will be unable to view verification files.
The Encode List Report will show all content as missing.
The Missing Content Report will not show MVL status
You will not be able to access merged schedules for Scheduled Spot Replace.
The Schedule Report will not display schedules status correctly and you will
not be able to view schedules.
10
Figure 3.2
Available and Selected Headends:
A two panel configuration screen shows Available Headends on the left
and Selected Headends on the right. By default all headends are shown.
To customize your headend view, choose those headends you wish to view
from the left panel and click on the right arrow button to move them to
the Selected Headend(s) list. You may select multiple headends at the
same time by holding down the CTRL key. To remove a headend from
the monitor, select it from the right panel and click the double red arrow
to place it back in the Available Headend panel. The recommended
settings is for all headends to be displayed.
Chapt e r 3 - C o nf i g u r a t io n
Page 13

Refresh Interval:
Select how often in minutes you want the monitor to refresh. This interval
is used with the Auto Monitor Refresh function. The recommended
setting is 4 minutes.
TBGS Time Zone (UTC):
Select the hour interval of the location of the TBGS from UTC time. See
Time Conversion Chart.
Local Time Zone Conversion from UTC
ADT - Atlantic Daylight -3 hrs
AST - Atlantic Standard
EDT - Eastern Daylight -4 hrs
EST - Eastern Standard
CDT - Central Daylight -5 hrs
CST - Central Standard
MDT - Mountain Daylight -6 hrs
MST - Mountain Standard
PDT - Pacific Daylight -7 hrs
PST - Pacific Standard
ADT - Alaskan Daylight -8 hrs
ALA - Alaskan Standard -9 hrs
HAW - Hawaiian Standard -10 hrs
Nome, Alaska -11 hrs
CET - Central European
FWT - French Winter
MET - Middle European
MEWT - Middle European Winter
SWT - Swedish Winter +1 hr
EET - Eastern European, USSR Zone 1 +2 hrs
BT - Baghdad, USSR Zone 2 +3 hrs
ZP4 - USSR Zone 3 +4 hrs
ZP5 - USSR Zone 4 +5 hrs
ZP6 - USSR Zone 5 +6 hrs
WAST - West Australian Standard +7 hrs
CCT - China Coast, USSR Zone 7 +8 hrs
JST - Japan Standard, USSR Zone 8 +9 hrs
EAST - East Australian Standard GST
Guam Standard, USSR Zone 9 +10 hrs
IDLE - International Date Line
NZST - New Zealand Standard
NZT - New Zealand +12 hrs
Once you have made your changes, save your changes.
To view your configured headends, you will need to close the
monitor and then load the monitor. There are two ways to close the
monitor. You can select Close Monitor from the File menu or simply
click on the Close Monitor button located within the Quick Button Bar.
Loading the monitor can also be done via the File Menu or the Quick
Button Bar.
11Chap t e r 3 - C on f i g u r a ti o n
Page 14

Verification Types:
Verification files (.VER) are based on the images of schedule files
and include the results of that day’s inserts. As each break airs, fails,
or expires, the appropriate code for each spot is updated and written to
the verification file in the ad inserter and then sent back to the TBGS.
From the Configuration Menu, select the type of verification
file you would like data to be pulled from: the Local Verification file,
an Interconnect Verification file or the Raw Verification file which
is the result of merged Local and Interconnect verifications.
The
recommended setting is Raw Verification.
Monitor Refresh Options:
(Enabled, Disabled) The break information within the monitor can
be updated automatically or manually. To turn auto refresh on, select
Configure> Monitor Refresh > Enable. Enabling the Refresh option will
refresh the content based on the Refresh Interval you have designated
in the previous Headend Configuration panel. Disabling the Refresh
option will keep the content static unless you refresh the monitor or
close and load the eyeMonitor application again. If enabled, eyeMonitor
will automatically refresh and align each channel to the current on air
event. To manually refresh the monitor, click Refresh Monitor
The
recommended setting is Enabled.
Scheduled Time Format:
(Show Seconds, No Seconds) Selecting Show Seconds will list each
break in the grid with the format HH:MM:SS. Selecting No Seconds
will prevent the seconds from being displayed in the break.
The
recommended setting is No Seconds
Customizing Your View
To modify how the individual headends are viewed within
eyeMonitor, you can use Configuration > Grid Tiling or the Window
Settings to arrange them. Another option is to drag, drop and re size
the individual headends to your liking. Once you are satisfied with your
view, you must save your layout before closing the monitor or your
arrangement will be lost. To save the layout, Select Window> Save
Layout from the menu. Keep in mind that only administrators can save
the layout.
Color Configuration:
The Color Configuration screen (Figure 3.3) defines all of the
event codes and their corresponding colors. These colors are used as
backgrounds per break on each headend within eyeMonitor to help
define status conditions. Consider using the same color configuration at
all of your monitor work stations as well as the TBGS to avoid confusion.
12
Figure 3.3
Note: When selecting your colors, keep in mind that the text within each
break is set to black so selecting lighter colors as condition backgrounds
will provide the most readable text.
Chapt e r 3 - C o nf i g u r a t io n
Page 15

To change a color for a specific event or condition, select Color
Configuration from the Configuration menu. Locate the condition you
wish to set the color for and click on it’s corresponding color box. A color
selector will appear. Select your preference and click OK.
Once you have completed your color choices, click on Save to save
and close the configuration window. To restore your color selections to
their default settings, you will need to click on the “Defaults” button and
then the Save button. For a full explanation of the events listed on the
Color Configuration screen see Appendix E , Verification Status Codes.
Scrolling Options:
When viewing eyeMonitor, you can select whether or not you
wish to view each headend panel as an individual scrolling window
or if you want the ability to scroll all headend panels at once. To set
your preference, go to Configuration > Scrolling Options and select
Individual Scroll or Scroll All.
Grid Tiling Options:
Grid Tiling allows you to select either horizontal or vertical tiling
of headends within the monitor window. Horizontal Tiling will stack the
headends one on top of another. Vertical will place them in a row sideby-side.
Channel Tiling:
Select the preferred orientation of the channels within each
headend. Horizontal will list the channels vertically in the left-most
column, and the break content for that channel a horizontal row.
Vertical will list the channels horizontally across-the-top and the break
content of each channel in a vertical column.
Note: The typical setup is for Grid Tiling to be set to Horizontal and
Channel Tiling to Horizontal. This setup allows you to see more breaks
at one time. (Figure 2.5)
13Chap t e r 3 - C on f i g u r a ti o n
Page 16

Chapter 4 - Using eyeMonitor
Position in Window: Break sequence number within window of opportunity
for event to occur.
eyeMonitor displays multiple headends and the schedule and
verification content of those headends for a 24 hour period (CCMS
Schedule Period).
Monitoring Headends & Spots
The headend grids within the Monitor display the breaks for each
headend for the date designated in the Date to Analyze field at the
bottom of the monitor screen. When eyeMonitor was configured, the
background colors for each of these breaks was set based upon their
current condition. In addition to this stand-out feature, a countdown
timer to the next missing spot is displayed in the headend header bar.
Among these alarms, the most time-crucial alarm is then placed in the
quick buttons section of the monitor.
A missing media countdown timer for all headends is displayed in
the quick buttons section and can be clicked on for more details.
Break Detail:
While in the headend grid, double click on any break to get the
details of the break. (Figure 4.1) shows the Break Detail Window.
The following information is provided within the Break Detail
Window. See Appendix D for more information.
Schedule Time: T&Bs approximation of the time of day when the event will occur
(formatted - HH:MM:SS)
Window Start Time: Time of day to begin window of opportunity for event to
occur (formatted - HH:MM)
Window Duration: Length of window of opportunity for event to occur
(formatted - HH:MM)
The break detail grid has the following columns:
Position: Position sequence number for event within a break.
Spot ID: T&Bs spot identification code used by adManage as the commercial
file name.
Client: Advertiser’s name as identified in Traffic and Billing Schedule.
Spot Title: Name of Spot as identified in Traffic and Billing Schedule.
Scheduled Length: Scheduled event length (formatted - HH:MM:SS)
Scheduled/Fill: Identifies the spot as either being scheduled contractually or
used as filler in order to complete a commercial break.
Tag: The channel-headend (cchhh) tag used by adManage for unmerging
verifications into local and interconnect destinations.
Status Code: Completion status code. See Appendix E for Status Code details
Verified Time: Time of the actual insert or if an insert failed then the word
FAILED will be shown.
View Verification File - This button will open a new window with the native
VER file. These .VER files follow the format outlined in Appendix F.
Note: You must have a valid mapped network drive to the TBGS to view
the actual verification file.
Window End Time: The ending of the window of opportunity for the event to
occur (formatted - HH:MM)
14
Figure 4.1
Chapt e r 4 - U s in g e y e M on i t o r
Page 17

Right Click Menu Options:
While your cursor is placed within any
headend/zone grid, you have several options
available from the right-click menu. (Figure
4.2)
Refresh Headend: Refreshes the break
information for the specified headends and moves
the view to the current event.
Verification File: The Verification File option on the Right Click menu in the
headend will pull up that verification file. (Figure 4.4)
Figure 4.2
Headend Analysis: The headend analysis screen (Figure 4.3) gives you a
quick summary of events per headend. It displays the totals for key headend
events as well as channel specific events. The events detailed in this report
are:
Figure 4.3
Channel: A list of channels within the selected headend.
Inserts: The number of successful inserts that have occurred in the current 24 hour
period.
Generic Fails: The number of scheduled event which failed.
No Ad Copy: The total of inserts that failed because there was no ad copy available.
Causes include material not copied into the MVL. The material is not inserted because of
a communication error. The material is on the headend purge list.
Refer to Appendix D: CCMS Schedule and Verification Format for
content descriptions and Appendix E: Verification Status Codes.
Note: You must have a valid mapped network drive to the TBGS to view
the actual verification file.
Figure 4.4
No Cue: The number of failed inserts due to an undetected cue tone within the service
window.
Unknown Errors: Total of undetermined event errors.
Event Totals: The number of events that have occurred within the 24 hour period.
Run Rate: The percentage of successful inserts to possible inserts.
15Chap t e r 4 - U si n g e y e Mo n i t o r
Page 18

Log View: Duet ad inserters FTP filtered log files back to the Traffic and
Billing Gateway Server. These log files or .LFR extension text files display the
following content per channel.
Note: You have the ability to turn logging off within each Duet Ad
Inserter. If it has been turned off, then there will be no content in the
Log View window.
Figure 4.5
Spot Search
You can launch a Spot Search from the Quick Button bar at the top
of the Monitor or select File > Spot Search. Within this window you can
either search for the history of a specific spot (previous 14 days) or it’s
scheduled status (future 14 days). To generate a spot search report,
first select whether you are looking for the history of a spot or it’s future
schedule. Then select the spot ID from the drop down menu. This drop
down menu contains all of the spots located in the MVL.
The data is sorted by the Tag ID number in ascending order. The
columns are:
Spot Length: The length of the spot (Formatted as HH:MM:SS)
Scheduled Date: The date the spot is scheduled if you are viewing Scheduled or the
date the spot ran if you are viewing the spot history.
Advertiser’s Name: The name of the advertiser
Advertiser’s Spot Name: The advertiser’s description of the spot.
Tag: The tag is the Channel-Headend (CCHHH) where the spot is scheduled.
Expiration Date: If the ad is scheduled to expire, this lists the expiration date.
(Formatted YYYY-MM-DD)
First Air Time: The first air time is the first time in the schedule day that the spot
played.
Occurrences: The number of times the spot was a part of the schedule or history
depending upon your search criteria.
Log Code: Refer to Appendix F - Duet Log Trace Messages for a complete list of error
codes.
Date: Date when the logged event occurred.
Time: Time when the logged event occurred.
Message: The log message
File Name: The associated filename for the log message.
Normal Window: Normal window allows you to restore any maximized
window to it’s previously saved position.
Close: Closes the headend.
16
Figure 4.6
Chapt e r 4 - U s in g e y e M on i t o r
Page 19

Advanced Features
Scheduled Spot Replace: As an advanced feature, you may
replace a scheduled spot with a different one within the schedule.
(Figure 4.7) This is mostly useful when needing an immediate solution
for a MISSING spot. It should not be used under normal operating
procedures where schedule changes are handled by the Traffic system.
NOTE: Scheduled Spot Replace will replace all of a selected scheduled
spot with the replacement spot. This process may not be reversed
without recreating local or interconnect schedules.
This is a manual process which modifies changes the schedule in
the merged schedule folder of the TBGS. That schedule will be sent to
the Duet during the next schedule transfer.
The frequent use of spot replace will cause eyeMonitor and it’s the
alarm run rate report to report success rates higher than your traffic
and billing’s run rate report.
Under normal operation, schedules should be changed in your
traffic and billing software in order to have accurate scheduling and
verification processes.
To replace a spot, select the name of the spot you wish to
replace in the Scheduled Spot section. The available spot names are
generated from the database and placed in a drop down menu. Once
you have selected the spot, the metadata for that spot will be shown for
confirmation purposes.
Now select the replacement spot from it’s drop down menu list and
double check the metadata to confirm you have selected the correct file.
In the section below, choose which headend(s) and/or channel(s)
you want to make a replacement on. If you want to make the change
for all headends and channels, check the Select All/None check box
and all will be highlighted. The Spot Selection section of this screen
allows you to narrow the criteria for the replacement. If you want to
limit the replacement to a specific date and time range, you can make
those selections prior to the replacement. The spot selection of Local or
Interconnect will list the scheduled spots originating from one of those
schedule sources. Clicking on the Replace Now button will make the
replacement and then close the Schedule Spot Replace dialog box.
Tools
Launch autoDialer:
The Launch autoDialer menu option will start the autoDialer
application.
Figure 4.7
17Chap t e r 4 - U si n g e y e Mo n i t o r
Page 20

Chapter 5 - Creating Reports
When generating reports, keep in mind that the report data
reflects all headends, not only the ones you have designated as part of
your monitor view.
Encode List
The encode list report (Figure 5.1) shows a list of spots that have
been scheduled but do not exist yet within the Master Video Library on
the TBGS. Once these file have been encoded, they should be saved in
the MasterVideoLibray folder of the TBGS.
Figure 5.1
Conflict List
The conflict list report (Figure 5.2) shows a list of all merge
conflicts between local and interconnect schedules. When configuring
your headends within adManage, you were able to select which set
of schedules takes precedence. This list shows the which file was
overridden and the date and time it occurred. This list can be printed by
selecting Print from the File Menu.
Figure 5.2
18
Chapt e r 6 - C r ea t i n g R ep o r t s
Page 21

Missing Content
The missing content report (Figure 5.3) shows a list of content
which is scheduled but not located on the ad inserters.
Figure 5.3
By default, this list is sorted by Schedule Date and Time so that
the most time-critical information is at the top of the list. The list can
be sorted by any of it’s categories by making that selection in the drop
down box at the top of the screen. This reports tells you the Headend,
Channel, Scheduled Date and Time, Spot ID, Advertisers Name,
Advertisers Spot Name and whether or not the Spot is in the MVL. Any
content which is defined as NOT being in the MVL will also appear on the
Encoding List.
This list can be printed by selecting Print from the File Menu.
Current Alarms
The current alarms report (Figure 5.4) shows a list of operations
alarms which have not been acknowledged. This list includes notification
of all alarms assigned to the logged in user as configured in adManage.
Alarms can include Missing Local Schedules, Missing Interconnect
Schedules, Missing Merged Schedules, Missing RDY Files, Connection
Errors, etc..
Figure 5.4
As each of these alarms is handled, you can remove then from the
Current Alarms report by checking the check box next to it. The next
time the report is run, the checked items will not appear.
19Chap t e r 6 - C re a t i n g Re p o r t s
Page 22

Schedule Report
The schedule report (Figure 5.5) shows whether or not the
schedules for your ad inserters have been properly loaded. The report
can be expanded to show up to a 14 day period. To change the date
range, select the dates from the drop down boxes and click on the
refresh button.
Verification Report
The verification report (Figure 5.6) shows whether or not the
verification files for each ad inserters has been properly relayed back to
the TBGS. The report can be expanded to show up to a 14 day period.
To change the date range, select the dates from the drop down boxes
and click on the refresh button.
Figure 5.5
There are three possible messages that will appear.
Missing Merged - This message means that the schedule is not in
the MergedSchedules Folder on the TBGS. Possible causes of this is that
the original Local or Interconnect schedules have not been produced by
the Traffic system or that there is a technical issue with the adManage
merger service.
MC Date - Time Stamp - The .SCH file is located on the inserters
but there were Merge Conflicts. To view the individual .SCH files for
each channel, you can double click on the date/time stamp and the
.SCH file will open in a new window. The top of the window will outline
the Merge Conflicts that occurred.
Date Time Stamp - The .SCH file with that time date stamp
is located on the inserters and there were no conflicts. To view the
individual .SCH files for each channel, you can double click on the date/
time stamp and the .SCH file will open in a new window.
Missing - The schedule is missing from the ad inserter. The
possible cause could be a network communication error between the
TBGS and the Duet/DPI.
This list can be printed by selecting Print from the File Menu.
Figure 5.6
There are three possible messages that will appear
Missing - The verification file is missing from the TBGS. Possible
causes for this could be a network communication error or a problem
with the ad inserter.
Partial - The verification file is partially complete. This message
occurs on the current day when the full day of verification status codes
have not been updated. If a partial verification is shown from a previous
day, the ad inserter did not return the final verification for the day.
Possible causes could be a network communication error or a problem
with the ad inserter.
Complete - The verification files is complete with all of the
verification status codes updated for the day.
The verification reports can be printed by selecting Print from the
File Menu.
20
Chapt e r 6 - C r ea t i n g R ep o r t s
Page 23

Discrepancy Report
The discrepancy report (Figure 5.7) shows all events except for
those that played successfully so you can quickly identify issues that are
preventing the ads from playing correctly. The report can be sorted by
headend or channel and can be narrowed via specific headend and start
and end dates. This report can be printed by clicking on File > Print.
Figure 5.7
For each unsuccessful event, the report displays the
Headend, Channel, Schedule Date, Scheduled Time, Window Start Time,
Window Duration, Break Number, Position, Length, Spot ID, Status
Code, Advertiser Name and Notes.
21Chap t e r 6 - C re a t i n g Re p o r t s
Page 24

Appendix
A - Contacting Customer Support
B - TBGS/adManage Technical Reference
C - Ad Insertion Enterprise Solution
C1 - Traffic & Billing Central
C2 - Connected Headend
C3 - Satellite Serviced Headend
C4 - Disconnected Headend
D - CCMS Schedule Format
E - Verification Status Codes
F - Duet Status Codes
G - Standard Operating Procedures
22
Appen d i x
Page 25

A Contacting Customer Support
Technical Support and Customer Service includes troubleshooting
product/system functional operations concerning Adtec equipment
,embedded systems and single device issues; Service Order generation,
processing and tracking; Warranty claim processing; and on-site
system evaluation and maintenance. Technical Support plans do not
include customer training programs. Programs incorporating customer
training are defined in the Training Services Policy. Customer Services
technicians provide limited instruction during a support call/email/fax in
order to facilitate checking for proper equipment operation.
Telephone and Email Support
Telephone: 615.256.6619
Email: support@adtecinc.com
Internet: www.adtecinc.com/supportrequest/
Adtec Digital offers telephone, email and fax support, warranty
and service related inquiries during normal business hours (9:00 AM
to 5:00PM Central Standard Time CST, Monday thru Friday, except
holidays. Please check the adtec website for a current list of Adtec
holidays. Support Requests can also be submitted on-line.
All inquiries will be processed in the order in which they are
received and by the criteria outlined in the Call Response Order.
Inquiries and inquiry responses made after 5:00 PM (CST) weekdays,
Saturday, Sunday or on an Adtec recognized holiday will be processed
the next business day in the order received.
Callers on hold and returned calls will be prioritized by the
following criteria:
• Priority-24 Subscription Customers
• Standard-Priority Subscription Customers
• All customers that have purchased Installation & Training, within 90 days of
the installation
• Adtec Certified Operators (ACO)
• Limited Level Support, Warranty & Service Requests
• Multi-device system installations that have purchased Installation & Training
from Adtec
• Distributors
• System Integrators
• Multi-device systems
• Single device users
Information needed for Support
To help expedite the troubleshooting process, please be prepared
to provide the following information to the support representative.
Product(s) affected: Please provide a list of the Adtec Products
involved including the Revision Number for each affected product.
Description of the Problem: Please include a detailed description
of the problem. Include the approximate time and day the problem
occurred, the spot ID of the material being inserted and what the
operator reported about the incident. It is also helpful to note any
recent changes to the system. More information is always better than
too little information.
Your Contact Data: Please include contact information so we
can reach you to discuss how to fix the problem, additional
troubleshooting steps that are required or to gather more complete
information regarding the problem. Please include your facility name
(or call letters), your name, title, email address, telephone number,
hours of work, and other contact persons if you are not available.
Advanced Support Plans
In addition to our basic Inquiry Response Policy, Adtec offers
two advanced levels of priority inquiry support: Standard-Priority
and Priority-24. The Standard-Priority & Priority-24 plans provide
guaranteed* response times with the Priority-24 plan offering after
hours and holiday support. Standard-Priority support is included with
the Adtec Certified Operator (ACO) training. Contact Adtec Sales to
upgrade your current support plan.
SUPPORT PLAN PRIORITY –24 STANDARD-
Hours 24 Hours/Day
Call Response
Time: Guaranty*
Discounted Site
Visits
Discounted Training
Repair Service:
Guaranty*
7 Days/Week
Same Day: 2
Hours (1st in
order of call list)
25% 10% None
25% 10% None
1 Day Turnaround 3 Day Turnaround
PRIORITY
“9 AM – 5 PM
(CST), Excluding
Weekends &
Holidays”
Same Day: 4
Hours (2nd in
order of call list)
LIMITED
9 AM – 5 PM
(CST) Excluding
Weekends &
Holidays
48 Hours
None
One month free service extension will be awarded if Adtec fails to
meet its service guarantee.
23Appe n d i x
Page 26

Standard-Priority Support Plan
Customers can improve upon our normal call processing times
and can expedite inquiry support responses through our subscription
Standard-Priority service plan. Under this plan all telephone inquiries
are guarantied** a telephone response of no more than 4 hours after
they are received (within the designated hours of operation). Telephone
inquiries received by 4:00 PM (CST) on weekdays, excluding Adtec
holidays are guarantied a same-day telephone response. However,
inquiry responses may be made after hours until 8:00 pm (CST).
Email and fax inquiries are limited in scope to normal business hours,
excluding holidays. Standard-Priority customers are entitled to a 10%
discount on site visit and training charges after the initial system/
product installation and training. Standard-Priority customers also
receive a 3-day turnaround time guaranty* on warranty and nonwarranty repairs on Adtec manufactured equipment, excluding Studio
Encoders.
Priority - 24 Support Plan (24 Hour)
In addition to our Standard-Support plan, after hours, weekend
and holiday support is available with the Priority-24 support plan. This
plan is a subscription only service available for service inquiries 24
hours a day, 7 days a week. All telephone inquiries are guarantied* a
telephone response of no more than 2 hours. Email and fax inquiries
are limited in scope to normal business hours, excluding holidays. Calls
after 5:00 PM will be forwarded to a Customer Services representative
on call. Priority-24 customers are entitled to a 25% discount on site
visit and training charges after the initial system/product installation
and training. Priority-24 customers also receive a 1- day turnaround
time guaranty* on warranty and non-warranty repairs on Adtec
manufactured equipment, excluding Studio Encoders.
24
Appen d i x
Page 27

B TBGS/adManage Technical Reference
TBGS-1 Hardware Features
• Rack mount 1 RU chassis
• 400 Watt power supply
• Hot Swap SATA hard drives
• Software RAID 1 (Mirroring)
> 160 GB storage capacity
• Dual Gigabit Ethernet NICs
• Intel Server mother board
• Intel remote Server management
• Windows 2000 Server
• FTP Server
• SQL Database
• Adtec AdManage application
• Physical 19” x 1.7” x 25.7” 30 Lbs.
TBGS-2 Hardware Features
• Rack mount 2 RU chassis
• 550 Watt Hot Swap power supplies
• Hot Swap SATA hard drives
• Hardware RAID 5
> 400 GB storage capacity (1.5 TB max)
• Dual Gigabit Ethernet NICs
• Intel Server mother board
• Intel remote Server management
• Windows 2000 Server
• FTP Server
• SQL Database
• Adtec AdManage application
• Physical 19” x 3.4” x 25.7” 35 Lbs.
Features and specifications are subject to change without written
notice.
25Appe n d i x
Page 28

C Ad Insertion Enterprise Solution
1 - adManage/TBGS
At the core of the adVantage solution is the TBGS traffic and billing gateway
server and the adManage software application. This is the gateway that invisibly
coordinates the complex flow of media and data across the enterprise. adManage
streamlines the process of getting the right ads, schedules and verifications
to the right places at the right times, resulting in high customer satisfaction
levels and increased revenues. The powerful server architecture and SQL
database offers rapid access to current data via the browser interface supporting
customized alarms with notification via paging, email or text messaging.
2 - Traffic and Billing
adManage merges local and interconnect schedules to create a master insertion
schedule for each channel at each headend. After commercials are played,
adManage creates and sends separate verification files to local and interconnect
traffic and billing systems facilitating seamless media and data management
across your enterprise.
3 - eyeMonitor
The eyeMonitor interface graphically displays the status of all headends and
channels in the enterprise on a single screen. It provides visibly better real time
status and highlights exceptions so that corrections can be easily made.
4 - autoDialer
The autoDialer application provides a back channel for schedule distribution
and verification retrieval over a simple phone line. This feature is essential for
disconnected remote headends and adds redundancy in networked headends, all
for the price of a phone call.
5 - adCode
New media is ingested and prepared by adCode and sent to adManage for
storage and distribution to the headends. Sources can be tapes, DVDs or over
FireWireTM from nonlinear editors. The architecture of adCode supports Cable
Labs VOD and SCTE encoding standards, an important aspect that future proofs
your investment. Use adCode to seamlessly bridge the transition from analog
and SDI digital insertion to DPI. adCode prepares the highest quality DPI ready
media in the industry. Compatibility with other ad insertion systems is standard
innovation at Adtec.
6 - Networked Headend
A networked headend has an existing broadband LAN/WAN connection, such
as a T1 line or cable modem. adManage uses this connection to send ads
and schedules and receive verifications and status monitoring. Ad insertion is
performed by Adtec’s scalable single-channel Duet or Duet-SDI. Since each Duet
is a single-channel modular unit that is totally self-contained, the system is fault
tolerant by design. Media distribution within the headend is invisibly performed
via multicast techniques making it available to all inserters all the time.
7 - Disconnected Remote Headend
What can you do when a headend is so small or remote that it has no economical
network connection and satellite is not an option? Media can be ingested by
adCode and burned onto a CD or DVD and sent to the headend where the disk is
simply placed into a Duet-DVD unit. The Duet-DVD automatically makes all the
ads available to every unit at the headend. At the remote headend, adManage
performs schedule distribution, status monitoring and verification retrieval over
standard phone lines (PTSN) via dial-up modem through autoDialer.
8 - Optional Satellite Serviced Headend
In headends without a network connection, media and data distribution can
easily be achieved via satellite. Here’s how it works. At the central office,
adManage sends the media and schedules to Adtec’s FCMP server which prepares
the data by adding forward error correction then multicasting it to the Adtec DTA3050 multiplexer for encapsulation and encrypting prior to the multicast uplink.
At each satellite headend, an Adtec edje-1123 with built-in satellite data receiver
unscrambles and distributes the media to the Duet, Duet-SDI or DPI-1200
units. At the satellite headend, adManage performs schedule distribution, status
monitoring and verification retrieval over a simple phone line with a dial-up
modem through autoDialer.
9 - Digital Program Insertion Option
Adtec’s DPI-1200 digital-into-transport (DIT) ad server takes the place of up
to twelve Duets. Designed for the all-digital headend, the DPI-1200 will deliver
seamless splicing effortlessly in concert with Duets in your analog systems.
The DPI-1200 can deliver up to twelve programs to the ad splicer. adManage
transparently delivers media and schedules and retrieves verifications and status
monitoring in the DPI environment just as in any other type of headend.
Headends
In an ad insertion enterprise, there are likely to be several different types of
headends with varying levels of connectivity available. From networked LAN/WAN
to satellite to disconnected remote, adManage can work with them all. Flexibly
better by design.
26
Appen d i x
Page 29

Page 30

C1 Traffic and Billing Central
Page 31

C2 Connected Headend
Page 32

C3 Satellite Serviced Headend
Page 33

C4 Disconnected Headend
Page 34

D CCMS Schedule Format
Field # Field Name Bytes Description
A schedule file exists for each channel of insertion. The file name
will always be eight characters in length plus the three character
extension of SCH.
MDDCCHHH.SCH
M -
Represents month of intended airing.
Range 1 - C Ex. 1 = January, C = December
Hexadecimal format
DD -
Represents day of month of intended airing
Range 01-31 Ex. 05
CC -
Numeric identifier or Channel ID
Range 01-99
HHH -
Numeric identifier or Headend ID
Range 001- 099
The records within the SCH file follow the following format. Each
record is terminated by a carriage return and line feed. Each record
will all be at least 77 bytes in length. The fields of each record are
determined by its byte position. Each field is separated by a space
character. All times are formatted in military time.
The record format is as follows :
Field # Field Name Bytes Description
1
Event Type
1-3 Type of event defined by record
(LOI, REM,END, NUL)
4 Window Start Time 17-20 Time of day to begin window of
5 Window Duration
Time
6 Break Number Within
Window
7 Position Number
Within Break
8 Scheduled Length 35-40 Scheduled event length (formatted
9 Actual Aired Time 42-47 Actual aired time of day used in VER
10 Actual Aired Length 49-56 Actual aired length used in VER file
11 Actual Aired Position
Within Break
12 Spot Identification 62-72 T&Bs spot identification code used
13 Status Code 74-77 Completion status Code used in VER
14 Advertiser Name 79-110 Advertiser’s name as identified in T&B.
15 Advertiser Spot Name 112-131 Advertiser’s Spot Name as identified
16 Scheduled/Fill 133-136 Identifies the spot as either being
17 Traffic System
Reserved
18 User Defined 145-NNN For use in tracking other data.
22-25 Length of window of opportunity for
27-29 Break sequence number within
30-33 Position sequence number for event
58-60 Actual sequential position number that
138-143 Reserved for use by the Traffic System
opportunity for event to occur
(formatted - HHMM)
event to occur (formatted - HHMM)
window of opportunity for event to
occur
within break
- HHMMSS)
file. (Formatted HHMMSS)
(formatted - HHMMSSCC)
event occurred in. Used in VER file
by adManage as the commercial
file name. See Headend>File Name
Length configuration on how this spot
ID is converted into a file name.
file.(See Appendix E for definition of
Status Codes)
in T&B
scheduled contractually or used
as filler in order to complete a
commercial break.
adManage uses this field in Merged
schedules to identify the event line as
a local or interconnect event.
2 Scheduled Date 5-8 T&Bs approximation of the date
3 Scheduled Time 10-15 T&Bs approximation of the time of day
when the event will occur (formatted
- MMDD)
when the event will occur (formatted
- HHMMSS)
32
Appen d i x
Page 35

E Verification Status Codes
Status Code Definition Possible Cause
0001 Aired Successfully
0002 Generic Failed to Air The scheduled event was
0004 Failed, Bypass On
0006 Failed, Bad Video The video stalled during
0008 Failed, User Abort The active insert was aborted
0010 Failed, Device Not Ready Possible hard drive issue.
0012 Failed, Unknown Error If any stall conditions occur
0013 Failed, Time Out The break was closed before
0015 Failed, System Error Possible hardware failure.
0020 Failed, No Ad Copy in
Inserter
not run by the Duet. All
events are marked with a
0002 at the beginning of the
broadcast day. As the event
is run by the Duet, the status
code is changed to an actual
error code.
playback. The actual air time
will be updated.
1. File read errors occur
during playback from a bad
file or hard drive problem.
Try replacing the video file.
2. The VERIFYERRORLMT
threshold of decode errors
was exceeded. Try to reencode the file. See the Duet
manual for details.
by operator intervention.
The hard drive may not be
partitioned.
during playback, the spot will
not be verified, even if the
system was able to continue
after the stall condition. The
actual played length will be
updated in the VER file for
partial verifications.
all spots could be aired.
The commercial inserter did
not have the scheduled ad
copy to play. Causes include:
- Material not copied
into adManage
MasterVideoLibrary.
- The material is not in
the inserter because of a
communication error.
- The material is on the
headend PURGE list (see
Content Management Purge).
Status Code Definition Possible Cause
0023 Failed, No Cue in Window No cue was received in the
scheduled window. See
the Duet manual chapter
on Cue Methods for more
information.
33Appe n d i x
Page 36

F Duet Log Trace Messages
0 - No Trace Message
1 - Raw Log Message
2 - Log Comment
3 - Trace Log Banner
Transport Log Messages (1000 Series)
1000 - PLAY
1001 – TOP SPOT
1002 - NEXT SPOT
1003 - PREVIOUS SPOT
1004 - PAUSE SPOT
1005 - SLOW SHUTTLE SPOT
1006 – INDEX TO TIMECODE
1007 – REWIND TO BEGINNING OF SPOT
1008 – CUE SPOT
1009 – PLAY SPOT
1010 – MULTICAST RECEIVE ON
1011 – MULTICAST RECEIVE OFF
1012 – MULTICAST RECEIVE RST
Transition Log Messages (2000 Series)
2000 - TRACE_MSG_TRANSITION_PLAY
2001 - TRACE_MSG_TRANSITION_STOP
FCMP Log Messages (3000 Series)
3000 - Receive file opened
3001 - Partial receive file opened
3002 - Replacement file opened
3003 - Partial replacement file opened
3004 - Receive file closed as complete
3005 - Receive file closed as partial
3006 - Replacement file renamed
3007 - End normally (received end message)
3008 - End abort (received end message with abort)
3009 - End due to error (something wrong, file not erased)
3010 - Abort due to error (file i/o error or something wrong,
file erased)
3011 - Receive process timed out
3012 - System command received and processed
3013 - System command sent
3014 - Error running report, probably not enough RAM
3015 - Unknown condition or error
3016 - FEC queue is full
Scheduling Log Messages (4000 Series)
4128 - Insert message type (only 1 network)
4129 - CCMS mode only - indicates missing spot in playlist
4130 - Indicates error in insert
4131 - Indicates that insert ran shorter than expected
4132 - Indicates that decode errors exceeded preset threshold
4133 - Indicates that the insert timed out
4144 - Miss BREAK SPOT in prior break
4145 - Miss NO OPEN NETSET
4156 - Miss NO NETSET TRIGGER
4147 - Miss INSERT by no network video present
4148 - Miss INSERT by No Break
4149 - Miss INSERT by No Spots
4150 - Miss TRANSPORT WOULD NOT START
4151 - Miss DUET BOARD NOT PRESENT
4160 - Launch message type
4160 - Launch INSERT by Time
4161 - Launch INSERT by Tone
4162 - Launch INSERT by GPI
4163 - Launch INSERT by Keypad
4164 - Launch INSERT by Terminal
4176 - Route message type
4176 - Route Satellite
4177 - Route Insert
4187 - Route Auxillary
4179 - Route Off
4192 - End INSERT by Time
4193 - End INSERT by Tone
4194 - End INSERT by GPI
4195 - End INSERT by Spot
4196 - End INSERT by Avail
4197 - End INSERT by Video Loss
4198 - End INSERT by Keypad
4199 - End INSERT by Terminal
4208 - Partial Tones EXT
4209 - Partial Tones CBD
4224 - Duet reset
4240 - Reset message type
4240 - Power Up
4241 - Soft Reset
4242 - Net Sets in NV file updated
4243 - Break Sets in NV file updated
4244 - Net Sets in NV file updated
4245 - Net Sets in NV file updated
4246 - Break Sets in NV file updated
4247 - Net Sets in NV file updated
4248 - Save the CCMS VER file
34
Appen d i x
Page 37

4249 - Load the CCMS VER file
4250 - Load the CCMS SCH file
4251 - CCSM Sch not fully loaded, buffer not big enough
4252 - CCSM Ver not fully loaded, buffer not big enough
5000 Series
5000 - FTP Server Get
5001 - FTP Server Put
5002 - FTP Client Get
5003 - FTP Client Put
5004 - FTP Send Command longterm failure
5010 - FTP CCMS mirror started by timer
5011 - FTP CCMS mirror started by command
5012 - FTP CCMS mirror done
5013 - FTP CCMS mirror done - no connection
5014 - FTP CCMS mirror done - no HIP configured
5015 - FTP CCMS mirror HIP comm longterm failure
6000 Series
6000 - Telnet Connected
6001 - Telnet Disconnected
6002 - Telnet Bad Username/Password
6003 - Telnet Connection Timed Out
7000 Series
7000, - EMT Subscription received
7001 - EMT Subscription received
7002 - EMT Subcribed
7003 - EMT File sent
7004 - EMT File received
7005 - EMT turned ON
7006 - EMT turned OFF
8000 Series
8000 - Issued Lan chip reset and kickstart
8001 - Netstats reset was issued
8002 - LanKickStart was issued
8003 - LanMux received bad message
8004 - TASK_Lan destructed
8900 - Relay reset, pings failed to find it
10000 Series
10000 - Rom upgrade successful (IFP, or Rom DVC file)
10001 - Rom upgrade failed (IFP, or Rom DVC file)
10002 - Rom upgradematch failed (IFP, or Rom DVC file)
10100 - ParPin6 status change
10109 - (all possible argsPARPIN6 entries)
11000 Series
11000 - ScanDisc OK
11001 - ScanDisc No Drive/Disc
11002 - ScanDisc Read Error
11003 - ScanDisc Write Error
11004 - ScanDisc Unit Error
11005 - ScanDisc Volume Error
11006 - ScanDisc Directory Error
11007 - ScanDisc Deleted a Crosslinked File
11008 - ScanDisc Deleted a Bad FAT Chain File
11009 - ScanDisc Freed up FAT
11010 - ScanDisc had problem scanning and bailed
12000 Series
12000 - File System Powered Up
12001 - File System Reset
12003 - No File
12004 - Read Error
12005 - Buffer Stalled
12006 - No GOP found in video buffer from Play Entry
12007 - Alternate Entry is a mismatch to Play Entry
12008 - No GOP found in Alternate Entry File
12009 - No File
12010 - Read Error
12011 - Buffer Stalled
12012 - No File
12013 - Read Error
12014 - No File
12015 - Read Error
12016 - Write Error
12017 - File is read only
12018 - Drive/disc missing
12019 - Drive/disc empty
12020 - Drive/disc loaded
12021 - Drive/disc removed
12022 - Drive/disc inserted
12023 - No File
12024 - Not Open
12025 - Continue Copy/Move
12026 - No Copy/Move streams, no more messages accepted
12027 - No Source File
12028 - No Destination File
12029 - File is read locked, max number of streams hit
12030 - File is write locked
12031 - Resize Error
12032 - Read Error
12033 - Write Error
35Appe n d i x
Page 38

12034 - Cancelled
12035 - No Drive/Disc
12036 - Read Error
12037 - Write Error
12038 - File already exists
12039 - Disc is full
12040 - No File
12041 - Read Error
12042 - Write Error
12043 - File or drive is read only
12044 - File is read locked, max number of streams hit
12045 - File is write locked
12046 - No File
12047 - No Filename to create
12048 - No File could be created
12049 - Resize failed
12050 - File is read only
12051 - File is read locked, max number of streams hit
12052 - File is write locked
12053 - File is already open
12054 - No File
12055 - Not Open
12056 - Read size greater than buffer size
12057 - Not Read Stream
12058 - Read Error occurred
12059 - EOF reached
12060 - No File
12061 - Read Error
12062 - No File
12063 - Read Error
12064 - Write Error
12065 - File is read only
12066 - No File
12067 - Read Error
12068 - Write Error
12069 - File is read only
12070 - Disc is full
12071 - File is corrupted
12072 - No File
12073 - Read Error
12074 - Write Error
12075 - No File
12076 - Read Error
12077 - Write Error
12078 - File is read only
12079 - No File
12080 - Read Error
12081 - Write Error
12082 - No File
12083 - Not Open
12084 - Write size greater than buffer size
12085 - Not Write Stream
12086 - Write Error occurred
12087 - Disc is Full
12088 - No directory entry found
12089 - Write to LBA was not successful
12090 - Read from LBA was not successful
12091 - File is read locked but open for write
12092 - File is read locked but open for write
12093 - File is read locked but open for write
12094 - File is read locked but open for write
12095 - Error in Transport file parse or copy
14000 Series
14000 - FEC Decode start
14001 - FEC Decode complete and ok
14002 - FEC Type is Turbo NonInterleaved
14003 - FEC Type is Turbo Interleaved
14004 - FEC Type is ReedSolomon NonInterleaved
14005 - FEC Type is ReedSolomon Interleaved
14006 - FEC bad PPR Header
14007 - FEC File corrupt, too many lost packets
14008 - FEC detected singular matrix
14009 - FEC File not found
14010 - FEC File read error
14011 - FEC File write error
14012 - FEC File open error
14013 - FEC File disc full
14014 - FEC File create fail
14015 - FEC File read size error (not multiple of N*BlockSize)
14016 - FEC File resize error
14017 - FEC File bad filename
14018 - FEC Unique File error
14019 - FEC File register error
14020 - FEC Stop
14021 - FEC Kill
14022 - TASK_Fec queue is full
14023 - FEC File rename error
15000 Series
15000 - CMDVIRT Index procedure
15001 - TRACE_MSG_CMDVIRT_INDEX_FAILED
16000 Series
16000 - Tuner in locked state
36
Appen d i x
Page 39

16001 - Tuner Task constructor done
16002 - Tuner in unlocked state
16003 - Tuner in unlocked state
16004 - Tuner in unlocked state
16005 - Tuner in unlocked state
16006 - Tuner in unlocked state
16007 - Tuner in unlocked state
16008 - Tuner in unlocked state
16009 - Tuner in unlocked state
16010 - Tuner in unlocked state
16011 - Tuner in unlocked state
16012 - Tuner in unlocked state
16013 - Tuner transitioned to unlocked state
16099 - Max # of trace messages for this unlocked state
17000 Series
17000 - XCP System command received and processed
17001 - XCP System command sent
18000 Series
18000 - Real Time Clock updated successfully(formatted in TASK_Clock)
18001 - Real Time Clock update failed (formatted in TASK_Clock)
19000 Series
19000 - IO stream operation timed out (OPEN,CLOSE,SEEK,READ,WRITE)
20000 Series
20000 - Multicast Insert: Start Cue Received
20001 - Multicast Insert: Start Cue Received, ignored transports off
20002 - Multicast Insert: Start Cue Received, ignored transports off
20003 - Multicast Insert: Stop Cue Received
20004 - Multicast Insert: Stop Cue Received, ignored extended window active
20005 - Multicast Insert: Stop Cue Received, ignored, insert not active
20100 - Multicast Insert: Schedule loaded
20101 - Multicast Insert: Schedule load failed
20102 - Multicast Insert: Schedule cleared
4130 - File Read Error
4131 - Play Stalled Error
4132 - Decode Errors
4208 - LOGID_EXTTONES
4209 - LOGID_CBDTONES
4129 - LOGID_INSERTNOSPOT
CCMS Trace Messages
FTP_CCMS_NO_COM - Mirroring fails to connect to the gateway.
FTP_CCMS_NO_HIP - System does not have a gateway configured.
FTP_CCMS_RESET - System has failed to connect with the gateway for three
consecutive mirror sessions. This condition also forces a reset of the entire LAN
system (Same as: NTS RESET).
FTP_SNDCMD_RESET - System has failed to send an FTP command to the
gateway for ten consecutive attempts. This condition also forces a reset of the
entire LAN system (Same as: NTS RESET).
37Appe n d i x
Page 40

G Standard Operating Procedures
Daily (Before T&B Verification)
1. Use eyeMonitor’s Verification Report to confirm that all verifications
have been returned since the last billing cycle (marked Complete). Determine
if there are any missing or partial verifications that will need to be retrieved
since the last time you verified. If verifications are missing or partial, correct
the issue or use autoDialer to get the final verification from the ad inserter.
2. Review Alarms assigned to you for corrective action.
Daily (All Day)
3. Use eyeMonitor’s Discrepancy Report to determine if there are any
outstanding error or cue issues that indicate insertion failures. Implement
corrective action for discrepancies.
4. Use eyeMonitor’s Headend Monitoring Zones to get a real time status of
all channels in each headend. To evaluate a run rate for a particular headend,
select any cell with in that headend and right click to navigate to Headend
Analysis.
5. Use the eyeMonitor Encode List Report (or the adCode encode list) and
encode all missing ad content.
Daily (After Schedules Are Created)
6. Use eyeMonitor’s Schedule Report to confirm that all new schedules are
loaded in the ad inserters.. Verify the time/date stamp of the schedule for
modified schedules.
7. Use the eyeMonitor Missing Content Report (or the adManage Content
Management > Missing) to determine if there are any spots missing or not
encoded for the schedules that are created. Correct any missing content
problems.
Monthly
1. Use adManage’s Content Management > Drive Status and Purge
Functions to maintain inserter drive health and efficiency.
2. Use adManage’s Content Management > System MVL to maintain the
Gateway Server’s drives and file maintenance.
3. Use adManage to setup Alarms for your users. You can assign any
alarm created to any user that has been setup.
Weekly
1. Use eyeMonitor’s Discrepancy Report to determine if there are any
outstanding error or cue issues for the system as well as any patters on
missed insertions
2. Use the eyeMonitor’s and adManage’s Run Rate percentage Alarms and
Reports to determine if any maintenance or adjustments need to be made to
improve overall performance.
3. Use adManage’s Content Management>Evergreen section to protect any
spots that you do not want to be deleted. This will protect the spot from any
type of deletion in adManage.
4. Verify that schedules and content are loaded for the weekend.
38
Appen d i x
Page 41

Intentionally Left Blank
Page 42

Corporate Headquarters & Domestic Sales USA
408 Russell Street
Nashville, TN 37206 USA
Tel.615.256.6619 Fax.615.256.6593
sales@adtecinc.com
International Sales
2231-3 Corporate Square Blvd.
Jacksonville, FL 32216-1921 USA
Tel. 904.394.0389 Fax. 904.421.0684
intlsales@adtecinc.com
Technical Support
Tel.615.256.6619 Fax.615.256.6593
www.adtecinc.com/support
support@adtecinc.com
www.adtecinc.com
 Loading...