

Page 1
User Guide
IM/SM1000 Issue 12
Videographic Recorder
SM1000
Page 2
ABB
The Company
EN ISO 9001:2000
We are an established world force in the design and manufacture of instrumentation for
industrial process control, flow measurement, gas and liquid analysis and environmental
applications.
Cert. No. Q 05907
As a part of ABB, a world leader in process automation technology, we offer customers
application expertise, service and support worldwide.
EN 29001 (ISO 9001)
We are committed to teamwork, high quality manufacturing, advanced technology and
unrivalled service and support.
The quality, accuracy and performance of the Company's products result from over 100 years
experience, combined with a continuous program of innovative design and development to
Lenno, Italy – Cert. No. 9/90A
incorporate the latest technology.
The UKAS Calibration Laboratory No. 0255 is just one of the ten flow calibration plants operated
Stonehouse, U.K.
by the Company and is indicative of our dedication to quality and accuracy.
0255
Electrical Safety
This equipment complies with the requirements of CEI/IEC 61010-1:2001-2 'Safety Requirements for Electrical Equipment for
Measurement, Control and Laboratory Use'. If the equipment is used in a manner NOT specified by the Company, the protection
provided by the equipment may be impaired.
Symbols
One or more of the following symbols may appear on the equipment labelling:
Warning – Refer to the manual for instructions Direct current supply only
Caution – Risk of electric shock Alternating current supply only
Protective earth (ground) terminal Both direct and alternating current supply
Earth (ground) terminal
Information in this manual is intended only to assist our customers in the efficient operation of our equipment. Use of this manual for
any other purpose is specifically prohibited and its contents are not to be reproduced in full or part without prior approval of the
Technical Publications Department.
Health and Safety
To ensure that our products are safe and without risk to health, the following points must be noted:
1. The relevant sections of these instructions must be read carefully before proceeding.
2. Warning labels on containers and packages must be observed.
3. Installation, operation, maintenance and servicing must only be carried out by suitably trained personnel and in accordance with the
information given.
4. Normal safety precautions must be taken to avoid the possibility of an accident occurring when operating in conditions of high pressure
and/or temperature.
5. Chemicals must be stored away from heat, protected from temperature extremes and powders kept dry. Normal safe handling
procedures must be used.
6. When disposing of chemicals ensure that no two chemicals are mixed.
The equipment is protected
through double insulation
Safety advice concerning the use of the equipment described in this manual or any relevant hazard data sheets (where applicable) may be
obtained from the Company address on the back cover, together with servicing and spares information.
Page 3

Videographic Recorder
SM1000 Contents
Contents
1 Introduction .....................................................................3
2 Operation .........................................................................5
2.1 Powering up the Instrument .....................................5
2.2 Displays and Controls ..............................................5
2.3 Chart Views .............................................................7
2.3.1 Electronic Signatures ..................................14
2.4 Bargraph Views ......................................................15
2.5 Digital Indicator View ..............................................17
2.6 Process View .........................................................20
2.7 Alarm Event Log .....................................................23
2.8 Totalizer Log ..........................................................25
2.9 Audit Log ...............................................................27
2.10 Status View ............................................................28
3 Setup .............................................................................29
3.1 Introduction ............................................................29
3.2 Accessing the Setup Level .....................................29
3.3 Password Entry ......................................................31
3.4 Setup Menu ...........................................................32
3.5 Archiving ................................................................34
3.5.1 Card Compatibility ......................................34
3.5.2 Media Status ..............................................34
3.5.3 Inserting and Removing Media ....................35
3.5.4 Archive File Types .......................................36
3.6 Text Format Archive Files .......................................37
3.6.1 Text Format Channel Data Files .................. 37
3.6.2 Text Format Filename Examples ................. 38
3.6.3 Text Format Log files ..................................38
3.6.4 Text Format Data File Examples ..................39
3.6.5 Text Format Data File Digital Signatures ......39
3.6.6 Text Format Data Verification and Integrity ..39
3.7 Binary Format Archive Files ....................................41
3.7.1 Binary Format Archive Filenames ................41
3.7.2 Binary Format Channel Data Files ...............41
3.7.3 Binary Format Log files ...............................41
3.7.4 Binary Format Data File Examples ...............41
3.7.5 Binary Format Data Verification
and Integrity ................................................41
3.8 Archiving Online/Offline ..........................................44
3.9 Backing-up Archived Data .....................................44
3.10 Archive Wrap .........................................................44
4 Configuration ................................................................ 45
4.1 Introduction ........................................................... 45
4.1.1 Configuration Level Security ....................... 45
4.1.2 Configuration Level Access ........................ 45
4.2 Overview of Configuration ...................................... 48
4.2.1 Adjusting Screen Contrast .......................... 48
4.3 Making Changes to Parameters ............................. 49
4.4 Common Configuration ......................................... 52
4.4.1 Setup ......................................................... 52
4.4.2 Screen ....................................................... 53
4.4.3 Time ........................................................... 54
4.4.4 Security ...................................................... 56
4.4.5 Users ......................................................... 58
4.4.6 Logs ........................................................... 60
4.4.7 Operator Messages .................................... 60
4.5 Process Group Configuration ................................. 61
4.5.1 Setting the Recording Parameters .............. 61
4.5.2 Configuring the Chart View ......................... 63
4.5.3 Configuring the Bargraph View ................... 66
4.5.4 Configuring the Process View ..................... 67
4.5.5 Configuring the Digital Indicator View .......... 68
4.5.6 Archiving .................................................... 70
4.6 Channel Configuration ........................................... 72
4.6.1 Recording Channel Setup .......................... 72
4.6.2 Analog Input Configuration ......................... 74
4.6.3 Digital Input Configuration .......................... 77
4.6.4 Alarm Configuration .................................... 78
4.6.5 Totalizer Configuration ................................ 84
4.7 Functions .............................................................. 87
4.7.1 Custom Linearizers .................................... 87
4.7.2 Real-time Alarms ........................................ 88
4.8 I/O Module Configuration ....................................... 89
4.8.1 Analog Inputs ............................................. 89
4.8.2 Relay Modules ........................................... 90
4.8.3 Ethernet Modules ....................................... 90
4.8.4 RS485 (Modbus™) Communications ......... 91
4.8.5 Comms Analog Input ................................. 92
4.8.6 Comms Digital Input ................................... 93
4.8.7 Hybrid Modules .......................................... 94
4.9 Modbus TCP ......................................................... 95
IM/SM1000 Issue 12 1
Page 4

Videographic Recorder
SM1000 Contents
5 Installation .....................................................................96
5.1 Siting ......................................................................96
5.2 Mounting ................................................................97
5.3 Electrical Connections ............................................98
5.4 Analog Inputs .......................................................100
5.4.1 Current and Voltage ..................................100
5.4.2 Thermocouple ...........................................100
5.4.3 Resistance Thermometer (RTD) .................100
5.4.4 Transmitter Power Supply .........................100
5.5 RS422/485 Serial Communications ......................101
5.6 Mains Power Connections ....................................102
5.7 Relay Output Board Connections .........................102
5.8 Hybrid I/O Module Connections ............................103
5.8.1 Digital Output Connections .......................103
5.8.2 Digital Input Connections ..........................103
5.8.3 Analog Output Connections ......................103
Appendix A – Signal Sources ..........................................104
Appendix B – Modbus Guide ..........................................106
B.1 Introduction ..........................................................106
B.2 Setting Up ............................................................106
B.3 Modbus Commands Supported ...........................106
B.4 Modbus Exception Responses .............................106
B.5 Operating Mode Modbus Coils .............................106
B.6 Operating Mode Modbus Registers ......................112
B.7 Comms. Analog and Digital Inputs ........................114
Appendix C – Storage Capacity ..................................... 116
C.1 Internal Storage Capacity .....................................116
C.2 Archive Storage Capacity ..................................... 117
Appendix D – Default Settings .......................................119
D.1 Company Standard .............................................. 119
D.1.1 Common Configuration ............................ 119
D.1.2 Process Groups 1 to 6 .............................119
D.1.3 Recording Channels .................................120
D.1.4 I/O Modules ..............................................120
D.1.5 Functions .................................................121
D.2 QuickStart Templates ..........................................121
D.2.1 QSMilliAmp ............................................... 121
D.2.2 QSFlow .................................................... 121
D.2.3 QSTHC_C ................................................ 121
D.2.4 QSTHC_F .................................................121
D.2.5 QSRTD_C ................................................ 121
D.2.6 QSRTD_F .................................................121
D.2.7 QSDEMO ................................................. 122
D.2.8 QSDAIRY .................................................123
Appendix E – Spare Parts and Accessories .................. 124
Appendix F – Error & Diagnostics Information .............. 126
Appendix G – Symbols and Icons ..................................127
Index .................................................................................128
2 IM/SM1000 Issue 12
Page 5
Videographic Recorder
SM1000 1Introduction
1Introduction
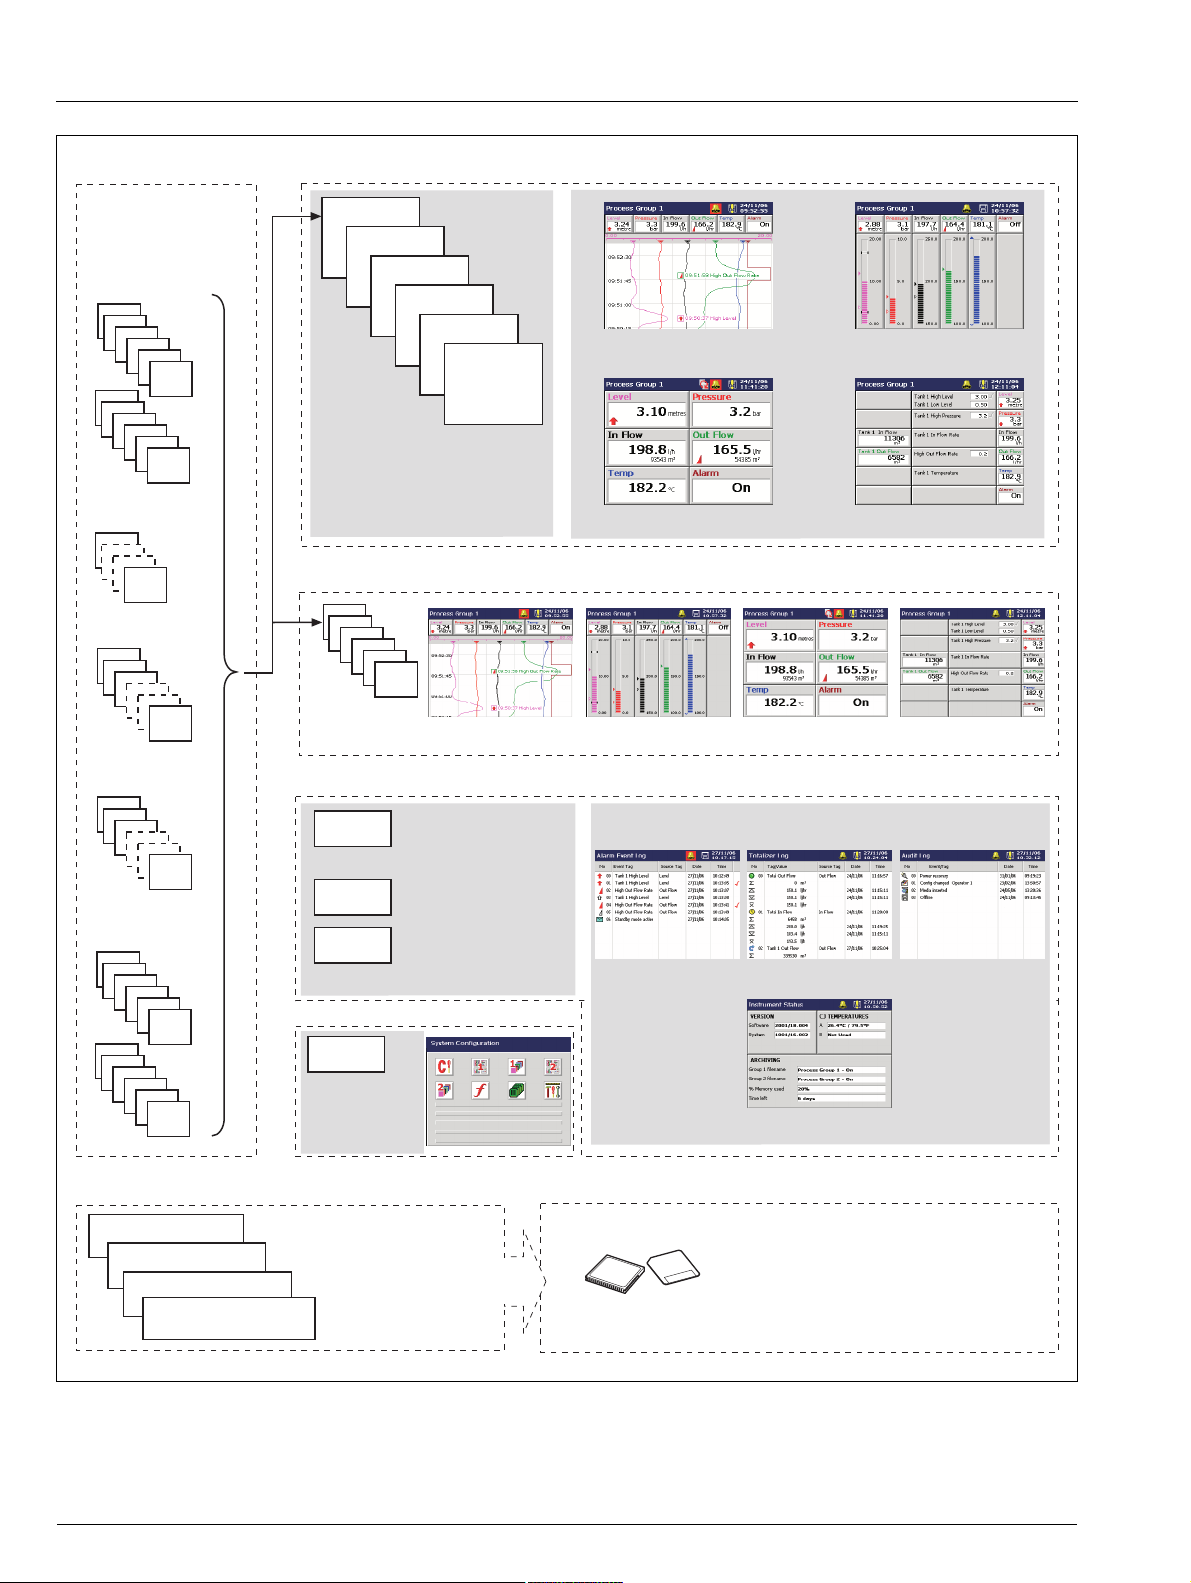
Functional Overview – Fig. 1.1
12 Recording Channels as standard, divided into 2 Process Groups, each with 6 Recording Channels.
Two Alarms and one Totalizer (if Totalizer option is enabled) are assigned to each Recording Channel.
Signal sources derived from universal analog inputs, the Modbus serial link, optional digital inputs or internal analog and digital
signals.
Any source can be assigned to any recording channel.
Data from assigned sources can be displayed in:
– Vertical or Horizontal Chart view format
– Vertical or Horizontal Bargraph view format
– Digital Indicator view format
– Process view format
Three instrument logs record alarm events, totalizer values (if totalizer option is enabled) and system/configuration changes.
Screen Capture facility – saves an image of any of the operator views to external archive media provided external archive media
with sufficient free space is inserted in the instrument. It is not necessary for archiving to be 'online'.
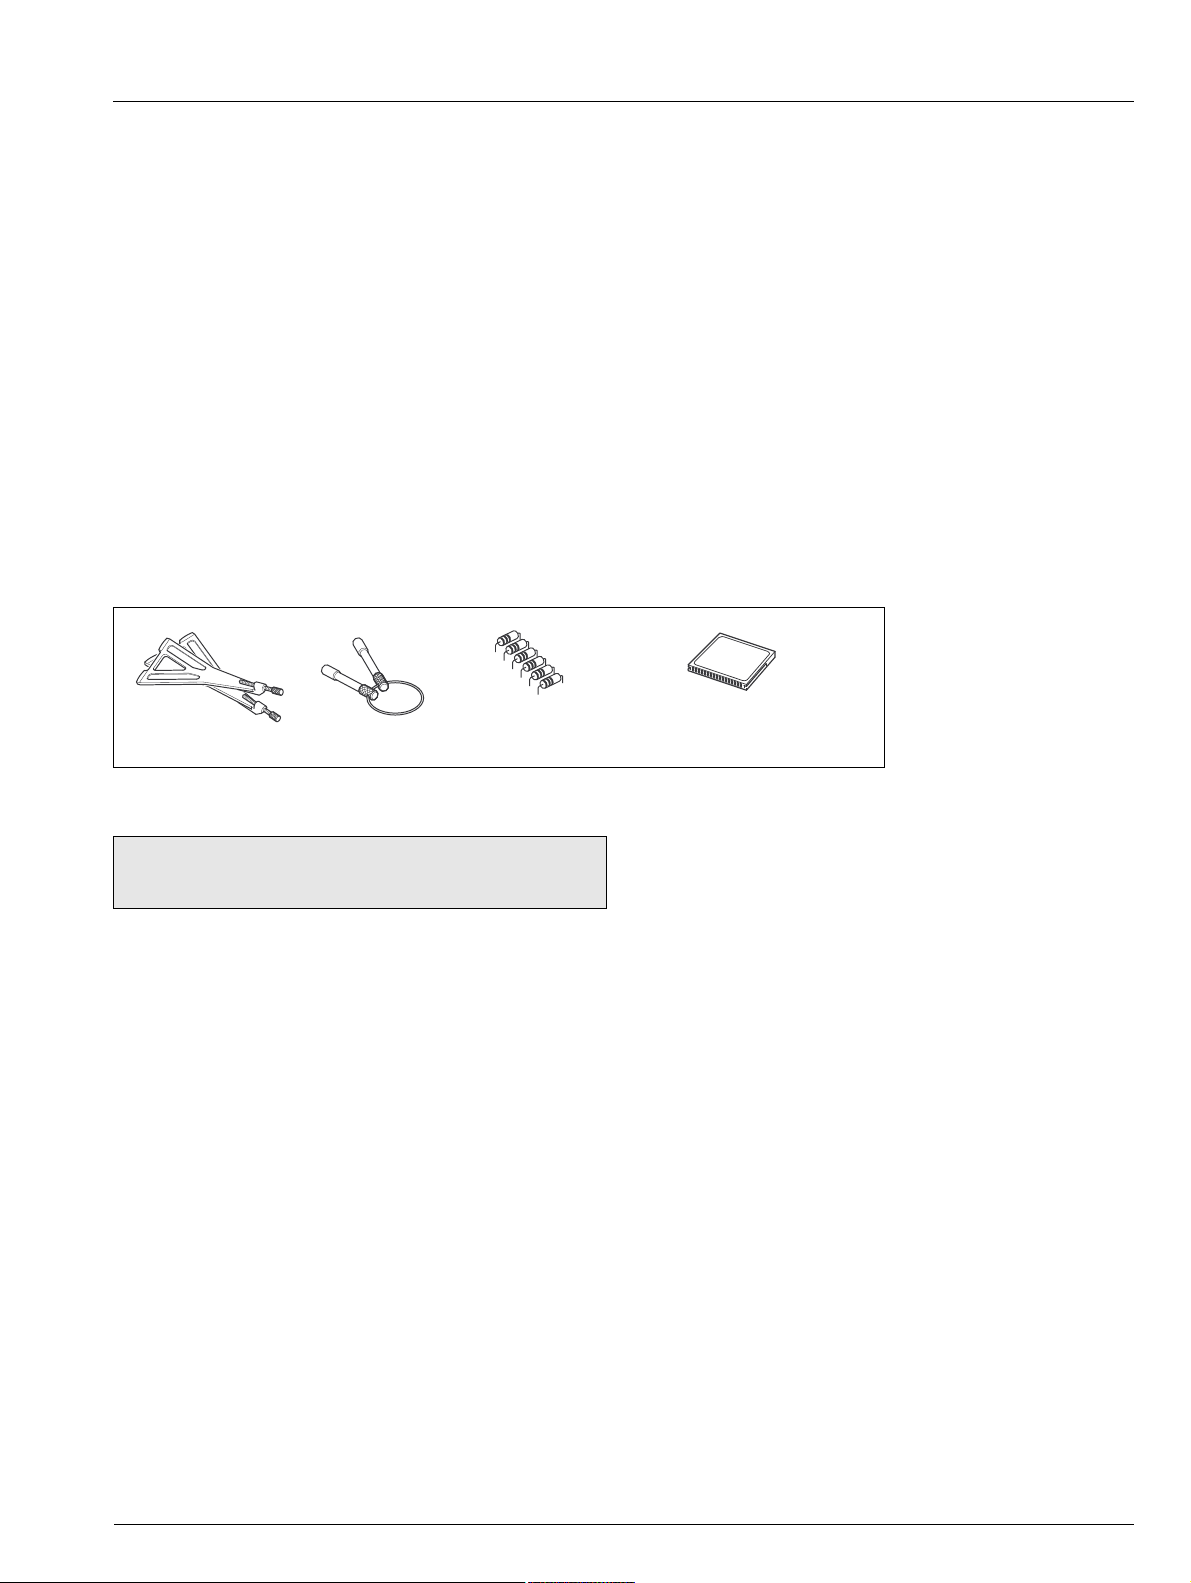
Shunt Resistors
(1 per analog input)
Mounting Clamps
Keys
Standard Accessories
Note. For optional accessories, refer to Appendix E on
page 124.
Compact Flash Card
(If fitted with a compact flash drive)
IM/SM1000 Issue 12 3
Page 6
Videographic Recorder
SM1000 1Introduction
Signal Sources
Note. Signal sources
can be assigned to any
recording channel in
either process group.
Analog Inputs
A1
A2
A3
A4
A5
A6
B1
B2
B3
B4
B5
B6
Internal sources
see Appendix A
Comms.
Analog Inputs
1
2
3
24
Comms.
Digital Inputs
1
2
3
24
Digital Inputs
C1
C2
C3
C4
C5
C6
D1
D2
D3
D4
D5
D6
Process Group 1
1.1
1.2
1.3
1.4
1.5
Two process groups as
standard provide 12 recording
channels, irrespective of the
number of external inputs.
Process Group 2
2.1
2.2
2.3
2.4
2.5
2.6
Recording
Channels
2.1 to 2.6
Instrument Logs
Alarm/Event Log
Totalizer Log
Audit Log
Configuration Data
Configuration
Data
Stores all
instrument
configuration,
calibration and
user preferences
Records all alarm
transitions and all
operator messages
Records all totalizer
activity*
Records all system
acfivity
*If totalizer option fitted
Recording
Channels
1.1 to 1.6
1.6
Digital Indicator View (Section 2.5) Process View (Section 2.6)
Chart View Bargraph View Digital Indicator View Process View
Alarm Event Log
(Section 2.7)
Totalizer Log
(Section 2.8)
Bargraph View (Section 2.4)Chart View (Section 2.3)
Audit Log
(Section 2.9)
Views provide a window on the stored data.
Status View
Recorded Data
Recording Channels 1.1 to 1.6
(Process Group 1)
Recording Channels 2.1 to 2.6
(Process Group 2)
Instrument Logs
Configuration Data
Files stored in
instrument's on-board
flash memory. Newest
data overwrites oldest.
Archive Data
Data saved to archive storage media
Archive Media
Fig. 1.1 Functional Overview
4 IM/SM1000 Issue 12
Page 7
Videographic Recorder
SM1000 2Operation
2Operation
2.1 Powering up the Instrument
When power is first applied to the instrument, its processor carries out a number of self-tests and displays the start-up screen.
At the end of the start-up sequence the instrument displays the Operator View that was being displayed when the instrument was
powered down.
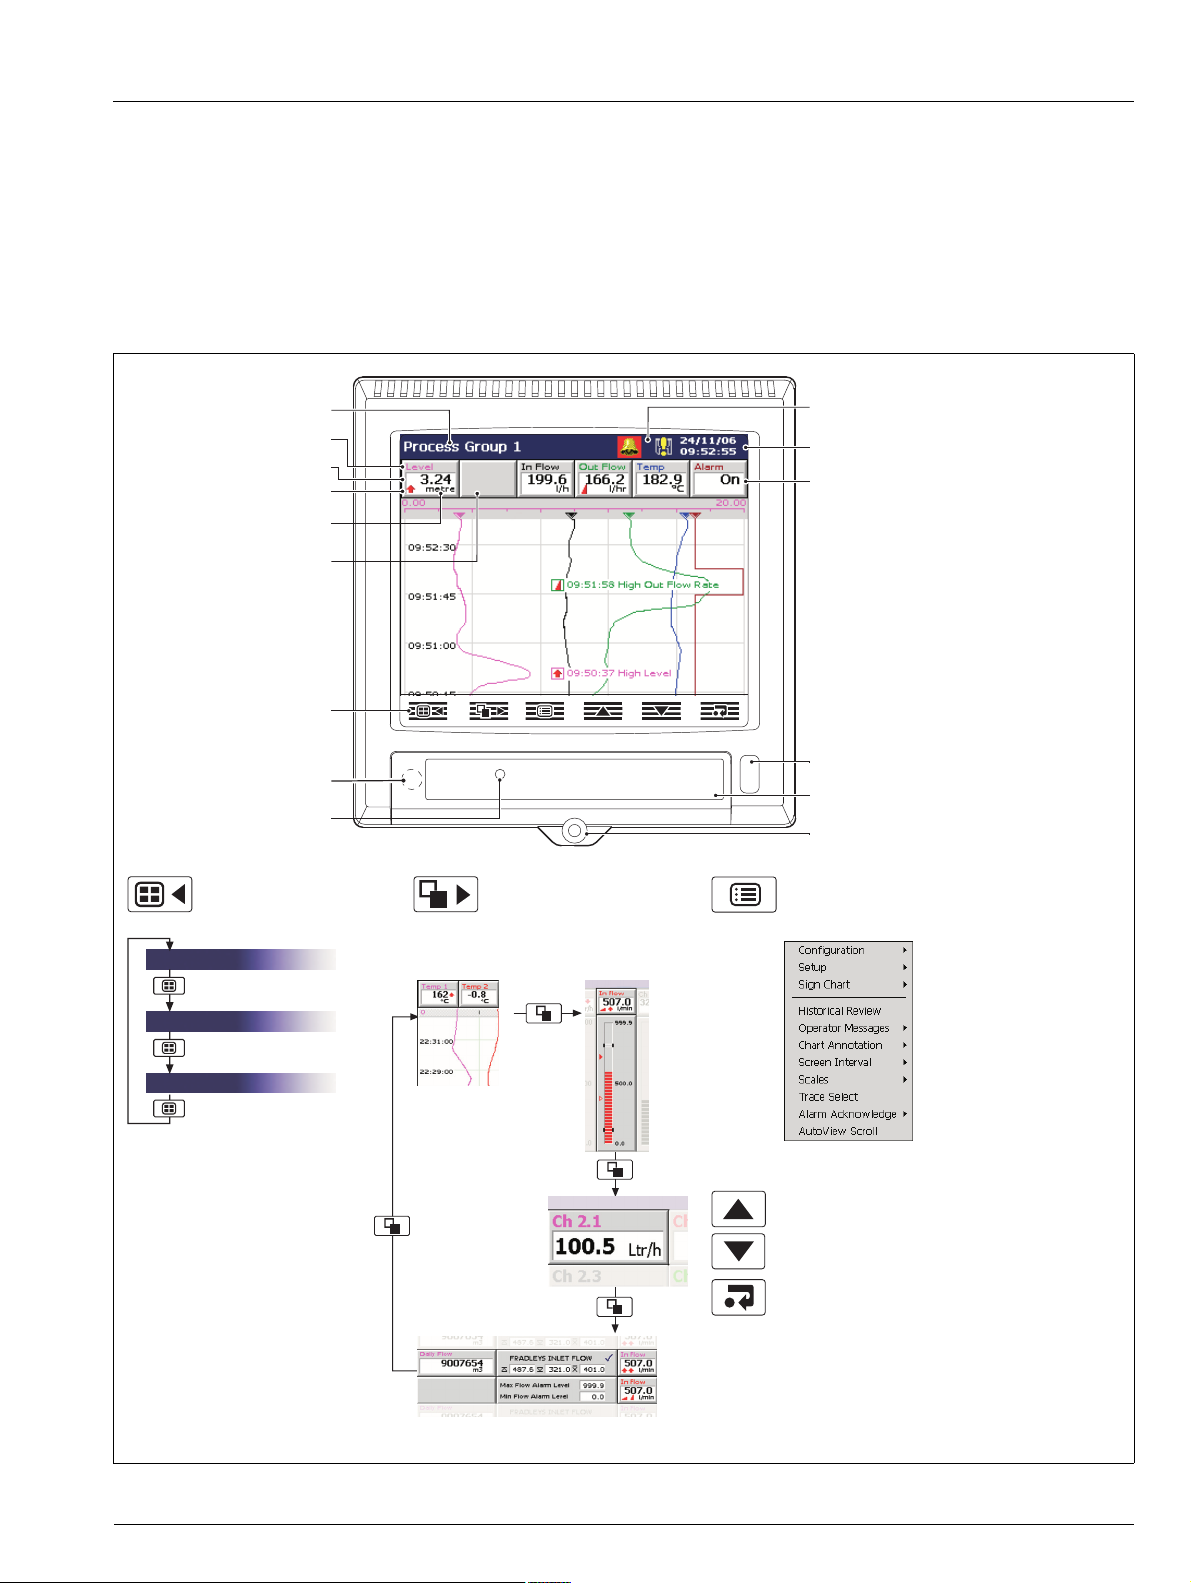
2.2 Displays and Controls – Figs. 2.1 and 2.2
In normal day-to-day use, the instrument is operated via the Operator Keys located along the bottom of the screen.
Process Group Name
Short Channel Tag
Current Value
Alarm Status
Engineering Units
Channel not enabled
Operator Keys
Programming Socket
(Inside Door)
Door Lock
Group Key
Selects a different
process group.
Process Group 1
View Key
Selects a different process
view or log.
Chart View
see Section 2.3
Status Icons – see Appendix G, page 127
Current Date and Time
Digital ON or OFF tag,
according to input status
Infrared Link
Media Door
Jacking Screw and Fitting for
Tamper-evident Seal
Menu Key
Displays or hides the context-sensitive operator
menu associated with each view.
Bargraph Views
see Section 2.4
Process Group 2
Instrument Status & Logs
Also cancels the menu without making a change
or returns to the previous menu level.
Digital Indicator
View see
Section 2.5
Process View
see Section 2.6
Up/Down Keys
Highlights menu items and scrolls through
previously recorded data.
Enter Key
Selects the highlighted menu item.
If 'Screen capture' is set to 'Enabled' (see
Section 4.4.1, page 52) and external archive
media is inserted in the instrument, the operator
can save a snapshot of any operator view to the
external media, if pressed when the menu is not
open.
Fig. 2.1 Displays and Controls
IM/SM1000 Issue 12 5
Page 8
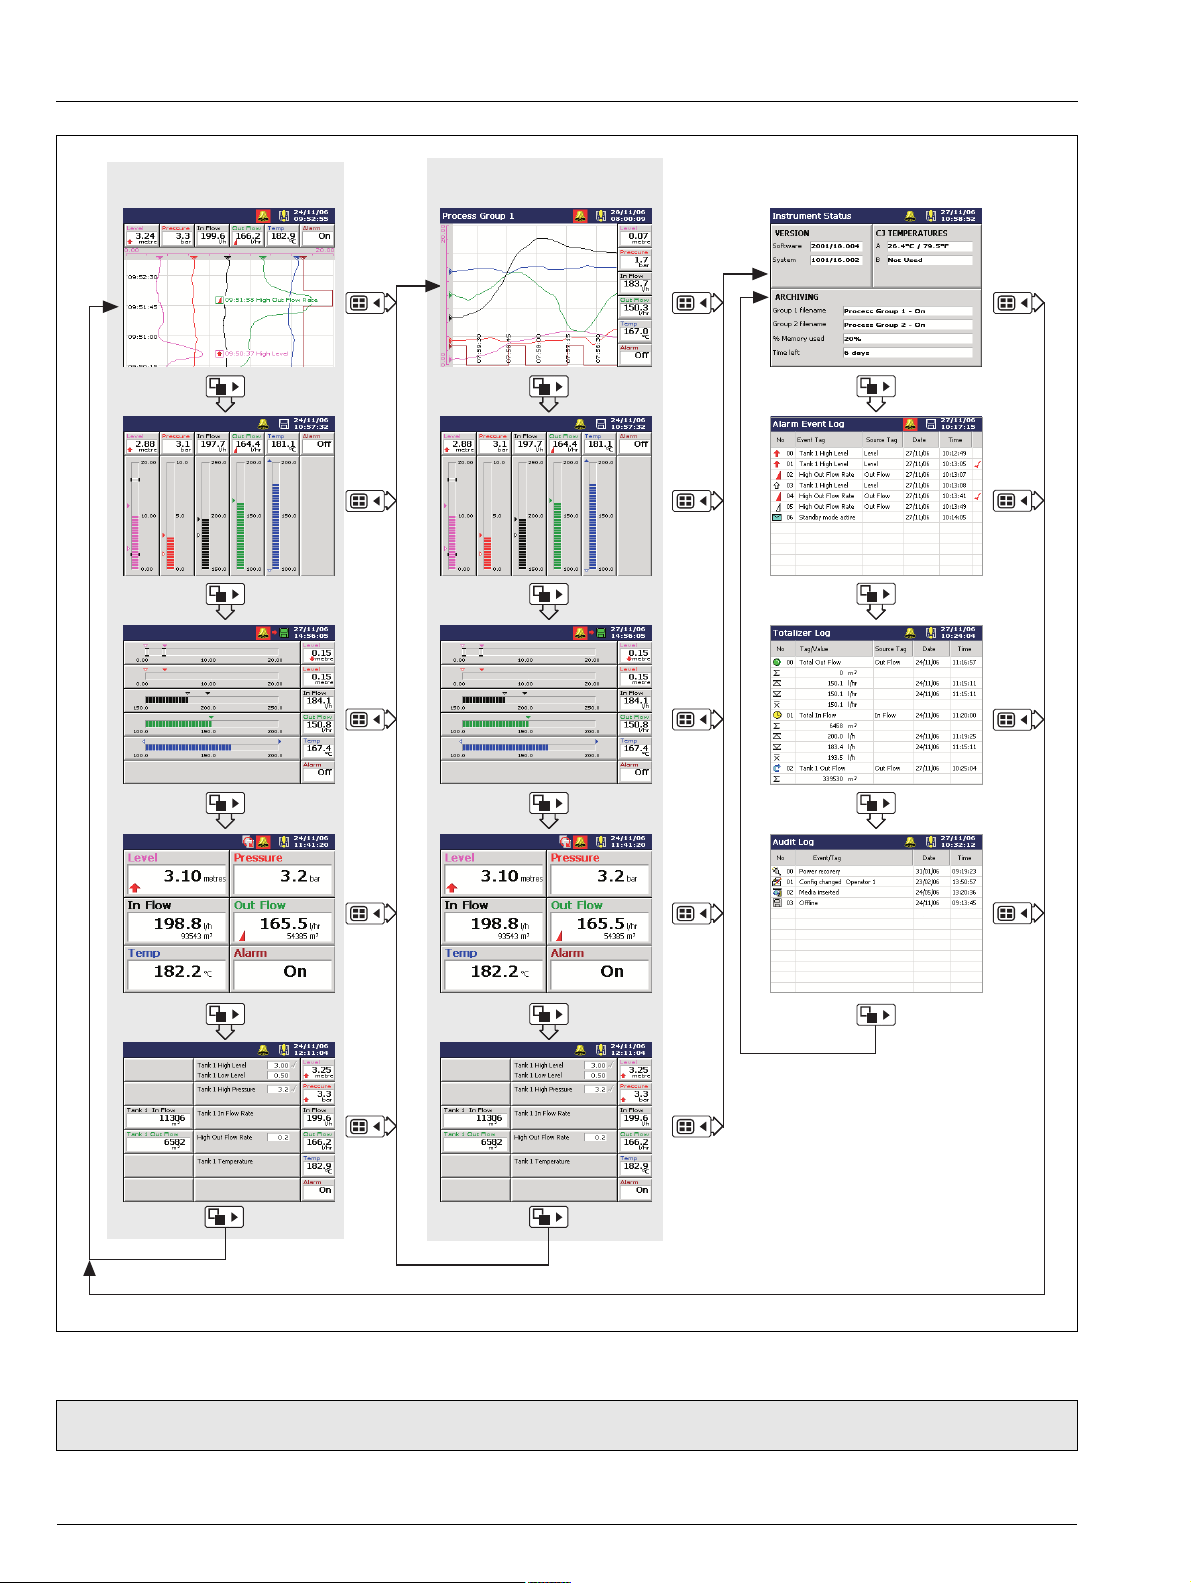
Videographic Recorder
SM1000 2Operation
Process Group 1
(Recording Channels 1.1 to 1.6)
Chart View
Vertical Bargraph
Horizontal Bargraph
Process Group 2
(Recording Channels 2.1 to 2.6)
Vertical Bargraph
Horizontal Bargraph
Digital Indicator
Process View
Fig. 2.2 Overview of Operator Displays
Digital Indicator
Process View
Note. Only process groups and views that have been enabled are displayed – see Section 4.5, page 61.
6 IM/SM1000 Issue 12
Page 9
Videographic Recorder
SM1000 2Operation
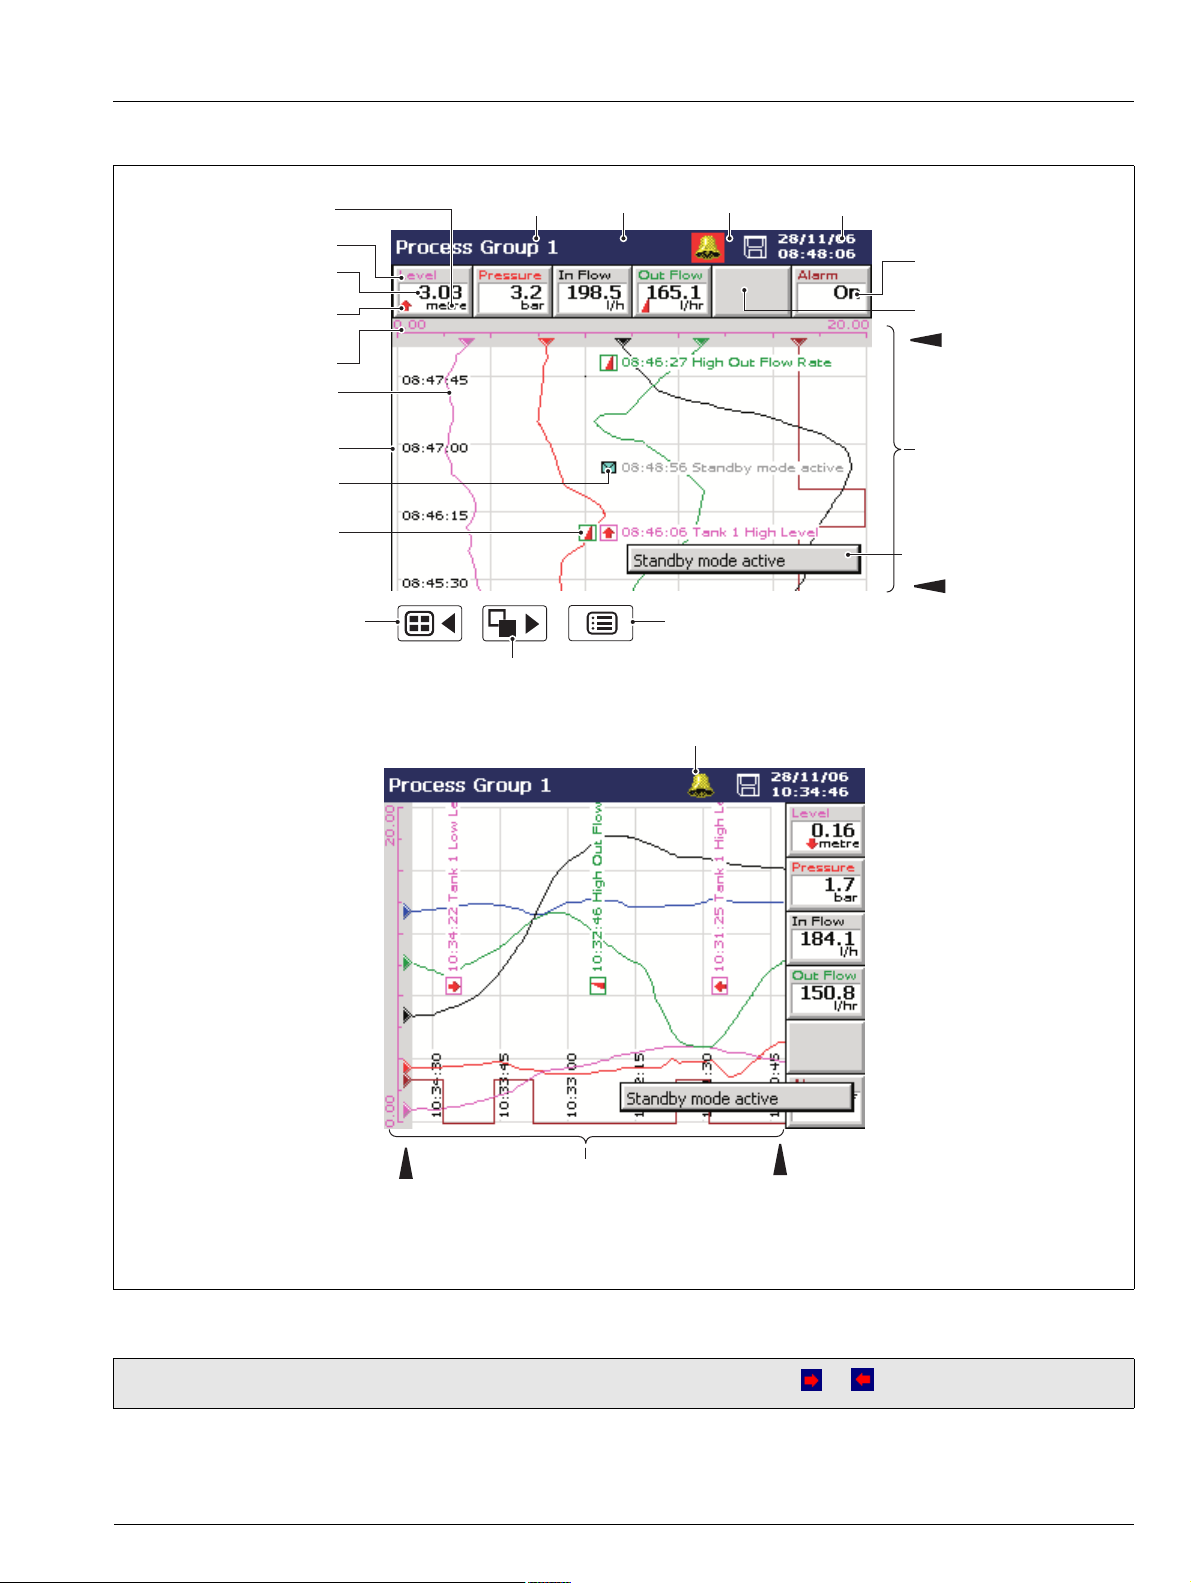
2.3 Chart Views – Fig. 2.3
Units
Short Channel Tag
Current Value
(see Note 1 on Page 8)
Alarm Event Icon
(see Note 2 on Page 8)
Scale Bar
Chart Trace
Time Stamp
Operator Message Annotation
(see Note 3 on Page 8)
Alarm Event Annotation
(see Note 3 on Page 8)
Selects next Process Group
(if enabled) or Status View
Group Tag
Selects the next enabled
view in the group
(Bar, Digital or Process)
Status Bar
Status Icons
Opens the Operator Menu for
the current view
Global Alarm Status Icon (see Note 1 on Page 8)
Current Date and Time
Digital On/Off Tag
Channel Not Used
Newest Data
Screen Interval
Operator Message
(appears for 1 second)
Oldest Data
Newest Data
For a description of the Status Icons (displayed in the Status Bar) and Alarm Event Icons
(displayed in the Bargraph, Digital Indicators, Process and Chart Views), see Appendix G, page 127.
Screen Interval
Oldest Data
Fig. 2.3 Horizontal and Vertical Chart Views
Note. Do not remove media while either of the media update in progress status icons ( or ) are displayed.
IM/SM1000 Issue 12 7
Page 10
Videographic Recorder
SM1000 2Operation
Note.
1. Current Values
The Current Value, shown on the digital indicators at either the top (vertical chart view) or right hand side (horizontal chart
view) of the screen, is the latest instantaneous value and its update rate is not affected by the recording sample rate.
If the current value in the digital indicator is displayed in red, recording has been stopped for that channel – see Section 3.4,
page 32 and see Section 4.6.1, page 72.
Traces are shown only when that particular channel is being recorded. When a channel is set to Stop, its trace continues to
be shown for up to one sample period.
2. Alarm Status
– Flashing red alarm event icon – alarm active and unacknowledged
– Continuous red alarm event icon – alarm active and acknowledged
If
any alarm in any process group is active, the Global Alarm status icon ( ) is displayed in the status bar – see Fig. 2.3. If
any active alarm in any process group is unacknowledged, the icon is surrounded by a red flashing border ( ).
3. Alarm Event and Operator Message Annotations
Alarm Event and Operator Message annotations are not shown on the chart unless enabled – see 'Chart Annotation' on
page 11 and see Section 4.5.2, page 63.
If Alarm event annotation is enabled and an alarm becomes active, a red alarm event icon surrounded by a channel colored
box is displayed at the point at which the alarm occurred, together with the alarm time and tag, e.g.
11:58:00 1.1A High Level
If more than one alarm occurs in the same sample period:
– and the second alarm on a channel becomes active, its icon is added behind the first.
– and more than one operator message is active (max. six), a second icon is added behind the first.
– the new alarm event icons appear to the left of earlier icons.
– the time and tag of the oldest alarm (right-most icon) only is displayed.
4. Screen Capture
If 'Screen capture' is set to 'Enabled' in Common Configuration (see Section 4.4.1, page 52) and an external archive media
card is inserted in the instrument, an image of any Chart, Bargraph, Digital Indicator, Process, Instrument Status, Audit
Log, Alarm Log or Totalizer Log view can be saved to the external media by pressing the key whenever the Operator
Menu is not open.
8 IM/SM1000 Issue 12
Page 11
Videographic Recorder
SM1000 2Operation
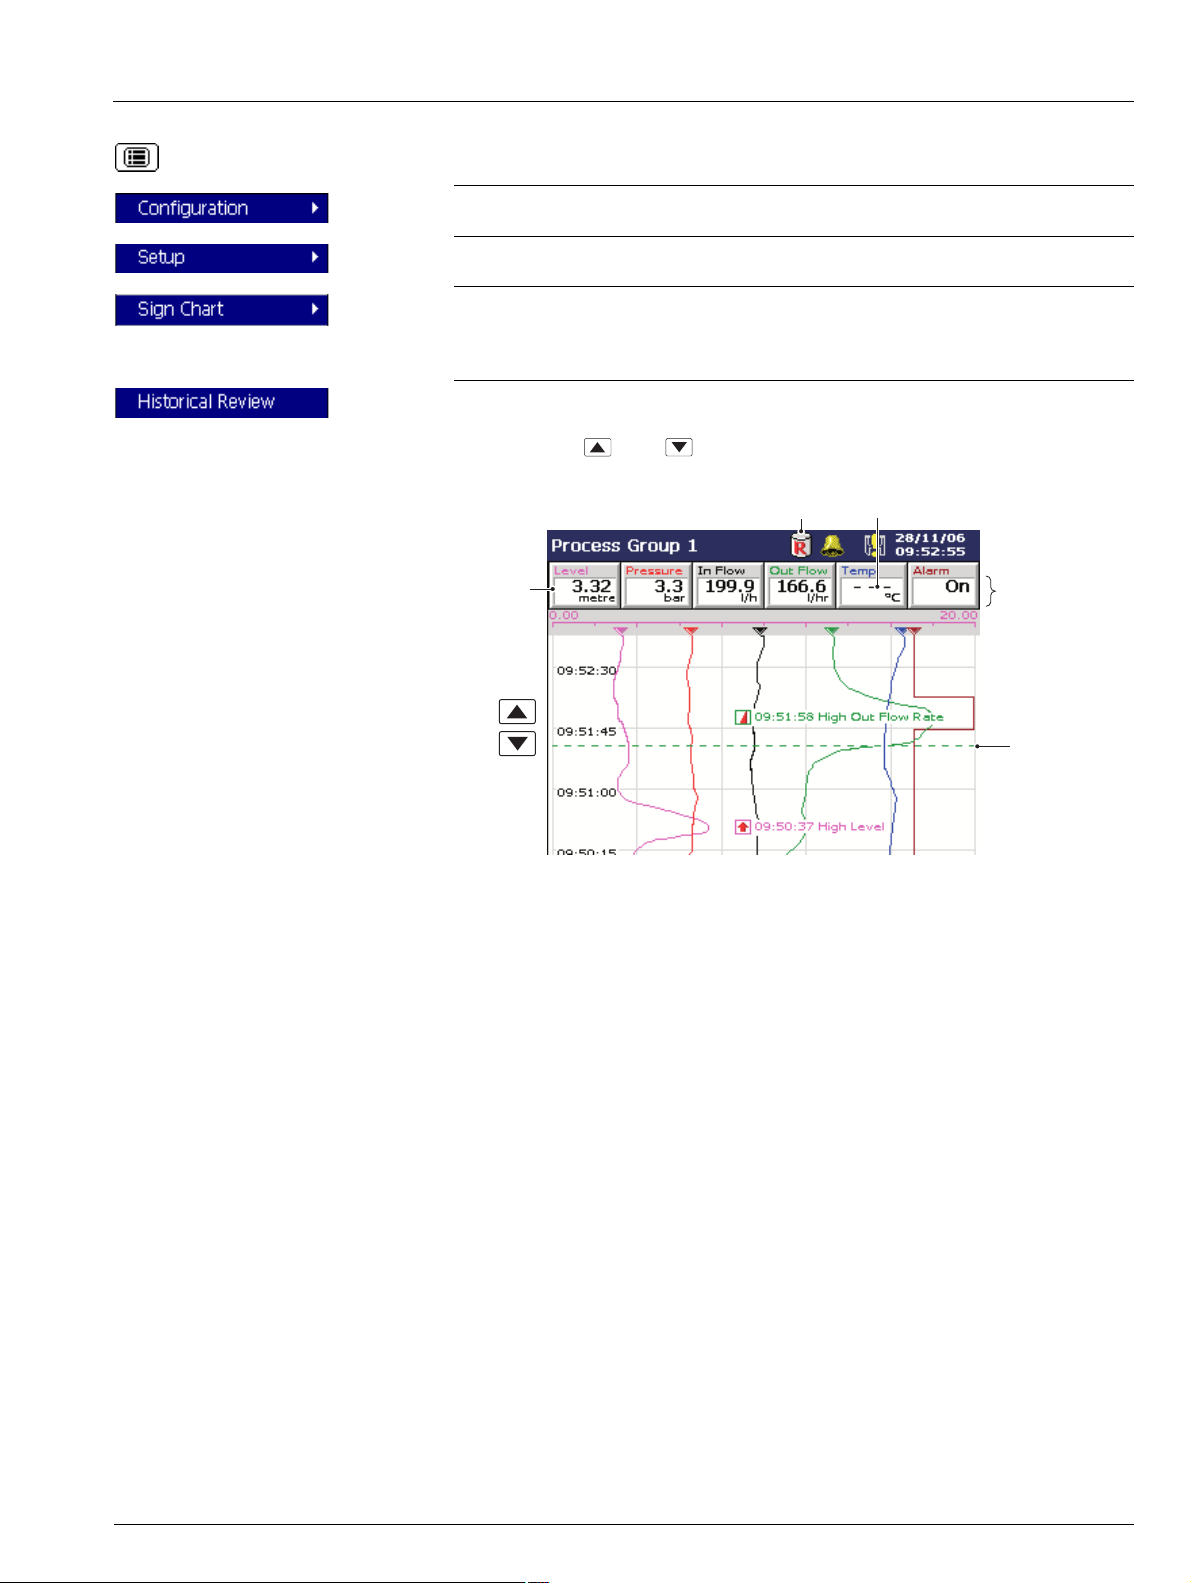
Select the Configuration Level – see Section 4, page 45.
Select the Setup Level – see Section 3, page 29.
Note.
Available only if 'Security system' is set to 'Advanced' – see Section 4.4.4, page 56.
Sign the chart electronically – see Section 2.3.1, page 14.
Select Historical Review to view previously recorded data stored in the instrument's
onboard memory.
Note. Use the and keys to move backwards and forwards through the
recorded data.
Historical Review Active Invalid data e.g. recording disabled
Digital
Indicators
Values displayed
indicate the
process status at
the cursor position
Cursor
IM/SM1000 Issue 12 9
Page 12
Videographic Recorder
SM1000 2Operation
Note.
While in Historical Review mode:
Recording of new data continues unless stopped from the Setup Menu – see
Section 3.4, page 32.
Invalid historical data (e.g. when recording has stopped) is denoted by '– – –' in the
digital indicator.
Where the trace at the cursor position represents more than one sample, the
indicators flash between the maximum and minimum values of those samples.
Menu options remain active – allowing the screen interval to be changed, different
scales and channels to be selected, etc.
Operator messages generated are added to the alarm event log at the present
time, not the time indicated by the cursor.
All data stored in the instrument's internal memory can be viewed.
The display can be scrolled back to the start of the oldest data.
Archiving to removable media does not occur but all data recorded in the internal
memory buffer during this time is archived on exiting Historical Review mode.
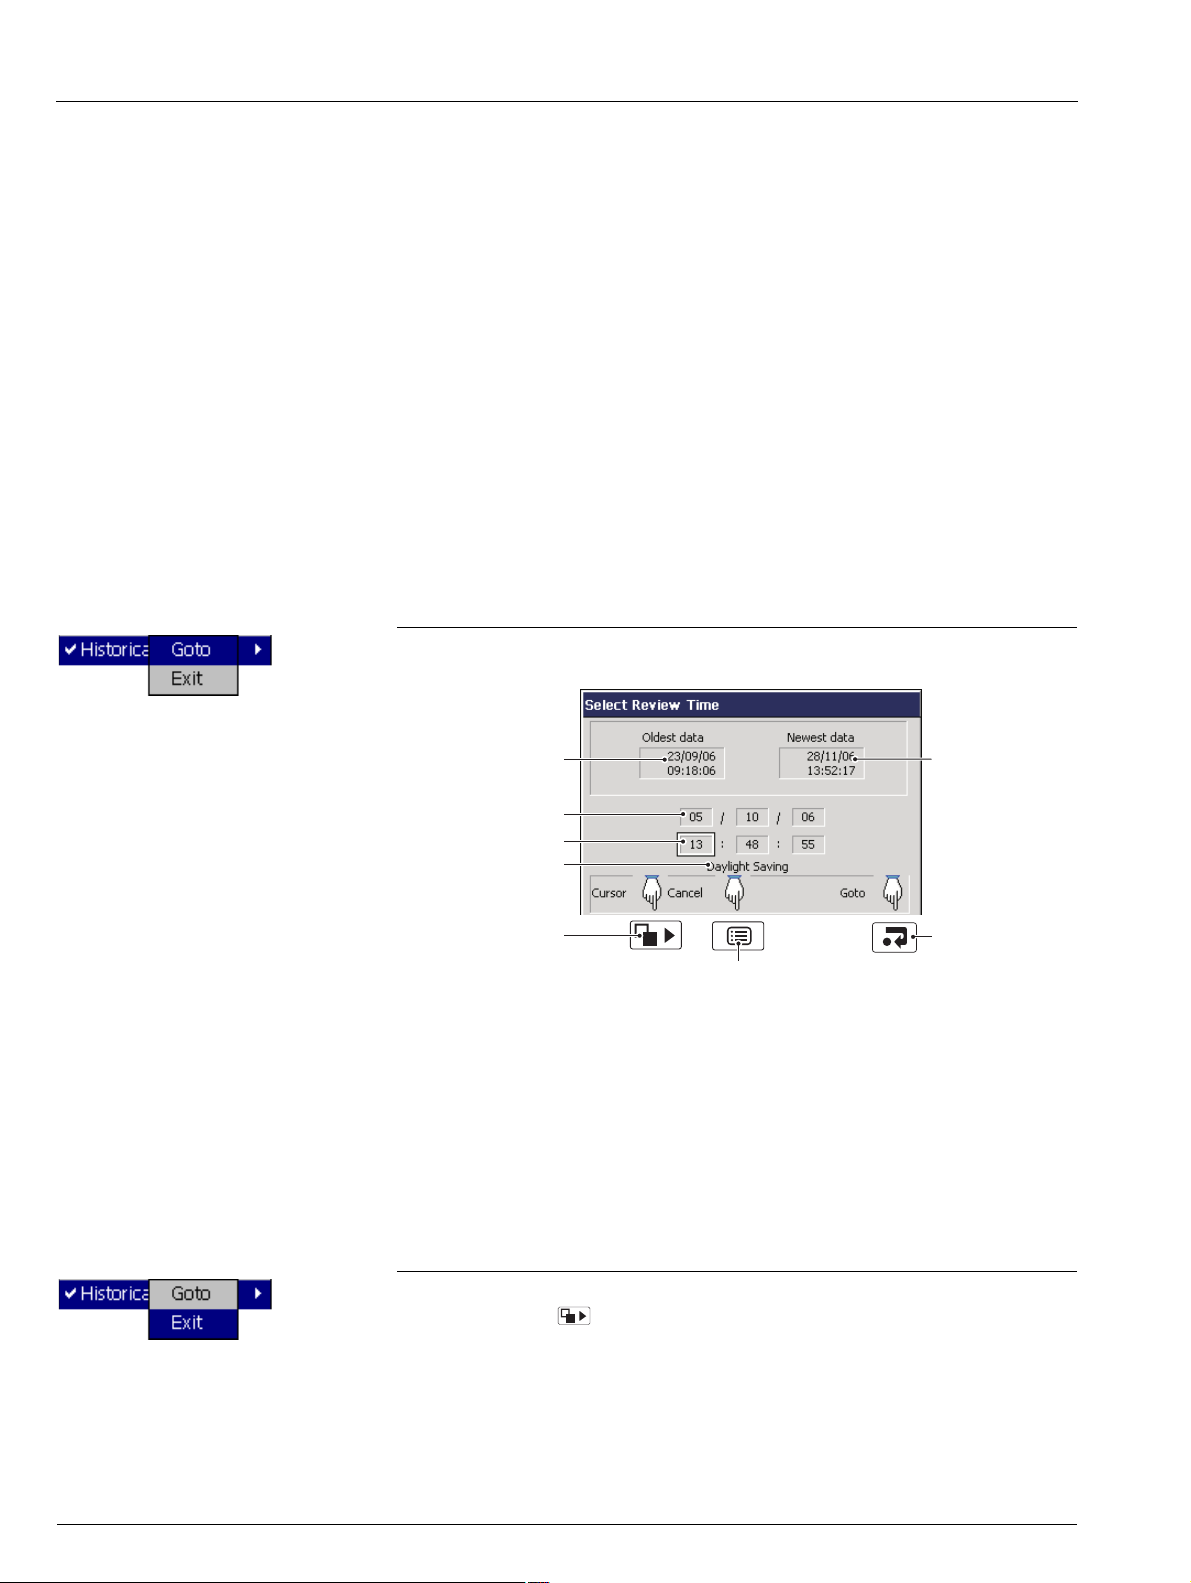
Select 'Goto' to move to data stored in the instrument's onboard memory that was
recorded at a specific date and time.
Oldest data in
internal memory
'Goto' target date
'Goto' target time
Selected 'goto' target
date/time is within
daylight saving period
Moves cursor between
'goto' target date and
time boxes
Returns to Menu
Newest data in
internal memory
Goes to the chart
view at the selected
'goto' target date
and time
Note.
If daylight saving is enabled (see Section 4.4.3, page 54) and the selected 'Goto'
target date/time is within the daylight saving period, 'Daylight Saving' is displayed
on the dialog box.
Once internal memory becomes full, oldest data is overwritten by newest data. If
historical review has been selected for some time, the oldest data present may no
longer be available.
The instrument exits Historical Review mode automatically after 15 minutes if no
key is pressed.
Select Exit to return to the real-time recording display.
Note. Pressing the key also exits Historical Review mode and displays the next
enabled view.
10 IM/SM1000 Issue 12
Page 13
Videographic Recorder
SM1000 2Operation
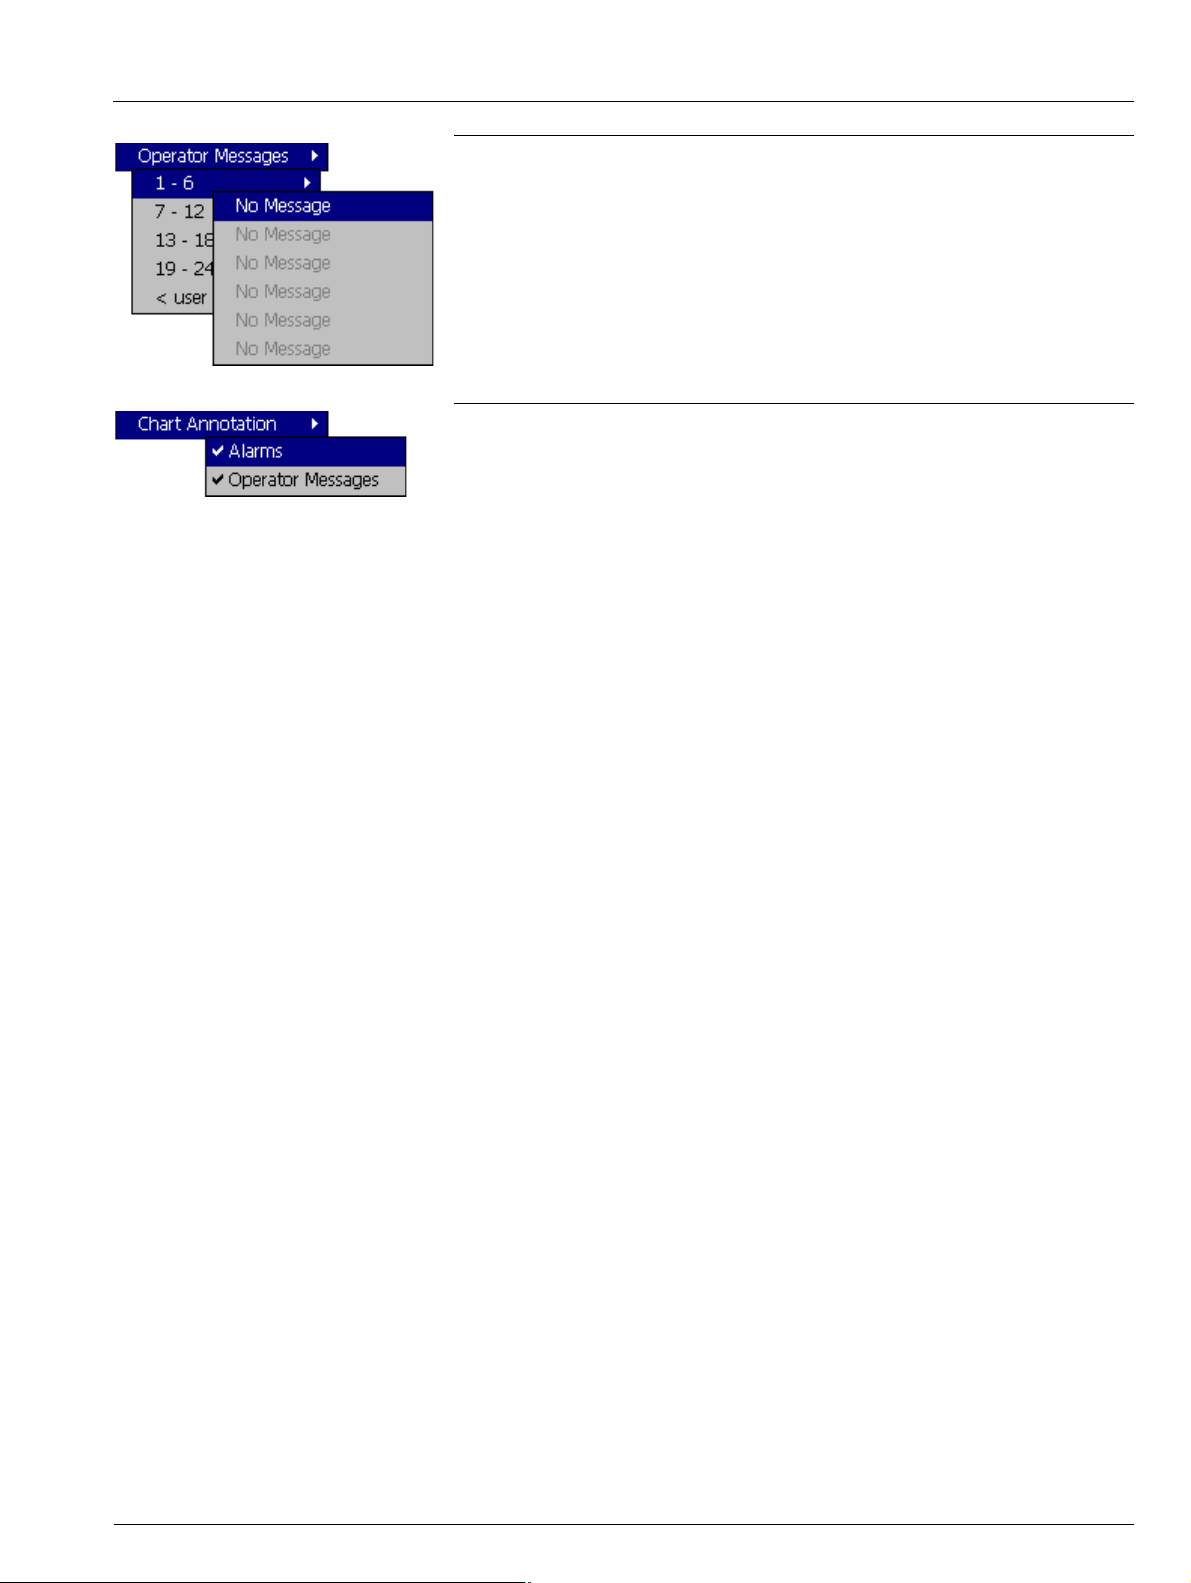
Add one of 24 predefined Operator Messages (see Section 4.4.7, page 60) or one UserDefined Message to the alarm event log.
If '< user defined >' is selected, a data entry keyboard appears to enable the message to
be entered (see Fig. 4.6, page 50).
The selected or user-defined message is displayed briefly on screen. If Operator
Message annotation is selected (see 'Chart Annotation' below) the message is also
added to the chart.
Note. When the instrument is in Historical Review mode, Operator Messages generated
are added at the current time, not the time indicated by the cursor.
If an alarm or operator message is obscuring part of a chart trace, use the Chart
Annotation option to hide or display alarms and messages on the screen. Select the
annotation required. indicates the annotations selected.
The possible combinations are:
No annotation (Alarms and Operator Messages both disabled)
Alarm annotation only
Alarms and Operator Message annotation
Operator Message annotation cannot be enabled unless Alarm annotation is also
enabled.
Note.
If more than 15 icons are present on the screen, chart annotation is disabled
automatically.
When chart annotation is disabled, new operator messages and alarms are still
added to the Alarm Event log – see Section 2.7, page 23.
IM/SM1000 Issue 12 11
Page 14
Videographic Recorder
SM1000 2Operation
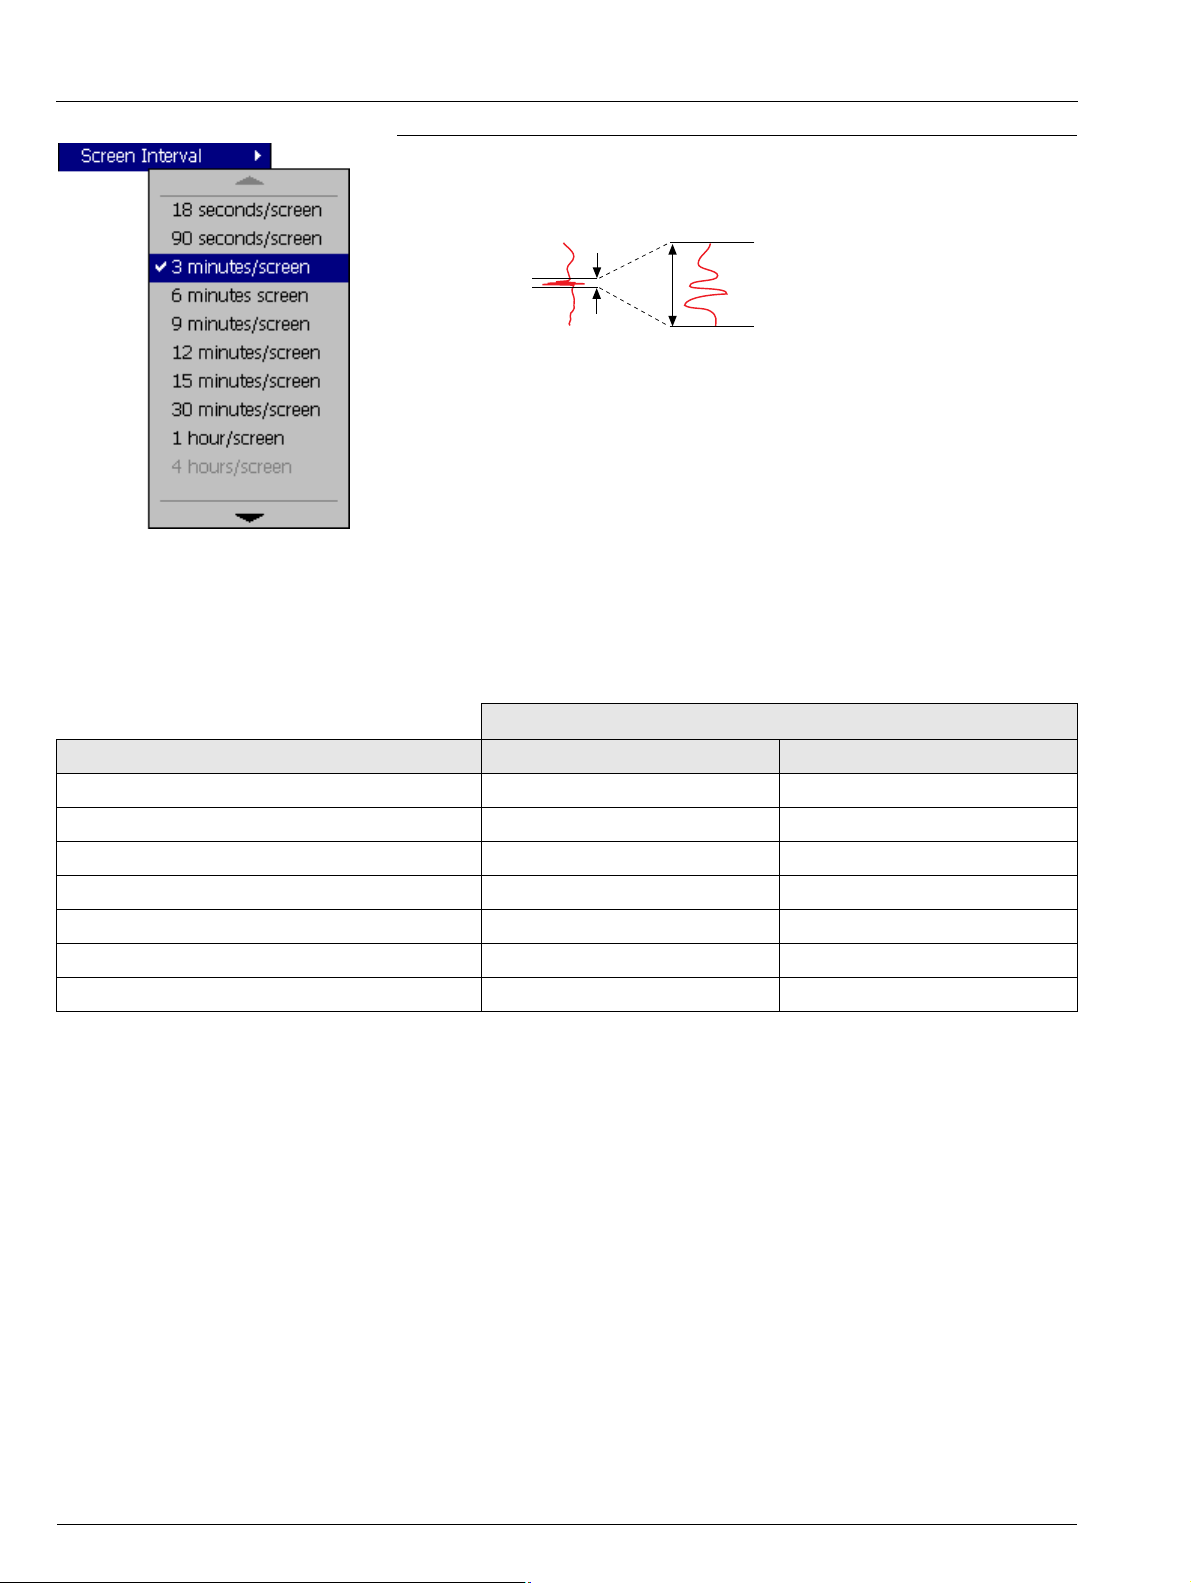
Use the 'Screen Interval' to change the amount of data displayed on the screen. A longer
screen interval displays more data, a shorter screen interval displays data over a shorter
time period, but in more detail. In both cases, the full trace is preserved by plotting the
maximum and minimum samples for each display point.
Longer interval =
better overview
Shorter interval
= more detail
The screen intervals available in the menu are determined by the faster of the primary
and secondary sample rates set for the process group during configuration – see
Section 4.5.1, page 61. Unavailable screen intervals are greyed-out.
Table 2.1 shows the relationship between sample rate and screen interval for the Vertical
and Horizontal Chart views.
Note.
A 'Please Wait' message appears in the status bar while the instrument retrieves
data from storage.
Selecting a different screen interval does not affect the rate at which data is
sampled.
When in historical review mode, changing the screen interval causes the time at
the cursor position to change.
Maximum Screen Interval
Sample Rate Setting Vertical Chart View horizontal Chart View
<1 second Up to 9 minutes/screen Up to 13 minutes/screen
Between 1 and 10 seconds Up to 1 hour/screen Up to 1.5 hours/screen
More than 10 seconds, less than 20 seconds Up to 12 hours/screen Up to 18 hours/screen
Between 20 and 40 seconds Up to 1 day/screen Up to 1.5 days/screen
Between 40 and 60 seconds Up to 2 days/screen Up to 3 days/screen
More than 60 seconds, less than 140 seconds Up to 3 days/screen Up to 4.5 days/screen
More than 140 seconds Up to 7 days/screen Up to 10 days/screen
Table 2.1 Sample Rates and Screen Intervals
12 IM/SM1000 Issue 12
Page 15
Videographic Recorder
SM1000 2Operation
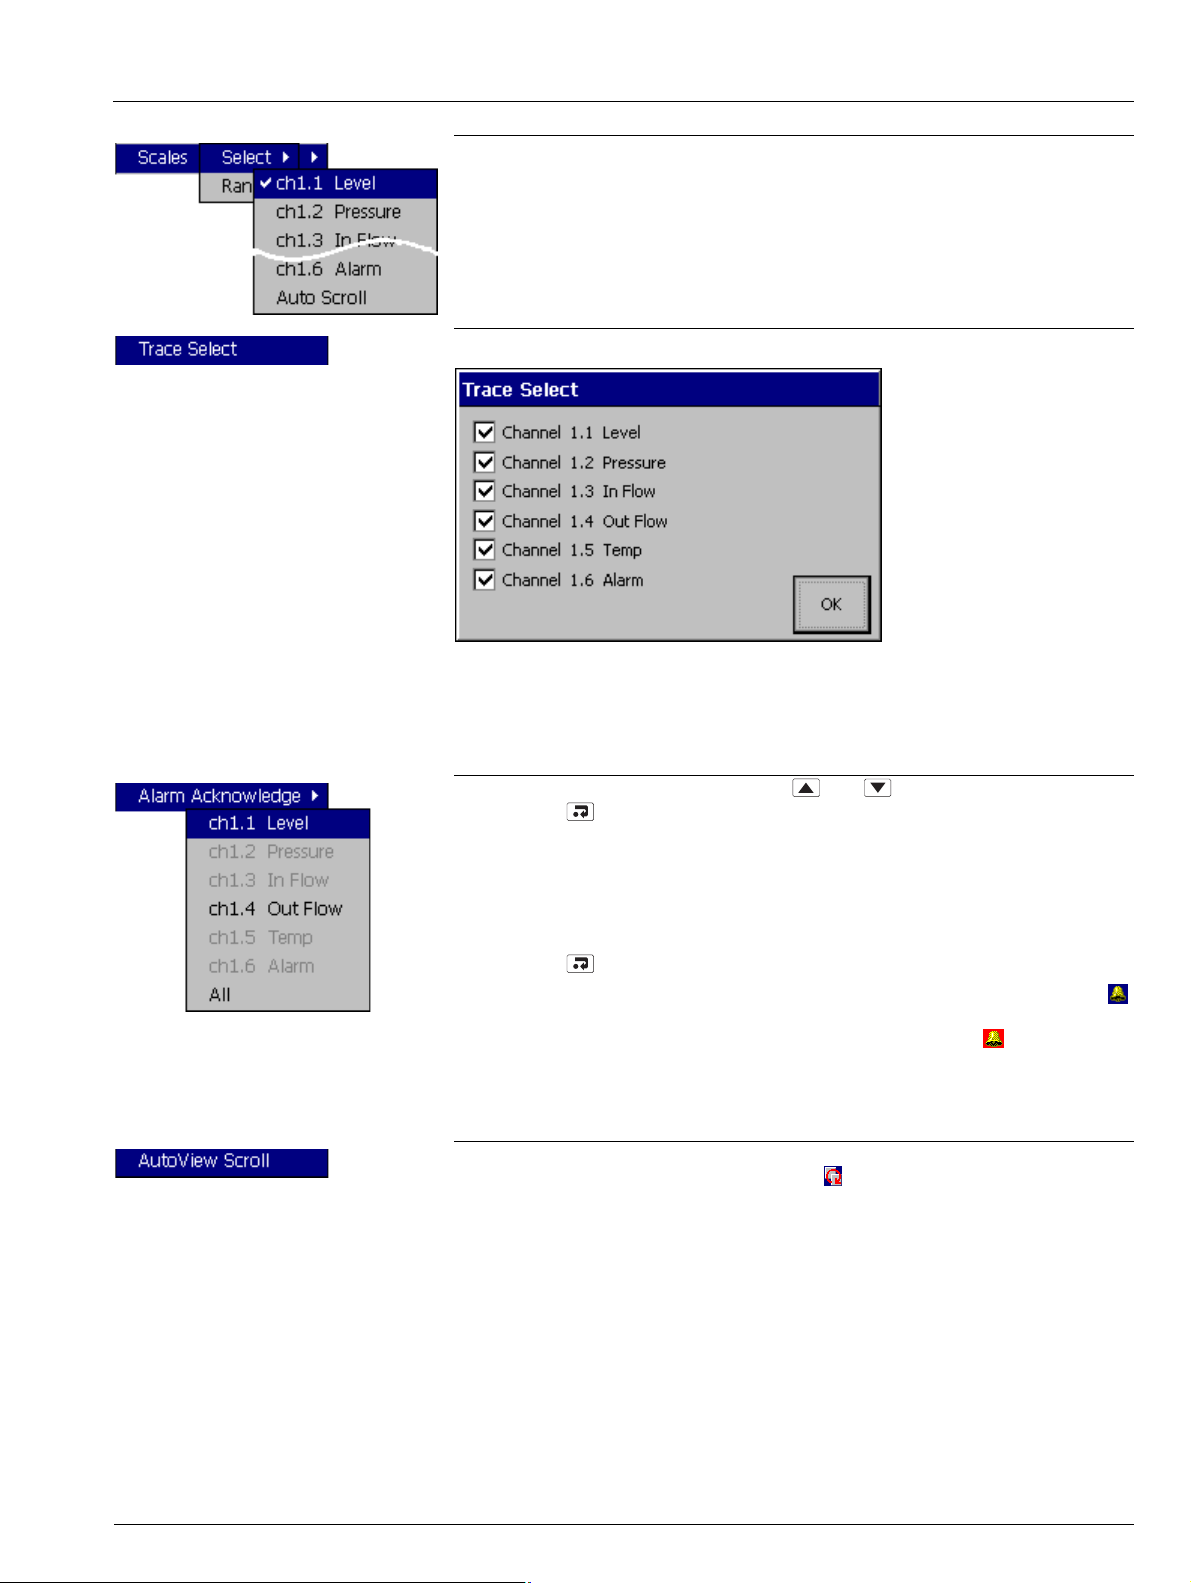
Select a channel scale to be displayed in the scale bar at the top of the chart window.
For digital channels, the On and Off tags are displayed at the corresponding position on
the scale bar.
Select 'Auto Scroll' to display the scale for each enabled channel in turn for 36 seconds.
Hide individual channel traces to improve chart clarity.
Traces are identified by the Channel Number (e.g. Ch1.1) and its short tag.
Note. The recording of a channel's data is not affected by this operation and the
instantaneous channel values are still shown on the indicators at the top of the screen.
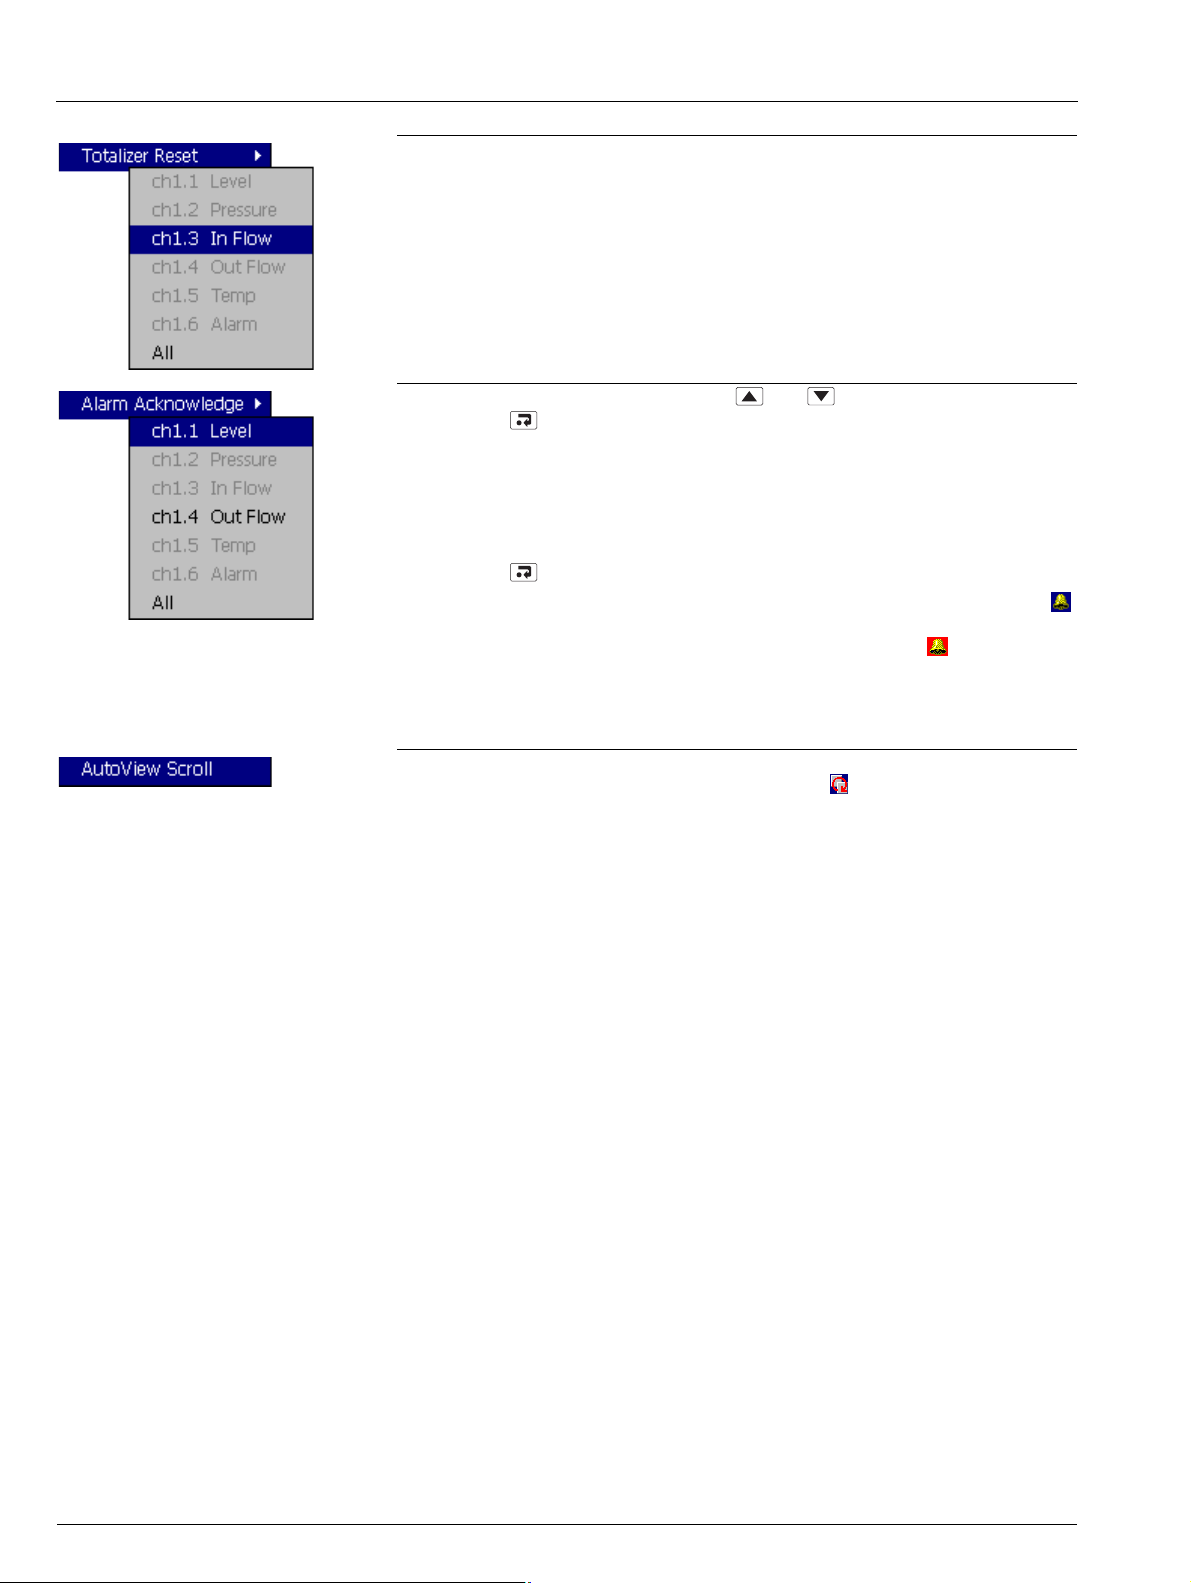
To acknowledge a particular alarm, use the and keys to highlight it in the menu
and press the key.
Note. Active unacknowledged alarms in the current process group are identified by a
flashing red Alarm Event icon in the bottom left hand corner of the associated channel
indicator. Active acknowledged alarms are identified by a continuous red Alarm Event
icon in the bottom left hand corner of the indicator – see Fig. 2.3, page 7.
To acknowledge all active alarms in the current process group simultaneously, select 'All'
and press the key.
Note. If an alarm in
continues to be displayed in the status bar. If an active alarm in
the other process group is active, the Global Alarm status icon ( )
the other process group
is unacknowledged, the icon is surrounded by a red flashing border ( ).
If neither alarm on a particular channel is configured, the short channel tag is shown
greyed-out in the menu.
Select 'AutoView Scroll' to display the chart for each configured process group in turn for
40 seconds. The AutoView Scroll status icon ( ) is displayed in the status bar when
AutoView Scroll is active. Press any key to cancel AutoView Scroll.
IM/SM1000 Issue 12 13
Page 16
Videographic Recorder
SM1000 2Operation
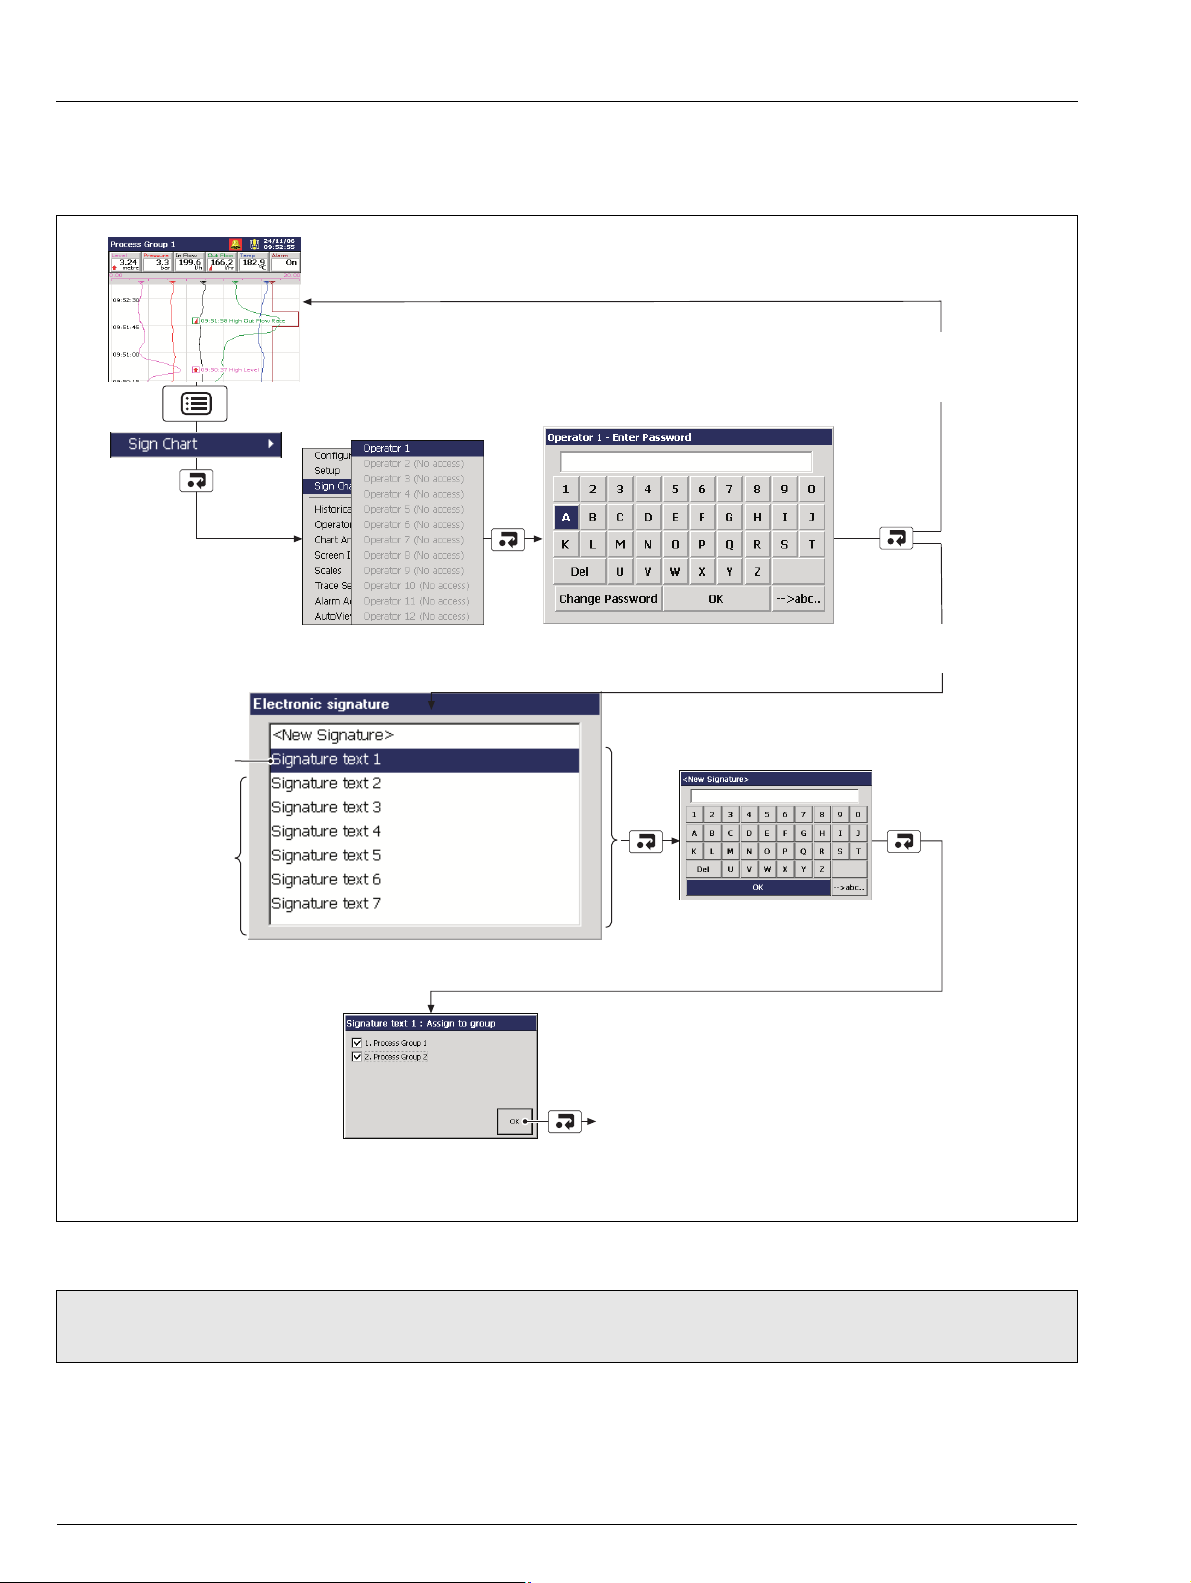
2.3.1 Electronic Signatures – Fig. 2.4
Entering an electronic signature is the equivalent to signing the chart of a conventional paper recorder. Local procedures may require
the approval of a record by an authorized signatory; for this reason, an electronic signature is password protected.
Invalid Password
(see Note in Fig. 3.2, page 30)
Entered
Create a new signature
or
Select one of 7
previously
defined signatures
Note below)
(see
If more than one process group is
enabled (see Section 4.4.1, page 52),
assign the signature to one or more
groups
Enter Password
(see Section 3.3, page 31)
Create new signature or
edit an existing one.
Electronic signature is entered into alarm log.
If Operator Message annotation is enabled (see Page 11),
the electronic signature is also displayed on the chart.
Valid Password
Entered
Fig. 2.4 Entering an Electronic Signature
Note. Up to 7 electronic signatures can be stored in the instrument’s memory. If 7 signatures exist and a new one is created, the
oldest is overwritten.
14 IM/SM1000 Issue 12
Page 17
Videographic Recorder
SM1000 2Operation
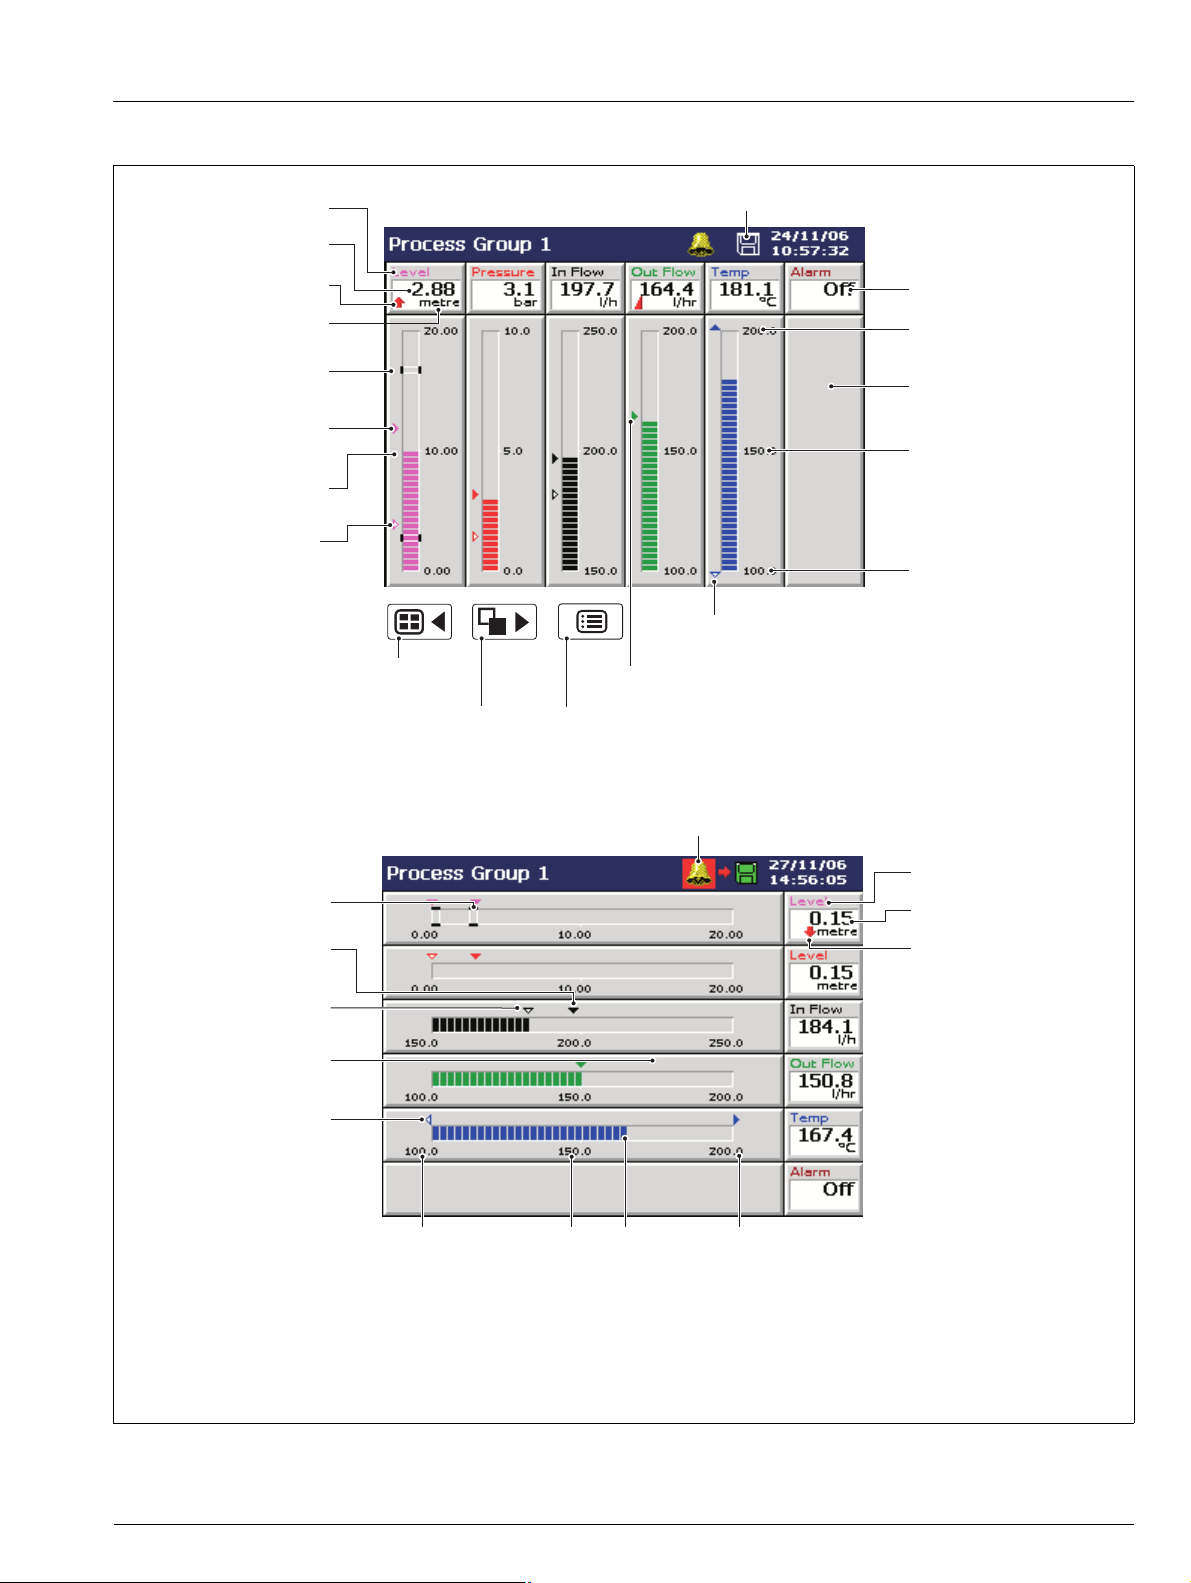
2.4 Bargraph Views – Fig. 2.5
Short Channel Tag
Current Value
Alarm Event Icon
see Rear fold-out
Engineering Units
Alarm Trip Level
(not shown for slow and
fast rate alarms)
Maximum Value
(solid color)
Instantaneous Value
Minimum Value
(white fill)
Selects the next Process Group
(if enabled) or Status View
Selects the next enabled view in the group
(Digital Indicator, Process or Chart)
Status Icons
Digital On or Off tag,
according to input status
Engineering Range
High Value
Digital Channel
Engineering Range
Middle Value
Engineering Range
Low Value
Minimum below engineering limit,
maximum above engineering limit
Identical Maximum and Minimum Values
Opens the Operator Menu for
the current view
A Vertical Bargraph View
Alarm Trip Level
(not shown for slow and
fast rate alarms)
Maximum Value
(solid color)
Minimum Value
(white fill)
Identical Maximum
and Minimum Values
Minimum below
engineering limit,
Maximum above
engineering limit
Engineering Range
(displayed in the Bargraph, Digital Indicators, Process and Chart Views), see Appendix G, page 127.
Global Alarm Status Icon
Low Value
Engineering Range
Middle Value
Instantaneous
Value
Engineering Range
High Value
B Horizontal Bargraph View
For a description of the Status Icons (displayed in the Status Bar) and Alarm Event Icons
Short Channel Tag
Current Value
Alarm Event Icon
Fig. 2.5 Bargraph Views
IM/SM1000 Issue 12 15
Page 18
Videographic Recorder
SM1000 2Operation
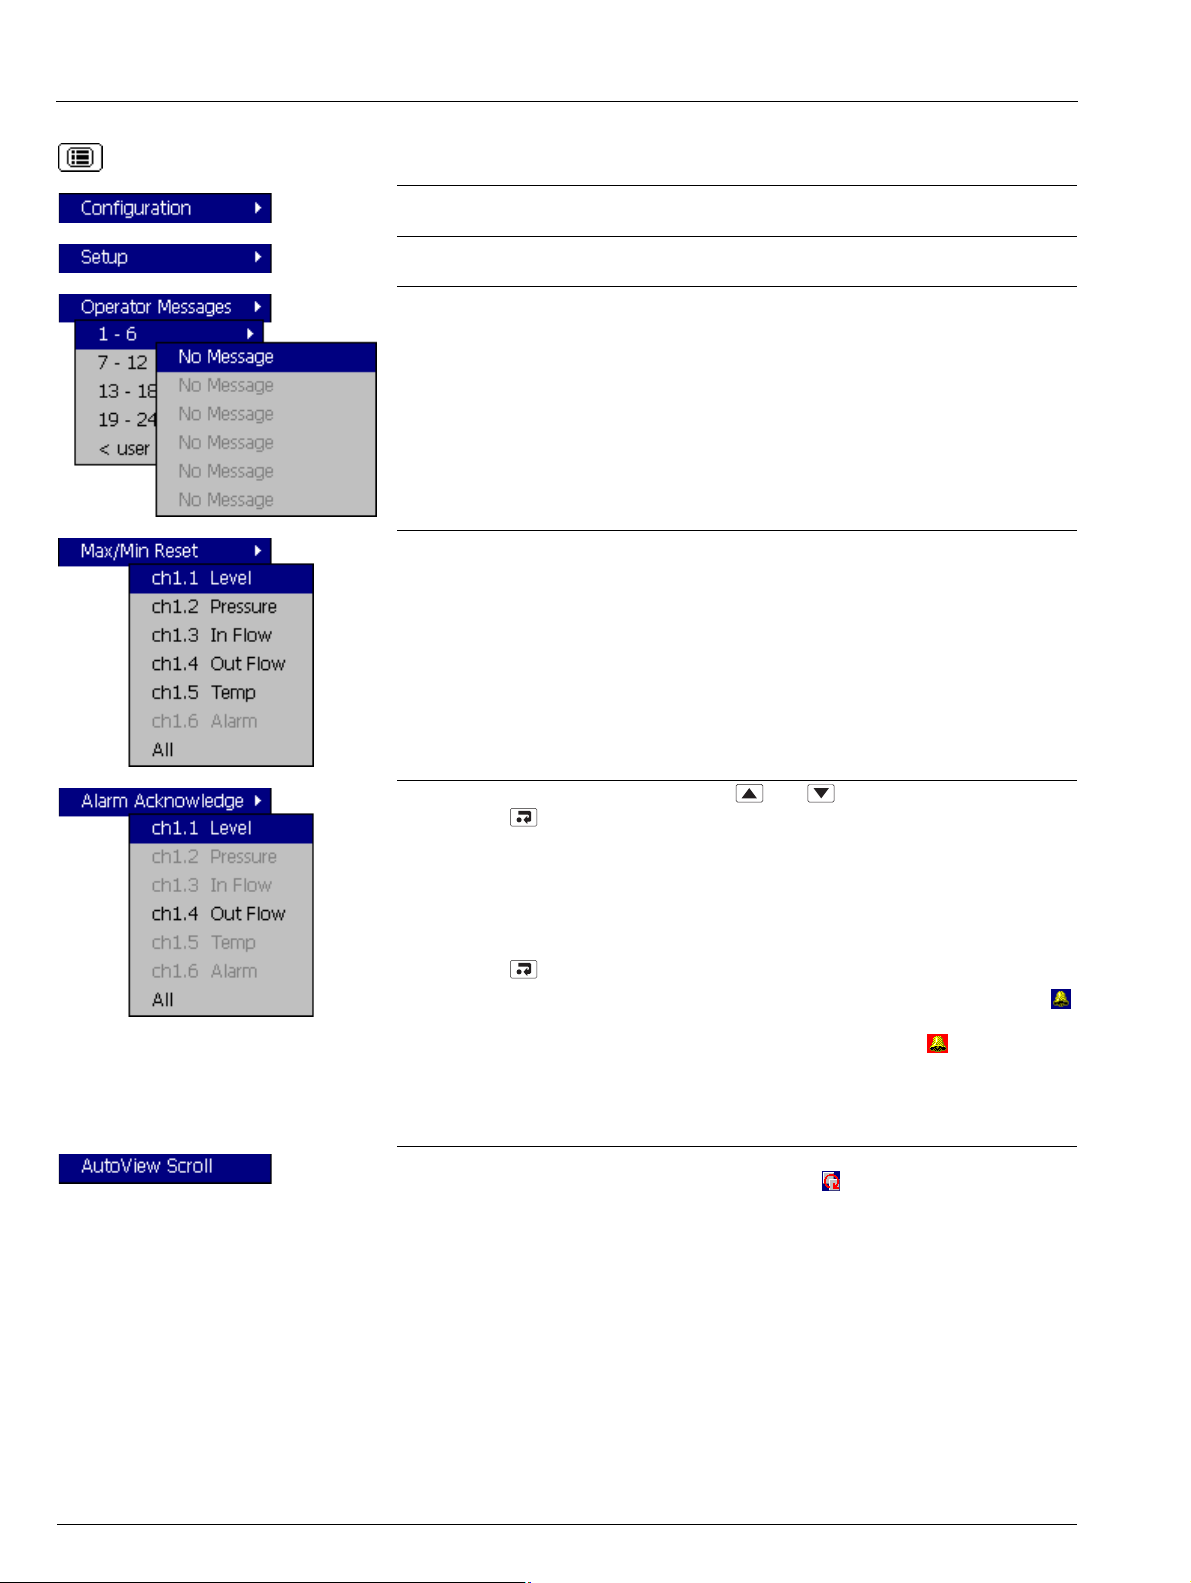
Select the Configuration Level – see Section 4, page 45.
Select the Setup Level – see Section 3, page 29.
Add one of 24 predefined Operator Messages (see Section 4.4.7, page 60) or one UserDefined Message to the alarm event log.
If '< user defined >' is selected, a data entry keyboard appears to enable the message to
be entered (see Fig. 4.6, page 50). The selected or user-defined message is displayed
briefly on-screen.
Reset the Maximum and Minimum value markers on one or all channels to the current
value.
Note.
These Maximum and Minimum values are for display purposes only. They are not
saved or archived and are not connected to the Totalizer Maximum and Minimum
Values displayed in the Process View.
These Maximum and Minimum values are reset whenever the current configuration
has been changed or is re-saved.
To acknowledge a particular alarm, use the and keys to highlight it in the menu
and press the key.
Note. Active unacknowledged alarms in the current process group are identified by a
flashing red Alarm Event icon in the bottom left hand corner of the associated indicator.
Active acknowledged alarms are identified by a continuous red Alarm Event icon in the
bottom left hand corner of the indicator – see Fig. 2.5, page 15.
To acknowledge all active alarms in the current process group simultaneously, select 'All'
and press the key.
Note. If an alarm in
continues to be displayed in the status bar. If an active alarm in
the other process group is active, the Global Alarm status icon ( )
the other process group
is unacknowledged, the icon is surrounded by a red flashing border ( ).
If neither alarm on a particular channel is configured, the short channel tag is shown
greyed-out in the menu.
Select 'AutoView Scroll' to display the bargraph for each configured process group in
turn for 40 seconds. The AutoView Scroll status icon ( ) is displayed in the status bar
when AutoView Scroll is active. Press any key to cancel AutoView Scroll.
16 IM/SM1000 Issue 12
Page 19
Videographic Recorder
SM1000 2Operation
2.5 Digital Indicator View – Fig. 2.6
Short Channel Tag
Current Value
Alarm Event Icon
Engineering Units
Selects the next Process Group
(if enabled) or the Status View
Global Alarm Status Icon
Opens the Operator Menu for
the current view
Selects the next enabled
view in the group
(Process, Chart or Bargraph)
Status Icons
Channel Units
Totalizer Units
Totalizer Value
For a description of the Status Icons (displayed in the Status Bar) and Alarm Event Icons
(displayed in the Bargraph, Digital Indicators, Process and Chart Views), see Appendix G, page 127.
Fig. 2.6 Digital Indicator View
Note.
Digital indicators resize automatically according to the number of channels displayed.
The totalizer option must be enabled and totalizers configured and enabled in the Configuration level before they are
displayed – see Section 4.6.5, page 84.
When a totalizer is not running (i.e. 'Stop' is selected), the corresponding totalizer value is shown in red.
IM/SM1000 Issue 12 17
Page 20
Videographic Recorder
SM1000 2Operation
Select the Configuration Level – see Section 4, page 45.
Select the Setup Level – see Section 3, page 29.
Add one of 24 predefined Operator Messages (see Section 4.4.7, page 60) or one UserDefined Message to the alarm event log.
If '< user defined >' is selected, a data entry keyboard appears to enable the message to
be entered (see Fig. 4.6, page 50). The selected or user-defined message is displayed
briefly on-screen.
Hide or display individual channel indicators for the group currently displayed.
Note.
The digital indicators displayed are sized equally depending on the number of
channels selected. This has no effect on the recording of the channel.
Channels that have not been configured are greyed-out in the menu.
Three or Four
Channels Selected
Two Channels Selected One Channel Selected
18 IM/SM1000 Issue 12
Page 21

Videographic Recorder
SM1000 2Operation
Stop and start individual totalizers.
Channel totalizers that have not been enabled in the Configuration level are greyed-out.
Note.
Displayed only if the Totalizer option is enabled.
When a totalizer is not running (i.e. 'Stop' is selected), the corresponding totalizer
value is shown in red.
Reset the totalizer value to the totalizer preset value.
Channel totalizers that have not been enabled in the Configuration level are greyed-out.
Note. Displayed only if the Totalizer option is enabled.
To acknowledge a particular alarm, use the and keys to highlight it in the menu
and press the key.
Note. Active unacknowledged alarms in the current process group are identified by a
flashing red Alarm Event icon in the bottom left hand corner of the associated indicator.
Active acknowledged alarms are identified by a continuous red Alarm Event icon in the
bottom left hand corner of the indicator – see Fig. 2.6, page 17.
To acknowledge all active alarms in the current process group simultaneously, select 'All'
and press the key.
Note. If an alarm in
continues to be displayed in the status bar. If an active alarm in
the other process group is active, the Global Alarm status icon ( )
the other process group
is unacknowledged, the icon is surrounded by a red flashing border ( ).
If neither alarm on a particular channel is configured, the short channel tag is shown
greyed-out in the menu.
Select 'AutoView Scroll' to display the digital indicator for each configured process group
in turn for 40 seconds. The AutoView Scroll status icon ( ) is displayed in the status bar
when AutoView Scroll is active. Press any key to cancel AutoView Scroll.
IM/SM1000 Issue 12 19
Page 22
Videographic Recorder
SM1000 2Operation
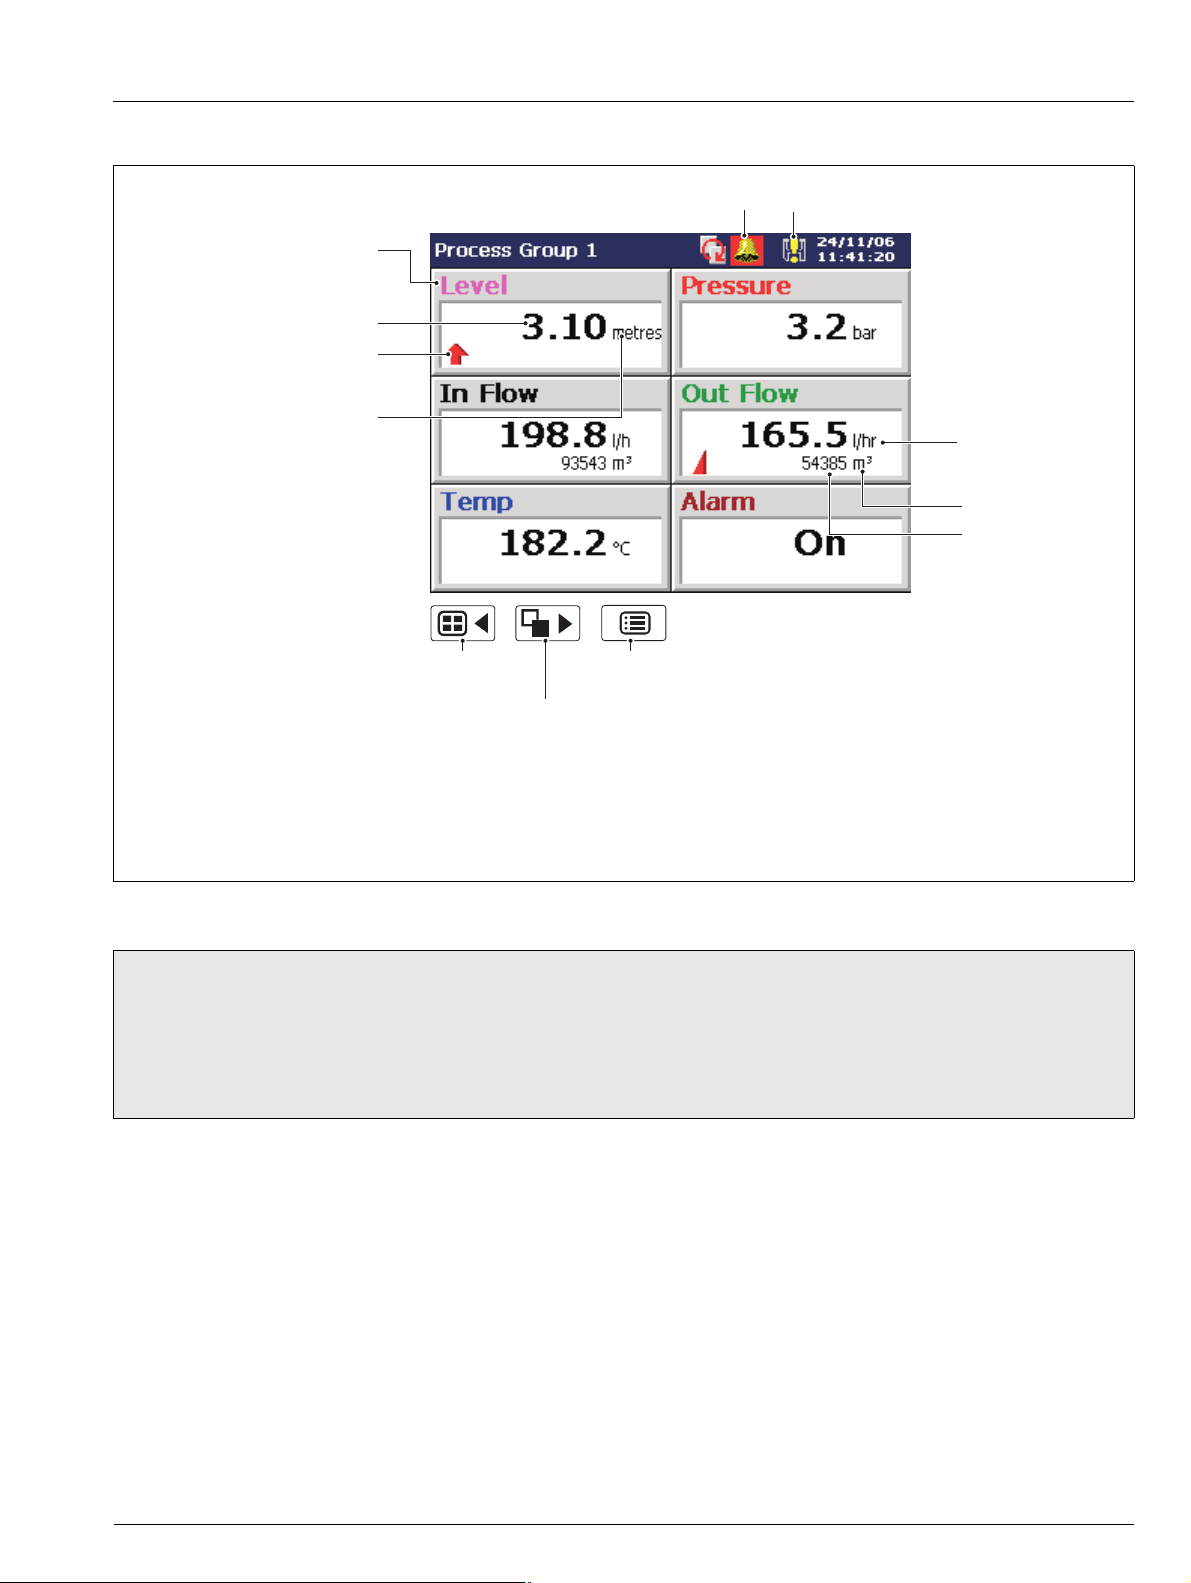
2.6 Process View – Fig. 2.7
Note. The Process view is available only if the Totalizer option is enabled.
Totalizer not enabled
in configuration level
Totalizer
Tag Name
Totalizer
Value
Selects the next Process Group
(if enabled) or the Status View
(Bargraph, Digital Indicator or Chart)
Global Alarm Status Icon
Alarm Tag
Opens the Operator Menu for
the current view
Selects the next enabled view
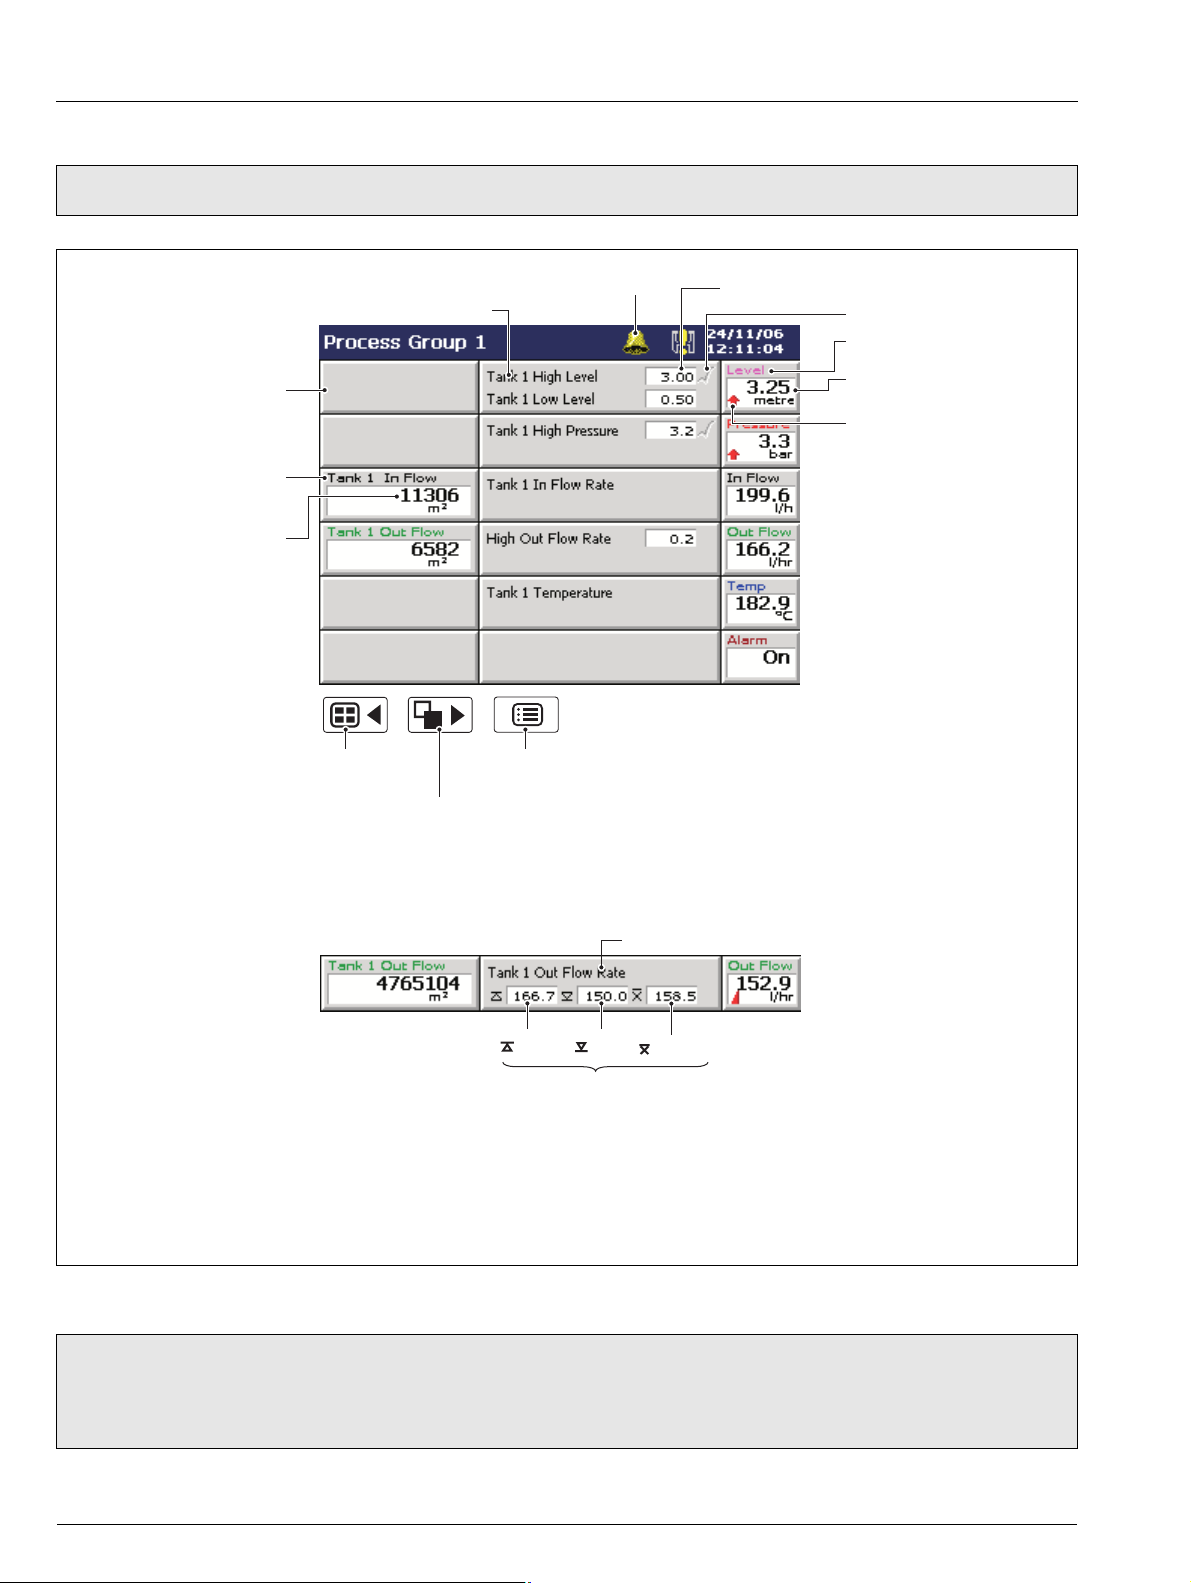
A Process View (Alarms)
Alarm Trip Level
Alarm Acknowledged
Short Channel Tag
Instantaneous Value
Alarm Status
Channel Source Long Tag
Max
Values since last totalizer reset or totalizer wrap. Calculated only while
the totalizer is enabled. Updated only while the totalizer is running.
Min
Average
B Process View (Statistics)
For a description of the Status Icons (displayed in the Status Bar) and Alarm Event Icons
(displayed in the Bargraph, Digital Indicators, Process and Chart Views), see Appendix G, page 127.
Fig. 2.7 Process View
Note.
Only totalizers that have been configured and enabled in the Configuration level are displayed.
When a totalizer is not running (i.e. 'Stop' is selected), the corresponding totalizer value is shown in red.
20 IM/SM1000 Issue 12
Page 23
Videographic Recorder
SM1000 2Operation
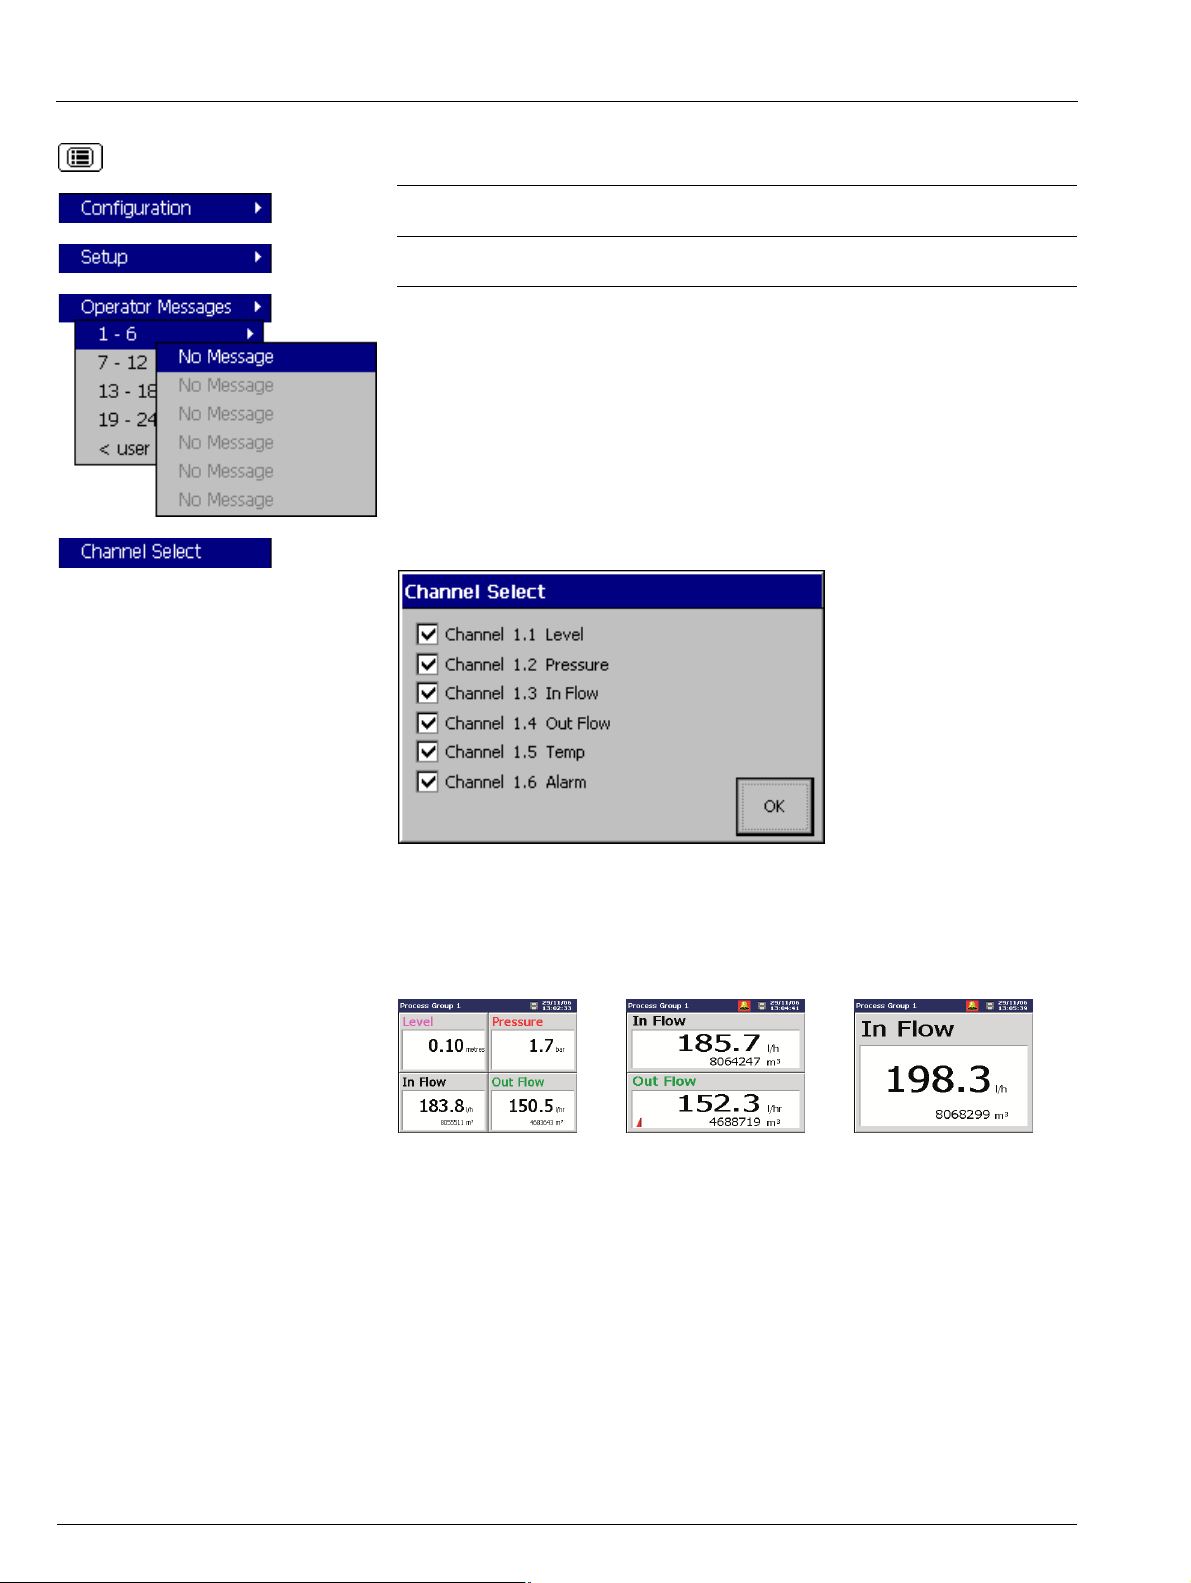
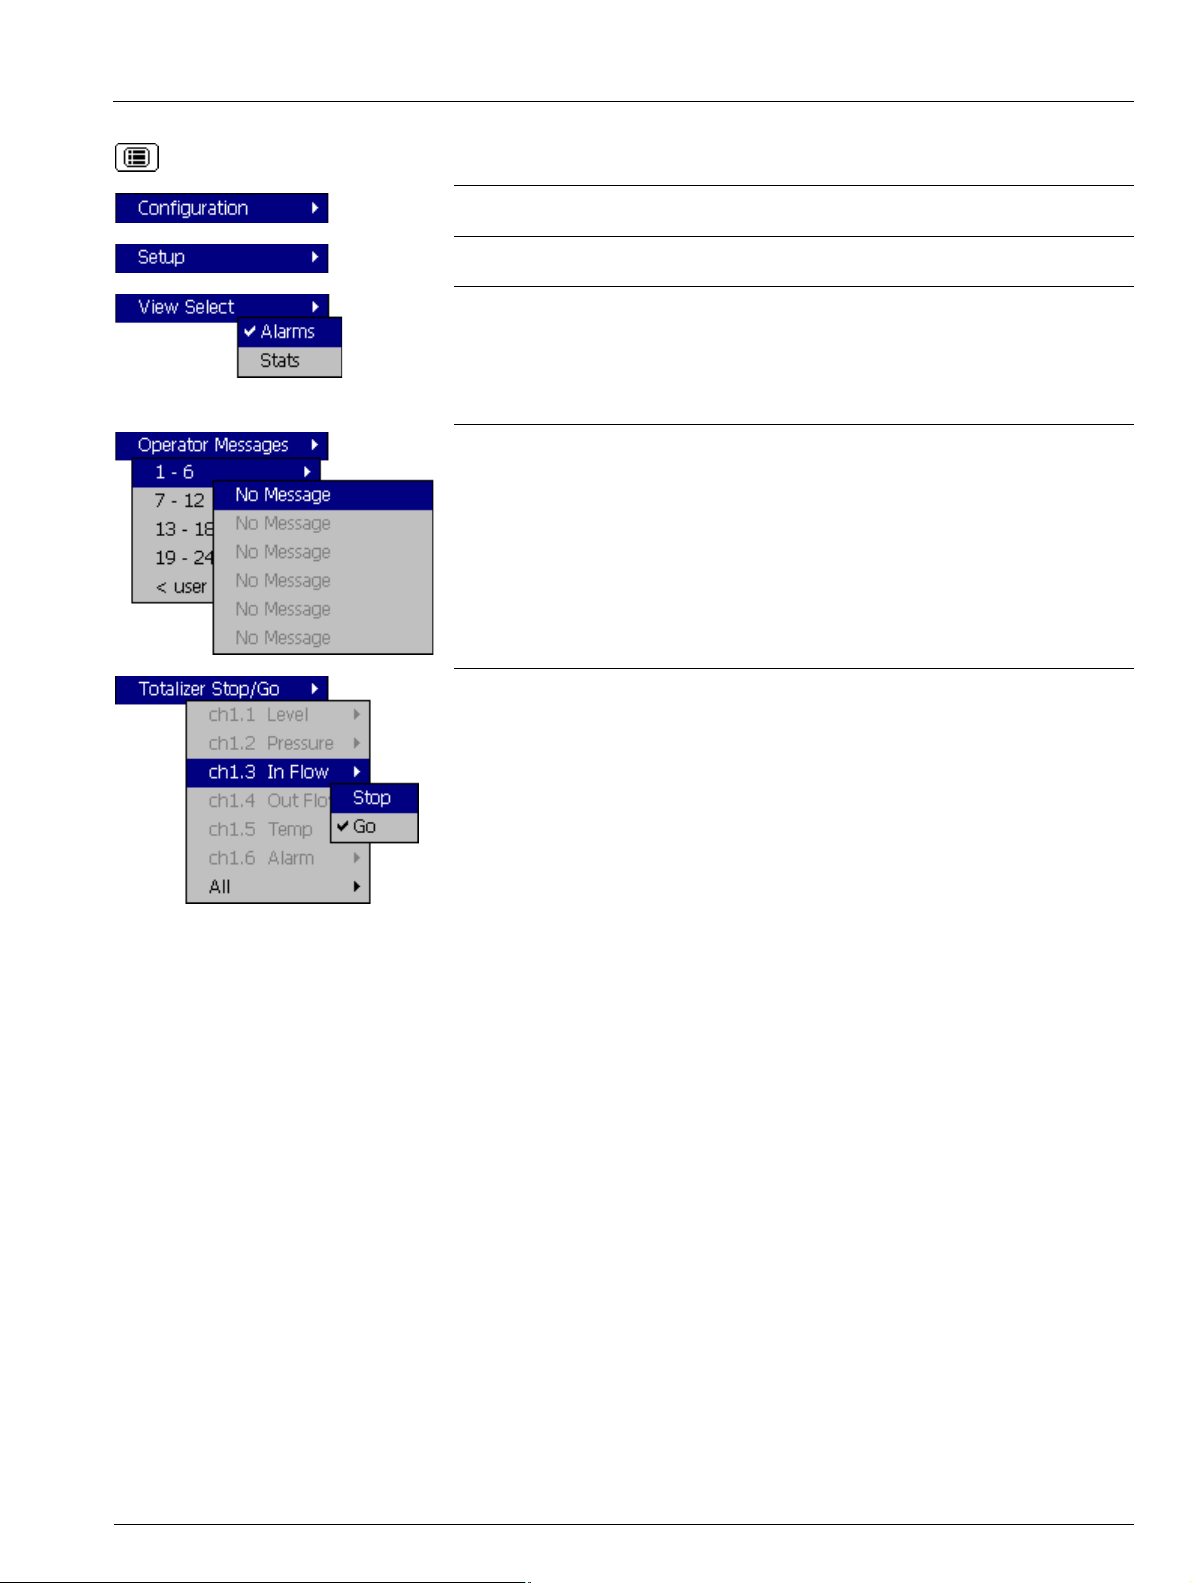
Select the Configuration Level – see Section 4, page 45.
Select the Setup Level – see Section 3, page 29.
Switch between the Alarm View and the Statistics View.
Note. If a channel's totalizer is not enabled in the Configuration level, Alarm trip levels
are shown in place of the channel statistics. If no alarms are enabled, the long tag for
that channel is displayed.
Add one of 24 predefined Operator Messages (see Section 4.4.7, page 60) or one UserDefined Message to the alarm event log.
If '< user defined >' is selected, a data entry keyboard appears to enable the message to
be entered (see Fig. 4.6, page 50). The selected or user-defined message is displayed
briefly on-screen.
Stop and start individual totalizers.
Channel totalizers that have not been enabled in the Configuration level are greyed-out.
Note. When a totalizer is not running (i.e. 'Stop' is selected), the corresponding totalizer
value is shown in red.
IM/SM1000 Issue 12 21
Page 24
Videographic Recorder
SM1000 2Operation
Reset the totalizer value to the totalizer preset value.
Channel totalizers that have not been enabled in the Configuration level are greyed-out.
To acknowledge a particular alarm, use the and keys to highlight it in the menu
and press the key.
Note. Active unacknowledged alarms in the current process group are identified by a
flashing red Alarm Event icon in the bottom left hand corner of the associated indicator.
Active acknowledged alarms are identified by a continuous red Alarm Event icon in the
bottom left hand corner of the indicator – see Fig. 2.6, page 17.
To acknowledge all active alarms in the current process group simultaneously, select 'All'
and press the key.
Note. If an alarm in
continues to be displayed in the status bar. If an active alarm in
the other process group is active, the Global Alarm status icon ( )
the other process group
is unacknowledged, the icon is surrounded by a red flashing border ( ).
If neither alarm on a particular channel is configured, the short channel tag is shown
greyed-out in the menu.
Select 'AutoView Scroll' to display the process view for each configured process group
in turn for 40 seconds. The AutoView Scroll status icon ( ) is displayed in the status bar
when AutoView Scroll is active. Press any key to cancel AutoView Scroll.
22 IM/SM1000 Issue 12
Page 25
Videographic Recorder
SM1000 2Operation
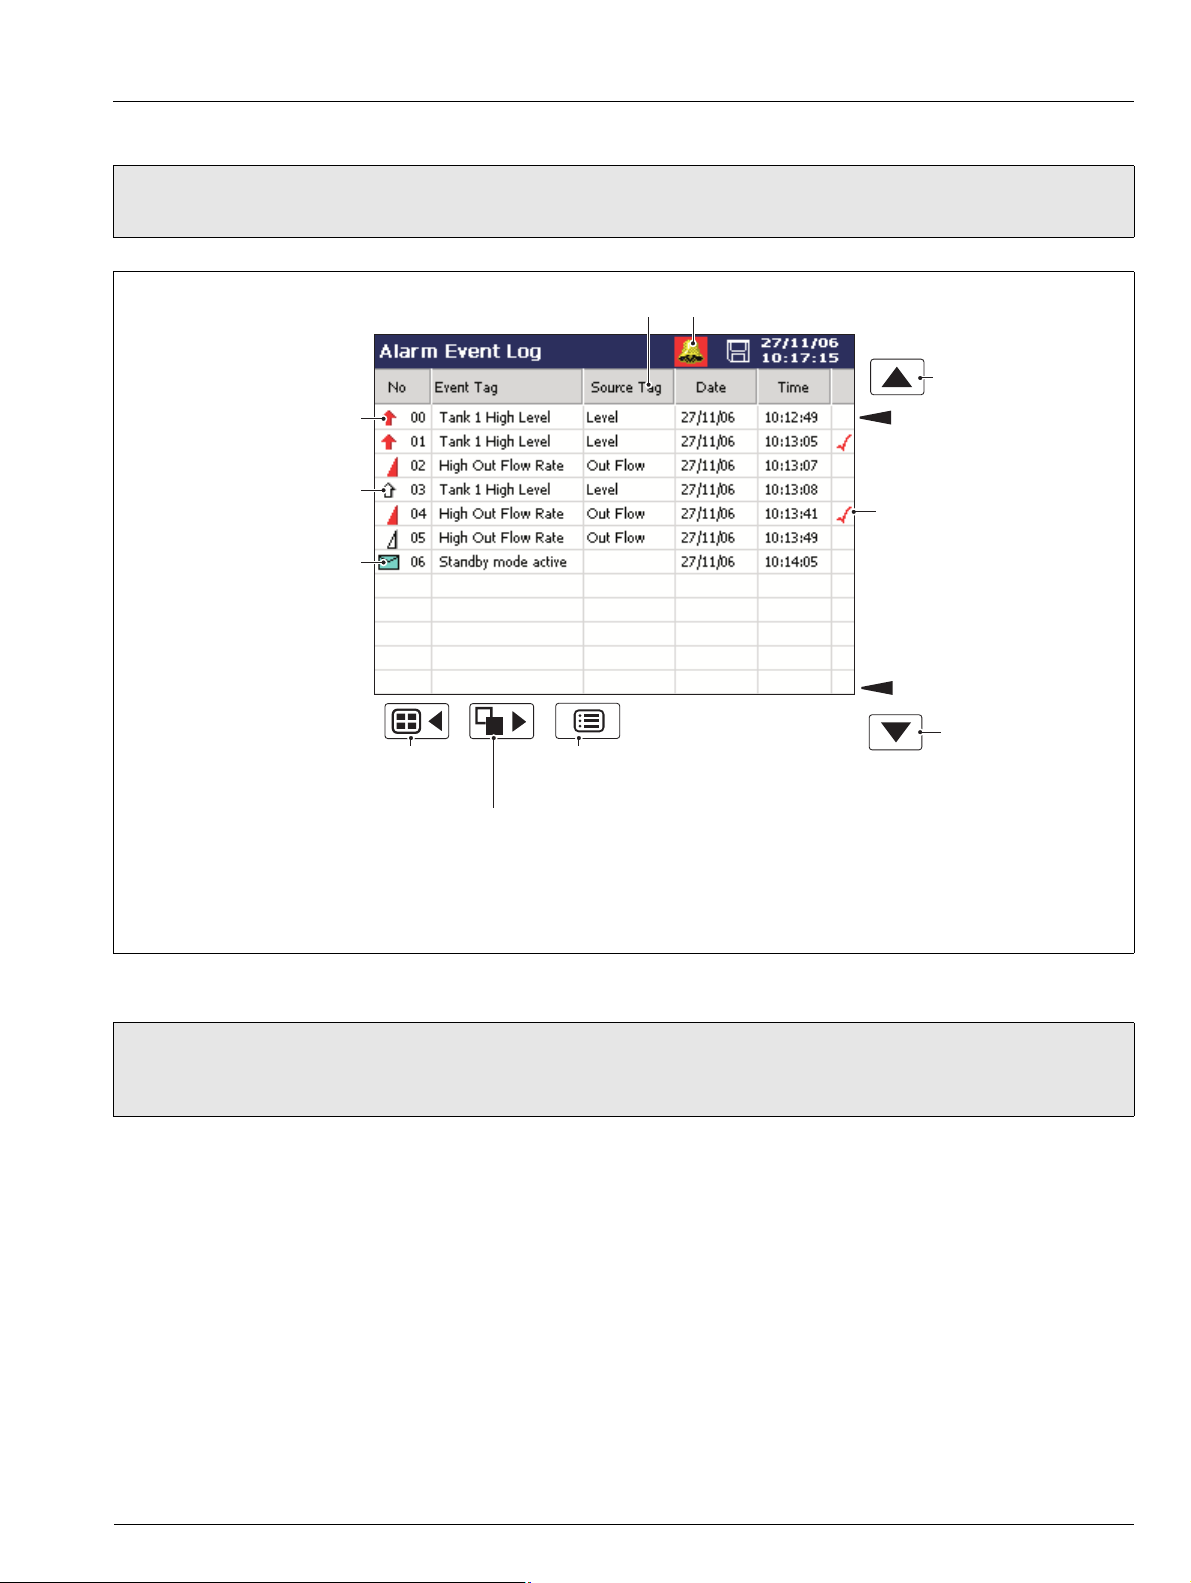
2.7 Alarm Event Log – Fig. 2.8
Note. The Alarm Event log view provides an historical log of all alarm events in the sequence in which they occurred. To view the
current status of all alarms, choose the Process View – see Section 2.6, page 20.
Alarm becomes active
(Active transition)
Alarm becomes inactive
(Inactive transition)
Operator Message
and the Bargraph, Digital Indicators, Process and Chart Views), see Appendix G, page 127.
Short tag of the alarm's source
Selects
Process
Group 1
Selects the
Totalizer Log
For a description of the Alarm Event Icons (displayed in the Alarm Event Log
Opens the
Operator Menu for
the current view
Global Alarm Status Icon
View previous
page of data
Oldest Data
Alarm Acknowledged
Newest Data
View next
page of data
Fig. 2.8 Alarm Event Log
Note. When the number of entries in the Alarm Event log has reached that defined in 'Alarm log size' (see Section 4.4.6,
page 60), the oldest data is overwritten by the newest. Entries are renumbered so that the number of the oldest entry is
always 00.
IM/SM1000 Issue 12 23
Page 26
Videographic Recorder
SM1000 2Operation
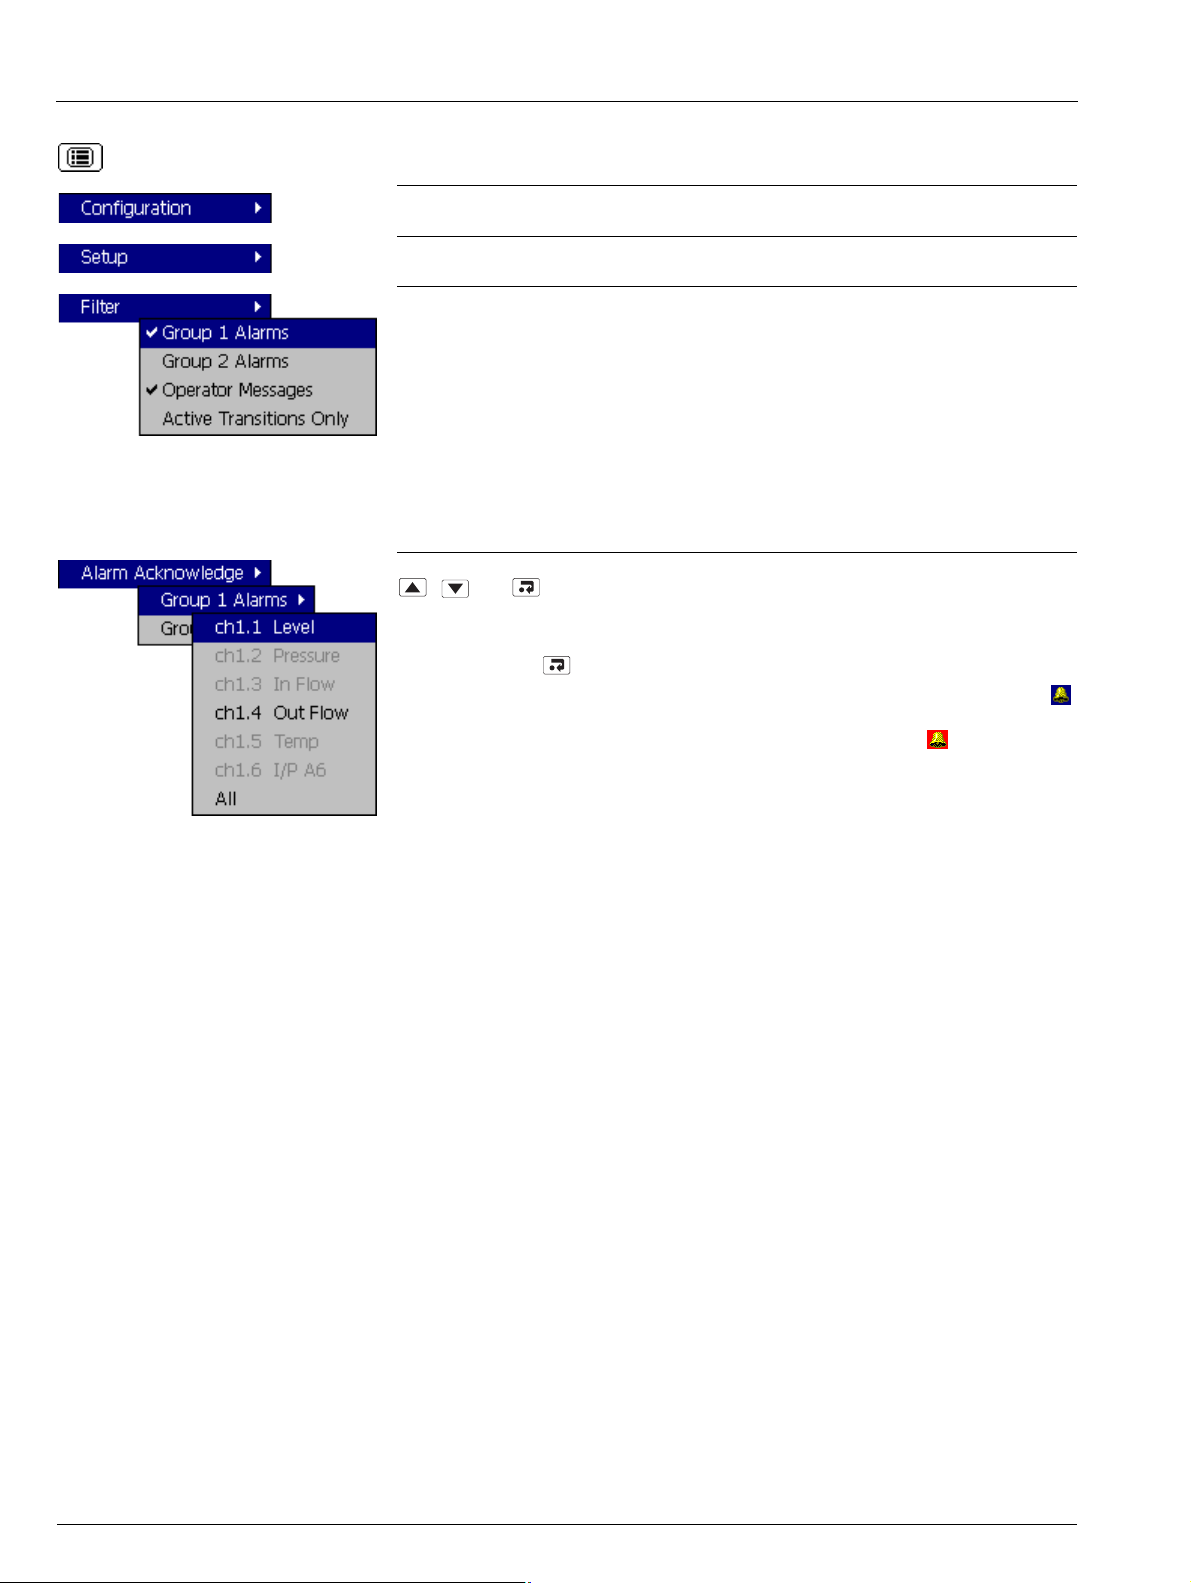
Select the Configuration Level – see Section 4, page 45.
Select the Setup Level – see Section 3, page 29.
Select the entries to be displayed in the log. Indicates entries currently displayed.
Note.
Hiding and displaying log entries does not affect the recording of events in the log.
All selected alarm event transitions (from inactive to active, from active to
acknowledged, from acknowledged to inactive, from active to inactive) appear in
the sequence in which they occurred.
Selecting 'Active Transitions Only' displays entries for alarms when made active
and hides all acknowledged & inactive transitions.
The Alarm Event log is not group specific. To acknowledge a particular alarm, use the
, and keys to first select the relevant process group, followed by the alarm
to be acknowledged.
To acknowledge all active alarms in the selected process group simultaneously, select
'All' and press the key.
Note. If an alarm in
continues to be displayed in the status bar. If an active alarm in
the other process group is active, the Global Alarm status icon ( )
the other process group
is unacknowledged, the icon is surrounded by a red flashing border ( ).
If neither alarm on a particular channel is configured, the short channel tag is shown
greyed-out in the menu.
24 IM/SM1000 Issue 12
Page 27
Videographic Recorder
SM1000 2Operation
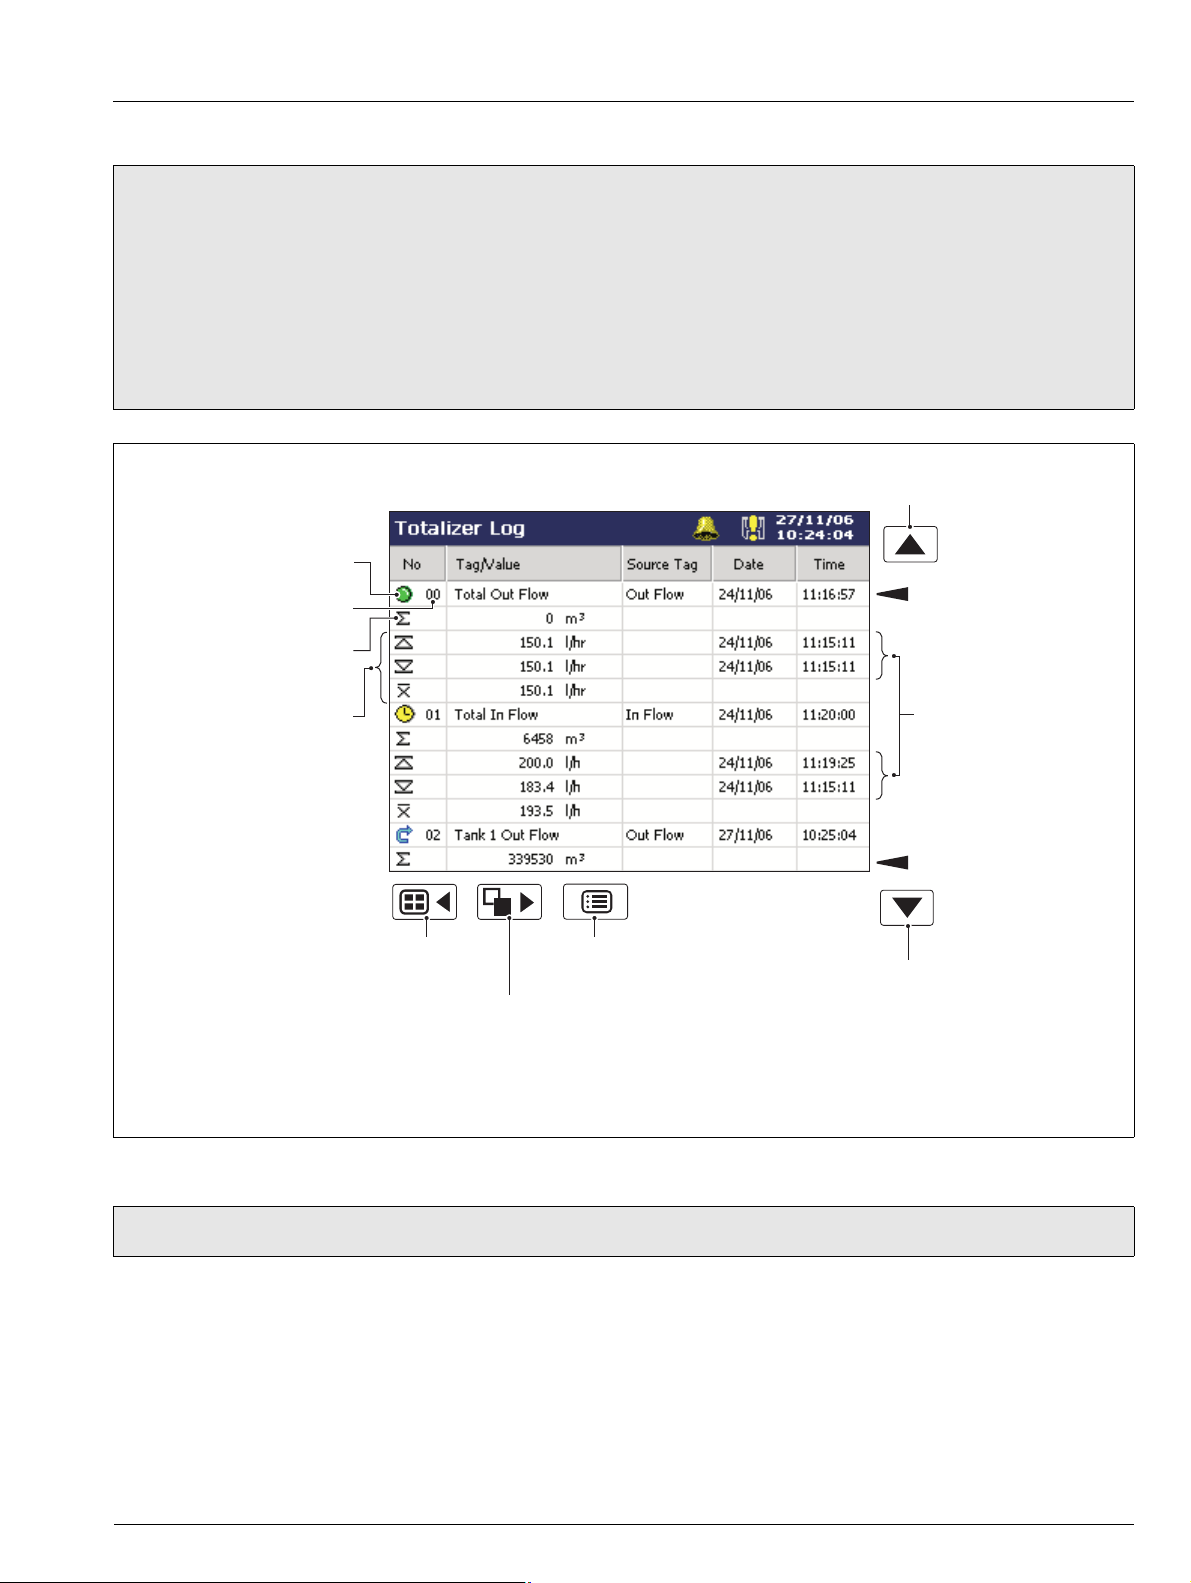
2.8 Totalizer Log – Fig. 2.9
Note.
The Totalizer log view is displayed only if the Totalizer option is enabled.
The Totalizer log view provides an historical log of totalizer activity. To view the current totalizer status, choose the Process
or Digital View.
When the number of entries in the Totalizer log has reached that defined in 'Totalizer log size' (see Section 4.4.6, page 60),
the oldest data is overwritten by the newest. Entries are renumbered so that the number of the oldest entry is always 00.
The logging of totalizer values can be triggered at pre-determined intervals and/or by digital signal – see 'Log update' on
page 85.
View previous
page of data
Totalizer Icon
Oldest
Log Entry Number
Data
Batch total at the
time of the event
Date/time at which
Max., min. and
average of the value
being totalized at the
time of the event
Selects
Process
Group 1
Selects the
Audit Log
For a description of the Totalizer Icons (displayed in the Totalizer Log
and the Process View), see Appendix G, page 127.
Opens the
Operator Menu for
the current view
View next page
max. and min.
flowrates occured
Newest
Data
of data
Fig. 2.9 Totalizer Log
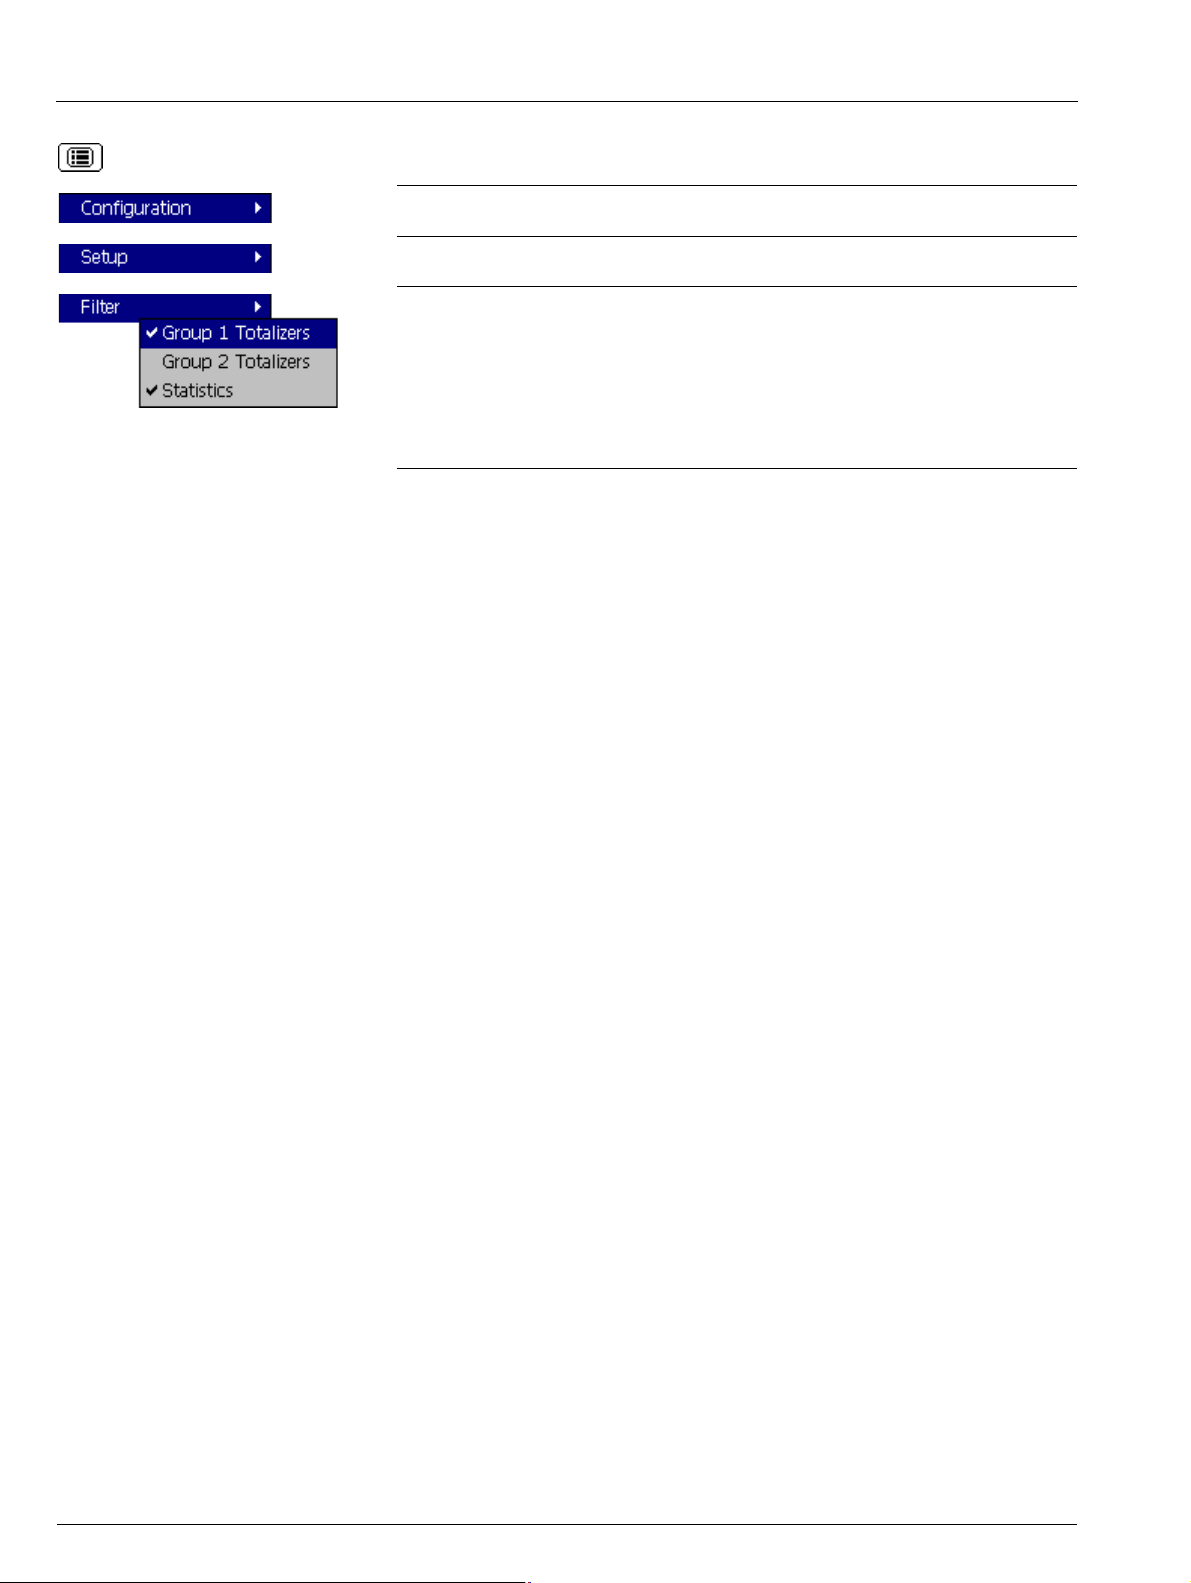
Note. Maximum, Minimum and Average statistics are not shown unless enabled in the 'Filter' menu – see overleaf.
IM/SM1000 Issue 12 25
Page 28
Videographic Recorder
SM1000 2Operation
Select the Configuration Level – see Section 4, page 45.
Select the Setup Level – see Section 3, page 29.
Select the entries to be displayed in the log. Indicates entries currently displayed. This
does not affect which events are recorded in the log.
'Statistics' displays the maximum, minimum and average values of the analog value
being totalized, together with the dates and times at which all maximum and minimum
values occurred.
These values are reset when the totalizer is reset and are updated only when the totalizer
is running.
26 IM/SM1000 Issue 12
Page 29
Videographic Recorder
SM1000 2Operation
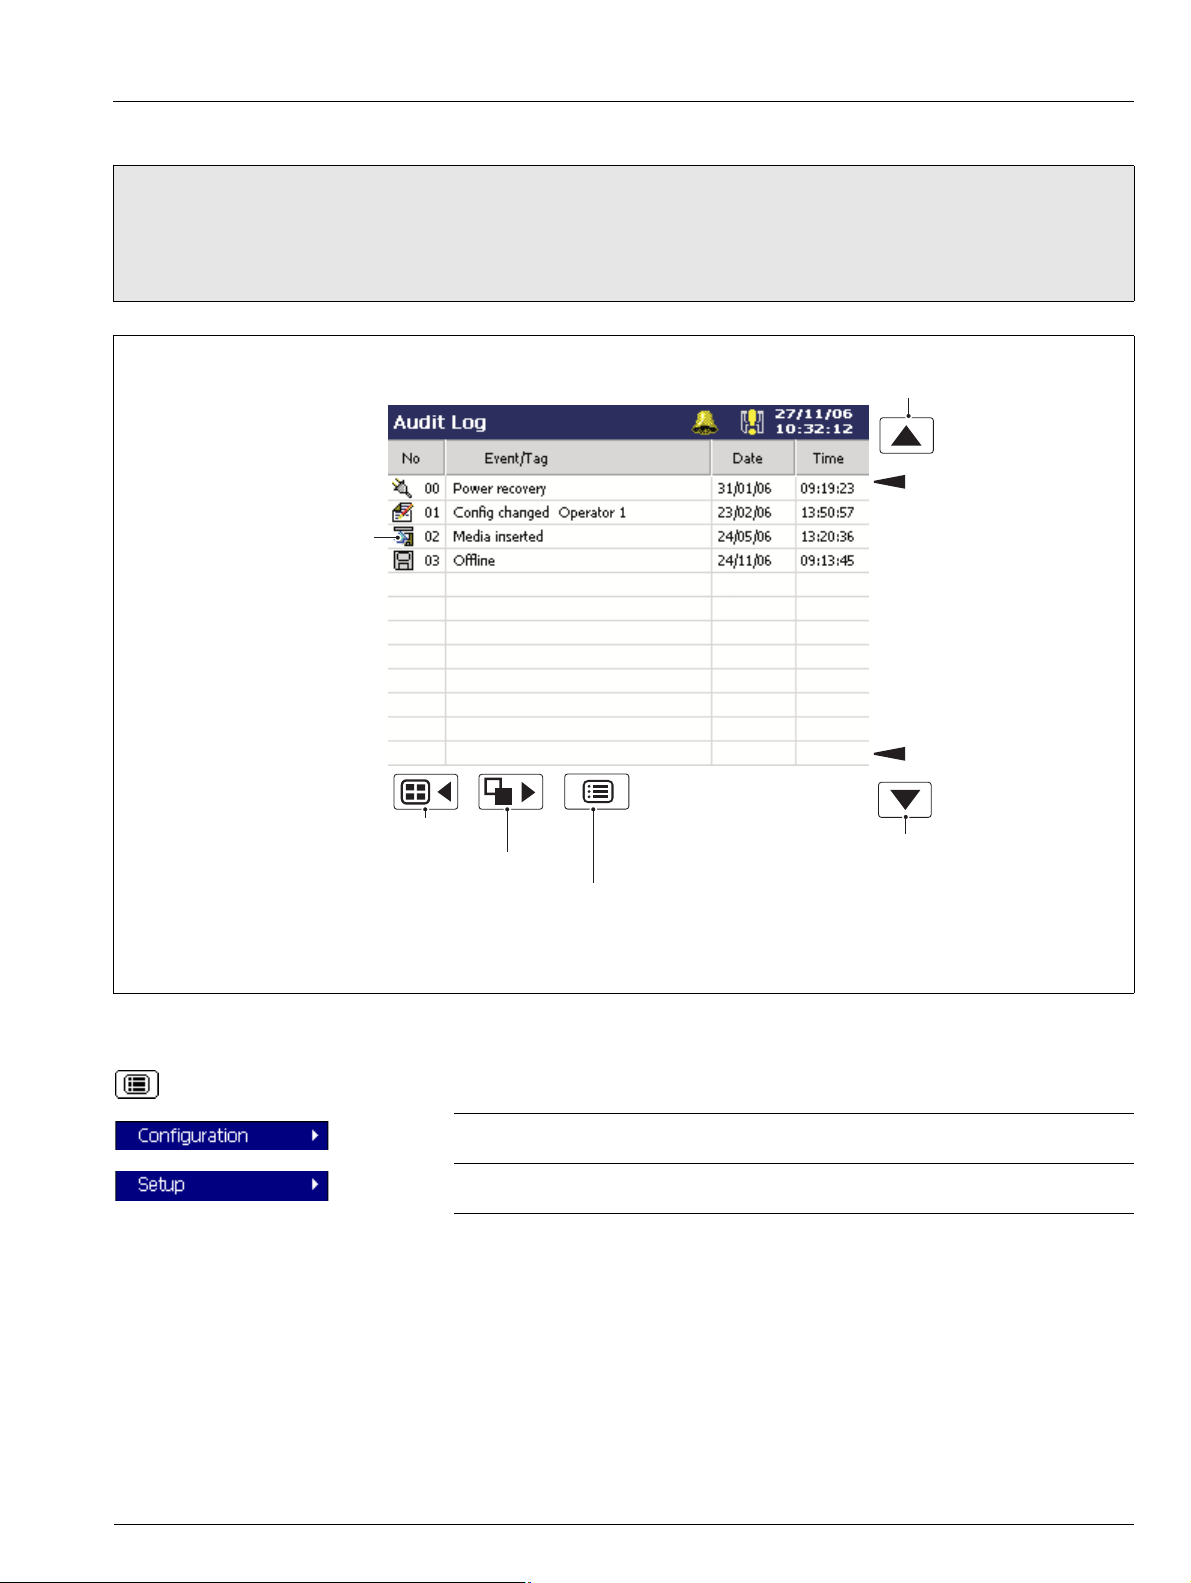
2.9 Audit Log – Fig. 2.10
Note.
The Audit log view provides an historical log of system activity.
When the number of entries in the Audit log has reached that defined in 'Audit log size' (see Section 4.4.6, page 60), the
oldest data is overwritten by the newest. Entries are renumbered so that the number of the oldest entry is always 00.
View previous
page of data
Oldest Data
Audit Log Icon
Fig. 2.10 Audit Log
Selects Process Group 1
Selects the Status View
Opens the Operator Menu for
the current log
For a description of the Audit Log Icons (displayed in the Audit Log) see Appendix G, page 127.
page of data
Select the Configuration Level – see Section 4, page 45.
Select the Setup Level – see Section 3, page 29.
Newest Data
View next
IM/SM1000 Issue 12 27
Page 30
Videographic Recorder
SM1000 2Operation
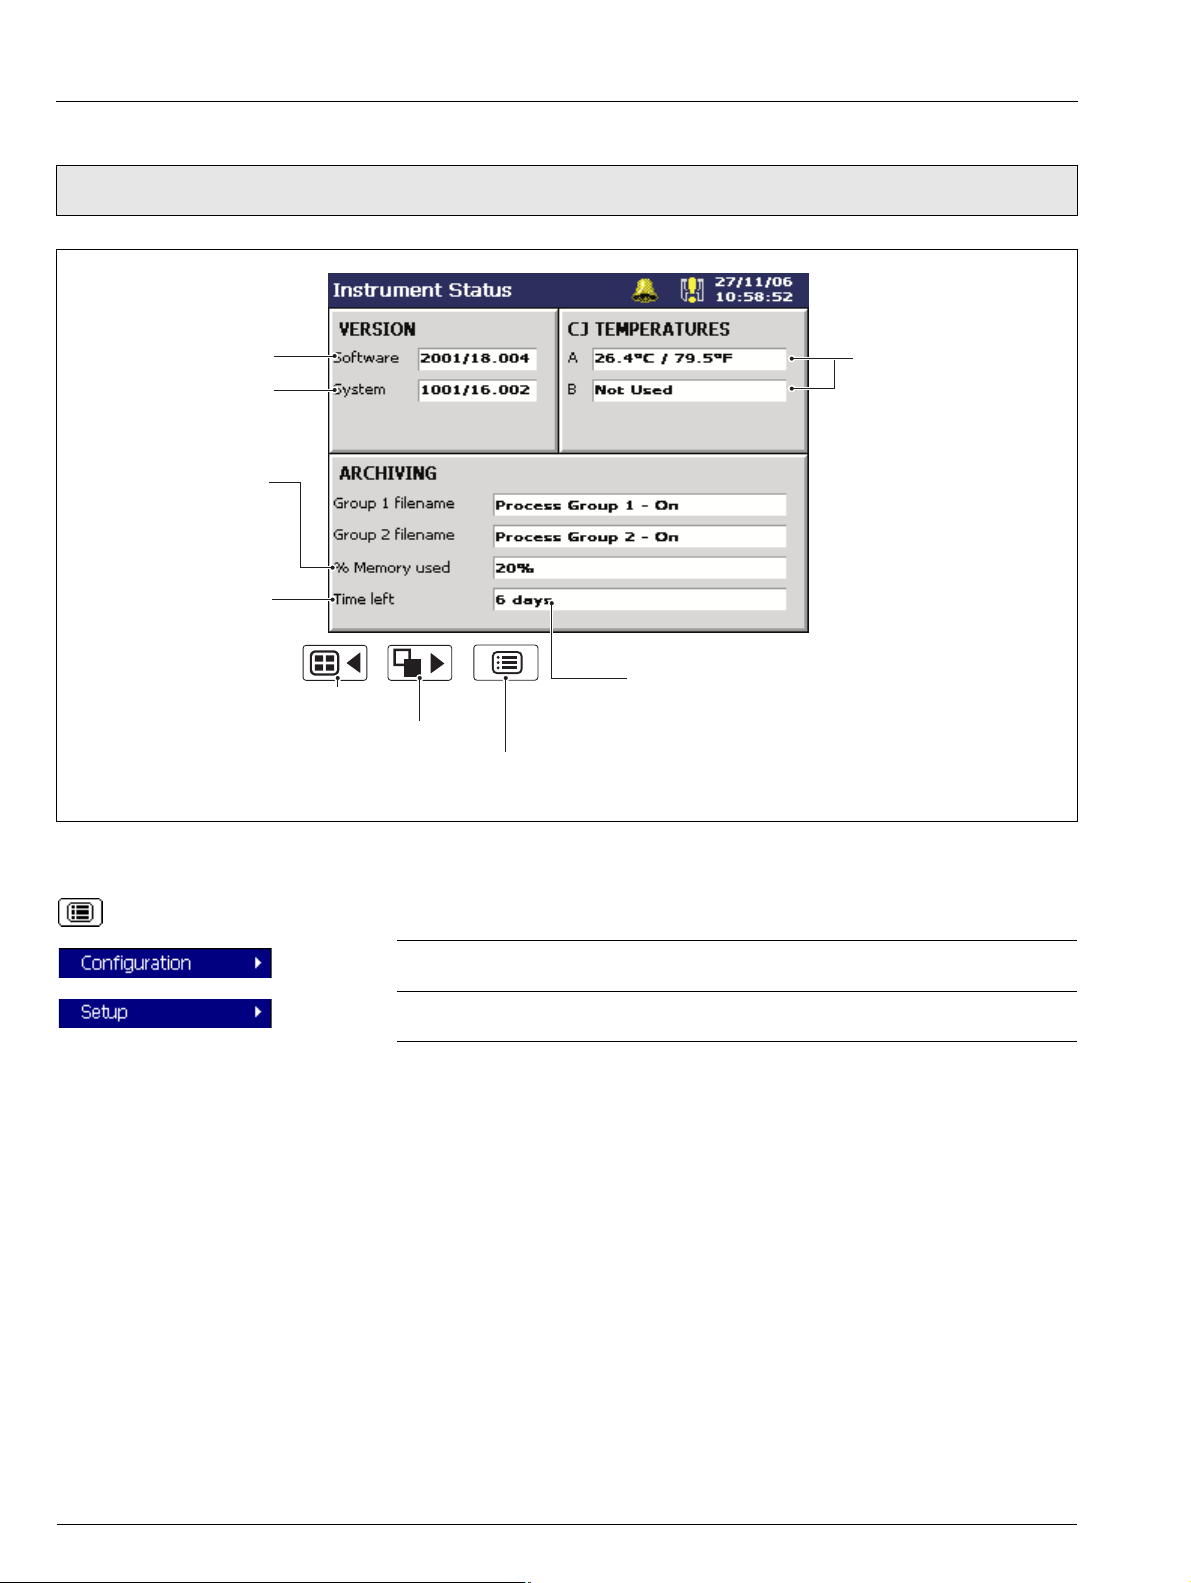
2.10 Status View – Fig. 2.11
Note. The Status view provides an overview of the instrument's status.
Instrument Software Version
Operating System Version
Amount of memory used
on the archive media
currently installed
Approximate time left
before the current archive
media is full, assuming the
amount of data recorded
remains the same
Selects Process Group 1
Fig. 2.11 Status View
Selects the Alarm Event Log
Opens the Operator Menu for
the current view
Cold junction temperatures
for Modules A & B; measured
by the built-in cold junction
circuitry.
'Not Used' is displayed if none
of the inputs on the module
are thermocouples.
Time Left Display Format
>=1 Day: Days, e.g. '5 Days'
>=1 Hour, <1 Day: Hours, e.g. '10 hours'
<1 Hour: Minutes, e.g. '25 minutes'
Select the Configuration Level – see Section 4, page 45.
Select the Setup Level – see Section 3, page 29.
28 IM/SM1000 Issue 12
Page 31

Videographic Recorder
SM1000 3Setup
3Setup
3.1 Introduction
Note. Users with Setup access can:
Start/Stop recording.
Switch between primary and secondary recording rates.
Set archiving 'on-line' and 'off-line'.
View internal and external archive media file directories and delete external archive media files.
3.2 Accessing the Setup Level – Figs. 3.2 and 3.3
Access to the Setup Level is controlled by the instrument's Security System – see Section 4.4.7, page 60.
If 'Security System' is set to 'Basic' and 'Setup Level Security' is set to 'Off', access to the Setup Level is unrestricted.
If 'Security System' is set to 'Basic' and 'Setup Level Security' is set to 'On', access to the Setup Level is protected by a single
password for all users. Refer to Fig. 3.2 to access the Setup Level.
If 'Security System' is set to 'Advanced' and 'Setup Level Security' is set to 'On', access to the Setup Level is protected by a
unique password for each authorized user. Refer to Fig. 3.3 to access the Setup Level.
Setup
Security
Enabled
Setup Security
Not Enabled
Fig. 3.1 Accessing the Setup Level – Basic Security
Note. The Setup level can be
accessed from any operator screen.
Invalid Setup
Password
Valid Setup
Password
IM/SM1000 Issue 12 29
Page 32

Videographic Recorder
SM1000 3Setup
Note. The Setup level can be
accessed from any operator screen.
Setup
Security
Enabled
Setup Security
Not Enabled
Fig. 3.2 Accessing the Setup Level – Advanced Security
Enter Password
(see Section 3.3, page 31)
Invalid Password
Entered
(see Note Below)
Valid Password
Entered
Note. If an incorrect password is entered the display returns to the Operating view. However, if the maximum number of
consecutive incorrect password entries is exceeded, the user's access privileges are removed and the following message is
displayed:
If this occurs, access privileges can be reinstated only by the system administrator (User 1). If the system administrator's access
privileges have been removed, the security system must be disabled using the configuration security switch (Yellow switch) to
gain access to the configuration – see Section 4.1.2, page 45.
30 IM/SM1000 Issue 12
Page 33

Videographic Recorder
SM1000 3Setup
3.3 Password Entry
Enter Password
1. Select the required character using the , , and keys.
2. Add the selected character to the password string using the key.
Note. For security, all characters are displayed as ''.
3. Repeat 1 and 2 until all characters have been entered.
4. Highlight the 'OK' button using the , , and keys and press .
Change Password
Select 'Change Password' using the , , and keys and press .
1. Highlight the Edit Button ( ) using the and keys and press to
display the character entry box.
2. Enter the old password using the , , and keys. Highlight the
'OK' button and press .
3. Enter the new password using the same procedure as for the old password.
4. Enter the new password again to confirm it.
5. Highlight the 'OK' button and press .
Password change successful.
Note. If the key is pressed at any stage or 'OK' is selected before the new
password is confirmed, the password change operation is cancelled and the following
message is displayed:
Password Expired
Passwords can be configured to expire at pre-determined intervals. If a password is time
expired, this screen is displayed automatically. Enter a new password as described
above.
IM/SM1000 Issue 12 31
Page 34

Videographic Recorder
SM1000 3Setup
3.4 Setup Menu
Use this menu to stop and start recording or switch between the Primary and Secondary
sample rates for the current Process Group.
The Primary sample rate is set typically to a relatively slow rate (depending upon process
recording requirements) and is active during normal process operating conditions in
order to maximize internal memory and external archive media.
The Secondary sample rate is set typically to a faster rate than the Primary sample rate
and may be selected manually in order to record the maximum amount of detail during,
for example, an alarm condition.
The rates are set during configuration – see Section 4.5.1, page 61.
Note.
Switching between the primary and secondary sample rates does not affect the
screen interval in the Chart view.
When the channels are set to 'Stop' the instantaneous values in the associated
indicators are displayed in red and, after the end of the next sample period, no
further samples are plotted on the associated traces.
Digital recording channels can only be set to 'Stop' or 'Go'.
Recording control can also be implemented using digital sources – see Sections
4.5.1 page 61 and 4.6.1 page 72.
If selected, the date of the oldest unarchived data is set to that of the oldest data in the
internal flash memory. This allows all data in the internal memory to be re-archived to
external media.
Note. Ideally, a blank media storage card should be inserted prior to selecting this
function.
To re-archive data:
1. Insert archive media, with sufficient free space, into the instrument.
2. Select 'Off-line' in the Setup Menu.
3. Select 'Reset archiving' in the Setup Menu.
4. Select 'On-line' in the Setup Menu.
5. Select data to be archived if >1 hour (Text format) or >1 day (Binary format) of data
in internal memory and press .
32 IM/SM1000 Issue 12
Page 35

Videographic Recorder
SM1000 3Setup
Places the archive media on-line, starting the archiving process.
Note.
The On-line function is disabled (greyed-out in the Setup Menu) if no archive media
card is inserted or the instrument has been placed in Historical Review mode.
When an archive media card is inserted and there is <1 hour (Text format) or <1
day (Binary format), the 'Select Line Status' dialog box (left) is displayed, giving the
user the choice of placing archiving on-line or remaining off-line. Archiving is placed
automatically on-line in 10 seconds unless 'Stay Offline' is selected.
When an archive media card is inserted and there is >1 hour (Text format) or >1
day (Binary format) of data in internal memory, the 'Select data to be archived'
dialog box (previous page) is displayed. Select data to be archived and press .
Once selected, all data within the selected time frame is archived. Older unarchived data
remains in the internal memory buffer until overwritten by newer data but is not available
for archiving unless 'Reset archiving' is selected.
Places the archive media off-line. Recording of channel data into internal memory
continues uninterrupted but archiving to the removable media is suspended until it is put
on-line again.
Note.
Always set the external media Off-line before removing it.
The Off-line function is disabled (greyed-out in the Setup Menu) when in Historical
Review mode.
Use the file viewer to view a list of the files stored in internal memory and on external
archive media.
Note. Files stored in internal memory cannot be deleted.
IM/SM1000 Issue 12 33
Page 36

Videographic Recorder
SM1000 3Setup
3.5 Archiving
Recorded data, logs and configuration files stored on the instrument's internal memory can be archived to files created on removable
media. Parameters for archiving Process Groups 1 and 2 data are set up independently.
Note. To configure Archiving, refer to Section 4.5.6.
3.5.1 Card Compatibility
Our recorders comply with approved industry standards for memory cards. SanDisk Standard Grade memory cards have been fully
tested and are recommended for use with our recorders. Other brands may not be fully compatible with this device and therefore
may not function correctly.
3.5.2 Media Status – Fig. 3.3
External archive media not inserted (yellow flashing exclamation mark)
External archive media on-line (green icon, shaded area indicates % used)
External archive media off-line (grey icon, shaded area indicates % used)
External archive media update in progress (see
External media 100% full, archiving stopped (green/red icon, flashing white cross)
Warning! Too many files (green icon media online, grey icon media offline)
Too many files, archiving stopped (red icon, flashing yellow cross)
Amount of memory used on the external archive media currently installed
Approximate time left before the current external archive media is full,
assuming the amount of data recorded remains the same.
Time Left Display Format
>=1 Day: Days, e.g. '5 Days'
>=1 Hour, <1 Day: Hours, e.g. '10 hours'
<1 Hour: Minutes, e.g. '25 minutes'
Note below)
Fig. 3.3 Media Status Icons
Note. Do not remove media while either of the media update in progress status icons ( or ) are displayed.
34 IM/SM1000 Issue 12
Page 37

Videographic Recorder
SM1000 3Setup
3.5.3 Inserting and Removing Media – Fig. 3.4
Set the archive media off-line –
1
see Section 3.4, page 33
4
3
Press the eject button
Unlock the media door with the key supplied
2
and press the release catch to open the door
4
Withdraw the media
Compact Flash Media SmartMedia
Note. When inserting the media into the instrument:
Ensure the media is the correct type for the instrument.
If SmartMedia option is fitted, ensure only 3.3V SmartMedia
cards used.
Do not use excessive force.
Fig. 3.4 Inserting and Removing External Media
IM/SM1000 Issue 12 35
Page 38

Videographic Recorder
SM1000 3Setup
3.5.4 Archive File Types
Archive files are created in one of two user-selectable formats:
Text (comma separated values [.csv]) – see Section 3.6,
page 37
or
Secure binary encoded – see Section 3.7, page 41
All archive files created by the instrument are given filenames
automatically but each type of archived file is given a different file
extension depending on whether Text or Binary format has been
selected during archive configuration – see Section 4.5.6,
page 70. File types and extensions for Text files are shown in
Table 3.1. File types and extensions for Binary files are shown in
Ta bl e 3. 2 .
Ty pe Extension Contents
Channel
data files
Alarm
event log
files
Totalizer
log files
Audit log
files
Digital
signature
files
Batch
data files
*.D**
*.E**
*.T**
*.A**
*.S**
*.V**
Analog or digital recording channels in the
current process group.
The historical record of the alarm events
related to the group's channels plus the
history of any operator messages,
electronic signatures or real time alarms.
The historical record of all totalizer and
associated statistical values relating to the
group's recording channels.
The historical entries from the audit log.
(Note. The content of this file is the same
for all groups).
Digital signature file for the corresponding
channel data file.
Analog or digital recording channels in the
current process group when the batch
function is active.
Ty pe Extension
Channel
data
files
Batch
channel
data
files
Alarm
event
log files
Totalizer
log files
Audit
log files
Batch
log files
* Batch files are created only if the Batch Recording software option
is enabled.
*.B00
*.V**
*.EE0
*.TE0
*.AE0
*.X**
Table 3.2 Binary Encoded Format File Types and Extensions
No. of
Files
One per
channel
One per
channel
One per
process
group
One per
process
group
One per
instrume
nt
One per
process
group
Contents
Analog or digital recording
channel data
Batch recording
channel data *.
The historical record of the
alarm events related to a
particular process group's
channels plus the history of
any operator messages,
electronic signatures or real
time alarms.
The historical record of all
totalizer and associated
statistical values relating to a
particular group's recording
channels.
The historical entries from the
audit log.
Batch information associated
with a process group *.
Batch
log files
*.X** Historical record of the batches recorded.
Table 3.1 Text Format File Types and Extensions
36 IM/SM1000 Issue 12
Page 39

Videographic Recorder
SM1000 3Setup
3.6 Text Format Archive Files
3.6.1 Text Format Channel Data Files
Text format channel data files can be configured to contain data
gathered over a predefined period of time using the 'New File
Interval' setting – see Table 3.3.
New File Interval Filename
Hourly <hour> <day, month, year>* <filename tag>
Daily <day, month, year>* <filename tag>
Monthly <month, year>* <filename tag>
None <filename tag>
* Formatted according to the date format set in Common
Configuration – see Section 4.4.3, page 54
Table 3.3 New Text File Intervals
Note. The 'New File Interval' is set in the Configuration level
– see Section 4.5.6, page 70.
In addition to new channel data files being created according to
the New File Interval selection, they are also created in the
following circumstances if automatic update is enabled and the
media is on-line or if a manually triggered update is in progress:
The instrument's power is lost then restored.
The instrument is taken offline and the archive media
removed, replaced or refitted.
The instrument's configuration is changed.
One of the current files exceeds the maximum permissible
size.
When the daylight saving period starts or ends.
Files containing data generated during the daylight saving period
(summertime) have '~DS' appended to the filename.
Example 1 – Start of daylight saving period:
A daily file is started at 00:00:00 on 30th March 2003 –
filename: 30Mar03ProcessGroup1.D00.
Summertime starts at 2:00am on 30th March 2003.
The clock changes automatically to 3:00am.
The existing file is closed and a new file is created –filename:
30Mar03ProcessGroup1~DS.D00.
The file '30Mar03ProcessGroup1.D00' contains data
generated from 00:00:00 to 01:59:59 (before summertime
starts).
The file '30Mar03ProcessGroup1~DS.D00' contains data
generated from 03:00:00 (after summertime starts).
Example 2 – End of daylight saving period:
A daily file is started at 00:00:00 on 26th October 2003 –
filename: 26Oct03ProcessGroup1~DS.D00
Summertime ends at 3:00am on 26th October 2003.
The clock changes automatically to 2:00am.
The existing file is closed and a new file is created –filename:
26Oct03ProcessGroup1.D00
The file '26Oct03ProcessGroup1~DS.D00' contains data
generated from 00:00:00 to 02:59:59 (before summertime
ends).
The file '26Oct03ProcessGroup1.D00' contains data
generated from 02:00:00 (after summertime ends)
Note. The instrument's internal clock can be configured to
adjust automatically at the start and end of Daylight Saving
Time (Summertime) periods – see Section 4.4.6, page 60.
When one of these conditions occurs, new channel data files
are created for each enabled group and the file extension index
on each new file is incremented by one from the previous file.
Example – if the original file had an extension of .D00, after
one of the above events a new file will be created with the
same filename but an extension of .D01.
IM/SM1000 Issue 12 37
Page 40

Videographic Recorder
SM1000 3Setup
3.6.2 Text Format Filename Examples
'New file interval' set to 'Hourly', 'Filename tag' set to 'Process
Group 1' (see Section 4.5.6, page 70); date is 10th October
2000; Channel data and alarm event log files only enabled:
9:00 amNew file created in which all channel data recorded
between 9:00 and 9:59:59 is archived in the following file:
09_00_10Oct00_Process_Group_1.d00
09:12amPower interrupt occurs
09:13amPower restored and new file created:
09_00_10Oct00_Process_Group_1.d01
10:00amNew file created in which all data recorded between
10:00 and 10:59:59 is archived.
10_00_10Oct00_Process_Group_1.d00
Note.
Hourly files start exactly on the hour.
Daily files start at 00:00:00.
Monthly files start at 00:00:00 on the first of the
month.
3.6.3 Text Format Log files
The Alarm Event and Totalizer Logs for each Process Group and
the Audit Log are archived into individual files. The filenames are
formatted as shown in Table 3.4 with the date and the time
indicating the first entry in the file.
Log File Filename
Alarm Event <hour min> <dd, mm, yy>* <process group tag>.e00
Totalizer <hour min> <dd, mm, yy>* <process group tag>.t00
Audit <hour min> <dd, mm, yy>* <instrument tag>.a00
* Formatted according to the date format set in Common
Configuration – see Section 4.4.3, page 54
Table 3.4 Log File Formats
If one of the archive log files becomes full (>64000 entries) a
new file is created with an extension incremented by 1, e.g. a01,
e01 etc.
Note. Totalizer logs are created only if the totalizer option is
enabled.
New text format log data files are also created when the daylight
saving period starts or ends.
Files containing log data generated during the daylight saving
period (summertime) have '~DS' appended to the filename.
38 IM/SM1000 Issue 12
Page 41

Videographic Recorder
SM1000 3Setup
3.6.4 Text Format Data File Examples – Figs. 3.5 to 3.8
Text format archived data is stored in a comma separated value
(*.csv) format so that it can be imported directly into a standard
spreadsheet, e.g. Microsoft Excel™ and Lotus 1-2-3™. The
files can also be read as an ASCII text file by a text viewer. When
imported into a spreadsheet, the files appear as shown in Figs.
3.5 to 3.8.
Alternatively, detailed graphical analysis of the data can be
carried out on a PC using the Company's DataManager data
analysis software package.
3.6.5 Text Format Data File Digital Signatures – Fig. 3.5
A digital signature file is created for each channel data file using
the same filename but with a *.S** extension. The file contains a
unique 'fingerprint' of the contents of the data file that can be
used to prove if the data has been tampered with or corrupted.
Data validation can be carried out on a PC using the Company's
DataManager software package.
3.6.6 Text Format Data Verification and Integrity
When data is saved to the archive media it is checked
automatically to verify that the date value stored on the media
matches exactly the date value stored in the internal memory.
Fig. 3.5 Channel Data File Sample – Text Format
IM/SM1000 Issue 12 39
Page 42

Videographic Recorder
SM1000 3Setup
Fig. 3.6 Alarm Event Log Sample – Text Format
Fig. 3.7 Totalizer Log Sample – Text Format
Fig. 3.8 Audit Log Sample – Text Format
40 IM/SM1000 Issue 12
Page 43

Videographic Recorder
SM1000 3Setup
3.7 Binary Format Archive Files
3.7.1 Binary Format Archive Filenames
Examples of binary archive filenames are shown in Table 3.5.
Ty pe Format
Channel
data files
Alarm
event log
files
To ta li ze r
log files
Audit log
files
<Start Time HHMMSS><Start Date
DDMMMYY>Ch<Group>_<Channel><Instrument tag>
e.g. 14322719Dec03Ch1_2Boiler room3
<Start Time HH_MM><Start Date DDMMMYY><Process
Group Tag> e.g. 14_3219Dec03Boiler5
<Start Time HH_MM><Start Date DDMMMYY><Process
Group Tag> e.g. 14_3219Dec03Boiler5
<Start Time HH_MM><Start Date
DDMMMYY><Instrument Tag> e.g. 14_3219Dec03Boiler
room 3
Table 3.5 Binary Archive Filenames
3.7.2 Binary Format Channel Data Files
A new binary format channel data file is created under the
following conditions:
When the current file for a channel does not exist on the
media card.
When the maximum size (5Mb) of the existing data file is
exceeded.
When the recording channel's configuration is changed.
When the daylight saving period starts or ends.
Note. The instrument's internal clock can be configured to
adjust automatically at the start and end of Daylight Saving
Time (Summertime) periods – see Section 4.4.6, page 60.
Files containing channel data generated during the daylight
saving period (summertime) have '~DS' appended to the
filename.
Example 1 – Start of daylight saving period:
Archiving is started at 01:45:00 on 30th March 2003 –
filename: 01450030Mar03Ch1_1AnlgSM2000.B00.
Summertime starts at 2:00am on 30th March 2003.
The clock changes automatically to 3:00am.
The existing file is closed and a new file is created –filename:
03000030Mar03Ch1_1AnlgSM2000~DS.B00.
The file '01450330Mar03Ch1_1AnlgSM2000.B00' contains
data generated from 01:45:00 to 01:59:59 (before
summertime starts).
The file '03000030Mar03Ch1_1AnlgSM2000~DS.B00'
contains data generated from 03:00:00 (after summertime
starts).
Example 2 – End of daylight saving period:
Archiving is started at 00:15:00 on 26th October 2003 –
filename: 00150026Oct03Ch1_1AnlgSM2000~DS.B00.
Summertime ends at 3:00am on 26th October 2003.
The clock changes automatically to 2:00am.
The existing file is closed and a new file is created –filename:
02000026Oct03Ch1_1AnlgSM2000.B00.
The file '00150026Oct03Ch1_1AnlgSM2000~DS.D00'
contains data generated from 00:15:00 to 02:59:59 (before
summertime ends).
The file '02000026Oct03Ch1_1AnlgSM2000' contains data
generated from 02:00:00 (after summertime ends).
3.7.3 Binary Format Log files
A new binary log file is created under the following conditions:
When an existing valid binary log file does not exist on the
media card.
When the maximum size (64000 entries) is exceeded.
When the daylight saving period starts or ends.
Files containing log data generated during the daylight saving
period (summertime) have “~DS” appended to the filename.
3.7.4 Binary Format Data File Examples – Figs. 3.9 to 3.12
Binary format archived data is stored in a secure binary encoded
format. A separate file is created for each recording channel.
The log data is stored in an encrypted text format. The files can
be read on a PC using the Company's DataManager data
analysis software package.
Note. Binary format archive files created during the daylight
saving period (summertime) are compatible with the
database feature of Version 5.8 (or later) only of the
Company's DataManager data analysis software package.
3.7.5 Binary Format Data Verification and Integrity
When data is saved to the archive media it is checked
automatically to verify that the data stored on the media
matches exactly what is stored in the internal memory.
Each block of data in the channel data files has its own data
integrity check. This enables the integrity of the data stored on
the external media card to be verified when it is viewed using the
Company's DataManager software package.
The log files also contain built-in integrity checks enabling the
integrity of the data to be verified by the DataManager software.
IM/SM1000 Issue 12 41
Page 44

Videographic Recorder
SM1000 3Setup
Fig. 3.9 Channel Data File Sample – Binary Format
Fig. 3.10 Alarm Event Log Sample – Binary Format
42 IM/SM1000 Issue 12
Page 45

Videographic Recorder
SM1000 3Setup
Fig. 3.11 Totalizer Log Sample – Binary Format
Fig. 3.12 Audit Log Sample – Binary Format
IM/SM1000 Issue 12 43
Page 46

Videographic Recorder
SM1000 3Setup
3.8 Archiving Online/Offline
Before data can be archived to external media, the external
media must be placed on-line and one or more archive file
enables set.
When an external archive media card is inserted and there
is <1 day (Binary format) or <1 hour (Text format) of data in
internal memory, a dialog box is displayed giving the user
the choice of putting the media on-line or remaining offline. If no selection is made within 10 seconds, the media
card is placed on-line automatically:
When an external archive media card is inserted and there
is >1 day (Binary format) or >1 hour (Text format) of data in
internal memory, a dialog box is displayed prompting the
user to select either the data to be archived or remain offline:
External archive media can be set on-line (if a media card
is inserted) or off-line in the setup menu.
Set archiving off-line before removing external media to
prevent loss of data and possible damage to the media
card.
When external archive media contains approximately 250
files, its read/write performance begins to degrade and
either of the 'Warning – Too Many Files' icons ( or )
are displayed. Change the media as soon as possible.
When external archive media contains approximately 300
files, its read/write performance becomes too slow,
Archiving is stopped automatically and the 'Too Many
Files – Archiving Stopped' icons ( alternating with )
are displayed. Change the media immediately to prevent
loss of data.
Note. Data stored in the internal memory buffer can still be
transferred to the archive media when the archive media is
placed on-line again (providing it is not off-line so long that
the un-archived data in the internal memory is overwritten).
3.9 Backing-up Archived Data
It is advisable to back-up critical data stored on SmartMedia or
Compact Flash cards on a regular basis. The instrument's
internal memory provides a buffer for the most recent data so, if
data stored on archive media is lost, it can be re-archived – see
'Reset archiving' on page 32.
To ensure that all required data is available for re-archiving, it is
recommended that data archived on archive media is removed
and backed-up before the instrument's internal buffer overwrites
that data. The length of time for which data remains in the
instrument's internal memory depends on the sample rate and
the number of channels selected – see Table C.1 on page 116
for details.
If a large amount of Text format unarchived data is
selected, a progress bar appears. During this time
operator views cannot be accessed, but new data
continues to be recorded to the internal buffer memory.
44 IM/SM1000 Issue 12
3.10 Archive Wrap
Archiving can be configured to delete the oldest archived data
file automatically from the external media when the media
approaches its maximum capacity – see 'Wrap' on page 71.
Page 47

Videographic Recorder
SM1000 4 Configuration
4 Configuration
4.1 Introduction
This section details the configuration of the instrument locally
using the front panel membrane keys. A configuration file can
also be created on a PC and transferred to the instrument via
one of the archive media options.
In addition, up to 16 different configurations can be stored in
internal memory and restored when required.
4.1.1 Configuration Level Security
Two methods of configuration access protection are available:
1.
Password protection
The Configuration level cannot be accessed until the correct
password has been entered – see Fig. 4.1, page 46.
2. Internal switch protection.
The Configuration level cannot be accessed until the
instrument is withdrawn from its case and the internal
switch set to the 'Configuration Level Not Protected'
position – see Fig. 4.2, page 47.
Internal Security Switch
Setting
(see Fig. 4.2, page 47)
Configuration Level
Protected
(Factory Default)
Configuration Level Not
Protected
(Factory Default).
'Configuration security'
Parameter Setting
(see Section 4.4.4, page 56)
'Password
protected'
(Factory Default)
Password Access No Access
Free Access Free Access
'Internal switch
protected'
(Alternative)
The instrument can be configured for one of two levels of
password protection:
Basic Security:
Up to 4 users
Each user is assigned a unique 4-digit security code for
Configuration level access
Optional security code protection of access to Setup level
Advanced Security:
Up to 12 users
Each user is assigned a unique password of up to 20
characters
Each user is assigned configuration, setup and/or
electronic signature access privileges
Each user is assigned one of 3 levels of configuration level
access privileges
Configurable password expiry times, password failure
limits and minimum password length
Inactive user disabling
Note. The electronic signature feature is available only with
Advanced security.
4.1.2 Configuration Level Access – Figs. 4.1 and 4.2
To configure an instrument when 'Configuration security type' is
set to the factory default setting of 'Password protected':
Access the Configuration Level – see Fig. 4.1, page 46.
Make changes to parameters as detailed in Figs.
4.1
and
4.3
.
To configure an instrument when 'Configuration security type' is
set to 'Internal switch protected':
Set the internal security switch to the 'Configuration Level
Not Protected' position – see Fig. 4.2, page 47.
Access the Configuration Level – see Fig. 4.1, page 46.
Make changes to parameters as detailed in Figs.
4.1
and
4.3
.
IM/SM1000 Issue 12 45
Page 48

Videographic Recorder
SM1000 4 Configuration
Invalid Password
Entered
Configuration Level Protected
(see Section 4.1.1, page 45)
Displayed only if 'Security
system' parameter is set to
'Basic' – see
Section 4.4.4, page 56
Displayed only if 'Security
system' parameter is set to
'Advanced' – see
Section 4.4.4, page 56
Configuration Level Unprotected
(see Section 4.1.1, page 45)
Check this box to
stop recording
while in the
configuration
mode
Use and
to highlight a
different selection.
Use
to
accept the
selection.
The existing security configuration parameters are
retained (i.e. the security configuration remains as
currently configured) when a configuration is opened
from file or when a new configuration is loaded.
Check 'Load security configuration from file' to
overwrite the current security configuration with
data from the file to be loaded see
Cancel and return to
the operator level
Note 2 below.
Edit the current configuration. Changes are not implemented
until saved on exit from the Configuration level
Open a configuration saved previously to internal or external
storage (up to 16 configurations can be stored in internal
memory) – see
QuickStart templates – see Appendix D, page 119.
Press to toggle between
internal and external
storage.
Open a new configuration with
the default settings detailed in
Appendix D, page 119 – see
1
below
Note 1 below. Alternatively, open one of the
Press to accept
the selection.
Press to cancel.
Note
Valid Password
Entered
Fig. 4.1 Accessing the Configuration Level
Note.
1. If 'New Configuration' or 'Open a Configuration' is selected and the modified configuration file is saved later as the current
configuration, new internal data files for all enabled recording channels are created and any unarchived data is lost.
2. The option to load or retain the security configuration applies only to Advanced Security mode and is available only to the
System Administrator (User 1). If a new or existing configuration file is opened by a user other than the System
Administrator, the instrument's existing security settings are retained.
46 IM/SM1000 Issue 12
Page 49

Videographic Recorder
SM1000 4 Configuration
Note. The Internal Security Switch is used to access the Configuration level when 'Configuration security' is set to 'Internal
switch protected' – see Section 4.4.4, page 56.
Do Not use the switch to access the Configuration level when 'Configuration
security' is set to 'Password protected' (default setting) unless the Password has been forgotten. The switch overrides Password
protection, enabling free access to the Configuration level.
Set the yellow Security switch to the
4
Switch off the power to
the instrument and unscrew
the jacking screw securing
2
the instrument to the case.
Withdraw the instrument
3
from the case
'Configuration Level Not Protected' position
Configuration Level Protected
Configuration Level Not Protected
Red Switch
(see
Note below)
Remove tamper-evident
1
seal (if fitted)
Refit the instrument to the case
5
and secure with the jacking screw
Re-apply power to the
6
instrument and wait for
the Operator Level to display
Access the Configuration level as
7
shown in Fig. 4.1
Fig. 4.2 Setting the Security Switch
Note. The red switch is for factory use only. Ensure it remains in the position closest to the rear of the instrument.
IM/SM1000 Issue 12 47
Page 50

Videographic Recorder
SM1000 4 Configuration
4.2 Overview of Configuration – Fig. 4.3
Select 'Common' from the Configuration menu.
1
Note below).
(See
Select the required parameter
2
using the
Press the key to
3
edit selected parameter.
Use the and keys to
4
select the next required tab.
and keys.
Press the
Select the next item required and
5
activate using the
When all configuration changes are
complete select Exit to save or
6
cancel changes.
Fig. 4.3 Overview of Configuration Steps
Note. Only enabled Process Groups (and their associated Channel Options) are visible in the menu.
4.2.1 Adjusting Screen Contrast – Fig. 4.4
Adjust the contrast to the required level using the and keys
1
(0 = darkest and 100 = lightest).
2
Pre ss the
or
Press the
key to save selected contrast level
key to cancel the selection.
key to display the menu.
key.
Fig. 4.4 Adjusting Screen Contrast
48 IM/SM1000 Issue 12
Page 51

Videographic Recorder
SM1000 4 Configuration
4.3 Making Changes to Parameters – Figs. 4.5 to 4.7
Configuration Tab
Parameter
Parameter Value
Edit Button
Sub-menu
Higher-level windows
remain visible to identify
location within the
configuration structure
Selection List
Use the and keys to
highlight a selection.
Press the
key to accept
the selection
Fig. 4.5 Locating Parameter Settings
Note.
The appropriate data entry box is displayed automatically – see Fig. 4.6
Use the key to open the Configuration menu in order to select a different channel – see Fig. 4.11, page 72.
IM/SM1000 Issue 12 49
Page 52

Videographic Recorder
SM1000 4 Configuration
Use and keys to
highlight an item and press
to select it.
Note. Items not selected are indicated
by an X in the parameter value window.
Parameter Limits
Note. Values outside the preset
parameter limits or with too many decimal
places are highlighted when the OK
button is selected.
Fig. 4.6 Data Entry Dialog Boxes
Highlight text box and use
keys to position cursor to edit text as required.
Use , , and
keys to highlight a
character and press
to select it.
and
Cursor
Spacebar
Note. Tags with a high percentage of capital letters and wide characters such as 'W' or 'M' may appear truncated in some
Operator Views. In such cases, use lower case letters or fewer characters.
50 IM/SM1000 Issue 12
Page 53

Videographic Recorder
SM1000 4 Configuration
Configuration
change will
cause the internal
recording data
files to be
recreated
Configuration
change will not
cause the internal
recording data
files to be
recreated
Fig. 4.7 Exiting Configuration Mode
Note.
The current, active configuration is saved to internal storage with the filename 'SM1000.cfg'.
Selecting 'Save as Current Configuration' suspends recording for a short time while the new configuration is implemented.
When saving the current configuration to internal storage, the file is saved automatically with the 'SM1000.cfg' filename,
and with a '<time><date><instrument tag>.cfg' filename.
When saving the current configuration to external storage, the file is saved automatically to internal storage with the
'SM1000.cfg' filename, as well as to the external archive media as '<time><date><instrument tag>.cfg'.
When 'Save Configuration' is selected, the configuration file is stored as '<time><date><instrument tag>.cfg' on internal or
external storage.
Changes are saved to non-volatile memory only when one of the save options above has been selected. Any powerdown
before this results in lost configuration changes.
Selecting 'Cancel' discards unsaved changes and returns the instrument to the Operating level.
New internal data files for enabled recording channels are created if any of the following configuration parameters are
changed:
– Recording channel source
– Primary/secondary sample rate
– Primary/secondary sample rate source
– Input filter type
– Engineering range
– Channel tag
New internal data files for all enabled recording channels are created if the number of groups is changed, or any previously
disabled channel is enabled. Any unarchived data is lost.
A warning is displayed if a configuration change will result in new internal data files for enabled recording channels being
created. Select 'Yes' to accept the configuration change. Select 'No' to cancel the configuration change.
IM/SM1000 Issue 12 51
Page 54

Videographic Recorder
SM1000 4 Configuration
4.4 Common Configuration
Fig. 4.8 Selecting Common Configuration
4.4.1 Setup
Configuration type is fixed as 'Basic'.
Enter the number of process groups required.
Each Process Group has 6 recording channels pre-assigned to
it – Group 1 (Ch1.1 to 1.6), Group 2 (Ch2.1 to 2.6).
If the Number of Groups is changed from 2 to 1, configuration
data for Process Group 2 is retained but not used.
Select the language to be used to display standard user
prompts and menu items.
Select a signal source used to acknowledge all active alarms in
both Process Groups simultaneously. Refer to Appendix A,
page 104 for a description of the available sources.
Note. This signal is edge-triggered. A rising edge (inactive to
active) or falling edge (active to inactive) triggers global alarm
acknowledgement.
Enter the tag to be used to identify the instrument on
1
configuration and audit log files.
Note. When reviewing data, the instrument tag is used to
identify the source of the data, therefore it is important to ensure
that the instrument tag is unique to each recorder.
•1 If this parameter is changed, internally recorded data files are recreated and unarchived data is lost.
52 IM/SM1000 Issue 12
Page 55

Videographic Recorder
SM1000 4 Configuration
4.4.2 Screen
Select the waiting time between the last key press and
activation of the screen saver.
When set to 'Enabled', the user can save an image of any
Operator screen to external archive media by pressing the
key when an Operator Menu is not open.
Note.
All images are saved to a folder on the archive media
named 'BMP'.
The images are saved even if archiving is set to 'Offline'.
If external archive media is not inserted, or is full, the
screen capture facility is disabled automatically.
Adjust screen contrast – refer to Section 4.2.1, page 48.
IM/SM1000 Issue 12 53
Page 56

Videographic Recorder
SM1000 4 Configuration
4.4.3 Time
Set the current date and time.
Note. If daylight saving is required, enter the settings (see next
page)
before setting the time and date as the operation of the
internal clock is affected by the daylight saving settings.
Note.
The date and time cannot be adjusted if recording is
enabled during configuration, i.e the 'Disable recording in
configuration' check box is
not ticked on entry to the
Configuration level – see Fig. 4.1, page 46.
Changes to the date and time are effective immediately
upon selecting 'OK' in the dialog box above. Selecting
'Cancel' upon exiting Configuration Mode (see Fig. 4.7,
page 51)
does not reset the clock to its previous setting.
Select 'Cancel' in the dialog box above to exit date and
time setup without saving changes.
Setting an earlier date or time results in the loss of all data
currently in the internal buffer memory past that date. Data
archived to external media is unaffected. If an earlier time
must be set, change the Instrument Tag (see below). This
causes new archive files to be created and the duplicated
hour of data is then saved to the new files.
Time changes due to automatic daylight saving do not
affect the recorded data.
Archive files created during the daylight saving period (see
Section 4.5.6, page 70) are compatible with the database
feature of Version 5.8 (or later) only of the Company's
DataManager data analysis software package.
54 IM/SM1000 Issue 12
Page 57

Videographic Recorder
SM1000 4 Configuration
Select the daylight saving method.
Note. Changes to daylight saving are effective immediately a
method is selected. However, if 'Cancel' is selected upon
exiting Configuration Mode (see Fig. 4.7, page 51), the last
saved daylight saving settings are restored.
Off Daylight saving is disabled.
Auto - USA The start and end of the daylight saving period in the
USA is calculated automatically.
The clock is incremented automatically by 1 hour at
2:00am on the first Sunday in April and decremented
automatically by 1 hour at 2:00am on the last Sunday
in October.
Auto - Europe The start and end of the daylight saving period in
Auto - Custom The start and end of the daylight saving period can be
Central Europe is calculated automatically.
The clock is incremented automatically by 1 hour at
2:00am on the last Sunday in March and
decremented automatically by 1 hour at 2:00am on
the last Sunday in October.
configured manually for regions that do not follow
either the USA or Europe conventions.
The clock is incremented automatically by 1 hour at
the manually selected start time and decremented
automatically by 1 hour at the manually selected end
time.
Note. Displayed only if 'Daylight Saving - Enable' is set to
'Auto - USA'.
Note. Displayed only if 'Daylight Saving - Enable' is set to
'Auto - Europe'.
Note. Displayed only if 'Daylight Saving - Enable' is set to
'Auto - Custom'.
Set the start and end of the daylight saving period.
IM/SM1000 Issue 12 55
Page 58

Videographic Recorder
SM1000 4 Configuration
4.4.4 Security
Note. User 1 is the System Administrator and is able to change the Security type and all other security parameters. Other users
can change only the 'Setup level security' setting and only if 'Security system' is set to 'Basic'.
Set the Security type.
Select Basic or Advanced security – see Section 4.1.1, page 45.
Set the method of access to the Configuration level.
If 'Password protected' is selected, access is by means of the
password set for the user in Section 4.4.6.
Note.
If 'Switch protected' is selected, access to the
Configuration level for all users is prohibited once the
changes have been saved and made active. Access to the
Configuration level is then achieved only by setting the
internal security switch to the 'Configuration Level Not
Protected' position – see Fig. 4.2, page 47.
Configuration level security is accessed and modified only
by the System Administrator (User 1).
When set to 'On', access to the Setup level is password
protected.
If 'Security system' is set to 'Basic', access to the Setup
level is protected by a single password for all users.
If 'Security system' is set to 'Advanced', access to the
Setup level is protected by each user's unique password.
Note. Displayed only if 'Security system' is set to 'Basic' and
'Setup level security' is set to 'On' – see above.
Enter the password to be used by all users to access the Setup
level.
56 IM/SM1000 Issue 12
Page 59

Videographic Recorder
SM1000 4 Configuration
Note. The following parameters:
are displayed only if 'Security system' is set to 'Advanced' – see page 56.
can be changed only by the System Administrator (User 1).
Passwords are entered initially by the System Administrator but,
subsequently, any user can change their own password. When
this parameter is set to 'Yes', each user must change their
password after it is used for the first time following initial
configuration – see also Section 4.4.5 on page 58.
Enter the time period after which all passwords expire. After this
period of time, all users must change their passwords.
Enter the time period after which an inactive user's access
privileges are de-activated. A user is considered inactive if their
password has not been used. A user is de-activated by removal
of their access privileges and can be re-activated only by the
System Administrator (User 1).
Enter the number of consecutive incorrect password entries
allowed by a user. If the number of incorrect entries exceeds this
limit, the user's access privileges are de-activated and can be
reinstated only by the System Administrator (User 1).
Passwords have a maximum length of 20 characters. Enter the
minimum length required for all new passwords.
IM/SM1000 Issue 12 57
Page 60

Videographic Recorder
SM1000 4 Configuration
4.4.5 Users
Note.
User 1 is the System Administrator and is able to change user names/access privileges and enter initial passwords for all
other users. Other users cannot change their user names and access privileges once set by User 1. All users may change
their own passwords.
The following parameters are displayed only if 'Security system' is set to 'Basic' – see Section 4.4.4, page 56.
Set the user name(s) and associated password(s) to be used to
access the Configuration level when 'Configuration security' is
set to 'Password protected' – see below.
Enter a name for the selected user.
Enter an initial password for the selected user.
Set access privileges for the selected user.
Enabled – The selected user is able to access the
Configuration level.
No access – The selected user is unable to access to the
Configuration level.
Note. When the method of access to the Configuration level is
set to 'Password protected' (see Section 4.4.4, page 56) and a
user with Configuration level access privileges changes the
instrument's configuration, the 'Name' of the user is included in
the audit log entry.
58 IM/SM1000 Issue 12
Page 61

Videographic Recorder
SM1000 4 Configuration
Note. The following parameters are displayed only if 'Security system' is set to 'Advanced' – see Section 4.4.4, page 56.
Configure User 1 (System Administrator)
Note. Full Configuration level access privileges for User 1
cannot be disabled but Setup level access and the Electronic
Signature privilege may be enabled/disabled as required.
The System Administrator (User 1) can view and/or change the
user name, access privileges and password for any other user.
Select the user to be viewed/edited.
Enter a name for the selected user.
Set access privileges for selected user.
Electronic Signature– The selected user is able to enter an
electronic signature.
Setup – The selected user is able to access the
Setup level.
Configuration (No access) (Disabled)
– The selected user is unable to access
the Configuration and Setup levels or
enter electronic signatures.
Config (Load) – The selected user is unable to make
any configuration changes but can load
configurations from external media.
Configuration (Ltd) – The selected user is able to:
• Change alarm trip points, hysteresis
and time hysteresis settings.
• Make input adjustments for analog
input boards.
• Load configurations from external
media only.
Configuration (Full) – The selected user is allowed full
configuration access with the exception
of access to the Audit Log size setting
and the Security Settings.
Note. The System Administrator (User 1) only is able to change
the Audit Log size and the Security Settings.
Enter an initial password for the selected user.
Note. The user may subsequently change this password.
IM/SM1000 Issue 12 59
Page 62

Videographic Recorder
SM1000 4 Configuration
4.4.6 Logs
Set the maximum number of entries in each instrument log.
Note. Changing the log size deletes the current log entries.
The
Alarm Event log records all process alarm transitions
(inactive to active, unacknowledged to acknowledged or active
to inactive), real-time events and Operator Messages – see
Section 2.7, page 23.
The Totalizer log records all activity associated with the
totalizers: start, stop, reset, wrap, current total and intermediate
totals – see Section 2.8, page 25.
Audit log records all system changes and events – see
The
Section 2.9, page 27.
Note.
The
Totalizer log is displayed only if the Totalizer option is
enabled.
The size of the Audit log can be changed only by the
System Administrator (User 1).
4.4.7 Operator Messages
Log sizes must be set in the range 10 to 200. The size of the
logs has no effect on the amount of memory available for storing
channel data.
Operator messages can be triggered via the Operator Menus or
a digital signal.
Message Tag
Enter the message text – 20 characters maximum.
Source ID
Select a signal source used to add the Operator Message to the
Alarm Event log. Refer to Appendix A, page 104 for a
description of the available sources.
Note. This signal is edge-triggered. A rising edge (inactive to
active) or a falling edge (active to inactive) triggers the addition of
the Operator Message to the Alarm Event log.
Assign to group 1/Assign to group 2
Select the group(s) to which the message is to apply.
60 IM/SM1000 Issue 12
Page 63

Videographic Recorder
SM1000 4 Configuration
4.5 Process Group Configuration
Process Group 1
or
Process Group 2
(see Note below)
Fig. 4.9 Selecting Process Group Configuration
Note. If 'Number of groups' is set to '1' (see Section 4.4.1, page 52), only one Process Group and its associated channels is
displayed in the configuration menu.
4.5.1 Setting the Recording Parameters
Enter the process group tag (maximum 20 characters) that
appears in the title bar when any operator views from that group
are displayed.
Note. Each process group tag
must be unique.
Select a signal source to enable/disable recording of all
channels in the current Process Group. Refer to Appendix A,
page 104 for a description of the available sources.
Note. This signal is edge-triggered. A rising edge (inactive to
active) enables recording. A falling edge (active to inactive)
disables recording.
Enabled
Disabled
IM/SM1000 Issue 12 61
Page 64

Videographic Recorder
SM1000 4 Configuration
The instrument can be configured to sample all recording channels in the group simultaneously and store the data in internal memory
and external archive media (if archiving is enabled) at two rates, Primary and Secondary.
The Primary sample rate is active during normal process operating conditions and is set typically to a relatively slow rate (depending
upon process recording requirements) in order to maximize internal memory and external archive media capacity.
The instrument can be configured to switch to a faster, Secondary sample rate when a selected digital source becomes active in
order to record the maximum amount of detail for the period in which that source is active, or may be switched manually – see
Section 3.4, page 32.
Set the Primary sample rate to between 0.1 seconds and 720
1
minutes (12 hours). The table below compares example sample
rates with the equivalent chart speeds of a traditional chart
recorder together with the storage capacity of internal memory.
Refer to Appendix C, page 116 for full details of internal memory
and external archive media storage capacity.
Sample Rate
1 second 720mm/h 22.7 hours
3 seconds 240mm/h 2.8 days
6 seconds 120mm/h 5.7 days
12 seconds 60mm/h 11.5 days
36 seconds 20mm/h 1.1 months
72 seconds 10mm/h 2.3 months
Equivalent Chart
Speed
On-board Storage
Time (6 Channels)
Note.
Sample rates are set using one of the following
combinations of units:
– Minutes or minutes and seconds
– Seconds
– Tenths of seconds (minutes and seconds must first
be set to zero).
The rate at which data is displayed in the Chart Views is
set separately – see 'Screen interval' in Section 4.5.2,
page 65.
The fastest sample rate setting determines the maximum
screen interval that can be selected – see Table 2.1 on
page 12.
Set the Secondary sample rate to between 0.1 seconds and
1
720 minutes (12 hours).
Select a signal source to enable switching between the primary
1
and secondary sample rates. Refer to Appendix A, page 104 for
a description of the available sources.
Note. This signal is edge-triggered. A rising edge (inactive to
active) switches to the secondary sampling rate. A falling edge
(active to inactive) switches to the primary sampling rate.
Secondary
Primary
•1 If this parameter is changed, internally recorded data files are recreated and unarchived data is lost.
62 IM/SM1000 Issue 12
Page 65

Videographic Recorder
SM1000 4 Configuration
4.5.2 Configuring the Chart View
Major Chart Divisions
Scale Bar
Chart Trace
Minor Chart Divisions
Time Stamp
Operator Message
Annotation
Alarm Event
Annotation
Screen Interval
Chart Divisions
Vertical Chart
Screen Interval
Horizontal --> Chart Horizontal <-- Chart
IM/SM1000 Issue 12 63
Page 66

Videographic Recorder
SM1000 4 Configuration
Select Horizontal --> (Chart runs left to right with scale bar on
left), Horizontal <--(chart runs right to left with scale bar on right),
or Vertical chart view.
Select the annotations to be displayed on the chart. Alarm
events and operator messages are displayed on the chart
adjacent to the point at which the alarm occurred – see
Section 2.3, page 7.
This initial setting can be changed by the operator if 'Chart
annotation select enable' is enabled in the Chart view menu
enables – see 'Menu Enables' on page 65.
Select the number of major and minor chart divisions to be
displayed on the chart and its scale bar.
Select the number of major vertical divisions to be displayed.
Select the number of minor vertical divisions to appear between
the major chart divisions.
64 IM/SM1000 Issue 12
Page 67

Videographic Recorder
SM1000 4 Configuration
Enable trace pointers to display a chart scale bar with pointers
to indicate the instantaneous trace positions.
Disable trace pointers to display the standard chart scale bar.
Select the amount of historical data to be displayed on the
screen. Available selections are limited by the sample rate
selected – see Section 4.5.1, page 61 and Table 2.1 on page
12.
Select the required trace width in pixels.
Select the menu items to be accessible from the Chart View.
Message select enable
Enables the operator to activate one of 24 pre-configured
messages or a user-defined message.
Alarm acknowledge enable
Enables the Operator to acknowledge any alarms associated
with the current group.
Scale select enable
Enables the operator to display the scale for one enabled
channel, or all channels in turn, on the scale bar at the top of the
screen.
Trace select enable
Enables individual chart traces to be displayed or hidden.
Screen interval select enable
Enables the Operator to change the amount of data displayed
on the screen at one time.
Historical review enable
Enables the Operator to scroll back through data recorded
previously that is no longer visible on screen.
Chart annotation select enable
Enables the display of Alarm events and Operator messages on
the chart to be enabled or disabled by the operator.
Note. Menu items that are not enabled are greyed-out in the
relevant Chart View menu.
IM/SM1000 Issue 12 65
Page 68

Videographic Recorder
SM1000 4 Configuration
4.5.3 Configuring the Bargraph View
Alarm Trip Level
(not shown for slow and
fast rate alarms)
Maximum Value
(solid color)
Instantaneous Value
Minimum Value
(white fill)
Analog Channels
Identical Maximum
and Minimum
Engineering High Value
Engineering Middle Value
Engineering Low Value
Digital
Channel
Values
Minimum below
engineering limit,
maximum above
engineering limit
Select the Bargraph views to be displayed in the current
Process Group.
Select the markers (channel-colored max./min. indicators and
alarm trip points) to be displayed on the bargraph.
Select the menu items to be accessible from the Bargraph
views.
Message select enable
Enables the operator to activate one of 24 pre-configured
messages or a user-defined message.
Alarm acknowledge enable
Enables the Operator to acknowledge any alarms associated
with the current group.
Max/min reset enable
Enables the operator to reset the maximum and minimum
values of one or more channels to the current value.
Note. Menu items that are not enabled are greyed-out in the
Bargraph menu.
66 IM/SM1000 Issue 12
Page 69

Videographic Recorder
SM1000 4 Configuration
4.5.4 Configuring the Process View
Note. The Process view is available only if the Totalizer option is enabled.
Alarms View Totalizer Enabled
Totalizer Tag Name
Totalizer Value
Statistics View Totalizer Enabled
Alarm Tag
Alarm Trip Level
Alarm Acknowledged
Channel Long Tag Name
Max
Values since last Totalizer Reset or Totalizer wrap.
Updated only if the Totalizer is Enabled and Running.
Alarms View or Statistics View Totalizer not Enabled
Alarms View Alarms A and B not Enabled
Min
Average
Set to 'On' to enable the operator to display the Process view.
Select the Totalizer view to be displayed – Alarms or Statistics.
This setting can be changed by the Operator if 'View select
enable' is ticked below.
Select the menu items to be accessible from the Process view.
Message select enable
Enables the operator to activate one of 24 pre-configured
messages or a user-defined message.
Alarm acknowledge enable
Enables the Operator to acknowledge any alarms associated
with the current group.
Totalizer reset enable
Enables the Operator to reset the totalizers on any or all
channels.
Totalizer stop/go enable
Enables the Operator to stop and start totalizers on any or all
channels.
View select enable
Enables the Operator to select the Alarms and Statistics views.
Note. Menu items that are not enabled are greyed-out in the
Process view menu.
IM/SM1000 Issue 12 67
Page 70

Videographic Recorder
SM1000 4 Configuration
4.5.5 Configuring the Digital Indicator View
Short Channel Tag
Current Value
Alarm Status
Units
Channel Units
Totalizer Units
Totalizer Value
See Note below
Note. Displayed only if the Totalizer option is enabled and is enabled for that channel (see Section 4.6.5, page 84) and for
display (see next page).
68 IM/SM1000 Issue 12
Page 71

Videographic Recorder
SM1000 4 Configuration
Set to 'On' to enable the operator to display the Digital Indicator
view.
Note. This parameter is displayed only if the Totalizer option is
enabled.
Set to 'On' to add the channel totalizer value and units to the
indicator displays (if the totalizer for that channel is enabled –
see Section 4.6.5, page 84).
Select the menu items to be accessible from the Digital Indicator
view.
Message select enable
Enables the Operator to activate one of 24 pre-configured
messages or a user-defined message.
Alarm acknowledge enable
Enables the Operator to acknowledge any alarms associated
with the current group.
Totalizer reset enable
Enables the Operator to reset the totalizer value to the preset
totalizer value on any or all channels.
Totalizer stop/go enable
Enables the Operator to start and stop the totalizer.
Channel select enable
Enables the Operator to display or hide individual channels.
Note.
Menu items that are not enabled are greyed-out in the
Digital Indicator View menu.
Totalizer menu items can be enabled only if the Totalizer
option is enabled.
IM/SM1000 Issue 12 69
Page 72

Videographic Recorder
SM1000 4 Configuration
4.5.6 Archiving
Introduction
Recorded data, logs and configuration files stored in the instrument's internal memory can be archived to files created in removable
media in either text or binary encoded format. Parameters for archiving Process Group 1 are set up independently from Process
Group 2 parameters.
For a full description of archiving and archive file formats, refer to Sections 3.5 to 3.10.
Sample Rates – Fig. 4.10
Data is saved to the archive file at the same rate as it is saved to internal memory, i.e. at either the Group's primary or secondary
recording sample rate.
Primary
rate
Secondary
rate
Group Sample
Rate
Fig. 4.10 Archiving Sample Rates
Internal Memory
1.1
1.2
1.3
1.4
1.5
1.6
Recording
Channels
Archive Media
Archive
Channel
Data
Archive rate is always same as channel sample rate.
Archive channel data is a direct copy of channel data
on internal memory
Select the archive file format required – Text format or Binary
format.
Note. The selected archive file format is applied automatically
to
both process groups. It is not possible to set each group to
different formats.
Select the data types that are to be archived to the storage
media: Channel Data; Alarm Event log; Totalizer log; Audit log.
Note. The totalizer log file can be enabled only if the totalizer
option is enabled.
File Type Contents Extension
Channel
data files
Alarm
event log
files
Totalizer
log files
Audit log
files
Analog or digital recording channel signals
in the current process group
The historical record of the alarm events
related to the group's channels plus the
history of any operator messages,
electronic signatures or real time alarms.
The historical record of all totalizer and
associated statistical values relating to the
group's recording channels.
The historical entries in the audit log.
*.D00 (Text)
*.B00 (Binary)
*.E00 (Text)
*.EE0 (Binary)
*.T00 (Text)
*.TE0 (Binary)
*.A00 (Text)
*.AE0 (Binary)
or
or
or
or
70 IM/SM1000 Issue 12
Page 73

Videographic Recorder
SM1000 4 Configuration
Note. Displayed only if 'Archive file format' (previous page) is
set to 'Text format'.
Enter the filename (max. 20 characters) to be used to identify
the channel data archive files.
Note. The following characters cannot be used in the filename
tag: \, /, :, *, ?, ", <, >, |, superscript characters, ~, Ω and º.
These are greyed-out on the keyboard.
Note. Displayed only if 'Archive file format' (previous page) is
set to 'Text format'.
Set the frequency with which new channel data files are created.
Note. Set automatically to 'Off' if 'Wrap' (see below) is set to
'On'.
New File Interval Filename
Hourly <hour> <day, month, year>* <filename tag>
Daily <day, month, year>* <filename tag>
Monthly <month, year>* <filename tag>
None <filename tag>
*Formatted according to the date format set in Common Configuration
– see Section 4.4.3, page 54.
Archive Triggers <1 Day Old (Binary) or <1 Hour Old (Text) >1 Day Old (Binary) or >1 Hour Old (Text)
'Online' request from the Set up
menu.
When set to 'On', archive wrap deletes the oldest archived data
file from external archive media automatically when the media
approaches its maximum capacity.
When set to 'Off', archiving stops automatically when external
archive media is full. No files are deleted.
Oldest Un-archived Data
Any un-archived data is stored automatically to the
removable archive media.
All the un-archived data within the selected time
frame is archived. Older un-archived data remains
in the internal memory buffer until overwritten by
newer data but is not available for archiving to
removable media.
Automatic update Any un-archived data is saved to removable
archive media at regular intervals (approximately
every 30 seconds).
Not Applicable
Table 4.1 Archive Triggers
IM/SM1000 Issue 12 71
Page 74

Videographic Recorder
SM1000 4 Configuration
4.6 Channel Configuration
Process Group 1,
Channels 1.1 to 1.6
Fig. 4.11 Recording Channel Configuration
4.6.1 Recording Channel Setup
A No Source
B Analog Source
C Digital Source
Select the signal source for the selected channel. This can be
1
any external analog or digital signal – see Appendix A, page 104
for full list.
Note.
The input source for Channel 1 in any process group
1
be an analog input to ensure correct operation of the
recorder.
The tabs change according to the selection made.
Setting a channel source to 'None' does not switch off the
analog input to which the channel was assigned
1
previously i.e. the analog input continues to be monitored.
To switch off an analog input, set Analog I/P 'Type' for the
required channel to 'Off' – see Section 4.6.2, page 74.
must
•1 If this parameter is changed from any previous setting other than 'None', a new internal data file for this recording channel is
created. All historical data stored internally for this channel is lost. If this parameter is changed from a previous setting of 'None'
new internal data files for all enabled recording channels are created. Any unarchived data is lost.
72 IM/SM1000 Issue 12
Page 75

Videographic Recorder
SM1000 4 Configuration
Each recording channel can be configured to position its trace in
a specific zone in the chart views in order to separate traces that
would otherwise be very close to each other.
Note. The trace colors cannot be changed. The trace colors
are:
1st 2nd 3rd 4th 5th 6th
Magenta Red Black Green Blue Brown
Select one of the 15 pre-defined zones available.
Raw
Input
Value
100
Sample Interval
0
12:00:00
(Previous
Sample)
Maximum Value over sample interval
Instantaneous Value at time of sample
Average Value over sample interval
Minimum Value over sample interval
t
12:00:01
(Current
Sample)
Select the filter to be applied to the electrical input prior to
1
sampling.
Note.
Applicable to analog sources only.
Filters are applied to the recorded values shown on the
chart view only, not to instantaneous values displayed on
the channel indicators or bargraphs.
Instantaneous – A single value based on process conditions
at the time of sampling.
Average – The average value of the analog signal since
the previous sample.
Minimum – The minimum value of the analog signal
since the previous sample.
Maximum – The maximum value of the analog signal
since the previous sample.
Max & min – Two values are recorded to capture the
maximum & minimum signal values since the
previous sample. This allows the memory
use to be extended by permitting a slower
sample rate to be selected without losing the
transient behavior of the signal.
•1 If this parameter is changed, internally recorded data files are recreated and unarchived data is lost.
IM/SM1000 Issue 12 73
Page 76

Videographic Recorder
SM1000 4 Configuration
4.6.2 Analog Input Configuration
Note.
The 'Analog I/P' tab is displayed only if 'Source ID' for the Recording Channel is set to an analog signal source – see
Section 4.6.1, page 72.
If an analog input is assigned to more than one recording channel, changes to any of its parameters and tags are applied to
each channel the input is assigned to.
If an analog input is already assigned to another channel, the edit keys ( ) are not available.
Select the electrical characteristics of the input.
1
Note.
Simulated input types are available for evaluating
instrument features without the need for process
connections.
If 'Volt free digital input' is selected, the input channel
becomes a digital input channel – see Section 4.6.3,
page 77.
Select 'Off' to disable an analog input.
Warning.
Ensure that the appropriate electrical connections have
been made – see Section 5.4, page 100.
When 'Type' is set to 'Volts', input signals with voltages
greater than 2V (standard inputs) or 1V (high specification
inputs)
must be connected through an external voltage
divider (part no. GR2000/0375) – see Section 5.4.1,
page 100.
Input signals with voltages up to 2V (2000mV – standard
inputs) or 1V (1000mV – high specification inputs) may be
measured without the need for the voltage divider by
setting 'Type' to 'millivolts'.
An external 10Ω shunt resistor is required for current
ranges – see Section 5.4.1, page 100.
•1 If this parameter is changed to or from 'Volt free digital input', internally recorded data files are recreated and unarchived data is
lost.
74 IM/SM1000 Issue 12
Page 77

Videographic Recorder
SM1000 4 Configuration
Select the linearizer type and the units used to condition the
input signal before it is sampled.
Note.
For thermocouple applications using an external fixed cold
junction, set 'Type' to 'millivolts' and select the
appropriate linearizer type.
Linearizer units are displayed only if a temperature
linearizer type (Thermocouple or RTD) is selected.
Set the required electrical range.
Note.
Applicable only to mA, mV, V and Resistance input types.
When an input is connected through an external voltage
divider (see
Warnings on page 74), set the electrical range
low and high values to the actual voltage applied to the
divider, not the voltage after it has been divided down. The
range of the electrical input signal is determined by the
input type – see Table 4.2:
Input Standard Inputs High Specification Inputs
Ty pe mV V mA Ω mV V mA Ω
Min. 0 0 0 0 –1000 –50 –100 0
Max. 2000 20 50 5000 1000 50 100 2000
Table 4.2 Limits of Electrical Ranges
IM/SM1000 Issue 12 75
Page 78

Videographic Recorder
SM1000 4 Configuration
Specify the display range and units of the engineering value
1
corresponding to the electrical high and low values, within the
limits defined in Table 4.3:
THC/RTD °C °F
Ty pe Min. Max. Min. Max.
Ty p e B –18 1800 0 3270
Typ e E –100 900 –140 1650
Typ e J –100 900 –140 1650
Typ e K –100 1300 –140 2350
Type L –100 900 –140 1650
Typ e N –200 1300 –325 2350
Type R & S –18 1700 0 3090
Ty p e T –250 300 –400 570
Pt100 –200 600 –325 1100
Power 5/2
Power 3/2
Square Root
Custom Linearizer 1
Custom Linearizer 2
Linear
–999 to +9999
Table 4.3 Limits of Engineering Ranges
Example – for an electrical input range of 4.0 to 20.0mA,
representing a pressure range of 50 to 250 bar, set the 'Low'
value to 50.0 and the 'High' value to 250.0.
Enter the tag name to be displayed on channel indicators and
1
used to identify the channel in archive files (8 characters max.).
Note. Tags with a high percentage of capital letters and wide
characters such as 'W' or 'M' may appear truncated in some
Operator Views. In such cases, use lower case letters or fewer
characters.
Enter the tag name to be displayed in the Process view and
1
used in the archive files (20 characters max.).
•1 If this parameter is changed, internally recorded data files are recreated and unarchived data is lost.
76 IM/SM1000 Issue 12
Page 79

Videographic Recorder
SM1000 4 Configuration
Set the time period over which the process variable is to be
filtered prior to being sampled (0 to 60 seconds).
Set a tolerance level (between 0 and 100% of the engineering
range) to allow for deviation of the input signal above or below
the input span before an input failure is detected.
Example – setting the fault detection level to 10% on an input
range of 50 to 250 bar causes an 'Analog Input Failure' fault to
be detected below 30 bar and above 270 bar.
In the event of an input failure, recorder channels can be set to
drive upscale, downscale or in the direction of failure.
Upscale – channel value driven beyond full scale.
None – driven in direction of failure.
Downscale – channel value driven below zero.
4.6.3 Digital Input Configuration
Note. The 'Digital I/P' tab is displayed only if 'Source ID' for the Recording Channel is set to a digital signal source – see
Section 4.6.1, page 72.
Note. This parameter is displayed only if 'Input type' on the
1
'Analog I/P' tab is set to 'Volt free digital input'. If this parameter
is changed to anything other than 'Volt free digital input', the
input channel reverts to an analog input channel – see
Section 4.6.2, page 74.
Enter the tag to be displayed on channel indicators when the
1
digital signal is active (6 characters max.).
Note. Tags with a high percentage of capital letters and wide
characters such as 'W' or 'M' may appear truncated in some
Operator views. In such cases, use lower case letters or fewer
characters.
Enter the tag to be displayed on channel indicators when the
1
digital signal is inactive (6 characters max.).
Enter the tag name to be displayed on channel indicators and
used to identify the channel in archive files (8 characters max.).
Note. Tags with a high percentage of capital letters and wide
characters such as 'W' or 'M' may appear truncated in some
Operator views. In such cases, use lower case letters or fewer
characters.
Enter the tag name to be displayed in the Process view and
used in the archive files (20 characters max.).
•1 If this parameter is changed, internally recorded data files are recreated and unarchived data is lost.
IM/SM1000 Issue 12 77
Page 80

Videographic Recorder
SM1000 4 Configuration
4.6.4 Alarm Configuration
Trip Point
Process
Variable
Alarm On
Alarm Off
Fig. 4.12 High/Low Process Alarms
Trip Point
Process
Variable
Hysteresis
High Process
Hysteresis
Alarm On
High Latch Alarm Action
Hysteresis
Low Process
Alarm Latched
Alarm On
Alarm Off
Alarm Off
Alarm acknowledged
by operator
Process
Variable
Trip Point
Fig. 4.13 High/Low Latch Alarms
Hysteresis
Alarm On
Low Latch Alarm Action
Alarm Latched
Alarm Off
Alarm acknowledged
by operator
78 IM/SM1000 Issue 12
Page 81

Videographic Recorder
SM1000 4 Configuration
Process
Trip Point
Hysteresis
Process
Variable
Alarm On
Variable
Hysteresis
Trip Point
Alarm On
Alarm acknowledged
by operator
High Annunciate Alarm Action Low Annunciate Alarm Action
Fig. 4.14 High/Low Annunciate Alarms
Deviation exceeded
fast rate alarm
becomes active,
slow rate alarm becomes
inactive, new period starts.
Deviation below limit
at end of time period
slow rate alarm becomes
active, new period starts.
Deviation
Deviation
Fast Rate Alarm
Alarm On
Alarm Off
Slow Rate Alarm
Alarm On
Alarm Off
Period
Alarm Off
Deviation below limit
at end of time period
fast rate alarm
becomes inactive,
slow rate alarm
becomes active.
Deviation exceeded
fast rate alarm becomes
active, slow rate alarm
becomes inactive,
new period starts.
Alarm Off
Alarm acknowledged
by operator
Deviation below
limit at end of time
period alarm
becomes inactive.
Fig. 4.15 Fast-/Slow-Rate Alarms
IM/SM1000 Issue 12 79
Page 82

Videographic Recorder
SM1000 4 Configuration
Process variable goes
above trip point but
alarm is not activated
because enable signal
is low (Alarm Disable).
Process
Variable
Alarm Enable signal is
switched On. Alarm delay
timer is started.
Process variable goes
above trip point but
alarm is not activated
because alarm delay
time has not expired.
Delay Time
Alarm delay timer expires,
alarm is now enabled.
Alarm is activated
because process variable
is above trip point.
Process variable goes
below trip (hysteresis)
point therefore alarm
is de-activated.
Process variable goes
above trip point, alarm is
activated (alarm is
enabled and delay time
has expired).
Trip Point
Hysteresis
Alarm Enabled
Alarm Disabled
Alarm On
Alarm Off
Alarm Enable signal is
switched Off. Alarm is
disabled immediately.
Alarm de-activates.
Fig. 4.16 Delayed High/Low Process Alarms
80 IM/SM1000 Issue 12
Page 83

Videographic Recorder
SM1000 4 Configuration
Note. The Alarm Configuration tabs are displayed only if 'Source ID' for the Recording Channel is set to an analog signal source
– see Section 4.6.1, page 72.
Set the alarm type:
High/Low process – see Fig. 4.12, page 78
High/Low latch – see Fig. 4.13, page 78
High/Low annunciate – see Fig. 4.14, page 79
Fast/Slow rate – see Fig. 4.15, page 79
Delayed high/low process – see Fig. 4.16, page 80
Enter an Alarm Tag to identify the alarm when it is displayed in
the Chart, Process and Alarm Event views (20 characters max.).
Note. Process and Latch alarms only – see Figs 4.12 and 4.13.
Set the value, in engineering units, at which the alarm is to
activate.
Set the hysteresis value in engineering units and the time
hysteresis in seconds.
Process Variable
Hysteresis
Trip Point
Hysteresis
Alarm On
High Trip
Low Trip
Alarm Off
Alarm On
Alarm Off
When an alarm trip value is exceeded, the alarm does not
become active until the time hysteresis value has expired. If the
signal goes out of the alarm condition before the time hysteresis
has expired, the hysteresis value is reset.
Note. Annunciate alarms only – see Fig. 4.14.
Set the value, in engineering units, at which the alarm is to
activate.
Set the time hysteresis in seconds.
IM/SM1000 Issue 12 81
Page 84

Videographic Recorder
SM1000 4 Configuration
Note. Delayed process alarms only – see Fig. 4.16.
Set the value, in engineering units, at which the alarm is to
activate.
Set the hysteresis value in engineering units and the delay time
in seconds.
Output
40 00
Time in seconds (s)
Timer
Started
Timer
Reset
Timer
Started
70 130
Hysteresis
Time
Elapsed
Alarm
Trip Point
Alarm On
Alarm Off
Timer
Reset
The delay time is the period of time for which alarm activation is
delayed after the enable signal is switched on. Once the delay
time has expired, the alarm operates in the same way as a
standard High/Low process alarm.
Note.
Rate alarms only – see Fig. 4.14.
A Rate alarm remains active until the rate has been within
limits for at least one complete Alarm Period.
Set the minimum or maximum amount of deviation allowed
within the Rate Alarm Period before the alarm is activated.
Set the time period over which the deviation is measured. For
High Rate alarms, the alarm becomes active if the value
changes by more than the deviation value within the alarm
period. For Low Rate alarms, the alarm becomes active if the
channel value changes by less than the deviation within the
alarm period.
Set the filter time to be used to reduce the number of spurious
alarm trips. The source signal is averaged over the filter period
prior to the rate alarm being determined.
82 IM/SM1000 Issue 12
Page 85

Videographic Recorder
SM1000 4 Configuration
Select an alarm Enable source. When the 'Enable source' is
active, the alarm is enabled. When the source is inactive the
alarm is disabled. If set to 'None' the alarm is always enabled.
Note. For Delayed Process alarm operation, see Fig. 4.16,
page 80.
Set to 'On' to record all changes in the alarm state in the Alarm
event log – see Section 2.7, page 23.
Assign the alarm to one or more of 12 groups.
The alarm states assigned to each group are 'ORed' together to
create an internal digital signal that may be assigned to relays,
digital outputs or internal digital controls.
IM/SM1000 Issue 12 83
Page 86

Videographic Recorder
SM1000 4 Configuration
4.6.5 Totalizer Configuration
Note.
The totalizer tab is displayed only if the Totalizer option is enabled.
Current totalizer values are displayed in the Digital Indicator and Process Views – see Sections 2.5 and 2.6 (Operation),
and Sections 4.5.5 and 4.5.4 (Configuration) respectively.
For analog sources, the total value of a signal is calculated by counting pulses produced at a rate proportional to the input.
For digital sources, off/on transitions are counted to produce a batch total.
Select the totalizer Count direction and Wrap action.
When the count direction is set to 'Up', the totalizer counts up
from the 'Preset count' value to the 'Predetermined count' value
– see next page.
If 'Wrap enable' is set to 'On', the total is reset automatically to
the 'Preset count' value once the 'Predetermined count' value is
reached.
If 'Wrap enable' is set to 'Off', the count stops when the
'Predetermined count' value is reached.
Note. A wrap pulse, with a duration of 2s, occurs if the total
reaches the 'Predetermined count' value and 'Wrap enable' is
set to 'On'. If 'Wrap enable' is set to 'Off', the wrap pulse
becomes active when the 'Predetermined count' value is
reached and remains active until the totalizer is reset. The pulse
can be assigned to a relay, digital output or digital counter.
Enter the totalizer tag to be displayed in the Process view and
the Totalizer log (20 characters max).
Enter the totalizer units to be displayed in Operator views.
Select the totalizer action following a power failure:
Stop/Go recovery
Last – On power recovery, the totalizer continues in the
same state as before the failure, i.e. stopped or
running.
Stop – Totalizer stops counting.
Go – Totalizer starts counting from the last recorded value.
Stop/Go source
Select a signal source to stop and start the totalizer. Refer to
Appendix A, page 104 for a description of the available sources.
Note. This signal is edge-triggered. A rising edge (inactive to
active) starts the totalizer. A falling edge (active to inactive) stops
the totalizer.
Start
Stop
84 IM/SM1000 Issue 12
Page 87

Videographic Recorder
SM1000 4 Configuration
Set the 'Preset count' value – the value the totalizer counts from
and the value applied when the totalizer is reset.
Set the 'Predetermined count' value – the value at which the
totalizer stops or wraps.
Note. A counter configured to count up must have a 'Preset
count' value lower than the 'Predetermined count' value. A
counter configured to count down must have a 'Preset count'
value greater than the 'Predetermined count' value.
Set the required number of decimal places on the higher of the
'Preset count' value or 'Predetermined count' value.
Set the 'Intermediate count' value – the value at which a digital
source is activated. This can be used as an alarm threshold to
indicate when the 'Predetermined count' value is about to be
reached.
Select a 'Reset source' signal (see Appendix A, page 104) – an
edge-triggered signal to reset the totalizer on a rising edge.
Select the frequency with which totalizer values are added to the
Totalizer log.
Select a 'Log update source' signal (see Appendix A, page 104)
– an edge-triggered signal to trigger the addition of the current
totalizer values to the Totalizer log on a rising edge.
Log update time Log updated every...
5 minutes 0, 5, 10, 15... etc. minutes past the hour
10 minutes 0, 10, 20, 30,...etc. minutes past the hour
15 minutes 0, 15, 30, 45 minutes past the hour
20 minutes 0, 20, 40 minutes past the hour
30 minutes 0, 30 minutes past the hour
60 minutes On the hour
2 hours Midnight, 2am, 4am, etc.
3 hours Midnight, 3am, 6am, etc.
4 hours Midnight, 4am, 8am, etc.
8 hours Midnight, 8am, 4pm, etc.
12 hours Midnight, 12am
24 hours Midnight
IM/SM1000 Issue 12 85
Page 88

Videographic Recorder
SM1000 4 Configuration
Set the required totalizer count rate and cut off value.
The count rate is determined by the maximum number of
engineering units (or pulses) per second and the smallest
Analog Input Sources only – see Section 4.6.1, page 72.
totalizer increment:
engineering full scale value (rate)
-------------------------------------------------------------------------engineering units (in seconds)
Example – to totalize a flow with a maximum rate of 2500 liters/
3
minute (= 2.5m
/minute) to the nearest 0.1m3, the calculation is
as follows:
3
/hour
150m
--------------------------------- 0 . 04 1 6 7 p u l s e s / s e co n d=
3600 seconds
The resulting value must be within the range 0.00001 to
99.99999. The totalizer increment is determined by the number
of decimal places in the 'Predetermined count' value – see page
85.
The totalizer cut off value is the lowest input value (in engineering
units) at which the totalizer is to stop counting.
Input Signal
150
m3/hr
m
3
/sec
0.04167
Units
2000
75
0
The totalizer pulse rate is
proportional to the input signal.
At this point it is
0.0208 pulses per second
0.0208
1hr
Area = total
volume of flow
t
0
Totalizer Value
OR
Digital Input Sources only – see Section 4.6.1, page 72
Input Signal
On
t
Off
1minute
0
Totalizer Value
1000
1hr
Units
500
400
300
200
100
1minute
t
Set the required totalizer count rate.
A digital totalizer pulse can be scaled to represent a value of
between 0.00001 and 1000.00000. The totalizer is then
incremented by this amount each time there is an off/on
transition.
Example – a count of 5 digital pulses with 'Count rate' set to
100 increments the totalizer from 0 to 500 in 100 unit steps.
t
86 IM/SM1000 Issue 12
Page 89

Videographic Recorder
SM1000 4 Configuration
4.7 Functions
Fig. 4.17 Functions Configuration
4.7.1 Custom Linearizers
Use the and keys to highlight the linearizer to be
adjusted.
Press the key to open the 'Adjust custom linearizer' screen.
Use the , , and keys to highlight the point to
be modified.
Press the key to open the digipad to change the position of
that point.
Press the key to return to the Functions screen.
Each linearizer has 20 breakpoints. Both X and Y values are set
as percentages.
Custom linearizers can be applied to any analog input by
selecting them as the linearizer type for that input – see
Section 4.6.2, page 74.
Note.
X is input to the linearizer expressed as a percentage of the
electrical range.
Y is output expressed as a percentage of the engineering range.
IM/SM1000 Issue 12 87
Page 90

Videographic Recorder
SM1000 4 Configuration
4.7.2 Real-time Alarms
Enter the tag to be used in the Alarm Event log – see
Section 2.7, page 23.
Set the day(s) on which the alarm is activated.
Set to 'On' to activate the real-time alarm on the first day of
each month.
Set the time at which the alarm becomes active.
If 'Every hour' is set to 'On', the 'Hours' setting cannot be
adjusted and the alarm is activated at the same time every hour
(determined by the 'Minutes' setting) or on the hour (if 'Minutes'
is set to 'Off').
Set the duration for the alarm to remain active.
Set to 'On' to add an entry to the Alarm event log each time the
real-time alarm becomes active.
88 IM/SM1000 Issue 12
Page 91

Videographic Recorder
SM1000 4 Configuration
4.8 I/O Module Configuration
Fig. 4.18 I/O Module Configuration
Note. The instrument detects the type of module fitted in each position automatically.
4.8.1 Analog Inputs
Set the mains rejection frequency used to electrical noise
induced on the signal lines by power supply cables.
Input Adjustment
Manually fine-tune inputs to remove process offset errors or
system scale errors.
Note.
Input adjustment frames appear only if recording is
enabled during configuration, i.e. the 'Disable recording in
configuration' check box is
not ticked on entry to the
Configuration level – see Fig. 4.1, page 46.
Changes to the Analog Input Type (see Section 4.6.2,
page 74) must be saved to the current configuration
before commencing input adjustment.
Actual value / Desired value
1. Adjust the process or simulated input signal to a known
value below 50% of the engineering range.
2. If 'Actual value' (in engineering units) is different from
expected, set 'Desired value' to the correct value ('Offset
adjust' and 'Span adjust' values are calculated
automatically).
3. Repeat steps 1 and 2 for a value above 50% of the
engineering range.
4. Repeat steps 1 to 3 for each input.
Reset adjustment
Select to reset 'Offset adjust' and 'Span adjust' (see next page)
to zero and to 1 respectively.
IM/SM1000 Issue 12 89
Page 92

Videographic Recorder
SM1000 4 Configuration
Offset adjust / Span adjust
Manually fine-tune the offset adjust and span adjust values to
remove process errors. These are calculated values applied to
the raw input signal.
Note. If simulating thermocouple inputs, connect the millivolt
source using appropriate compensating cable – see
Section 5.4.2, page 100. For 2-lead resistance thermometers,
either connect the resistance box at the sensor end of the leads
or add the lead resistance to the calibration values.
4.8.2 Relay Modules
High
Engineering
High
Adjusted
Value
Engineering
Low
Offset Adjust (>0)
Unadjusted Value
Engineering
Low
With Adjustment
(typical example)
Span Adjust (<1)
Engineering
High
Engineering
High
Adjusted
Value
Engineering
Low
(Span Adjust = 1, Offset Adjust = 0)
Unadjusted Value
Engineering
Low
Without Adjustment
Engineering
Select the relay source (a digital source) to be used to energize/
de-energize the relay.
Note. If the relay is used to provide a totalizer count pulse, the
maximum pulse frequency is 5Hz. Consideration must also be
given to the mechanical life of the relay.
Select the relay source polarity.
Note. When polarity is set to 'Positive', the relay is energized
when the digital source is active (On).
4.8.3 Ethernet Modules
Refer to the Ethernet Communications Option User Guide Supplement (IM/SMENET) for information on how to install, configure and
use the instrument on an Ethernet network and for information on configuring and using the e-mail facility.
90 IM/SM1000 Issue 12
Page 93

Videographic Recorder
SM1000 4 Configuration
4.8.4 RS485 (Modbus™) Communications
Refer to Appendix B, page 106 for further information on using the optional Modbus link.
Select the Modbus protocol required.
Modbus – instrument acts as a Modbus Slave
Modbus Master – instrument acts as a Modbus Master
Set according to the number of transmission wires connected to
the instrument: 4-wire, 2-wire.
Set to the Baud rate used by the host system: 1200, 2400,
4800, 9600, 19200, 38400, 115200.
Set to the Parity used by the host system: None, Odd, Even.
Note. Displayed only if 'Protocol' is set to 'Modbus'.
Set a unique Modbus Address that allows the host system to
identify the instrument on a Modbus link.
Note. Maximum 31 slaves per loop.
Note. Displayed only if 'Protocol' is set to 'Modbus Master'.
Set the poll rate in milliseconds – min. 0, max. 3600000.
Note. Displayed only if 'Protocol' is set to 'Modbus Master'.
Set the number of successive polls permitted to fail before the
data is marked as a failed input – min. 0, max. 4.
Note. Displayed only if 'Protocol' is set to 'Modbus Master'.
Set the timeout time in milliseconds for a single poll – min. 0,
max. 60000.
Note. If any RTU devices are polled, set a response time that is
long enough to allow for the normal turn around time from these
devices. The configuration allows for only one setting for all
devices connected to the network.
IM/SM1000 Issue 12 91
Page 94

Videographic Recorder
SM1000 4 Configuration
4.8.5 Comms Analog Input
Note. This tab is displayed only if 'Protocol' is set to 'Modbus Master' – see Section 4.8.4, page 91.
Select the comms analog input to hold the data from the
nominated slave device.
Enter the RTU address assigned to the remote unit (1 to 247).
Note. Displayed only if 'RTU Address'
is not set to 'None'.
Enter the register number to be read in the slave device.
Note. Displayed only if 'RTU Address'
is not set to 'None'.
Select the register type, 'Holding Register' or 'Input Register'.
Note. Displayed only if 'RTU Address'
is not set to 'None'.
Select the format of the data to be read from the slave device:
Sint16 – signed, 16 bit integer
Sint32 – signed, 32 bit integer, transmitted in high/low
order
rev. Sint32 – signed, 32 bit integer, transmitted in low/high
order
IEEE – 32 bit floating point number, transmitted in
high/low order
Rev. IEEE – 32 bit floating point number, transmitted in
low/high order
Sint16 X 10 – signed, 16 bit integer, multiplied by a factor of
10
Sint16 X 100 – signed, 16 bit integer, multiplied by a factor of
100
Sint16 X 1000– signed, 16 bit integer, multiplied by a factor of
1000
92 IM/SM1000 Issue 12
Page 95

Videographic Recorder
SM1000 4 Configuration
4.8.6 Comms Digital Input
Note. This tab is displayed only if 'Protocol' is set to 'Modbus Master' – see Section 4.8.4, page 91.
Select the comms digital input to hold the data from the
nominated slave device.
Enter the RTU address assigned to the remote unit (1 to 247).
Note. Displayed only if 'RTU Address'
is not set to 'None'.
Enter the register number to be read or written to in the slave
device.
Note. Displayed only if 'RTU Address'
is not set to 'None'.
Select the register type, 'Input Status' or 'Coil Status'.
IM/SM1000 Issue 12 93
Page 96

Videographic Recorder
SM1000 4 Configuration
4.8.7 Hybrid Modules
Select a digital output source.
Note.
A digital output source is the internal digital source used to
activate/de-activate a digital output.
If a digital output is used to provide a totalizer count pulse,
the maximum pulse frequency is 5Hz.
Select the digital output source polarity.
Note. When the polarity is set to 'Positive', the digital output is
energized when the digital source is active (On).
The six digital inputs from any hybrid module produce six
independent digital states that can be used as digital sources for
recording channels, relay outputs, alarm acknowledgement etc.,
e.g.:
Digital I/P H1, Digital I/P H2
Additionally, digital inputs from a hybrid module in position H
(see Fig. 5.5) can be used to produce up to 32 Binary Encoded
(BCD) digital states, e.g.:
BCD digital I/P H0 to BCD digital I/P H31
BCD digital inputs can be used as digital sources in the same
way as standard digital inputs.
Inputs H1, H2, H3, H4 and H5 have 'weightings' of 1, 2, 4, 8,
and 16 respectively. A rising edge on input H6 is used as the
update trigger.
Following an inactive to active transition on input H6, inputs H1
to H5 are evaluated, the weighted values of any active inputs are
added together and the BCD digital input corresponding to the
total is activated. All other BCD digital inputs are deactivated.
Example.
If digital inputs H1 (weighting = 1), H2 (weighting = 2) and H4
(weighting = 8) are active when digital input H6 (update trigger)
is activated, BCD digital input H11 (1 + 2 + 8) is activated. BCD
digital inputs H0 to H10 and BCD digital inputs H12 to H31 are
deactivated.
If digital inputs H1 to H5 are all inactive when digital input H6
(update trigger) is activated then BCD digital input H0 is
activated. BCD digital inputs H1 to H31 are deactivated.
94 IM/SM1000 Issue 12
Page 97

Videographic Recorder
SM1000 4 Configuration
Select the analog output source.
Note. The analog output source can be any internal or external
analog signal.
Set the required analog output engineering and electrical
ranges.
Note. The 'Engineering low' and 'Engineering high' settings are
the engineering values corresponding to the 'Electrical low' and
'Electrical high' values below.
The 'Electrical low' and 'Electrical high' values are the minimum
and maximum values of the current output, in Electrical units –
range 0 to 23mA.
Source Range High
Analog Output
Engineering High
Analog Output
Engineering Low
Source Range Low
21mA
0mA
Analog Output
Electrical High
Analog Output
Electrical Low
4.9 Modbus TCP
Note. Modbus TCP is available only if the optional ethernet module is fitted.
Modbus TCP enables Modbus devices to communicate via an ethernet network transferring Modbus messages via TCP/IP.
Communication with standard, serially connected, Modbus RTU devices is also possible through a Modbus TCP Gateway.
Refer to the Ethernet Communications Option User Guide Supplement (IM/SMENET) for information on how to install, configure and
use the instrument on an Ethernet network and for information on configuring and using the Modbus TCP facility.
Refer to Appendix B, page 106 for further information on using the Modbus link.
IM/SM1000 Issue 12 95
Page 98

Videographic Recorder
SM1000 5 Installation
5 Installation
EC Directive 89/336/EEC
In order to meet the requirements of EC Directive 89/336/
EEC for EMC regulations, this product must not be used in
a non-industrial environment.
End of Life Disposal
The instrument contains a small lithium battery which
should be removed and disposed of responsibly in
accordance with local environmental regulations.
The remainder of the instrument does not contain any
substance that will cause undue harm to the
environment and must be disposed of in accordance
with the Directive on Waste Electrical and Electronic
Equipment (WEEE). It must not be disposed of in
Municipal Waste Collection.
Cleaning
Clean only the front panel, using warm water and a mild
detergent.
5.1 Siting – Figs. 5.1 and 5.2
50°C
(122°F)
Max.
0°C
(32°F)
Min.
A Within Temperature Limits
0 to 95% RH
B Within Humidity Limits
IP66 / NEMA 4X front
IP40 rear (with extension)
IP20 rear (without extension)
C Environmental Limits
Keep distance
to a minimum
A Close to Sensors
B At Eye-level Location
C Avoid Vibration
Fig. 5.1 General Requirements
Sensors
+
Warning. Select a location away from strong electrical
and magnetic fields. If this is not possible, particularly
in applications where mobile communications
equipment is expected to be used, screened cables
within earthed metal conduit must be used.
D Use Screened Cable
Fig. 5.2 Environmental Limits
96 IM/SM1000 Issue 12
Page 99

Videographic Recorder
SM1000 5 Installation
5.2 Mounting – Figs. 5.3 and 5.4
Dimensions in mm (in.)
144.0 (5.67)
Fig. 5.3 Mounting Dimensions
Gasket
144.0
(5.67)
7.0
(0.27) 155.0 (6.1)
3 (0.12)
34 (1.34)
Gasket
3
40 (1.57)
29 (1.14)
Fit the panel clamps
Tighten the panel clamp securely by hand
4
AC Power Supply
Earth (Ground) Stud
+1.0
138
0.0
+0.04
(5.43 )
0.0
30
(1.2)
Panel Cut-out
+1.0
138
0.0
+0.04
(5.43 )
0.0
(See Note).
1
Cut a hole in the panel see Fig. 5.3.
2
Insert the instrument
Note. This is critical in order to ensure
proper compression of the panel seal
and achieve the NEMA 4X hosedown
rating.
AC Power Supply
Earth (Ground) Stud
Fig. 5.4 Fitting the Instrument into the Panel
IM/SM1000 Issue 12 97
Page 100

Videographic Recorder
SM1000 5 Installation
5.3 Electrical Connections – Fig. 5.5
Warning.
The instrument is not fitted with a switch therefore a disconnecting device such as a switch or circuit breaker conforming to
local safety standards must be fitted to the final installation. It must be fitted in close proximity to the instrument within easy
reach of the operator and must be marked clearly as the disconnection device for the instrument.
The AC power supply earth (ground) cable must be connected to the earth (ground) stud .
Remove all power from supply, relay and any powered control circuits and high common mode voltages before accessing
or making any connections.
Use cable appropriate for the load currents. The terminals accept cables up to 14AWG (2.5mm
The instrument conforms to Mains Power Input Insulation Category III. All other inputs and outputs conform to Category II.
All connections to secondary circuits must have basic insulation.
After installation, there must be no access to live parts, e.g. terminals.
Terminals for external circuits are for use only with equipment with no accessible live parts.
If the instrument is used in a manner not specified by the Company, the protection provided by the equipment may be
impaired.
All equipment connected to the instrument's terminals must comply with local safety standards (IEC 60950, EN601010-1).
2
).
Note.
Always route signal leads and power cables separately, preferably in earthed (grounded) metal conduit.
It is strongly recommended that screened cable is used for signal inputs and relay connections. Connect the screen to the
earth (ground stud) – see Fig. 5.5, page 99.
Replacement of the internal battery (types Duracell DL2450 or Renata CR2450N 3V lithium cell) must be carried out by an
approved technician only.
98 IM/SM1000 Issue 12
 Loading...