

Page 1
SPOR TON International Inc.
No. 52, Hwa Ya 1st Rd., Kwei-Shan Hsiang, TaoYuan Hsien, Taiwan, R.O.C.
Ph: 886-3-327-3456 / FAX: 886-3-327-0973 / www.sporton.com.tw
FCC RADIO TEST REPORT
Applicant’s company Z-Com, Inc.
Applicant Address 7F-2, No. 9. Prosperity RD.I Science-Based Industrial, Park Hsinchu, 300
Taiwan
FCC ID M4Y-0XG880M
Manufacturer’s company Z-Com, Inc.
Manufacturer Address
7F-2, No. 9. Prosperity RD.I Science-Based Industrial, Park Hsinchu, 300
Taiwan
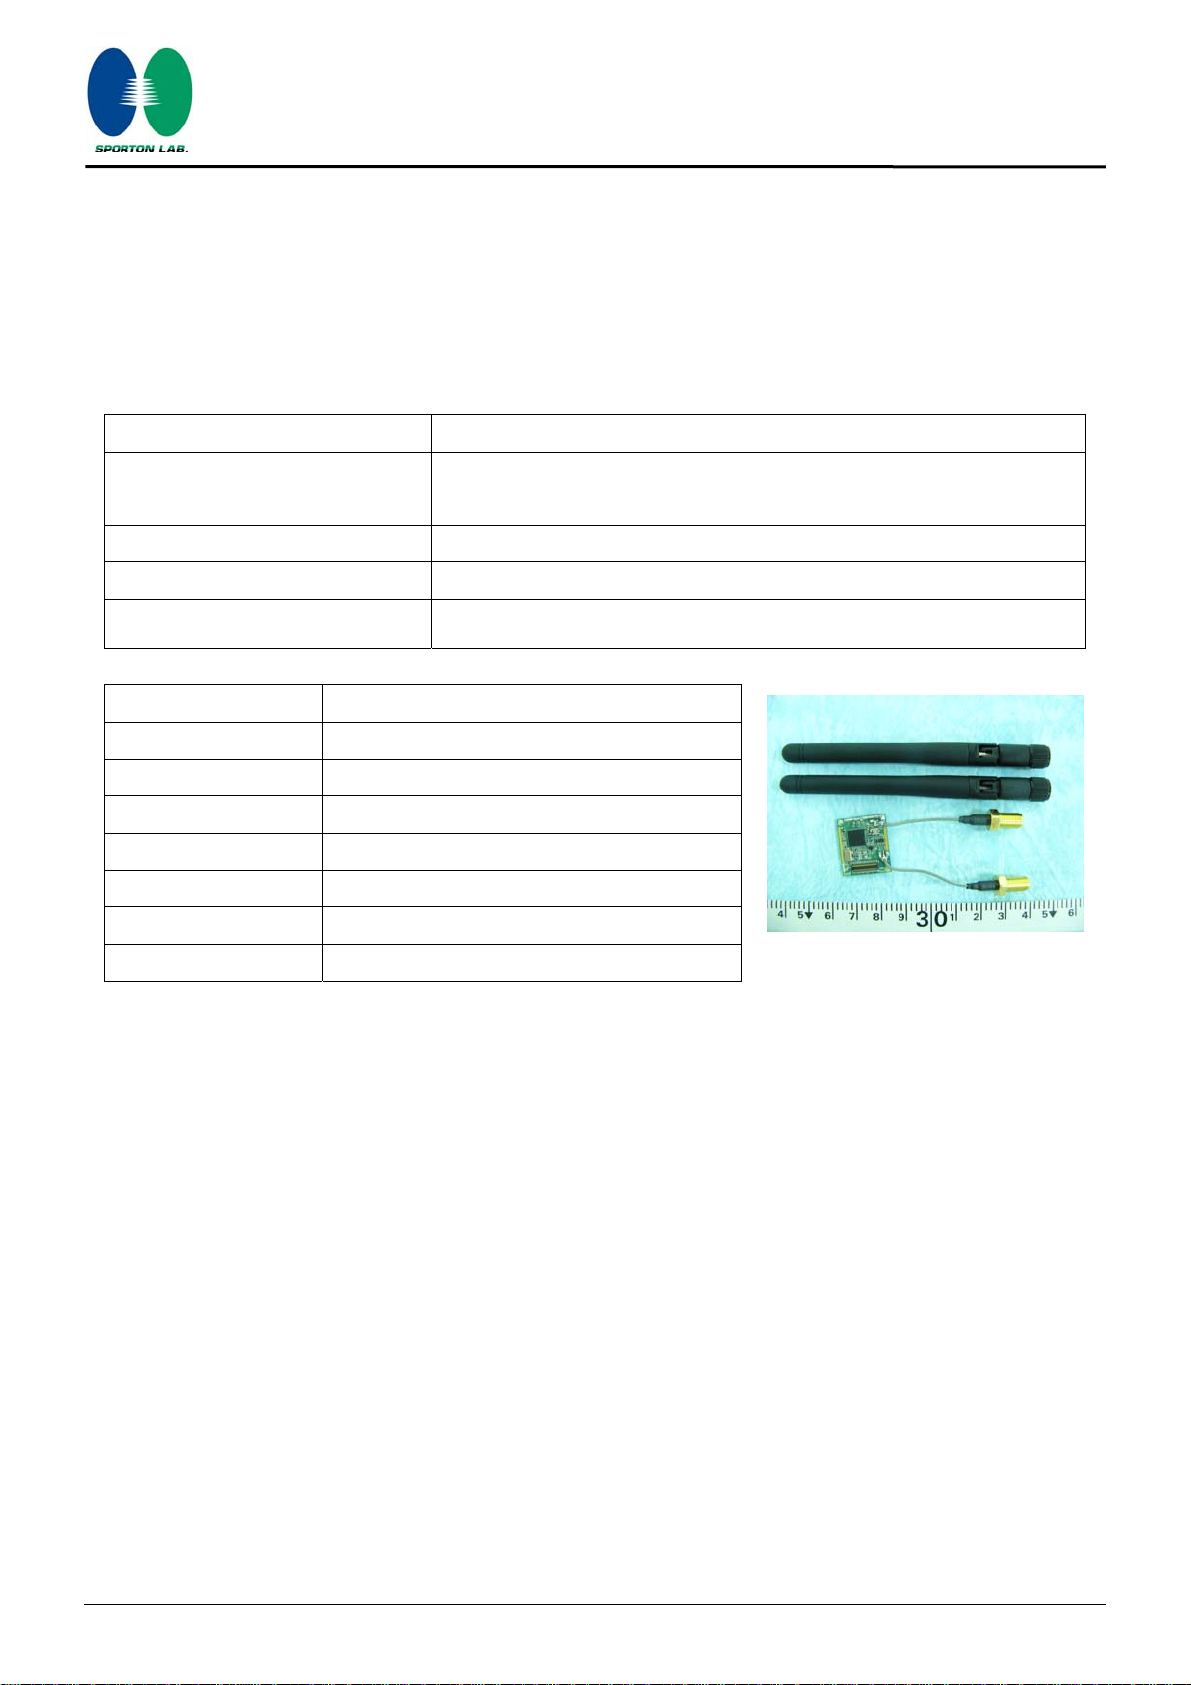
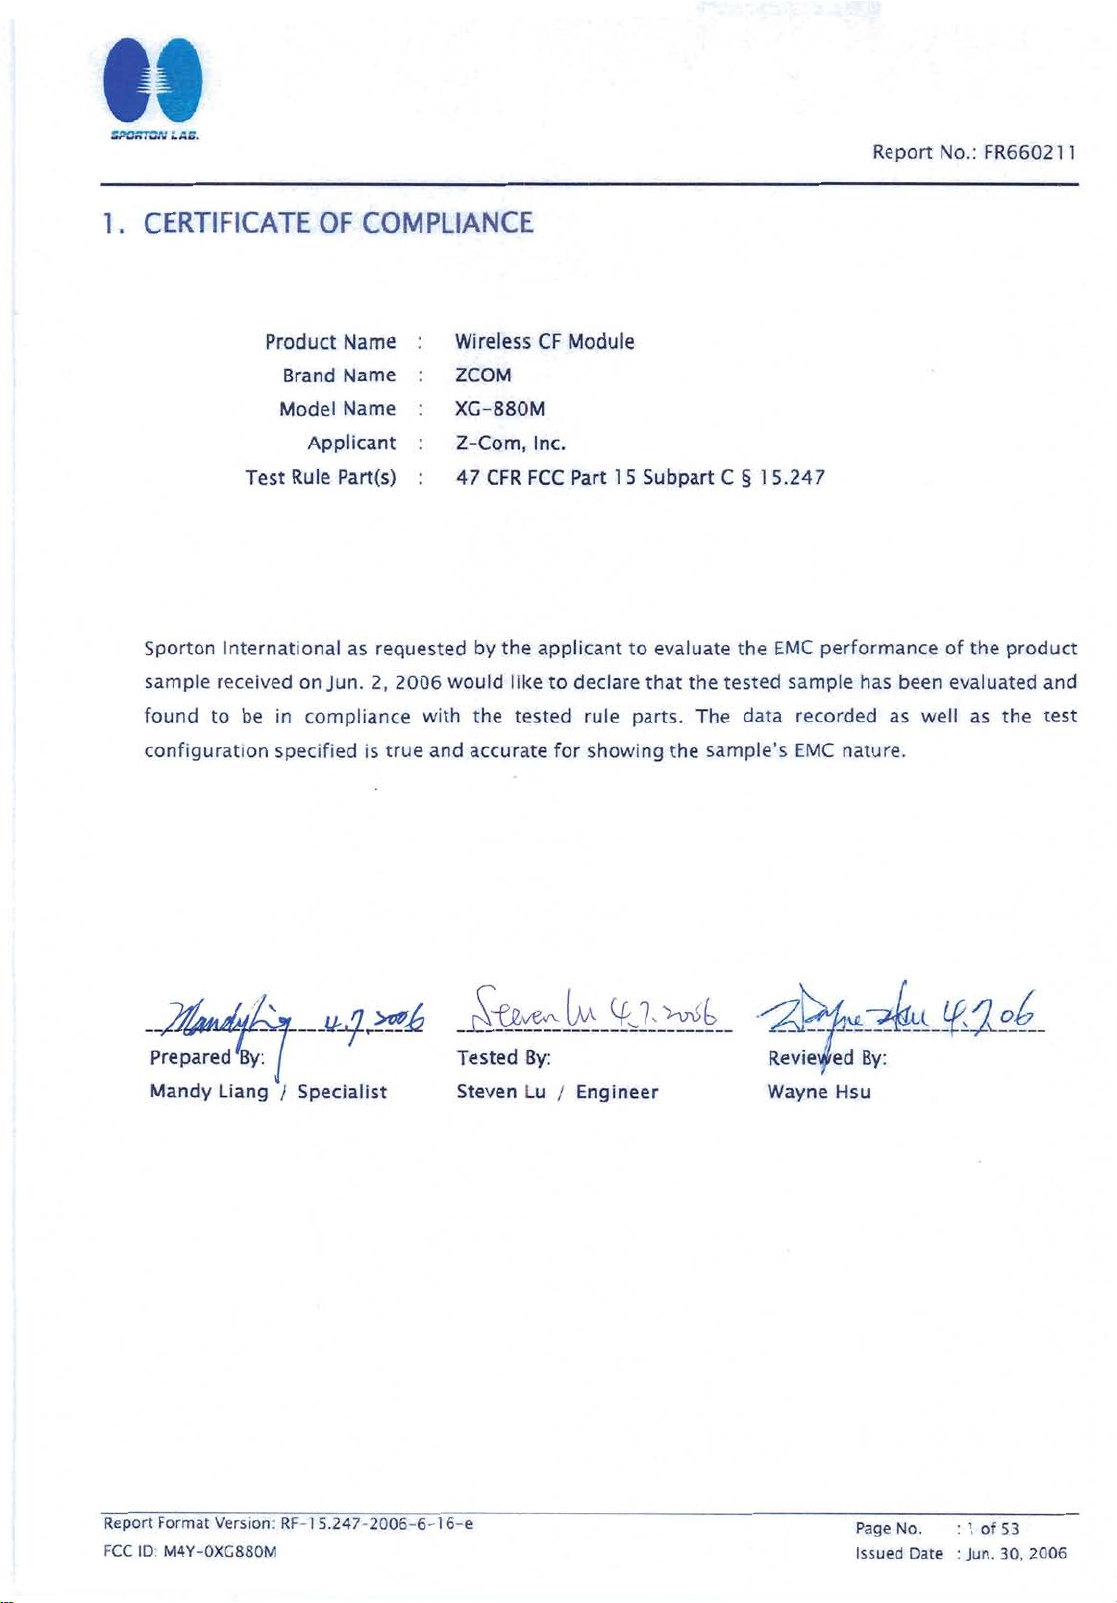
Product Name Wireless CF Module
Brand Name ZCOM
Model Name XG-880M
Test Rule
Test Freq. Range 2400 ~ 2483.5MHz
Receive Date
Final Test Date
Submission Type
47 CFR FCC Part 15 Subpart C § 15.247
Jun. 2, 2006
Jun. 23, 2006
Original Equipment
Statement
Test result included is only for the 802.11b/g part of the product.
The test result in this report refers exclusively to the presented test model / sample.
Without written approval of SPORTON International Inc., the test report shall not be reproduced except in full.
The measurements and test results shown in this test report were made in accordance with the procedures
and found in compliance with the limit given in ANSI C63.4-2003 and 47 CFR FCC Part 15 Subpart C.
The test equipment used to perform the test is calibrated and traceable to NML/ROC.
Report Format Version: RF-15.247-2006-6-16-e
Page 2

Report No.: FR660211
Table of Contents
1. CERTIFICATE OF COMPLIANCE ......................................................................................................................... 1
2. SUMMARY OF THE TEST RESULT .......................................................................................................................... 2
3. GENERAL INFORMATION .................................................................................................................................. 3
3.1. Product Details....................................................................................................................................................................................3
3.2. Accessories.........................................................................................................................................................................................3
3.3. Table for Filed Antenna.......................................................................................................................................................................3
3.4. Table for Carrier Frequencies .............................................................................................................................................................4
3.5. Table for Test Modes ...........................................................................................................................................................................4
3.6. Table for Testing Locations..................................................................................................................................................................5
3.7. Table for Supporting Units ...................................................................................................................................................................5
3.8. Table for Parameters of Test Software Setting .....................................................................................................................................6
3.9. Test Configurations .............................................................................................................................................................................7
4. TEST RESULT ..................................................................................................................................................... 9
4.1. AC Power Line Conducted Emissions Measurement...........................................................................................................................9
4.2. Maximum Peak Output Power Measurement ...................................................................................................................................13
4.3. Power Spectral Density Measurement ..............................................................................................................................................15
4.4. 6dB Spectrum Bandwidth Measurement ..........................................................................................................................................20
4.5. Radiated Emissions Measurement ....................................................................................................................................................25
4.6. Band Edge Emissions Measurement .................................................................................................................................................43
4.7. Antenna Requirements .....................................................................................................................................................................50
5. LIST OF MEASURING EQUIPMENTS ................................................................................................................... 51
6. SPORTON COMPANY PROFILE ........................................................................................................................ 53
6.1. Test Location.....................................................................................................................................................................................53
APPENDIX A. PHOTOGRAPHS OF EUT.......................................................................................................... A1 ~ A4
APPENDIX B. TEST PHOTOS.......................................................................................................................... B1 ~ B7
APPENDIX C. MAXIMUM PERMISSIBLE EXPOSURE......................................................................................... C1 ~C3
Report Format Version: RF-15.247-2006-2-17-d
FCC ID: M4Y-0XG880M Issued Date : Jun. 30, 2006
Page No. :
i of ii
Page 3
History of This Test Report
Original Issue Date: Jun. 30, 2006
Report No.: FR660211
■ No additional attachment.
□ Additional attachment were issued as following record:
Attachment No. Issue Date Description
Turbo 6
2437 MHz
Report No.: FR660211
Further, this requirement does not apply to intentional radiators that must be professionally installed.
Report Format Version: RF-15.247-2006-2-17-d
FCC ID: M4Y-0XG880M Issued Date : Jun. 30, 2006
Page No. :
ii of ii
Page 4
Page 5
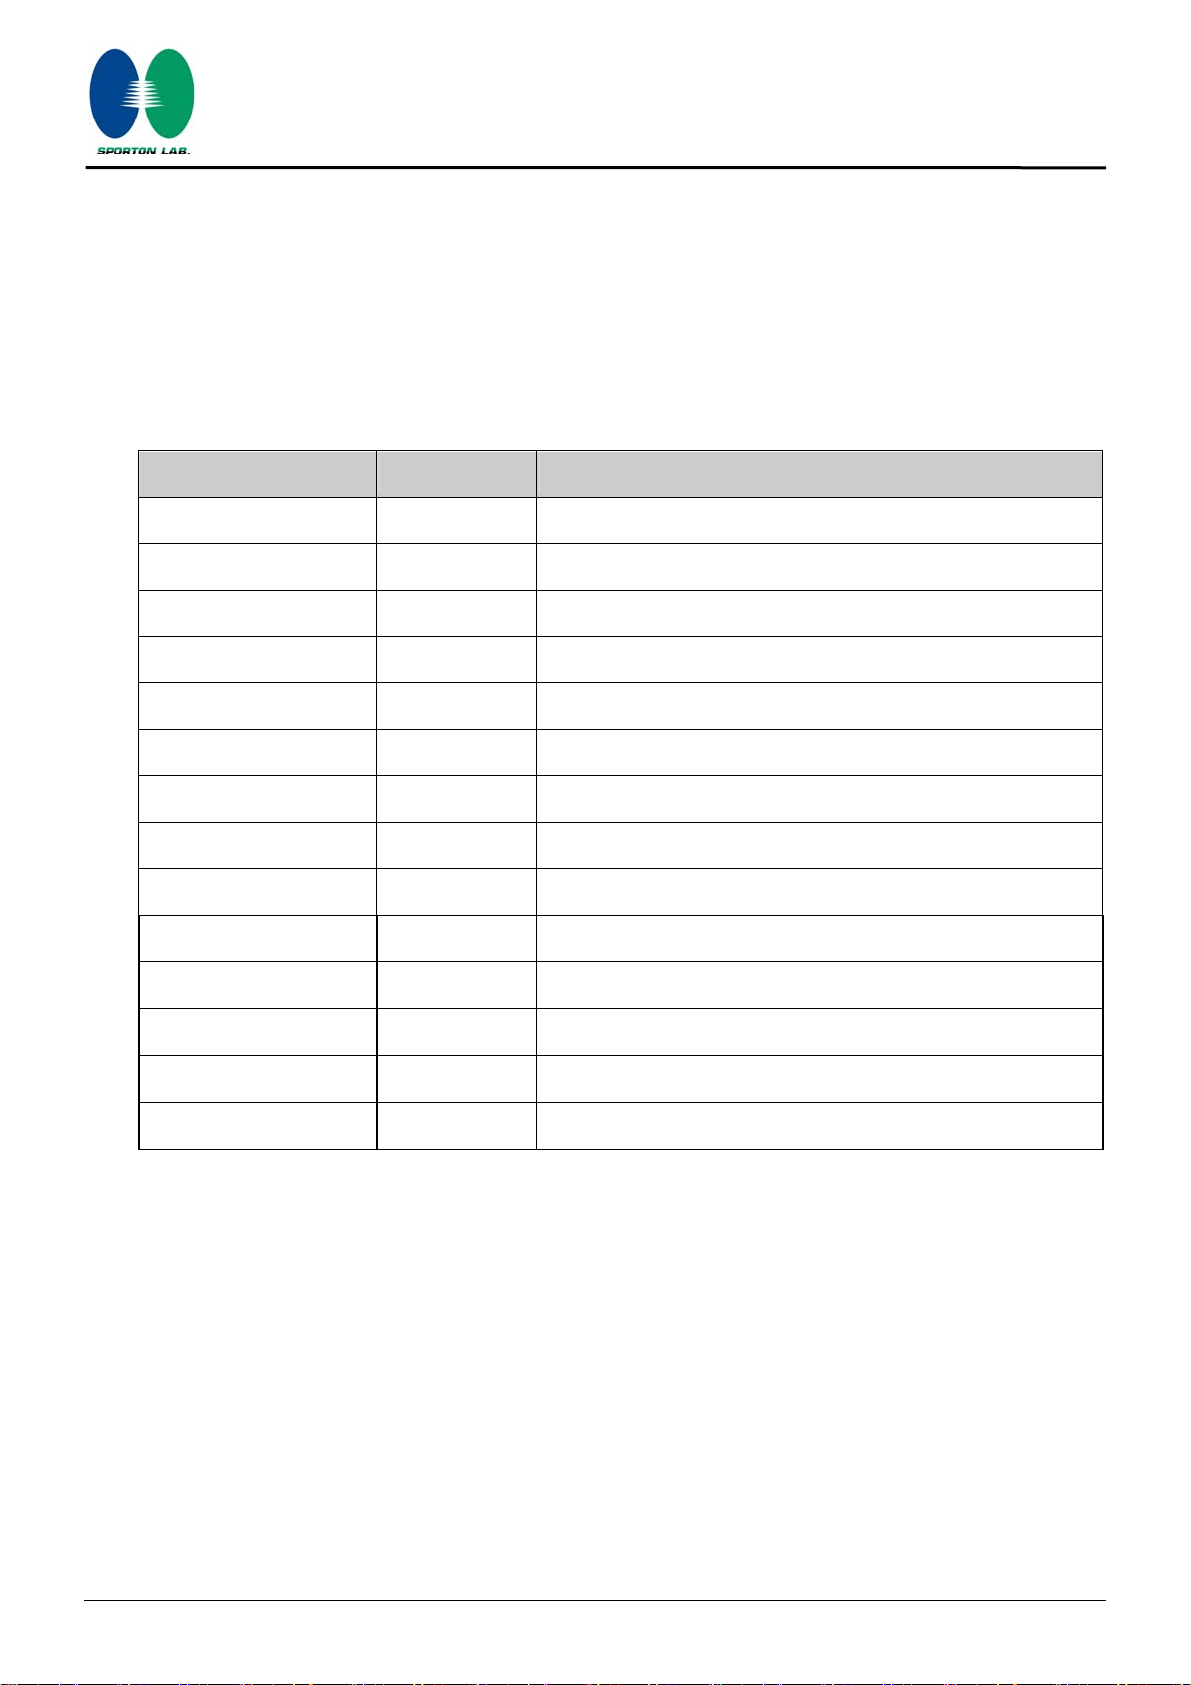
2. SUMMARY OF THE TEST RESULT
Applied Standard: 47 CFR FCC Part 15 Subpart C
Part Rule Section Description of Test Result Under Limit
4.1 15.207 AC Power Line Conducted Emissions Complies 14.74 dB
4.2 15.247(b)(3) Maximum Peak Conducted Output Power Complies 12.25 dB
4.3 15.247(e) Power Spectral Density Complies 18.97 dB
4.4 15.247(a)(2) 6dB Spectrum Bandwidth Complies -
4.5 15.247(d) Radiated Emissions Complies 3.02 dB
4.6 15.247(d) Band Edge Emissions Complies 3.10 dB
Report No.: FR660211
4.7 15.203 Antenna Requirements Complies
Test Items Uncertainty Remark
AC Power Line Conducted Emissions
Maximum Peak Conducted Output Power
Power Spectral Density
6dB Spectrum Bandwidth
Radiated Emissions/ Band Edge Emissions
±2.26dB
±0.5dB
±0.71dB
±6.25×10⁻⁷
±3.72dB
Confidence levels of 95%
Confidence levels of 95%
Confidence levels of 95%
Confidence levels of 95%
Confidence levels of 95%
-
Report Format Version: RF-15.247-2006-6-16-e
FCC ID: M4Y-0XG880M Issued Date : Jun. 30, 2006
Page No. :
2 of 53
Page 6
3. GENERAL INFORMATION
3.1. Product Details
Items Description
Power Type Host (Notebook)
Modulation DSSS for IEEE 802.11b ; OFDM for IEEE 802.11g
Data Modulation DSSS (BPSK / QPSK / CCK) ; OFDM (BPSK / QPSK / 16QAM / 64QAM)
Data Rate (Mbps) DSSS (1/ 2/ 5.5/11) ; OFDM (6/9/12/18/24/36/48/54)
Frequency Range 2400 ~ 2483.5MHz
Channel Number 11
Channel Band Width (99%) 11b: 13.91 MHz ; 11g: 16.44 MHz
Report No.: FR660211
Conducted Output Power 11b: 15.44 dBm ; 11g: 17.75 dBm
Carrier Frequencies Please refer to section 3.4
Antenna Please refer to section 3.3
3.2. Accessories
N/A
3.3. Table for Filed Antenna
Ant. Brand Model Name Antenna Type Connector Gain (dBi)
1 WANSHIH SAW-0008A Dipole Antenna Reversed-SMA 2.0
Report Format Version: RF-15.247-2006-6-16-e
FCC ID: M4Y-0XG880M Issued Date : Jun. 30, 2006
Page No. :
3 of 53
Page 7
3.4. Table for Carrier Frequencies
Freqeuncy Band Channel No. Frequency Channel No. Frequency
Report No.: FR660211
1 2412 MHz 7 2442 MHz
2 2417 MHz 8 2447 MHz
2400~2483.5MHz
3 2422 MHz 9 2452 MHz
4 2427 MHz 10 2457 MHz
5 2432 MHz 11 2462 MHz
6 2437 MHz
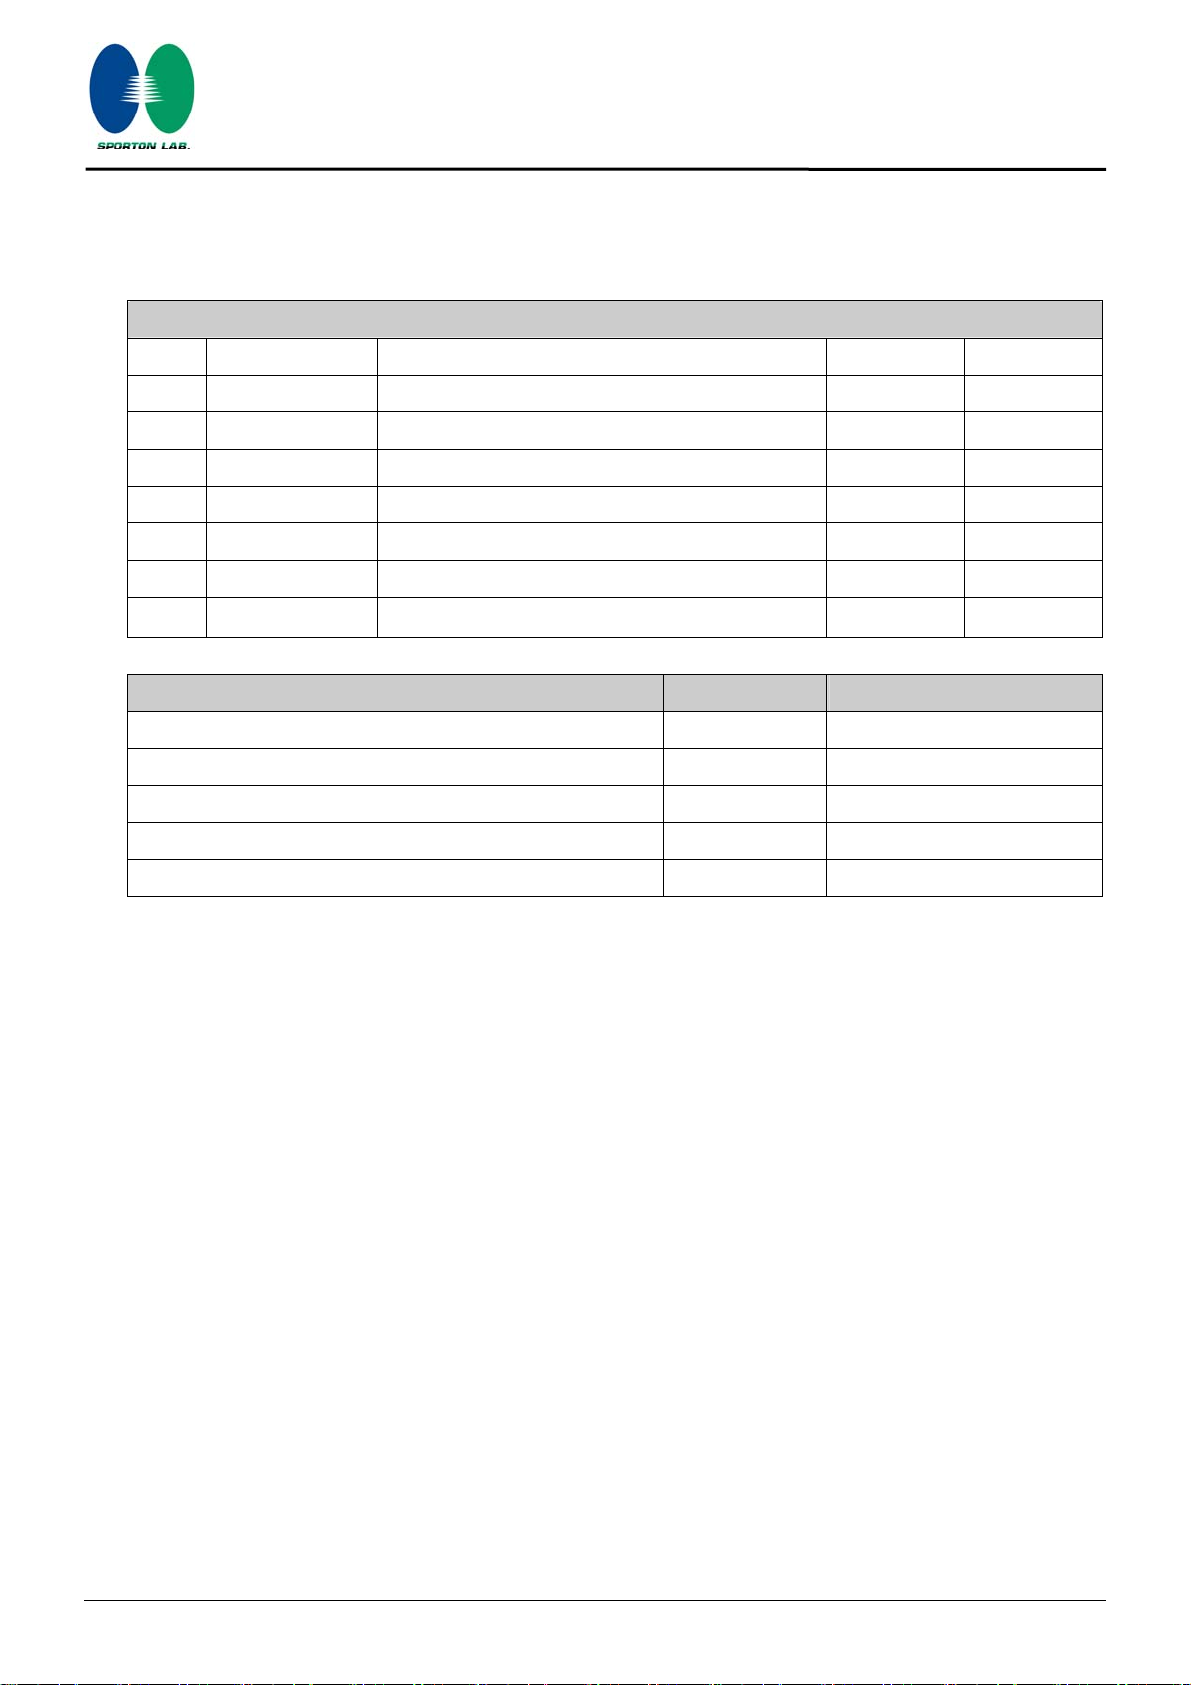
3.5. Table for Test Modes
Preliminary tests were performed in different data rate to find the worst radiated emission. The data rate
shown in the table below is the worst-case rate with respect to the specific test item. Investigation has been
done on all the possible configurations for searching the worst cases. The following table is a list of the test
modes shown in this test report.
Test Items Mode Data Rate Channel Antenna
AC Power Line Conducted Emissions Normal Link 54 Mbps 6 1
11b/ BPSK 1 Mbps 1/6/11 NA Maximum Peak Conducted Output Power
Power Spectral Density
6dB Spectrum Bandwidth
Radiated Emissions 9kHz~1GHz 11g/BPSK 6 Mbps 6 1
11g/BPSK 6 Mbps 1/6/11 NA
11b/ BPSK 1 Mbps 1/6/11 1 Radiated Emissions 1GHz~10th Harmonic
11g/BPSK 6 Mbps 1/6/11 1
11b/ BPSK 1 Mbps 1/11 1 Band Edge Emissions
11g/BPSK 6 Mbps 1/11 1
Report Format Version: RF-15.247-2006-6-16-e
FCC ID: M4Y-0XG880M Issued Date : Jun. 30, 2006
Page No. :
4 of 53
Page 8
3.6. Table for Testing Locations
Test Site No. Site Category Location FCC Reg. No. IC File No. VCCI Reg. No
03CH03-HY SAC Hwa Ya 101377 IC 4088 -
CO04-HY Conduction Hwa Ya 101377 IC 4088 -
TH01-HY OVEN Room Hwa Ya - - -
Open Area Test Site (OATS); Semi Anechoic Chamber (SAC); Fully Anechoic Chamber (FAC).
Please refer section 6 for Test Site Address.
3.7. Table for Supporting Units
Support Unit Brand Model FCC ID
Report No.: FR660211
Notebook IBM 1829 DoC
Printer EPSON LQ-300 DoC
Report Format Version: RF-15.247-2006-6-16-e
FCC ID: M4Y-0XG880M Issued Date : Jun. 30, 2006
Page No. :
5 of 53
Page 9
Report No.: FR660211
3.8. Table for Parameters of Test Software Setting
During testing, Channel & Power Controlling Software provided by the customer was used to control the
operating channel as well as the output power level. The RF output power selection is for the setting of RF
output power expected by the customer and is going to be fixed on the firmware of the final end product.
Power Parameters of IEEE 802.11b/g
Test Software Version DutApiCf8385p
Frequency 2412 MHz 2437 MHz 2462 MHz
IEEE 802.11b 14 14 14
IEEE 802.11g 14 14 14
Report Format Version: RF-15.247-2006-6-16-e
FCC ID: M4Y-0XG880M Issued Date : Jun. 30, 2006
Page No. :
6 of 53
Page 10
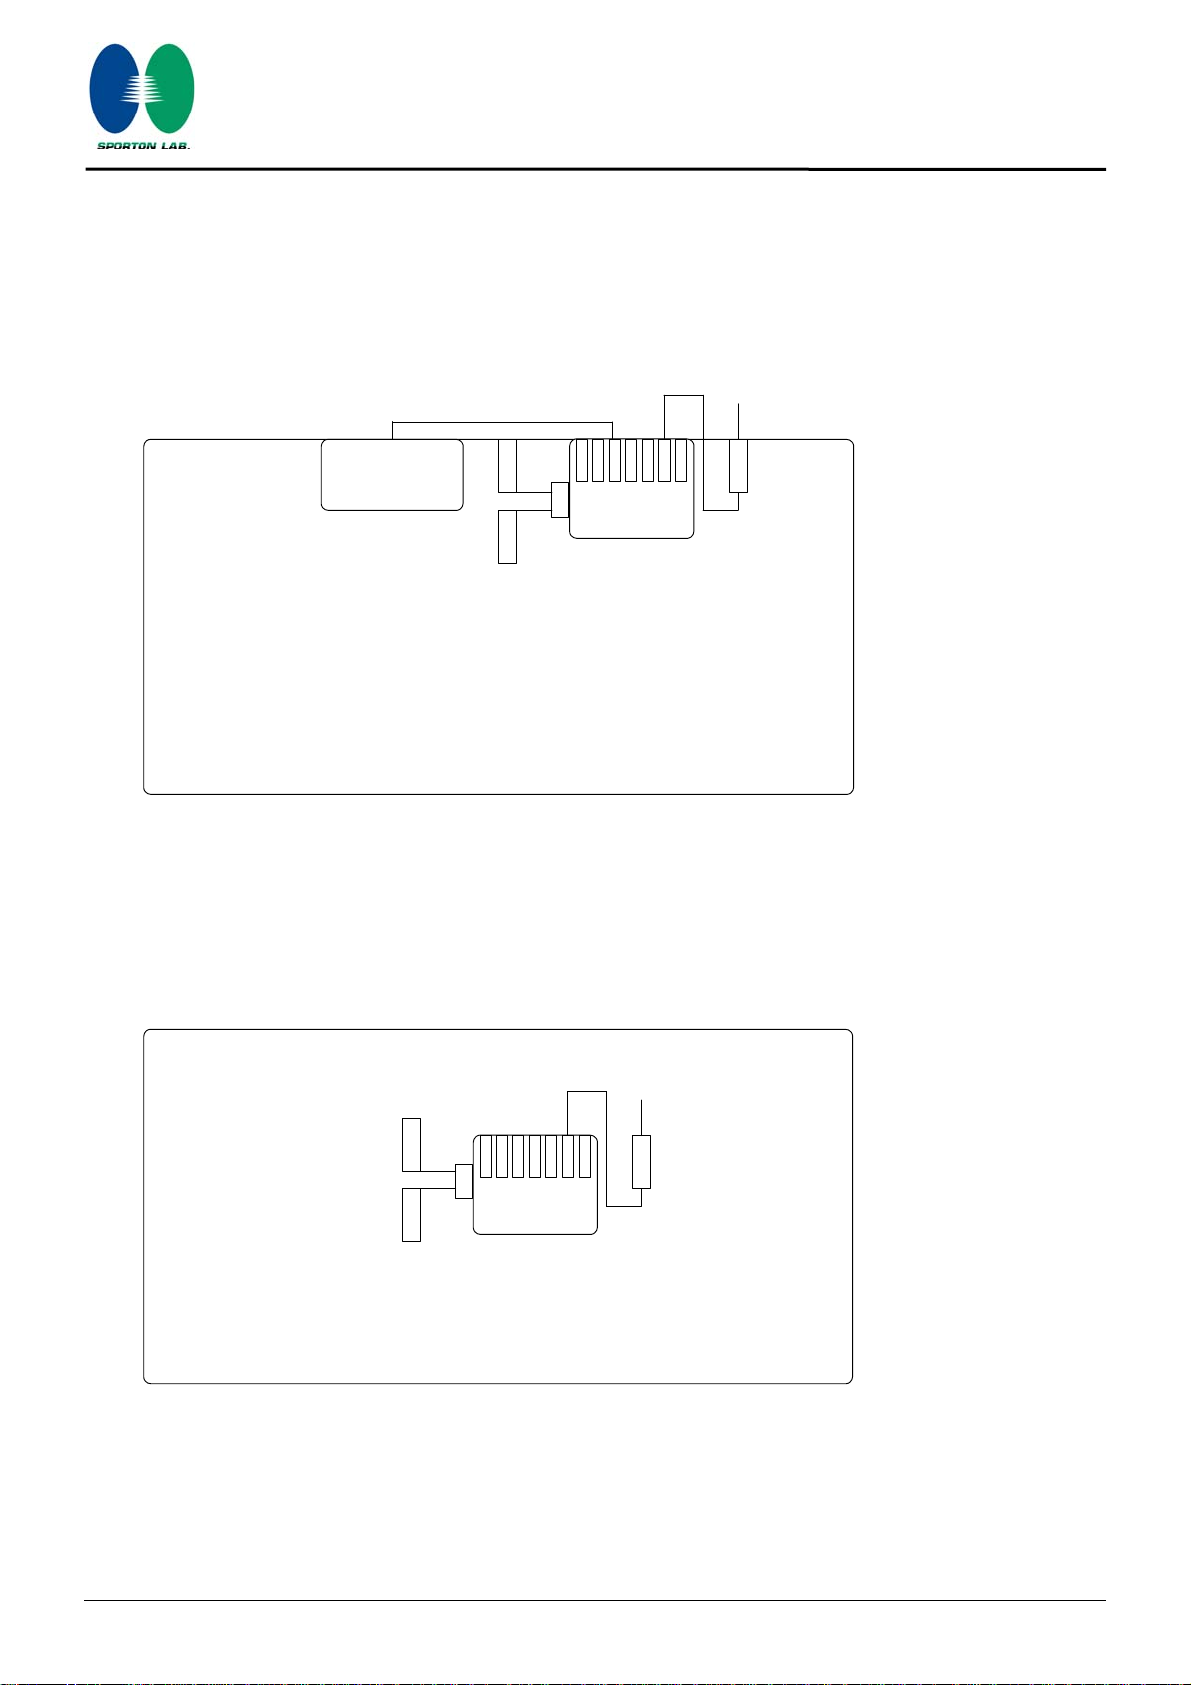
3.9. Test Configurations
3.9.1. Radiation Emissions Test Configuration
Test Configuration: 9KHz~1GHz
2
Printer
Antenna
Antenna
Report No.: FR660211
AC Main
RJ-45
LPT
PS/2
Notebook
VGADCUSB x 2
Adapter
1
RJ-11
EUT
3
1. DC power line, 1.5m, No-shielding
2. LPT, 1.8m, Shielding
3. RF Cable, 7cm, Shielding
Test Configuration: above 1GHz
AC Main
Antenna
2
Antenna
RJ-45
LPT
PS/2
Notebook
VGADCUSB x 2
Adapter
1
RJ-11
EUT
1. DC power line, 1.5m, No-shielding
2. RF CABLE , 7cm , shielding
Report Format Version: RF-15.247-2006-6-16-e
FCC ID: M4Y-0XG880M Issued Date : Jun. 30, 2006
Page No. :
7 of 53
Page 11
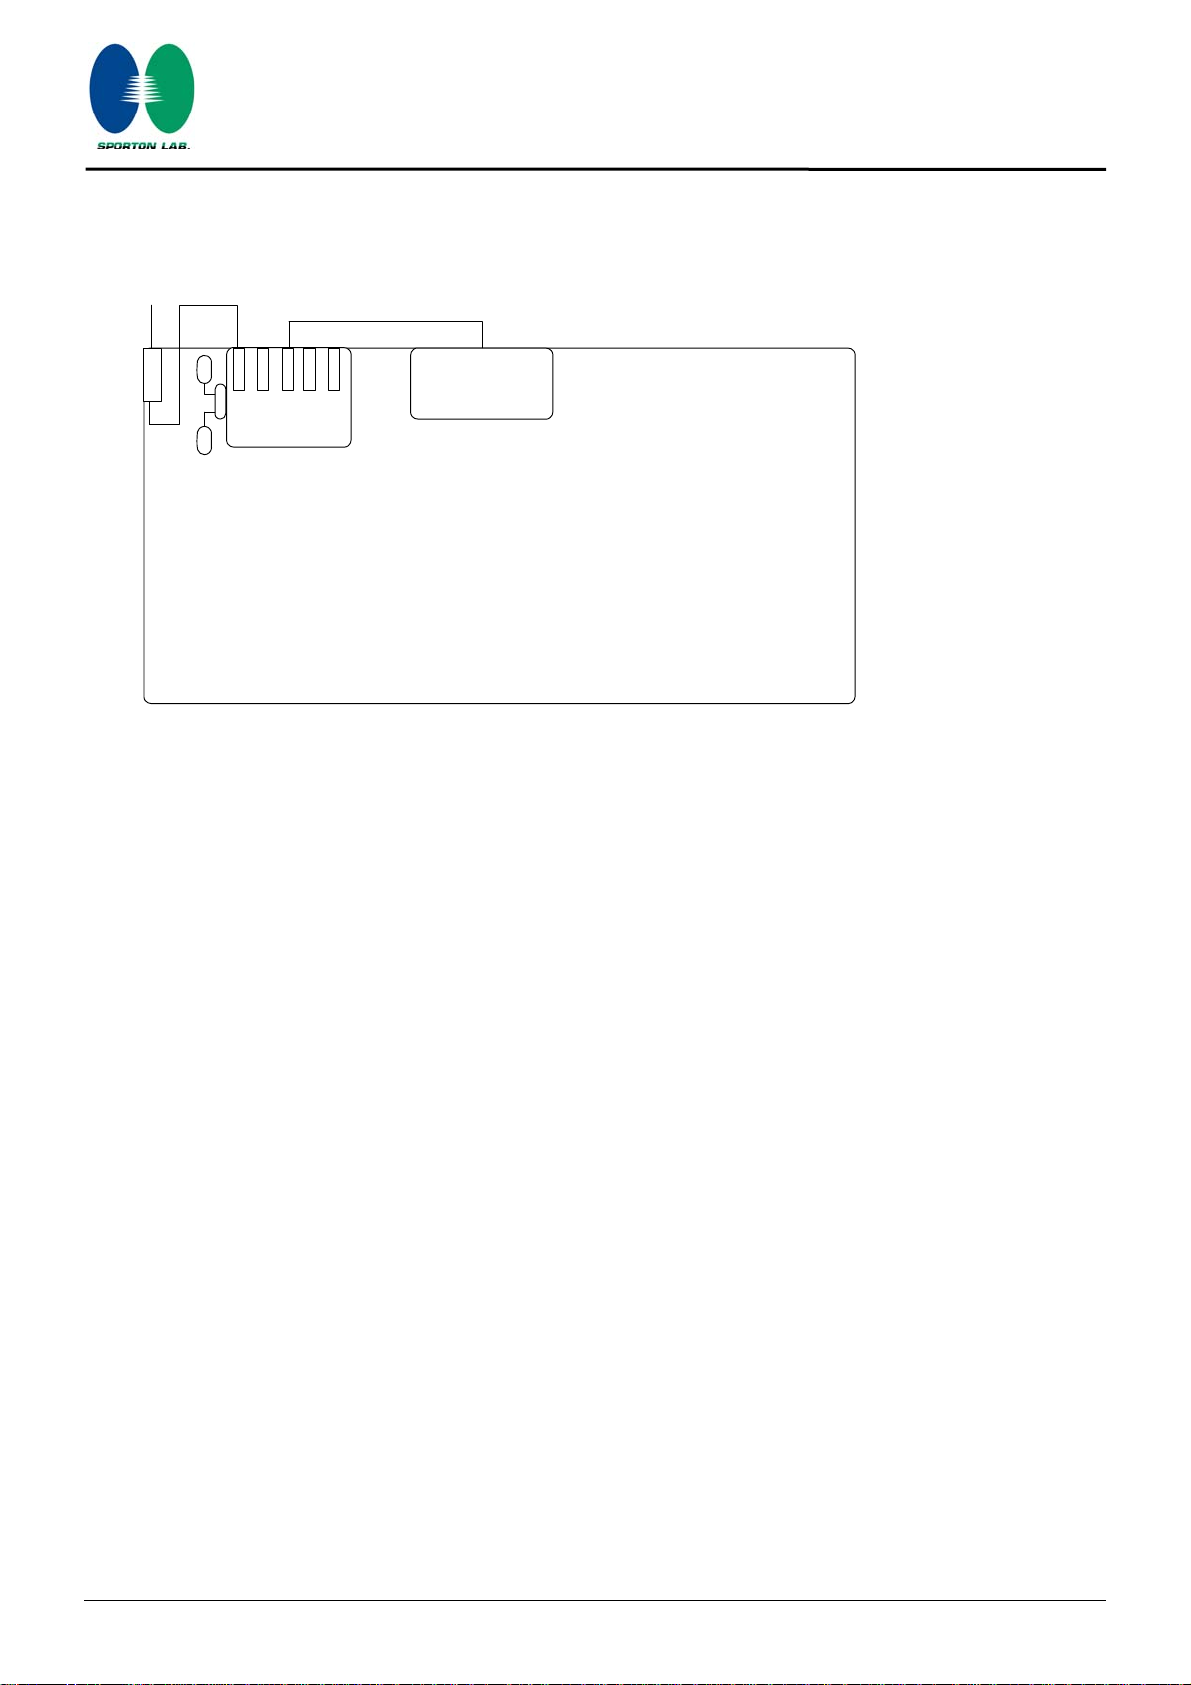
3.9.2. AC Power Line Conduction Emissions Test Configuration
Report No.: FR660211
VGA
LPT
Adapter
1
1. DC power line, 1.5m, No-shielding
2. LPT, 1.8m, Shielding
3. RF Cable ,7 cm, Shielding
4. RF Cable ,7 cm, Shielding
DC
ant ant
EUT
3
4
RJ-45
Notebook
RJ-11
2
Printer
Report Format Version: RF-15.247-2006-6-16-e
Page No. :
8 of 53
FCC ID: M4Y-0XG880M Issued Date : Jun. 30, 2006
Page 12
4. TEST RESULT
4.1. AC Power Line Conducted Emissions Measurement
4.1.1. Limit
For a Low-power Radio-frequency Device which is designed to be connected to the AC power line, the
radio frequency voltage that is conducted back onto the AC power line on any frequency or
frequencies within the band 150 kHz to 30 MHz shall not exceed below limits table.
Frequency (MHz) QP Limit (dBuV) AV Limit (dBuV)
0.15~0.5 66~56 56~46
0.5~5 56 46
5~30 60 50
Report No.: FR660211
4.1.2. Measuring Instruments and Setting
Please refer to section 5 in this report. The following table is the setting of the receiver.
Receiver Parameters Setting
Attenuation 10 dB
Start Frequency 0.15 MHz
Stop Frequency 30 MHz
IF Bandwidth 9 KHz
4.1.3. Test Procedures
1. Configure the EUT according to ANSI C63.4. The EUT or host of EUT has to be placed 0.4 meter far
from the conducting wall of the shielding room and at least 80 centimeters from any other
grounded conducting surface.
2. Connect EUT or host of EUT to the power mains through a line impedance stabilization network (LISN).
3. All the support units are connected to the other LISNs. The LISN should provide 50uH/50ohms
coupling impedance.
4. The frequency range from 150 KHz to 30 MHz was searched.
5. Set the test-receiver system to Peak Detect Function and Specified Bandwidth with Maximum Hold
Mode.
6. The measurement has to be done between each power line and ground at the power terminal.
Report Format Version: RF-15.247-2006-6-16-e
FCC ID: M4Y-0XG880M Issued Date : Jun. 30, 2006
Page No. :
9 of 53
Page 13
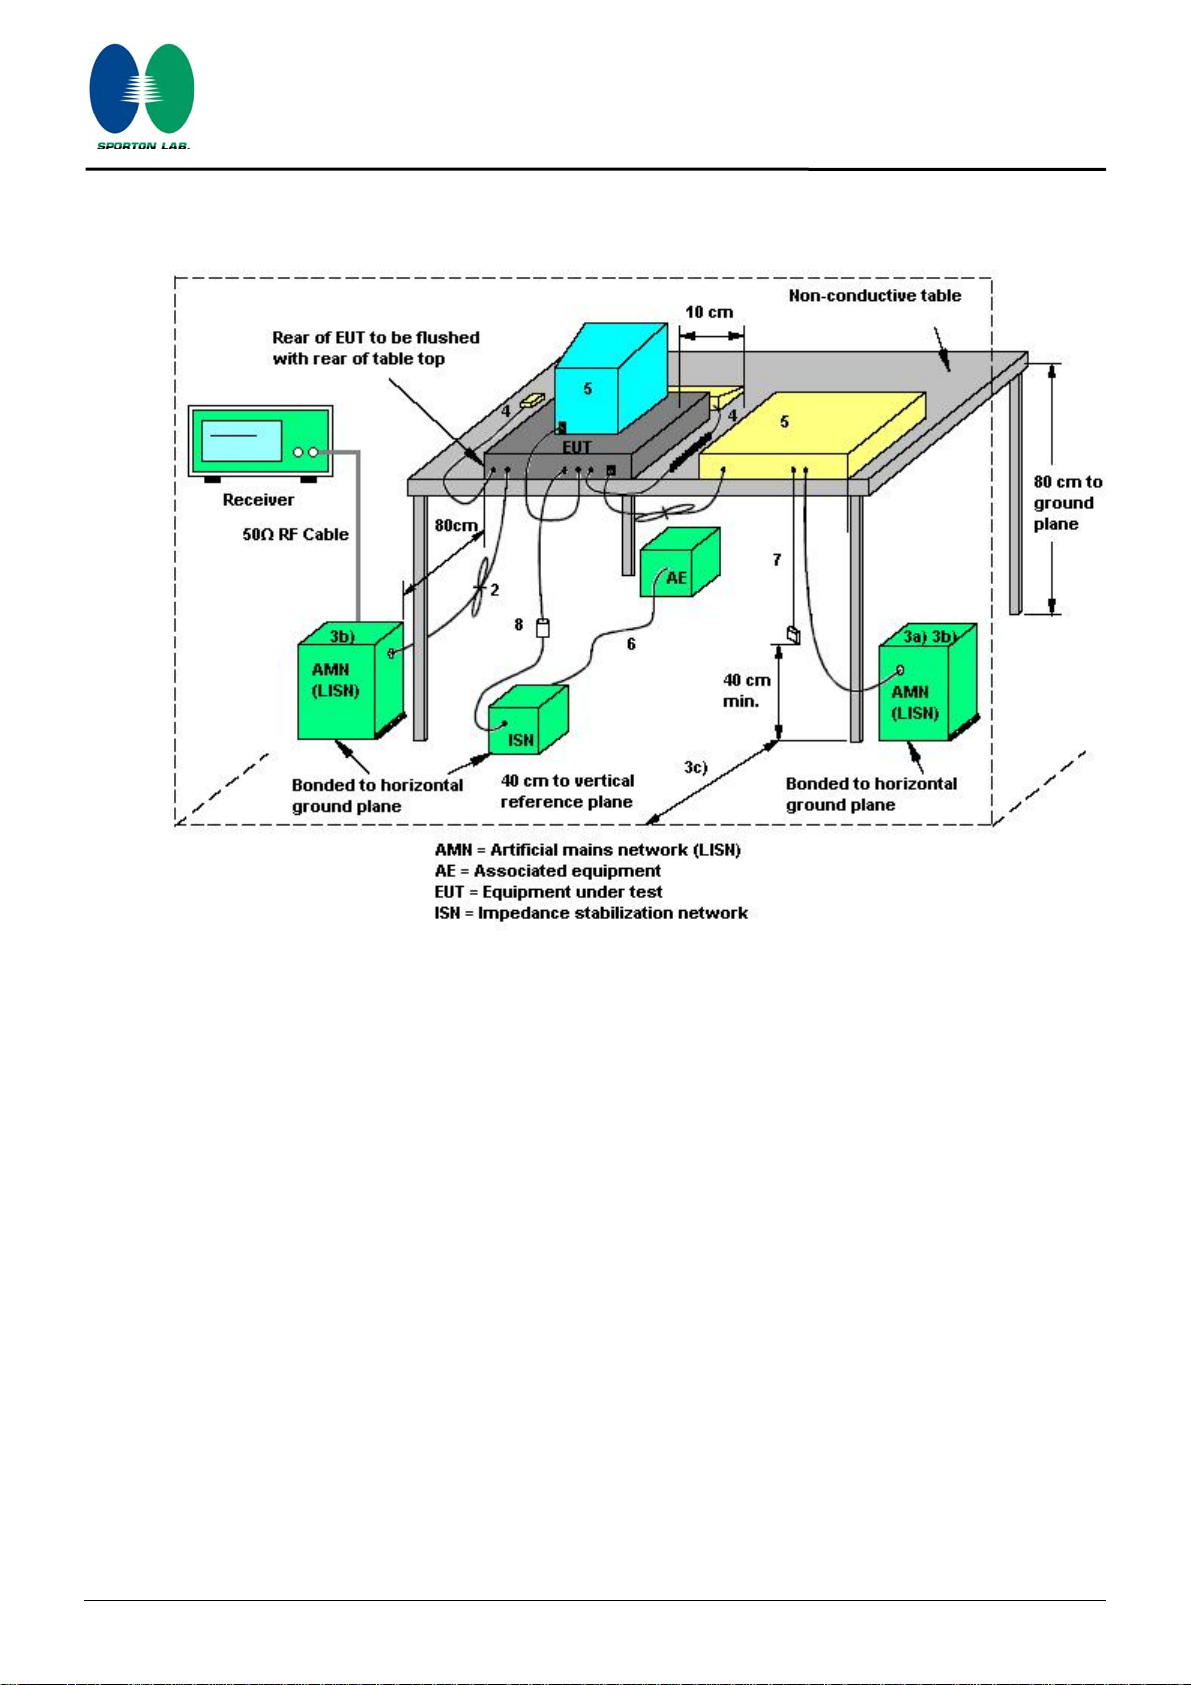
4.1.4. Test Setup Layout
Report No.: FR660211
1. If cables, which hang closer than 40 cm to the horizontal metal groundplane, cannot be shortened
to appropriate length, the excess shall be folded back and forth forming a bundle 30 cm to 40 cm
long.
2. Excess mains cord shall be bundled in the centre or shortened to appropriate length.
3. EUT is connected to one artificial mains network (AMN). All AMNs and ISNs may alternatively be
connected to a vertical reference plane or metal wall.
4. All other units of a system are powered from a second AMN. A multiple outlet strip can be used for
multiple mains cords.
5. AMN and ISN are 80 cm from the EUT and at least 80 cm from other units and other metal planes.
6. Mains cords and signal cables shall be positioned for their entire lengths, as far as possible, at 40 cm
from the vertical reference plane.
7. Cables of hand operated devices, such as keyboards, mouses, etc. shall be placed as for normal
usage.
8. Peripherals shall be placed at a distance of 10 cm from each other and from the controller, except
for the monitor which, if this is an acceptable installation practice, shall be placed directly on the
top of the controller.
9. I/O signal cable intended for external connection.
10. The end of the I/O signal cables which are not connected to an AE may be terminated, if required,
using correct terminating impedance.
11. If used, the current probe shall be placed at 0,1 m from the ISN.
Report Format Version: RF-15.247-2006-6-16-e
FCC ID: M4Y-0XG880M Issued Date : Jun. 30, 2006
Page No. :
10 of 53
Page 14
4.1.5. Test Deviation
There is no deviation with the original standard.
4.1.6. EUT Operation during Test
The EUT was placed on the test table and programmed in normal function.
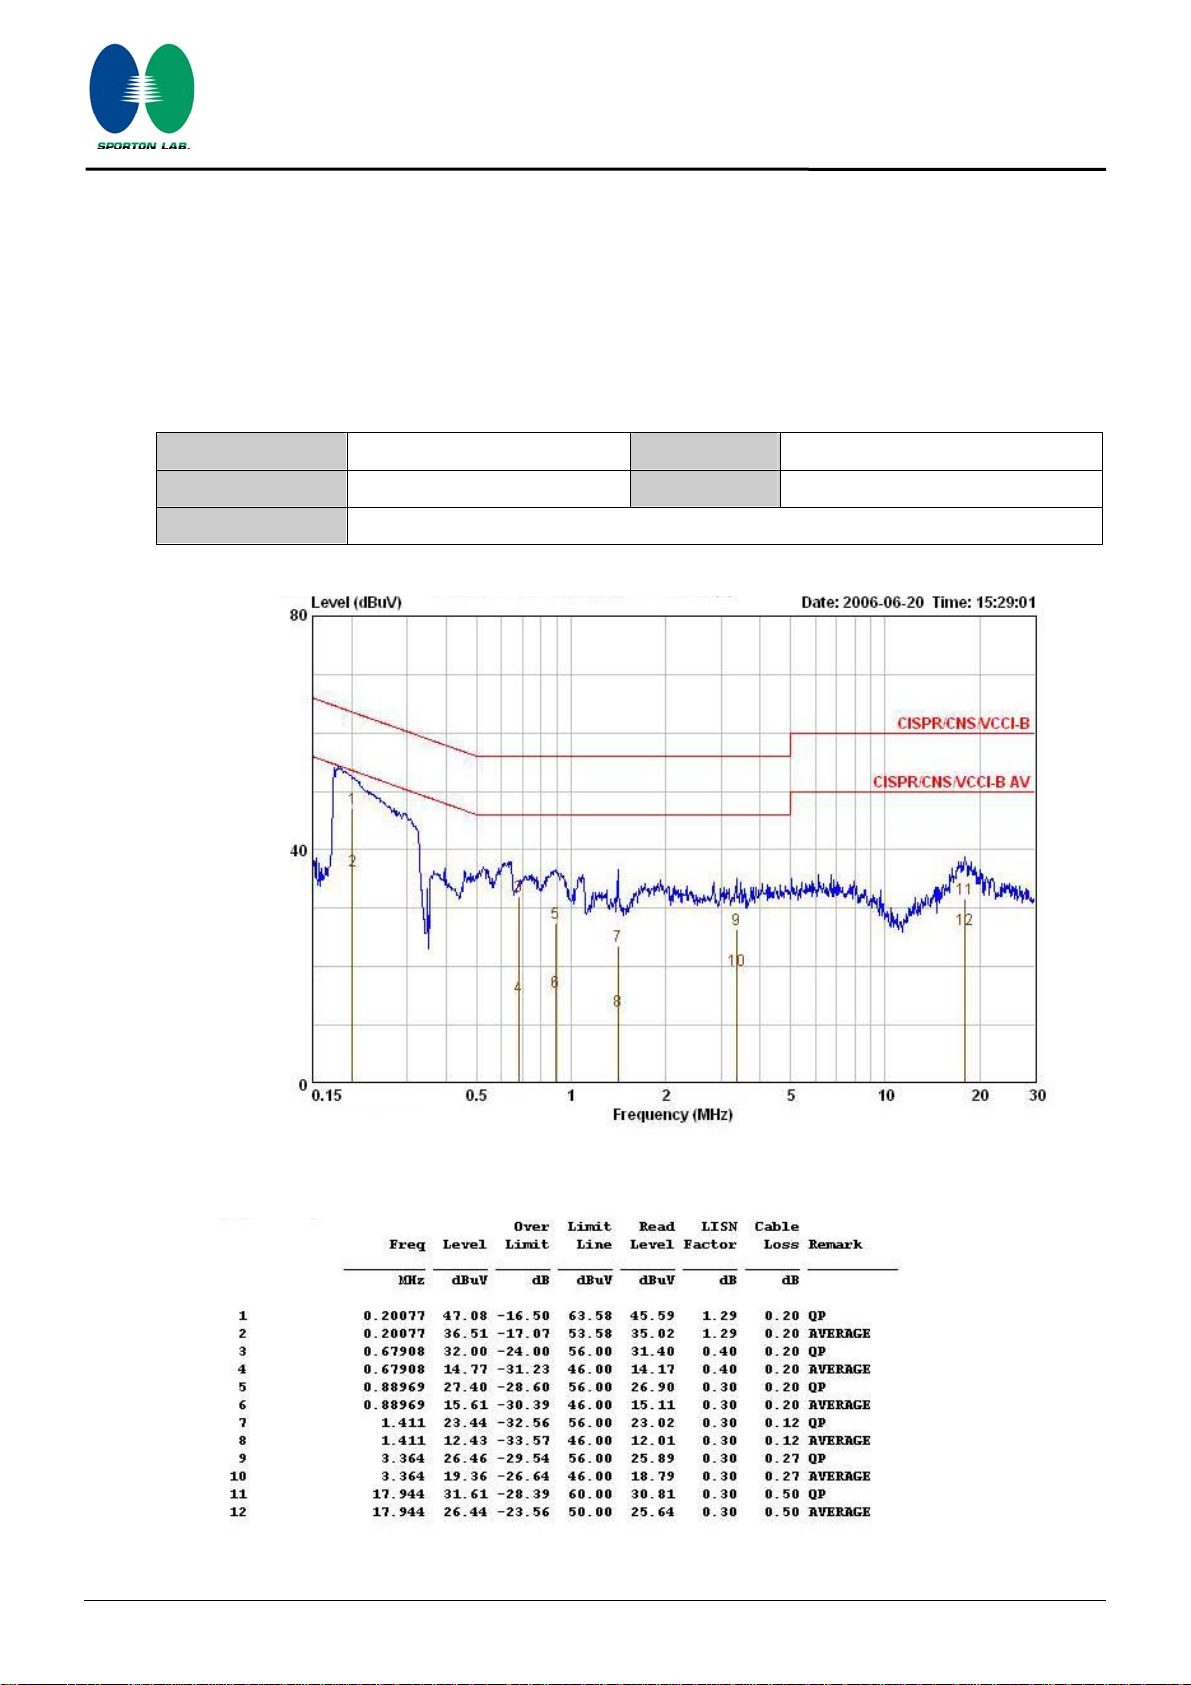
4.1.7. Results of AC Power Line Conducted Emissions Measurement
Report No.: FR660211
Temperature
26℃
Humidity 65%
Test Engineer Rush Kao Phase Line
Configuration Normal Link
Report Format Version: RF-15.247-2006-6-16-e
FCC ID: M4Y-0XG880M Issued Date : Jun. 30, 2006
Page No. :
11 of 53
Page 15
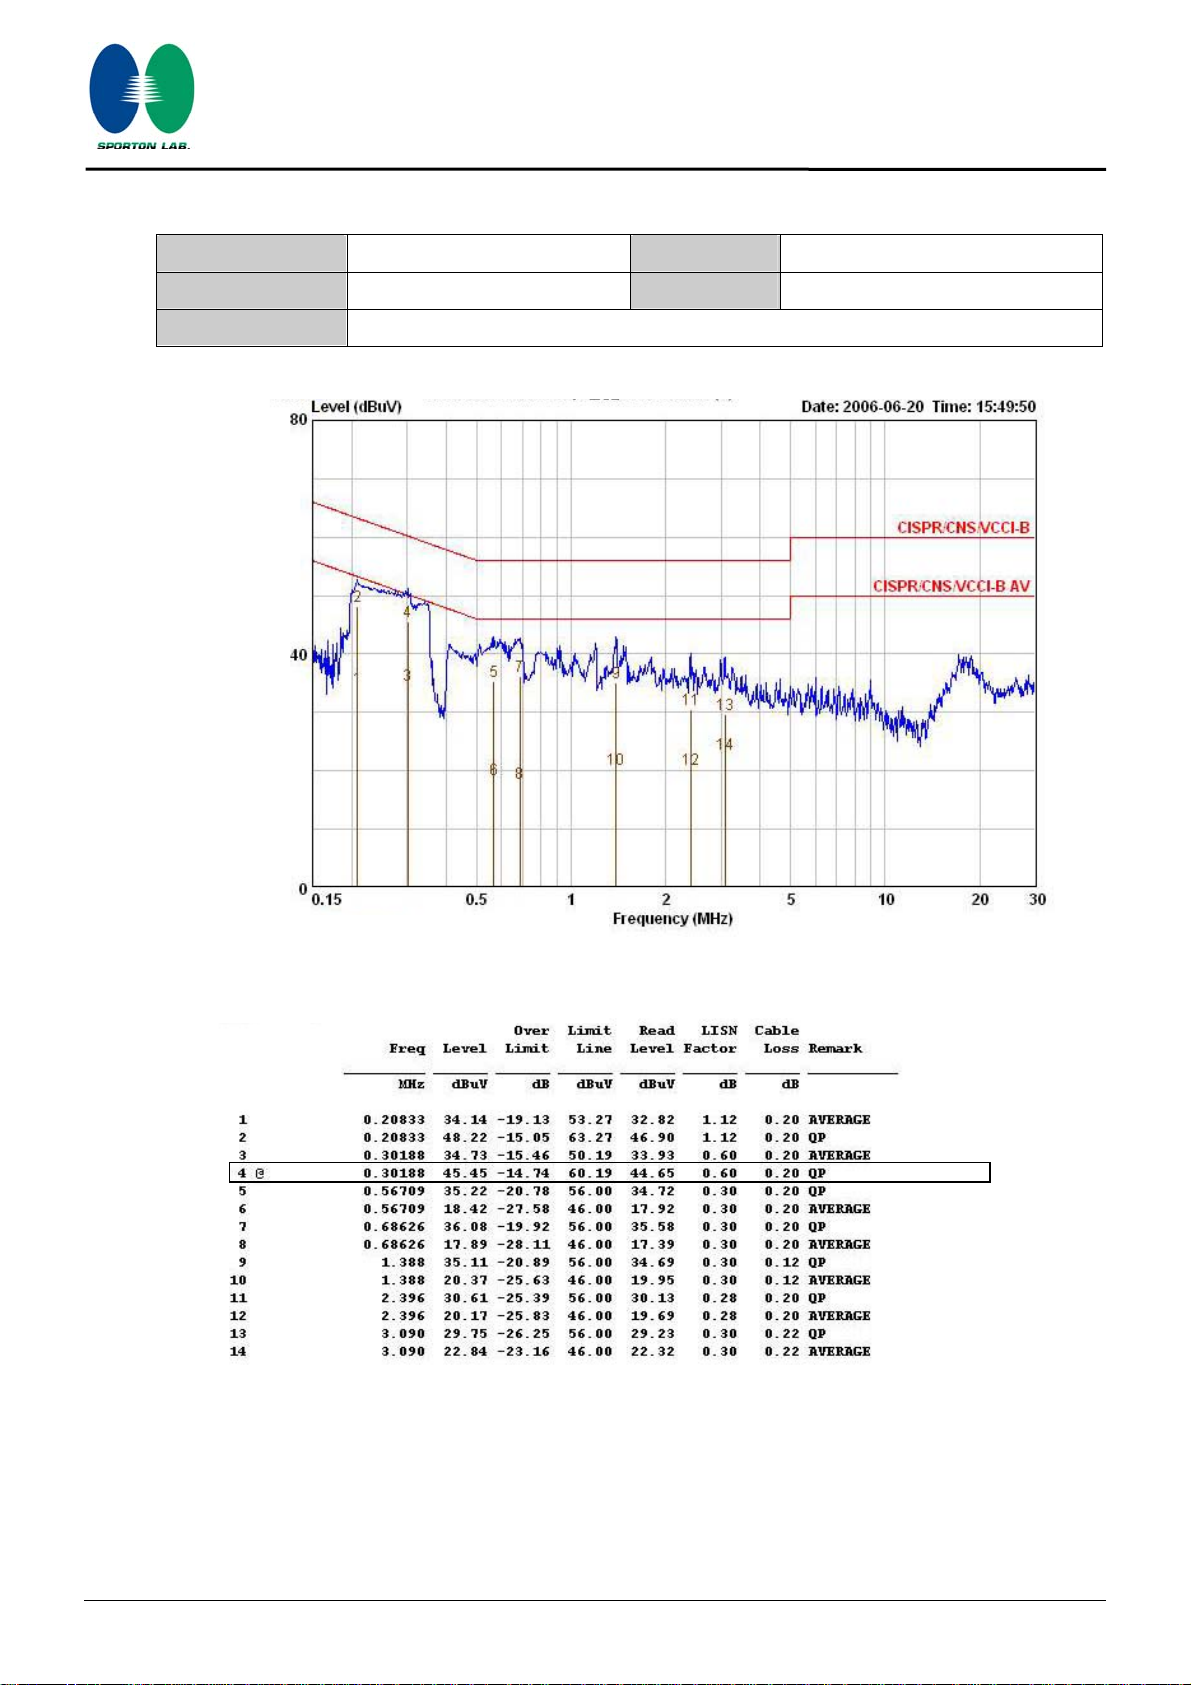
Report No.: FR660211
Temperature
26℃
Humidity 65%
Test Engineer Rush Kao Phase Neutral
Configuration Normal Link
Note:
Level = Read Level + LISN Factor + Cable Loss.
Report Format Version: RF-15.247-2006-6-16-e
FCC ID: M4Y-0XG880M Issued Date : Jun. 30, 2006
Page No. :
12 of 53
Page 16
4.2. Maximum Peak Output Power Measurement
4.2.1. Limit
For systems using digital modulation in the 2400-2483.5MHz, the limit for peak output power is 30dBm.
The limited has to be reduced by the amount in dB that the gain of the antenna exceed 6dBi. In case of
point-to-point operation, the limit has to be reduced by 1dB for every 3dB that the directional gain of the
antenna exceeds 6dBi.
4.2.2. Measuring Instruments and Setting
Please refer to section 5 in this report. The following table is the setting of the power meter.
Power Meter Parameter Setting
Filter No. Auto
Report No.: FR660211
Measurement time 0.135 s ~ 26 s
Used Peak Sensor NRV-Z32 (model 04)
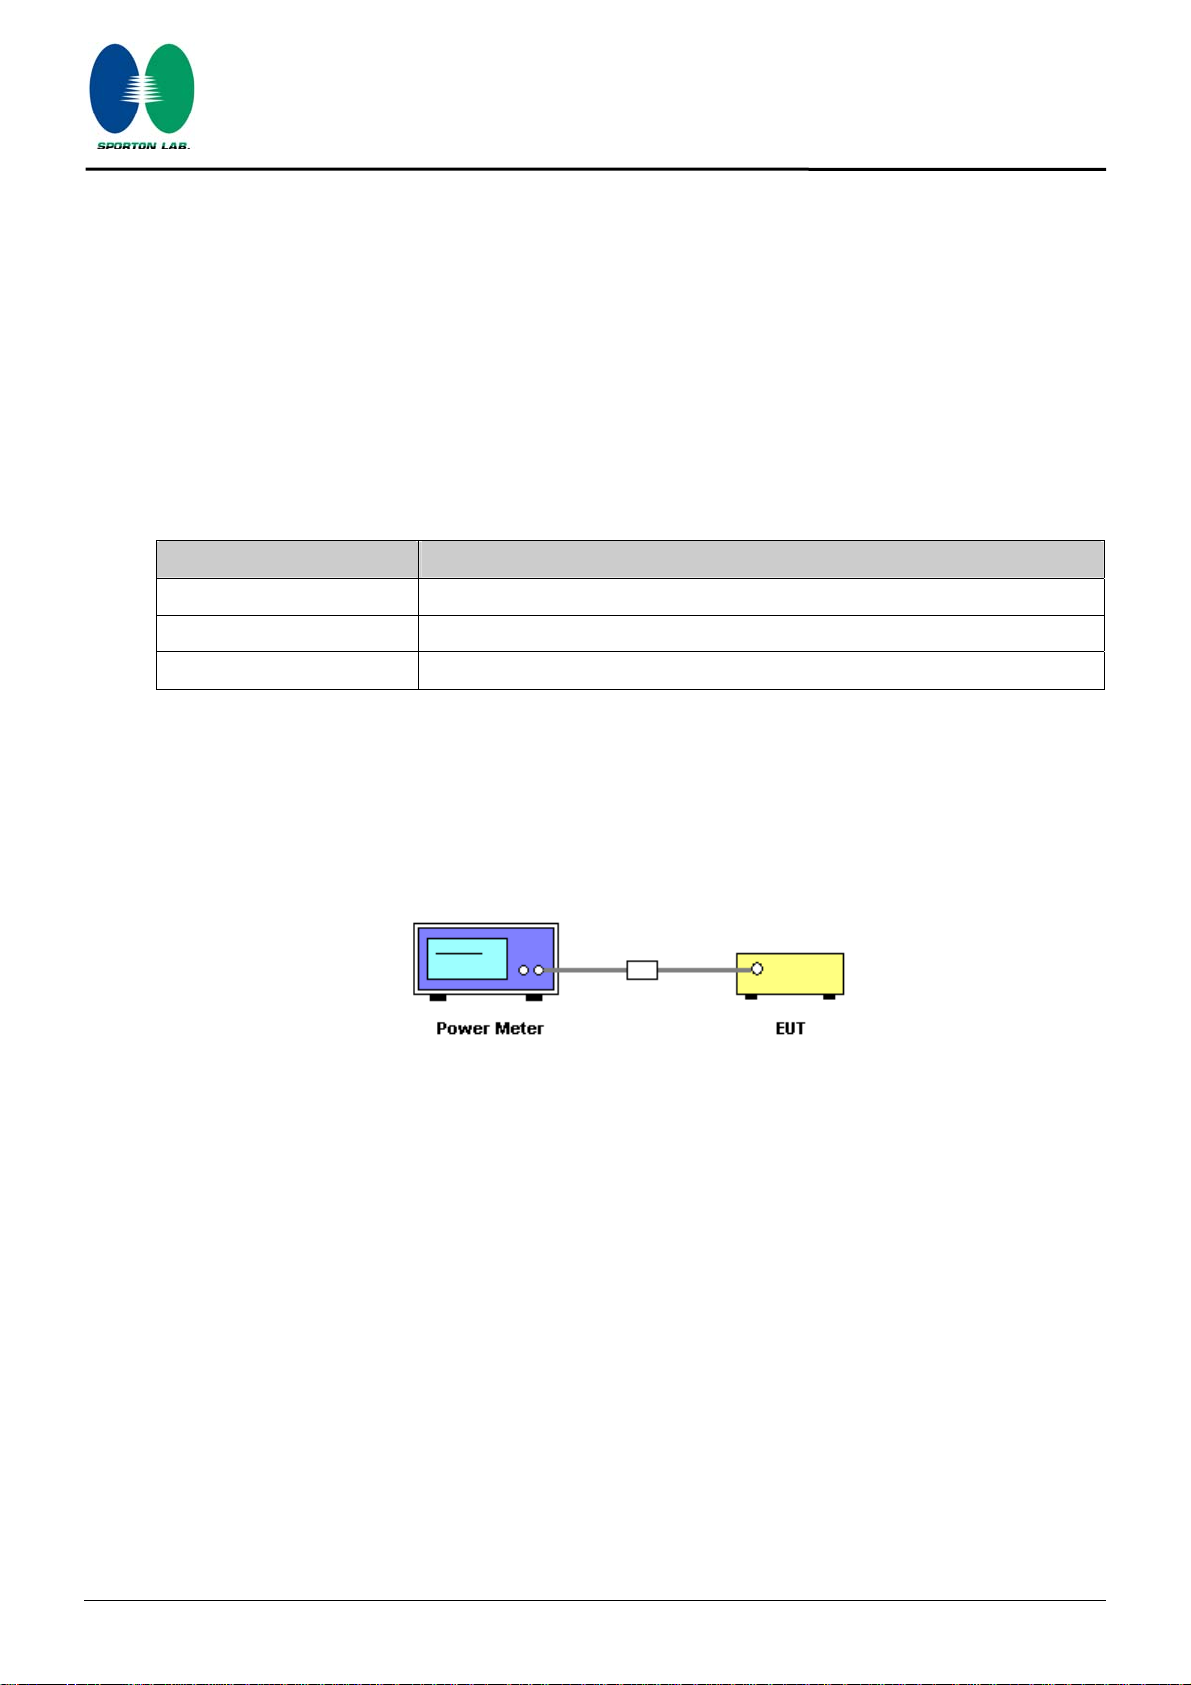
4.2.3. Test Procedures
1. The transmitter output (antenna port) was connected to the power meter.
2. Turn on the EUT and power meter and then record the peak power value.
3. Repeat above procedures on all channels needed to be tested.
4.2.4. Test Setup Layout
4.2.5. Test Deviation
There is no deviation with the original standard.
4.2.6. EUT Operation during Test
The EUT was programmed to be in continuously transmitting mode.
Report Format Version: RF-15.247-2006-6-16-e
FCC ID: M4Y-0XG880M Issued Date : Jun. 30, 2006
Page No. :
13 of 53
Page 17
4.2.7. Test Result of Maximum Peak Output Power
Report No.: FR660211
Temperature
26℃
Humidity 65%
Test Engineer Rush Kao Configurations 802.11b/g
Configuration IEEE 802.11b
Channel Frequency
Conducted Power
(dBm)
Max. Limit
(dBm)
1 2412 MHz 15.44 30.00 Complies
6 2437 MHz
15.24
30.00 Complies
11 2462 MHz 15.02 30.00 Complies
Configuration IEEE 802.11g
Channel Frequency
Conducted Power
(dBm)
Max. Limit
(dBm)
1 2412 MHz 17.66 30.00 Complies
6 2437 MHz
17.71
30.00 Complies
11 2462 MHz 17.75 30.00 Complies
Result
Result
Report Format Version: RF-15.247-2006-6-16-e
FCC ID: M4Y-0XG880M Issued Date : Jun. 30, 2006
Page No. :
14 of 53
Page 18

4.3. Power Spectral Density Measurement
4.3.1. Limit
For digitally modulated systems, the power spectral density conducted from the intentional radiator to
the antenna shall not be greater than 8 dBm in any 3 kHz band during any time interval of continuous
transmission.
4.3.2. Measuring Instruments and Setting
Please refer to section 5 in this report. The following table is the setting of Spectrum Analyzer.
Spectrum Parameter Setting
Attenuation Auto
Span Frequency 1.5MHz
Report No.: FR660211
RB 3 kHz
VB 30 kHz
Detector Peak
Trace Max Hold
Sweep Time 500s
4.3.3. Test Procedures
1. The transmitter output (antenna port) was connected to the spectrum analyser.
2. Set RBW of spectrum analyzer to 3kHz and VBW to 30kHz. Set Detector to Peak, Trace to Max Hold.
3. Mark the frequency with maximum peak power as the center of the display of the spectrum.
4. Set the span to 1.5MHz and the sweep time to 500s and record the maximum peak value.
4.3.4. Test Setup Layout
4.3.5. Test Deviation
There is no deviation with the original standard.
Report Format Version: RF-15.247-2006-6-16-e
FCC ID: M4Y-0XG880M Issued Date : Jun. 30, 2006
Page No. :
15 of 53
Page 19

4.3.6. EUT Operation during Test
The EUT was programmed to be in continuously transmitting mode.
4.3.7. Test Result of Power Spectral Density
Report No.: FR660211
Temperature
26℃
Humidity 65%
Test Engineer Rush Kao Configurations 802.11b/g
Configuration IEEE 802.11b
Channel Frequency
Power Density
(dBm)
Max. Limit
(dBm)
1 2412 MHz -12.17 8.00 Complies
6 2437 MHz -11.13 8.00 Complies
11 2462 MHz -10.97 8.00 Complies
Configuration IEEE 802.11g
Channel Frequency
Power Density
(dBm)
Max. Limit
(dBm)
1 2412 MHz -14.73 8.00 Complies
6 2437 MHz -15.03 8.00 Complies
11 2462 MHz -13.38 8.00 Complies
Result
Result
Report Format Version: RF-15.247-2006-6-16-e
FCC ID: M4Y-0XG880M Issued Date : Jun. 30, 2006
Page No. :
16 of 53
Page 20

K
1
2.410302885GH
K
2.436259615GH
Report No.: FR660211
Power Density Plot on Configuration IEEE 802.11b / 2412 MHz
*
1 P
VIEW
Ref 20 dBm
20
10
0
-10
-20
-30
-40
-50
*
Att 30 dB
RBW 3 kHz
*
VBW 30 kHz
*
SWT 500 s
Marker 1 [T1 ]
-12.17 dBm
z
*
A
-60
-70
-80
Center 2.410240385 GHz Span 1.5 MHz150 kHz/
Date: 20.JUN.2006 10:05:24
Power Density Plot on Configuration IEEE 802.11b / 2437 MHz
*
RBW 3 kHz
*
VBW 30 kHz
*
SWT 500 s
1
1 P
VIEW
Ref 20 dBm
20
10
0
-10
-20
-30
-40
-50
*
Att 30 dB
Marker 1 [T1 ]
-11.13 dBm
z
*
A
-60
-70
-80
Center 2.435995192 GHz Span 1.5 MHz150 kHz/
Date: 20.JUN.2006 10:08:25
Report Format Version: RF-15.247-2006-6-16-e
FCC ID: M4Y-0XG880M Issued Date : Jun. 30, 2006
Page No. :
17 of 53
Page 21

K
2.462995192GH
K
2.415439103GH
Report No.: FR660211
Power Density Plot on Configuration IEEE 802.11b / 2462 MHz
*
1 P
VIEW
Ref 20 dBm
20
10
0
-10
-20
-30
-40
-50
*
Att 30 dB
RBW 3 kHz
*
VBW 30 kHz
*
SWT 500 s
Marker 1 [T1 ]
-10.97 dBm
1
z
*
A
-60
-70
-80
Center 2.462596154 GHz Span 1.5 MHz150 kHz/
Date: 20.JUN.2006 10:10:40
Power Density Plot on Configuration IEEE 802.11g / 2412 MHz
*
RBW 3 kHz
*
VBW 30 kHz
*
SWT 500 s
1 P
VIEW
Ref 20 dBm
20
10
0
-10
-20
-30
-40
-50
*
Att 30 dB
1
Marker 1 [T1 ]
-14.73 dBm
z
*
A
-60
-70
-80
Center 2.415763622 GHz Span 1.5 MHz150 kHz/
Date: 20.JUN.2006 09:55:14
Report Format Version: RF-15.247-2006-6-16-e
FCC ID: M4Y-0XG880M Issued Date : Jun. 30, 2006
Page No. :
18 of 53
Page 22

K
2.441060897GH
K
2.464468750GH
Report No.: FR660211
Power Density Plot on Configuration IEEE 802.11g / 2437 MHz
*
1 P
VIEW
Ref 20 dBm
20
10
0
*
Att 30 dB
RBW 3 kHz
*
VBW 30 kHz
*
SWT 500 s
Marker 1 [T1 ]
-15.03 dBm
z
*
A
-10
-20
-30
-40
-50
-60
-70
-80
Center 2.44043109 GHz Span 1.5 MHz150 kHz/
Date: 20.JUN.2006 09:58:17
Power Density Plot on Configuration IEEE 802.11g / 2462 MHz
*
RBW 3 kHz
*
VBW 30 kHz
*
SWT 500 s
1 P
VIEW
Ref 20 dBm
20
10
0
*
Att 30 dB
1
Marker 1 [T1 ]
-13.38 dBm
z
*
A
-10
-20
-30
-40
-50
-60
-70
-80
Center 2.463855769 GHz Span 1.5 MHz150 kHz/
Date: 20.JUN.2006 10:00:30
1
Report Format Version: RF-15.247-2006-6-16-e
FCC ID: M4Y-0XG880M Issued Date : Jun. 30, 2006
Page No. :
19 of 53
Page 23

4.4. 6dB Spectrum Bandwidth Measurement
4.4.1. Limit
For digital modulation systems, the minimum 6 dB bandwidth shall be at least 500 kHz.
4.4.2. Measuring Instruments and Setting
Please refer to section 5 in this report. The following table is the setting of the Spectrum Analyzer.
Spectrum Parameters Setting
Attenuation Auto
Span Frequency > 6dB Bandwidth
RB 100 kHz
VB 100 kHz
Report No.: FR660211
Detector Peak
Trace Max Hold
Sweep Time Auto
4.4.3. Test Procedures
1. The transmitter output (antenna port) was connected to the spectrum analyser in peak hold mode.
2. The resolution bandwidth of 100 kHz and the video bandwidth of 100 kHz were used.
3. Measured the spectrum width with power higher than 6dB below carrier.
4.4.4. Test Setup Layout
Report Format Version: RF-15.247-2006-6-16-e
FCC ID: M4Y-0XG880M Issued Date : Jun. 30, 2006
Page No. :
20 of 53
Page 24

4.4.5. Test Deviation
There is no deviation with the original standard.
4.4.6. EUT Operation during Test
The EUT was programmed to be in continuously transmitting mode.
4.4.7. Test Result of 6dB Spectrum Bandwidth
Report No.: FR660211
Temperature
26℃
Humidity 65%
Test Engineer Rush Kao Configurations 802.11b/g
Configuration IEEE 802.11b
99% Occupied
Bandwidth
(MHz)
Min. Limit
(kHz)
Channel Frequency
6dB Bandwidth
(MHz)
1 2412 MHz 9.80 13.81 500 Complies
6 2437 MHz 9.58 13.87 500 Complies
11 2462 MHz 10.00 13.91 500 Complies
Configuration IEEE 802.11g
99% Occupied
Bandwidth
(MHz)
Min. Limit
(kHz)
Channel Frequency
6dB Bandwidth
(MHz)
1 2412 MHz 16.34 16.44 500 Complies
6 2437 MHz 16.34 16.44 500 Complies
Test Result
Test Result
11 2462 MHz 16.31 16.44 500 Complies
Report Format Version: RF-15.247-2006-6-16-e
FCC ID: M4Y-0XG880M Issued Date : Jun. 30, 2006
Page No. :
21 of 53
Page 25

K
1
9.807692308MH
-12.74d
Bm2.405108974GH
Temp2[T1OBW
]
-12.70d
B
2.418923077GH
K
9.583333333MH
-8.53dB
2.430012821GH
Temp2[T1OBW]-12.53d
B
2.443891026GH
Report No.: FR660211
6 dB Bandwidth Plot on Configuration IEEE 802.11b / 2412 MHz
*
1 P
VIEW
Ref 20 dBm
20
10
D1 2.71 dBm
0
-10
-20
-30
-40
-50
1
D2 -3.29 dBm
T1
*
Att 30 dB
RBW 100 kHz
*
VBW 100 kHz
SWT 10 ms
Delta 1 [T1 ]
1.34 dB
OBW 13.814102564 MHz
Marker 1 [T1 ]
-4.57 dBm
2.407224359 GHz
Temp 1 [T1 OBW]
T2
z
A
z
m
z
-60
-70
-80
Center 2.412 GHz Span 20 MHz2 MHz/
F1
Date: 20.JUN.2006 10:04:18
6 dB Bandwidth Plot on Configuration IEEE 802.11b / 2437 MHz
*
RBW 100 kHz
*
VBW 100 kHz
SWT 10 ms
1
1 P
VIEW
Ref 20 dBm
20
10
D1 3.11 dBm
0
-10
-20
-30
-40
-50
1
D2 -2.89 dBm
T1
*
Att 30 dB
F2
Delta 1 [T1 ]
-0.81 dB
OBW 13.878205128 MHz
Marker 1 [T1 ]
-2.06 dBm
2.432032051 GHz
Temp 1 [T1 OBW]
T2
z
A
m
z
m
z
-60
-70
-80
Center 2.437 GHz Span 20 MHz2 MHz/
F1
F2
Date: 20.JUN.2006 10:07:22
Report Format Version: RF-15.247-2006-6-16-e
FCC ID: M4Y-0XG880M Issued Date : Jun. 30, 2006
Page No. :
22 of 53
Page 26

K
1
10.000000000M
H
-10.06d
Bm2.455044872GHzT2Temp2[T1OBW
]
-12.03d
B
2.468955128GH
K
16.346153846M
H
-6.23dB
2.403794872GHzT
2
Temp2[T1OBW]-6.63dB
2.420237179GH
Report No.: FR660211
6 dB Bandwidth Plot on Configuration IEEE 802.11b / 2462 MHz
*
1 P
VIEW
Ref 20 dBm
20
10
D1 2.53 dBm
0
-10
-20
-30
-40
-50
1
D2 -3.47 dBm
T1
*
Att 30 dB
RBW 100 kHz
*
VBW 100 kHz
SWT 10 ms
Delta 1 [T1 ]
-2.08 dB
OBW 13.910256410 MHz
Marker 1 [T1 ]
-1.04 dBm
2.457000000 GHz
Temp 1 [T1 OBW]
z
A
m
z
-60
-70
-80
Center 2.462 GHz Span 20 MHz2 MHz/
F1
Date: 20.JUN.2006 10:09:40
6 dB Bandwidth Plot on Configuration IEEE 802.11g / 2412 MHz
*
RBW 100 kHz
*
VBW 100 kHz
SWT 10 ms
1 P
VIEW
Ref 20 dBm
20
10
D1 1.09 dBm
0
1
T1
-10
-20
-30
-40
-50
D2 -4.91 dBm
*
Att 30 dB
F2
Delta 1 [T1 ]
0.61 dB
OBW 16.442307692 MHz
Marker 1 [T1 ]
-4.44 dBm
2.403826923 GHz
Temp 1 [T1 OBW]
1
z
A
m
m
z
-60
-70
F1
-80
Center 2.412 GHz Span 20 MHz2 MHz/
F2
Date: 20.JUN.2006 09:54:12
Report Format Version: RF-15.247-2006-6-16-e
FCC ID: M4Y-0XG880M Issued Date : Jun. 30, 2006
Page No. :
23 of 53
Page 27

K
16.346153846M
H
-6.07dBm2.428794872GHzT2Temp2[T1OBW
]
-6.99dB
2.445237179GH
K
1
16.314102564M
H
-6.12dB
2.453794872GHzT
2
Temp2[T1OBW]-6.61dB
2.470237179GH
Report No.: FR660211
6 dB Bandwidth Plot on Configuration IEEE 802.11g / 2437 MHz
*
1 P
VIEW
Ref 20 dBm
20
10
D1 1.47 dBm
0
1
T1
-10
-20
-30
-40
-50
D2 -4.53 dBm
*
Att 30 dB
RBW 100 kHz
*
VBW 100 kHz
SWT 10 ms
Delta 1 [T1 ]
0.10 dB
OBW 16.442307692 MHz
Marker 1 [T1 ]
-4.16 dBm
2.428858974 GHz
Temp 1 [T1 OBW]
1
z
A
m
z
-60
-70
F1
-80
Center 2.437 GHz Span 20 MHz2 MHz/
Date: 20.JUN.2006 09:57:28
6 dB Bandwidth Plot on Configuration IEEE 802.11g / 2462 MHz
*
RBW 100 kHz
*
VBW 100 kHz
SWT 10 ms
1 P
VIEW
Ref 20 dBm
20
10
D1 1.49 dBm
0
1
T1
-10
-20
-30
-40
-50
D2 -4.51 dBm
*
Att 30 dB
F2
Delta 1 [T1 ]
0.91 dB
OBW 16.442307692 MHz
Marker 1 [T1 ]
-4.34 dBm
2.453858974 GHz
Temp 1 [T1 OBW]
z
A
m
m
z
-60
-70
F1
-80
Center 2.462 GHz Span 20 MHz2 MHz/
F2
Date: 20.JUN.2006 09:59:35
Report Format Version: RF-15.247-2006-6-16-e
FCC ID: M4Y-0XG880M Issued Date : Jun. 30, 2006
Page No. :
24 of 53
Page 28

4.5. Radiated Emissions Measurement
4.5.1. Limit
20dBc in any 100 kHz bandwidth outside the operating frequency band. In case the emission fall within
the restricted band specified on 15.205(a), then the 15.209(a) limit in the table below has to be
followed.
Report No.: FR660211
Frequencies
(MHz)
0.009~0.490 2400/F(KHz) 300
0.490~1.705 24000/F(KHz) 30
1.705~30.0 30 30
30~88 100 3
88~216 150 3
216~960 200 3
Above 960 500 3
4.5.2. Measuring Instruments and Setting
Please refer to section 5 in this report. The following table is the setting of spectrum analyzer and
receiver.
Spectrum Parameter Setting
Attenuation Auto
Start Frequency 1000 MHz
Stop Frequency 10th carrier harmonic
Field Strength
(micorvolts/meter)
Measurement Distance
(meters)
RB / VB (emission in restricted band) 1MHz / 1MHz for Peak, 1 MHz / 10Hz for Average
RB / VB (other emission) 100KHz / 100KHz for peak
Receiver Parameter Setting
Attenuation Auto
Start ~ Stop Frequency 9kHz~150kHz / RB 200Hz for QP
Start ~ Stop Frequency 150kHz~30MHz / RB 9kHz for QP
Start ~ Stop Frequency 30MHz~1000MHz / RB 120kHz for QP
Report Format Version: RF-15.247-2006-6-16-e
FCC ID: M4Y-0XG880M Issued Date : Jun. 30, 2006
Page No. :
25 of 53
Page 29

4.5.3. Test Procedures
1. Configure the EUT according to ANSI C63.4. The EUT was placed on the top of the turntable 0.8
meter above ground. The phase center of the receiving antenna mounted on the top of a
height-variable antenna tower was placed 3 meters far away from the turntable.
2. Power on the EUT and all the supporting units. The turntable was rotated by 360 degrees to
determine the position of the highest radiation.
3. The height of the broadband receiving antenna was varied between one meter and four meters
above ground to find the maximum emissions field strength of both horizontal and vertical
polarization.
4. For each suspected emissions, the antenna tower was scan (from 1 M to 4 M) and then the turntable
was rotated (from 0 degree to 360 degrees) to find the maximum reading.
Report No.: FR660211
5. Set the test-receiver system to Peak or CISPR quasi-peak Detect Function with specified bandwidth
under Maximum Hold Mode.
6. For emissions above 1GHz, use 1MHz VBW and RBW for peak reading. Then 1MHz RBW and 10Hz VBW
for average reading in spectrum analyzer.
7. When the radiated emissions limits are expressed in terms of the average value of the emissions, and
pulsed operation is employed, the measurement field strength shall be determined by averaging
over one complete pulse train, including blanking intervals, as long as the pulse train does not
exceed 0.1 seconds. As an alternative (provided the transmitter operates for longer than 0.1
seconds) or in cases where the pulse train exceeds 0.1 seconds, the measured field strength shall
be determined from the average absolute voltage during a 0.1 second interval during which the
field strength is at its maximum value.
8. If the emissions level of the EUT in peak mode was 3 dB lower than the average limit specified, then
testing will be stopped and peak values of EUT will be reported, otherwise, the emissions which do
not have 3 dB margin will be repeated one by one using the quasi-peak method for below 1GHz.
9. For testing above 1GHz, the emissions level of the EUT in peak mode was lower than average limit
(that means the emissions level in peak mode also complies with the limit in average mode), then
testing will be stopped and peak values of EUT will be reported, otherwise, the emissions will be
measured in average mode again and reported.
10. In case the emission is lower than 30MHz, loop antenna has to be used for measurement and the
recorded data should be QP measured by receiver. High – Low scan is not required in this case.
Report Format Version: RF-15.247-2006-6-16-e
FCC ID: M4Y-0XG880M Issued Date : Jun. 30, 2006
Page No. :
26 of 53
Page 30

4.5.4. Test Setup Layout
For radiated emissions below 30MHz
Report No.: FR660211
For radiated emissions above 30MHz
3 or 1m
Above 10 GHz shall be extrapolated to the specified distance using an extrapolation factor of 20
dB/decade form 3m to 1m.
Distance extrapolation factor = 20 log (specific distanc [3m] / test distance [1m]) (dB);
Limit line = specific limits (dBuV) + distance extrapolation factor [9.54 dB].
4.5.5. Test Deviation
There is no deviation with the original standard.
4.5.6. EUT Operation during Test
The EUT was programmed to be in continuously transmitting mode.
Report Format Version: RF-15.247-2006-6-16-e
FCC ID: M4Y-0XG880M Issued Date : Jun. 30, 2006
Page No. :
27 of 53
Page 31

4.5.7. Results of Radiated Emissions (9kHz~30MHz)
Report No.: FR660211
Temperature
26℃
Humidity 65%
Test Engineer Jordan Hsiao Configurations 802.11g Channel 6
Freq. Level Over Limit Limit Line Remark
(MHz) (dBuV) (dB) (dBuV)
- - - - See Note
Note:
The amplitude of spurious emissions which are attenuated by more than 20 dB below the permissible
value has no need to be reported.
Distance extrapolation factor = 40 log (specific distance / test distance) (dB);
Limit line = specific limits (dBuV) + distance extrapolation factor.
Report Format Version: RF-15.247-2006-6-16-e
FCC ID: M4Y-0XG880M Issued Date : Jun. 30, 2006
Page No. :
28 of 53
Page 32

4.5.8. Results of Radiated Emissions (30MHz~1GHz)
Report No.: FR660211
Temperature
26℃
Humidity 65%
Test Engineer Jordan Hsiao Configurations 802.11g Channel 6
Vertical
Report Format Version: RF-15.247-2006-6-16-e
FCC ID: M4Y-0XG880M Issued Date : Jun. 30, 2006
Page No. :
29 of 53
Page 33

Report No.: FR660211
Horizontal
Note:
The amplitude of spurious emissions which are attenuated by more than 20 dB below the permissible
value has no need to be reported.
Emission level (dBuV/m) = 20 log Emission level (uV/m).
Corrected Reading: Antenna Factor + Cable Loss + Read Level - Preamp Factor = Level.
Pol. : V is Vertical Polarization ; H is Horizontal Polarization.
Report Format Version: RF-15.247-2006-6-16-e
FCC ID: M4Y-0XG880M Issued Date : Jun. 30, 2006
Page No. :
30 of 53
Page 34

4.5.9. Results for Radiated Emissions (1GHz~10th Harmonic)
Report No.: FR660211
Temperature
26℃
Humidity 65%
Test Engineer Jordan Hsiao Configurations 802.11b Channel 1
Vertical
Report Format Version: RF-15.247-2006-6-16-e
FCC ID: M4Y-0XG880M Issued Date : Jun. 30, 2006
Page No. :
31 of 53
Page 35

Report No.: FR660211
Horizontal
Report Format Version: RF-15.247-2006-6-16-e
FCC ID: M4Y-0XG880M Issued Date : Jun. 30, 2006
Page No. :
32 of 53
Page 36

Report No.: FR660211
Temperature
26℃
Humidity 65%
Test Engineer Jordan Hsiao Configurations 802.11b Channel 6
Vertical
Report Format Version: RF-15.247-2006-6-16-e
FCC ID: M4Y-0XG880M Issued Date : Jun. 30, 2006
Page No. :
33 of 53
Page 37

Report No.: FR660211
Horizontal
Report Format Version: RF-15.247-2006-6-16-e
FCC ID: M4Y-0XG880M Issued Date : Jun. 30, 2006
Page No. :
34 of 53
Page 38

Report No.: FR660211
Temperature
26℃
Humidity 65%
Test Engineer Jordan Hsiao Configurations 802.11b Channel 11
Vertical
Report Format Version: RF-15.247-2006-6-16-e
FCC ID: M4Y-0XG880M Issued Date : Jun. 30, 2006
Page No. :
35 of 53
Page 39

Report No.: FR660211
Horizontal
Report Format Version: RF-15.247-2006-6-16-e
FCC ID: M4Y-0XG880M Issued Date : Jun. 30, 2006
Page No. :
36 of 53
Page 40

Report No.: FR660211
Temperature
26℃
Humidity 65%
Test Engineer Jordan Hsiao Configurations 802.11g Channel 1
Vertical
Report Format Version: RF-15.247-2006-6-16-e
FCC ID: M4Y-0XG880M Issued Date : Jun. 30, 2006
Page No. :
37 of 53
Page 41

Report No.: FR660211
Horizontal
Report Format Version: RF-15.247-2006-6-16-e
FCC ID: M4Y-0XG880M Issued Date : Jun. 30, 2006
Page No. :
38 of 53
Page 42

Report No.: FR660211
Temperature
26℃
Humidity 65%
Test Engineer Jordan Hsiao Configurations 802.11g Channel 6
Vertical
Report Format Version: RF-15.247-2006-6-16-e
FCC ID: M4Y-0XG880M Issued Date : Jun. 30, 2006
Page No. :
39 of 53
Page 43

Report No.: FR660211
Horizontal
Report Format Version: RF-15.247-2006-6-16-e
FCC ID: M4Y-0XG880M Issued Date : Jun. 30, 2006
Page No. :
40 of 53
Page 44

Report No.: FR660211
Temperature
26℃
Humidity 65%
Test Engineer Jordan Hsiao Configurations 802.11g Channel 11
Vertical
Report Format Version: RF-15.247-2006-6-16-e
FCC ID: M4Y-0XG880M Issued Date : Jun. 30, 2006
Page No. :
41 of 53
Page 45

Report No.: FR660211
Horizontal
Note:
The amplitude of spurious emissions which are attenuated by more than 20 dB below the permissible
value has no need to be reported.
Emission level (dBuV/m) = 20 log Emission level (uV/m).
Corrected Reading: Antenna Factor + Cable Loss + Read Level - Preamp Factor = Level.
Pol. : V is Vertical Polarization ; H is Horizontal Polarization.
Report Format Version: RF-15.247-2006-6-16-e
FCC ID: M4Y-0XG880M Issued Date : Jun. 30, 2006
Page No. :
42 of 53
Page 46

4.6. Band Edge Emissions Measurement
4.6.1. Limit
20dBc in any 100 kHz bandwidth outside the operating frequency band. In case the emission fall within
the restricted band specified on 15.205(a), then the 15.209(a) limit in the table below has to be followed.
Report No.: FR660211
Frequencies
(MHz)
0.009~0.490 2400/F(KHz) 300
0.490~1.705 24000/F(KHz) 30
1.705~30.0 30 30
30~88 100 3
88~216 150 3
216~960 200 3
Above 960 500 3
4.6.2. Measuring Instruments and Setting
Please refer to section 5 in this report. The following table is the setting of the spectrum analyzer.
Spectrum Parameter Setting
Attenuation Auto
Span Frequency 100 MHz
RB / VB (emission in restricted band) 1MHz / 1MHz for Peak, 1 MHz / 10Hz for Average
RB / VB (other emission) 100 KHz /100 KHz for Peak
Field Strength
(micorvolts/meter)
Measurement Distance
(meters)
4.6.3. Test Procedures
1. The test procedure is the same as section 4.5.3, only the freqeuncy range investigated is limited to
100MHz around bandedges.
2. In case the emission is fail due to the used RB/VB is too wide, marker-delta method of FCC Public
Notice DA00-705 will be followed.
4.6.4. Test Setup Layout
This test setup layout is the same as that shown in section 4.5.4.
4.6.5. Test Deviation
There is no deviation with the original standard.
4.6.6. EUT Operation during Test
The EUT was programmed to be in continuously transmitting mode.
Report Format Version: RF-15.247-2006-6-16-e
FCC ID: M4Y-0XG880M Issued Date : Jun. 30, 2006
Page No. :
43 of 53
Page 47

4.6.7. Test Result of Band Edge and Fundamental Emissions
Report No.: FR660211
Temperature
26℃
Humidity 65%
Test Engineer Jordan Hsiao Configurations 802.11b Channel 1, 11
Channel 1
Item 3, 4 are the fundamental frequency at 2412 MHz.
Report Format Version: RF-15.247-2006-6-16-e
FCC ID: M4Y-0XG880M Issued Date : Jun. 30, 2006
Page No. :
44 of 53
Page 48

Report No.: FR660211
Channel 11
Item 1, 2 are the fundamental frequency at 2462 MHz.
Report Format Version: RF-15.247-2006-6-16-e
FCC ID: M4Y-0XG880M Issued Date : Jun. 30, 2006
Page No. :
45 of 53
Page 49

Report No.: FR660211
Temperature
26℃
Humidity 65%
Test Engineer Jordan Hsiao Configurations 802.11g Channel 1, 11
Channel 1
Item 3, 4 are the fundamental frequency at 2412 MHz.
Report Format Version: RF-15.247-2006-6-16-e
FCC ID: M4Y-0XG880M Issued Date : Jun. 30, 2006
Page No. :
46 of 53
Page 50

Report No.: FR660211
Channel 11
Item 1, 2 are the fundamental frequency at 2462 MHz.
Note:
Emission level (dBuV/m) = 20 log Emission level (uV/m).
Corrected Reading: Antenna Factor + Cable Loss + Read Level - Preamp Factor = Level.
Receiving maximum band edge emissions are Vertical Polarization.
Report Format Version: RF-15.247-2006-6-16-e
FCC ID: M4Y-0XG880M Issued Date : Jun. 30, 2006
Page No. :
47 of 53
Page 51

K
1
39.490384615M
H
K
1
-32.692307692MH
Report No.: FR660211
For Emission not in Restricted Band
Low Band Edge Plot on Configuration IEEE 802.11b / 2412 MHz
*
1 P
VIEW
Ref 20 dBm
20
10
D1 4.06 dBm
0
-10
-20
-30
-40
-50
D2 -15.94 dBm
*
Att 30 dB
RBW 100 kHz
*
VBW 100 kHz
SWT 10 ms
Delta 1 [T1 ]
54.44 dB
Marker 1 [T1 ]
-50.38 dBm
2.373653846 GHz
1
z
A
-60
-70
-80
Center 2.373240385 GHz Span 100 MHz10 MHz/
Date: 20.JUN.2006 10:06:09
F1
High Band Edge Plot on Configuration IEEE 802.11b / 2462 MHz
*
1 P
VIEW
Ref 20 dBm
20
10
1
D1 3.92 dBm
0
-10
-20
-30
-40
-50
D2 -16.08 dBm
*
Att 30 dB
RBW 100 kHz
*
VBW 100 kHz
SWT 10 ms
Delta 1 [T1 ]
54.05 dB
Marker 1 [T1 ]
-50.14 dBm
2.495583333 GHz
F2
z
A
-60
-70
-80
Center 2.503596154 GHz Span 100 MHz10 MHz/
Date: 20.JUN.2006 10:11:30
F1
F2
Report Format Version: RF-15.247-2006-6-16-e
FCC ID: M4Y-0XG880M Issued Date : Jun. 30, 2006
Page No. :
48 of 53
Page 52

K
1
24.270032051M
H
K
-20.304487179MH
Report No.: FR660211
Low Band Edge Plot on Configuration IEEE 802.11g / 2412 MHz
*
1 P
VIEW
Ref 20 dBm
20
10
D1 1.58 dBm
0
-10
*
Att 30 dB
RBW 100 kHz
*
VBW 100 kHz
SWT 10 ms
Delta 1 [T1 ]
44.43 dB
Marker 1 [T1 ]
-42.85 dBm
2.389038462 GHz
z
A
-20
-30
-40
-50
-60
-70
-80
Center 2.372763622 GHz Span 100 MHz10 MHz/
Date: 20.JUN.2006 09:56:10
D2 -18.42 dBm
1
F1
High Band Edge Plot on Configuration IEEE 802.11g / 2462 MHz
*
1 P
VIEW
Ref 20 dBm
20
10
D1 1.65 dBm
0
-10
RBW 100 kHz
*
*
Att 30 dB
1
VBW 100 kHz
SWT 10 ms
Delta 1 [T1 ]
42.38 dB
Marker 1 [T1 ]
-40.73 dBm
2.483500000 GHz
F2
z
A
-20
-30
-40
-50
-60
-70
-80
Center 2.500855769 GHz Span 100 MHz10 MHz/
Date: 20.JUN.2006 10:01:19
D2 -18.35 dBm
1
F1
F2
Report Format Version: RF-15.247-2006-6-16-e
FCC ID: M4Y-0XG880M Issued Date : Jun. 30, 2006
Page No. :
49 of 53
Page 53

4.7. Antenna Requirements
4.7.1. Limit
Except for special regulations, the Low-power Radio-frequency Devices must not be equipped with any
jacket for installing an antenna with extension cable. An intentional radiator shall be designed to ensure
that no antenna other than that furnished by the responsible party shall be used with the device. The use
of a permanently attached antenna or of an antenna that uses a unique coupling to the intentional
radiator shall be considered sufficient to comply with the provisions of this Section. The manufacturer
may design the unit so that the user can replace a broken antenna, but the use of a standard antenna
jack or electrical connector is prohibited. Further, this requirement does not apply to intentional radiators
that must be professionally installed.
Report No.: FR660211
4.7.2. Antenna Connector Construction
Please refer to section 3.3 in this test report, all antenna connectors comply with the requirements.
Report Format Version: RF-15.247-2006-6-16-e
FCC ID: M4Y-0XG880M Issued Date : Jun. 30, 2006
Page No. :
50 of 53
Page 54

5. LIST OF MEASURING EQUIPMENTS
Report No.: FR660211
Instrument Manufacturer Model No. Serial No. Characteristics
3m Semi Anechoic
Chamber
Amplifier SCHAFFNER CPA9231A 3565 9 kHz - 2 GHz Jan. 18, 2006
Amplifier Agilent 8449B 3008A02120 1 GHz - 26.5 GHz May 29, 2006
Amplifier MITEQ AMF-6F-260400 923364 26.5 GHz - 40 GHz Jan. 24, 2006*
Spectrum
Analyzer
Biconical Antenna SCHWARZBECK VHBB 9124 301 30 MHz - 200 MHz Jul. 22, 2005
Log Antenna SCHWARZBECK VUSLP 9111 221 200 MHz - 1 GHz Jul. 22, 2005
Horn Antenna EMCO 3115
Horn Antenna SCHWARZBECK BBHA9170 BBHA9170154 15 GHz - 40 GHz NCR
RF Cable-R03m Jye Bao RG142 CB021 30 MHz - 1 GHz Dec.02, 2005
RF Cable-HIGH SUHNER SUCOFLEX 106 03CH03-HY 1 GHz - 40 GHz Dec.02, 2005
Turn Table HD DS 420 420/650/00 0 – 360 degree N/A
Antenna Mast HD MA 240 240/560/00 1 m - 4 m N/A
EMC Receiver R&S ESCS 30 100174 9kHz – 2.75GHz Feb. 22, 2006
LISN MessTec NNB-2/16Z 99079 9kHz – 30MHz Dec. 19, 2005
LISN
(Support Unit)
RF Cable-CON UTIFLEX 3102-26886-4 CB049 9kHz – 30MHz Apr. 20, 2006
EMI Filter LINDGREN LRE-2030 2651 < 450 Hz N/A
Spectrum analyzer R&S FSP30 100023 9kHz ~ 30GHz Nov. 26, 2005
Power meter R&S NRVS 100444 DC ~ 40GHz Jun,10,2006
Power sensor R&S NRV-Z55 100049 DC ~ 40GHz Jul. 06, 2005
Power Sensor R&S NRV-Z32 100057 30MHz ~ 6GHz Jun,10,2006
AC power source HPC HPA-500W HPA-9100024 AC 0 ~ 300V Apr. 21, 2005*
DC power source G.W. GPC-6030D C671845 DC 1V ~ 60V Dec. 28, 2005
Temp. and Humidity
Chamber
RF CABLE-1m Jye Bao RG142 CB034-1m 20MHz ~ 7GHz Dec. 30, 2005
SIDT FRANKONIA SAC-3M 03CH03-HY
R&S FSP40 100004/040 9 kHZ - 40 GHz Sep. 30, 2005
6903 1GHz ~ 18GHz Mar. 15, 2006
EMCO 3810/2NM 9708-1839 9kHz – 30MHz
KSON THS-C3L 612 N/A Oct. 01, 2005
30 MHz - 1 GHz
3m
Calibration
Date
Jun. 15, 2006
Mar. 18, 2006
Remark
Radiation
(03CH03-HY)
Radiation
(03CH03-HY)
Radiation
(03CH03-HY)
Radiation
(03CH03-HY)
Radiation
(03CH03-HY)
Radiation
(03CH03-HY)
Radiation
(03CH03-HY)
Radiation
(03CH03-HY)
Radiation
(03CH03-HY)
Radiation
(03CH03-HY)
Radiation
(03CH03-HY)
Radiation
(03CH03-HY)
Radiation
(03CH03-HY)
Conduction
(CO04-HY)
Conduction
(CO04-HY)
Conduction
(CO04-HY)
Conduction
(CO04-HY)
Conduction
(CO04-HY)
Conducted
(TH01-HY)
Conducted
(TH01-HY)
Conducted
(TH01-HY)
Conducted
(TH01-HY)
Conducted
(TH01-HY)
Conducted
(TH01-HY)
Conducted
(TH01-HY)
Conducted
(TH01-HY)
Report Format Version: RF-15.247-2006-6-16-e
FCC ID: M4Y-0XG880M Issued Date : Jun. 30, 2006
Page No. :
51 of 53
Page 55

Report No.: FR660211
Instrument Manufacturer Model No. Serial No. Characteristics
RF CABLE-2m Jye Bao RG142 CB035-2m 20MHz ~ 1GHz Dec. 30, 2005
Oscilloscope Tektronix TDS1012 CO38515 100MHz / 1GS/s Apr. 15, 2005*
Signal Generator R&S SMR40 100116 10MHz ~ 40GHz Dec. 30, 2005
Data Generator Tektronix DG2030 063-2920-50 0.1Hz~400MHz Jun. 16, 2006
Calibration
Date
Note: Calibration Interval of instruments listed above is one year.
Note: *Calibration Interval of instruments listed above is two year.
Remark
Conducted
(TH01-HY)
Conducted
(TH01-HY)
Conducted
(TH01-HY)
Conducted
(TH01-HY)
Report Format Version: RF-15.247-2006-6-16-e
FCC ID: M4Y-0XG880M Issued Date : Jun. 30, 2006
Page No. :
52 of 53
Page 56

Report No.: FR660211
6. SPORTON COMPANY PROFILE
SPORTON Lab. was established in 1986 with one shielded room: the first private EMI test facility, offering local
manufacturers an alternative EMI test familial apart from ERSO. In 1988, one 3M and 10M/3M open area test
site were setup and also obtained official accreditation from FCC, VCCI and NEMKO. In 1993, a Safety
laboratory was founded and obtained accreditation from UL of USA, CSA of Canada and TUV (Rhineland &
PS) of Germany. In 1995, one EMC lab, including EMI and EMS test facilities was setup. In 1997, SPORTON
Group has provided financial expense to relocate the headquarter to Orient Scientific Park in Taipei Hsien
to offer more comprehensive, more qualified and better service to local suppliers and manufactures. In
1999, Safety Group and Component Group were setup. In 2001, SPORTON has established 3M/10M
chamber in Hwa Ya Technology Park.
6.1. Test Location
SHIJR ADD : 6Fl., No. 106, Sec. 1, Shintai 5th Rd., Shijr City, Taipei, Taiwan 221, R.O.C.
TEL :
FAX :
HWA YA ADD : No. 52, Hwa Ya 1st Rd., Kwei-Shan Hsiang, Tao Yuan Hsien, Taiwan, R.O.C.
TEL :
FAX :
LINKOU ADD : No. 30-2, Dingfu Tsuen, Linkou Shiang, Taipei, Taiwan 244, R.O.C
TEL :
FAX :
DUNGHU ADD : No. 3, Lane 238, Kangle St., Neihu Chiu, Taipei, Taiwan 114, R.O.C.
TEL :
FAX :
JUNGHE ADD : 7Fl., No. 758, Jungjeng Rd., Junghe City, Taipei, Taiwan 235, R.O.C.
TEL :
FAX :
02-2696-2468
02-2696-2255
03-327-3456
03-318-0055
02-2601-1640
02-2601-1695
02-2631-4739
02-2631-9740
02-8227-2020
02-8227-2626
NEIHU ADD :
TEL :
FAX :
JHUBEI ADD :
TEL :
FAX :
Report Format Version: RF-15.247-2006-6-16-e
FCC ID: M4Y-0XG880M Issued Date : Jun. 30, 2006
4Fl., No. 339, Hsin Hu 2nd Rd., Taipei 114, Taiwan, R.O.C.
02-2794-8886
02-2794-9777
No.8, Lane 728, Bo-ai St., Jhubei City, Hsinchu County 302, Taiwan, R.O.C.
03-656-9065
03-656-9085
Page No. :
53 of 53
 Loading...