

Page 1
HPS
HIGH POWER SUBWOOFERS
User’s manual
1/6
Page 2

HPS
HIGH POWER SUBWOOFERS
User’s manual
CONTENTS
1. Introduction
2.
“λ”, directivity, combing
3. Combing and mutual pairing
4. Pairing with the environment
5. Hence, some pratical ideas...
6.
Examples and simulations with the X-Treme Installer
7. X-Treme Subwoofers: product catalogue
1. Introduction
This brief guide aims to take a closer look at some of the concepts
related to the features of subwoofers and to verify some of their
effects in the field, especially how they interact with one another
and with the environment. Software and trials carried out at Sound
Corporation’s metrological laboratory (see Figure 1) will be used to
confirm and add to these concepts. Although specific recommendations on the “cut” and “alignment” of subwoofers may be of primary
interest, they go beyond the scope of this study.
Our aim is to use a more informative approach to explain not only the
physical phenomena associated with subwoofers in the environment
where they are located, but also partly to explain them. Thus, our
aim is to think “upstream” to the installation and then compare the
suggested concepts with the acoustic measurements of an actual
installation.
For this purpose, we have to imagine a generic subwoofer model
resembling a “black box” (that is to say, forgetting about construction techniques) measuring roughly one metre per side and whose
acoustic pressure remains within a range of frequencies below 100
Hz, with basically omni directional emission: a sort of “monopole
source,” but with real dimensions.
Fig. 1 Metrological laboratory at Sound Corporation
2. “λ”, directivity, combing
All the acoustic specifications of a subwoofer (or “sw”) stem from
the size of the wavelength it produces, conventionally known as λ,
(lambda). Taking our definition of a sw, we can estimate that λ will be
no less than 3.4 m (the wavelength at a frequency of 100 Hz) and will
reach about 17 m (the wavelength at a frequency of 20 Hz ), if the
sw is capable of “dropping” down to the lower threshold of the audible spectrum (with regard to this point, it is worth recalling the first
golden rule of sound: v=λυ with υ=frequency and v=speed of sound,
namely about 340 m/s).
2/6
Page 3

User’s manual
Compared to the physical size of the sw, these λ values confirm its
very low directivity, already verified on our omni-directional model.
This will come about unless special techniques are used to “force”
the directionality of a sw, making it possible to optimise the direction
of the sound (as with the XTCARDIOID: a cardioid directivity subwoofer manufactured by X-Treme Audio).
Another phenomenon related to λ size is combing. Generally speaking, two sources that emit a specific frequency will create zones of
constructive and destructive combing: the two pressure contributions are “in phase” for the former, resulting in an increase in acoustic
pressure (the level of sound pressure resulting from two contributions
with equal amplitude and perfectly in phase is the same as that of the
single source + 6 dB). For the latter, the two contributions are “push-
pull”, leading to the cancelling out of the pressure (two contributions
of equal amplitude with perfect push-pull will cancel out one another:
-∞ dB). These two situations depend on the difference of the acous-
tic paths relating to the two sources at the point in question.
Combing does not generally create major problems at the mediumhigh end of the spectrum due to the fast spectral and spatial alternation of the phenomena of construction and cancellation; however its
effects can be significant with sw’s. In this case, the dimensions of
the combing “fringes” are macroscopic and, as such, can be perceived by the listener, who will note clear and undesirable changes in
the level of acoustic pressure when moving from one part of the area
of sound to another.
3. Combing and mutual pairing
Another phenomenon linked directly to the relationship between λ
and the distances involved is pairing of sw’s. Two sources placed at
a comparable or smaller mutual distance than λ “pair up”, meaning
the total acoustic power delivered is not simply the sum of the two
powers supplied individually: the acoustic power of each one depends on the other one’s performance. This comes from the fact that
the effective acoustic power depends both on the vibratory motion
of the source (which we can basically associate with the movement
of the cone) and on the total acoustic pressure near it: the combing
coming from nearby sources also plays a part in the total pressure
encountered by the movement of the cone. The following examples
show how combing, analysed across the entire acoustic field, easily
explains this phenomenon of power pairing.
a) Two very close sources with respect to λ in the band considered
(basically: distance between them is less than λ/8): can be considered coinciding from an acoustic point of view, meaning the acoustic paths separating them from all spatial points virtually coincide if
λ is used as a unit of measurement. This leads to phase coherence
throughout the space and so to an increase of 6 dB compared to
the single source. This 6 dB increase in acoustic pressure at all
spatial points leads to a similar increase in sound intensity (this is
true in far field): if the flow of the intensity is calculated on a surface
that encloses the system, the result is an increase of 6 dB in the
acoustic power delivered. So, the acoustic power is fourfold for
actual electro-acoustic sources, even though the consumption of
electrical energy has only doubled. Here are two basic explanations of the phenomenon: the acoustic impedance “seen” by each
source is doubled, as is the efficiency of both of them. We can also
see that the energy balances seem right given the low efficiency of
a sw, namely the very low acoustic energy compared to the energy
of the cone that is largely dissipated out of it.
It should be remembered that for two actual paired elements, an
increase of 5 dB is a more accurate estimate than the nominal 6
dB due to the considerable size of a subwoofer and the frequencies it can reach.
b) Two very distant sources compared to λ (basically distances over
5λ): the space will typically have alternating zones of constructive and
destructive combing with an average 3 dB increase in pressure. The
power in this case is only doubled: the individual powers are simply
added together, so the sources can be considered un-paired.
c) Two sources placed at a mutual distance comparable with λ (such
as two subwoofers placed a few metres apart): a positive pairing
(more than 3 dB increase in acoustic power) or negative pairing
(less than 3 dB increase in acoustic power) may occur depending
on the distance/λ relationship.
d) Close sources compared to λ but with push-pull emission: the
pressure is nil (or “very low”) throughout the space, so the acoustic
power is nil (nil impedance, nil efficiency: the cones are unable to
compress the air and simply move it between one and another).
Some of the examples discussed are illustrated in Figure 2.
Single source Two coupled sources
Two uncoupled sources
Fig. 2 Combing figures for different source coupling
(instant SPL)
Two coupled sources
in push-pull
4. Pairing with the environment
The phenomena of interaction with the environment can often be traced
back to the mutual interaction we have just seen, applying the Mirror
Image Source Method (MISM). This says that a flat wall can be considered almost a twin of the actual source and symmetrical to it with
respect to the wall itself (not unlike a source of light placed in front of
a mirror) provided it has a sufficiently large and reflective surface area.
Take the example of a subwoofer resting on the floor: its image
source is located immediately underneath it and so is well paired
with it. In this case, the efficiency doubles but the electrical power is
not affected because we have not added an actual source. So, compared to the case of two actually paired sources, the acoustic power
is only twofold and not fourfold. However, since it is concentrated in
a single half-space, the increase in intensity and pressure coming
from the floor is again about 5 dB, compared to a hypothetical free
field situation. The same type of pairing will occur if the sw is placed
against a vertical wall (provided this is sufficiently large and solid).
The same wall at a slightly higher distance (so the distance of the
image source is comparable to the average λ) may result in power
cancellation for certain frequencies and emphasis for others, altering
the timbre and the characteristic “emotion” of the sw used and contributing considerably less than 5 dB in this case.
5. Hence, some pratical ideas...
• You can safeguard optimum acoustic power by installing the subwoofers in stacked clusters (groups of subwoofers on top of one
another) and keeping the distance between one and other and
from the floor as small as possible.
3/6
Page 4

HPS
This does not mean the acoustic pressure will be distributed
throughout the space as and how we would like: this will probably
not happen. However, it is a good notion to bear in mind, especially when there are few sw’s available.
• Fitting the sw’s in a flying configuration, (typically above line array
modules) may result in some unpleasant surprises due to the lack
of a nearby, reinforced ceiling: the pressure on the low frequencies may not come up to expectations and require an unfeasible
number of units.
• Any walls close to the subwoofers should be taken into proper
consideration: “feared” but potential for exploitation.
6. Examples and simulations with the X-Treme Installer
We have seen how combing explains the phenomena of sw pairing.
Now we are providing a few examples of “virtual” installation using a
software tool whose algorithm is based on this phenomenon.
This is XTI free field acoustic prediction software, a tool specifically
created for X-Treme products. This software was created for line array predictions where combing is an even more important element in
the characteristic emission patterns and should not be overlooked in
any acoustic prediction. The predictions illustrated (Figures 3 and 4)
refer to two actual installations (Figures 5 and 6) carried out at Sound
Corporation’s metrological laboratory.
The subwoofer used in this case is the XTMISIS: a subwoofer with
2400 watt RMS absorbed power, normally linked to the MISITM line
array (middle of the range in terms of the size and power of the three
array products made by X-Treme). In the workshop, 6 units are used,
eliminating the problem of delivering sufficient acoustic power at
source but more importantly offering the potential of working with a
degree of complexity in terms of spatial configuration and thus the
distribution of the sound.
Here, we compare two possible types of installation on the ground
(Figures 5 and 6):
a) two clusters of 3 units each, stacked;
b) a horizontal array of 6 units.
Fig. 3 Acoustic prediction for two clusters of 3 units
Fig. 4 Acoustic prediction for an array of 6 units
In both cases, the subwoofers are located close to the back wall.
The room’s floor plan is the rectangle that is drawn inside the XTI;
the plotted maps represent the level of pressure limited to the 63 Hz
octave (from 45 to 90 Hz approximately), calculated from the total of
the combing figures on twelve discrete frequencies distributed within
it (semitones). The prediction is limited to free field, but it will also
be used to forecast the resulting interaction with the environment (a
more detailed study could also create the main image sources and
see the effect directly).
Solution a) with two lateral clusters is often preferred by the FOH
technicians: in a touring installation they are typically located under
the upper left and right modules of the sound reinforcement system.
This is because it combines the concept of high performance and
that of phase coherence with the satellites across the whole space.
However, it does not consider the phase coherence between the
subwoofers nor the resulting problem of the combing lobes and the
overall distribution of the pressure level.
The prediction illustrated in Figures 3 and 4 clearly shows the problem of the lobes as well as the strong lateral emission; bearing the
lateral reflection in mind, this will result in excess energy being “restrained” close to the installation itself (not being projected forwards)
so that the result is a certain amount of wasted power output.
The pressure level performance shown in Figure 7 is measured along
a straight oblique line, highlighted by an arrow in the XTI screens: we
can see that the combing “gaps” are clearly marked (naturally they
are less than they would be in free field) despite the “randomisation”
introduced by environmental reflection.
The phenomenon is clearly audible when walking along the same line
and listening to music: the attractive and well-defined “boom boom”
of our XTMISIS decays at the incriminated points, slightly yet tauntingly; a question of few, but truly important decibels.
Otherwise, the prediction for installation b) with a horizontal array
shows a main lobe that is well adapted to the room’s more elongated
layout compared to the previous example, suggesting the possibility of greater penetration of direct sound in depth (so less loss and
higher definition), as well as the elimination of those annoying gaps.
4/6
Page 5

User’s manual
Fig. 5 Installation a) consisting of two clusters of 3 subwoofers each
Fig. 5 bis Detail of the glass wall
The “in the field” measurements and listening (Figure 7) generally
confirm the prediction made with the XTI (Figures 3 and 4), showing
the excellent potential of this approach.
Fig. 6 Installation b) consisting of 6-unit sub array
For both installations, note the asymmetry of the level caused by
the glass wall on the right (Figure 5 bis) that transmits part of the
incident sound outside (and so does not reflect it back). For these
frequencies, the roughness of the surface is not as important as the
mass and the stiffness of the wall. Therefore, in this case, the dB
“received” from the wall by the overall acoustic pressure level will be
much less than 5. In particular, in case b) we can say that this asymmetry disturbs the desired effect of uniformity: two perfectly reflecting
side walls would result in a system (consisting of the actual array plus
its virtual images) corresponding to an infinite array with a significant
improvement in uniformity. We might consider an active method of
compensating for this imbalance by altering the gain of the individual
subwoofers; in actual fact, the multi-channel process offers a range
of interesting solutions especially for sw arrays that should be discussed in a separate technical paper.
The same goes for the analysis of transients, which should complete
this study. For now, we have only studied the stationary state and have
discussed the effects that this study may bring to light.
Further analysis of the effects of the geometrics of installation on
the phase transfer function would be equally important, because it
would provide more specific information on the quality and not just the
“quantity” of the sound reproduced by the subwoofers. This is possible thanks to the measurement of the system’s impulse response
and is part of the current research projects of the R&D team at Sound
Corporation.
Fig. 7 Sound pressure level on the transverse line
at 8 m from the system
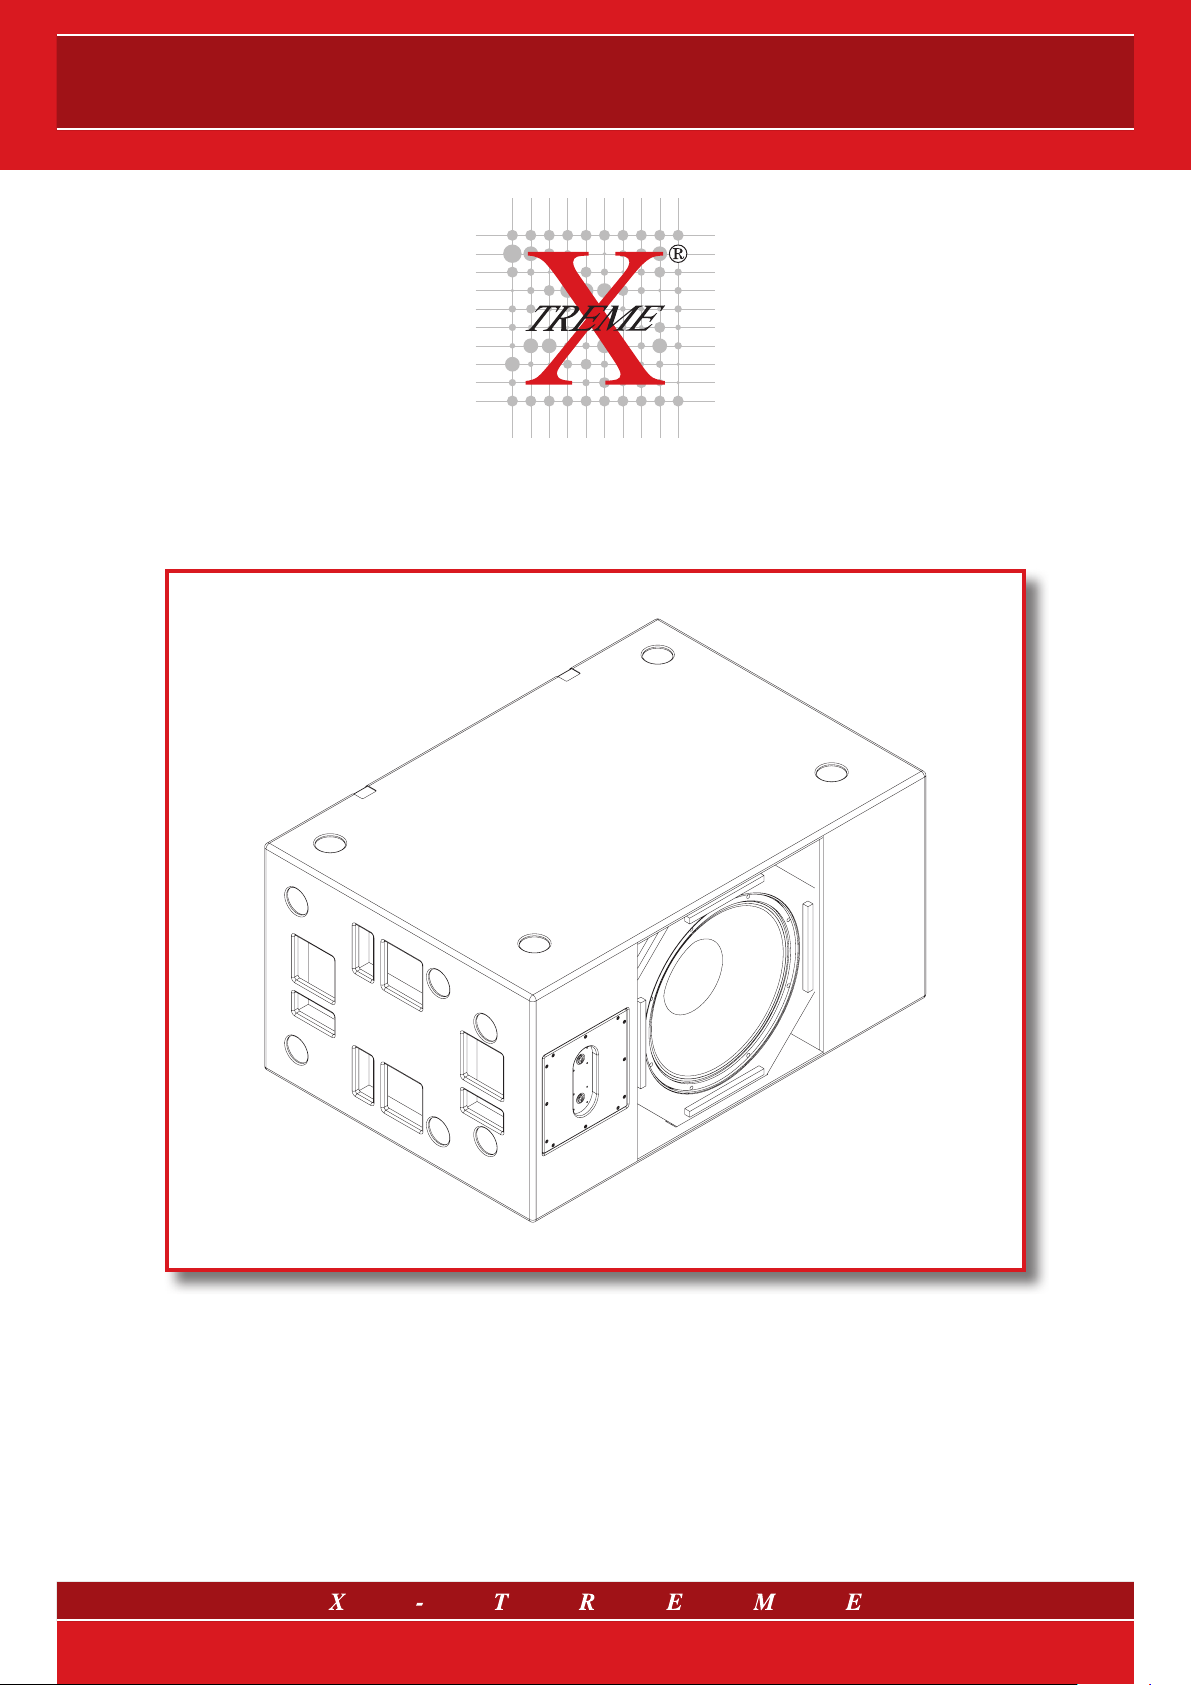
7. X-Treme Subwoofers: product catalogue
Rather than developing a product merely to achieve a beautiful design
(which often does not guarantee a high quality reproduced sound) or
to follow some production efficiency criteria, the X-Treme designers
created the High Power Subwoofers
XTHPS36 and XTHPS36/A)
of these products and their final application: reproducing ultra-low frequencies with unequalled efficiency and performance in the professional audio, in the case of both indoor and outdoor great musical events.
Perfect compensation of the masses and volumes, together with reinforcements inside the cabinet, completely eliminates vibrations and
maintains the subwoofer characteristics unchanged over time. The
SPL peak is reached at 80 Hz, the volume of air displaced by 15” or
18” components and the structural rigidity of the Canadian birch cabinets make the sound reinforcement always deep, round and diffused.
To sum up: an incisive and deep “big punch”.
The XTCARDIOID model should be dealt with separately: in fact, it can
be defined as a controlled directivity “big punch” cardioid subwoofer.
But what do we mean by the term cardioid? In geometry the cardioid
is a curve (its name refers to its heart-like shape) and, more accurately,
an epicycloid with just one cusp – see figure 8. In the audio sector it
means that the polar diagram (that is the angular distribution graph of
a speaker system output level at a fixed distance and in the presence
of a constantly applied signal) at the working nominal frequency of
this subwoofer is of a “heart-shaped” type. This is achieved by controlling the element components with a power amplifier (for example
the XTDT6000F model) and a control processor (such as the XTDP26
model) to manage the delay, in order to combine the response of the
two front bi-directional 18” loudspeakers with that of the rear omnidirectional one. The resulting polar diagram looks like a heart, with a
peaked anisotropy in the front direction and a minimum response in
the rear direction.
only taking into account the functionality
(mod. XTHPS21, XTHPS33,
Fig. 8 Illustration
of the XTCARDIOID
polar pattern
5/6
Page 6

Contacts
www.x-tremeaudio.com
X-Treme Headquarters:
via Monti Urali, 33 - 42100 Reggio Emilia - Italy
tel. +39 0522 557735
fax +39 0522 391268
X-Treme Audio reserves the rights to change or modify products and specifications at any time without prior notice.
X-Treme and the corresponding symbols, images and registered trademarks are of exclusive property of Sound Corporation group. © 2010 Sound Corporation group. All rights reserved.
6/6
For technical support/information: support@x-tremeaudio.com
For general information: info@x-tremeaudio.com
For commercial information: sales@x-tremeaudio.com
 Loading...