

Page 1

W&T
Manual
Web-IO Analog-In
Type 10/100BaseT, 12-24V
Model 57641, 57642, 57643
Release 1.4, Jan 2008
Page 2

W&T
© 01/2008 by Wiesemann & Theis GmbH
Microsoft, MS-DOS, Windows, Winsock and Visual Basic
are registered trademarks of the Microsoft Corporation
Subject to errors and modifications:
Since we can make mistakes, none of our statements should be
taken without verification. Please inform us of any mistakes or
misunderstandings you notice so that we can become aware of
them and remedy them as quickly as possible.
Perform work on and with W&T products only as described and
after you have read and understood this manual thoroughly.
Improper use may result in hazards. We are not liable for improper
use. In case of doubt please check with us or your dealer first!
Page 3
W&T
Introduction
The W&T Web-IO Analog-In models incorporate all the
functions in one box for capturing, storing and displaying your
analog measurements (0...20mA or 0...10V). A variety of alarm
functions is also available which can be custom implemented
in your own applications or in existing systems.
This manual contains all the information you need for
installing, configuring and operating the Web-IO Analog-In
module.
Page 4

W&T
Table of Contents
Introduction ............................................................................................ 3
1 Quick Start-up ..................................................................................... 6
1.1 Connecting the supply voltage ........................................ 6
1.2 Connecting the measurement lines .................................. 6
1.3 Assigning the IP address using „WuTility“ ......................... 8
1.4 IP assignment using DHCP protocol ................................ 10
1.4.1 Activating/deactivating DHCP ................................ 10
1.4.2 System Name ........................................................ 11
1.4.3 Lease time ............................................................ 12
1.4.4 Reserved IP addresses ........................................... 13
1.4.5 Dynamic IP addresses ............................................ 13
1.5 Assigning the basic network parameters ......................... 14
2 Graph Display of the Measurements ........................................17
2.1 Basic functions ............................................................. 17
2.2 Config menu ................................................................ 19
2.3 Table ............................................................................21
3 Additional basic settings ............................................................. 22
3.1 Configuring the port and device names .......................... 22
3.2 Local time setting ......................................................... 24
3.3 Automatic time setting using a networjk time service ....... 27
3.4 Configuring the data logger ........................................... 28
3.5 Configuring the graphics display ................................... 30
3.5.1 Basic Settings ....................................................... 30
3.5.2 Select Sensor ........................................................ 32
3.5.3 Scale Config ......................................................... 34
3.6 Calibration ................................................................... 35
3.7 Browser access ............................................................. 37
3.8 E-mail alarms ................................................................ 38
3.9 SNMP incl. alarm sending via Trap .................................. 46
3.10 Sending alarms via TCP (Client Mode) ........................... 49
3.11 Sending alarms via FTP (Client Mode) ........................... 50
3.12 Sending alarms via Syslog ............................................54
3.13 ASCII command strings via TCP Port 80 ........................ 55
Page 5

5
W&T
3.14 ASCII command strings via UDP ................................... 56
3.15 UP-/Download ............................................................. 57
4 Individual querying of measured values ............................... 59
4.1 Querying via TCP/IP ...................................................... 59
4.2 Querying via UDP .......................................................... 59
4.3 Querying via SNMP ........................................................ 60
5 Java Applets - Auto-updating in the browser .................. 62
5.1 Working with the Java applet .......................................... 62
5.2 Using the applet with JavaScript ..................................... 64
6 Data Logger .......................................................................................67
7 Appendix ............................................................................................68
7.1 Alternate IP address assignment .................................... 68
7.2 Example for creating your own Web pages ...................... 71
7.3 Firmware update ........................................................... 78
7.3.1 Where do I obtain the current firmware? .................. 78
7.3.2 Firmware update over the network under Windows ... 78
7.3.3 LED indicators ...................................................... 80
7.4 Technical Data .............................................................. 82
7.5 Declaration of Conformity .............................................. 83
Page 6
6
W&T
1 Quick Start-up
It takes only a few steps to start up the Web-IO Analog-IN
module and make it visible in your network.
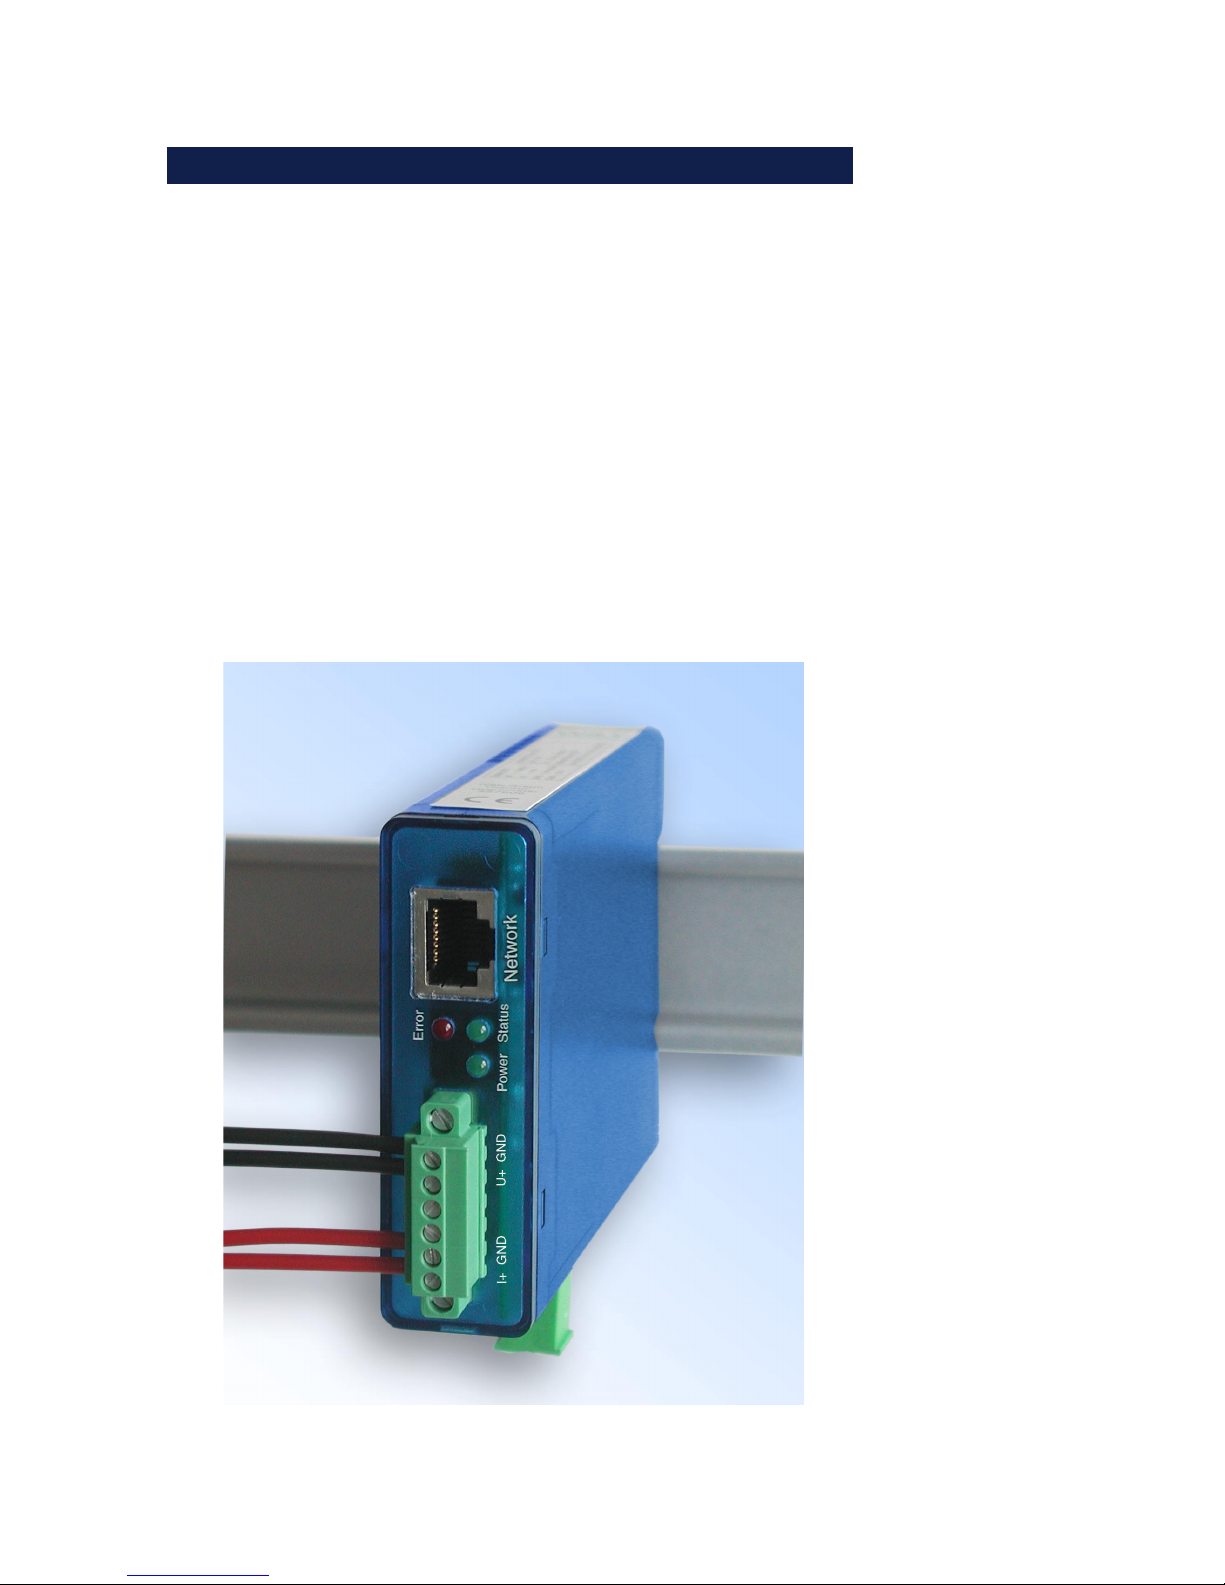
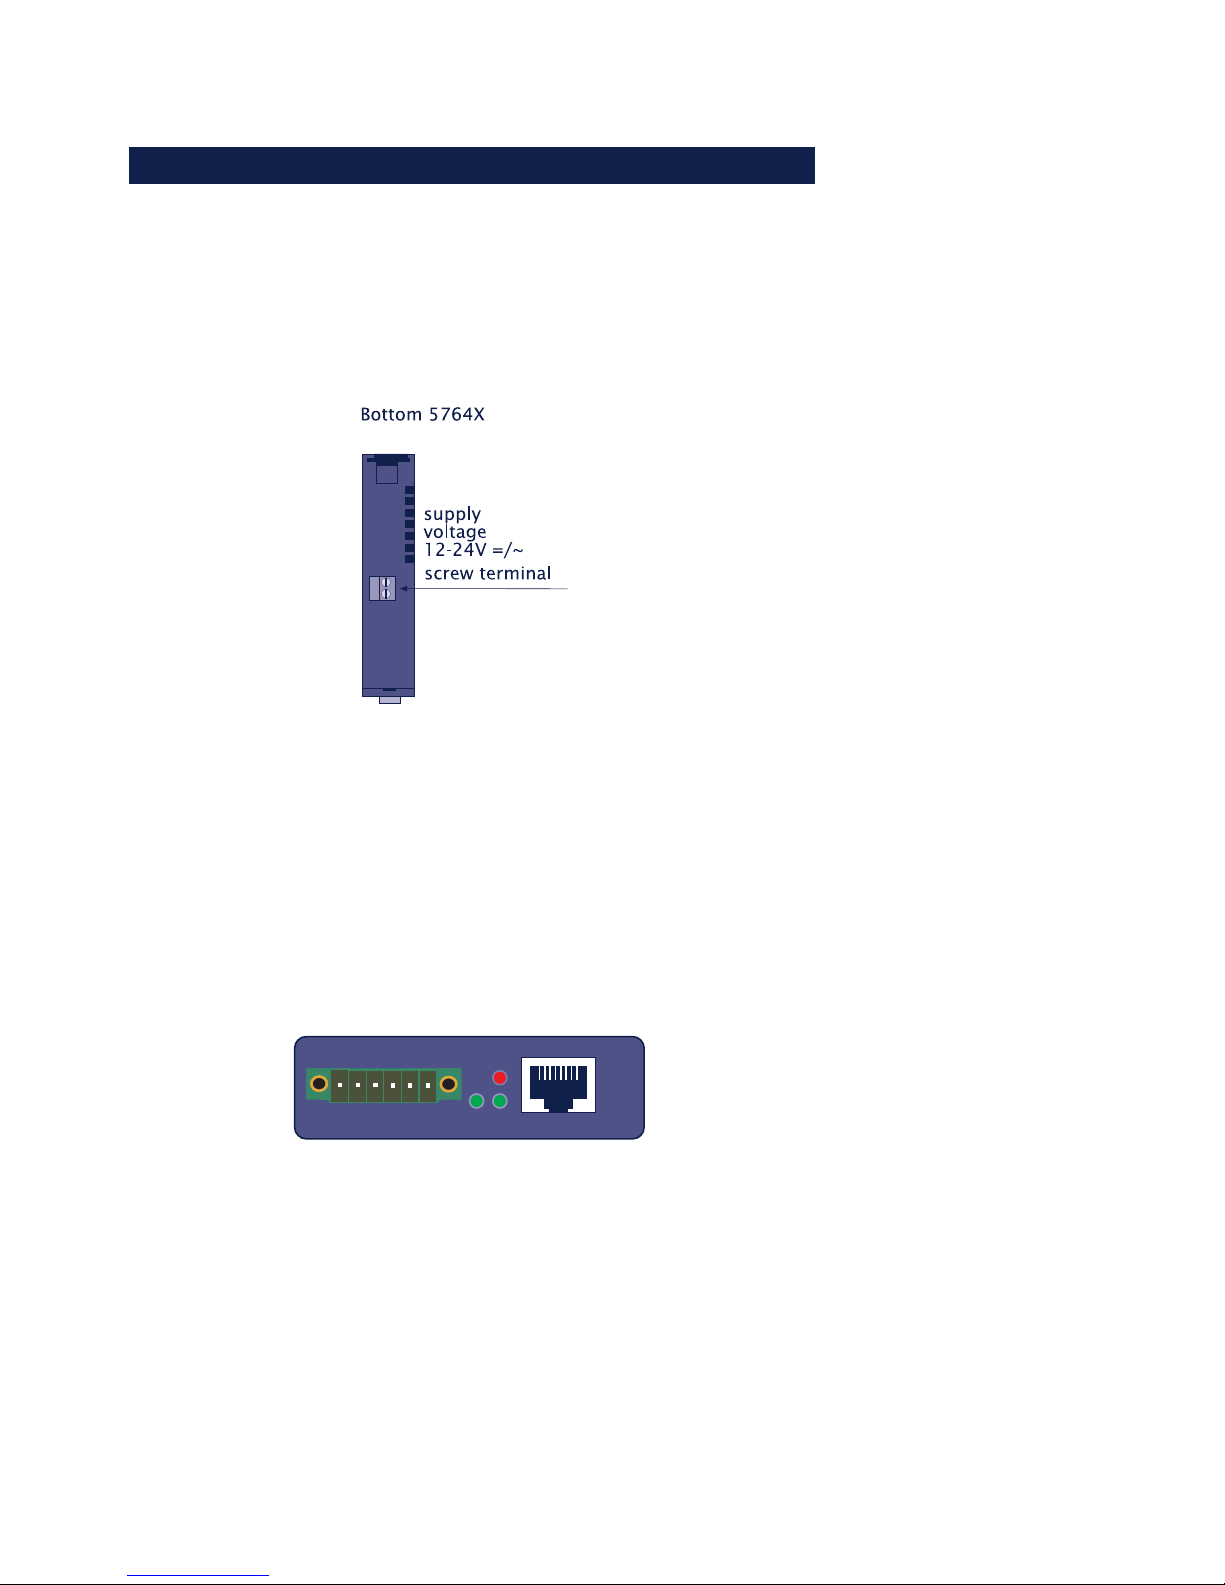
1.1 Connecting the supply voltage
Connect 12-24V AC/DC to the terminal provided using the plug-in
power supply included. Polarity is uncritical.
1.2 Connecting the measurement lines
Screw the measuring lines into the 6-pole female connector
provided and plug it into the device.
Power
Network
Status
Error
I+ GND U+ GND
Page 7

7
W&T
1.2.1 Terminal designations
I+ : Current input 0..20mA
U+ : Voltage input 0..10V
GND : Ground
!
Please note when wiring the inputs that they use the
same GND internally.
1.2.2 Pin configuration 57641
Web-IO Analog-In 0..20mA / 0..10V
1.2.3 Pin configuration 57642
Web-IO Analog-In 2x 0..20mA
1.2.4 Pin configuration 57643
Web-IO Analog-In 2x 0..10V
6
Page 8

8
W&T
1.3 Assigning the IP address using „WuTility“
Once the hardware has been connected to the supply voltage
as described above, you must assign the IP address needed for
operation in a TCP/IP network. You can obtain the correct value
for this parameter from your system administrator.
!
The IP address must be unique throughout the network.
There are various ways of assigning the IP address. To make it
as convenient as possible, we have developed the „WuTility“
tool, which you can download from the WuT homepage at
http://www.wut.de. This procedure is described in the
following. A summary of the alternatives can be found in the
Appendix to this manual under 7.1.
Be sure that the PC you are using to assign the IP address is
located in the same sub-network as the module and that both the
PC and the module are connected to the network.
When it starts, WuTility automatically searches the local network
for connected W&T network devices and generates an inventory
list. This search process can be repeated manually as often as
desired by clicking the Scan button:
Select from the displayed list your Web-IO Analog-In based on
the MAC address:
Page 9
9
W&T
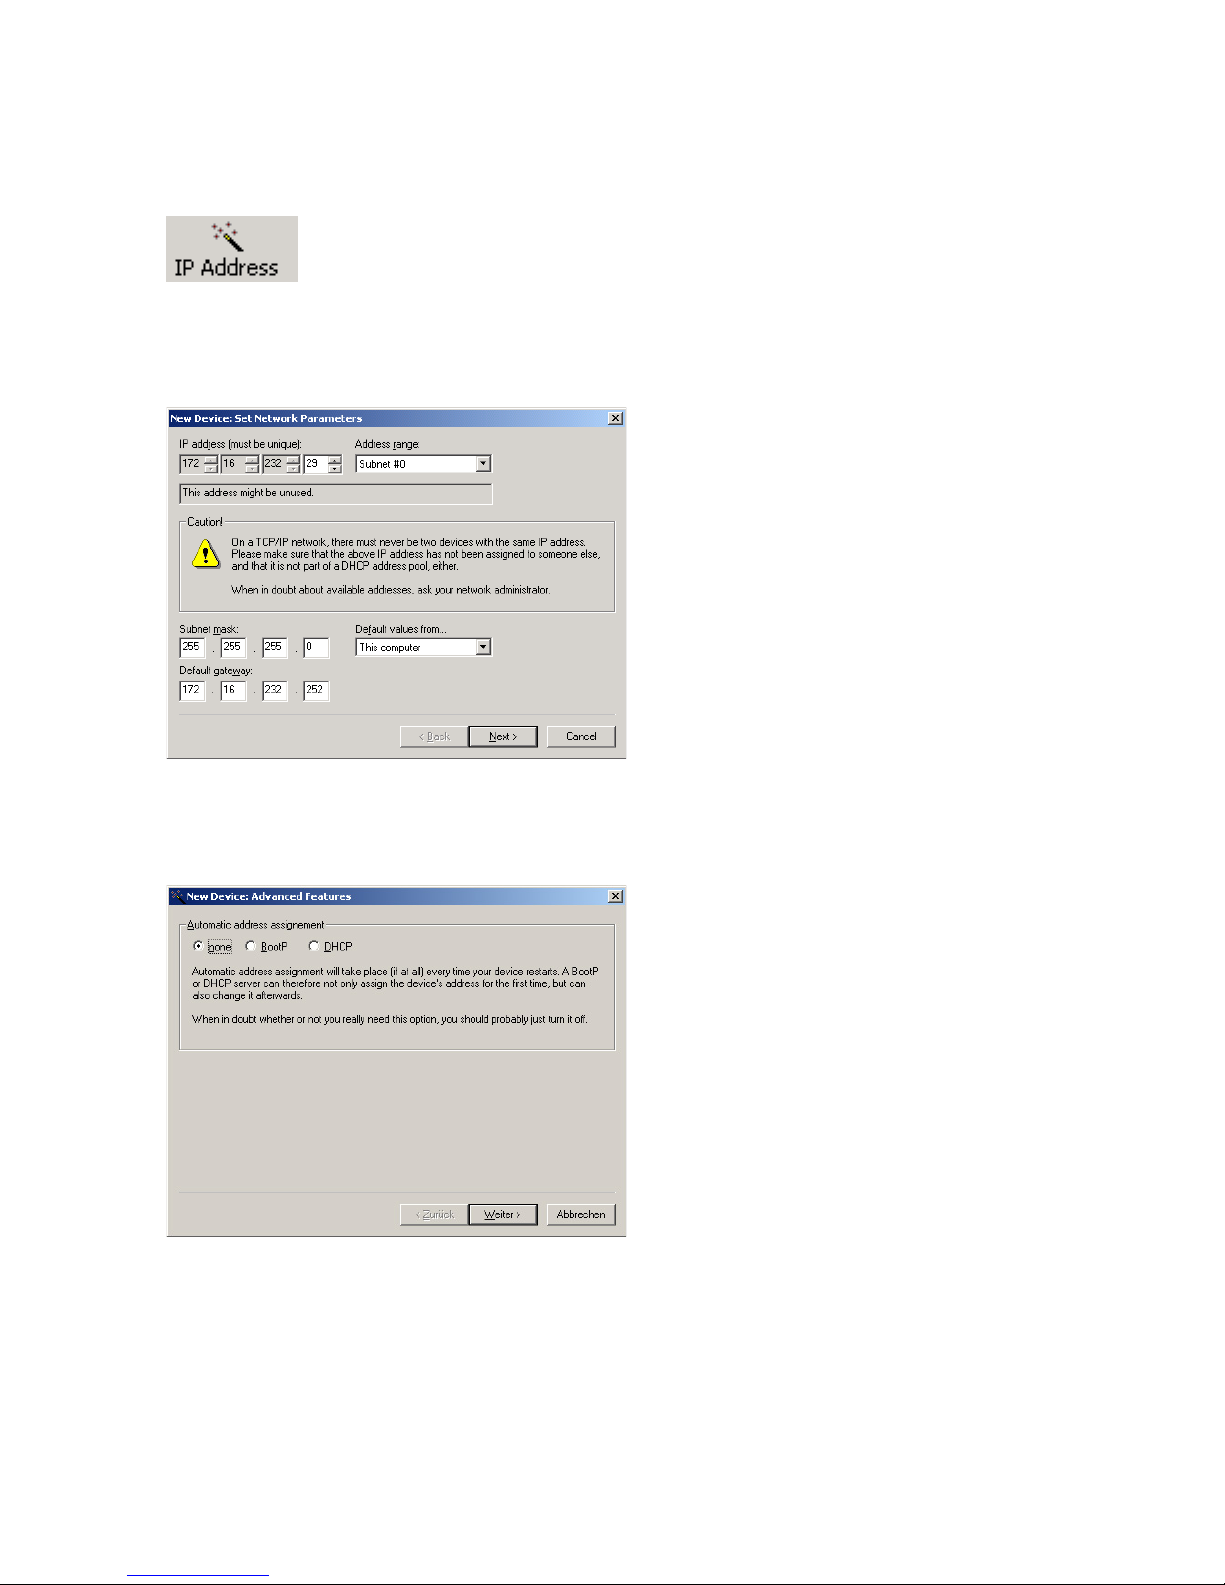
Click on the „IP address“ symbol:
In the resulting window enter the desired network parameters for
the device and confirm by clicking on „Continue“.
The BOOTP client of the Web-IO Analog-In can be activated in the
following window.
Clicking on the Continue button assigns the network parameters
to the Web-IO Analog-In. All the columns in the device list in
WuTility are filled with information. After clicking on the globe in the
WuTility menu list your standard browser is opened and you will
see the start page for the device.
Page 10

10
W&T
1.4 IP assignment using DHCP protocol
Many networks use DHCY (Dynamic Host Configuration
Protocol) or its predecessor BOOTP described in the following
section for centralized, dynamic assignment of network
parameters. By default DHCP protocol is activated, so that in
network environments with dynamic IP assignment you only
need to connect the Web-IO Analog-In to the network. The
following parameters can be assigned using DHCP:
• IP address
• Subnet mask
• Gateway address
• DNS server
• Lease time
1
To prevent undesired address assignment
or address changes, we recommend deactivating DHCP,
BOOTP and RARP unless these are expressly used in the
respective network environment. Web-IO Analog-In with
incorrectly assigned IP address can be conveniently found and
reconfigured after the fact using the scan function of the
WuTility management tool.
1.4.1 Activating/deactivating DHCP
By default DHCP is activated. The following methods are
available for deactivating or later reactivating DHCP protocol.
• Management tool WuTility
Select the desired Web-IO Analog-In from the device list and
click on the IP address button. In the first dialog window
enter the new network parameters and then click on Next.
Page 11

11
W&T
In the following dialog window deactivate the options
BOOTP and DHCP. Click on Next to send the new
configuration data to the Web-IO Analog-In.
• Web Based Management
In Config r Device r Basic Settings r Network you can
alternately activate or deactivate both the protocols. Detailed
information about this can be found in section Assigning the
basic network parameters 1.5.
1.4.2 System Name
To support any automated updating of the DNS system by the
DHCP server, the Web-IO Analog-In identifies itself within the
DHCP protocol with its system name. The factory setting for this
is WEBIO- followed by the last three places of the Ethernet
address. For example, the default system name of a Web-IO
Analog-In having Ethernet address 00:c0:3d:01:02:03 is WEBIO-
010203. The system name of the Web-IO Analog-In can be
changed using Web Based Management.
Page 12

12
W&T
1.4.3 Lease time
The lease time determined and sent by the DHCP server
specifies how long the IP address will remain in use. After half
the lease time has expired the Web-IO Analog-In attempts to
extend the time for the assigning DHCP server and to update
the address. If this is not possible by the time the lease time
expires, for example because the DHCP server can no longer
be reached, the Web-IO Analog-In deletes the IP address and
starts a cyclical search for alternative DHCP servers in order to
assign a new IP address.
Because the clock is missing, the lease time associated with the
current IP address is no longer available after a reset. Therefore,
after the restart an update query is generated for the original
DHCP server. If it is not available at this time, the Web-IO Analog-In deletes the IP address and starts a cyclical search for alternative DHCP servers.
If DHCP is activated, the remaining lease time together with the
current IP address is shown in seconds in the menu branch
Home r Doc r Property.
1
If after the assigned lease time has expired the DHCP
server cannot be reached, the Web-IO Analog-In deletes
its IP address. All existing TCP/UDP connections between the
Web-IO Analog-In and other network clients are closed. To
prevent disturbances of this kind, we recommend setting the
lease time in the DHCP server to infinite.
Page 13

13
W&T
1.4.4 Reserved IP addresses
The Web-IO Analog-In provides services which can make use of
other clients in the network as needed. To open a connection
they of course need the current IP address of the Web-IO Analog-In, so that in these applications it makes sense to reserve a
particular IP address for the Web-IO Analog-In on the DHCP
server. As a rule this is done by joining the IP address to the
worldwide unique Ethernet address of the device, which can be
found on the sticker on the housing.
1.4.5 Dynamic IP addresses
Fully dynamic IP address assignment, in which the Web-IO Analog-In gets a different IP address after each restart or after the
lease time has expired, is only useful in network environments
with automatic cross-connection between the DHCP and DNS
services. This means when a new IP address is assigned to the
Web-IO Analog-In, the DHCP server then automatically updates
the DNS system as well. The new address is assigned to the
respective domain name. For detailed information about your
network environment, consult your system administrator if in
doubt.
Dynamic, changing IP addresses can also be used for time
server queries, sending of e-mails or other client applications
in which the device itself searches for active connection to
server services located in the network.
5xxxx [Typ]
EN=00c03d004a05
OK xxxxxx
Ethernet-address
Page 14
14
W&T
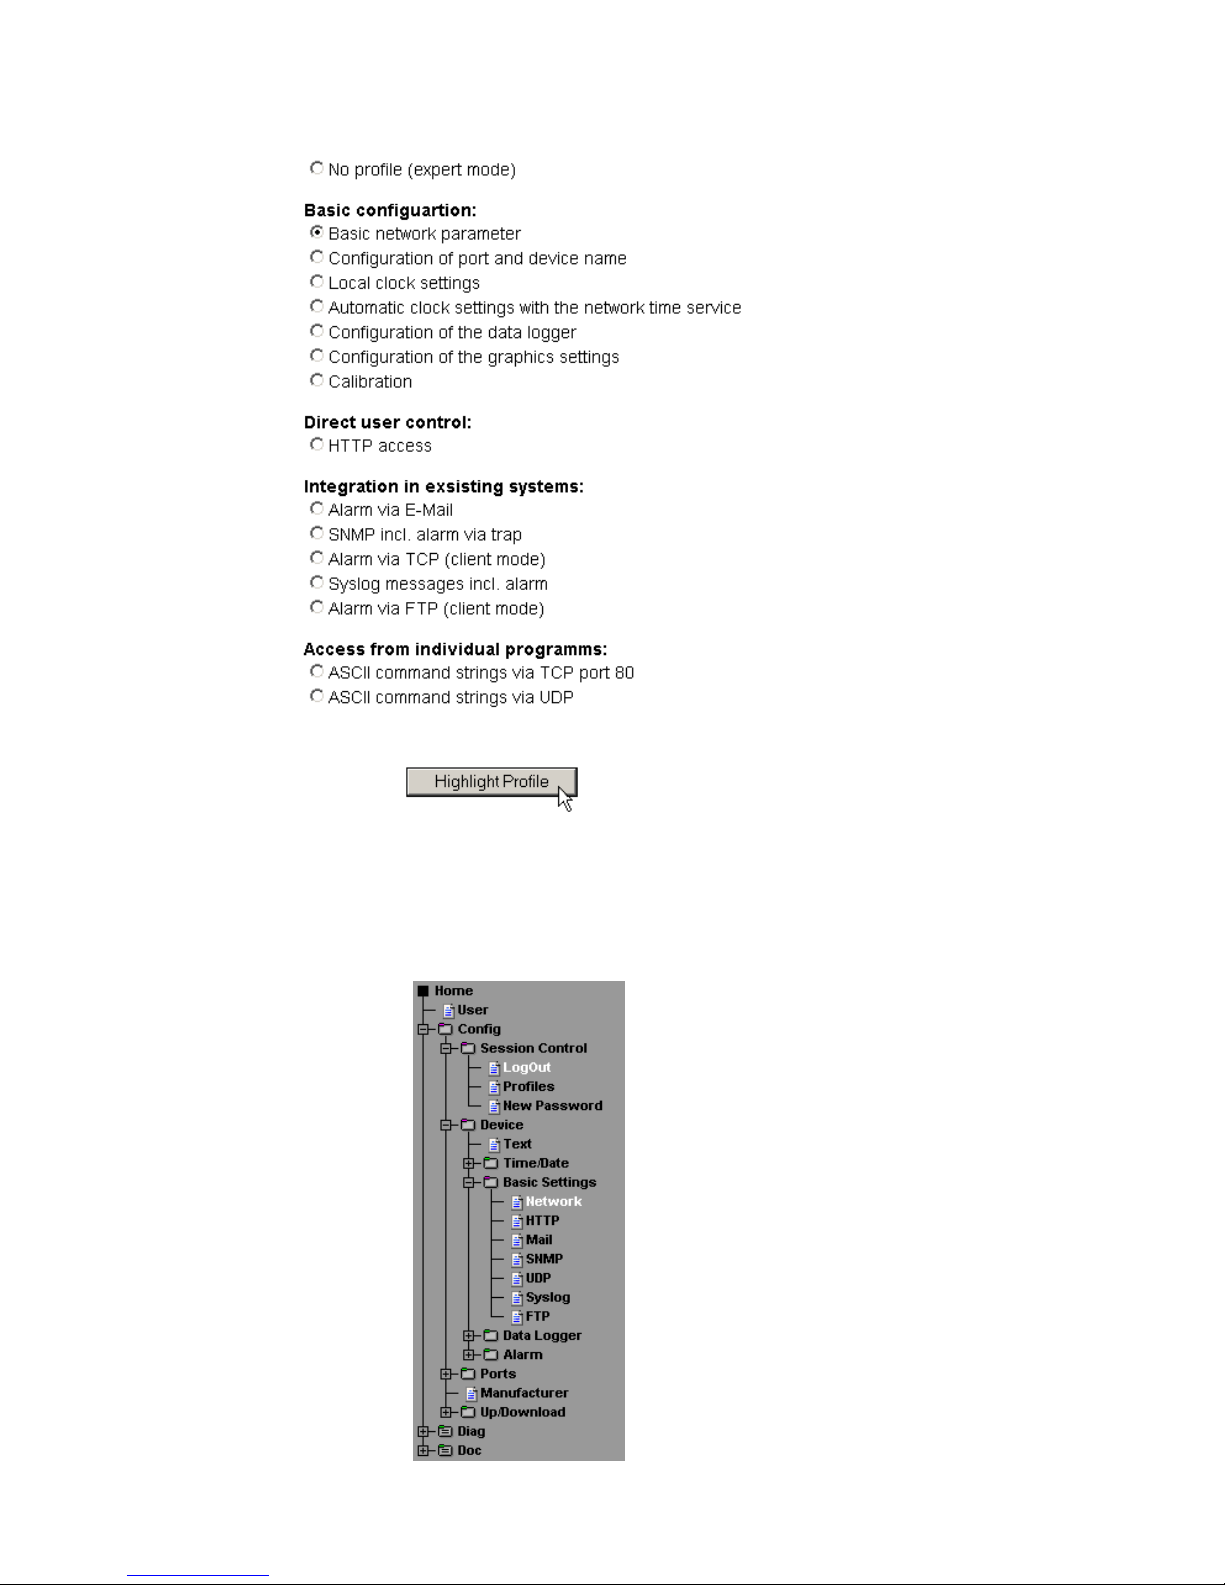
On the next page select the configuration path with the aid of the
profiles.
Select the profile „Basic network parameters“ and click on the
„Show profile“ button.
1.5 Assigning the basic network parameters
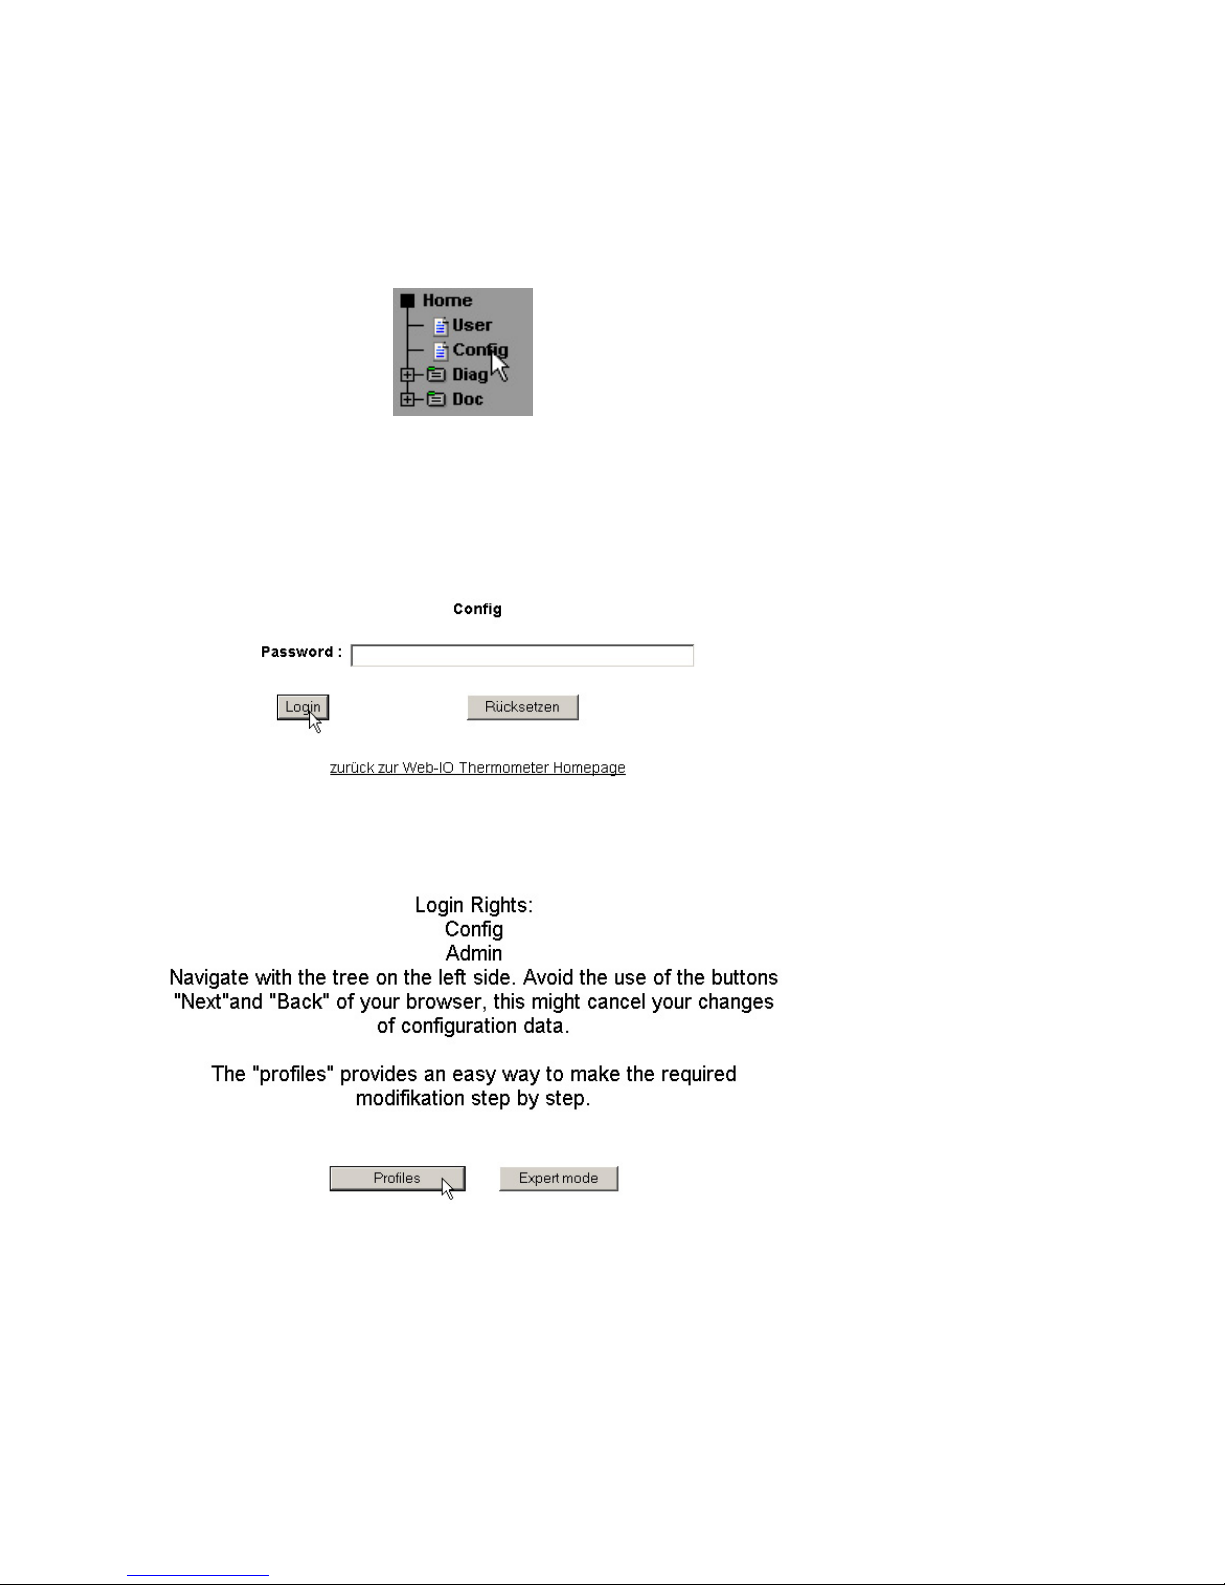
In the configuration tree at left click on „Config“.
You are now prompted to enter a password. The factory default
setting is for no password, so that you can simply click on the
Login button without entering a password.
Page 15
15
W&T
The device now automatically displays the necessary menu points
for this profile. Click on „Network“ in the configuration menu.
Page 16

16
W&T
Then clicking on the „Save“ button saves the settings in the
device and closes your configuration session. After the network
parameters have been changed the device automatically
restarts itself.
The device is now ready for use in your network. For convenience
you can use the additional profiles for adapting the unit to your
specific needs.
On the following page enter all the necessary network parameters
and when you are finished click on the „Logout“ button.
Page 17
17
W&T
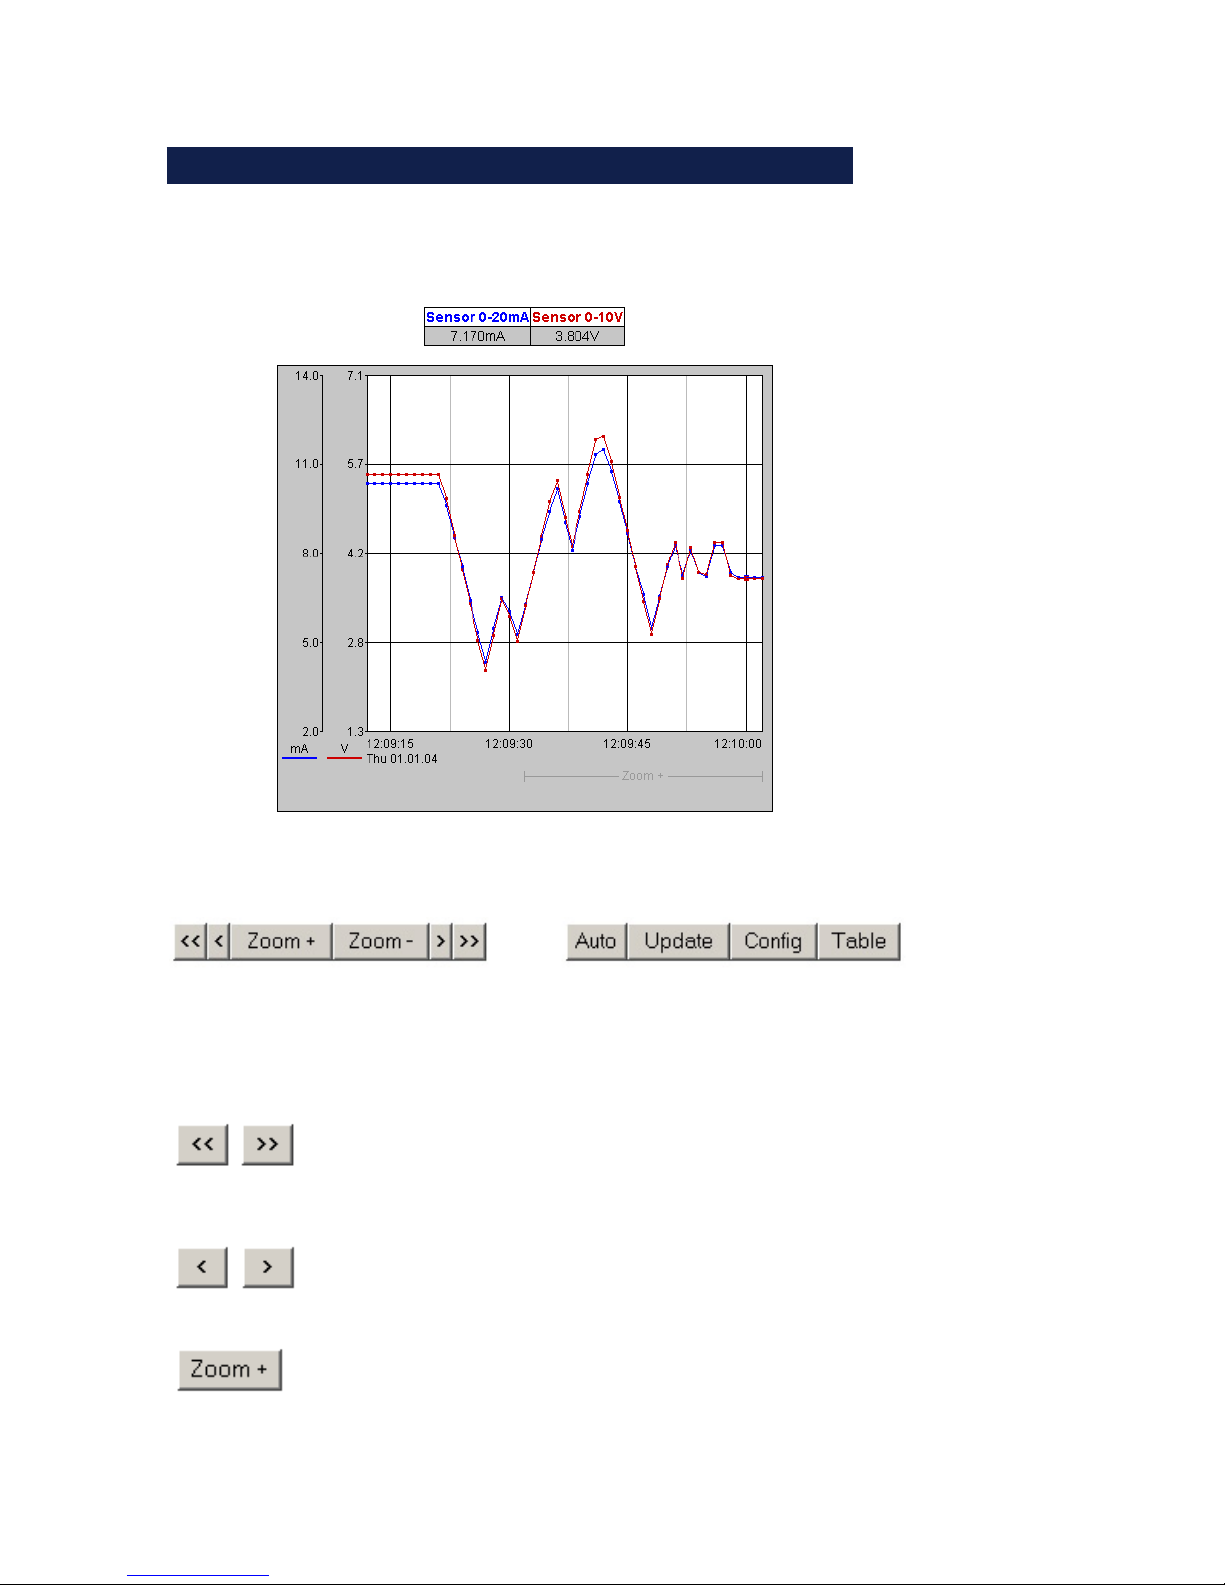
2 Graph Display of the Measurements
2.1 Basic functions
The device provides a table of the current values and a graph
of the stored values.
By using the control buttons at the bottom of the page you can
do the following.
Scroll the graph to right or left by the size
of the display interval, to within one unit.
Scroll left or right in the graph in
increments of one unit of the X-axis.
Zoom the area of the graph indicated at
the lower right edge.
Page 18
18
W&T
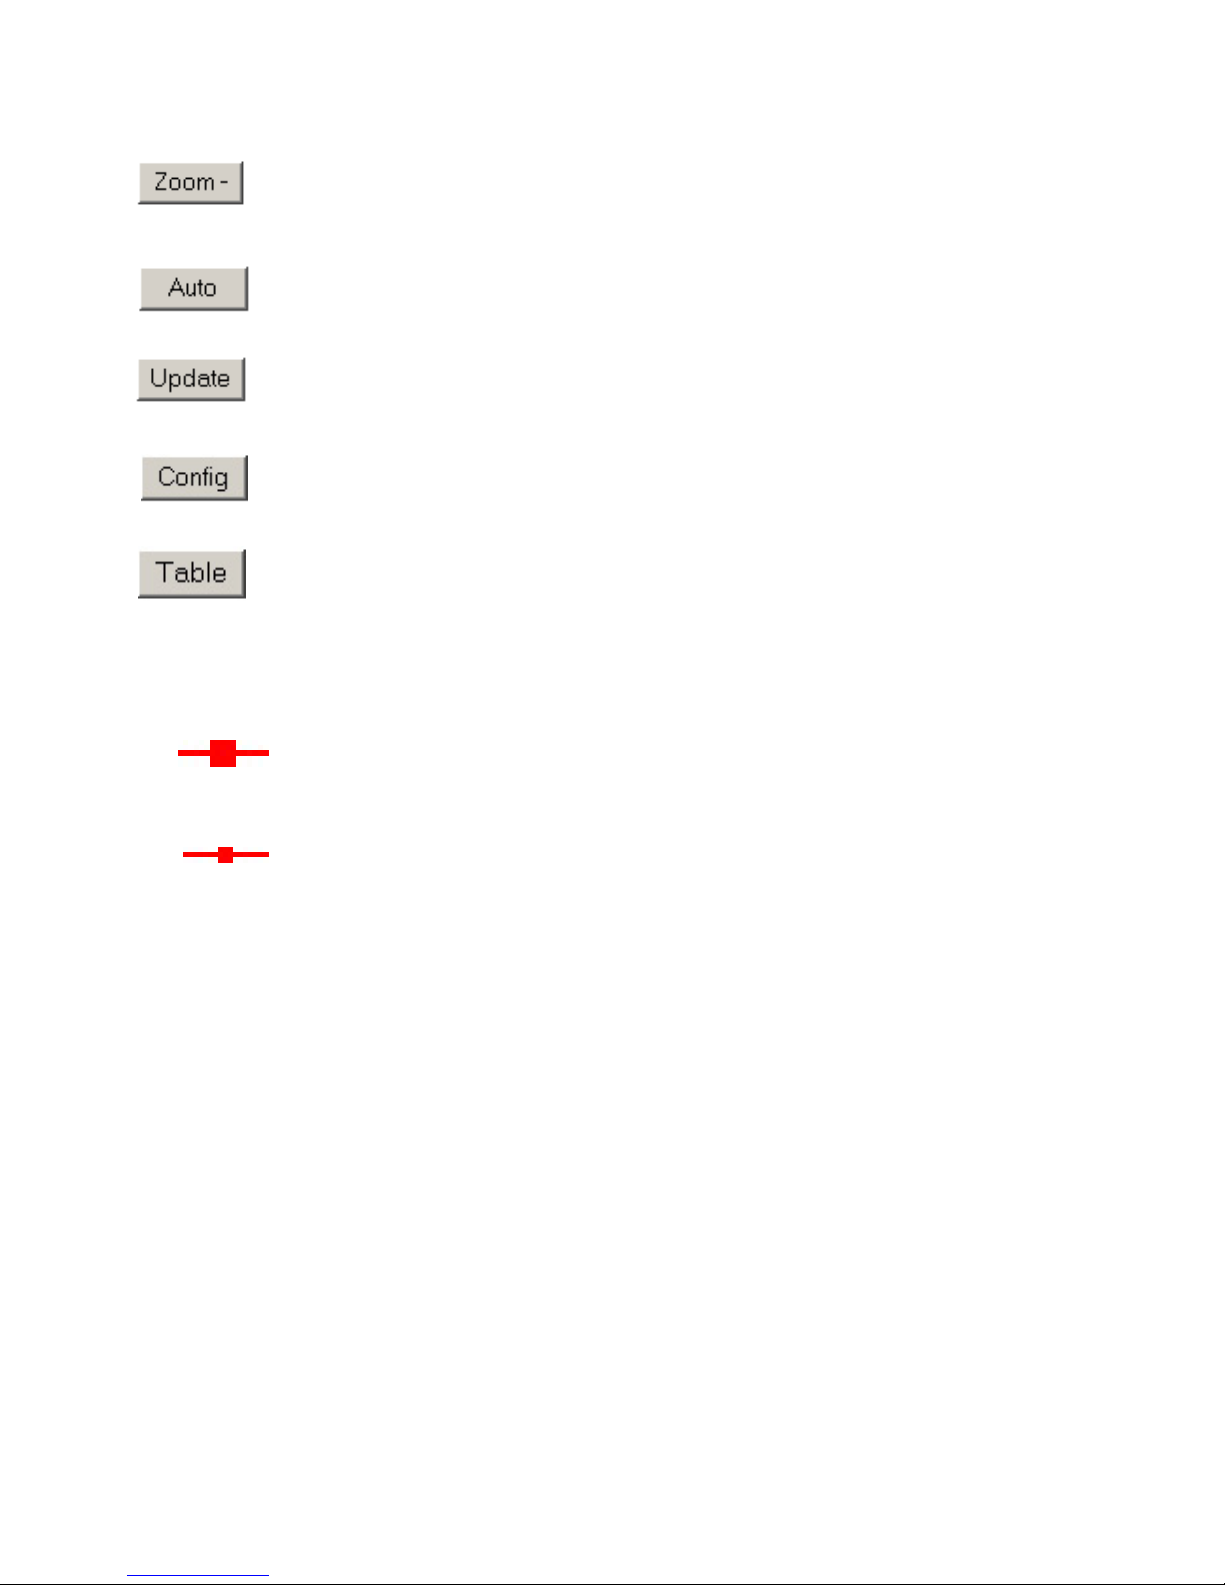
Zooms back to the previous zoom level.
Activates automatic refreshing of
the graph.
Value visualization:
Large marker: This measured value is
stored in the device data logger.
Small marker: This measured value is a
volatile value which is used only for
display but which is not stored in the data
logger.
!
When exiting the zoom level, these
measurements are lost. The
connectinglines are only displayed
in the zoom level which represents the
memory.
Refreshes the display
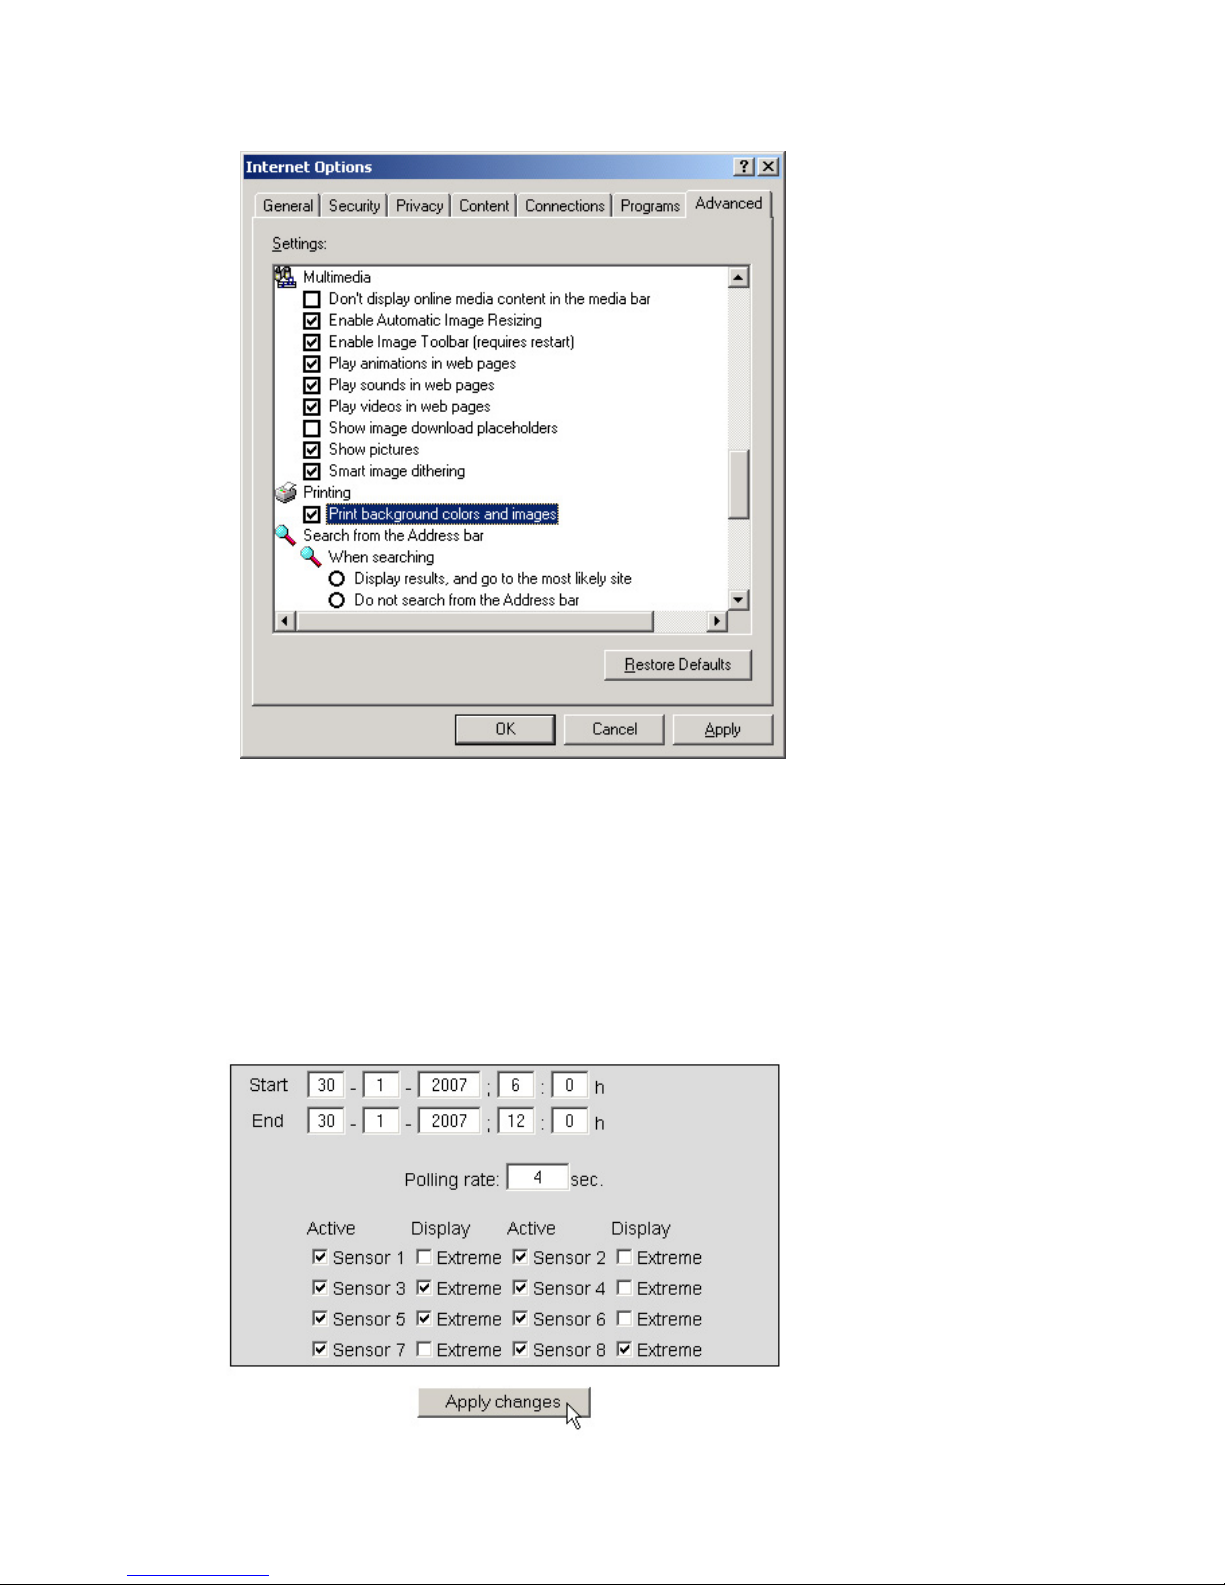
To print out the page containing the graph, it is necessary to
activate printing of background colors and images in the
Internet options. In Microsoft Internet Explorer this setting is
found in
Tools -> Internet options -> Advanced
Opens the configuration menu beneath
the graph
Displays the values currently displayed in the
graph in table form.
Page 19
19
W&T
Design and positioning of the graph is configurable.
2.2 Config menu
Page 20

20
W&T
The following functions are available from the configuration
menu beneath the graph:
Start: Here you specify the starting time for the X-axis.
End: Here you specify the ending time for the X-axis.
Polling Rate: Enter here the desired refresh rate for the graph.
The device provides a new value no sooner than after 4
seconds. Entering a value of less than 4 is not useful.
Active: Use this to turn the individual sensors on or off.
Display, Extreme: If a zoom level is selected in the graph in
which a display point represents a measuring interval and not
an individual measuring point, this function is used to display
the maximum and minimum measured in this interval. If the
zoom level is selected such that every measured value is
displayed, this function has no effect. If the function is
deactivated, the average value of the displayed interval is
displayed.
Apply changes: Immediately applies the changes made for the
graph.
Page 21
21
W&T
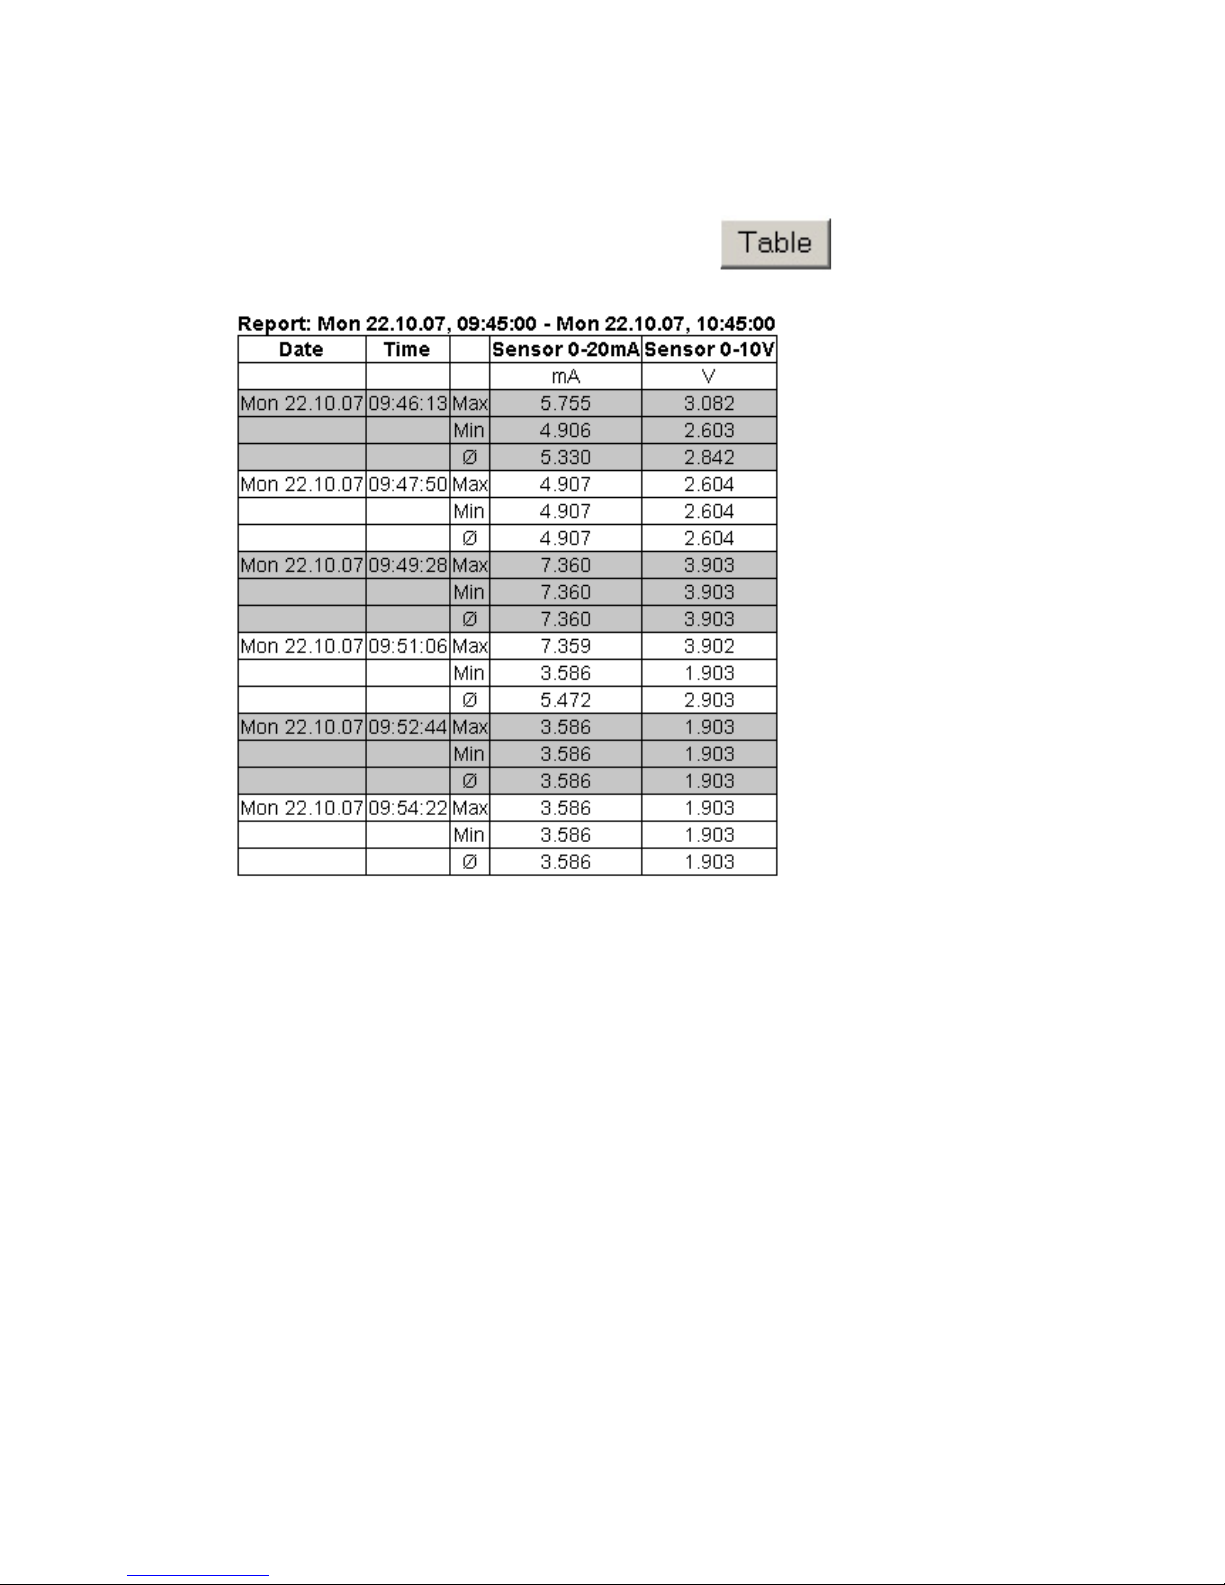
2.3 Table
This function is used to show the currently represented values
in table format. As soon as not all stored values can be
displayed, the following values are shown in the table for each
sensor:
Max: The maximum value in the displayed interval
Min: The minimum value in the displayed interval
Ø: The average value of the displayed interval
Page 22
22
W&T
3 Additional basic settings
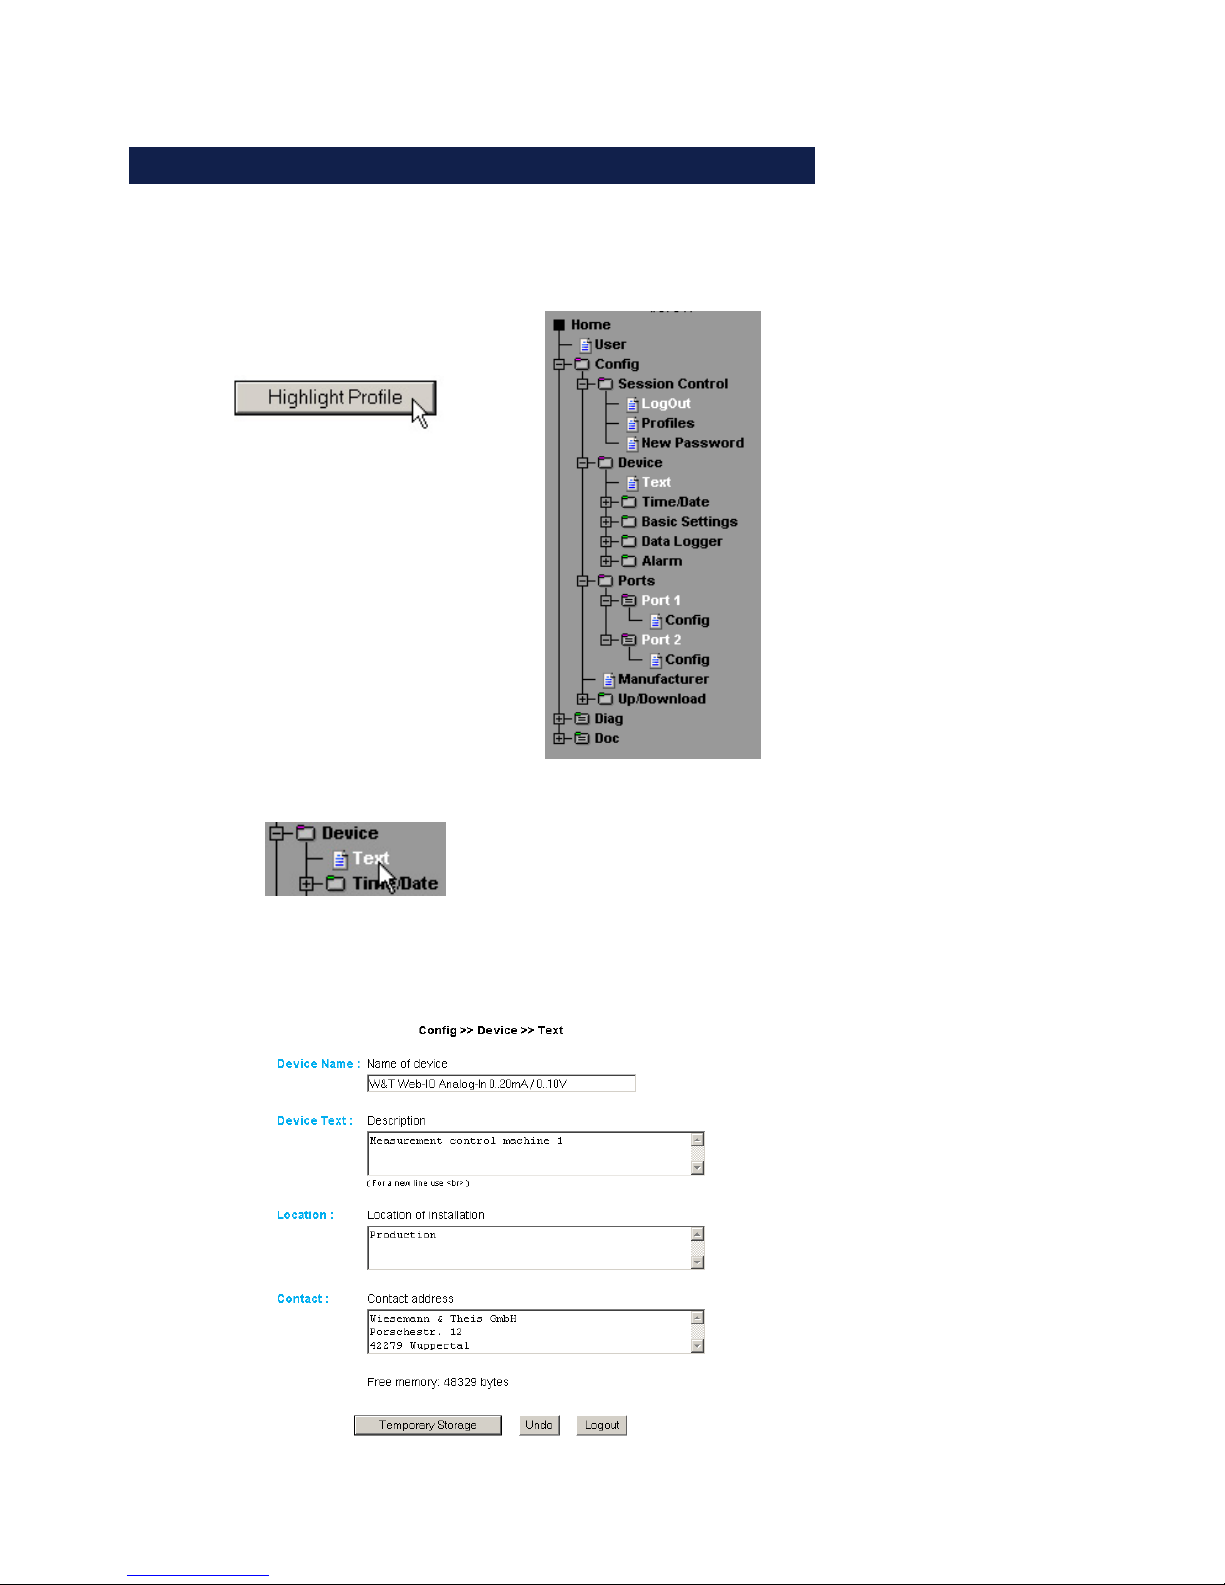
3.1 Configuring the port and device names
3.1.1 Text
Enter your personal descriptions in the field provided and then
click on „Send“.
Page 23

23
W&T
3.1.2 Ports
Port 1..2:
First enter a name and a descrptive text for the port and select the
measuring range to calibrate the input circuit to your measuring
location (for models 57641, 57642 only: measuring range 0..20mA
or 4..20mA). To deactivate the port, select „Disconnect“.
Configuring the current input (57641, 57642):
Configuring the voltage input (57641, 57643):
Page 24
24
W&T
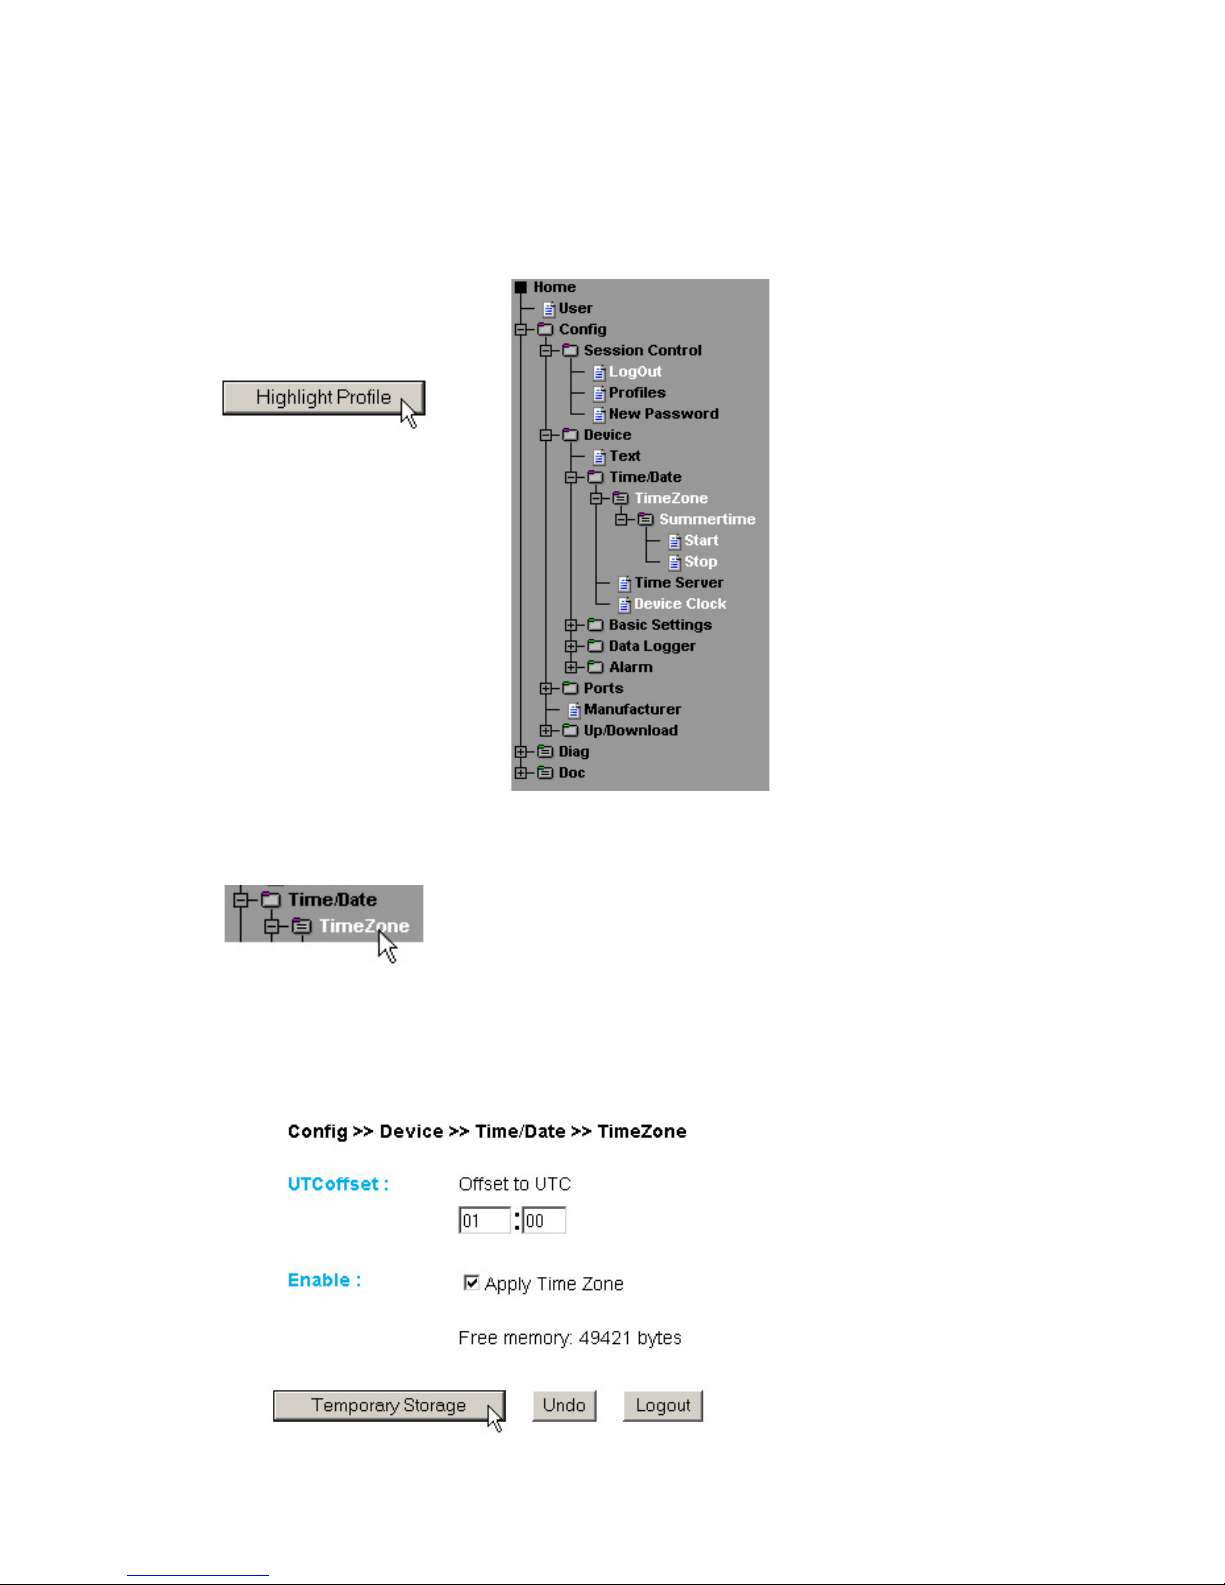
3.2 Local time setting
3.2.1 Time zone
Here you define the time zone in which the device is located.
The settings refer to UTC (Coordinated Universal Time ). Then
click on „Send“.
Page 25
25
W&T
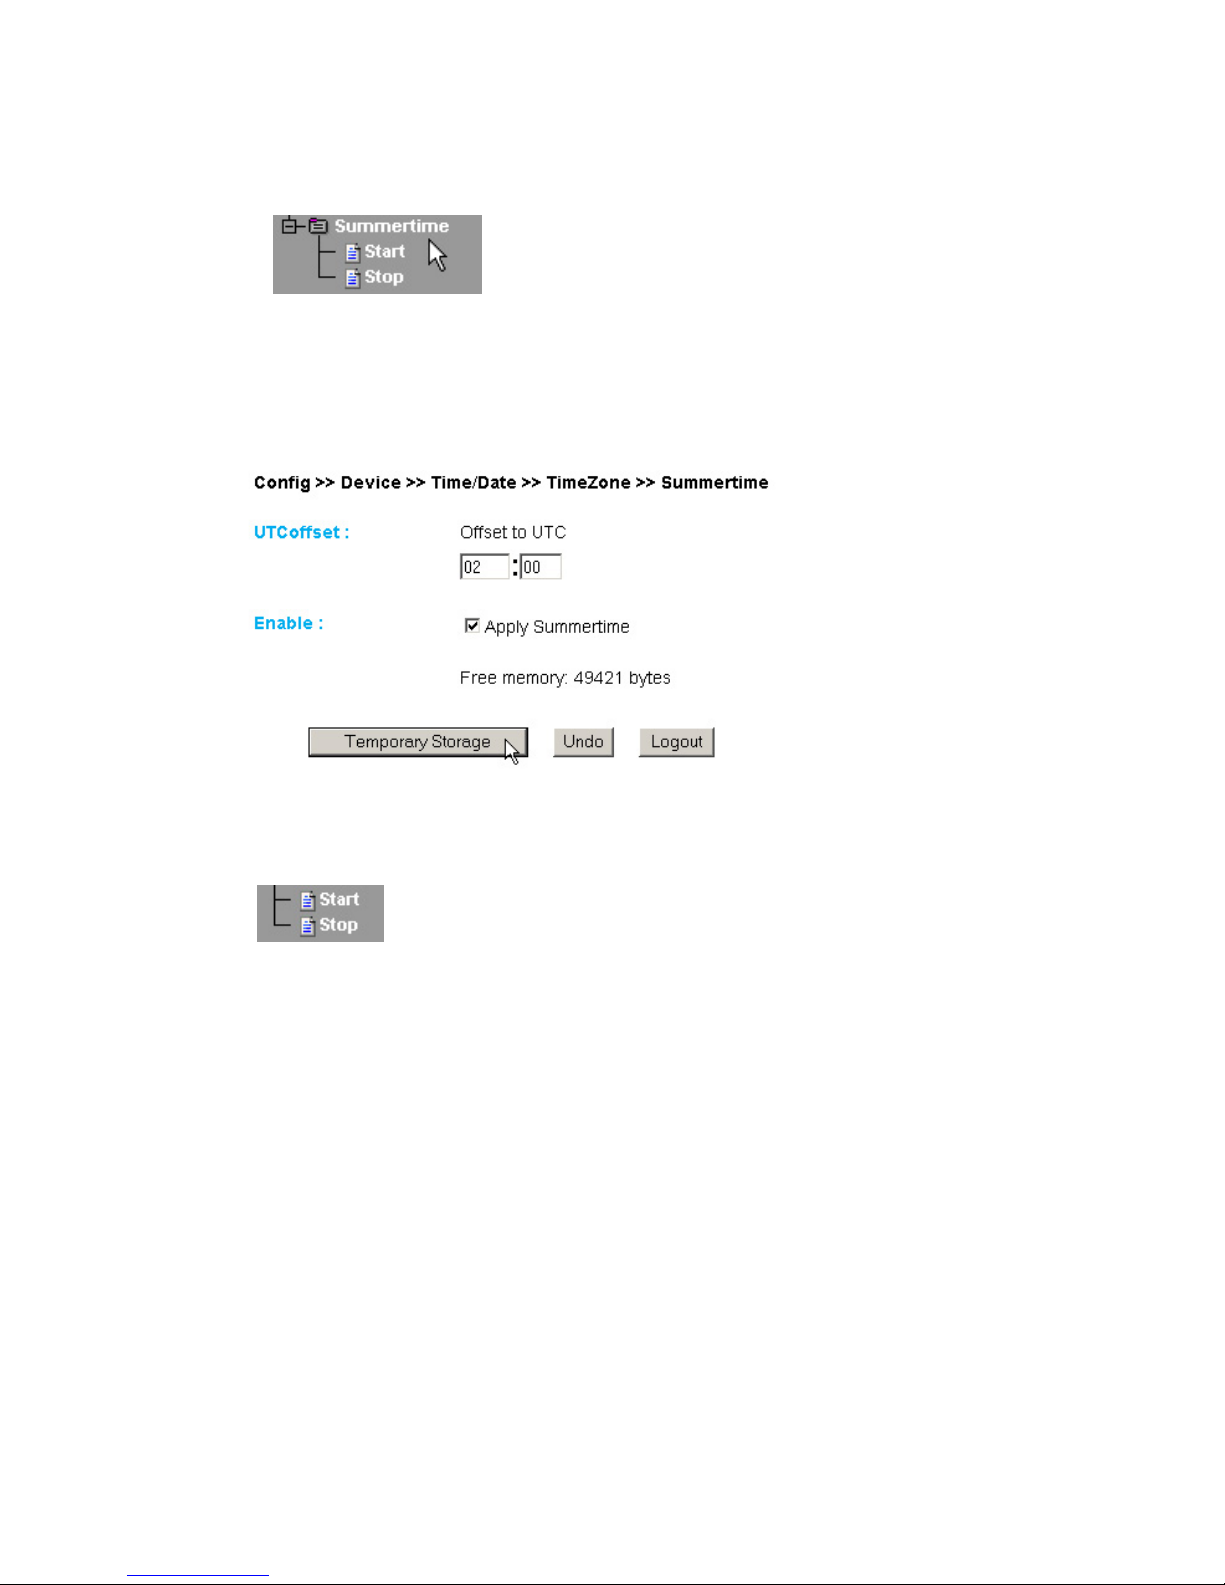
3.2.2 Summer time
If you want your unit to automatically switch to daylight savings
time, first enter the offset to UTC. The standard value (for
Germany etc.) is two hours. Activate this function by selecting
„Apply Summertime“ and buffer store the settings („Send“).
Start/Stop
Define when daylight savings time begins and ends. The
parameters are already pre-configured:
Start:
Last Sunday in March at 02:00 hours
Stop:
Last Sunday in October at 03:00 hours
Page 26

26
W&T
3.2.3 Device Clock
If you choose not to use a timeserver, this allows you to set the
clock manually. Then click on „Logout“ and save your settings.
Page 27

27
W&T
3.3 Automatic time setting using a network time service
3.3.1 Time Server
If you want to adjust the time using a time server, enter here the
necessary information. The preset addresses are just an example
and do not necessarily have to be used.
Page 28

28
W&T
!
If you enter a name as the address, be sure that you first
have configured the Gateway and DNS server so that the
device can resolve the addresses.
Click on the „Logout“ buitton and save your settings.
3.4 Configuring the data logger
3.4.1 Select
Make the following settings:
Timebase: Defines at what time interval the measured data are
stored in the data logger. The device measures in any case every
four seconds.
Select Sensor: The sensor selected here is used for saving the
values in the data logger.
Page 29

29
W&T
!
Attention: If you change
TimebaseTimebase
TimebaseTimebase
Timebase or
Select Sen-Select Sen-
Select Sen-Select Sen-
Select Sen-
sor sor
sor sor
sor the memory will be erased completely.
3.4.2 Clear
Clicking on the „Clear memory“ button deletes the entire contents
of the data logger.
Page 30

30
W&T
3.5.1 Basic Settings
3.5 Configuring the graphics display
Page 31

31
W&T
Enable:
Auto scroll enable: After opening the graphical representation,
the measured values are automatically refreshed. The control
buttons are not available when using the Auto Scroll function.
Show table: Shows the current values in table format as well.
Show graph: Activates graph representation of the measured
values.
Show control buttons: Shows the control buttons.
Show config menu: Shows the configuration menu for the graph
representation below the control buttons.
Width: Enter here the desired width of the graph display.
Height: Enter here the desired height of the graph display
Page 32

32
W&T
Frame Color: Enter here the desired color for the border of the
graph, or select a color from the color selector below:
Background Color: Select here the color for the background of
the graph. This color is also used as a background for the
table.
Polling Rate: Enter here the desired refresh rate for the graph.
The device provides a new value no sooner than after 0,5
seconds. Entering a value of less than 0,5 is not useful.
3.5.2 Select Sensor
Page 33

33
W&T
Graphics Selection:
You can set the following parameters for each sensor:
Activate/deactivate Sensor X: (Checkbox selected/deselected)
Sensor Color: Enter the desired sensor color, or use the color
selector to choose.
Show extreme values: If a zoom level is selected in the graph in
which a display point represents a measuring interval and not
an individual measuring point, this function is used to display
the maximum and minimum measured in this interval. If the
zoom level is selected such that every measured value is
displayed, this function has no effect. If the function is
deactivated, the average value of the displayed interval is
displayed.
Scale 1 2 : For multi-channel devices you can show multiple
Y-axes at the same time in the graph. These can be for example
different measurands. Specify here which scale you want to
assign the respective sensor to. For single-channel devices of
course only one scale is available.
Page 34

34
W&T
3.5.3 Scale Config
Scale:
The graph can display four different scales. Each individual
scale can be assigned the following parameters:
unit: The unit used for this scale.
min: The lowest displayed value on this scale
max: The highest displayed value on this scale
auto scale: The lower and upper values for this scale are
selected automatically based on the measured values, so that
an optimal, dynamic display is achieved. If this function is
activated, the existing parameters „min“ and „max“ are ignored.
auto fit: If this function is activated, the scale is corrected so
that only whole-number values are shown on the display grid.
Auto fit automatically activates the auto scale function.
Page 35

35
W&T
3.6 Calibration
You can calibrate the port with the help of single-point, twopoint reference measurements and corresponding offset value
entries.
In single-poing compensation the entered value is added to the
measured value, whereas in two-point compensation a straight line
is calculated for compensating the entire measuring range.
The user can enter a comment for remembering calibration
procedures.
Page 36

36
W&T
Config:
If you want the measured value to correspond to a certain
physical quantity (e.g. 10mA corresponds to 50hPa), you can
configure the display value for 0% to 100% of the measuring
range including the associated unit. This configuration is used
for all outputs.
Page 37

37
W&T
3.7 Browser access
3.7.1 HTTP
Startup: Here you specify which HTML page should be displayed
when the device starts up.
Page 38

38
W&T
3.8 E-mail alarms
3.8.1 Basic Settings -> Mail
Here you make the basic settings for sending alarms via e-mail.
HTTP Port: You can use this port to access the device. The default
setting is the standard HTTP Port 80. If you would like to use a
different port, it may have to be explicitly indicated when the page
is opened:
http://webio:<PortNr>
Page 39

39
W&T
The e-mail function allows you to forward an information or alarm
mail to one or more e-mail or SMS recipients.
Name: Enter here the name that should appear as the sender.
ReplyAddr: This is the reply address with which the device
identifies itself.
MailServer: In the next step set the IP address of your mail server
or its host name (for a configured DNS server) you want the device
to use. If the e-mail port does is not the standard port 25, you may
append the port to the address using a colon:
Page 40

40
W&T
mail.provider.de:476
Authentication: If the mail server requires authentication, set here
the corresponding procedure for user identification.
SMTP authentication off: No authentication
ESMTP: A user name and password are required for logging in to
the mail server.
SMTP after POP3: For an SMTP access it is necessary to first
make access using POP3 so that the user can be identified. For
this setting enter in addition an associated POP3 server.
Enable: Be sure that the checkbox „Mail enable“ for sending e-mail
is checked.
Page 41

41
W&T
3.8.2 Alarm X
Here you configure the desired alarm conditions.
Page 42

42
W&T
Trigger: Here you define the trigger for the alarm e-mail. Multiple
selections are allowed.
To send a message wihtout an alarm condition, check only the
„Timer“ box.
Min./Max.: Specifies the lower and upper limit. The range within
these limits is considered „valid“.
Hysteresis: You can also specify a hysteresis value based on
which the alarm status is reset. This function prevents ‚flickering‘
arou9nd the limit value.
Page 43

43
W&T
Delay Time: Triggering of the alarm is delayed by this time (in
minutes) for momentary limit violations.
Interval: Enter here the send interval (in minutes) at which a
message should be sent assuming the alarm function is enabled.
If you want to send just a single message, enter here an „E“.
Timer: This timer interval is based on the CRON service such as
is used in Linux/Unix systems. Valid characters are:
* : stands for all valid values in the respective input field (e.g. all
minutes or all hours)
- : specifies a range of from ... to .. For example, weekday „2-4“
stands for Tuesday to Thursday, whereas entering a „*“ triggers the
timer on all weekdays.
/ : Interval within the entered range , e.g. minute „0-45/2“ starts the
timer in the range between the 0th and 45th minute every two
minutes (0, 2, 4, 6 ,8, 10, ... , 44).
, : specifies an absolute value. For example minute 0, 15, 30 starts
the timer on the hour, quarter-hour and half=hour.
This function requires that the „Timer“ box be checked.
Enable: For selecting the type of message. For an e-mail alarm
check the Mail enable“ box.
Page 44

44
W&T
E-Mail-Addr: Enter here the e-mail address of the recipient. To
send the e-mail to multiple recipients, separate the addresses from
each other with a semicolon.
Subject & Mailtext: Specify the subject line and the mail-text
of the e-mail. In these text fields the following tags will be also
accepted. The device exchanges these tags with the actual
values.
3.8.3 Alarm X -> Mail
The actual content of the e-mail is selected under this menu item.
Page 45

45
W&T
Function
comma spelling
(##,####)
dot spelling (##.####)
<M1> <m1>
Measurand 1: Displays the
value for channel 1.
<M2> <m2>
Measurand 2: Displays the
value for channel 2.
Displays the actual time and
date as a strin
g
.
Year (####): Displays the
y
ear.
Month (##): Displays the
month.
Da
y
(##): Displays the day.
Hour (##): Dis
play
s the hour.
Minute (##): Displays the
minute.
Second (##): Displays the
second.
<Z>
W&T tag date + time
<$y>
<$m>
<$d>
<$h>
<$i>
<$s>
W&T tag value
Attach thermo.csv enable: The „Attach therno.csv enable“
option allows you to attach the entire contents of the data
logger in semicolon-delineated CSV format as a mail
attachment. The time base for the output corresponds to the
pre-settings you have made for the data logger.
!
The file is generated dynamically in the unit, so that
whenthe contents of the logger is large the assembly of
the CSV file may take up to 30 seconds. During this time
no other mail may be sent. Pending alarms are executed
directly after the mail with attachment has been sent.
CSV-Data since last report: This option causes that only the
data is written into the CSV file, which is measured since the
last transmission interval.
!
This function only works properly if only the timer
function is selected and no limit values are configured.
Alarm Clear Text: In addition, an Alarm Clear message is sent
when the measured value has reentered the valid zone. Here
you may use the same tags as for the alarm message itself.
Page 46

46
W&T
3.9.1 Basic Settings -> SNMP
Here you define the basic settings needed for SNMP operation.
Sending alarm messages as an SNMP trap.
Community String: Read: Use this string to read the
configuration in your SNMP manager.
Community String: Read-Write: Use this string to both read
and write the configuration in your SNMP manager.
Manager IP: Contains the address of your SNMP manager. The
SNMP messages from the W&T unit are sent to this address.
System Traps: Two system traps can be created.
3.9 SNMP incl. alarm sending via Trap
Page 47

47
W&T
Cold Start: When power is disconnected/fails.
Warm Start: At device reset.
SNMP Enable: To use the SHMP functionality, check this box.
3.9.2 Alarm X -> SNMP
The actual contents of the SNMP trap is specified under this
menu item.
Page 48

48
W&T
Manager IP: Contains the IP address of your SNMP manager.
The SNMP messages from the W&T unit are sent to this address.
Trap Text: Specifies the text of the trap. In this text field the
following tags will be also accepted. The device exchanges
these tags with the actual values.
Alarm Clear Text: In addition, an Alarm Clear message is sent
when the temperature value has reentered the valid zone. Here
you may use the same tags as for the alarm message itself.
Function
comma spelling
(##,####)
dot spelling (##.####)
<M1> <m1>
Measurand 1: Displays the
value for channel 1.
<M2> <m2>
Measurand 2: Displays the
value for channel 2.
Displays the actual time and
date as a strin
g
.
Year (####): Displays the
y
ear.
Month (##): Displays the
month.
Da
y
(##): Displays the day.
Hour (##): Dis
play
s the hour.
Minute (##): Displays the
minute.
Second (##): Displays the
second.
<Z>
W&T tag date + time
<$y>
<$m>
<$d>
<$h>
<$i>
<$s>
W&T tag value
Page 49

49
W&T
3.10.1 Alarm X -> TCP:
IP Addr: The IP address where you want the message sent.
Port: The recipient must have a TCP server service on this port
which can accept incoming connections.
TCP Text: The text corresponds to the same specifications as for
the other message types.
Alarm Clear Text: s.o.
3.10 Sending alarms via TCP (Client Mode)
Send alarm messages as a TCP packet.
Page 50

50
W&T
3.11 Sending alarms via FTP (Client Mode)
Write the measured values to an FTP server.
Page 51

51
W&T
FTP Account: Some FTP servers require a special Account entry
for the login. If this is the case for your server, enter the account
name here.
Options / PASV: If this option is enabled the server is instructed
to work in passive mode. This means that the data connection is
opened by the Web-Thermo-Hygrograph. If this option is disabled
the FTP server handles opening of the data connection. If the
server is protected by a firewall, you are encouraged to enable the
PASV option, since otherwise connection attempts could be
blocked.
Enable: Check this box to use the FTP functionality.
3.11.1 Basic Settings -> FTP
Here you will find the basic settings needed for FTP operation.
FTP Server IP: Enter here the IP address or the host name of the
FTP server yhou want to send the data to.
FTP Control Port: This is the port needed for the connection. The
standard prot for FTP accesses is 21. This port is already set as
shipped, and should function on most systems right out of the box.
If you require a different port, consult your network administrator.
User: Enter the user name required for the FTP access.
Password: This is the password assigned to the user.
Page 52

52
W&T
3.11.2 Alarm X -> FTP
FTP Local Data Port: This is the local data port on the WebThermo-Hygrograph. Values between 1 and 65536 are permitted.
Entering „AUTO“ causes the device to select the port dynamically.
File Name: Enter here the path to the file you want the device to
access.
FTP Alarm Text: Specifies the text of the ftp content. In this
text field the following tags will be also accepted. The device
exchanges these tags with the actual values.
Page 53

53
W&T
If you want a line feed after every data send, insert a CRLF by
pressing the RETURN key at the end of the line.
Alarm Clear Text: This message is sent after the alarm state is
ended. The same tags as above may be used.
Options:
STORE: Stores a file and writes the data into it. If this file already
exists, it is overwritten.
APPEND: Appends the data to an existing file. If the file does not
yet exist, it is created.
Function
comma spelling
(##,####)
dot spelling (##.####)
<M1> <m1>
Measurand 1: Displays the
value for channel 1.
<M2> <m2>
Measurand 2: Displays the
value for channel 2.
Displays the actual time and
date as a strin
g
.
Year (####): Displays the
y
ear.
Month (##): Displays the
month.
Da
y
(##): Displays the day.
Hour (##): Dis
play
s the hour.
Minute (##): Displays the
minute.
Second (##): Displays the
second.
<Z>
W&T tag date + time
<$y>
<$m>
<$d>
<$h>
<$i>
<$s>
W&T tag value
Page 54

54
W&T
3.12 Sending alarms via Syslog
IP Addr: This is the IP address you want the message sent to.
Port: On the receiver end there must be a Syslog server service
on this port which can accept incoming connections (Standard:
514).
Syslog Text: The text is subject to the same specifications as
apply to the other message types.
Alarm Clear Text: see above
Page 55

55
W&T
3.13 ASCII command strings via TCP Port 80
3.13.1 HTTP
When queried by an HTTP Get command, the device can also
send a header with IP address and name of the device along with
the measured value. To enable this, check the corresponding box.
If this function is deactivated, only the measured value is sent.
Page 56

56
W&T
Here again you may include the header, which is included with
the measured value.
3.14 ASCII command strings via UDP
In addition to TCP/IP commands the device can also reply to UDP
datagrams. For this the port which the device is supposed to
„listen“ to must be set. The default setting is 42279. The enable
function turns UDP on.
Page 57

57
W&T
3.15 UP-/Download
In the Download area yo can download the XML configuration
as well as the three user pages (home.htm, user.htm, log.htm)
for further processing.
With XML download you can read out the Web-IO Analog-In
settings, make any changes and save them to the device using
XML Upload.
!
Some Web browsers the correct code is only output using
„View -> Show (Frame-) source text“ after the „XML
Download“ button has been actuated.
For XML Upload you create or change a text file using the
corresponding parameters and load this file into the device. The
Web-IO Analog-In configuration must begin with the expression
<io-AIN2.3>
and end with the expression
</io-AIN2.3>
The sequence of the parameters you set corresponds to the
sequence in the configuration menu starting with „Device“.
The syntax for configuring using XML is as follows:
<Option>
<Parameter1> VALUE </Parameter1>
<Parameter2> VALUE </Parameter2>
</Option>
In addition, you can exchange the user pages (user.htm,
home.htm, log.htm) in the Upload area.
An example can be found in the Appendix (6.2).
Page 58

58
W&T
The individual options and parameters correspond to the
configuration items in the browser menu.
!
Please note, especially when carrying out mass updates
orconfigurations, the IP address stored in the XML file
isalways sent also, and that it must first be set
accordingly.
An example can be found in the Appendix (7.2).
You may use menu item „Upload -> GIF“ to exchange the logo
displayed in the menu and save it directly in the W&T device.
Page 59

59
W&T
4 Individual querying of measured values
4.1 Querying via TCP/IP
It is possible to use a socket connection for manually querying
the current measurements in CSV format (comma separated
data). This function as well is used for querying the single data
without the Web interface.
Send the following string to Port 80:
GET /logger.csv
To query the single, current measured value on Port 1, send:
GET /Single1
To query the single, current measured value on Port 2, send:
GET /Single2
4.2 Querying via UDP
Open a UDP connection to the IP address of the device or to
the NED ID as a broadcast and Port 42279 (preset is modifiable).
Then send one of the expressions listed under 3.1 to the device
and the device will return the measured values on the port you are
using.
i
When using multiple devices, it may be practical to send
the name and the IP address of the device at the same
time. To do this, activate the item „GET Header enable“
under „Config >> Device >> Basic Settings >> HTTP“.
Page 60

60
W&T
4.3 Querying via SNMP
The sensor can be queried directly using SNMP Get instructions.
You reach the measuring port through the following path:
<IP-Address> 1.3.6.1.4.1.5040.1.2.10.1.3.1.1.1 = Measured value
1 as octet string.
<IP-Address> 1.3.6.1.4.1.5040.1.2.10.1.4.1.1.1 = Measured value
as integer value in thousandths, without comma separation.
<IP-Address> 1.3.6.1.4.1.5040.1.2.10.1.3.1.1.2 = Measured value
1 as octet string.
<IP-Adresse> 1.3.6.1.4.1.5040.1.2.10.1.4.1.1.2 = Measured value
2 als Integer-Wert in tausendstel, ohne Kommatrennung.
The IDs for the different device types are:
#57641: 1.3.6.1.4.1.5040.1.2.10...
#57642: 1.3.6.1.4.1.5040.1.2.11...
#57643: 1.3.6.1.4.1.5040.1.2.12...
!
Use the configured SNMP-Read or Read/Write-Community
for the query.
An MIB for incorporating into management applications is available
for downloading on the data sheet page of the WuT homepage at
http://www.wut.de.
If you would like to use SNMP to change settings in the device
(IP address, subnet mask, etc.), it is necessary to first use the
SNMP manager to start a session on the device.
Page 61

61
W&T
Entering the administrator password in the variable
wtWebGraphAnalogIn57641SessCntrlPassword
opens a session. By reading out the variable
wtWebGraphAnalogIn57641SessCntrlConfigMode
you can check whether the session was successfully opened.
1 = Session opened, device in configuration mode.
0 = Opening of the session failed. Check whether the
password was incorrectly entered if a password has been
assigned.
After the session has been successfully opened, the variables
defined in the private MIB can be used to make any desired
configuration changes.
After the configuration is finished, the session is closed by
writing the variable
wtWebGraphAnalogIn57641SessCntrlLogout
wtWebGraphAnalogIn57641SessCntrlLogout=
1 All changes are saved
2 Quit without saving
If no SNMP communication takes place during an open session
for a period of 5 minutes or longer, the device unilaterally quits
the session and no changes are saved.
1
Opening an SNMP session has priority over an
HTTPlogin. That means: A user with Config or
Adminstratorrights loses his browser access as soon
as an SNMP session is opened.
The description for the individual SNMP variables, OIDs etc. can
be found in the private MIB.
Page 62

62
W&T
5 Java Applets - Auto-updating in the browser
Visualizing states int he browser based on pure HTTP or HTMP
allows only a snapshot. What is displayed is the status at the time
the Web page was opened. The only way to see a state change is
to reload the complete Web page.
A Java applet is implemented in the Web-IO Analog-In for
displaying current states in the browser.
In order to enable the most flexible utilization, the Java applet
invokes pre-defined Javascript functions which must be declared
in the head of the HTML page.
5.1 Working with the Java applet
You incorporate the applet using the <applet> HTML tag,
whereby the standard parameters archive and code are set as
follows:
archive="A.jar"
code="A.class"
The remaining parameters are set individually based on the
application.
name=“Analog“
The term Analog was randomly selected here and can be replaced
by any other desired term. The only important thing is that when
invoking the applet functions using JavaScript the same name is
used.
codebase="IP-Adresse des Web-IO Analog-In"
If the Web page from which the applet is loaded is loaded directly
from the Web-IO as user.htm or home.htm, you can skip the
codebase parameter.
Page 63

63
W&T
width="0" declaration in Pixel
height="0" declaration in Pixel
Since the applet does not contain a visual component, width and
height should always be 0.
mayscript
This option allows the Java applet to use JavaScript code in the
HTML document.
In addition, several other Web-IO-specific parameters can be set,
each of which is inserted in its own <param> tag:
device
Whole number value between 0 and 255. The device parameter is
used for indexing when more than one Web-IO is operated on a
single Web page.
If you are using only one Web-IO Analog-In, set the value to 0. For
all additional devices incorporated into the Web page, the value is
incremented by 1.
showerrors
If errors occur when using the Java applet, this parameter can be
used to specify whether an error message in the form of an alert
window will be output.
For showerrors you can set on or off as value.
sensorpolling
This parameter is used to specify when the applet is started
whether the ports should be checked for their measure value at the
interval set under pollingrate.
For sensorpolling you can set on or off as value.
pollingrate
This parameter is used to specify (using value) at what interval
(in ms) the ports should be updated.
Page 64

64
W&T
Here is an example:
<applet name="Analog" archive="A.jar" code="A.class"
codebase="http://192.168.0.5" width="0" height="0" mayscript>
<param name="device" value="0">
<param name="showerrors" value="off">
<param name="sensorpolling" value="on">
<param name="pollingrate" value="500">
</applet>
1
Both the parameters and the values are case-sensitive.
5.2 Using the applet with JavaScript
To be able to work with the applet, a corresponding JavaScript
function must be declared in the header of the Web page.
function sensorChanged( iDevice, iSensor, iVal )
{ program code carried out when the measured value changes)
The above function is invoked by the applet when a change is
detected on the measuring inputs. iDevice indicates on which WebIO Analog-In a value changed. iSensor indicates which port (0 or
1) changed. The variable iVal indicates the actual measured value.
Page 65

65
W&T
!
Please note that the function name is case-sensitive.
The following source text shows a short example for dynamic
display of Port 0.
<html>
<head>
<script language="JavaScript" type="text/javascript">
<!--
function sensorChanged( iDevice, iSensor, iVal )
{ if (iSensor == 0 && iDevice == 0)
{ document.getElementById( 'port' + iSensor ).firstChild.data = iVal;
}
}
//-->
</script>
</head>
<body>
<applet name="Analog" archive="A.jar" code="A.class"
codebase="http://192.168.0.5" width="0" height="0">
<param name="device" value="0">
<param name="showerrors" value="off">
<param name="sensorpolling" value="on">
<param name="pollingrate" value="4">
</applet>
<p>current value port 0:</p>
<p id="port0">0</p>
</body>
</html>
!
When working with ports, note the following: If polling is
is activated, the associated JavaScript function must be
declared in the HTMP text so that there are no runtime
errors.
Page 66

66
W&T
i
A more detailed example for use of the Java applet can be
found on the Web page app.htm, which can be opened in
the Web-IO.
Open: http://<ip-adresse>/app.htm
Page 67

67
W&T
6 Data Logger
The Web-IO Analog-In stores all them measured values in a fixed
ring memory, so that they are still intact even after a power loss or
after pressing the Reset button.
i
The measuring data in the data logger are obtained
through the user page of the device (Home -> User bzw.
http://xxx.xxx.xxx.xxx/user.htm).
Under Config -> Device -> Data Logger -> Memory you can clear
the memory.
An interruption of the time line, such as resulting from a reset
or a subsequent time server synchronization, is represented on
the data logger page as a yellow line.
i
If alarm limits are set, measured values that are not
within the valid range are highlighted in red.
time line interruption:
yellow marked line
Page 68

68
W&T
7 Appendix
7.1 Alternate IP address assignment
7.1.1 Using DHCP-/BOOTP protocol
Many networks use DHCP (Dynamic Host Configuration Protocol)
or BOOTP for centralized and dynamic assigning of the IP
addresses. It makes no difference to the Web-IO devices which of
the two protocols is used in any given case, since DHCP is simply
a downward compatible extension of BOOTP. DHCP servers also
make use of requests from BOOTP clients.
The following parameters can be assigned to the Web-IO AnalogIn using these protocols:
■ IP address
■ Subnet mask
■ Gateway address
It is not possible to configure any other parameters or lease time.
Functionality
To obtain an IP address, the unit sends a corresponding BOOTP
request as a broadcast after each new start. The reply generated
by the DHCP/BOOTP server contains the IP address as well as the
subnet mask and gateway address. The device immediately stores
this information in its non-volatile memory.
Page 69

69
W&T
Please consult your system administrator when starting up the
device in DHCP/BOOTP networks. If the address is assigned using
DHCP, you must also indicate that a reserved IP address is
required. To integrate this into the respective address database,
the administrator needs the Ethernet address of the device, which
can be found on the housing sticker.
Once the necessary entries have been made, the device
automatically retrieves the desired IP address after each reset. To
ensure the Web-IO Analog-In can still be reached should the
DHCP/BOOTP server be down, the previous IP address is retained
if no reply is forthcoming.
!
In DHCP environments the IP address to be assigned
must be reserved by means of a fixed link to the Ethernet
address of the device. Under Windows NT this is done in
the DHCP Manager under menu item „Reservations“. Linux
provices the file „dhcpd.conf“ for this purpose, where the
corresponding entry must be made.
7.1.2 ...using ARP commnand
The prerequisite is a PC located in the same network segment
as the Web-IO Analog-In and which has TCP/IP protocol
installed on it. Read off the MAC address for the device (e.g.
EN=00C03D0012FF). Under Windows you first ping another
network device and then use the command line indicated below to
make a static entry in the ARP table of the computer:
Page 70

70
W&T
arp -s <IP-Adresse> <MAC-Adresse>
e.g. under Windows:
arp -s 172.0.0.10 00-C0-3D-00-12-FF
e.g. under SCO UNIX:
arp -s 172.0.0.10 00:C0:3D:00:12:FF
Then ping the device again (in our example ping 172.0.0.10). The
IP aeddress is now stored in the non-volatile memory.
!
This method can only be used if no other IP address has
already been assigned to the device, i.e. the entry is
0.0.0.0. To change an already existing IP address you must
open the configuration menu from your browser.
7.1.4 ...using RARP-Server (UNIX only)
Working with an RARP server activated under UNIX is based on
entries in the configuration files, /etc/ethers and
/etc/hosts. First expand /etc/ethers by one line by assigning the
Ethernet address of the device to the desired IP address. In /etc/
hosts the link is then established with an alias name. After you
have connected the device in the network segment of the RARP
server, you can use the network to assign the desired IP address
to the device.
Example:
Your Web-IO Analog-In has MAC address EN=00C03D0012FF
(sticker on the housing). You want to assign IP address 172.0.0.10
and alias WT_1 to it.
Entry in the file /etc/hosts: 172.0.0.10 WT_1
Entry in the file /etc/ethers: 00:C0:3D:00:12:FF WT_1
If the RARP daemon is not yet activated, you must start it now
using the command „rarpd -a“.
Page 71

71
W&T
<w&t_tags=session>
inserts an invisible session control so that the user is not logged
out from the device when leaving the page. The expression is only
needed if you want to create your own button for sending. Insert
this expression between <form action> and </form>.
Background color:
Background colors for the values shown in tables can be used for
indicating the sensor state:
7.2 Example for creating your own Web pages
You can freely configure the standard display pages of the
device (user.htm, home.htm, log.htm). Special control elements
can be inserted into the page using tags. In the following you
will find an example for creating the page „user.htm“.
Create an HTML page which must begin with the expression
<user.htm> (bzw. log.htm oder home.htm)
Then you enter the HTMP code.
You can display the following parameters on your page:
<w&t_tags=m1>
displays the current measured value of the first port.
<w&t_tags=m2>
displays the current measured value of the second port.
<w&t_tags=time>
inserts the current time.
<w&t_tags=steps>
inserts a list box for selecting the time steps to be displayed.
<w&t_tags=ok_button>
inserts an „OK“ button for sending the selected parameters to the
device.
Page 72

72
W&T
<w&t_tag=bc1>
describes a backgrouind color (BGColor) that varies with the alarm
state of the first port. If there is a limit violation, this color is red.
Otherwise the tag does not describe an explicit color. This tag is
used for example to show limit violations in red in the log table.
<w&t_tag=bc2>
Background color for the second port.
<w&t_tags=sensorx>
inserts the name of sensor x into the page and contains a link for
the complete sensor description.
<w&t_tags=device_name>
inserts the assigned device name.
<w&t_tags=device_text>
inserts the freely configurable, descriptive text for the device.
<w&t_tags=location>
<w&t_tags=contact>
inserts the respective text elements, which are configured
under Config >> Device >> Text.
<w&t_tags=reload_button>
inserts a „Reload“ button for reloading the current page.
<w&t_tags=previous_button>
<w&t_tags=next_button>
inserts a button for moving ahead or back in the table.
!
The „Previous“ button and the „Next“ button only have
any meaning in the „log.htm“ file.
<w&t_tags=logtable>
inserts a table with the current measurements. You can navigate
this table only on the „log“ page using the „Next“ and „Previous“
buttons (see above). On both the other pages (user.htm,
home.htm) only the current measured values can be displayed.
Page 73

73
W&T
Example for setting a background color in a table:
<tr>
<td colspan="3" align="center">
<table border="2">
<tr>
<th><w&t_tags=sensor1></th>
</tr>
<tr>
<td <w&t_tags=bct>><w&t_tags=m1> mA</td>
</tr>
</table></td>
</tr>
The measured value is highlighted in red when there is a limit
violation.
To specify the output format for the data, insert the following line
into your document:
<form action="log.htm" method="POST" >
....
</form>
CSV output can be specified using the expression
<form action="logger.csv" method="POST" >
....
</form>
!
Resetting the device to its factory defaults restores the
original HTML pages.
Page 74

74
W&T
Example for user.htm:
<user.htm>
<html>
<head>
<title>Untitled Document</title>
<meta http-equiv="Content-Type" content="text/html; charset=iso-8859-1">
</head>
<body bgcolor="#FFFFFF" text="#000000">
<p>Web-IO Analog-In</p>
<p>Time: <w&t_tags=time></p>
<p><w&t_tags=sensor1>: <w&t_tags=m1></p>
<p> </p>
<form action="log.htm" method="POST">
<p>Output data logger:</p>
<p><w&t_tags=steps></p>
<p><w&t_tags=ok_button></p>
</form>
<form action="logger.csv" method="POST">
<p>Output CSV:</p>
<p><w&t_tags=steps></p>
<p><w&t_tags=ok_button></p>
</form>
<form action="user.htm" method="GET">
<p><w&t_tags=reload_button></p>
</form>
</body>
</html>
Page 75

75
W&T
This page is displayed by the Web-IO Analog-In in the Web
browser as follows:
Page 76

76
W&T
Example for log.htm:
<log.htm>
<html>
<head>
<title>Untitled Document</title>
<meta http-equiv="Content-Type" content="text/html; charset=iso-8859-1">
</head>
<body bgcolor="#FFFFFF" text="#000000">
<form action="log.htm" method="POST">
<w&t_tags=previous_button>
</form>
<w&t_tags=logtable>
<form action="log.htm" method="POST">
<w&t_tags=next_button>
</form>
</body>
</html>
Page 77

77
W&T
This page is displayed by the Web-IO Analog-In in the Web
browser as follows:
Page 78

78
W&T
7.3 Firmware update
The operating software for the Web-IO Analog-In is being
constantly enhanced. The following section describes how to
upload the firmware when new versions become available.
. Where do I obtain the current firmware?
. Firmware update over the network under Windows
7.3.1 Where do I obtain the current firmware?
The most up to date firmware version including the available
update tools and a revision history are published on our Web
pages under the following address: http://www.wut.de
Before downloading, first write down the 5-digit part number
printed on the label of the Web-IO Analog-In. From the homepage
yo ureach the product overview sorted by article numbers, from
which you can get directly to the data sheet for the device. Follow
the link to the current version of the firmware.
7.3.2 Firmware update over the network under Windows
The prerequisite is a PC running under Windows 9x/NT/2000/
XP with a network connection and activated TCP/IP stack. For
the update process you will need two files which, as already
described, are available for downloading at http://www.wut.de.
· the executable update tool for sending the firmware to the
Web-IO Analog-In
· the file with the new firmware you want to load into the device
Page 79

79
W&T
No special preparation of the device is needed for the firmware
update.
The WuTility used for the update recognizes all WuT devices
located in its network and is for the most part self-explanatory. If
you do have questions or if anything is unclear, please refer to the
accompanying documentation or try our online help.
!
Never intentionally interrupt the update process by dis-
connecting power or activating the Reset button. The Web-
IO Analog-In will be inoperable following an incomplete
firmware update.
Never mixes files having different version numbers in the file name.
This will result in inoperability of the device.
The Web-IO Analog-In automatically recognizes when uploading of
the new firmware is complete and performs an autonomous reset.
Page 80

80
W&T
7.3.3 LED indicators
■ Power-LED: Indicates the presence of supply voltage. If the
LED is not on, please check for proper connection of the power
supply.
■ Status-LED: Flashes whenever there is network activity. The
Web-IO Analog-In is not receiving a link pulse from a hub or
switch. Please check the cable or the hub/switch port.
■ Error-LED: The Error LED uses various blink codes to indicate
error conditions on the device or network port.
1x blinking of the Error-LED = Check network connection.
The Web-IO Analog-In is not receiving a link pulse from a hub
or switch. Please check the cable or the hub/switch port.
2x or 3x blinking of the Error-LED = Interrupt the power
supply to perform a reset. If the error has not cleared, reset the
device to its factory defaults. Since all the network settings will
be reset, you should write down your network setting before
performing the reset.
Config -> Session Control -> LogOut -> Restore Defaults
After a reset the device is restored to its factory defaults.
Reconfigure your network settings.
■ Power-LED Status-LED Error-LED on
= Self-test error
The self-test performed after each reset of the device was not
able to be carried out successfully - due for example to an
incomplete update of the firmware. In this state the device is
inoperable. Please return the device for repair.
Page 81

81
W&T
Auxiliary-LEDs (internal)
■ on error http://xxx.xxx.xxx.xxx/diag -LED: Indicates internal
configuration errors. For diagnostic information open page
http://xxx.xxx.xxx.xxx/diag in the device.
■ system error: Serious hardware error. Try restarting the device
by interrupting turning power off and on. If the problem persists,
return the unit for service.
!
If the device has no IP address or the address is 0/0/0/0,
the LEDs „on error“ and „system error“ remain on after a
reset or new start. The system error LED flashes 3x after a
short time. The LEDs do not turn off until an IP address has been
assigned.
Page 82

82
W&T
7.4 Technical Data
Prod. No.: 57641, 57642, 57643
Current in
p
ut: 0..20mA, 100Ohm (57641, 57642)
Volta
g
e input: 0..10V, 1MOhm (57641, 57643)
Network: 10/100BaseT autosensin
g
Power su
pply
: 12-24V AC / DC via terminal screw
Measurement unit
Resolution: Current in
p
ut: 2µA, Voltage input: 1,20mV
max. 0,4% FSR (Full Scale Ran
g
e 0..20mA, 0..10V)
TA = 0-60°C
Savin
g
frequency: 1, 5, 15, 60 min
Memor
y
(834k): min. 79 days, max. 17 years
Deviation of internal clock: max. 4
,
32 min. / month
Data logging (request via
Network and alarm trigger):
2/second
Saving in internal
1/minute
data logger:
Additional infos
Galvanic isolation: In
p
ut vs. Network: min. 500 Volt
Mail function: Mail for sendin
g
alarm or reports
DC 12V .. 48V (+/-10%)
AC 9Veff (-5%) - 24Veff (+5%)
AVG: 185mA @12VDC, 90mA @24VDC
Housin
g
: Plastic housing, 105x75x22mm
Wei
g
ht: approx. 200g
Stora
g
e temperature: -40..+70°
C
Operating ambient temperature: 0 .. +60°C
Current consumption:
Measuring error:
Power supply:
Page 83

83
W&T
7.5 Declaration of Conformity
 Loading...