

Page 1

Wireshark User's Guide
for Wireshark 1.9
Ulf Lamping,
Richard Sharpe, NS Computer Software and Services P/L
Ed Warnicke,
Page 2

Wireshark User's Guide: for Wireshark 1.9
by Ulf Lamping, Richard Sharpe, and Ed Warnicke
Copyright © 2004-2012 Ulf Lamping , Richard Sharpe , Ed Warnicke
Permission is granted to copy, distribute and/or modify this document under the terms of the GNU General Public License, Version 2 or any later
version published by the Free Software Foundation.
All logos and trademarks in this document are property of their respective owner.
Page 3

Preface ............................................................................................................................ ix
1. Foreword .............................................................................................................. ix
2. Who should read this document? .............................................................................. ix
3. Acknowledgements ................................................................................................ ix
4. About this document ............................................................................................... x
5. Where to get the latest copy of this document? ............................................................. x
6. Providing feedback about this document ..................................................................... x
1. Introduction ................................................................................................................... 1
1.1. What is Wireshark? .............................................................................................. 1
1.1.1. Some intended purposes .............................................................................. 1
1.1.2. Features ................................................................................................... 1
1.1.3. Live capture from many different network media ............................................. 2
1.1.4. Import files from many other capture programs ............................................... 2
1.1.5. Export files for many other capture programs .................................................. 2
1.1.6. Many protocol decoders .............................................................................. 2
1.1.7. Open Source Software ................................................................................ 3
1.1.8. What Wireshark is not ................................................................................ 3
1.2. System Requirements ............................................................................................ 3
1.2.1. General Remarks ....................................................................................... 3
1.2.2. Microsoft Windows .................................................................................... 3
1.2.3. Unix / Linux ............................................................................................. 4
1.3. Where to get Wireshark? ....................................................................................... 5
1.4. A brief history of Wireshark .................................................................................. 5
1.5. Development and maintenance of Wireshark ............................................................. 6
1.6. Reporting problems and getting help ........................................................................ 6
1.6.1. Website .................................................................................................... 6
1.6.2. Wiki ........................................................................................................ 6
1.6.3. Q&A Forum ............................................................................................. 7
1.6.4. FAQ ........................................................................................................ 7
1.6.5. Mailing Lists ............................................................................................. 7
1.6.6. Reporting Problems .................................................................................... 7
1.6.7. Reporting Crashes on UNIX/Linux platforms .................................................. 8
1.6.8. Reporting Crashes on Windows platforms ...................................................... 9
2. Building and Installing Wireshark .................................................................................... 10
2.1. Introduction ....................................................................................................... 10
2.2. Obtaining the source and binary distributions ........................................................... 10
2.3. Before you build Wireshark under UNIX ................................................................ 11
2.4. Building Wireshark from source under UNIX .......................................................... 13
2.5. Installing the binaries under UNIX ......................................................................... 14
2.5.1. Installing from rpm's under Red Hat and alike ............................................... 14
2.5.2. Installing from deb's under Debian, Ubuntu and other Debian derivatives ............. 14
2.5.3. Installing from portage under Gentoo Linux .................................................. 14
2.5.4. Installing from packages under FreeBSD ...................................................... 14
2.6. Troubleshooting during the install on Unix .............................................................. 15
2.7. Building from source under Windows ..................................................................... 15
2.8. Installing Wireshark under Windows ...................................................................... 15
2.8.1. Install Wireshark ...................................................................................... 15
2.8.2. Manual WinPcap Installation ...................................................................... 17
2.8.3. Update Wireshark ..................................................................................... 18
2.8.4. Update WinPcap ...................................................................................... 18
2.8.5. Uninstall Wireshark .................................................................................. 18
2.8.6. Uninstall WinPcap .................................................................................... 18
3. User Interface ............................................................................................................... 19
3.1. Introduction ....................................................................................................... 19
iii
Page 4

Wireshark User's Guide
3.2. Start Wireshark .................................................................................................. 19
3.3. The Main window .............................................................................................. 19
3.3.1. Main Window Navigation .......................................................................... 21
3.4. The Menu ......................................................................................................... 21
3.5. The "File" menu ................................................................................................. 22
3.6. The "Edit" menu ................................................................................................. 25
3.7. The "View" menu ............................................................................................... 27
3.8. The "Go" menu .................................................................................................. 31
3.9. The "Capture" menu ............................................................................................ 32
3.10. The "Analyze" menu ......................................................................................... 33
3.11. The "Statistics" menu ......................................................................................... 35
3.12. The "Telephony" menu ...................................................................................... 37
3.13. The "Tools" menu ............................................................................................. 39
3.14. The "Internals" menu ......................................................................................... 39
3.15. The "Help" menu .............................................................................................. 40
3.16. The "Main" toolbar ........................................................................................... 42
3.17. The "Filter" toolbar ........................................................................................... 44
3.18. The "Packet List" pane ....................................................................................... 45
3.19. The "Packet Details" pane .................................................................................. 46
3.20. The "Packet Bytes" pane .................................................................................... 46
3.21. The Statusbar ................................................................................................... 47
4. Capturing Live Network Data .......................................................................................... 49
4.1. Introduction ....................................................................................................... 49
4.2. Prerequisites ...................................................................................................... 49
4.3. Start Capturing ................................................................................................... 50
4.4. The "Capture Interfaces" dialog box ....................................................................... 50
4.5. The "Capture Options" dialog box ......................................................................... 52
4.5.1. Capture frame .......................................................................................... 54
4.5.2. Capture File(s) frame ................................................................................ 54
4.5.3. Stop Capture... frame ................................................................................ 55
4.5.4. Display Options frame .............................................................................. 55
4.5.5. Name Resolution frame ............................................................................. 56
4.5.6. Buttons ................................................................................................... 56
4.6. The "Edit Interface Settings" dialog box ................................................................. 56
4.7. The "Add New Interfaces" dialog box .................................................................... 59
4.7.1. Add or remove pipes ................................................................................ 60
4.7.2. Add or hide local interfaces ....................................................................... 61
4.7.3. Add or hide remote interfaces ..................................................................... 62
4.8. The "Remote Capture Interfaces" dialog box ............................................................ 62
4.8.1. Remote Capture Interfaces ......................................................................... 63
4.8.2. Remote Capture Settings ........................................................................... 64
4.9. The "Interface Details" dialog box ......................................................................... 65
4.10. Capture files and file modes ................................................................................ 65
4.11. Link-layer header type ....................................................................................... 67
4.12. Filtering while capturing .................................................................................... 67
4.12.1. Automatic Remote Traffic Filtering ............................................................ 69
4.13. While a Capture is running ... .............................................................................. 69
4.13.1. Stop the running capture .......................................................................... 70
4.13.2. Restart a running capture ......................................................................... 70
5. File Input / Output and Printing ....................................................................................... 71
5.1. Introduction ....................................................................................................... 71
5.2. Open capture files ............................................................................................... 71
5.2.1. The "Open Capture File" dialog box ............................................................ 71
5.2.2. Input File Formats .................................................................................... 73
iv
Page 5

Wireshark User's Guide
5.3. Saving captured packets ....................................................................................... 74
5.3.1. The "Save Capture File As" dialog box ........................................................ 75
5.3.2. Output File Formats .................................................................................. 76
5.4. Merging capture files .......................................................................................... 77
5.4.1. The "Merge with Capture File" dialog box .................................................... 78
5.5. Import text file ................................................................................................... 79
5.5.1. The "File import" dialog box ...................................................................... 80
5.6. File Sets ............................................................................................................ 81
5.6.1. The "List Files" dialog box ........................................................................ 82
5.7. Exporting data .................................................................................................... 82
5.7.1. The "Export as Plain Text File" dialog box ................................................... 83
5.7.2. The "Export as PostScript File" dialog box .................................................... 85
5.7.3. The "Export as CSV (Comma Separated Values) File" dialog box ...................... 87
5.7.4. The "Export as C Arrays (packet bytes) file" dialog box ................................... 87
5.7.5. The "Export as PSML File" dialog box ........................................................ 87
5.7.6. The "Export as PDML File" dialog box ........................................................ 89
5.7.7. The "Export selected packet bytes" dialog box ............................................... 91
5.7.8. The "Export Objects" dialog box ................................................................. 93
5.8. Printing packets .................................................................................................. 94
5.8.1. The "Print" dialog box .............................................................................. 94
5.9. The Packet Range frame ...................................................................................... 95
5.10. The Packet Format frame ................................................................................... 95
6. Working with captured packets ........................................................................................ 97
6.1. Viewing packets you have captured ....................................................................... 97
6.2. Pop-up menus .................................................................................................... 98
6.2.1. Pop-up menu of the "Packet List" column header ........................................... 98
6.2.2. Pop-up menu of the "Packet List" pane ....................................................... 100
6.2.3. Pop-up menu of the "Packet Details" pane ................................................... 102
6.3. Filtering packets while viewing ........................................................................... 104
6.4. Building display filter expressions ........................................................................ 105
6.4.1. Display filter fields ................................................................................. 106
6.4.2. Comparing values ................................................................................... 106
6.4.3. Combining expressions ............................................................................ 107
6.4.4. A common mistake ................................................................................. 108
6.5. The "Filter Expression" dialog box ....................................................................... 109
6.6. Defining and saving filters .................................................................................. 110
6.7. Defining and saving filter macros ......................................................................... 112
6.8. Finding packets ................................................................................................. 112
6.8.1. The "Find Packet" dialog box ................................................................... 112
6.8.2. The "Find Next" command ....................................................................... 113
6.8.3. The "Find Previous" command .................................................................. 113
6.9. Go to a specific packet ...................................................................................... 113
6.9.1. The "Go Back" command ........................................................................ 113
6.9.2. The "Go Forward" command .................................................................... 113
6.9.3. The "Go to Packet" dialog box .................................................................. 113
6.9.4. The "Go to Corresponding Packet" command ............................................... 113
6.9.5. The "Go to First Packet" command ............................................................ 114
6.9.6. The "Go to Last Packet" command ............................................................ 114
6.10. Marking packets .............................................................................................. 114
6.11. Ignoring packets .............................................................................................. 114
6.12. Time display formats and time references ............................................................ 115
6.12.1. Packet time referencing .......................................................................... 115
7. Advanced Topics ......................................................................................................... 117
7.1. Introduction ..................................................................................................... 117
v
Page 6

Wireshark User's Guide
7.2. Following TCP streams ...................................................................................... 117
7.2.1. The "Follow TCP Stream" dialog box ......................................................... 117
7.3. Expert Infos ..................................................................................................... 118
7.3.1. Expert Info Entries ................................................................................. 119
7.3.2. "Expert Info" dialog ................................................................................ 120
7.3.3. "Colorized" Protocol Details Tree .............................................................. 120
7.3.4. "Expert" Packet List Column (optional) ...................................................... 121
7.4. Time Stamps .................................................................................................... 121
7.4.1. Wireshark internals ................................................................................. 121
7.4.2. Capture file formats ................................................................................ 122
7.4.3. Accuracy ............................................................................................... 122
7.5. Time Zones ...................................................................................................... 122
7.5.1. Set your computer's time correctly! ............................................................ 123
7.5.2. Wireshark and Time Zones ....................................................................... 124
7.6. Packet Reassembling ......................................................................................... 125
7.6.1. What is it? ............................................................................................ 125
7.6.2. How Wireshark handles it ........................................................................ 125
7.7. Name Resolution .............................................................................................. 126
7.7.1. Name Resolution drawbacks ..................................................................... 126
7.7.2. Ethernet name resolution (MAC layer) ....................................................... 127
7.7.3. IP name resolution (network layer) ............................................................ 127
7.7.4. IPX name resolution (network layer) .......................................................... 128
7.7.5. TCP/UDP port name resolution (transport layer) ........................................... 128
7.8. Checksums ....................................................................................................... 128
7.8.1. Wireshark checksum validation ................................................................. 129
7.8.2. Checksum offloading ............................................................................... 129
8. Statistics .................................................................................................................... 130
8.1. Introduction ..................................................................................................... 130
8.2. The "Summary" window .................................................................................... 130
8.3. The "Protocol Hierarchy" window ........................................................................ 131
8.4. Conversations ................................................................................................... 133
8.4.1. What is a Conversation? .......................................................................... 133
8.4.2. The "Conversations" window .................................................................... 133
8.4.3. The protocol specific "Conversation List" windows ....................................... 134
8.5. Endpoints ........................................................................................................ 134
8.5.1. What is an Endpoint? .............................................................................. 134
8.5.2. The "Endpoints" window ......................................................................... 135
8.5.3. The protocol specific "Endpoint List" windows ............................................ 136
8.6. The "IO Graphs" window ................................................................................... 136
8.7. Service Response Time ...................................................................................... 137
8.7.1. The "Service Response Time DCE-RPC" window ......................................... 138
8.8. Compare two capture files .................................................................................. 138
8.9. WLAN Traffic Statistics ..................................................................................... 140
8.10. The protocol specific statistics windows .............................................................. 140
9. Telephony .................................................................................................................. 141
9.1. Introduction ..................................................................................................... 141
9.2. RTP Analysis ................................................................................................... 141
9.3. VoIP Calls ....................................................................................................... 141
9.4. LTE MAC Traffic Statistics ................................................................................ 142
9.5. LTE RLC Traffic Statistics ................................................................................. 142
9.6. The protocol specific statistics windows ................................................................ 143
10. Customizing Wireshark ............................................................................................... 144
10.1. Introduction .................................................................................................... 144
10.2. Start Wireshark from the command line ............................................................... 144
vi
Page 7

Wireshark User's Guide
10.3. Packet colorization .......................................................................................... 150
10.4. Control Protocol dissection ................................................................................ 153
10.4.1. The "Enabled Protocols" dialog box ......................................................... 153
10.4.2. User Specified Decodes .......................................................................... 154
10.4.3. Show User Specified Decodes ................................................................. 155
10.5. Preferences ..................................................................................................... 156
10.5.1. Interface Options .................................................................................. 157
10.6. Configuration Profiles ...................................................................................... 158
10.7. User Table ..................................................................................................... 160
10.8. Display Filter Macros ....................................................................................... 160
10.9. ESS Category Attributes ................................................................................... 160
10.10. GeoIP Database Paths ..................................................................................... 161
10.11. IKEv2 decryption table ................................................................................... 161
10.12. Object Identifiers ........................................................................................... 162
10.13. PRES Users Context List ................................................................................ 162
10.14. SCCP users Table .......................................................................................... 162
10.15. SMI (MIB and PIB) Modules .......................................................................... 163
10.16. SMI (MIB and PIB) Paths ............................................................................... 163
10.17. SNMP Enterprise Specific Trap Types ............................................................... 163
10.18. SNMP users Table ......................................................................................... 163
10.19. Tektronix K12xx/15 RF5 protocols Table ........................................................... 164
10.20. User DLTs protocol table ................................................................................ 164
11. Lua Support in Wireshark ........................................................................................... 165
11.1. Introduction .................................................................................................... 165
11.2. Example of Dissector written in Lua ................................................................... 165
11.3. Example of Listener written in Lua ..................................................................... 166
11.4. Wireshark's Lua API Reference Manual ............................................................... 167
11.5. Saving capture files ......................................................................................... 167
11.5.1. Dumper ............................................................................................... 167
11.5.2. PseudoHeader ....................................................................................... 168
11.6. Obtaining dissection data .................................................................................. 169
11.6.1. Field ................................................................................................... 169
11.6.2. FieldInfo ............................................................................................. 170
11.6.3. Non Method Functions ........................................................................... 171
11.7. GUI support ................................................................................................... 171
11.7.1. ProgDlg ............................................................................................... 171
11.7.2. TextWindow ........................................................................................ 172
11.7.3. Non Method Functions ........................................................................... 175
11.8. Post-dissection packet analysis ........................................................................... 177
11.8.1. Listener ............................................................................................... 177
11.9. Obtaining packet information ............................................................................. 178
11.9.1. Address ............................................................................................... 178
11.9.2. Column ............................................................................................... 179
11.9.3. Columns .............................................................................................. 180
11.9.4. NSTime ............................................................................................... 180
11.9.5. Pinfo ................................................................................................... 181
11.9.6. PrivateTable ......................................................................................... 184
11.10. Functions for writing dissectors ........................................................................ 184
11.10.1. Dissector ............................................................................................ 184
11.10.2. DissectorTable .................................................................................... 185
11.10.3. Pref ................................................................................................... 186
11.10.4. Prefs ................................................................................................. 188
11.10.5. Proto ................................................................................................. 188
11.10.6. ProtoField .......................................................................................... 189
vii
Page 8

Wireshark User's Guide
11.10.7. Non Method Functions ......................................................................... 198
11.11. Adding information to the dissection tree ........................................................... 198
11.11.1. TreeItem ............................................................................................ 198
11.12. Functions for handling packet data .................................................................... 200
11.12.1. ByteArray .......................................................................................... 200
11.12.2. Int .................................................................................................... 202
11.12.3. Tvb ................................................................................................... 202
11.12.4. TvbRange .......................................................................................... 203
11.12.5. UInt .................................................................................................. 208
11.13. Utility Functions ............................................................................................ 208
11.13.1. Dir .................................................................................................... 208
11.13.2. Non Method Functions ......................................................................... 208
A. Files and Folders ........................................................................................................ 212
A.1. Capture Files ................................................................................................... 212
A.1.1. Libpcap File Contents ............................................................................. 212
A.1.2. Not Saved in the Capture File .................................................................. 212
A.2. Configuration Files and Folders .......................................................................... 213
A.2.1. Protocol help configuration ...................................................................... 217
A.3. Windows folders .............................................................................................. 219
A.3.1. Windows profiles ................................................................................... 219
A.3.2. Windows 7, Vista, XP, 2000, and NT roaming profiles .................................. 220
A.3.3. Windows temporary folder ...................................................................... 220
B. Protocols and Protocol Fields ........................................................................................ 221
C. Wireshark Messages .................................................................................................... 222
C.1. Packet List Messages ........................................................................................ 222
C.1.1. [Malformed Packet] ................................................................................ 222
C.1.2. [Packet size limited during capture] ........................................................... 222
C.2. Packet Details Messages .................................................................................... 222
C.2.1. [Response in frame: 123] ......................................................................... 222
C.2.2. [Request in frame: 123] ........................................................................... 222
C.2.3. [Time from request: 0.123 seconds] ........................................................... 223
C.2.4. [Stream setup by PROTOCOL (frame 123)] ................................................ 223
D. Related command line tools .......................................................................................... 224
D.1. Introduction ..................................................................................................... 224
D.2. tshark: Terminal-based Wireshark ...................................................................... 224
D.3. tcpdump: Capturing with tcpdump for viewing with Wireshark ................................ 226
D.4. dumpcap: Capturing with dumpcap for viewing with Wireshark ............................... 226
D.5. capinfos: Print information about capture files ....................................................... 227
D.6. rawshark: Dump and analyze network traffic. ....................................................... 229
D.7. editcap: Edit capture files .................................................................................. 229
D.8. mergecap: Merging multiple capture files into one ................................................. 233
D.9. text2pcap: Converting ASCII hexdumps to network captures ................................... 235
D.10. idl2wrs: Creating dissectors from CORBA IDL files ............................................. 237
D.10.1. What is it? .......................................................................................... 237
D.10.2. Why do this? ....................................................................................... 237
D.10.3. How to use idl2wrs .............................................................................. 237
D.10.4. TODO ................................................................................................ 239
D.10.5. Limitations .......................................................................................... 239
D.10.6. Notes ................................................................................................. 239
E. This Document's License (GPL) .................................................................................... 240
viii
Page 9

Preface
1. Foreword
Wireshark is one of those programs that many network managers would love to be able to use, but they are
often prevented from getting what they would like from Wireshark because of the lack of documentation.
This document is part of an effort by the Wireshark team to improve the usability of Wireshark.
We hope that you find it useful, and look forward to your comments.
2. Who should read this document?
The intended audience of this book is anyone using Wireshark.
This book will explain all the basics and also some of the advanced features that Wireshark provides. As
Wireshark has become a very complex program since the early days, not every feature of Wireshark may
be explained in this book.
This book is not intended to explain network sniffing in general and it will not provide details about specific
network protocols. A lot of useful information regarding these topics can be found at the Wireshark Wiki
at http://wiki.wireshark.org
By reading this book, you will learn how to install Wireshark, how to use the basic elements of the graphical
user interface (such as the menu) and what's behind some of the advanced features that are not always
obvious at first sight. It will hopefully guide you around some common problems that frequently appear
for new (and sometimes even advanced) users of Wireshark.
3. Acknowledgements
The authors would like to thank the whole Wireshark team for their assistance. In particular, the authors
would like to thank:
• Gerald Combs, for initiating the Wireshark project and funding to do this documentation.
• Guy Harris, for many helpful hints and a great deal of patience in reviewing this document.
• Gilbert Ramirez, for general encouragement and helpful hints along the way.
The authors would also like to thank the following people for their helpful feedback on this document:
• Pat Eyler, for his suggestions on improving the example on generating a backtrace.
• Martin Regner, for his various suggestions and corrections.
• Graeme Hewson, for a lot of grammatical corrections.
The authors would like to acknowledge those man page and README authors for the Wireshark project
from who sections of this document borrow heavily:
• Scott Renfro from whose mergecap man page Section D.8, “mergecap: Merging multiple capture files
into one ” is derived.
ix
Page 10
Preface
• Ashok Narayanan from whose text2pcap man page Section D.9, “text2pcap: Converting ASCII
hexdumps to network captures ” is derived.
• Frank Singleton from whose README.idl2wrs Section D.10, “idl2wrs: Creating dissectors from
CORBA IDL files ” is derived.
4. About this document
This book was originally developed by Richard Sharpe with funds provided from the Wireshark Fund. It
was updated by Ed Warnicke and more recently redesigned and updated by Ulf Lamping.
It is written in DocBook/XML.
You will find some specially marked parts in this book:
This is a warning!
You should pay attention to a warning, as otherwise data loss might occur.
This is a note!
A note will point you to common mistakes and things that might not be obvious.
This is a tip!
Tips will be helpful for your everyday work using Wireshark.
5. Where to get the latest copy of this document?
The latest copy of this documentation can always be found at: http://www.wireshark.org/docs/.
6. Providing feedback about this document
Should you have any feedback about this document, please send it to the authors through wireshark-
dev[AT]wireshark.org.
x
Page 11

Chapter 1. Introduction
1.1. What is Wireshark?
Wireshark is a network packet analyzer. A network packet analyzer will try to capture network packets
and tries to display that packet data as detailed as possible.
You could think of a network packet analyzer as a measuring device used to examine what's going on
inside a network cable, just like a voltmeter is used by an electrician to examine what's going on inside
an electric cable (but at a higher level, of course).
In the past, such tools were either very expensive, proprietary, or both. However, with the advent of
Wireshark, all that has changed.
Wireshark is perhaps one of the best open source packet analyzers available today.
1.1.1. Some intended purposes
Here are some examples people use Wireshark for:
• network administrators use it to troubleshoot network problems
• network security engineers use it to examine security problems
• developers use it to debug protocol implementations
• people use it to learn network protocol internals
Beside these examples, Wireshark can be helpful in many other situations too.
1.1.2. Features
The following are some of the many features Wireshark provides:
• Available for UNIX and Windows.
• Capture live packet data from a network interface.
• Display packets with very detailed protocol information.
• Open and Save packet data captured.
• Import and Export packet data from and to a lot of other capture programs.
• Filter packets on many criteria.
• Search for packets on many criteria.
• Colorize packet display based on filters.
• Create various statistics.
• ... and a lot more!
However, to really appreciate its power, you have to start using it.
1
Page 12
Introduction
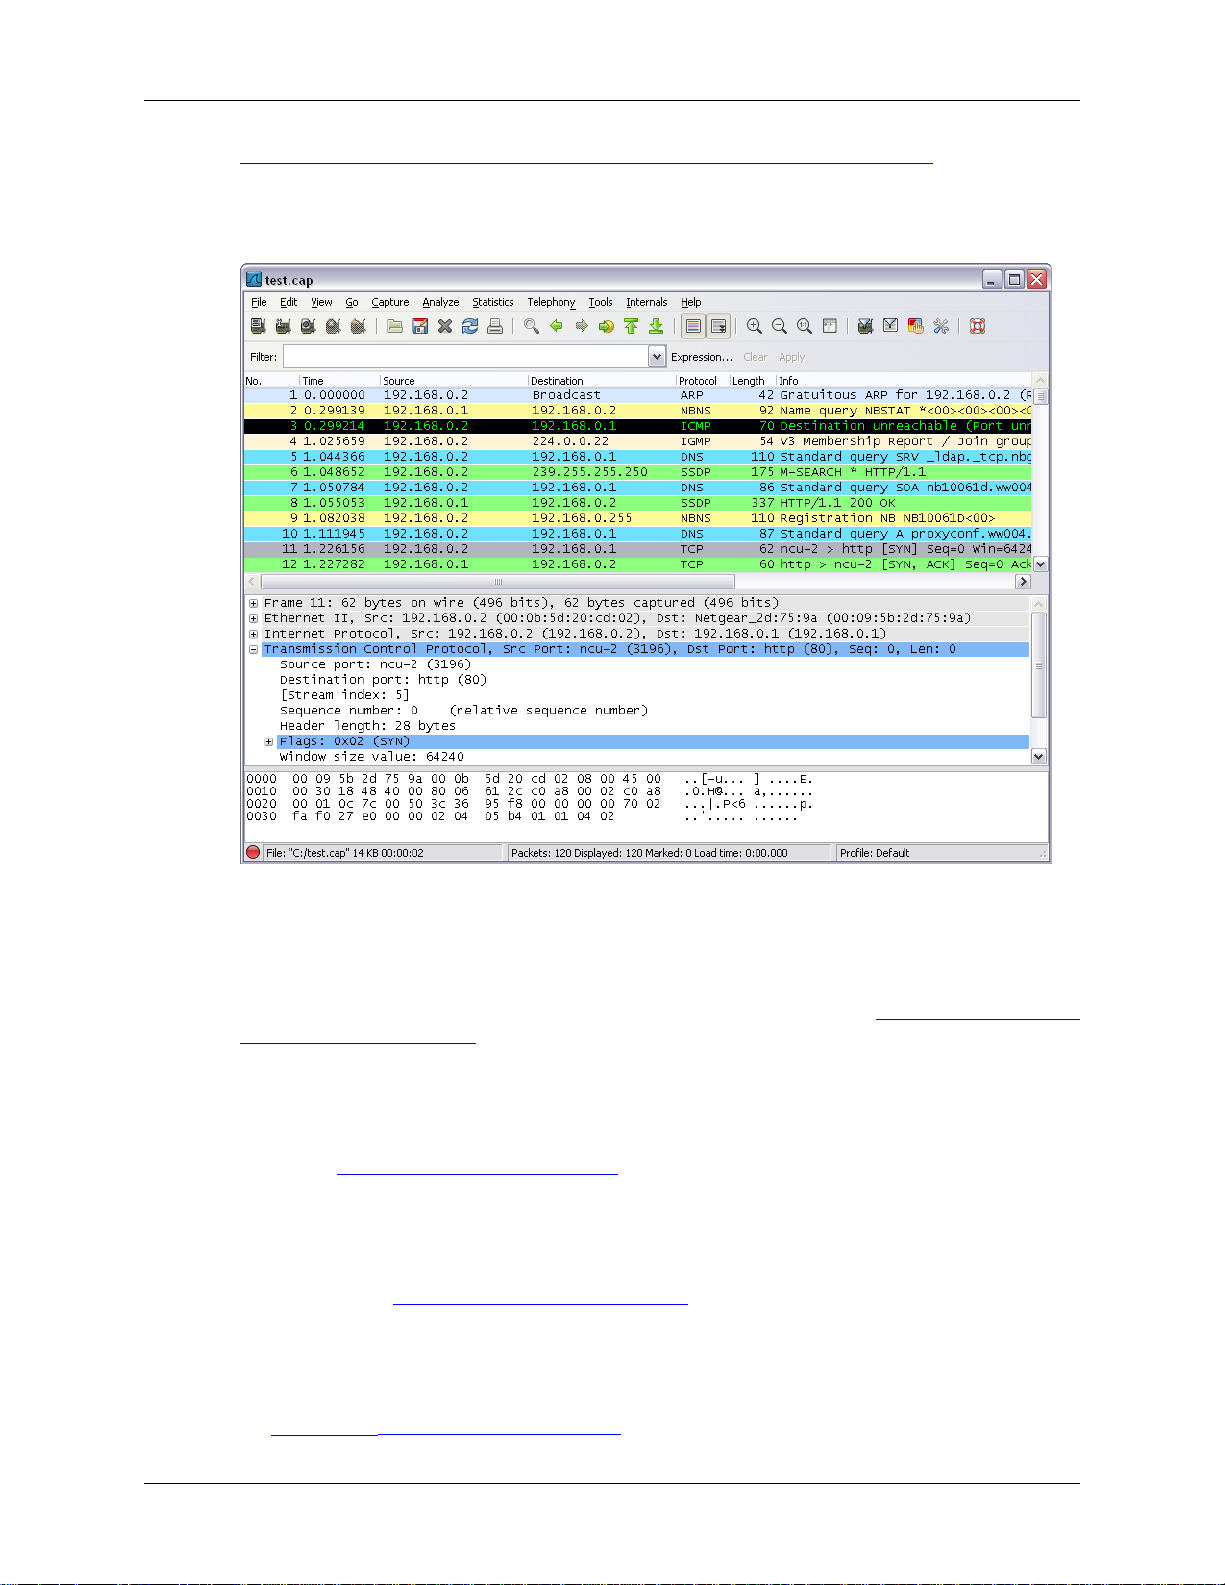
Figure 1.1, “ Wireshark captures packets and allows you to examine their content. ” shows Wireshark
having captured some packets and waiting for you to examine them.
Figure 1.1. Wireshark captures packets and allows you to examine their content.
1.1.3. Live capture from many different network media
Wireshark can capture traffic from many different network media types - and despite its name - including
wireless LAN as well. Which media types are supported, depends on many things like the operating
system you are using. An overview of the supported media types can be found at: http://wiki.wireshark.org/
CaptureSetup/NetworkMedia.
1.1.4. Import files from many other capture programs
Wireshark can open packets captured from a large number of other capture programs. For a list of input
formats see Section 5.2.2, “Input File Formats”.
1.1.5. Export files for many other capture programs
Wireshark can save packets captured in a large number of formats of other capture programs. For a list of
output formats see Section 5.3.2, “Output File Formats”.
1.1.6. Many protocol decoders
There are protocol decoders (or dissectors, as they are known in Wireshark) for a great many protocols:
see Appendix B, Protocols and Protocol Fields.
2
Page 13

Introduction
1.1.7. Open Source Software
Wireshark is an open source software project, and is released under the GNU General Public License
(GPL). You can freely use Wireshark on any number of computers you like, without worrying about license
keys or fees or such. In addition, all source code is freely available under the GPL. Because of that, it is
very easy for people to add new protocols to Wireshark, either as plugins, or built into the source, and
they often do!
1.1.8. What Wireshark is not
Here are some things Wireshark does not provide:
• Wireshark isn't an intrusion detection system. It will not warn you when someone does strange things
on your network that he/she isn't allowed to do. However, if strange things happen, Wireshark might
help you figure out what is really going on.
• Wireshark will not manipulate things on the network, it will only "measure" things from it. Wireshark
doesn't send packets on the network or do other active things (except for name resolutions, but even
that can be disabled).
1.2. System Requirements
What you'll need to get Wireshark up and running ...
1.2.1. General Remarks
• The values below are the minimum requirements and only "rules of thumb" for use on a moderately
used network
• Working with a busy network can easily produce huge memory and disk space usage! For example:
Capturing on a fully saturated 100MBit/s Ethernet will produce ~ 750MBytes/min! Having a fast
processor, lots of memory and disk space is a good idea in that case.
• If Wireshark is running out of memory it crashes, see: http://wiki.wireshark.org/KnownBugs/
OutOfMemory for details and workarounds
• Wireshark won't benefit much from Multiprocessor/Hyperthread systems as time consuming tasks like
filtering packets are single threaded. No rule is without exception: during an "Update list of packets in
real time" capture, capturing traffic runs in one process and dissecting and displaying packets runs in
another process - which should benefit from two processors.
1.2.2. Microsoft Windows
• Windows XP Home, XP Pro, XP Tablet PC, XP Media Center, Server 2003, Vista, 2008, 7, or 2008 R2
• Any modern 32-bit x86 or 64-bit AMD64/x86-64 processor.
• 128MB available RAM. Larger capture files require more RAM.
• 75MB available disk space. Capture files require additional disk space.
• 800*600 (1280*1024 or higher recommended) resolution with at least 65536 (16bit) colors (256 colors
should work if Wireshark is installed with the "legacy GTK1" selection of the Wireshark 1.0.x releases)
3
Page 14

Introduction
• A supported network card for capturing:
• Ethernet: Any card supported by Windows should work. See the wiki pages on Ethernet capture and
offloading for issues that may affect your environment.
• 802.11: See the Wireshark wiki page. Capturing raw 802.11 information may be difficult without
special equipment.
• Other media: See http://wiki.wireshark.org/CaptureSetup/NetworkMedia
Remarks:
• Many older Windows versions are no longer supported for three reasons: None of the developers use
those systems which makes support difficult. The libraries Wireshark depends on (GTK, WinPcap, …)
have dropped support for older releases. Microsoft has also dropped support for these systems.
• Windows 95, 98 and ME are no longer supported. The "old technology" releases of Windows lack
memory protection (specifically VirtualProtect) which we use to improve program safety and security.
The last known version to work was Ethereal 0.10.14 (which includes WinPcap 3.1). You can get it
from http://ethereal.com/download.html. According to this bug report, you may need to install Ethereal
0.10.0 on some systems.
Microsoft retired support for Windows 98 and ME in 2006.
• Windows NT 4.0 no longer works with Wireshark. The last known version to work was Wireshark
0.99.4 (which includes WinPcap 3.1). You still can get it from http://www.wireshark.org/download/
win32/all-versions/wireshark-setup-0.99.4.exe.
Microsoft retired support for Windows NT 4.0 in 2004.
• Windows 2000 no longer works with Wireshark. The last known version to work was Wireshark 1.2.x
(which includes WinPcap 4.1.2). You still can get it from http://www.wireshark.org/download/win32/
all-versions/.
Microsoft retired support for Windows 2000 in 2010.
• Windows CE and the embedded versions of Windows are not currently supported.
• Multiple monitor setups are supported but may behave a bit strangely.
1.2.3. Unix / Linux
Wireshark currently runs on most UNIX platforms. The system requirements should be comparable to the
Windows values listed above.
Binary packages are available for at least the following platforms:
• Apple Mac OS X
• Debian GNU/Linux
• FreeBSD
• Gentoo Linux
• HP-UX
• Mandriva Linux
4
Page 15

Introduction
• NetBSD
• OpenPKG
• Red Hat Enterprise/Fedora Linux
• rPath Linux
• Sun Solaris/i386
• Sun Solaris/Sparc
• Canonical Ubuntu
If a binary package is not available for your platform, you should download the source and try to build it.
Please report your experiences to wireshark-dev[AT]wireshark.org .
1.3. Where to get Wireshark?
You can get the latest copy of the program from the Wireshark website: http://www.wireshark.org/
download.html. The website allows you to choose from among several mirrors for downloading.
A new Wireshark version will typically become available every 4-8 months.
If you want to be notified about new Wireshark releases, you should subscribe to the wireshark-announce
mailing list. You will find more details in Section 1.6.5, “Mailing Lists”.
1.4. A brief history of Wireshark
In late 1997, Gerald Combs needed a tool for tracking down networking problems and wanted to learn
more about networking, so he started writing Ethereal (the former name of the Wireshark project) as a
way to solve both problems.
Ethereal was initially released, after several pauses in development, in July 1998 as version 0.2.0. Within
days, patches, bug reports, and words of encouragement started arriving, so Ethereal was on its way to
success.
Not long after that, Gilbert Ramirez saw its potential and contributed a low-level dissector to it.
In October, 1998, Guy Harris of Network Appliance was looking for something better than tcpview, so he
started applying patches and contributing dissectors to Ethereal.
In late 1998, Richard Sharpe, who was giving TCP/IP courses, saw its potential on such courses, and started
looking at it to see if it supported the protocols he needed. While it didn't at that point, new protocols could
be easily added. So he started contributing dissectors and contributing patches.
The list of people who have contributed to the project has become very long since then, and almost all of
them started with a protocol that they needed that Wireshark or Ethereal did not already handle. So they
copied an existing dissector and contributed the code back to the team.
In 2006 the project moved house and re-emerged under a new name: Wireshark.
In 2008, after ten years of development, Wireshark finally arrived at version 1.0. This release was the first
deemed complete, with the minimum features implemented. Its release coincided with the first Wireshark
Developer and User Conference, called SharkFest.
5
Page 16

Introduction
1.5. Development and maintenance of Wireshark
Wireshark was initially developed by Gerald Combs. Ongoing development and maintenance of Wireshark
is handled by the Wireshark team, a loose group of individuals who fix bugs and provide new functionality.
There have also been a large number of people who have contributed protocol dissectors to Wireshark,
and it is expected that this will continue. You can find a list of the people who have contributed code to
Wireshark by checking the about dialog box of Wireshark, or at the authors page on the Wireshark web site.
Wireshark is an open source software project, and is released under the GNU General Public License
(GPL). All source code is freely available under the GPL. You are welcome to modify Wireshark to suit
your own needs, and it would be appreciated if you contribute your improvements back to the Wireshark
team.
You gain three benefits by contributing your improvements back to the community:
• Other people who find your contributions useful will appreciate them, and you will know that you have
helped people in the same way that the developers of Wireshark have helped people.
• The developers of Wireshark might improve your changes even more, as there's always room for
improvement. Or they may implement some advanced things on top of your code, which can be useful
for yourself too.
• The maintainers and developers of Wireshark will maintain your code as well, fixing it when API
changes or other changes are made, and generally keeping it in tune with what is happening with
Wireshark. So if Wireshark is updated (which is done often), you can get a new Wireshark version from
the website and your changes will already be included without any effort for you.
The Wireshark source code and binary kits for some platforms are all available on the download page of
the Wireshark website: http://www.wireshark.org/download.html.
1.6. Reporting problems and getting help
If you have problems, or need help with Wireshark, there are several places that may be of interest to you
(well, besides this guide of course).
1.6.1. Website
You will find lots of useful information on the Wireshark homepage at http://www.wireshark.org.
1.6.2. Wiki
The Wireshark Wiki at http://wiki.wireshark.org provides a wide range of information related to Wireshark
and packet capturing in general. You will find a lot of information not part of this user's guide. For example,
there is an explanation how to capture on a switched network, an ongoing effort to build a protocol
reference and a lot more.
And best of all, if you would like to contribute your knowledge on a specific topic (maybe a network
protocol you know well), you can edit the wiki pages by simply using your web browser.
6
Page 17

1.6.3. Q&A Forum
The Wireshark Q and A forum at http://ask.wireshark.org offers a resource where questions and answers
come together. You have the option to search what questions were asked before and what answers were
given by people who knew about the issue. Answers are graded, so you can pick out the best ones easily.
If your issue isn't discussed before you can post one yourself.
1.6.4. FAQ
The "Frequently Asked Questions" will list often asked questions and the corresponding answers.
Read the FAQ!
Before sending any mail to the mailing lists below, be sure to read the FAQ, as it will often
answer the question(s) you might have. This will save yourself and others a lot of time (keep
in mind that a lot of people are subscribed to the mailing lists).
You will find the FAQ inside Wireshark by clicking the menu item Help/Contents and selecting the FAQ
page in the dialog shown.
An online version is available at the Wireshark website: http://www.wireshark.org/faq.html. You might
prefer this online version, as it's typically more up to date and the HTML format is easier to use.
Introduction
1.6.5. Mailing Lists
There are several mailing lists of specific Wireshark topics available:
wireshark-announce This mailing list will inform you about new program releases, which usually
appear about every 4-8 weeks.
wireshark-users This list is for users of Wireshark. People post questions about building and
using Wireshark, others (hopefully) provide answers.
wireshark-dev This list is for Wireshark developers. If you want to start developing a
protocol dissector, join this list.
You can subscribe to each of these lists from the Wireshark web site: http://www.wireshark.org. Simply
select the mailing lists link on the left hand side of the site. The lists are archived at the Wireshark web
site as well.
Tip!
You can search in the list archives to see if someone asked the same question some time
before and maybe already got an answer. That way you don't have to wait until someone
answers your question.
1.6.6. Reporting Problems
Note!
Before reporting any problems, please make sure you have installed the latest version of
Wireshark.
When reporting problems with Wireshark, it is helpful if you supply the following information:
7
Page 18
Introduction
1. The version number of Wireshark and the dependent libraries linked with it, e.g. GTK+, etc. You can
obtain this from the about dialog box of Wireshark, or with the command wireshark -v.
2. Information about the platform you run Wireshark on.
3. A detailed description of your problem.
4. If you get an error/warning message, copy the text of that message (and also a few lines before and after
it, if there are some), so others may find the place where things go wrong. Please don't give something
like: "I get a warning while doing x" as this won't give a good idea where to look at.
Don't send large files!
Do not send large files (>100KB) to the mailing lists, just place a note that further data
is available on request. Large files will only annoy a lot of people on the list who are not
interested in your specific problem. If required, you will be asked for further data by the
persons who really can help you.
Don't send confidential information!
If you send captured data to the mailing lists, be sure they don't contain any sensitive or
confidential information like passwords or such.
1.6.7. Reporting Crashes on UNIX/Linux platforms
When reporting crashes with Wireshark, it is helpful if you supply the traceback information (besides the
information mentioned in "Reporting Problems").
You can obtain this traceback information with the following commands:
$ gdb `whereis wireshark | cut -f2 -d: | cut -d' ' -f2` core >& bt.txt
backtrace
^D
$
Note
Type the characters in the first line verbatim! Those are back-tics there!
Note
backtrace is a gdb command. You should enter it verbatim after the first line shown above,
but it will not be echoed. The ^D (Control-D, that is, press the Control key and the D key
together) will cause gdb to exit. This will leave you with a file called bt.txt in the current
directory. Include the file with your bug report.
Note
If you do not have gdb available, you will have to check out your operating system's
debugger.
You should mail the traceback to the wireshark-dev[AT]wireshark.org mailing list.
8
Page 19

Introduction
1.6.8. Reporting Crashes on Windows platforms
The Windows distributions don't contain the symbol files (.pdb), because they are very large. For this
reason it's not possible to create a meaningful backtrace file from it. You should report your crash just like
other problems, using the mechanism described above.
9
Page 20

Chapter 2. Building and Installing Wireshark
2.1. Introduction
As with all things, there must be a beginning, and so it is with Wireshark. To use Wireshark, you must:
• Obtain a binary package for your operating system, or
• Obtain the source and build Wireshark for your operating system.
Currently, several Linux distributions ship Wireshark, but they are commonly shipping an out-of-date
version. No other versions of UNIX ship Wireshark so far, and Microsoft does not ship it with any version
of Windows. For that reason, you will need to know where to get the latest version of Wireshark and how
to install it.
This chapter shows you how to obtain source and binary packages, and how to build Wireshark from
source, should you choose to do so.
The following are the general steps you would use:
1. Download the relevant package for your needs, e.g. source or binary distribution.
2. Build the source into a binary, if you have downloaded the source.
This may involve building and/or installing other necessary packages.
3. Install the binaries into their final destinations.
2.2. Obtaining the source and binary distributions
You can obtain both source and binary distributions from the Wireshark web site: http://
www.wireshark.org. Simply select the download link, and then select either the source package or binary
package of your choice from the mirror site closest to you.
Download all required files!
In general, unless you have already downloaded Wireshark before, you will most likely need
to download several source packages if you are building Wireshark from source. This is
covered in more detail below.
Once you have downloaded the relevant files, you can go on to the next step.
Note!
While you will find a number of binary packages available on the Wireshark web site, you
might not find one for your platform, and they often tend to be several versions behind the
10
Page 21

Building and Installing Wireshark
current released version, as they are contributed by people who have the platforms they are
built for.
For this reason, you might want to pull down the source distribution and build it, as the
process is relatively simple.
2.3. Before you build Wireshark under UNIX
Before you build Wireshark from sources, or install a binary package, you must ensure that you have the
following other packages installed:
• GTK+, The GIMP Tool Kit.
You will also need Glib. Both can be obtained from www.gtk.org
• libpcap, the packet capture software that Wireshark uses.
You can obtain libpcap from www.tcpdump.org
Depending on your system, you may be able to install these from binaries, e.g. RPMs, or you may need
to obtain them in source code form and build them.
If you have downloaded the source for GTK+, the instructions shown in Example 2.1, “Building GTK+
from source” may provide some help in building it:
Example 2.1. Building GTK+ from source
gzip -dc gtk+-2.21.1.tar.gz | tar xvf <much output removed>
cd gtk+-2.21.1
./configure
<much output removed>
make
<much output removed>
make install
<much output removed>
Note!
You may need to change the version number of GTK+ in Example 2.1, “Building GTK+
from source” to match the version of GTK+ you have downloaded. The directory you change
to will change if the version of GTK+ changes, and in all cases, tar xvf - will show you the
name of the directory you should change to.
Note!
If you use Linux, or have GNU tar installed, you can use tar zxvf gtk+-2.21.1.tar.gz. It is
also possible to use gunzip -c or gzcat rather than gzip -dc on many UNIX systems.
Note!
If you downloaded GTK+ or any other tar file using Windows, you may find your file called
gtk+-2_21_1_tar.gz.
11
Page 22

Building and Installing Wireshark
You should consult the GTK+ web site if any errors occur in carrying out the instructions in Example 2.1,
“Building GTK+ from source”.
If you have downloaded the source to libpcap, the general instructions shown in Example 2.2, “Building
and installing libpcap” will assist in building it. Also, if your operating system does not support tcpdump,
you might also want to download it from the tcpdump web site and install it.
Example 2.2. Building and installing libpcap
gzip -dc libpcap-1.0.0.tar.Z | tar xvf <much output removed>
cd libpcap-1.0.0
./configure
<much output removed>
make
<much output removed>
make install
<much output removed>
Note!
The directory you should change to will depend on the version of libpcap you have
downloaded. In all cases, tar xvf - will show you the name of the directory that has been
unpacked.
Under Red Hat 6.x and beyond (and distributions based on it, like Mandrake) you can simply install each of
the packages you need from RPMs. Most Linux systems will install GTK+ and GLib in any case, however
you will probably need to install the devel versions of each of these packages. The commands shown in
Example 2.3, “ Installing required RPMs under Red Hat Linux 6.2 and beyond ” will install all the needed
RPMs if they are not already installed.
Example 2.3. Installing required RPMs under Red Hat Linux 6.2 and beyond
cd /mnt/cdrom/RedHat/RPMS
rpm -ivh glib-1.2.6-3.i386.rpm
rpm -ivh glib-devel-1.2.6-3.i386.rpm
rpm -ivh gtk+-1.2.6-7.i386.rpm
rpm -ivh gtk+-devel-1.2.6-7.i386.rpm
rpm -ivh libpcap-0.4-19.i386.rpm
Note
If you are using a version of Red Hat later than 6.2, the required RPMs have most likely
changed. Simply use the correct RPMs from your distribution.
Under Debian you can install Wireshark using aptitude. aptitude will handle any dependency issues for
you. Example 2.4, “Installing debs under Debian, Ubuntu and other Debian derivatives” shows how to
do this.
Example 2.4. Installing debs under Debian, Ubuntu and other Debian derivatives
aptitude install wireshark-dev
12
Page 23

Building and Installing Wireshark
2.4. Building Wireshark from source under UNIX
Use the following general steps if you are building Wireshark from source under a UNIX operating system:
1. Unpack the source from its gzip'd tar file. If you are using Linux, or your version of UNIX uses GNU
tar, you can use the following command:
tar zxvf wireshark-1.9-tar.gz
For other versions of UNIX, you will want to use the following commands:
gzip -d wireshark-1.9-tar.gz
tar xvf wireshark-1.9-tar
Note!
The pipeline gzip -dc wireshark-1.9-tar.gz | tar xvf - will work here as well.
Note!
If you have downloaded the Wireshark tarball under Windows, you may find that your
browser has created a file with underscores rather than periods in its file name.
2. Change directory to the Wireshark source directory.
3. Configure your source so it will build correctly for your version of UNIX. You can do this with the
following command:
./configure
If this step fails, you will have to rectify the problems and rerun configure. Troubleshooting hints are
provided in Section 2.6, “Troubleshooting during the install on Unix”.
4. Build the sources into a binary, with the make command. For example:
make
5. Install the software in its final destination, using the command:
make install
Once you have installed Wireshark with make install above, you should be able to run it by entering
wireshark.
13
Page 24

Building and Installing Wireshark
2.5. Installing the binaries under UNIX
In general, installing the binary under your version of UNIX will be specific to the installation methods
used with your version of UNIX. For example, under AIX, you would use smit to install the Wireshark
binary package, while under Tru64 UNIX (formerly Digital UNIX) you would use setld.
2.5.1. Installing from rpm's under Red Hat and alike
Use the following command to install the Wireshark RPM that you have downloaded from the Wireshark
web site:
rpm -ivh wireshark-1.9.i386.rpm
If the above step fails because of missing dependencies, install the dependencies first, and then retry the
step above. See Example 2.3, “ Installing required RPMs under Red Hat Linux 6.2 and beyond ” for
information on what RPMs you will need to have installed.
2.5.2. Installing from deb's under Debian, Ubuntu and other Debian derivatives
If you can just install from the repository then use:
aptitude install wireshark
aptitude should take care of all of the dependency issues for you.
Use the following command to install downloaded Wireshark deb's under Debian:
dpkg -i wireshark-common_1.9.0-1_i386.deb wireshark_1.9.0-1_i386.deb
dpkg doesn't take care of all dependencies, but reports what's missing.
Note!
By installing Wireshark packages non-root users won't gain rights automatically to capture
packets. To allow non-root users to capture packets follow the procedure described in /usr/
share/doc/wireshark-common/README.Debian
2.5.3. Installing from portage under Gentoo Linux
Use the following command to install Wireshark under Gentoo Linux with all of the extra features:
USE="adns gtk ipv6 portaudio snmp ssl kerberos threads selinux" emerge wireshark
2.5.4. Installing from packages under FreeBSD
Use the following command to install Wireshark under FreeBSD:
14
Page 25

Building and Installing Wireshark
pkg_add -r wireshark
pkg_add should take care of all of the dependency issues for you.
2.6. Troubleshooting during the install on Unix
A number of errors can occur during the installation process. Some hints on solving these are provided here.
If the configure stage fails, you will need to find out why. You can check the file config.log in the
source directory to find out what failed. The last few lines of this file should help in determining the
problem.
The standard problems are that you do not have GTK+ on your system, or you do not have a recent enough
version of GTK+. The configure will also fail if you do not have libpcap (at least the required include
files) on your system.
Another common problem is for the final compile and link stage to terminate with a complaint of: Output
too long. This is likely to be caused by an antiquated sed (such as the one shipped with Solaris). Since sed
is used by the libtool script to construct the final link command, this leads to mysterious problems. This
can be resolved by downloading a recent version of sed from http://directory.fsf.org/project/sed/.
If you cannot determine what the problems are, send an email to the wireshark-dev mailing list explaining
your problem, and including the output from config.log and anything else you think is relevant, like
a trace of the make stage.
2.7. Building from source under Windows
It is recommended to use the binary installer for Windows, until you want to start developing Wireshark
on the Windows platform.
For further information how to build Wireshark for Windows from the sources, have a look at the
Developer's Guide on the Documentation Page.
You may also want to have a look at the Development Wiki: http://wiki.wireshark.org/Development for
the latest available development documentation.
2.8. Installing Wireshark under Windows
In this section we explore installing Wireshark under Windows from the binary packages.
2.8.1. Install Wireshark
You may acquire a binary installer of Wireshark named something like: wiresharkwinxx-1.9.x.exe. The Wireshark installer includes WinPcap, so you don't need to download and
install two separate packages.
Simply download the Wireshark installer from: http://www.wireshark.org/download.html and execute it.
Beside the usual installer options like where to install the program, there are several optional components.
Tip: Just keep the defaults!
If you are unsure which settings to select, just keep the defaults.
15
Page 26

Building and Installing Wireshark
2.8.1.1. "Choose Components" page
Wireshark
• Wireshark GTK - Wireshark is a GUI network protocol analyzer.
TShark - TShark is a command-line based network protocol analyzer.
Plugins / Extensions (for the Wireshark and TShark dissection engines):
• Dissector Plugins - Plugins with some extended dissections.
• Tree Statistics Plugins - Plugins with some extended statistics.
• Mate - Meta Analysis and Tracing Engine (experimental) - user configurable extension(s) of the
display filter engine, see http://wiki.wireshark.org/Mate for details.
• SNMP MIBs - SNMP MIBs for a more detailed SNMP dissection.
Tools (additional command line tools to work with capture files):
• Editcap - Editcap is a program that reads a capture file and writes some or all of the packets into another
capture file.
• Text2Pcap - Text2pcap is a program that reads in an ASCII hex dump and writes the data into a libpcapstyle capture file.
• Mergecap - Mergecap is a program that combines multiple saved capture files into a single output file.
• Capinfos - Capinfos is a program that provides information on capture files.
• Rawshark - Rawshark is a raw packet filter.
User's Guide - Local installation of the User's Guide. The Help buttons on most dialogs will require an
internet connection to show help pages if the User's Guide is not installed locally.
2.8.1.2. "Additional Tasks" page
• Start Menu Shortcuts - add some start menu shortcuts.
• Desktop Icon - add a Wireshark icon to the desktop.
• Quick Launch Icon - add a Wireshark icon to the Explorer quick launch toolbar.
• Associate file extensions to Wireshark - Associate standard network trace files to Wireshark.
2.8.1.3. "Install WinPcap?" page
The Wireshark installer contains the latest released WinPcap installer.
If you don't have WinPcap installed, you won't be able to capture live network traffic, but you will still
be able to open saved capture files.
• Currently installed WinPcap version - the Wireshark installer detects the currently installed WinPcap
version.
• Install WinPcap x.x - if the currently installed version is older than the one which comes with the
Wireshark installer (or WinPcap is not installed at all), this will be selected by default.
16
Page 27

Building and Installing Wireshark
• Start WinPcap service "NPF" at startup - so users without administrative privileges can capture.
More WinPcap info:
• Wireshark related: http://wiki.wireshark.org/WinPcap
• General WinPcap info: http://www.winpcap.org
2.8.1.4. Command line options
You can simply start the Wireshark installer without any command line parameters, it will show you the
usual interactive installer.
For special cases, there are some command line parameters available:
• /NCRC disables the CRC check
• /S runs the installer or uninstaller silently with default values. Please note: The silent installer won't
install WinPCap!
• /desktopicon installation of the desktop icon, =yes - force installation, =no - don't install, otherwise use
defaults / user settings. This option can be useful for a silent installer.
• /quicklaunchicon installation of the quick launch icon, =yes - force installation, =no - don't install,
otherwise use defaults / user settings.
• /D sets the default installation directory ($INSTDIR), overriding InstallDir and InstallDirRegKey. It
must be the last parameter used in the command line and must not contain any quotes, even if the path
contains spaces.
Example:
wireshark-win32-1.9.0.exe /NCRC /S /desktopicon=yes
/quicklaunchicon=no /D=C:\Program Files\Foo
2.8.2. Manual WinPcap Installation
Note!
As mentioned above, the Wireshark installer takes care of the installation of WinPcap,
so usually you don't have to worry about WinPcap at all!
The following is only necessary if you want to try a different version than the one included in the Wireshark
installer, e.g. because a new WinPcap (beta) version was released.
Additional WinPcap versions (including newer alpha or beta releases) can be downloaded from the
following locations:
• The main WinPcap site: http://www.winpcap.org
• The Wiretapped.net mirror: http://www.mirrors.wiretapped.net/security/packet-capture/winpcap
At the download page you will find a single installer exe called something like "auto-installer", which can
be installed under various Windows systems, including NT4.0/2000/XP/2003/Vista/7/2008.
17
Page 28
Building and Installing Wireshark
2.8.3. Update Wireshark
From time to time you may want to update your installed Wireshark to a more recent version. If you join
Wireshark's announce mailing list, you will be informed about new Wireshark versions, see Section 1.6.5,
“Mailing Lists” for details how to subscribe to this list.
New versions of Wireshark usually become available every 4 to 8 months. Updating Wireshark is done the
same way as installing it, you simply download and start the installer exe. A reboot is usually not required
and all your personal settings remain unchanged.
2.8.4. Update WinPcap
New versions of WinPcap are less frequently available, maybe only once in a year. You will find WinPcap
update instructions where you can download new WinPcap versions. Usually you have to reboot the
machine after installing a new WinPcap version.
Warning!
If you have an older version of WinPcap installed, you must uninstall it before installing the
current version. Recent versions of the WinPcap installer will take care of this.
2.8.5. Uninstall Wireshark
You can uninstall Wireshark the usual way, using the "Add or Remove Programs" option inside the Control
Panel. Select the "Wireshark" entry to start the uninstallation procedure.
The Wireshark uninstaller will provide several options as to which things are to be uninstalled; the default
is to remove the core components but keep the personal settings, WinPcap and alike.
WinPcap won't be uninstalled by default, as other programs than Wireshark may use it as well.
2.8.6. Uninstall WinPcap
You can uninstall WinPcap independently of Wireshark, using the "WinPcap" entry in the "Add or Remove
Programs" of the Control Panel.
Note!
After uninstallation of WinPcap you can't capture anything with Wireshark.
It might be a good idea to reboot Windows afterwards.
18
Page 29

Chapter 3. User Interface
3.1. Introduction
By now you have installed Wireshark and are most likely keen to get started capturing your first packets.
In the next chapters we will explore:
• How the Wireshark user interface works
• How to capture packets in Wireshark
• How to view packets in Wireshark
• How to filter packets in Wireshark
• ... and many other things!
3.2. Start Wireshark
You can start Wireshark from your shell or window manager.
Tip!
When starting Wireshark it's possible to specify optional settings using the command line.
See Section 10.2, “Start Wireshark from the command line” for details.
Note!
In the following chapters, a lot of screenshots from Wireshark will be shown. As Wireshark
runs on many different platforms with many different window managers, different styles
applied and there are different versions of the underlying GUI toolkit used, your screen
might look different from the provided screenshots. But as there are no real differences in
functionality, these screenshots should still be well understandable.
3.3. The Main window
Let's look at Wireshark's user interface. Figure 3.1, “The Main window” shows Wireshark as you would
usually see it after some packets are captured or loaded (how to do this will be described later).
19
Page 30
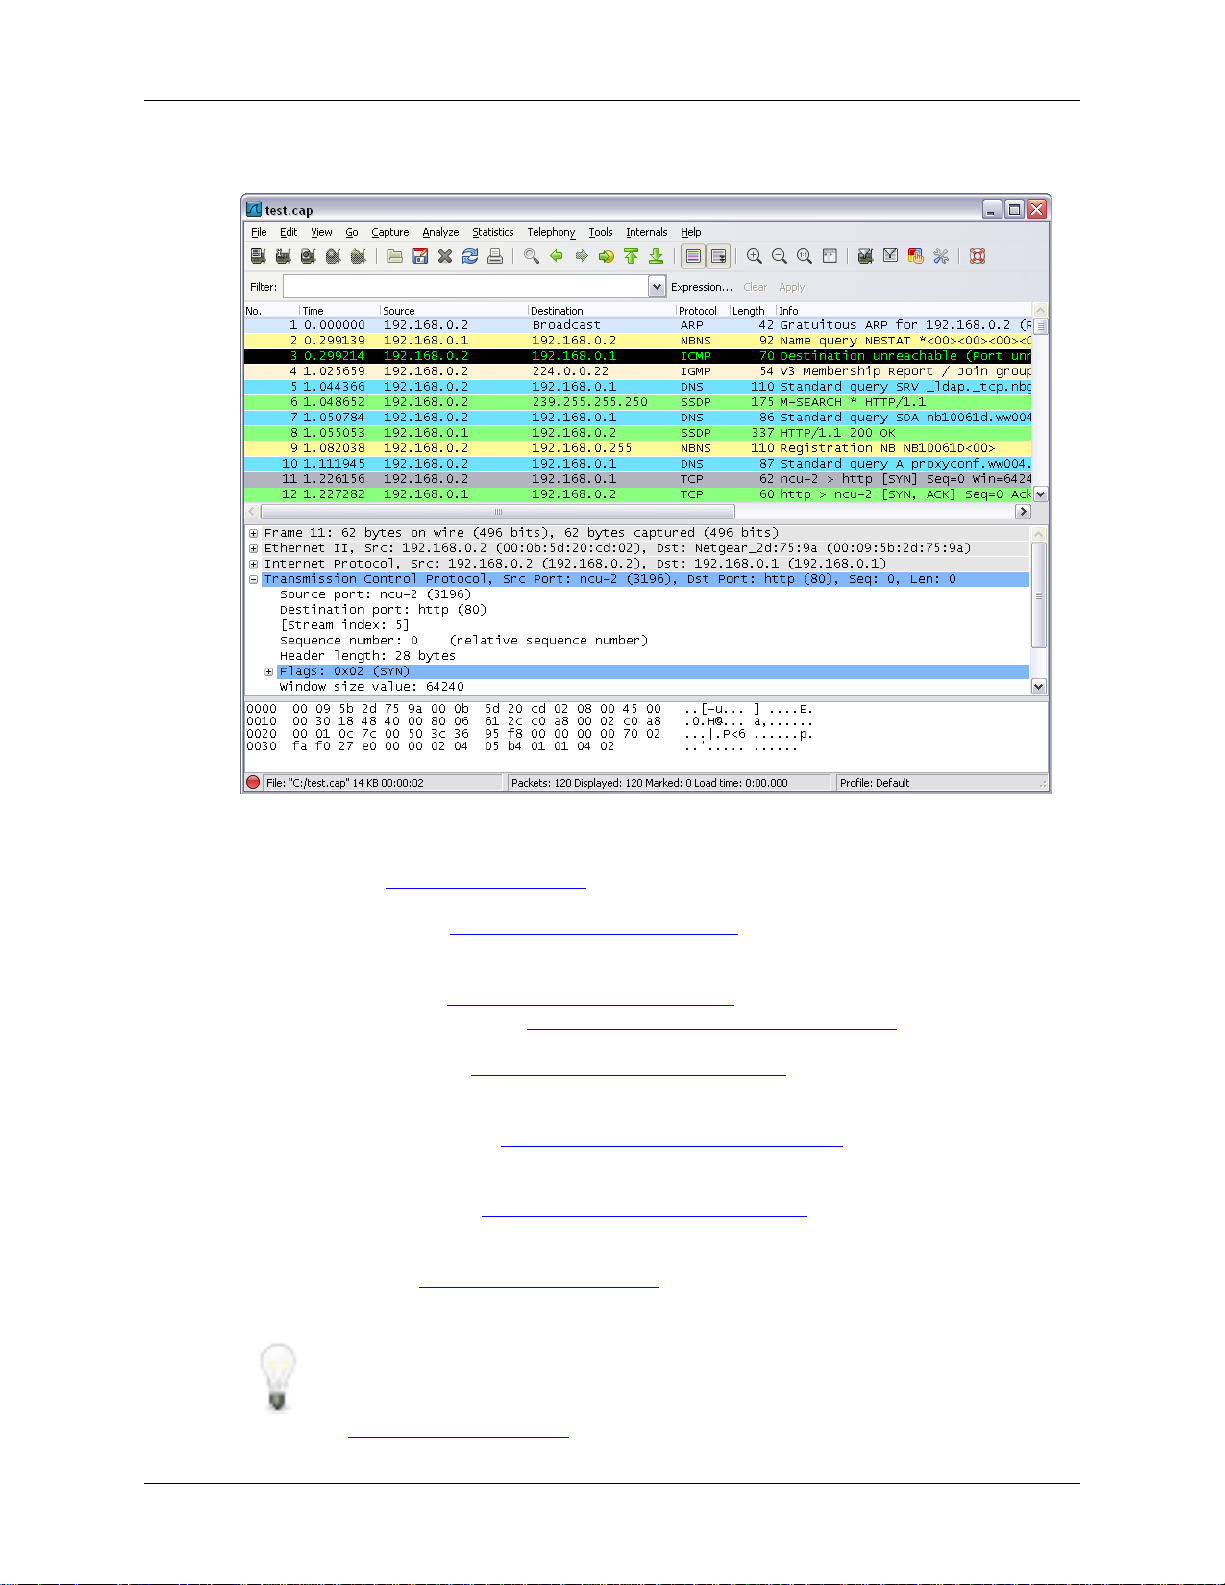
Figure 3.1. The Main window
User Interface
Wireshark's main window consists of parts that are commonly known from many other GUI programs.
1. The menu (see Section 3.4, “The Menu”) is used to start actions.
2. The main toolbar (see Section 3.16, “The "Main" toolbar”) provides quick access to frequently used
items from the menu.
3. The filter toolbar (see Section 3.17, “The "Filter" toolbar”) provides a way to directly manipulate the
currently used display filter (see Section 6.3, “Filtering packets while viewing”).
4. The packet list pane (see Section 3.18, “The "Packet List" pane”) displays a summary of each packet
captured. By clicking on packets in this pane you control what is displayed in the other two panes.
5. The packet details pane (see Section 3.19, “The "Packet Details" pane”) displays the packet selected
in the packet list pane in more detail.
6. The packet bytes pane (see Section 3.20, “The "Packet Bytes" pane”) displays the data from the packet
selected in the packet list pane, and highlights the field selected in the packet details pane.
7. The statusbar (see Section 3.21, “The Statusbar”) shows some detailed information about the current
program state and the captured data.
Tip!
The layout of the main window can be customized by changing preference settings. See
Section 10.5, “Preferences” for details!
20
Page 31

User Interface
3.3.1. Main Window Navigation
Packet list and detail navigation can be done entirely from the keyboard. Table 3.1, “Keyboard Navigation”
shows a list of keystrokes that will let you quickly move around a capture file. See Table 3.5, “Go menu
items” for additional navigation keystrokes.
Table 3.1. Keyboard Navigation
Accelerator Description
Tab, Shift+Tab Move between screen elements, e.g. from the toolbars to the packet list to the packet
detail.
Down Move to the next packet or detail item.
Up Move to the previous packet or detail item.
Ctrl+Down, F8 Move to the next packet, even if the packet list isn't focused.
Ctrl+Up, F7 Move to the previous packet, even if the packet list isn't focused.
Ctrl+. Move to the next packet of the conversation (TCP, UDP or IP)
Ctrl+, Move to the previous packet of the conversation (TCP, UDP or IP)
Left In the packet detail, closes the selected tree item. If it's already closed, jumps to the
parent node.
Right In the packet detail, opens the selected tree item.
Shift+Right In the packet detail, opens the selected tree item and all of its subtrees.
Ctrl+Right In the packet detail, opens all tree items.
Ctrl+Left In the packet detail, closes all tree items.
Backspace In the packet detail, jumps to the parent node.
Return, Enter In the packet detail, toggles the selected tree item.
Additionally, typing anywhere in the main window will start filling in a display filter.
3.4. The Menu
The Wireshark menu sits on top of the Wireshark window. An example is shown in Figure 3.2, “The
Menu”.
Note!
Menu items will be greyed out if the corresponding feature isn't available. For example, you
cannot save a capture file if you didn't capture or load any data before.
Figure 3.2. The Menu
It contains the following items:
File This menu contains items to open and merge capture files, save / print / export capture
files in whole or in part, and to quit from Wireshark. See Section 3.5, “The "File" menu”.
21
Page 32

User Interface
Edit This menu contains items to find a packet, time reference or mark one or more packets,
handle configuration profiles, and set your preferences; (cut, copy, and paste are not
presently implemented). See Section 3.6, “The "Edit" menu”.
View This menu controls the display of the captured data, including colorization of packets,
zooming the font, showing a packet in a separate window, expanding and collapsing trees
in packet details, .... See Section 3.7, “The "View" menu”.
Go This menu contains items to go to a specific packet. See Section 3.8, “The "Go" menu”.
Capture This menu allows you to start and stop captures and to edit capture filters. See Section 3.9,
“The "Capture" menu”.
Analyze This menu contains items to manipulate display filters, enable or disable the dissection of
protocols, configure user specified decodes and follow a TCP stream. See Section 3.10,
“The "Analyze" menu”.
Statistics This menu contains items to display various statistic windows, including a summary of
the packets that have been captured, display protocol hierarchy statistics and much more.
See Section 3.11, “The "Statistics" menu”.
Telephony This menu contains items to display various telephony related statistic windows,
including a media analysis, flow diagrams, display protocol hierarchy statistics and much
more. See Section 3.12, “The "Telephony" menu”.
Tools This menu contains various tools available in Wireshark, such as creating Firewall ACL
Rules. See Section 3.13, “The "Tools" menu”.
Internals This menu contains items that show information about the internals of Wireshark. See
Section 3.14, “The "Internals" menu”.
Help This menu contains items to help the user, e.g. access to some basic help, manual pages
of the various command line tools, online access to some of the webpages, and the usual
about dialog. See Section 3.15, “The "Help" menu”.
Each of these menu items is described in more detail in the sections that follow.
Tip!
You can access menu items directly or by pressing the corresponding accelerator keys which
are shown at the right side of the menu. For example, you can press the Control (or Strg in
German) and the K keys together to open the capture dialog.
3.5. The "File" menu
The Wireshark file menu contains the fields shown in Table 3.2, “File menu items”.
22
Page 33

Figure 3.3. The "File" Menu
User Interface
Table 3.2. File menu items
Menu Item Accelerator Description
Open... Ctrl+O This menu item brings up the file open dialog box that allows you
to load a capture file for viewing. It is discussed in more detail in
Section 5.2.1, “The "Open Capture File" dialog box”.
Open Recent This menu item shows a submenu containing the recently opened
capture files. Clicking on one of the submenu items will open the
corresponding capture file directly.
Merge... This menu item brings up the merge file dialog box that allows you
to merge a capture file into the currently loaded one. It is discussed
in more detail in Section 5.4, “Merging capture files”.
Import... This menu item brings up the import file dialog box that allows you
to import a text file into a new temporary capture. It is discussed
in more detail in Section 5.5, “Import text file”.
Close Ctrl+W This menu item closes the current capture. If you haven't saved the
capture, you will be asked to do so first (this can be disabled by a
preference setting).
-----Save Ctrl+S This menu item saves the current capture. If you have not set a
default capture file name (perhaps with the -w <capfile> option),
Wireshark pops up the Save Capture File As dialog box (which
23
Page 34

User Interface
Menu Item Accelerator Description
is discussed further in Section 5.3.1, “The "Save Capture File As"
dialog box”).
Note!
If you have already saved the current capture, this
menu item will be greyed out.
Note!
You cannot save a live capture while the capture is in
progress. You must stop the capture in order to save.
Save As... Shift+Ctrl+S This menu item allows you to save the current capture file to
whatever file you would like. It pops up the Save Capture File As
dialog box (which is discussed further in Section 5.3.1, “The "Save
Capture File As" dialog box”).
-----File Set > List
Files
File Set > Next
File
File Set >
Previous File
-----Export > File... This menu item allows you to export all (or some) of the packets
Export >
Selected Packet
Bytes...
Export >
Objects >
HTTP
Export >
Objects >
DICOM
Export >
Objects > SMB
------
Ctrl+H This menu item allows you to export the currently selected bytes
This menu item allows you to show a list of files in a file set. It
pops up the Wireshark List File Set dialog box (which is discussed
further in Section 5.6, “File Sets”).
If the currently loaded file is part of a file set, jump to the next file
in the set. If it isn't part of a file set or just the last file in that set,
this item is greyed out.
If the currently loaded file is part of a file set, jump to the previous
file in the set. If it isn't part of a file set or just the first file in that
set, this item is greyed out.
in the capture file to file. It pops up the Wireshark Export dialog
box (which is discussed further in Section 5.7, “Exporting data”).
in the packet bytes pane to a binary file. It pops up the Wireshark
Export dialog box (which is discussed further in Section 5.7.7,
“The "Export selected packet bytes" dialog box”)
This menu item allows you to export all or some of the captured
HTTP objects into local files. It pops up the Wireshark HTTP
object list (which is discussed further in Section 5.7.8, “The
"Export Objects" dialog box”)
This menu item allows you to export all or some of the captured
DICOM objects into local files. It pops up the Wireshark DICOM
object list (which is discussed further in Section 5.7.8, “The
"Export Objects" dialog box”)
This menu item allows you to export all or some of the captured
SMB objects into local files. It pops up the Wireshark SMB object
list (which is discussed further in Section 5.7.8, “The "Export
Objects" dialog box”)
24
Page 35

Menu Item Accelerator Description
Print... Ctrl+P This menu item allows you to print all (or some) of the packets in
-----Quit Ctrl+Q This menu item allows you to quit from Wireshark. Wireshark will
3.6. The "Edit" menu
The Wireshark Edit menu contains the fields shown in Table 3.3, “Edit menu items”.
Figure 3.4. The "Edit" Menu
User Interface
the capture file. It pops up the Wireshark Print dialog box (which
is discussed further in Section 5.8, “Printing packets”).
ask to save your capture file if you haven't previously saved it (this
can be disabled by a preference setting).
Table 3.3. Edit menu items
Menu Item Accelerator Description
Copy >
Description
Copy >
Fieldname
Copy > Value Shift+Ctrl+V This menu item will copy the value of the selected item in the detail
Shift+Ctrl+D This menu item will copy the description of the selected item in
the detail view to the clipboard.
Shift+Ctrl+F This menu item will copy the fieldname of the selected item in the
detail view to the clipboard.
view to the clipboard.
25
Page 36

User Interface
Menu Item Accelerator Description
Copy > As
Filter
-----Find Packet... Ctrl+F This menu item brings up a dialog box that allows you to find a
Find Next Ctrl+N This menu item tries to find the next packet matching the settings
Find Previous Ctrl+B This menu item tries to find the previous packet matching the
-----Mark Packet
(toggle)
Toggle
Marking Of
All Displayed
Packets
Mark All
Displayed
Packets
Unmark All
Displayed
Packets
Find Next
Mark
Find Previous
Mark
-----Ignore Packet
(toggle)
Ignore All
Displayed
Packets (toggle)
Un-Ignore All
Packets
-----Set Time
Reference
(toggle)
Un-Time
Reference All
Packets
Find Next Time
Reference
Shift+Ctrl+C This menu item will use the selected item in the detail view to
create a display filter. This display filter is then copied to the
clipboard.
packet by many criteria. There is further information on finding
packets in Section 6.8, “Finding packets”.
from "Find Packet...".
settings from "Find Packet...".
Ctrl+M This menu item "marks" the currently selected packet. See
Section 6.10, “Marking packets” for details.
Shift+Ctrl+Alt+M This menu item toggles the mark on all displayed packets.
Shift+Ctrl+M This menu item "marks" all displayed packets.
Ctrl+Alt+M This menu item "unmarks" all displayed packets.
Shift+Ctrl+N Find the next marked packet.
Shift+Ctrl+B Find the previous marked packet.
Ctrl+D This menu item marks the currently selected packet as ignored. See
Section 6.11, “Ignoring packets” for details.
Shift+Ctrl+D This menu item marks all displayed packets as ignored.
Ctrl+Alt+D This menu item unmarks all ignored packets.
Ctrl+T This menu item set a time reference on the currently selected
packet. See Section 6.12.1, “Packet time referencing” for more
information about the time referenced packets.
Ctrl+Alt+T This menu item removes all time references on the packets.
Ctrl+Alt+N This menu item tries to find the next time referenced packet.
26
Page 37

Menu Item Accelerator Description
Find Previous
Time Reference
-----Configuration
Profiles...
Preferences... Shift+Ctrl+P This menu item brings up a dialog box that allows you to set
Ctrl+Alt+B This menu item tries to find the previous time referenced packet.
Shift+Ctrl+A This menu item brings up a dialog box for handling configuration
profiles. More detail is provided in Section 10.6, “Configuration
Profiles”.
preferences for many parameters that control Wireshark. You can
also save your preferences so Wireshark will use them the next time
you start it. More detail is provided in Section 10.5, “Preferences”.
3.7. The "View" menu
The Wireshark View menu contains the fields shown in Table 3.4, “View menu items”.
Figure 3.5. The "View" Menu
User Interface
Table 3.4. View menu items
Menu Item Accelerator Description
Main Toolbar This menu item hides or shows the main toolbar, see Section 3.16,
“The "Main" toolbar”.
Filter Toolbar This menu item hides or shows the filter toolbar, see Section 3.17,
“The "Filter" toolbar”.
27
Page 38

User Interface
Menu Item Accelerator Description
Wireless
Toolbar
(Windows only)
Statusbar This menu item hides or shows the statusbar, see Section 3.21, “The
-----Packet List This menu item hides or shows the packet list pane, see
Packet Details This menu item hides or shows the packet details pane, see
Packet Bytes This menu item hides or shows the packet bytes pane, see
-----Time Display
Format > Date
and Time of
Day:
1970-01-01
01:02:03.123456
Time Display
Format > Time
of Day:
01:02:03.123456
Time Display
Format >
Seconds Since
Epoch
(1970-01-01):
1234567890.123456
Time Display
Format >
Seconds Since
Beginning of
Capture:
123.123456
Time Display
Format >
Seconds Since
Previous
Captured
Packet:
1.123456
This menu item hides or shows the wireless toolbar. See the
AirPcap documentation for more information.
Statusbar”.
Section 3.18, “The "Packet List" pane”.
Section 3.19, “The "Packet Details" pane”.
Section 3.20, “The "Packet Bytes" pane”.
Selecting this tells Wireshark to display the time stamps in date
and time of day format, see Section 6.12, “Time display formats
and time references”.
Note!
The fields "Time of Day", "Date and Time of Day",
"Seconds Since Beginning of Capture", "Seconds
Since Previous Captured Packet" and "Seconds Since
Previous Displayed Packet" are mutually exclusive.
Selecting this tells Wireshark to display time stamps in time of
day format, see Section 6.12, “Time display formats and time
references”.
Selecting this tells Wireshark to display time stamps in seconds
since 1970-01-01 00:00:00, see Section 6.12, “Time display
formats and time references”.
Selecting this tells Wireshark to display time stamps in seconds
since beginning of capture format, see Section 6.12, “Time display
formats and time references”.
Selecting this tells Wireshark to display time stamps in seconds
since previous captured packet format, see Section 6.12, “Time
display formats and time references”.
28
Page 39

User Interface
Menu Item Accelerator Description
Time Display
Format >
Seconds Since
Previous
Displayed
Packet:
1.123456
Time Display
Format > -----Time Display
Format >
Automatic (File
Format
Precision)
Time Display
Format >
Seconds: 0
Time Display
Format
> ...seconds: 0....
Time Display
Format >
Display
Seconds with
hours and
minutes
Name
Resolution >
Resolve Name
Name
Resolution >
Enable for
MAC Layer
Name
Resolution >
Enable for
Network Layer
Name
Resolution >
Enable for
Transport
Layer
Colorize Packet
List
Selecting this tells Wireshark to display time stamps in seconds
since previous displayed packet format, see Section 6.12, “Time
display formats and time references”.
Selecting this tells Wireshark to display time stamps with the
precision given by the capture file format used, see Section 6.12,
“Time display formats and time references”.
Selecting this tells Wireshark to display time stamps with a
precision of one second, see Section 6.12, “Time display formats
and time references”.
Selecting this tells Wireshark to display time stamps with a
precision of one second, decisecond, centisecond, millisecond,
microsecond or nanosecond, see Section 6.12, “Time display
formats and time references”.
Selecting this tells Wireshark to display time stamps in seconds,
with hours and minutes.
This item allows you to trigger a name resolve of the current packet
only, see Section 7.7, “Name Resolution”.
This item allows you to control whether or not Wireshark translates
MAC addresses into names, see Section 7.7, “Name Resolution”.
This item allows you to control whether or not Wireshark
translates network addresses into names, see Section 7.7, “Name
Resolution”.
This item allows you to control whether or not Wireshark
translates transport addresses into names, see Section 7.7, “Name
Resolution”.
This item allows you to control whether or not Wireshark should
colorize the packet list.
Note!
The fields "Automatic", "Seconds" and "...seconds"
are mutually exclusive.
29
Page 40

User Interface
Menu Item Accelerator Description
Note!
Enabling colorization will slow down the display of
new packets while capturing / loading capture files.
Auto Scroll in
Live Capture
-----Zoom In Ctrl++ Zoom into the packet data (increase the font size).
Zoom Out Ctrl+- Zoom out of the packet data (decrease the font size).
Normal Size Ctrl+= Set zoom level back to 100% (set font size back to normal).
Resize All
Columns
Shift+Ctrl+R Resize all column widths so the content will fit into it.
This item allows you to specify that Wireshark should scroll the
packet list pane as new packets come in, so you are always looking
at the last packet. If you do not specify this, Wireshark simply adds
new packets onto the end of the list, but does not scroll the packet
list pane.
Note!
Resizing may take a significant amount of time,
especially if a large capture file is loaded.
Displayed
Columns
-----Expand
Subtrees
Expand All Ctrl+Right Wireshark keeps a list of all the protocol subtrees that are
Collapse All Ctrl+Left This menu item collapses the tree view of all packets in the capture
-----Colorize
Conversation
Colorize
Conversation >
Color 1-10
Colorize
Conversation >
Reset coloring
Colorize
Conversation >
New Coloring
Rule...
Shift+Right This menu item expands the currently selected subtree in the packet
This menu items folds out with a list of all configured columns.
These columns can now be shown or hidden in the packet list.
details tree.
expanded, and uses it to ensure that the correct subtrees are
expanded when you display a packet. This menu item expands all
subtrees in all packets in the capture.
list.
This menu item brings up a submenu that allows you to color
packets in the packet list pane based on the addresses of the
currently selected packet. This makes it easy to distinguish
packets belonging to different conversations. Section 10.3, “Packet
colorization”.
These menu items enable one of the ten temporary color filters
based on the currently selected conversation.
This menu item clears all temporary coloring rules.
This menu item opens a dialog window in which a new permanent
coloring rule can be created based on the currently selected
conversation.
30
Page 41

Menu Item Accelerator Description
Coloring
Rules...
-----Show Packet in
New Window
Reload Ctrl+R This menu item allows you to reload the current capture file.
3.8. The "Go" menu
The Wireshark Go menu contains the fields shown in Table 3.5, “Go menu items”.
Figure 3.6. The "Go" Menu
User Interface
This menu item brings up a dialog box that allows you to color
packets in the packet list pane according to filter expressions you
choose. It can be very useful for spotting certain types of packets,
see Section 10.3, “Packet colorization”.
This menu item brings up the selected packet in a separate window.
The separate window shows only the tree view and byte view
panes.
Table 3.5. Go menu items
Menu Item Accelerator Description
Back Alt+Left Jump to the recently visited packet in the packet history, much like
the page history in a web browser.
Forward Alt+Right Jump to the next visited packet in the packet history, much like the
page history in a web browser.
31
Page 42

User Interface
Menu Item Accelerator Description
Go to Packet... Ctrl+G Bring up a dialog box that allows you to specify a packet number,
and then goes to that packet. See Section 6.9, “Go to a specific
packet” for details.
Go to
Corresponding
Packet
-----Previous
Packet
Next Packet Ctrl+Down Move to the next packet in the list. This can be used to move to the
First Packet Ctrl+Home Jump to the first packet of the capture file.
Last Packet Ctrl+End Jump to the last packet of the capture file.
Previous
Packet In
Conversation
Next Packet In
Conversation
Ctrl+Up Move to the previous packet in the list. This can be used to move
Ctrl+, Move to the previous packet in the current conversation. This can
Ctrl+. Move to the next packet in the current conversation. This can be
Go to the corresponding packet of the currently selected protocol
field. If the selected field doesn't correspond to a packet, this item
is greyed out.
to the previous packet even if the packet list doesn't have keyboard
focus.
previous packet even if the packet list doesn't have keyboard focus.
be used to move to the previous packet even if the packet list doesn't
have keyboard focus.
used to move to the previous packet even if the packet list doesn't
have keyboard focus.
3.9. The "Capture" menu
The Wireshark Capture menu contains the fields shown in Table 3.6, “Capture menu items”.
32
Page 43

User Interface
Figure 3.7. The "Capture" Menu
Table 3.6. Capture menu items
Menu Item Accelerator Description
Interfaces... Ctrl+I This menu item brings up a dialog box that shows what's going
on at the network interfaces Wireshark knows of, see Section 4.4,
“The "Capture Interfaces" dialog box”) .
Options... Ctrl+K This menu item brings up the Capture Options dialog box
(discussed further in Section 4.5, “The "Capture Options" dialog
box”) and allows you to start capturing packets.
Start Ctrl+E Immediately start capturing packets with the same settings than the
last time.
Stop Ctrl+E This menu item stops the currently running capture, see
Section 4.13.1, “Stop the running capture”) .
Restart Ctrl+R This menu item stops the currently running capture and starts again
with the same options, this is just for convenience.
Capture
Filters...
This menu item brings up a dialog box that allows you to create and
edit capture filters. You can name filters, and you can save them for
future use. More detail on this subject is provided in Section 6.6,
“Defining and saving filters”
3.10. The "Analyze" menu
The Wireshark Analyze menu contains the fields shown in Table 3.7, “Analyze menu items”.
33
Page 44

User Interface
Figure 3.8. The "Analyze" Menu
Table 3.7. Analyze menu items
Menu Item Accelerator Description
Display
Filters...
Display Filter
Macros...
-----Apply as
Column
Apply as Filter
> ...
Prepare a Filter
> ...
------
This menu item brings up a dialog box that allows you to create and
edit display filters. You can name filters, and you can save them for
future use. More detail on this subject is provided in Section 6.6,
“Defining and saving filters”
This menu item brings up a dialog box that allows you to create and
edit display filter macros. You can name filter macros, and you can
save them for future use. More detail on this subject is provided in
Section 6.7, “Defining and saving filter macros”
This menu item adds the selected protocol item in the packet details
pane as a column to the packet list.
These menu items will change the current display filter and apply
the changed filter immediately. Depending on the chosen menu
item, the current display filter string will be replaced or appended
to by the selected protocol field in the packet details pane.
These menu items will change the current display filter but won't
apply the changed filter. Depending on the chosen menu item, the
current display filter string will be replaced or appended to by the
selected protocol field in the packet details pane.
34
Page 45

User Interface
Menu Item Accelerator Description
Enabled
Protocols...
Decode As... This menu item allows the user to force Wireshark to decode
User Specified
Decodes...
-----Follow TCP
Stream
Follow UDP
Stream
Follow SSL
Stream
Expert Info Open a dialog showing some expert information about the captured
Conversation
Filter > ...
Shift+Ctrl+E This menu item allows the user to enable/disable protocol
dissectors, see Section 10.4.1, “The "Enabled Protocols" dialog
box”
certain packets as a particular protocol, see Section 10.4.2, “User
Specified Decodes”
This menu item allows the user to force Wireshark to decode
certain packets as a particular protocol, see Section 10.4.3, “Show
User Specified Decodes”
This menu item brings up a separate window and displays all the
TCP segments captured that are on the same TCP connection as a
selected packet, see Section 7.2, “Following TCP streams”
Same functionality as "Follow TCP Stream" but for UDP streams.
Same functionality as "Follow TCP Stream" but for SSL streams.
XXX - how to provide the SSL keys?
packets. The amount of information will depend on the protocol
and varies from very detailed to non-existent. XXX - add a new
section about this and link from here
In this menu you will find conversation filter for various protocols.
3.11. The "Statistics" menu
The Wireshark Statistics menu contains the fields shown in Table 3.8, “Statistics menu items”.
35
Page 46

User Interface
Figure 3.9. The "Statistics" Menu
All menu items will bring up a new window showing specific statistical information.
Table 3.8. Statistics menu items
Menu Item Accelerator Description
Summary Show information about the data captured, see Section 8.2, “The
"Summary" window”.
Protocol
Hierarchy
Conversations Display a list of conversations (traffic between two endpoints), see
Endpoints Display a list of endpoints (traffic to/from an address), see
Packet
Lengths...
IO Graphs Display user specified graphs (e.g. the number of packets in the
-----Conversation
List
Display a hierarchical tree of protocol statistics, see Section 8.3,
“The "Protocol Hierarchy" window”.
Section 8.4.2, “The "Conversations" window”.
Section 8.5.2, “The "Endpoints" window”.
See Section 8.10, “The protocol specific statistics windows”
course of time), see Section 8.6, “The "IO Graphs" window”.
Display a list of conversations, obsoleted by the combined window
of Conversations above, see Section 8.4.3, “The protocol specific
"Conversation List" windows”.
36
Page 47

User Interface
Menu Item Accelerator Description
Endpoint List Display a list of endpoints, obsoleted by the combined window
of Endpoints above, see Section 8.5.3, “The protocol specific
"Endpoint List" windows”.
Service
Response Time
-----ANCP... See Section 8.10, “The protocol specific statistics windows”
BOOTP-
DHCP...
Colledtd... See Section 8.10, “The protocol specific statistics windows”
Compare... See Section 8.10, “The protocol specific statistics windows”
Flow Graph... See Section 8.10, “The protocol specific statistics windows”
HTTP HTTP request/response statistics, see Section 8.10, “The protocol
IP Addresses... See Section 8.10, “The protocol specific statistics windows”
IP
Destinations...
IP Protocol
Types...
ONC-RPC
Programs
Sametime See Section 8.10, “The protocol specific statistics windows”
TCP Stream
Graph
UDP Multicast
Streams
WLAN Traffic See Section 8.9, “WLAN Traffic Statistics”
Display the time between a request and the corresponding
response, see Section 8.7, “Service Response Time”.
See Section 8.10, “The protocol specific statistics windows”
specific statistics windows”
See Section 8.10, “The protocol specific statistics windows”
See Section 8.10, “The protocol specific statistics windows”
See Section 8.10, “The protocol specific statistics windows”
See Section 8.10, “The protocol specific statistics windows”
See Section 8.10, “The protocol specific statistics windows”
3.12. The "Telephony" menu
The Wireshark Telephony menu contains the fields shown in Table 3.9, “Telephony menu items”.
37
Page 48

User Interface
Figure 3.10. The "Telephony" Menu
All menu items will bring up a new window showing specific telephony related statistical information.
Table 3.9. Telephony menu items
Menu Item Accelerator Description
IAX2 See Section 9.6, “The protocol specific statistics windows”
SMPP
Operations...
SCTP See Section 9.6, “The protocol specific statistics windows”
ANSI See Section 9.6, “The protocol specific statistics windows”
GSM See Section 9.6, “The protocol specific statistics windows”
H.225... See Section 9.6, “The protocol specific statistics windows”
ISUP
Messages...
LTE See Section 9.4, “LTE MAC Traffic Statistics”
MTP3 See Section 9.6, “The protocol specific statistics windows”
RTP See Section 9.2, “RTP Analysis”
SIP... See Section 9.6, “The protocol specific statistics windows”
UCP
Messages...
VoIP Calls... See Section 9.3, “VoIP Calls”
See Section 9.6, “The protocol specific statistics windows”
See Section 9.6, “The protocol specific statistics windows”
See Section 9.6, “The protocol specific statistics windows”
38
Page 49

User Interface
Menu Item Accelerator Description
WAP-WSP... See Section 9.6, “The protocol specific statistics windows”
3.13. The "Tools" menu
The Wireshark Tools menu contains the fields shown in Table 3.10, “Tools menu items”.
Figure 3.11. The "Tools" Menu
Table 3.10. Tools menu items
Menu Item Accelerator Description
Firewall ACL
Rules
Lua These options allow you to work with the Lua interpreter optionally
This allows you to create command-line ACL rules for many
different firewall products, including Cisco IOS, Linux Netfilter
(iptables), OpenBSD pf and Windows Firewall (via netsh). Rules
for MAC addresses, IPv4 addresses, TCP and UDP ports, and
IPv4+port combinations are supported.
It is assumed that the rules will be applied to an outside interface.
build into Wireshark, see Section 11.1, “Introduction”.
3.14. The "Internals" menu
The Wireshark Internals menu contains the fields shown in Table 3.11, “Help menu items”.
39
Page 50

User Interface
Figure 3.12. The "Internals" Menu
Table 3.11. Help menu items
Menu Item Accelerator Description
Dissector tables This menu item brings up a dialog box showing the tables with
subdissector relationships.
Supported
Protocols
(slow!)
This menu item brings up a dialog box showing the supported
protocols and protocol fields.
3.15. The "Help" menu
The Wireshark Help menu contains the fields shown in Table 3.12, “Help menu items”.
40
Page 51

Figure 3.13. The "Help" Menu
User Interface
Table 3.12. Help menu items
Menu Item Accelerator Description
Contents F1 This menu item brings up a basic help system.
Manual Pages
> ...
-----Website This menu item starts a Web browser showing the webpage from:
FAQ's This menu item starts a Web browser showing various FAQ's.
Downloads This menu item starts a Web browser showing the downloads from:
-----Wiki This menu item starts a Web browser showing the front page from:
Sample
Captures
-----About
Wireshark
This menu item starts a Web browser showing one of the locally
installed html manual pages.
http://www.wireshark.org.
http://www.wireshark.org.
http://wiki.wireshark.org.
This menu item starts a Web browser showing the sample captures
from: http://wiki.wireshark.org.
This menu item brings up an information window that provides
various detailed information items on Wireshark, such as how it's
build, the plugins loaded, the used folders, ...
41
Page 52

User Interface
Note!
Calling a Web browser might be unsupported in your version of Wireshark. If this is the case,
the corresponding menu items will be hidden.
Note!
If calling a Web browser fails on your machine, maybe because just nothing happens or
the browser is started but no page is shown, have a look at the web browser setting in the
preferences dialog.
3.16. The "Main" toolbar
The main toolbar provides quick access to frequently used items from the menu. This toolbar cannot be
customized by the user, but it can be hidden using the View menu, if the space on the screen is needed
to show even more packet data.
As in the menu, only the items useful in the current program state will be available. The others will be
greyed out (e.g. you cannot save a capture file if you haven't loaded one).
Figure 3.14. The "Main" toolbar
Table 3.13. Main toolbar items
Toolbar
Icon
------
Toolbar Item Corresponding
Menu Item
Interfaces... Capture/
Interfaces...
Options... Capture/Options... This item brings up the Capture Options dialog box
Start Capture/Start This item starts capturing packets with the options
Stop Capture/Stop This item stops the currently running live capture
Restart Capture/Restart This item stops the currently running live capture
Open... File/Open... This item brings up the file open dialog box that allows
Save As... File/Save As... This item allows you to save the current capture file
Description
This item brings up the Capture Interfaces List
dialog box (discussed further in Section 4.3, “Start
Capturing”).
(discussed further in Section 4.3, “Start Capturing”)
and allows you to start capturing packets.
form the last time.
process Section 4.3, “Start Capturing”).
process and restarts it again, for convenience.
you to load a capture file for viewing. It is discussed
in more detail in Section 5.2.1, “The "Open Capture
File" dialog box”.
to whatever file you would like. It pops up the Save
Capture File As dialog box (which is discussed further
in Section 5.3.1, “The "Save Capture File As" dialog
box”).
42
Page 53

User Interface
Toolbar
Icon
------
Toolbar Item Corresponding
Menu Item
Description
Note!
If you currently have a temporary capture
file, the Save icon will be shown
instead.
Close File/Close This item closes the current capture. If you have not
saved the capture, you will be asked to save it first.
Reload View/Reload This item allows you to reload the current capture file.
Print... File/Print... This item allows you to print all (or some of) the
packets in the capture file. It pops up the Wireshark
Print dialog box (which is discussed further in
Section 5.8, “Printing packets”).
Find Packet... Edit/Find Packet... This item brings up a dialog box that allows you to
find a packet. There is further information on finding
packets in Section 6.8, “Finding packets”.
Go Back Go/Go Back This item jumps back in the packet history.
Go Forward Go/Go Forward This item jumps forward in the packet history.
------
------
------
Go to Packet... Go/Go to Packet... This item brings up a dialog box that allows you to
specify a packet number to go to that packet.
Go To First
Packet
Go To Last
Packet
Colorize View/Colorize Colorize the packet list (or not).
Auto Scroll in
Live Capture
Zoom In View/Zoom In Zoom into the packet data (increase the font size).
Zoom Out View/Zoom Out Zoom out of the packet data (decrease the font size).
Normal Size View/Normal Size Set zoom level back to 100%.
Resize Columns View/Resize
Capture Filters... Capture/Capture
Go/First Packet This item jumps to the first packet of the capture file.
Go/Last Packet This item jumps to the last packet of the capture file.
View/Auto Scroll
in Live Capture
Columns
Filters...
Auto scroll packet list while doing a live capture (or
not).
Resize columns, so the content fits into them.
This item brings up a dialog box that allows you to
create and edit capture filters. You can name filters,
and you can save them for future use. More detail on
this subject is provided in Section 6.6, “Defining and
saving filters”.
43
Page 54

User Interface
Toolbar
Icon
------
Toolbar Item Corresponding
Menu Item
Display Filters... Analyze/Display
Filters...
Coloring Rules... View/Coloring
Rules...
Preferences... Edit/Preferences This item brings up a dialog box that allows you
Help Help/Contents This item brings up help dialog box.
3.17. The "Filter" toolbar
Description
This item brings up a dialog box that allows you to
create and edit display filters. You can name filters,
and you can save them for future use. More detail on
this subject is provided in Section 6.6, “Defining and
saving filters”.
This item brings up a dialog box that allows you
color packets in the packet list pane according to
filter expressions you choose. It can be very useful
for spotting certain types of packets. More detail
on this subject is provided in Section 10.3, “Packet
colorization”.
to set preferences for many parameters that control
Wireshark. You can also save your preferences so
Wireshark will use them the next time you start it.
More detail is provided in Section 10.5, “Preferences”
The filter toolbar lets you quickly edit and apply display filters. More information on display filters is
available in Section 6.3, “Filtering packets while viewing”.
Figure 3.15. The "Filter" toolbar
Table 3.14. Filter toolbar items
Toolbar
Icon
Toolbar Item Description
Filter: Brings up the filter construction dialog, described in Figure 6.8, “The
"Capture Filters" and "Display Filters" dialog boxes”.
Filter input The area to enter or edit a display filter string, see Section 6.4, “Building
display filter expressions” . A syntax check of your filter string is done
while you are typing. The background will turn red if you enter an
incomplete or invalid string, and will become green when you enter a
valid string. You can click on the pull down arrow to select a previouslyentered filter string from a list. The entries in the pull down list will remain
available even after a program restart.
Note!
After you've changed something in this field, don't forget to
press the Apply button (or the Enter/Return key), to apply this
filter string to the display.
44
Page 55

User Interface
Toolbar
Icon
Toolbar Item Description
Note!
This field is also where the current filter in effect is displayed.
Expression... The middle button labeled "Add Expression..." opens a dialog box that
lets you edit a display filter from a list of protocol fields, described in
Section 6.5, “The "Filter Expression" dialog box”
Clear Reset the current display filter and clears the edit area.
Apply Apply the current value in the edit area as the new display filter.
Note!
Applying a display filter on large capture files might take
quite a long time!
3.18. The "Packet List" pane
The packet list pane displays all the packets in the current capture file.
Figure 3.16. The "Packet List" pane
Each line in the packet list corresponds to one packet in the capture file. If you select a line in this pane,
more details will be displayed in the "Packet Details" and "Packet Bytes" panes.
While dissecting a packet, Wireshark will place information from the protocol dissectors into the columns.
As higher level protocols might overwrite information from lower levels, you will typically see the
information from the highest possible level only.
For example, let's look at a packet containing TCP inside IP inside an Ethernet packet. The Ethernet
dissector will write its data (such as the Ethernet addresses), the IP dissector will overwrite this by its own
(such as the IP addresses), the TCP dissector will overwrite the IP information, and so on.
There are a lot of different columns available. Which columns are displayed can be selected by preference
settings, see Section 10.5, “Preferences”.
The default columns will show:
• No. The number of the packet in the capture file. This number won't change, even if a display filter
is used.
45
Page 56

User Interface
• Time The timestamp of the packet. The presentation format of this timestamp can be changed, see
Section 6.12, “Time display formats and time references”.
• Source The address where this packet is coming from.
• Destination The address where this packet is going to.
• Protocol The protocol name in a short (perhaps abbreviated) version.
• Info Additional information about the packet content.
There is a context menu (right mouse click) available, see details in Figure 6.4, “Pop-up menu of the
"Packet List" pane”.
3.19. The "Packet Details" pane
The packet details pane shows the current packet (selected in the "Packet List" pane) in a more detailed
form.
Figure 3.17. The "Packet Details" pane
This pane shows the protocols and protocol fields of the packet selected in the "Packet List" pane. The
protocols and fields of the packet are displayed using a tree, which can be expanded and collapsed.
There is a context menu (right mouse click) available, see details in Figure 6.5, “Pop-up menu of the
"Packet Details" pane”.
Some protocol fields are specially displayed.
• Generated fields Wireshark itself will generate additional protocol fields which are surrounded by
brackets. The information in these fields is derived from the known context to other packets in the
capture file. For example, Wireshark is doing a sequence/acknowledge analysis of each TCP stream,
which is displayed in the [SEQ/ACK analysis] fields of the TCP protocol.
• Links If Wireshark detected a relationship to another packet in the capture file, it will generate a link
to that packet. Links are underlined and displayed in blue. If double-clicked, Wireshark jumps to the
corresponding packet.
3.20. The "Packet Bytes" pane
The packet bytes pane shows the data of the current packet (selected in the "Packet List" pane) in a hexdump
style.
Figure 3.18. The "Packet Bytes" pane
46
Page 57

User Interface
As usual for a hexdump, the left side shows the offset in the packet data, in the middle the packet data is
shown in a hexadecimal representation and on the right the corresponding ASCII characters (or . if not
appropriate) are displayed.
Depending on the packet data, sometimes more than one page is available, e.g. when Wireshark has
reassembled some packets into a single chunk of data, see Section 7.6, “Packet Reassembling”. In this case
there are some additional tabs shown at the bottom of the pane to let you select the page you want to see.
Figure 3.19. The "Packet Bytes" pane with tabs
Note!
The additional pages might contain data picked from multiple packets.
The context menu (right mouse click) of the tab labels will show a list of all available pages. This can be
helpful if the size in the pane is too small for all the tab labels.
3.21. The Statusbar
The statusbar displays informational messages.
In general, the left side will show context related information, the middle part will show the current number
of packets, and the right side will show the selected configuration profile. Drag the handles between the
text areas to change the size.
Figure 3.20. The initial Statusbar
This statusbar is shown while no capture file is loaded, e.g. when Wireshark is started.
Figure 3.21. The Statusbar with a loaded capture file
• The colorized bullet on the left shows the highest expert info level found in the currently loaded capture
file. Hovering the mouse over this icon will show a textual description of the expert info level, and
clicking the icon will bring up the Expert Infos dialog box. For a detailed description of expert info,
see Section 7.3, “Expert Infos”.
• The left side shows information about the capture file, its name, its size and the elapsed time while it
was being captured.
• The middle part shows the current number of packets in the capture file. The following values are
displayed:
• Packets: the number of captured packets
• Displayed: the number of packets currently being displayed
47
Page 58

User Interface
• Marked: the number of marked packets
• Dropped: the number of dropped packets (only displayed if Wireshark was unable to capture all
packets)
• Ignored: the number of ignored packets (only displayed if packets are ignored)
• The right side shows the selected configuration profile. Clicking in this part of the statusbar will
bring up a menu with all available configuration profiles, and selecting from this list will change the
configuration profile.
Figure 3.22. The Statusbar with a configuration profile menu
For a detailed description of configuration profiles, see Section 10.6, “Configuration Profiles”.
Figure 3.23. The Statusbar with a selected protocol field
This is displayed if you have selected a protocol field from the "Packet Details" pane.
Tip!
The value between the brackets (in this example arp.opcode) can be used as a display filter
string, representing the selected protocol field.
Figure 3.24. The Statusbar with a display filter message
This is displayed if you are trying to use a display filter which may have unexpected results. For a detailed
description, see Section 6.4.4, “A common mistake”.
48
Page 59

Chapter 4. Capturing Live Network Data
4.1. Introduction
Capturing live network data is one of the major features of Wireshark.
The Wireshark capture engine provides the following features:
• Capture from different kinds of network hardware (Ethernet, Token Ring, ATM, ...).
• Stop the capture on different triggers like: amount of captured data, captured time, captured number
of packets.
• Simultaneously show decoded packets while Wireshark keeps on capturing.
• Filter packets, reducing the amount of data to be captured, see Section 4.12, “Filtering while capturing”.
• Capturing into multiple files while doing a long term capture, and in addition the option to form
a ringbuffer of these files, keeping only the last x files, useful for a "very long term" capture, see
Section 4.10, “Capture files and file modes”.
• Simultaneous capturing from multiple network interfaces.
The capture engine still lacks the following features:
• Stop capturing (or doing some other action), depending on the captured data.
4.2. Prerequisites
Setting up Wireshark to capture packets for the first time can be tricky.
Tip!
A comprehensive guide "How To setup a Capture" is available at: http://wiki.wireshark.org/
CaptureSetup.
Here are some common pitfalls:
• You need to have root / Administrator privileges to start a live capture.
• You need to choose the right network interface to capture packet data from.
• You need to capture at the right place in the network to see the traffic you want to see.
• ... and a lot more!.
If you have any problems setting up your capture environment, you should have a look at the guide
mentioned above.
49
Page 60

Capturing Live Network Data
4.3. Start Capturing
One of the following methods can be used to start capturing packets with Wireshark:
•
You can get an overview of the available local interfaces using the " Capture Interfaces" dialog
box, see Figure 4.1, “The "Capture Interfaces" dialog box on Microsoft Windows” or Figure 4.2, “The
"Capture Interfaces" dialog box on Unix/Linux”. You can start a capture from this dialog box, using
(one of) the "Capture" button(s).
•
You can start capturing using the " Capture Options" dialog box, see Figure 4.3, “The "Capture
Options" dialog box”.
•
If you have selected the right capture options before, you can immediately start a capture using the "
Capture Start" menu / toolbar item. The capture process will start immediately.
• If you already know the name of the capture interface, you can start Wireshark from the command line
and use the following:
wireshark -i eth0 -k
This will start Wireshark capturing on interface eth0, more details can be found at: Section 10.2, “Start
Wireshark from the command line”.
4.4. The "Capture Interfaces" dialog box
When you select "Interfaces..." from the Capture menu, Wireshark pops up the "Capture Interfaces" dialog
box as shown in Figure 4.1, “The "Capture Interfaces" dialog box on Microsoft Windows” or Figure 4.2,
“The "Capture Interfaces" dialog box on Unix/Linux”.
This dialog consumes lots of system resources!
As the "Capture Interfaces" dialog is showing live captured data, it is consuming a lot of
system resources. Close this dialog as soon as possible to prevent excessive system load.
Not all available interfaces may be displayed!
This dialog box will only show the local interfaces Wireshark knows of. It will not show
interfaces marked as hidden in Section 10.5.1, “Interface Options”. As Wireshark might not
be able to detect all local interfaces, and it cannot detect the remote interfaces available, there
could be more capture interfaces available than listed.
As it is possible to simultaneously capture packets from multiple interfaces, the toggle buttons can be used
to select one or more interfaces.
50
Page 61

Capturing Live Network Data
Figure 4.1. The "Capture Interfaces" dialog box on Microsoft Windows
Figure 4.2. The "Capture Interfaces" dialog box on Unix/Linux
Device (Unix/Linux only) The interface device name.
Description The interface description provided by the operating system, or the
user defined comment added in Section 10.5.1, “Interface Options”.
IP The first IP address Wireshark could find for this interface. You can
click on the address to cycle through other addresses assigned to it,
if available. If no address could be found "none" will be displayed.
Packets The number of packets captured from this interface, since this
dialog was opened. Will be greyed out, if no packet was captured
in the last second.
51
Page 62

Capturing Live Network Data
Packets/s Number of packets captured in the last second. Will be greyed out,
if no packet was captured in the last second.
Stop Stop a currently running capture.
Start Start a capture on all selected interfaces immediately, using the
settings from the last capture or the default settings, if no options
have been set.
Options Open the Capture Options dialog with the marked interfaces
selected, see Section 4.5, “The "Capture Options" dialog box”.
Details (Microsoft Windows only) Open a dialog with detailed information about the interface, see
Section 4.9, “The "Interface Details" dialog box”.
Help Show this help page.
Close Close this dialog box.
4.5. The "Capture Options" dialog box
When you select Options... from the Capture menu (or use the corresponding item in the "Main" toolbar),
Wireshark pops up the "Capture Options" dialog box as shown in Figure 4.3, “The "Capture Options"
dialog box”.
52
Page 63

Capturing Live Network Data
Figure 4.3. The "Capture Options" dialog box
53
Page 64

Tip!
If you are unsure which options to choose in this dialog box, just try keeping the defaults as
this should work well in many cases.
4.5.1. Capture frame
The table shows the settings for all available interfaces:
• The name of the interface and its IP addresses. If no address could be resolved from the system, "none"
will be shown.
Note
loopback interfaces are not available on Windows platforms.
• The link-layer header type.
• The information whether promicuous mode is enabled or disabled.
• The maximum amount of data that will be captured for each packet. The default value is set to the
65535 bytes.
Capturing Live Network Data
• The size of the kernel buffer that is reserved to keep the captured packets.
• The information whether packets will be captured in monitor mode (Unix/Linux only).
• The chosen capture filter.
By marking the checkboxes in the first column the interfaces are selected to be captured from. By doubleclicking on an interface the "Edit Interface Settings" dialog box as shown in Figure 4.4, “The "Edit Interface
Settings" dialog box” will be opened.
Capture on all interfaces As Wireshark can capture on multiple interfaces, it is possible to
choose to capture on all available interfaces.
Capture all packets in
promiscuous mode
Manage Interfaces The "Manage Interfaces" button leads you to Figure 4.5, “The "Add
This checkbox allows you to specify that Wireshark should put all
interfaces in promiscuous mode when capturing.
New Interfaces" dialog box” where pipes can be defined, local
interfaces scanned or hidden, or remote interfaces added (Windows
only).
4.5.2. Capture File(s) frame
An explanation about capture file usage can be found in Section 4.10, “Capture files and file modes”.
File This field allows you to specify the file name that will be used for
the capture file. This field is left blank by default. If the field is
left blank, the capture data will be stored in a temporary file, see
Section 4.10, “Capture files and file modes” for details.
You can also click on the button to the right of this field to browse
through the filesystem.
54
Page 65

Capturing Live Network Data
Use multiple files Instead of using a single file, Wireshark will automatically switch
to a new one, if a specific trigger condition is reached.
Use pcap-ng format This checkbox allows you to specify that Wireshark saves the
captured packets in pcap-ng format. This next generation capture
file format is currently in development. If more than one interface
is chosen for capturing, this checkbox is set by default. See http://
wiki.wireshark.org/Development/PcapNg for more details on pcap-
ng.
Next file every n megabyte(s) Multiple files only: Switch to the next file after the given number
of byte(s)/kilobyte(s)/megabyte(s)/gigabyte(s) have been captured.
Next file every n minute(s) Multiple files only: Switch to the next file after the given number
of second(s)/minutes(s)/hours(s)/days(s) have elapsed.
Ring buffer with n files Multiple files only: Form a ring buffer of the capture files, with the
given number of files.
Stop capture after n file(s) Multiple files only: Stop capturing after switching to the next file
the given number of times.
4.5.3. Stop Capture... frame
... after n packet(s) Stop capturing after the given number of packets have been
captured.
... after n megabytes(s) Stop capturing after the given number of byte(s)/kilobyte(s)/
megabyte(s)/gigabyte(s) have been captured. This option is greyed
out, if "Use multiple files" is selected.
... after n minute(s) Stop capturing after the given number of second(s)/minutes(s)/
hours(s)/days(s) have elapsed.
4.5.4. Display Options frame
Update list of packets in real time This option allows you to specify that Wireshark should update the
packet list pane in real time. If you do not specify this, Wireshark
does not display any packets until you stop the capture. When you
check this, Wireshark captures in a separate process and feeds the
captures to the display process.
Automatic scrolling in live
capture
This option allows you to specify that Wireshark should scroll the
packet list pane as new packets come in, so you are always looking
at the last packet. If you do not specify this, Wireshark simply adds
new packets onto the end of the list, but does not scroll the packet
list pane. This option is greyed out if "Update list of packets in real
time" is disabled.
Hide capture info dialog If this option is checked, the capture info dialog described in
Section 4.13, “While a Capture is running ...” will be hidden.
55
Page 66

Capturing Live Network Data
4.5.5. Name Resolution frame
Enable MAC name resolution This option allows you to control whether or not Wireshark
translates MAC addresses into names, see Section 7.7, “Name
Resolution”.
Enable network name resolution This option allows you to control whether or not Wireshark
translates network addresses into names, see Section 7.7, “Name
Resolution”.
Enable transport name
resolution
This option allows you to control whether or not Wireshark
translates transport addresses into protocols, see Section 7.7,
“Name Resolution”.
4.5.6. Buttons
Once you have set the values you desire and have selected the options you need, simply click on Start to
commence the capture, or Cancel to cancel the capture.
If you start a capture, Wireshark allows you to stop capturing when you have enough packets captured,
for details see Section 4.13, “While a Capture is running ...”.
4.6. The "Edit Interface Settings" dialog box
If you double-click on an interface in Figure 4.3, “The "Capture Options" dialog box” the following dialog
box pops up.
56
Page 67

Capturing Live Network Data
Figure 4.4. The "Edit Interface Settings" dialog box
You can set the following fields in this dialog box:
IP address The IP address(es) of the selected interface. If no address could be
resolved from the system, "none" will be shown.
Link-layer header type Unless you are in the rare situation that you need this, just keep
the default. For a detailed description, see Section 4.11, “Link-layer
header type”
Wireless settings (Windows only) Here you can set the settings for wireless capture using the AirPCap
adapter. For a detailed description, see the AirPCap Users Guide.
Remote settings (Windows only) Here you can set the settings for remote capture. For a detailed
description, see Section 4.8, “The "Remote Capture Interfaces"
dialog box”
Capture packets in promiscuous
mode
This checkbox allows you to specify that Wireshark should put
the interface in promiscuous mode when capturing. If you do not
specify this, Wireshark will only capture the packets going to or
from your computer (not all packets on your LAN segment).
Note
If some other process has put the interface in
promiscuous mode you may be capturing in
promiscuous mode even if you turn off this option.
57
Page 68

Capturing Live Network Data
Note
Even in promiscuous mode you still won't necessarily
see all packets on your LAN segment, see http://
www.wireshark.org/faq.html#promiscsniff for some
more explanations.
Limit each packet to n bytes This field allows you to specify the maximum amount of data that
will be captured for each packet, and is sometimes referred to as the
snaplen. If disabled, the value is set to the maximum 65535, which
will be sufficient for most protocols. Some rules of thumb:
• If you are unsure, just keep the default value.
• If you don't need all of the data in a packet - for example, if you
only need the link-layer, IP, and TCP headers - you might want
to choose a small snapshot length, as less CPU time is required
for copying packets, less buffer space is required for packets,
and thus perhaps fewer packets will be dropped if traffic is very
heavy.
• If you don't capture all of the data in a packet, you might find
that the packet data you want is in the part that's dropped, or that
reassembly isn't possible as the data required for reassembly is
missing.
Buffer size: n megabyte(s) Enter the buffer size to be used while capturing. This is the size of
the kernel buffer which will keep the captured packets, until they
are written to disk. If you encounter packet drops, try increasing
this value.
Capture packets in monitor mode
(Unix/Linux only)
This checkbox allows you to setup the Wireless interface to capture
all traffic it can receive, not just the traffic on the BSS to which it
is associated, which can happen even when you set promiscuous
mode. Also it might be necessary to turn this option on in order
to see IEEE 802.11 headers and/or radio information from the
captured frames.
Note
In monitor mode the adapter might disassociate itself
from the network it was associated to.
Capture Filter This field allows you to specify a capture filter. Capture filters
are discussed in more details in Section 4.12, “Filtering while
capturing”. It defaults to empty, or no filter.
You can also click on the button labeled "Capture Filter", and
Wireshark will bring up the Capture Filters dialog box and allow
you to create and/or select a filter. Please see Section 6.6, “Defining
and saving filters”
Compile BPF This button allows you to compile the capture filter into BPF code
and pop up a window showing you the resulting pseudo code. This
58
Page 69

Capturing Live Network Data
can help in understanding the working of the capture filter you
created.
4.7. The "Add New Interfaces" dialog box
As a central point to manage interfaces this dialog box consists of three tabs to add or remove interfaces.
Figure 4.5. The "Add New Interfaces" dialog box
59
Page 70

Capturing Live Network Data
4.7.1. Add or remove pipes
Figure 4.6. The "Add New Interfaces - Pipes" dialog box
To successfully add a pipe, this pipe must have already been created. Click the "New" button and type the
name of the pipe including its path. Alternatively, the "Browse" button can be used to locate the pipe. With
the "Save" button the pipe is added to the list of available interfaces. Afterwards, other pipes can be added.
To remove a pipe from the list of interfaces it first has to be selected. Then click the "Delete" button.
60
Page 71

Capturing Live Network Data
4.7.2. Add or hide local interfaces
Figure 4.7. The "Add New Interfaces - Local Interfaces" dialog box
The tab "Local Interfaces" contains a list of available local interfaces, including the hidden ones, which
are not shown in the other lists.
If a new local interface is added, for example, a wireless interface has been activated, it is not automatically
added to the list to prevent the constant scanning for a change in the list of available interfaces. To renew
the list a rescan can be done.
One way to hide an interface is to change the preferences. If the "Hide" checkbox is activated and the
"Apply" button clicked, the interface will not be seen in the lists of the "Capture Options" or "Capture
Interfaces" dialog box any more. The changes are also saved in the "Preferences" file.
61
Page 72

Capturing Live Network Data
4.7.3. Add or hide remote interfaces
Figure 4.8. The "Add New Interfaces - Remote Interfaces" dialog box
In this tab interfaces on remote hosts can be added. One or more of these interfaces can be hidden. In
contrast to the local interfaces they are not saved in the "Preferences" file.
To remove a host including all its interfaces from the list, it has to be selected. Then click the "Delete"
button.
For a detailed description, see Section 4.8, “The "Remote Capture Interfaces" dialog box”
4.8. The "Remote Capture Interfaces" dialog box
Besides doing capture on local interfaces Wireshark is capable of reaching out across the network to a so
called capture daemon or service processes to receive captured data from.
Microsoft Windows only
This dialog and capability is only available on Microsoft Windows. On Linux/Unix you can
achieve the same effect (securely) through an SSH tunnel.
The Remote Packet Capture Protocol service must first be running on the target platform before Wireshark
can connect to it. The easiest way is to install WinPcap from http://www.winpcap.org/install/default.htm
62
Page 73

Capturing Live Network Data
on the target. Once installation is completed go to the Services control panel, find the Remote Packet
Capture Protocol service and start it.
Note
Make sure you have outside access to port 2002 on the target platform. This is the port where
the Remote Packet Capture Protocol service can be reached, by default.
To access the Remote Capture Interfaces dialog use the "Add New Interfaces - Remote" dialog, see
Figure 4.8, “The "Add New Interfaces - Remote Interfaces" dialog box”, and select "Add".
4.8.1. Remote Capture Interfaces
Figure 4.9. The "Remote Capture Interfaces" dialog box
You have to set the following parameter in this dialog:
Host Enter the IP address or host name of the target platform where
the Remote Packet Capture Protocol service is listening. The drop
down list contains the hosts that have previously been successfully
contacted. The list can be emptied by choosing "Clear list" from the
drop down list.
Port Set the port number where the Remote Packet Capture Protocol
service is listening on. Leave open to use the default port (2002).
63
Page 74

Capturing Live Network Data
Null authentication Select this if you don't need authentication to take place for a
remote capture to be started. This depends on the target platform.
Configuring the target platform like this makes it insecure.
Password authentication This is the normal way of connecting to a target platform. Set the
credentials needed to connect to the Remote Packet Capture Protocol
service.
4.8.2. Remote Capture Settings
The remote capture can be further fine tuned to match your situation. The Remote Settings button in
Figure 4.4, “The "Edit Interface Settings" dialog box” gives you this option. It pops up the dialog shown
in Figure 4.10, “The "Remote Capture Settings" dialog box”.
Figure 4.10. The "Remote Capture Settings" dialog box
You can set the following parameters in this dialog:
Do not capture own RPCAP
traffic
Use UDP for data transfer Remote capture control and data flows over a TCP connection. This
This option sets a capture filter so that the traffic flowing back
from the Remote Packet Capture Protocol service to Wireshark isn't
captured as well and also send back. The recursion in this saturates
the link with duplicate traffic.
You only should switch this off when capturing on an interface
other then the interface connecting back to Wireshark.
option allows you to choose an UDP stream for data transfer.
64
Page 75

Capturing Live Network Data
Sampling option None This option instructs the Remote Packet Capture Protocol service
to send back all captured packets which have passed the capture
filter. This is usually not a problem on a remote capture session with
sufficient bandwidth.
Sampling option 1 of x packets This option limits the Remote Packet Capture Protocol service to
send only a sub sampling of the captured data, in terms of number
of packets. This allows capture over a narrow band remote capture
session of a higher bandwidth interface.
Sampling option 1 every x
milliseconds
This option limits the Remote Packet Capture Protocol service to
send only a sub sampling of the captured data, in terms of time.
This allows capture over a narrow band capture session of a higher
bandwidth interface.
4.9. The "Interface Details" dialog box
When you select Details from the Capture Interface menu, Wireshark pops up the "Interface Details"
dialog box as shown in Figure 4.11, “The "Interface Details" dialog box”. This dialog shows various
characteristics and statistics for the selected interface.
Microsoft Windows only
This dialog is only available on Microsoft Windows
Figure 4.11. The "Interface Details" dialog box
4.10. Capture files and file modes
While capturing, the underlying libpcap capturing engine will grab the packets from the network card and
keep the packet data in a (relatively) small kernel buffer. This data is read by Wireshark and saved into
the capture file(s) the user specified.
65
Page 76

Capturing Live Network Data
Different modes of operation are available when saving this packet data to the capture file(s).
Tip!
Working with large files (several 100 MB's) can be quite slow. If you plan to do a long term
capture or capturing from a high traffic network, think about using one of the "Multiple files"
options. This will spread the captured packets over several smaller files which can be much
more pleasant to work with.
Note!
Using Multiple files may cut context related information. Wireshark keeps context
information of the loaded packet data, so it can report context related problems (like a stream
error) and keeps information about context related protocols (e.g. where data is exchanged
at the establishing phase and only referred to in later packets). As it keeps this information
only for the loaded file, using one of the multiple file modes may cut these contexts. If the
establishing phase is saved in one file and the things you would like to see is in another, you
might not see some of the valuable context related information.
Tip!
Information about the folders used for the capture file(s), can be found in Appendix A, Files
and Folders.
Table 4.1. Capture file mode selected by capture options
"File" option "Use multiple
files" option
- - - Single temporary
foo.cap - - Single named file foo.cap
foo.cap x - Multiple files,
foo.cap x x Multiple files,
Single temporary file A temporary file will be created and used (this is the default). After
Single named file A single capture file will be used. If you want to place the new
Multiple files, continuous Like the "Single named file" mode, but a new file is created and
"Ring buffer with
n files" option
the capturing is stopped, this file can be saved later under a user
specified name.
capture file to a specific folder, choose this mode.
used, after reaching one of the multiple file switch conditions (one
of the "Next file every ..." values).
Mode Resulting filename(s)
used
wiresharkXXXXXX
file
continuous
ring buffer
(where XXXXXX is a
unique number)
foo_00001_20100205110102.cap,
foo_00002_20100205110318.cap, ...
foo_00001_20100205110102.cap,
foo_00002_20100205110318.cap, ...
Multiple files, ring buffer Much like "Multiple files continuous", reaching one of the multiple
files switch conditions (one of the "Next file every ..." values) will
switch to the next file. This will be a newly created file if value of
"Ring buffer with n files" is not reached, otherwise it will replace
the oldest of the formerly used files (thus forming a "ring").
66
Page 77

Capturing Live Network Data
This mode will limit the maximum disk usage, even for an unlimited
amount of capture input data, keeping the latest captured data.
4.11. Link-layer header type
In the usual case, you won't have to choose this link-layer header type. The following paragraphs describe
the exceptional cases, where selecting this type is possible, so you will have a guide of what to do:
If you are capturing on an 802.11 device on some versions of BSD, this might offer a choice of "Ethernet"
or "802.11". "Ethernet" will cause the captured packets to have fake Ethernet headers; "802.11" will cause
them to have IEEE 802.11 headers. Unless the capture needs to be read by an application that doesn't
support 802.11 headers, you should select "802.11".
If you are capturing on an Endace DAG card connected to a synchronous serial line, this might offer a
choice of "PPP over serial" or "Cisco HDLC"; if the protocol on the serial line is PPP, select "PPP over
serial", and if the protocol on the serial line is Cisco HDLC, select "Cisco HDLC".
If you are capturing on an Endace DAG card connected to an ATM network, this might offer a choice
of "RFC 1483 IP-over-ATM" or "Sun raw ATM". If the only traffic being captured is RFC 1483 LLCencapsulated IP, or if the capture needs to be read by an application that doesn't support SunATM headers,
select "RFC 1483 IP-over-ATM", otherwise select "Sun raw ATM".
If you are capturing on an Ethernet device, this might offer a choice of "Ethernet" or "DOCSIS". If you
are capturing traffic from a Cisco Cable Modem Termination System that is putting DOCSIS traffic onto
the Ethernet to be captured, select "DOCSIS", otherwise select "Ethernet".
4.12. Filtering while capturing
Wireshark uses the libpcap filter language for capture filters. This is explained in the tcpdump man page,
which can be hard to understand, so it's explained here to some extent.
Tip!
You will find a lot of Capture Filter examples at http://wiki.wireshark.org/CaptureFilters.
You enter the capture filter into the Filter field of the Wireshark Capture Options dialog box, as shown
in Figure 4.3, “The "Capture Options" dialog box”. The following is an outline of the syntax of the
tcpdump capture filter language. See the expression option at the tcpdump manual page for details: http:
//www.tcpdump.org/tcpdump_man.html.
A capture filter takes the form of a series of primitive expressions connected by conjunctions (and/or)
and optionally preceded by not:
[not] primitive [and|or [not] primitive ...]
An example is shown in Example 4.1, “ A capture filter for telnet that captures traffic to and from a
particular host ”.
Example 4.1. A capture filter for telnet that captures traffic to and from a particular
host
tcp port 23 and host 10.0.0.5
67
Page 78

Capturing Live Network Data
This example captures telnet traffic to and from the host 10.0.0.5, and shows how to use two primitives
and the and conjunction. Another example is shown in Example 4.2, “ Capturing all telnet traffic not from
10.0.0.5”, and shows how to capture all telnet traffic except that from 10.0.0.5.
Example 4.2. Capturing all telnet traffic not from 10.0.0.5
tcp port 23 and not src host 10.0.0.5
XXX - add examples to the following list.
A primitive is simply one of the following:
[src|dst] host <host> This primitive allows you to filter on a host IP address or name.
You can optionally precede the primitive with the keyword src|
dst to specify that you are only interested in source or destination
addresses. If these are not present, packets where the specified
address appears as either the source or the destination address will
be selected.
ether [src|dst] host <ehost> This primitive allows you to filter on Ethernet host addresses. You
can optionally include the keyword src|dst between the keywords
ether and host to specify that you are only interested in source or
destination addresses. If these are not present, packets where the
specified address appears in either the source or destination address
will be selected.
gateway host <host> This primitive allows you to filter on packets that used host as a
gateway. That is, where the Ethernet source or destination was host
but neither the source nor destination IP address was host.
[src|dst] net <net> [{mask
<mask>}|{len <len>}]
This primitive allows you to filter on network numbers. You
can optionally precede this primitive with the keyword src|dst
to specify that you are only interested in a source or destination
network. If neither of these are present, packets will be selected
that have the specified network in either the source or destination
address. In addition, you can specify either the netmask or the CIDR
prefix for the network if they are different from your own.
[tcp|udp] [src|dst] port <port> This primitive allows you to filter on TCP and UDP port numbers.
You can optionally precede this primitive with the keywords src|dst
and tcp|udp which allow you to specify that you are only interested
in source or destination ports and TCP or UDP packets respectively.
The keywords tcp|udp must appear before src|dst.
If these are not specified, packets will be selected for both the TCP
and UDP protocols and when the specified address appears in either
the source or destination port field.
less|greater <length> This primitive allows you to filter on packets whose length was less
than or equal to the specified length, or greater than or equal to the
specified length, respectively.
ip|ether proto <protocol> This primitive allows you to filter on the specified protocol at either
the Ethernet layer or the IP layer.
68
Page 79

Capturing Live Network Data
ether|ip broadcast|multicast This primitive allows you to filter on either Ethernet or IP
broadcasts or multicasts.
<expr> relop <expr> This primitive allows you to create complex filter expressions that
select bytes or ranges of bytes in packets. Please see the tcpdump
man page at http://www.tcpdump.org/tcpdump_man.html for more
details.
4.12.1. Automatic Remote Traffic Filtering
If Wireshark is running remotely (using e.g. SSH, an exported X11 window, a terminal server, ...), the
remote content has to be transported over the network, adding a lot of (usually unimportant) packets to
the actually interesting traffic.
To avoid this, Wireshark tries to figure out if it's remotely connected (by looking at some specific
environment variables) and automatically creates a capture filter that matches aspects of the connection.
The following environment variables are analyzed:
SSH_CONNECTION (ssh) <remote IP> <remote port> <local IP> <local port>
SSH_CLIENT (ssh) <remote IP> <remote port> <local port>
REMOTEHOST (tcsh, others?) <remote name>
DISPLAY (x11) [remote name]:<display num>
SESSIONNAME (terminal server) <remote name>
4.13. While a Capture is running ...
While a capture is running, the following dialog box is shown:
Figure 4.12. The "Capture Info" dialog box
This dialog box will inform you about the number of captured packets and the time since the capture was
started. The selection of which protocols are counted cannot be changed.
69
Page 80

Capturing Live Network Data
Tip!
This Capture Info dialog box can be hidden, using the "Hide capture info dialog" option in
the Capture Options dialog box.
4.13.1. Stop the running capture
A running capture session will be stopped in one of the following ways:
1.
Using the " Stop" button from the Capture Info dialog box .
Note!
The Capture Info dialog box might be hidden, if the option "Hide capture info dialog"
is used.
2.
Using the menu item "Capture/ Stop".
3.
Using the toolbar item " Stop".
4. Pressing the accelerator keys: Ctrl+E.
5. The capture will be automatically stopped, if one of the Stop Conditions is exceeded, e.g. the maximum
amount of data was captured.
4.13.2. Restart a running capture
A running capture session can be restarted with the same capture options as the last time, this will remove
all packets previously captured. This can be useful, if some uninteresting packets are captured and there's
no need to keep them.
Restart is a convenience function and equivalent to a capture stop following by an immediate capture start.
A restart can be triggered in one of the following ways:
1.
Using the menu item "Capture/ Restart".
2.
Using the toolbar item " Restart".
70
Page 81

Chapter 5. File Input / Output and Printing
5.1. Introduction
This chapter will describe input and output of capture data.
• Open/Import capture files in various capture file formats
• Save/Export capture files in various capture file formats
• Merge capture files together
• Print packets
5.2. Open capture files
Wireshark can read in previously saved capture files. To read them, simply select the menu or toolbar
item: "File/ Open". Wireshark will then pop up the File Open dialog box, which is discussed in more
detail in Section 5.2.1, “The "Open Capture File" dialog box”.
It's convenient to use drag-and-drop!
... to open a file, by simply dragging the desired file from your file manager and dropping it
onto Wireshark's main window. However, drag-and-drop is not available/won't work in all
desktop environments.
If you haven't previously saved the current capture file, you will be asked to do so, to prevent data loss
(this behaviour can be disabled in the preferences).
In addition to its native file format (libpcap format, also used by tcpdump/WinDump and other libpcap/
WinPcap-based programs), Wireshark can read capture files from a large number of other packet capture
programs as well. See Section 5.2.2, “Input File Formats” for the list of capture formats Wireshark
understands.
5.2.1. The "Open Capture File" dialog box
The "Open Capture File" dialog box allows you to search for a capture file containing previously captured
packets for display in Wireshark. Table 5.1, “The system specific "Open Capture File" dialog box” shows
some examples of the Wireshark Open File Dialog box.
The dialog appearance depends on your system!
The appearance of this dialog depends on the system and/or GTK+ toolkit version used.
However, the functionality remains basically the same on any particular system.
Common dialog behaviour on all systems:
• Select files and directories.
• Click the Open/Ok button to accept your selected file and open it.
• Click the Cancel button to go back to Wireshark and not load a capture file.
71
Page 82

File Input / Output and Printing
Wireshark extensions to the standard behaviour of these dialogs:
• View file preview information (like the filesize, the number of packets, ...), if you've selected a capture
file.
• Specify a display filter with the "Filter:" button and filter field. This filter will be used when opening
the new file. The text field background becomes green for a valid filter string and red for an invalid
one. Clicking on the Filter button causes Wireshark to pop up the Filters dialog box (which is discussed
further in Section 6.3, “Filtering packets while viewing”).
XXX - we need a better description of these read filters
• Specify which type of name resolution is to be performed for all packets by clicking on one of the "...
name resolution" check buttons. Details about name resolution can be found in Section 7.7, “Name
Resolution”.
Save a lot of time loading huge capture files!
You can change the display filter and name resolution settings later while viewing the
packets. However, loading huge capture files can take a significant amount of extra time if
these settings are changed later, so in such situations it can be a good idea to set at least the
filter in advance here.
Table 5.1. The system specific "Open Capture File" dialog box
Figure 5.1. "Open" on native Windows
Figure 5.2. "Open" - new GTK version
Microsoft Windows
This is the common Windows file open dialog - plus
some Wireshark extensions.
Specific for this dialog:
• If available, the "Help" button will lead you to this
section of this "User's Guide".
•
Unix/Linux: GTK version >= 2.4
This is the common Gimp/GNOME file open dialog
- plus some Wireshark extensions.
Specific for this dialog:
Note
The "Filter:" button currently
doesn't work on Windows!
72
• The "+ Add" button allows you to add a directory,
selected in the right-hand pane, to the favorites
list on the left. Those changes are persistent.
• The "- Remove" button allows you to remove
a selected directory from that list again (the
Page 83

File Input / Output and Printing
Figure 5.3. "Open" - old GTK version
5.2.2. Input File Formats
items like: "Home", "Desktop", and "Filesystem"
cannot be removed).
• If Wireshark doesn't recognize the selected file as
a capture file, it will grey out the "Open" button.
Unix/Linux: GTK version < 2.4
This is the file open dialog of former Gimp/
GNOME versions - plus some Wireshark
extensions.
Specific for this dialog:
• If Wireshark doesn't recognize the selected file as
a capture file, it will grey out the "Ok" button.
The following file formats from other capture tools can be opened by Wireshark:
• libpcap - captures from Wireshark/TShark/dumpcap, tcpdump, and various other tools using libpcap's/
tcpdump's capture format
• pcap-ng - "next-generation" successor to libpcap format
• Sun snoop and atmsnoop
• Shomiti/Finisar Surveyor captures
• Novell LANalyzer captures
• Microsoft Network Monitor captures
• AIX's iptrace captures
• Cinco Networks NetXray captures
• Network Associates Windows-based Sniffer and Sniffer Pro captures
• Network General/Network Associates DOS-based Sniffer (compressed or uncompressed) captures
• AG Group/WildPackets EtherPeek/TokenPeek/AiroPeek/EtherHelp/PacketGrabber captures
• RADCOM's WAN/LAN Analyzer captures
• Network Instruments Observer version 9 captures
• Lucent/Ascend router debug output
• HP-UX's nettl
• Toshiba's ISDN routers dump output
73
Page 84

File Input / Output and Printing
• ISDN4BSD i4btrace utility
• traces from the EyeSDN USB S0
• IPLog format from the Cisco Secure Intrusion Detection System
• pppd logs (pppdump format)
• the output from VMS's TCPIPtrace/TCPtrace/UCX$TRACE utilities
• the text output from the DBS Etherwatch VMS utility
• Visual Networks' Visual UpTime traffic capture
• the output from CoSine L2 debug
• the output from Accellent's 5Views LAN agents
• Endace Measurement Systems' ERF format captures
• Linux Bluez Bluetooth stack hcidump -w traces
• Catapult DCT2000 .out files
• Gammu generated text output from Nokia DCT3 phones in Netmonitor mode
• IBM Series (OS/400) Comm traces (ASCII & UNICODE)
• Juniper Netscreen snoop captures
• Symbian OS btsnoop captures
• Tamosoft CommView captures
• Textronix K12xx 32bit .rf5 format captures
• Textronix K12 text file format captures
• Apple PacketLogger captures
• Captures from Aethra Telecommunications' PC108 software for their test instruments
• ... new file formats are added from time to time
Opening a file may fail due to invalid packet types!
It may not be possible to read some formats dependent on the packet types captured. Ethernet
captures are usually supported for most file formats but it may not be possible to read other
packet types (e.g. token ring packets) from all file formats.
5.3. Saving captured packets
You can save captured packets simply by using the Save As... menu item from the File menu under
Wireshark. You can choose which packets to save and which file format to be used.
74
Page 85

File Input / Output and Printing
Saving may reduce the available information!
Saving the captured packets will slightly reduce the amount of information, e.g. the number
of dropped packets will be lost; see Section A.1, “Capture Files” for details.
5.3.1. The "Save Capture File As" dialog box
The "Save Capture File As" dialog box allows you to save the current capture to a file. Table 5.2, “The
system specific "Save Capture File As" dialog box” shows some examples of this dialog box.
The dialog appearance depends on your system!
The appearance of this dialog depends on the system and GTK+ toolkit version used.
However, the functionality remains basically the same on any particular system.
Table 5.2. The system specific "Save Capture File As" dialog box
Figure 5.4. "Save" on native Windows
Figure 5.5. "Save" - new GTK version
Microsoft Windows
This is the common Windows file save dialog - plus
some Wireshark extensions.
Specific for this dialog:
• If available, the "Help" button will lead you to this
section of this "User's Guide".
• If you don't provide a file extension to the
filename - e.g. .pcap, Wireshark will append the
standard file extension for that file format.
Unix/Linux: GTK version >= 2.4
This is the common Gimp/GNOME file save dialog
- plus some Wireshark extensions.
Specific for this dialog:
• Clicking on the + at "Browse for other folders"
will allow you to browse files and folders in your
file system.
75
Page 86

File Input / Output and Printing
Figure 5.6. "Save" - old GTK version
With this dialog box, you can perform the following actions:
Unix/Linux: GTK version < 2.4
This is the file save dialog of former Gimp/GNOME
versions - plus some Wireshark extensions.
1. Type in the name of the file you wish to save the captured packets in, as a standard file name in your
file system.
2. Select the directory to save the file into.
3. Select the range of the packets to be saved, see Section 5.9, “The Packet Range frame”
4. Specify the format of the saved capture file by clicking on the File type drop down box. You can choose
from the types, described in Section 5.3.2, “Output File Formats”.
The selection of capture formats may be reduced!
Some capture formats may not be available, depending on the packet types captured.
File formats can be converted!
You can convert capture files from one format to another by reading in a capture file and
writing it out using a different format.
5. Click on the Save/Ok button to accept your selected file and save to it. If Wireshark has a problem
saving the captured packets to the file you specified, it will display an error dialog box. After clicking
OK on that error dialog box, you can try again.
6. Click on the Cancel button to go back to Wireshark and not save the captured packets.
5.3.2. Output File Formats
Wireshark can save the packet data in its "native" file format (libpcap) and in the file formats of some
other protocol analyzers, so other tools can read the capture data.
76
Page 87

File Input / Output and Printing
File formats have different time stamp accuracies!
Saving from the currently used file format to a different format may reduce the time stamp
accuracy; see the Section 7.4, “Time Stamps” for details.
The following file formats can be saved by Wireshark (with the known file extensions):
• libpcap, tcpdump and various other tools using tcpdump's capture format (*.pcap,*.cap,*.dmp)
• Accellent 5Views (*.5vw)
• HP-UX's nettl (*.TRC0,*.TRC1)
• Microsoft Network Monitor - NetMon (*.cap)
• Network Associates Sniffer - DOS (*.cap,*.enc,*.trc,*fdc,*.syc)
• Network Associates Sniffer - Windows (*.cap)
• Network Instruments Observer version 9 (*.bfr)
• Novell LANalyzer (*.tr1)
• Sun snoop (*.snoop,*.cap)
• Visual Networks Visual UpTime traffic (*.*)
• ... new file formats are added from time to time
If the above tools will be more helpful than Wireshark is a different question ;-)
Third party protocol analyzers may require specific file
extensions!
Other protocol analyzers than Wireshark may require that the file has a certain file extension
in order to read the files you generate with Wireshark, e.g.:
".cap" for Network Associates Sniffer - Windows
5.4. Merging capture files
Sometimes you need to merge several capture files into one. For example this can be useful, if you have
captured simultaneously from multiple interfaces at once (e.g. using multiple instances of Wireshark).
Merging capture files can be done in three ways:
• Use the menu item "Merge" from the "File" menu, to open the merge dialog, see Section 5.4.1, “The
"Merge with Capture File" dialog box”. This menu item will be disabled, until you have loaded a capture
file.
• Use drag-and-drop to drop multiple files on the main window. Wireshark will try to merge the packets
in chronological order from the dropped files into a newly created temporary file. If you drop only a
single file, it will simply replace a (maybe) existing one.
77
Page 88

File Input / Output and Printing
• Use the mergecap tool, which is a command line tool to merge capture files. This tool provides the most
options to merge capture files, see Section D.8, “mergecap: Merging multiple capture files into one ”.
5.4.1. The "Merge with Capture File" dialog box
This dialog box let you select a file to be merged into the currently loaded file.
You will be prompted for an unsaved file first!
If your current data wasn't saved before, you will be asked to save it first, before this dialog
box is shown.
Most controls of this dialog will work the same way as described in the "Open Capture File" dialog box,
see Section 5.2.1, “The "Open Capture File" dialog box”.
Specific controls of this merge dialog are:
Prepend packets to existing file Prepend the packets from the selected file before the currently
loaded packets.
Merge packets chronologically Merge both the packets from the selected and currently loaded file
in chronological order.
Append packets to existing file Append the packets from the selected file after the currently loaded
packets.
Table 5.3. The system specific "Merge Capture File As" dialog box
Figure 5.7. "Merge" on native Windows
Figure 5.8. "Merge" - new GTK version
Microsoft Windows
This is the common Windows file open dialog - plus
some Wireshark extensions.
Unix/Linux: GTK version >= 2.4
This is the common Gimp/GNOME file open dialog
- plus some Wireshark extensions.
78
Page 89

File Input / Output and Printing
Figure 5.9. "Merge" - old GTK version
5.5. Import text file
Wireshark can read in an ASCII hex dump and write the data described into a temporary libpcap capture
file. It can read hex dumps with multiple packets in them, and build a capture file of multiple packets. It
is also capable of generating dummy Ethernet, IP and UDP, TCP, or SCTP headers, in order to build fully
processable packet dumps from hexdumps of application-level data only.
Wireshark understands a hexdump of the form generated by od -Ax -tx1 -v. In other words, each byte is
individually displayed and surrounded with a space. Each line begins with an offset describing the position
in the file. The offset is a hex number (can also be octal or decimal), of more than two hex digits. Here
is a sample dump that can be imported:
Unix/Linux: GTK version < 2.4
This is the file open dialog of former Gimp/
GNOME versions - plus some Wireshark
extensions.
000000 00 e0 1e a7 05 6f 00 10 ........
000008 5a a0 b9 12 08 00 46 00 ........
000010 03 68 00 00 00 00 0a 2e ........
000018 ee 33 0f 19 08 7f 0f 19 ........
000020 03 80 94 04 00 00 10 01 ........
000028 16 a2 0a 00 03 50 00 0c ........
000030 01 01 0f 19 03 80 11 01 ........
There is no limit on the width or number of bytes per line. Also the text dump at the end of the line is
ignored. Bytes/hex numbers can be uppercase or lowercase. Any text before the offset is ignored, including
email forwarding characters '>'. Any lines of text between the bytestring lines is ignored. The offsets are
used to track the bytes, so offsets must be correct. Any line which has only bytes without a leading offset
is ignored. An offset is recognized as being a hex number longer than two characters. Any text after the
bytes is ignored (e.g. the character dump). Any hex numbers in this text are also ignored. An offset of zero
is indicative of starting a new packet, so a single text file with a series of hexdumps can be converted into
a packet capture with multiple packets. Packets may be preceded by a timestamp. These are interpreted
according to the format given. If not the first packet is timestamped with the current time the import takes
place. Multiple packets are read in with timestamps differing by one microsecond each. In general, short of
these restrictions, Wireshark is pretty liberal about reading in hexdumps and has been tested with a variety
of mangled outputs (including being forwarded through email multiple times, with limited line wrap etc.)
There are a couple of other special features to note. Any line where the first non-whitespace character is
'#' will be ignored as a comment. Any line beginning with #TEXT2PCAP is a directive and options can be
inserted after this command to be processed by Wireshark. Currently there are no directives implemented;
in the future, these may be used to give more fine grained control on the dump and the way it should
be processed e.g. timestamps, encapsulation type etc. Wireshark also allows the user to read in dumps
of application-level data, by inserting dummy L2, L3 and L4 headers before each packet. The user can
79
Page 90

File Input / Output and Printing
elect to insert Ethernet headers, Ethernet and IP, or Ethernet, IP and UDP/TCP/SCTP headers before each
packet. This allows Wireshark or any other full-packet decoder to handle these dumps.
5.5.1. The "File import" dialog box
This dialog box lets you select a file to be imported and set import parameters.
Figure 5.10. The "File Import" dialog
Specific controls of this import dialog are split in two sections:
Input Determine which input file has to be imported and how it is to be interpreted.
Import Determine how the data is to be imported.
The input parameters are as follows:
Filename / Browse Enter the name of the text file to import. You can use Browse to browse for
a file.
Offsets Select the radix of the offsets given in the text file to import. This is usually
hexadecimal, but decimal and octal are also supported.
Date/Time Tick this checkbox if there are timestamps associated with the frames in the
text file to import you would like to use. Otherwise the current time is used
for timestamping the frames.
Format This is the format specifier used to parse the timestamps in the text file to
import. It uses a simple syntax to describe the format of the timestamps, using
%H for hours, %M for minutes, %S for seconds, etc. The straightforward
HH:MM:SS format is covered by %T. For a full definition of the syntax look
for strftime(3).
The import parameters are as follows:
80
Page 91

File Input / Output and Printing
Encapsulation type Here you can select which type of frames you are importing. This all depends
on from what type of medium the dump to import was taken. It lists all types
that Wireshark understands, so as to pass the capture file contents to the right
dissector.
Dummy header When Ethernet encapsulation is selected you have to option to prepend
dummy headers to the frames to import. These headers can provide artificial
Ethernet, IP, UDP or TCP or SCTP headers and SCTP data chunks. When
selecting a type of dummy header the applicable entries are enabled, others
are grayed out and default values are used.
Max. frame length You may not be interested in the full frames from the text file, just the first
part. Here you can define how much data from the start of the frame you
want to import. If you leave this open the maximum is set to 64000 bytes.
Once all input and import parameters are setup click OK to start the import.
You will be prompted for an unsaved file first!
If your current data wasn't saved before, you will be asked to save it first, before this dialog
box is shown.
When completed there will be a new capture file loaded with the frames imported from the text file.
5.6. File Sets
When using the "Multiple Files" option while doing a capture (see: Section 4.10, “Capture files and file
modes”), the capture data is spread over several capture files, called a file set.
As it can become tedious to work with a file set by hand, Wireshark provides some features to handle
these file sets in a convenient way.
How does Wireshark detect the files of a file set?
A filename in a file set uses the format Prefix_Number_DateTimeSuffix which might look like this:
"test_00001_20060420183910.pcap". All files of a file set share the same prefix (e.g. "test") and
suffix (e.g. ".pcap") and a varying middle part.
To find the files of a file set, Wireshark scans the directory where the currently loaded file resides
and checks for files matching the filename pattern (prefix and suffix) of the currently loaded file.
This simple mechanism usually works well, but has its drawbacks. If several file sets were captured
with the same prefix and suffix, Wireshark will detect them as a single file set. If files were renamed
or spread over several directories the mechanism will fail to find all files of a set.
The following features in the "File Set" submenu of the "File" menu are available to work with file sets
in a convenient way:
• The List Files dialog box will list the files Wireshark has recognized as being part of the current file set.
• Next File closes the current and opens the next file in the file set.
• Previous File closes the current and opens the previous file in the file set.
81
Page 92

File Input / Output and Printing
5.6.1. The "List Files" dialog box
Figure 5.11. The "List Files" dialog box
Each line contains information about a file of the file set:
• Filename the name of the file. If you click on the filename (or the radio button left to it), the current
file will be closed and the corresponding capture file will be opened.
• Created the creation time of the file
• Last Modified the last time the file was modified
• Size the size of the file
The last line will contain info about the currently used directory where all of the files in the file set can
be found.
The content of this dialog box is updated each time a capture file is opened/closed.
The Close button will, well, close the dialog box.
5.7. Exporting data
Wireshark provides several ways and formats to export packet data. This section describes general ways
to export data from Wireshark.
Note!
There are more specialized functions to export specific data, which will be described at the
appropriate places.
XXX - add detailed descriptions of the output formats and some sample output, too.
82
Page 93

File Input / Output and Printing
5.7.1. The "Export as Plain Text File" dialog box
Export packet data into a plain ASCII text file, much like the format used to print packets.
83
Page 94

File Input / Output and Printing
Figure 5.12. The "Export as Plain Text File" dialog box
• Export to file: frame chooses the file to export the packet data to.
84
Page 95

File Input / Output and Printing
• The Packet Range frame is described in Section 5.9, “The Packet Range frame”.
• The Packet Details frame is described in Section 5.10, “The Packet Format frame”.
5.7.2. The "Export as PostScript File" dialog box
Export packet data into PostScript, much like the format used to print packets.
Tip!
You can easily convert PostScript files to PDF files using ghostscript. For example: export
to a file named foo.ps and then call: ps2pdf foo.ps
85
Page 96

File Input / Output and Printing
Figure 5.13. The "Export as PostScript File" dialog box
• Export to file: frame chooses the file to export the packet data to.
86
Page 97

File Input / Output and Printing
• The Packet Range frame is described in Section 5.9, “The Packet Range frame”.
• The Packet Details frame is described in Section 5.10, “The Packet Format frame”.
5.7.3. The "Export as CSV (Comma Separated Values) File" dialog box
XXX - add screenshot
Export packet summary into CSV, used e.g. by spreadsheet programs to im-/export data.
• Export to file: frame chooses the file to export the packet data to.
• The Packet Range frame is described in Section 5.9, “The Packet Range frame”.
5.7.4. The "Export as C Arrays (packet bytes) file" dialog box
XXX - add screenshot
Export packet bytes into C arrays so you can import the stream data into your own C program.
• Export to file: frame chooses the file to export the packet data to.
• The Packet Range frame is described in Section 5.9, “The Packet Range frame”.
5.7.5. The "Export as PSML File" dialog box
Export packet data into PSML. This is an XML based format including only the packet summary. The
PSML file specification is available at: http://www.nbee.org/doku.php?id=netpdl:psml_specification.
87
Page 98

File Input / Output and Printing
Figure 5.14. The "Export as PSML File" dialog box
• Export to file: frame chooses the file to export the packet data to.
88
Page 99

File Input / Output and Printing
• The Packet Range frame is described in Section 5.9, “The Packet Range frame”.
There's no such thing as a packet details frame for PSML export, as the packet format is defined by the
PSML specification.
5.7.6. The "Export as PDML File" dialog box
Export packet data into PDML. This is an XML based format including the packet details. The PDML file
specification is available at: http://www.nbee.org/doku.php?id=netpdl:pdml_specification.
The PDML specification is not officially released and Wireshark's implementation of it is
still in an early beta state, so please expect changes in future Wireshark versions.
89
Page 100

File Input / Output and Printing
Figure 5.15. The "Export as PDML File" dialog box
• Export to file: frame chooses the file to export the packet data to.
90
 Loading...