

Page 1

SERIES 54XXA
SCALAR MEASUREMENT SYSTEMS
OPERATION MANUAL
490 JARVIS DRIVE ● MORGAN HILL, CA 95037-2809
P/N: 10410-00118
PRINTED: DECEMBER 1994
COPYRIGHT 1993 WILTRON CO.
REVISION: E
Page 2

WARRANTY
The WILTRON product(s) listed on the title page is (are) warranted against defects in
materials and workmanship for one year from the date of shipment, except for YIG-tuned
oscillators, which are warranted for two years.
WILTRON’s obligation covers repairing or replacing products which prove to be defective
during the warranty period. Buyers shall prepay transportation charges for equipment
returned to WILTRON for warranty repairs. Obligation is limited to the original purchaser.
WILTRON is not liable for conseque ntial damages.
LIMITATION OF WA RRANTY
The foregoing warranty does not apply to WILTRON connectors that have failed due to
normal wear. Also, the warranty does not apply to defects resulting from improper or
inadequate maintenance by the Buyer, unauthorized modification or misuse, or operation
outside of the environmental specifications of the product. No other warranty is expressed
or implied, and the remedies provided herein are the Buyer’s sole and exclusive remedies.
NOTICE
WILTRON Company has prepared this manual for use by WILT RON Company personnel and
customers as a guide for the proper installation, operation and maintenance of WILTRON
Company equipment and computer programs. The drawings, specifications, and information
contained herein are the property of WILTRON Company, and any unauthorized use or
disclosure of these drawings, specifications, and information is prohibited; they shall not be
reproduced, copied, or used in whole or in part as the basis for manufacture or sale of the
equipment or software programs without the prior written consent of WILTRON Company.
Page 3

TABLE
OF
CONTENTS
Tab / Section Title
1 SECTION I — GENERAL INFORMATION
Contains a general description of the WILTRON Series 54XXA S calar Measurement Systems, product identification numbers, related manuals, accessories, and options. SWR
Autotesters and detectors used with these systems are described along with precautions
for use of these accessories. S ystem specifications are lis ted and a list o f recommended
test equipment is provided.
2 SECTION II — INSTALLATION
Contains information for the initial inspection and preparation of the 54XXA system. Explains how to set the rear panel Line Voltage Module and provides information for connection to the rear panel GPIB connectors and other input/output connectors.
3 SECTION III — FRONT PANEL OPERATION
Describes the front panel controls and connectors of the 54XXA and the menus associated
with the front panel keys. Explains the measurement screen display and annotation and
describes the overall operation of the system using these controls, menus and display.
4 SECTION IV — MEASUREMENT AND CALIBRATION PROCEDURES
This section describes measurement and calibration procedures used with 54XXA Scalar
Measurement Systems. The s pecific procedures described are: se lf-test, calibration, and
procedures for transmission, return loss, power and alte rnating setup measurements.
5 SECTION V — PERFORMANCE VERIFICATION PROCEDURES
This section contains procedures for verifying the p erformance of Series 54XXA Scalar
Measurement Systems to the specifications listed in Section I.
6 APPENDICES
Contains tables that describe 54XXA Error/Warning Messages, Front Panel LED Error
Codes, and Printer Switch Settings. A Rear Panel L ayout and Connector Location Diagram and connector pinout diagrams are also included.
7 SUPPLEMENTS/OPTIONS
GPIB USER’S GUIDE — Contains information for operating the 54XXA Scalar Measurement System with the IEEE-488 General Purpose Interface Bus (GPIB). The set of GPIB
command codes for the 54XXA are described, and example programs showing use o f the
GPIB comm and cod es are i ncluded.
54XXA OM i
Page 4

Tab / Section Title
7 SUPPLEMENTS/OPTIONS (Continued)
Also included behind this tab are three application notes that contain information about test
applications and GPIB programming for 54XXA Scalar Measurement Systems:
5400A-2 Data Sheet for 54XXA Scalar Me asurement
Systems Part No. 11410-00100
AN5400A-1, Testing Microwave Amplifiers Part No. 11410-00081
AN5400A-2, Testing Microwave Mixers Part No. 11410-00082
AN5400A-3, Programming the 54XXA Systems Using
Microsoft Quic kBASIC
8 COMPONENTS
Series 560 Autotesters Operation and Maintenance Manual,Part N o. 10100-00028.
TABLE
OF
CONTENTS
Part No. 11410-00083
Microsoft QuickBASIC is a registered trademark of Microsoft Corporation.
ii 54XXA OM
Page 5

SECTION I
GENERAL INFORMATION
Table of Contents
1-1 SCOPE OF THE MANUAL . . . . . . . . . . . . . . . . . . . . . . . . 1-3
1-2 INTRODUCTION . . . . . . . . . . . . . . . . . . . . . . . . . . . . . 1-3
1-3 IDENTIFICATION NUMBER . . . . . . . . . . . . . . . . . . . . . . 1-3
1-4 DESCRIPTION OF 54XXA SYSTEM . . . . . . . . . . . . . . . . . . 1-3
1-5 REQUIRED EQUIPMENT . . . . . . . . . . . . . . . . . . . . . . . . 1-3
1-6 OPTIONS . . . . . . . . . . . . . . . . . . . . . . . . . . . . . . . . . 1-3
1-7 ACCESSORIES . . . . . . . . . . . . . . . . . . . . . . . . . . . . . . 1-4
Extender Cables . . . . . . . . . . . . . . . . . . . . . . . . . . . . . . 1-4
Adapter Cables . . . . . . . . . . . . . . . . . . . . . . . . . . . . . . 1-4
GPIB Cables . . . . . . . . . . . . . . . . . . . . . . . . . . . . . . . . 1-4
1-8 SYSTEM SPECIFICATIONS . . . . . . . . . . . . . . . . . . . . . . . 1-4
1-9 SYSTEM RF COMPONENTS . . . . . . . . . . . . . . . . . . . . . . 1-11
SWR Autotesters . . . . . . . . . . . . . . . . . . . . . . . . . . . . . 1-11
Detectors . . . . . . . . . . . . . . . . . . . . . . . . . . . . . . . . . . 1-12
1-10 PRECAUTIONS FOR USE OF SWR AUTOTESTERS
AND RF DETECTORS . . . . . . . . . . . . . . . . . . . . . . . . . . 1-13
1-11 RECOMMENDED TEST EQUIPMENT . . . . . . . . . . . . . . . . . 1-14
54XXA OM 1-1
Page 6
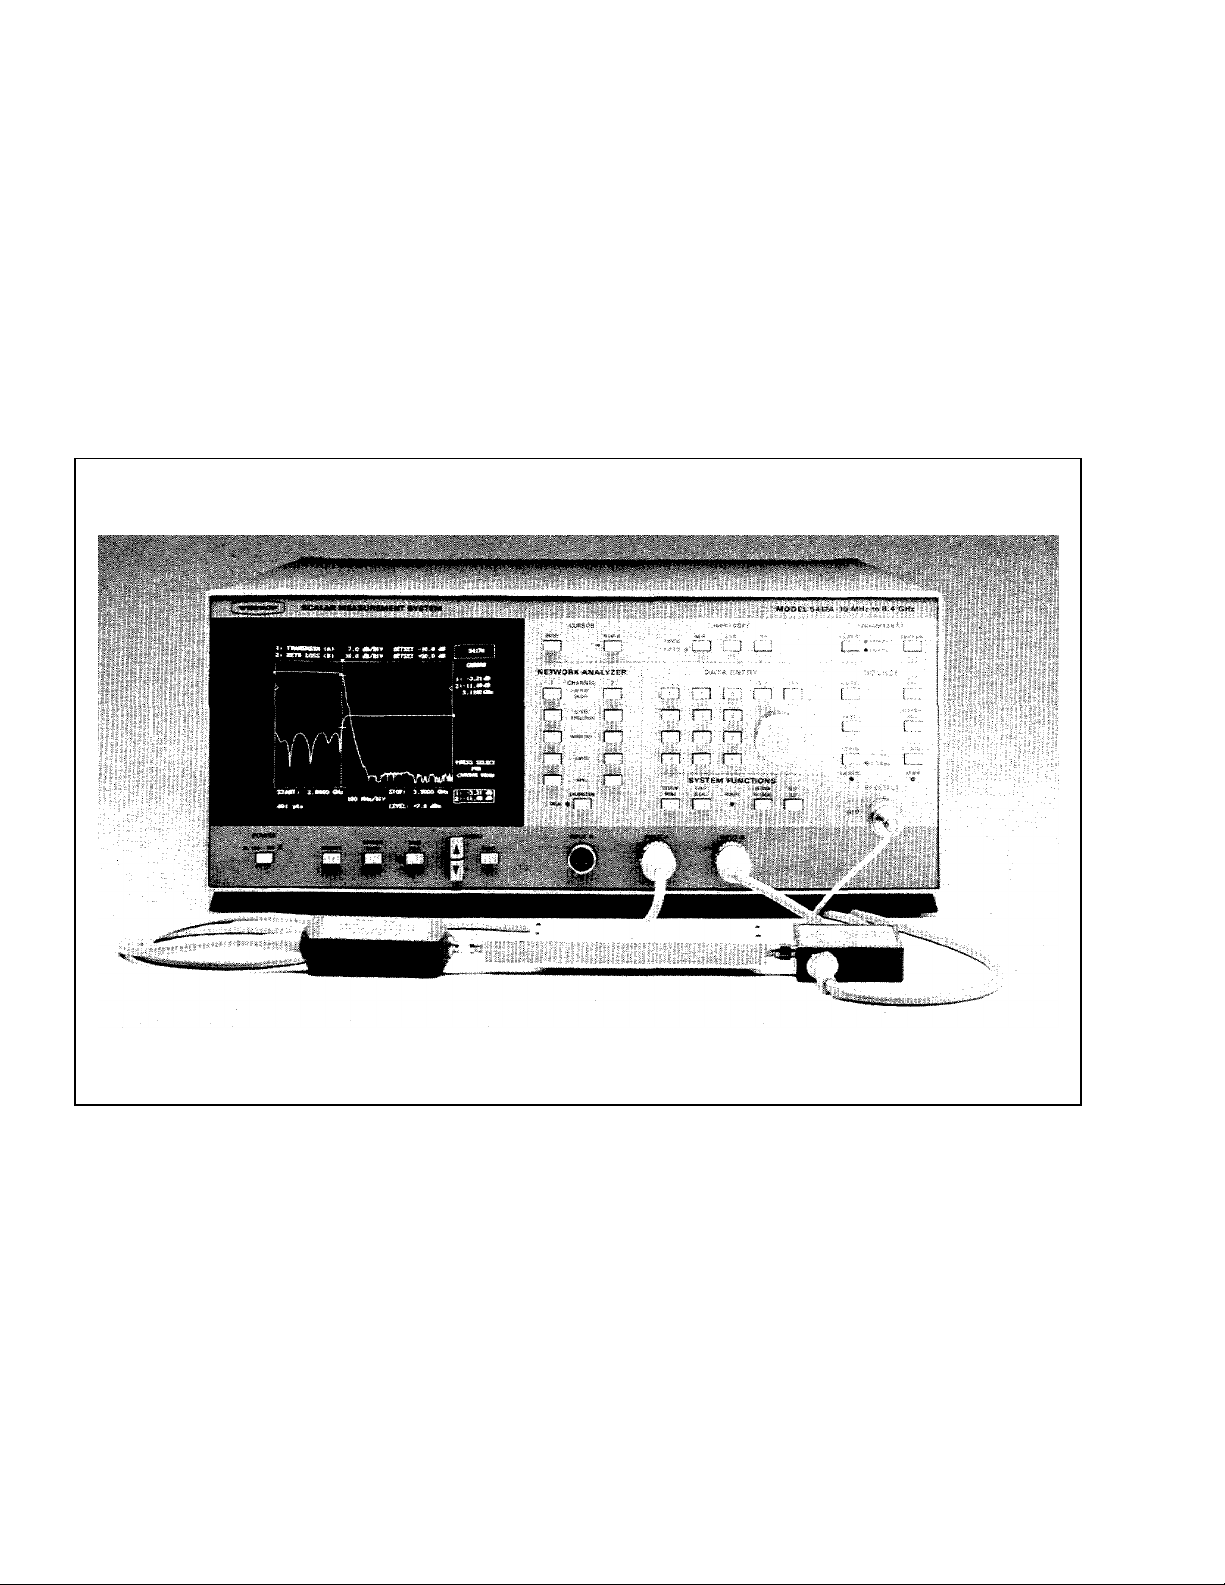
Figure 1-1. Model 5417A Scalar Measurement System with Detector and SWR Autotester (and Test Device)
1-2 54XXA OM
Page 7

SECTION I
GENERAL INFORMATION
1-1 SCOPE OF THE MANUAL
This manual provides general, installation, and operating information for the Model 54XXA Scalar Measurement System.
1-2 INTRODUCTION
Section I provides information about the 54XXA
equipment identification number, performance
specifications, and options.
1-3 IDENTIFICATION NUMBER
All WILTRON instruments are assigned a six-digit
ID number, such as “101001.” This number appears
on a decal affixed to the rear panel. Pleas e use this
identification number during any correspondence with
WILTRON Customer Service about this instrument.
1-4 DESCRIPTION OF 54XXA SYSTEM
The 54XXA is a microprocessor controlled scalar
measurement syst em. This system is used to make
scalar (magnitude) transmission, reflection, and absolute power measurements. A typical model is
shown in Figure 1-1 (facing page). All measurement
functions are selectable by using the front panel
keys and controls together wi th the display screen
menus. Section III describes this mode of operation.
All 54XXA front panel control functions (except
POWER on/off) are programmable via the I EEE–488
interface bus (GPIB). This function can be ordered
as an option on all models (refer t o paragraph 1-6).
Remote operation of the 54XXA using GPIB commands is described in the GPIB User’s Guide for the
54XXA Series Scalar Measurement Systems that is
located behind the Supplements/Options tab at the
rear of this manual.
The measurement frequency range of the 54XXA is
determined by:
The range of the internal signal source of the
•
particular model.
The external SWR Autotester and/or detector
•
used with the 54XXA.
Table 1-1. 54XXA Model F requency R anges
Model Frequency Range (GHz)
5407A 0.001 to 1.0
5409A 0.001 to 2.0
5411A 0.001 to 3.0
5417A 0.01 to 8.6
5419A 2.0 to 8.6
5428A 8.0 to 12.4
5431A 10.0 to 16.0
5430A 12.4 to 20.0
5436A 17.0 to 26.5
5437A 2.0 to 20.0
5447A 0.01 to 20.0
Table 1-1 lists the frequency ranges of all 54XXA
models. Tables 1-6 through 1-9 list the frequency
ranges for the WILTRON SWR Autotesters and detectors normally used with the 54XXA.
1-5 REQUIRED EQUIPMENT
Depending on the test to be performed, a SWR
Autotester and/or one or mo re d etecto rs ar e re quir ed
to complete the test setup; refer to Section IV —
Measurement and Calibration Procedures. These devices produce the detected signals that are processed
and displayed by the 54XXA system. WILTRON
5400 and 560 series SWR Autotesters and detectors
are listed in Tables 1-6 through 1-9.
1-6 OPTIONS
The various standard options that are available for
the model 54XXA are described below. Contact your
WILTRON representative for further information.
Rack Mount (Option 1) — Adds kit that pro-
•
vides mounting brackets and chassis track slides
for 54XXA Scalar Measurement Systems. These
track slides have 90-degree tilt capability.
54XXA OM 1-3
Page 8

ACCESSORIES I GENERAL INFORMATION
70 dB Step Attenuator (Options 2, 2A and 2B)
•
These options add an internal 70 dB attenuator
to the 54XXA signal source. Option 2 is for models
5407A, 5409A and 5411A. Option 2A is for models
with upper band edge up to 20 GHz (includes
model 5447A); Option 2B is for model 5436A only.
These attenuators are switchable in 10 dB steps
using the front panel keys and menus, or under
GPIB control (Option 3). The specifications for
these options are included in Table 1-3.
GPIB Operation (Option 3) — Adds interface
•
circuitry and rear panel connector for IEEE-488
Interface Bus (GPIB) to 54XXA. The 54XXA GPIB
controller operates with any IBM XT, AT, or PS/2
compatible computer/controller equipped with a
National Instruments GPIB-PCII/IIA interface
card and NI-488 MS-DOS Handler Software. The
procedures for installing this hardware and software in your computer is contained in Appendix B
at the rear of this manual.
Signal Source 75 Ω Output (Option 4) —-
•
Provides 75 Ω signal source output. This option
available for models 5407A, 5409A and 5411A
only.
Third Input Connector (Option 5) — Adds
•
“Reference” input connector (R) to front panel.
This option allows input signal ratios A/R and B/R
to be displayed and subsequently printed/plotted.
External Leveling (Option 6) — Adds rear
•
panel EXTERNAL LEVELING connector. The
signal applied to this input controls the RF output
of the 54XXA internal signal source. (The output
power level will be determined by the detector
type, detector location, any additional attenuation
in leveling loop, and by the OUTPUT POWER key
menu setting.)
This option allows the 54XXA RF output to be
leveled from a remote location using a directional
detector, or similar. Extender cables allow remote
measurements up to 200 feet from t he 54XXA.
1-7 ACCESSORIES
Cable accessories for the 54XXA are listed/referenced below. Part numbers and specifications for
WILTRON 5400 series and 560 series SWR
Autotesters detectors are listed in Tables 1-6
and 1-7. Part numbers and specifications for 5400
series and 560 series detectors are listed in Tables 1-8 and 1-9.
Part numbers and specifications for Open/Shorts,
Matching Pads, Terminations, RF Cables, etc. are
contained in the 5400A Series Scalar Measurement
Systems Data Sheet. A copy of this data sheet is
located behind the Supplements tab at the rear of
this manual. Contact your WILTRON representative for further information.
1-7.1 Extender Cables
Extender cables can be used between the SWR
Autotester or detector and the 54XXA. This allow s
measurements to be made up to 200 feet from the
54XXA. Cable part numbers and lengths are:
Model Cable Length
800-109 7.6m (25 f t)
800-110 15.2m (50 f t)
800-111 30.5m (100 ft)
800-112 61m (200 ft)
1-7.2 Adapter Cables
The 560-10BX Adapter cable is used to simulate a
RF detector and to connect to a calibration dc source
during the Performance/Verification and calibration
procedures for the 54XXA. The 560-10BX-1 Adapter
cable is used to connect the 54XXA to suitable
waveguide detectors or other detectors having SMA
female output connectors. The cable length is 1.2m
(4 ft). Cable part numbers are:
Model Connector
560-10BX BNC Male
560-10BX-1 SMA Male
1-7.3 GPIB Cables
GPIB cables are used to interconnect the 54XXA
with an external computer/controller, a plotter, or
other instruments on the GPIB. The part numbers
for standard cable lengths are:
Model Cable Length
2100-1 1 m (3.3 ft)
2100-2 2 m (6.6 ft)
2100-4 4 m (13.2 ft)
2100-5 0.5m (1.65 ft)
1-8 SYSTEM SPECIFICATIONS
Specifications for the 54XXA Scalar Measurement
System models are listed in Tables 1-2 through 1-5.
1-4 54XXA OM
Page 9

I GENERAL INFORMATION SPECIFICATIONS
Table 1-2. System Specifications (1 of 3)
MEASUREMENTS
Function: The 5400 Series measures swept freq-
uency transmission, reflection and power characteristics of microwave devices usin g a built-in microwave source along with external detectors and/or
SWR Autotesters.
Measurement Modes: Transmission (dB), Return
Loss (dB), SWR (linear SWR), and Power (dBm).
Frequency Range: Eleven mo dels cover the range
1.0 MHz to 26.5 GHz, determined by range of the
signal source of the particular model (T able 1-5). Measurement range also determined by WILTRON 5400 Series or 560 Series SWR Autotester and/or Detector used
with Analyzer portion of unit.
ANALYZER
Inputs: Two inputs standard ( A and B); th ir d inpu t ( R )
is optional. Inputs accept dete cted outputs from WILTRON 5400 Series or 560 Series SWR Aut otesters and
Detectors. Third input adds A/R and B/R input ratio
capability. Measurements can be made in waveguide
using suitable waveguide detectors and a WILTRON
560-10BX-1 Adapter Cable.
Dynamic Range: 71 dB (–55 dBm to +16 dBm) for all
channels, usable to –60 dBm.
Data Correction: System residuals, including the average of open an d short reflec tions, are st ored during
calibration and automatically subtracted from test data.
Calibration: During the calibration sequence, the
number of data points used for each trace are stored
with 0.002 dB resolution over any user-selected frequency range. Calibration data are automatically interpolate d for rang es less than the original normalized range.
Trace Memory: For both channe ls: the data for any
measuremen t trace, or high/low ac tive limit line, may
be stored to active trace memory. This memory data
may be rec alled later fo r viewing or outp ut or may be
subtracted from any subsequent measurement.
Save/Recall: Ni ne fro nt- pane l se tups can be store d fo r
later recall; four of these may include calibration data.
Stored setups may be di splayed/pri nted before selection. Four sets of trace memory data
can also be stored. This data can be recalled to active
trace memory to be viewed, etc (see above).
for each chan nel
Analyzer Accu racy Summary: Refer to Tables 1-3
and 1-4.
DISPLAY
Display Channels: Select and display one or any two
signals from A, or B inputs, or (optional) R input. These
signals can also be displa yed as r atios of A/R o r B/R.
Alternate Sweep: Displays alternate sweeps between the cur rent frequency sweep and an alter nate
sweep.
Display Resol ution:
Horizontal: 51, 101, 201, or 401 p oint s per trace ov er
the selected frequency range.
Vertical: 0.02 5 dB
Trace Update Time: Varies with frequency range, av-
eraging/smoothing settings, and number of data points
selected. Typically <130 m s for 101 data p oints.
Smoothing: Selectable in five steps (and off ); uses
analog techniques to reduce noise on low-level traces.
Trace update time is automatically adjusted for any
combination of averaging and smoothing. Each channel may be set inde pendentl y.
Averaging: 2, 4, 8, 16, 32 , 64, 128, or 256 succ essi ve
traces can be averaged to smooth the trace display.
Each chann el may be se t inde pendentl y.
Scaling:
Resolution: 0.1 dB to 10 dB per division in 0.1 dB
steps with independent control for each channel. SWR:
0.01 to 10 per division.
Offset Range: –99 dB to +99 dB in 0.1 dB steps. For
SWR: 1.00 to 60.00.
Autoscale: Automatically select s offset a nd res ol utio n
to provide optimum display of test data.
Limit Lines: Two lines, either straight or complex, for
each trace. Complex lines may include up to 10 segments. Meas urement data ca n be c ompared with li mit
lines for Pass/Fail testing.
Graticule: Ten vertical divisions. Horizontal divisions
are set auto matically in frequency incr ements with a 1,
2, 5 sequen ce. The graticule On/Off control turns all
graticule li nes off (tick marks rem ain on each axis to
indicate scale ma rkings).
Display/Graticule Intensity: Menu selectable in ten
steps from off to bright. Graticule intensity may be set
independently.
54XXA OM 1-5
Page 10

SPECIFICATIONS I GENERAL INFORMATION
Table 1-2. System Specifications (2 of 3)
MARKERS AND CURSORS
Markers: Up to eight individually co ntrolled markers,
can be placed on the display. Amplitude readout of both
traces at each marker is displayed in dB, dBm, or
SWR. Frequency resolution of markers is 10 kHz for
models 5407A , 5409A and 5411A and 100 kHz for all
other models.
Cursor: Position is selectable via tuning knob. The
frequency and am plitude of the test data at the c ursor
is displayed for both traces when cursor in on.
Relative Cursor: Displays the frequency and amplitude difference b etween the Main Cursor and R eference Cursor for both traces. A menu selection reverses
the position of the two cursors.
Cursor Min/Max: Moves the cursor to the mi nimum
or maximum point on the trace as selected.
Cursor “X” dB: Moves cursor to “X” dB value on the
selected trace.
Cursor “X” dB Bandwidth: Moves both mai n Cursor
and Reference Cursors to the first “X” dB value to the left
and to the right of th e init ial ref ere nce po sition .
Cursor Next Marker: Moves cursor directly to next
highest frequency marker.
Source
Frequency Ran ge : 1. 0 MHz t o 26 .5 GHz i n ten mo d-
els.
Start-Stop: Sweeps upward from Start Frequency to
Stop Frequency. Start frequency must be less than
stop frequency.
Center-Wid th: Sweeps frequency upward from
CENTER – (WIDTH/2) to CENTER + (WIDTH/2).
Alternate Sweep: Sweeps alternately between
frequency ranges set differently for Channels 1 and 2.
CW: Source output is a single frequency (f = Start
Frequency) when both display channels are tur ned off.
Start Frequency Accuracy: ±100 kHz for models
5407A, 5409A and 5411A and ±200 kHz for all other
models.
Output Power: Depends on model, see Table 1-5.
Power Level Control, Internally Leveled: Front
panel control adjusts power over a 10 dB range (stand-
ard) or from –70.0 dBm to maximum leveled power
when Option 2, 2A, or Option 2B 70 dB Step
Attenuator is ins talled (para graph 1 -6).
External Leveling (Option 6): When used with
external microwave detector, source output power is
maintained at constant level by detector output signal
(refer to paragraph 1-6). Detector connects to rear
panel EXTERNAL LEVELI NG connector and must provide a positive or negative polarity detected signal of
30 to 200 mV.
Power Level Control With External Leveling
(Option 6): F ront panel co ntrol adju sts power ov er a
10 dB range deter mined by externa l leveling detector
output.
Attenuator: Optional 70 dB Step Attenuator with
10 dB steps: Option 2 (models 5407A, 5409A and
5411A), 2A (models wi th upper band ed ge ≤20 GHz),
or 2B (model 5436A).
Markers: The num erical ampl itude of th e test dat a and
frequency are displayed for both channels. The frequency is continuously variable with the keypad or
tuning knob over the entire instrument frequency
range. Markers remain fixed at the set frequency, independent of sweep frequency range.
Horizontal Output: Rear panel BNC connector,
0 to +10V ramp coincident with sweep in all sweep
modes.
Output Connector Type: All models except 5436A
equipped with type N female connector, with 50Ω output standard. Option 4 provides 75Ω output for models
5407A, 5409A, and 5411A. Model 5436A equipped w ith
type K female connector.
Reverse Power Protection: Models 5407A, 5409A,
5411A, and 5447A prot ecte d fo r up to 1 Watt of reverse
RF power, 1 MHz to 2.0 GHz.
Source Accu racy S umm ary: R efer to Table 1-5.
APPLICATION FUNCTIONS
Built-in Applications Functions: Automatic measure-
ment sequences: Gain/Gain Compression Tests (for
amplifiers and other active devices), Bandwidth Measurement (for filters, etc.), Maximum/Minimum Peak
Hold and other trace value search functions.
PRINTER/PLOTTER
Printer: The parallel printer interface is compatible
with most d ot-matri x printer s, includ ing Epson F X, HP
Thinkjet and similar printers. Hard copy output in
graphical or tabular format can be selected. Selections
include graphics with/without measurement data, test
data tabulated for 26, 51, 101, 201, or 401 points,
measurement data at marker parameters only, or
stored setup parameters. C omplex limit lines may also
be printed.
1-6 54XXA OM
Page 11

I GENERAL INFORMATION SPECIFICATIONS
Table 1-2. System Specifications (3 of 3)
Plotter: With GPIB option installed, the 54XXA is compatible with HP Models 7440A, 7470A, and 7475A Plotters. Displa y traces, ma rkers, curs or, and graticule information are plotte d. Whe n overlay traces are d esired,
data traces only can be plotted. Plot size can be defined by user.
Internal Print/Plot Bu ffers: Formattin g and output to
print buffer requires approximately 2 – 3 seconds. Formatting and output to plot buffer requires approximately
ten seconds (401 points). Testing can be resumed
while buffered data is being prin ted/plot ted.
GPIB
Remote operation via the IEEE–488 interface is optional for all models (Option 3). All front panel controls,
except power on/off, are GPIB controllable with this
option. The GPI B interface is config urable for control
of 54XXA or for control of GPIB plotter by 54XXA.
Data Transfer: Wit h GPIB opti on installe d, the 54XXA
is capable of providing high speed transfer of test data
and normalization data to and from an external computer or other GPIB controller.
INPUT/OUTPUT CONNECTIONS
RF Output Connector: Output of internal signal
source. All models have front panel type N female
connector (except 5436A, which has type K female).
External Monitor: Connects internal measurement
display information to external VGA type monitor. The
color (mode) display is coordinate so that the color of
each data readout item in the display matches the color
of the associated measurement trace. Rear panel
15 pin D type connec tor prov ided.
Input A and In put B: Connects detected outputs from
WIL TRON 5400 Series or 560 Series SWR Autotest ers
and Detectors to intern al selectio n, measur ement and
display circuits. Front panel multi-pin connectors. Option 05 adds third “reference” input (R). The operation
and function of this input is identical to the A and B
inputs.
Input R (Option 5 only): Same as inputs A and B, but
may be used as reference channel for A/R or B/R ratio
measurements.
Parallel Printer (Interface): Connects 54XXA to
external Centronics compatible printer. Rear panel
connector.
Horizontal Output: Provides 0–10V Sweep Ramp
signal. Rear pa nel BNC typ e connecto r.
GPIB IEEE 488 (Option 3 only): Connects exter nal
computer o r GPIB con troller to 54XXA GPIB function.
Also provides connection to external plotter. Rear
panel GPIB int erface connec tor.
External ALC Input (Option 6 only ): Connects external detector signal to internal RF source output leveling
circuits. Rear panel BNC type connector. External
signal requirements: positive or negative polarity
signal, 30 – 200 mV.
GENERAL
Non Volatile Memory: Retains front panel control set-
tings in memor y for up to 10 year s. Whenev er 54XXA
is turned on , control setting are set to the same functions and values that were in effect when power was
removed. (For se curity applications, this feature may
be disabled by moving backup battery jumper; contact
your WILTRON Sales Office for de tails.)
Self Test: Performs a self test every time power is
applied, or when SELF TEST pushbutton is pressed. If
and error is detected, a diagno stic code appears that
identifies th e cause and lo cation of the er ror.
Temperature Range:
Operating: 0°C to +50°C (+32° F to +122°F)
Storage: –4 0°C to +70°C (–40°F to +158°F)
Power:
115 Vac setting: 90 to 132 Vrms, 48–63 Hz,
200 VA maximum
230 Vac setting: 180 to 265 Vrms, 48–63 Hz,
200 VA maximum
Dimensions :
177 H x 432 W x 476 D mm (+ 10 mm with feet)
7 H x 17 W x 18-3/4 D in. (+ 3/8 in. with feet)
54XXA OM 1-7
Page 12
Frequency Response
(+/- dB)
1000
2000
Frequency (MHz)
50 Ohm
1
75 Ohm
3000
50 & 75 Ohm
0.6
0.5
0.4
0.3
0.2
0.1
0
SPECIFICATIONS I GENERAL INFORMATION
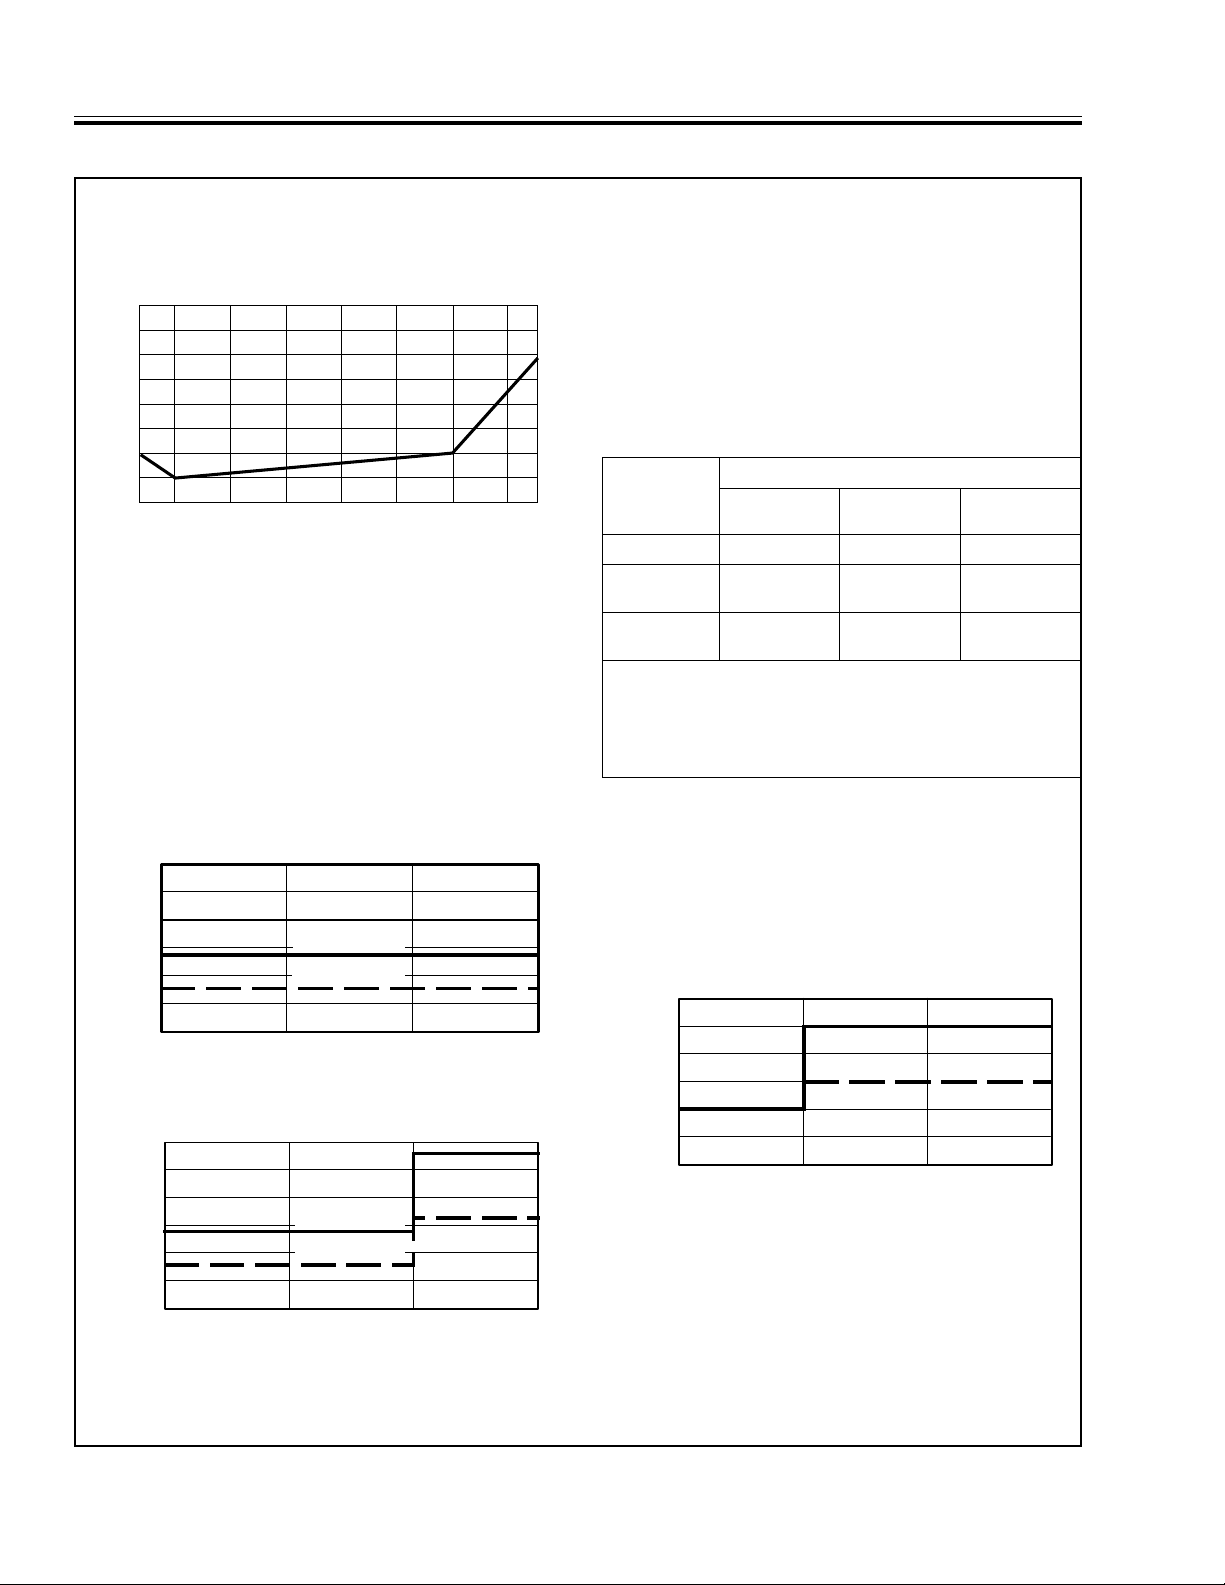
Table 1-3. Analyzer Accuracy Specificati ons Using 5400 Series System Componen ts
ANALYZER ACCURACY SUMMARY
USING 5400 SERIES COMPONENTS:
Channel Accuracy (25°)
1.6
1.4
1.2
1.0
0.8
0.6
Accuracy (+/- dB)
0.4
0.2
0.0
+16 +10 0 -10 -20 -30 -40 -50 -55
Input Power (dBm)
Transmission Loss or Gain Accuracy: Uncertainties
from frequ ency re spon se of comp onen ts a re au toma tically subtracted from test data during the calibration
procedure. Ove rall accur acy is then:
Transmission
Loss or Gain
Accuracy
∗
Effects of si gnal so urce, te st dev ice, SW R Aut otest er and d etec-
tor mismatch can be significant.
Channel Mismatch
=
Accuracy Uncertainty*
+
Overall Coaxial Return Loss Measurement
Accuracy: Uncertainties resulting from SWR
Autotester a nd signal sou rce frequenc y response an d
from system open and short characteristics are automatically subtracted from test data. Overall accuracy is
then:
Return Loss Channel SWR Autotester
Accuracy Accuracy Accuracy
SWR Autotester Accuracy
Model
5400–6B75
5400–6N50
5400–6NF50
5400–6N75
5400–6NF75
† SWR Autotester Directivity and Frequency Sen sitivity specifications
are shown in Tables 1-6.
‡ Accuracy includes the effects of directivity (fir st term) and te st port
reflection (s econd term ) over the fr equen cy range (ρ is the measured
reflection coefficient.)
=
Accuracy of Measured Reflection Co efficient (ρ)
1 MHz to
1000 MHz
0.010 ± 0.10
0.010 ± 0.05
0.010 ± 0.05
0.010 ± 0.05
0.010 ± 0.05
ρ
ρ
ρ
ρ
ρ
+
†
(5400 Seri es):
1 MHz to
2000 MHz
2
2
2
2
2
N/A N/A
0.010 ± 0.05
0.010 ± 0.05
0.010 ± 0.05
0.010 ± 0.05
2
ρ
2
ρ
2
ρ
2
ρ
1 MHz to
3000 MHz
0.010 ± 0.05
0.010 ± 0.05
0.010 ± 0.08
0.010 ± 0.08
‡
2
ρ
2
ρ
2
ρ
2
ρ
Mismatch U ncert ainty ( 50Ω Components)**:
0.75
0.50
15 dB Return Loss
0.25
Uncertainty Caused
by Mismatch (+/- dB)
Transmissiom Measurement
0
1
20 dB Return Loss
1000 2000 3000
Frequency (MHz)
Power Measurement Accuracy:
Absolute
Power
Accuracy Response
=
Channel
Accuracy
Detector Frequency Response# (5400 Series):
Frequency
+
Detector
Mismatch U ncert ainty ( 75Ω Components)**:
0.75
0.50
15 dB Return Loss
0.25
Uncertainty Caused
by Mismatch (+/- dB)
0
Transmissiom Measurement
1
∗∗
Based on wo rst-ca se ana lysis o f unce rtaint ies du e to re turn
loss of the detector, SWR Autotester, N-type connecting cables,
and the retu rn lo ss of th e meas ured reflect ion.
20 dB Return Loss
1000 2000 3000
Frequency (MHz)
#Refer to paragraph 1-9.2 and Table 1-8 for further specifica-
tions for 5400 series detectors.
1-8 54XXA OM
Page 13
4
3
2
1
0
12.4 18.5
26.5
Frequency (GHz)
0.0 2.0
8.0
Frequency Response
(+/- dB)
Maximum Variation
I GENERAL INFORMATION SPECIFICATIONS
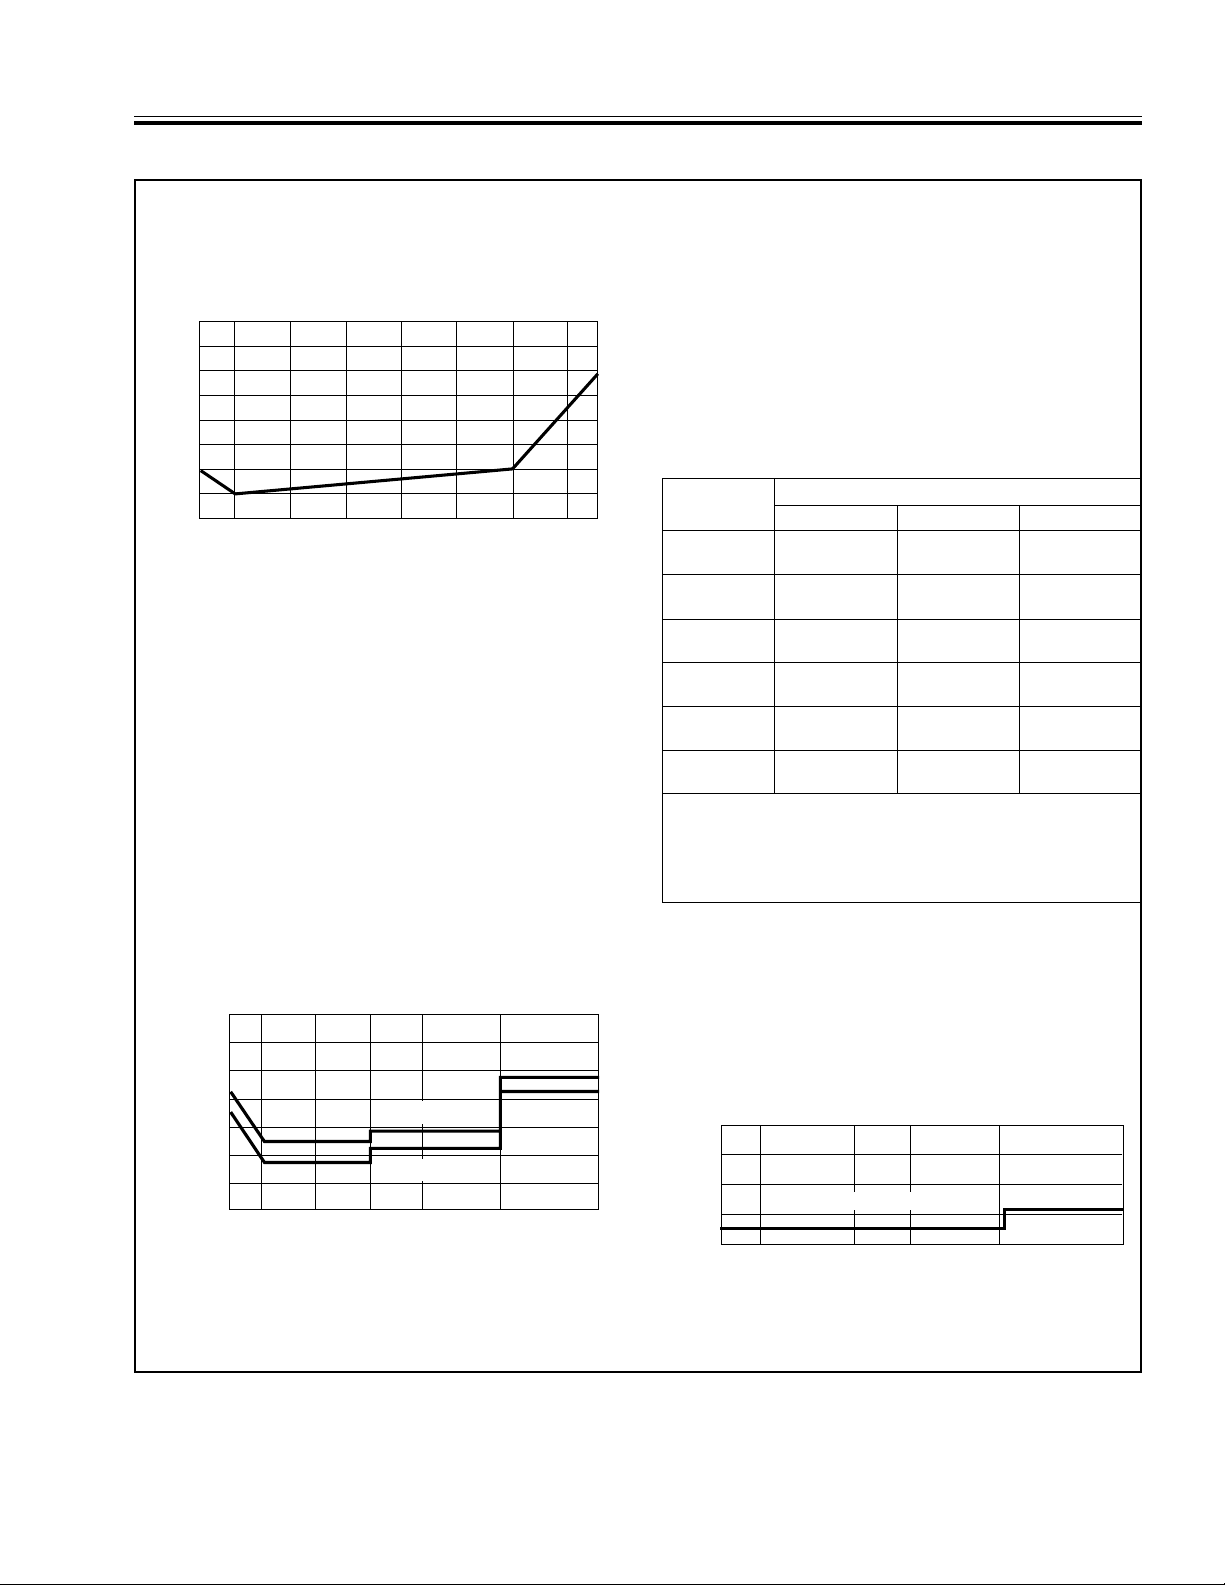
Table 1-4. Analyzer Accuracy Specificati ons Using 562 Series System Components
ANALYZER ACCURACY SUMMARY
USING 560 SERIES COMPONENTS:
Channel Accuracy (25°)
1.6
1.4
1.2
1.0
0.8
0.6
Accuracy (+/- dB)
0.4
0.2
0.0
+16 +10 0 -10 -20 -30 -40 -50 -55
Input Power (dBm)
Transmission Loss or Gain Accuracy: Uncertainties
from frequ ency re spon se of comp onen ts a re au toma tically subtracted from test data during the calibration
procedure.
Overall accuracy is then:
Transmission
Loss or Gain
Accuracy
∗
Effects of si gnal so urce, te st dev ice, SW R Aut otest er and d etec-
tor mismatch can be significant. This m ismatch uncertainty
is minimized by WILTRON’s exceptionally low reflection characteristics o f the signa l sourc e, det ector, and SWR Autote ster.
Channel Mismatch
=
Accuracy Uncertainty*
+
Overall Coaxial Return Loss Measurement
Accuracy: Uncertainties resulting from SWR
Autotester a nd signal sou rce frequenc y response an d
from system open and short characteristics are automatically subtracted from test data.
Overall accuracy is then:
Return Loss Channel SWR Autotester
Accuracy Accuracy Accuracy
SWR Autotester Accuracy
Model
560–97A50
560–97A50–1
560–97N50
560–97N50–1
560–97NF50
560–97NF50–1
560–98S50
560–98S50–1
560–98SF50
560–98SF50–1
560–98K50
560–98K50-1
† SWR Autotester Directivity and Frequency Sen sitivity specifications
are shown in Table 1-7.
‡ Accuracy includes the effects of directivity (fir st term) and te st port
reflection (s econd term ) over the fr equen cy range (ρ is the measured
reflection coefficient.)
=
Accuracy of Measured Reflection Coefficient (ρ)
10 MHz–8 GHz 8–18 GHz 18–26.5 GHz
0.016 ± 0.06
0.010 ± 0.06
0.018 ± 0.08
0.013 ± 0.08
0.018 ± 0.12
0.013 ± 0.12
0.014 ± 0.10
0.010 ± 0.10
0.014 ± 0.10
0.010 ± 0.10
0.018 ± 0.15
ρ
ρ
ρ
ρ
ρ
ρ
ρ
ρ
ρ
ρ
ρ
†
(560 Series):
2
0.016 ± 0.10
2
0.010 ± 0.10
2
0.018 ± 0.12
2
0.013 ±
2
0.018 ± 0.12
2
0.013 ± 0.12
2
0.014 ± 0.10
2
0.010 ± 0.10
2
0.014 ± 0.10
2
0.010 ± 0.10
2
0.018 ± 0.15
+
0.12
2
ρ
2
ρ
2
ρ
2
ρ
2
ρ
2
ρ
2
ρ
2
ρ
2
ρ
2
ρ
2
ρ
N/A
N/A
N/A
0.016 ± 0.12
0.013 ±
0.12
0.016 ± 0.12
0.013 ±
0.12
0.025 ± 0.15
‡
2
ρ
2
ρ
2
ρ
2
ρ
2
ρ
Mismatch Uncertainty (Typical – with 560 Series
Components)**:
1.4
1.2
1.0
0.8
0.6
0.4
Uncertainty Caused
by Mismatch (+/- dB)
0.2
Transmission Measurement
0
.01 .04 4
∗∗
Based on wo rst-ca se ana lysis o f unce rtaint ies du e to re turn
loss of the detector, SWR Autotester, N-type connecting cables,
and the retu rn lo ss of th e meas ured reflect ion.
15 dB Return Loss
20 dB Return Loss
8 12.4
Frequency (GHz)
18.5
26.5
Power Measurement Accuracy:
Absolute
Power
Accuracy Response
=
Channel
Accuracy
Frequency
+
Detector
Detector Frequency Response# (560 Series):
#Refer to paragraph 1-9.2 and Table 1-9 for further specifica-
tions for 560 series detectors.
54XXA OM 1-9
Page 14
Frequency Error (+/- MHz )
2.0
1.8
1.6
1.4
1.2
1.0
0.8
0.6
0.4
0.2
0.0
50%
0% 100%
Stop
Start
Percentage of Sweep
25% 75%
≤
40 MHz Sweep Width
≤
100 MHz Sweep Width
≤
1 GHz Sweep Width
SIGNAL SOURCE SPECIFICATIONS I GENERAL INFORMATION
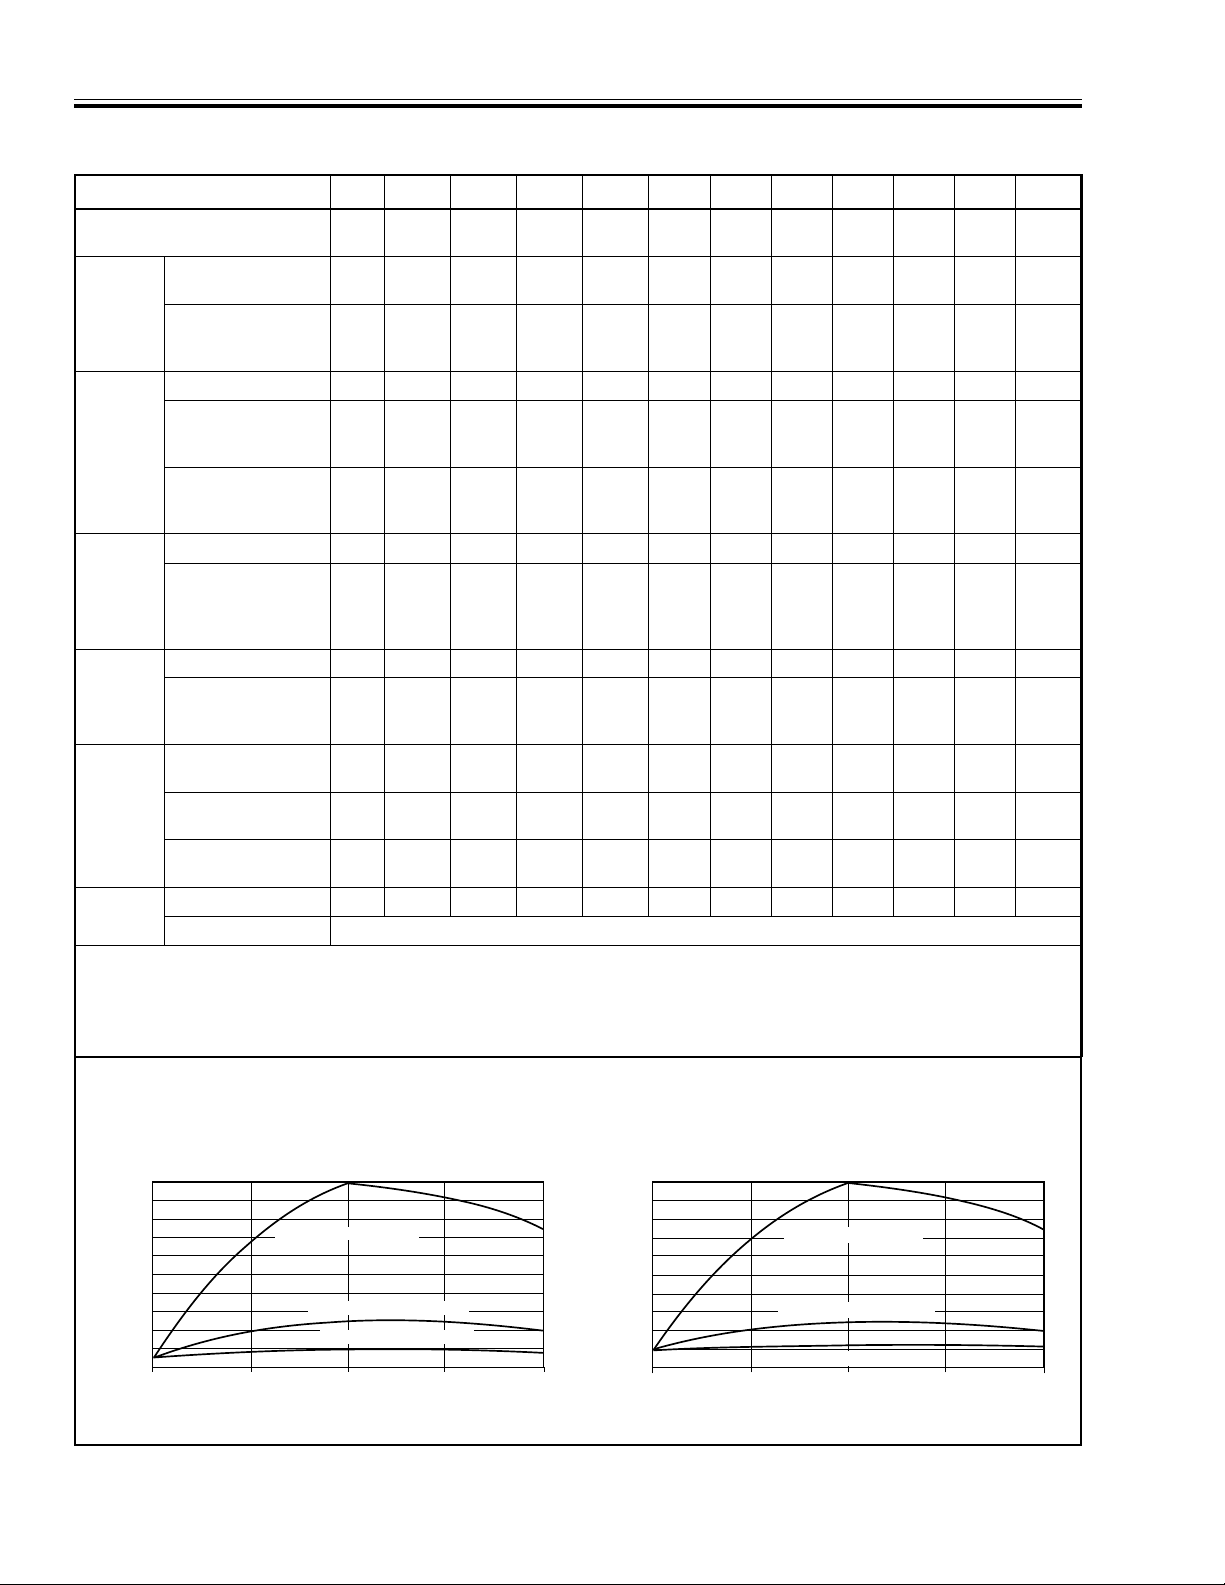
Table 1-5. 54XXA Signal Source Specifications
MODEL/SPECIFICATION
Frequency Range GHz
Internally Leveled,
Output
Power
(@25°)
Maximum
With Option 2, 2A
or 2B; 70 dB
step Attenuator
With Leveled Power dB
With Option 2, 2A
Power
Level
Accuracy
or 2B; 70 dB step
Attenuator
Step Attenuator,
Accuracy between
➁
steps
With Frequency dB
Leveled
Power
Variation
With Frequency;
With Option 2A or
2B; 70 dB
step Attenuator
With Leveled Power SWR
Source
SWR
With Leveled
Power; 70 dB step
Attenuator
Harmonics dBc <–40
Signal Pu-
rity
Non-Harmonics dBc <–60 <–60 <–60
Residual FM
Frequency
Accuracy
CW Mode kHz
Sweep Accuracy See Sweep Error Chart Below
➀ At maximum specified output power with 560 Series or 5400 Series
SWR Autotester connected directly to the RF Output Connector.
➁ 10 dB per step
➂ For Option 4, 75
➃ For Option 4, 75
Ω
Ω
➀
Units 5407A 5409A 5411A 5417A 5419A 5428A 5431A 5430A 5436A 5437A 5447A
dB
dB +10
➁
Add
➁
dB
dB
dB
➁
➁
➄
output, subtra ct 2.0 dB.
output, add 0. 2 dB
SWR <1.5 <1.5 <1.5 <1.5 <1.5 <1.5 <1.5 <1.5 <2 .0 <1.8 1.8
kHz
peak
0.001
to 1.0
+12➂+12
±1.0
±1.0
0.001
to 2.0
➂
+10➂+10
➃
±1.0➃±1.0
④
±1.0➃±1.5
0.001
to 3.0
➂
+12
0.01
to 8.6
➂
+10 +10 +10 +10 +10 +7 +10 +10
➂
+7 +7 +7 +7 +7 +4 +7 +7
➃
±1.0 ±1.0 ±1.0 ±1.0 ±1.0 ±1.0 ±1.0 ±1.0
➃
±1.5 ±1.5 ±1.5 ±1.5 ±1.5 ±3.0 ±1.9 ±1.9
2.0
to 8.6
8.0
to 12.4
10.0
to 16.0
12.4
to 20.0
17.0
to 26.5
to 20.0
2.0
to 20.0
±0.4 ±0.4 ±0.4 ±0.4 ±0.4 ±0.4 ±0.5 ±0.4 ±0.7 ±0.4 ±0.5
±0.3
±1.0
➃
±0.4➃±0.6
④
±1.1④±1.3
➃
±0.5 ±0.4 ±0.4 ±0.4 ±0.5 ±1.0 ±0.5 ±0.75
④
±1.0 ±0.9 ±0.9 ±0.9 ±1.0 ±2.5 ±1.0 ±1.0
<1.5 <1.5 <1.5 <1.5 <1.5 <1.5 <1.5 <1.5 <1.7 <1.5 <1.5
➇
<–40➇<–40
<–40
➇
<–50
<–50
<–60
<–50 <–50 <–50 <–50 <–50 <–60
➆
➅
<–60 <–60 <–60 <–60 <–60 <–60
➆
<–40
<–60
<–50
<–60
➅
<10 <10 <10 <7 <7 <10 <10 <10 <30 <1 0 <1 0
➈
±100
±100➈±100➈±200 ±200 ±200 ±200 ±200 ±200 ±200 ±200
➄ Measured in 30 Hz to 15 kHz post-detection bandwidth.
➅ ≤
2 GHz
➆ >
2 GHz
➇ <–35 dBc for Option 4 , 75
➈ ±
200 kHz for frequencies below 10 MHz (±100 kHz typical)
Ω
output
0.01
➅
➆
➅
➆
Frequency Error With Sweep Width (in Swept Frequency Mode):
Models 5407A, 5409A, 5411A: Models 5417A Through 5447A:
2.0
1.8
1.6
1.4
1.2
1.0
0.8
0.6
0.4
0.2
Frequency Error (+/- MHz)
0.0
≤
25% 75%
1 GHz Sweep Width
≤
100 MHz Sweep Wid th
≤
40 MHz Sweep Width
50%0%
Percentage of Sweep
100%
StopStart
1-10 54XXA OM
Page 15
SYSTEM RF COMPONENTS I GENERAL INFORMATION
1-1 SYSTEM RF COMPONENTS
1-1.1 SWR Autotesters
WILTRON SWR Autotesters integrate in one small package a broadband, high directivity bridge, a detector, a low
reflection test port connector, a reference termination, and
a connecting cable. The output of the SWR Autotester is a
detected signal, varying in prop ortion to reflections from
the test device connected to the test port. Optional
extender cables can be used with these units without
degradation in performance. Th e pr e ca u ti o ns fo r us i ng
these component are described in paragraph 1-10.
a. 5400 Series Autotesters (Specifications)
The SWR autotesters in this series operate from 1.0
MHz to 3.0 MHz (Table 1-6).
Accuracy: See accuracy chart on page 1-8.
Maximum Input Power: 500 mW
Table 1-6.5400 Series SWR Autotesters
Model Frequency
Range
(MHz)
5400–6B75 1 to 1000
5400–6N50
1 to 3000
Directivity
(dB)
40
40
5400–6NF50
5400–6N75
1 to 3000
40
5400–6NF75
Cable Length: 122 cm (4 ft)
Insertion Loss: 7.0 dB nominal from input port to
test port.
Weight:5400- 6B75: 200g (7 oz.)
5400–6NXX Series: 255g (9 oz.)
b. 560 Series Autotesters (Specifications)
The SWR autotesters in this series operate from 10
MHz to 26.5 GHz (Table 1-7). The performance verification procedures for these SWR Autotesters are
contained in the Series 560 Autotesters Operation
and Maintenance Manual (P/N 10100-00028).
Accuracy: See accuracy chart on page 1-9.
Maximum Input Power: 500 mW
Cable Length: 122 cm (4 ft)
Insertion Loss: 6.5 dB nominal from input port to
test port.
Weight:560-97XXXX Series: 340g ( 12 oz.)
560-98XXXX Series: 198g (7 o z.)
Frequency
Sensitivity
(dB, max)
±1.0
±1.0
Impedance
(Ohms)
75
50
Test Port
Connector
BNC Male
N Male
N Female
±1.0
75
N Male
N Female
Input
Connector
N Female
N Female
N Female
Table 1-7.560 Series SWR Autotesters
Model Frequency
560-97A50
560-97A50-1
560-97N50
560-97N50-1
560-97NF50
560-97NF50-1
560-98S50
560-98SF50
560-98S50-1
560-98SF50-1
560-98K50
560-98KF50
Range
(GHz)
0.01-18
0.01-18
0.01-18
0.01-26.5
0.01-26.5
0.01-26.5*
Directivity
(dB)
36
40
35
38
35 (<18 GHz)
38 (≥18 GHz)
37 (<18 GHz)
36 (≥18 GHz)
40 (<18 GHz)
38 (≥18 GHz)
35 (<18 GHz)
32 (≥18 GHz)
Frequency
Sensitivity
(dB, max)
±
1.2
±
1.5
±1.5
±2
±2
±3
Impedance
(Ohms)
50 GPC-7 N Female
50 N Male N F emale
50 N Female N Female
50
50
50
Test Port
Connector
WSMA Male
WSMA Female
WSMA Male
WSMA Female
K Male
K Female
Input
Connector
Ruggedized
K Female
Ruggedized
K Female
Ruggedized
K Female
∗Operation to 40 GHz with WILTRON Model 562.
1-11 54XXA OM
Page 16
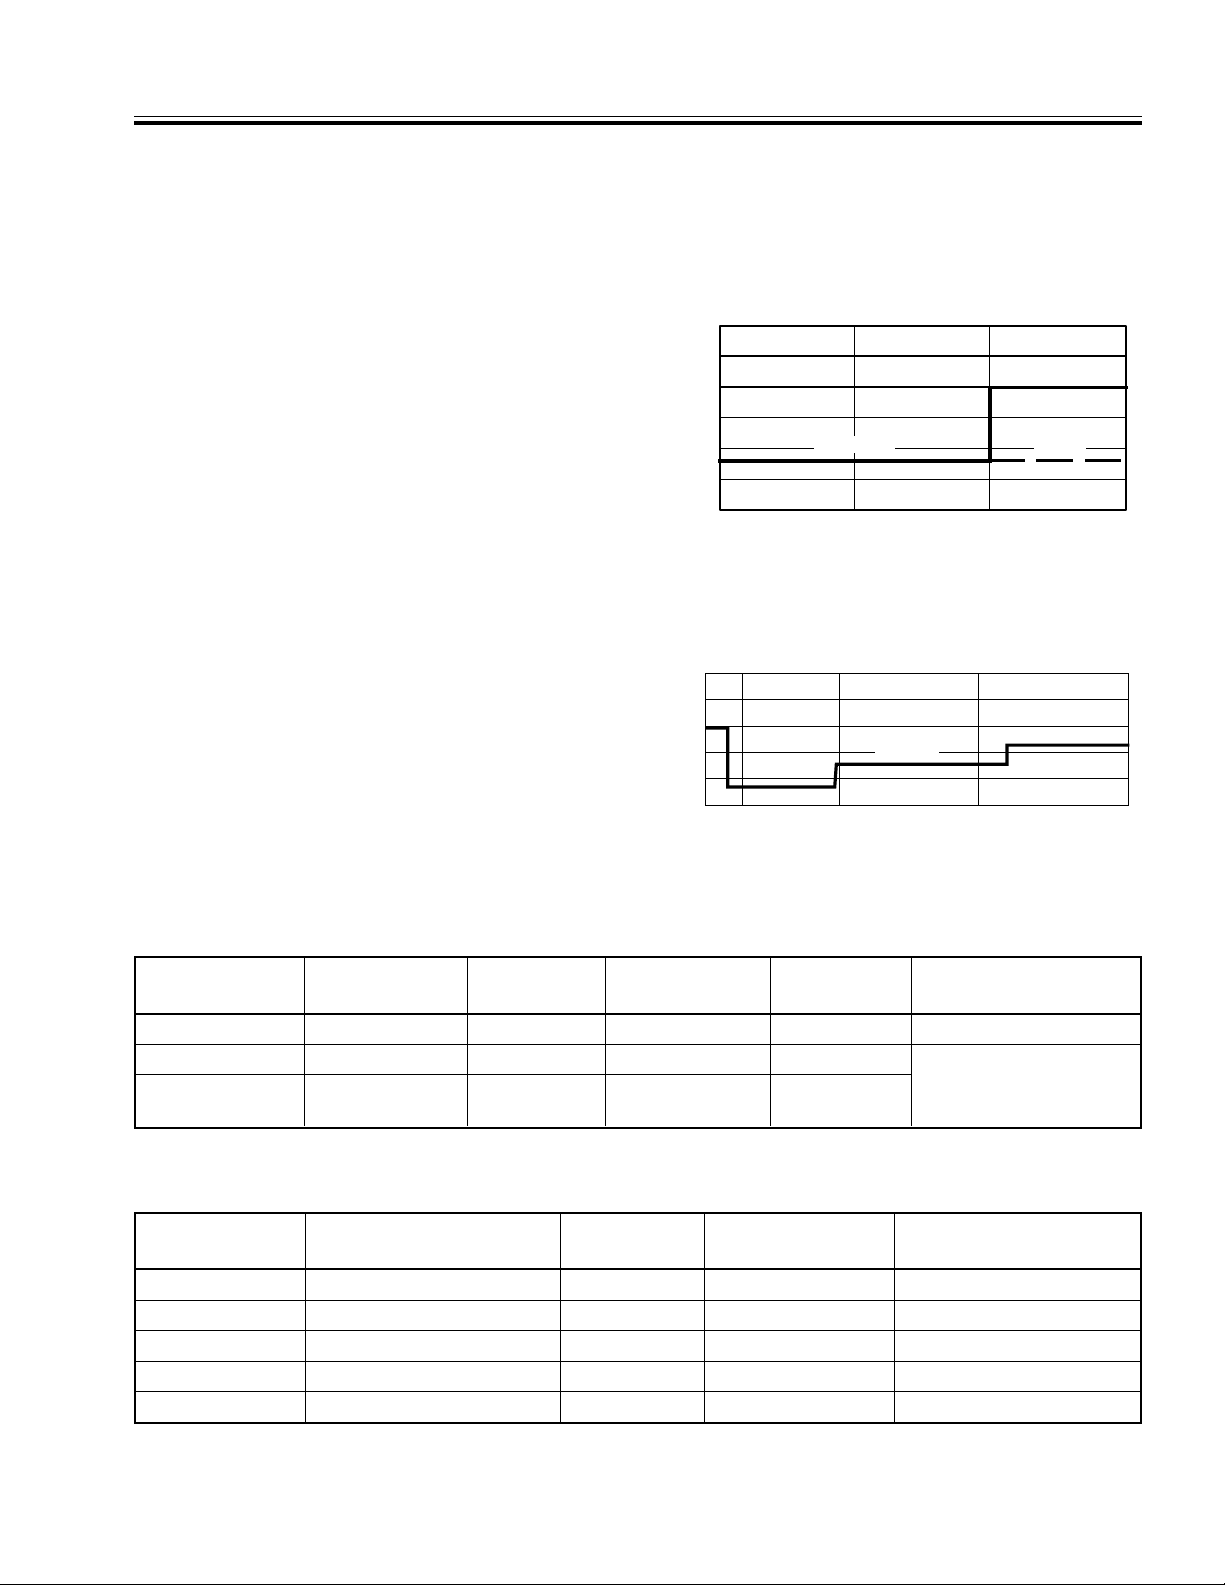
Return Loss (dB)
0
5
10
15
20
25
Frequency (GHz)
0 8.0
18.0 26.5
Minimum
0.04
1000 2000
3000
Return Loss (dB)
Frequency (MHz)
11
50 Ohm
75 Ohm
50 & 75 O hm
15
20
25
30
I GENERAL INFORMATION SYSTEM RF COMPONENTS
1-1.2 Detectors
The 5400 Series and 560 Series Detectors are used
for coaxial transmission loss or gain and power
measurements. Zero-biased Schottky diodes provide
a measurement range of –55 dBm to +16 dBm. Field
replacement of the detector diode is possible with the
5400-71B75 detector and most of the 560-7 Series
RF Detectors Tables 1-8 and 1-9). Optional extender
cables can be used without degradation in performance. With suitable coaxial adapters they may be
used for waveguide reflectometer measurements.
The precaution s for using these component are described in paragraph 1-10.
a. 5400 Series Detector Specifications
The frequency ranges and input connector types for
these detectors are listed in Table 1-8.
Maximum Input Power: 100 mW
Cable Length: 122 cm (4 ft)
Dimensions: 7.6 x 2.9 x 2.2 cm
(3 x 1-1/8 x 7/8 in.)
Weight: 170g (6 oz)
b. 560 Series Detector Specifications
The frequency ranges and input connector types for
these detectors are listed in Table 1-9.
Maximum Input Power: 100 mW
Cable Length: 122 cm (4 ft)
Dimensions: 7.6 x 2.9 x 2.2 cm
(3 x 1-1/8 x 7/8 in.)
Weight: 170g (6 oz)
Detector Return Loss (5400 series):
Detector Return Loss (560 series):
Table 1-8.5400 Series Det ectors
Model Frequency
Range (MHz)
5400-71B75 1 to 1000 75 20
5400-71N50 1 to 3000 50 26
5400-71N75 1 to 3000 75
Impedance
(Ohms)
Return
Loss(dB)
26 (≤2 GHz)
20 (≥2 GHz)
Input
Connector
BNC Male
N Male
N Male
Replacement Module
Diode
10-88
Serv. Center
Replacement
Table 1-9.560 Series Detect ors
Model Frequency
560-7A50 10 MHz to 18.0 GHz
Range
560-7N50B 10 MHz to 20 G Hz
560-7S50B 10 MHz to 20 GHz
560-7S50-2 10 MHz t o 26.5 GHz
560-7K50 10 MHz to 26.5 GHz
Impedance
(Ohms)
50
50
50
50
50
Input
Connector
Diode
Replacement Module
GPC-7 560-A-7219-A
N Male 560-A-C-24441
WSMA Male 560-A-C-24441
WSMA Male 560-A-7219-B
K Male ND19393
54XXA OM 1-12
Page 17
0
1
2
3
4
5
1
2
3
4
2
11
2
PRECAUTIONS FOR USE OF
I GENERAL INFORMATION AUTOTESTERS AND RF DETECTORS
1-10 PRECAUTIONS FOR USE OF SWR
AUTOTESTERS AND RF DETECTORS
The 560 Series SWR Autotesters and RF Detectors
are high-quality, precision laboratory devices that
contain General Precision class Connectors (GPC’s).
Follow the precautions listed below when handling
or connecting these devices. Complying with these
precautions will guarantee longer component life
and less equipment downtime due to connector or
device failure. Such compliance will ensure that RF
component failures are not due to misuse or abuse
(these two failure causes not covered under the WILTRON warranty).
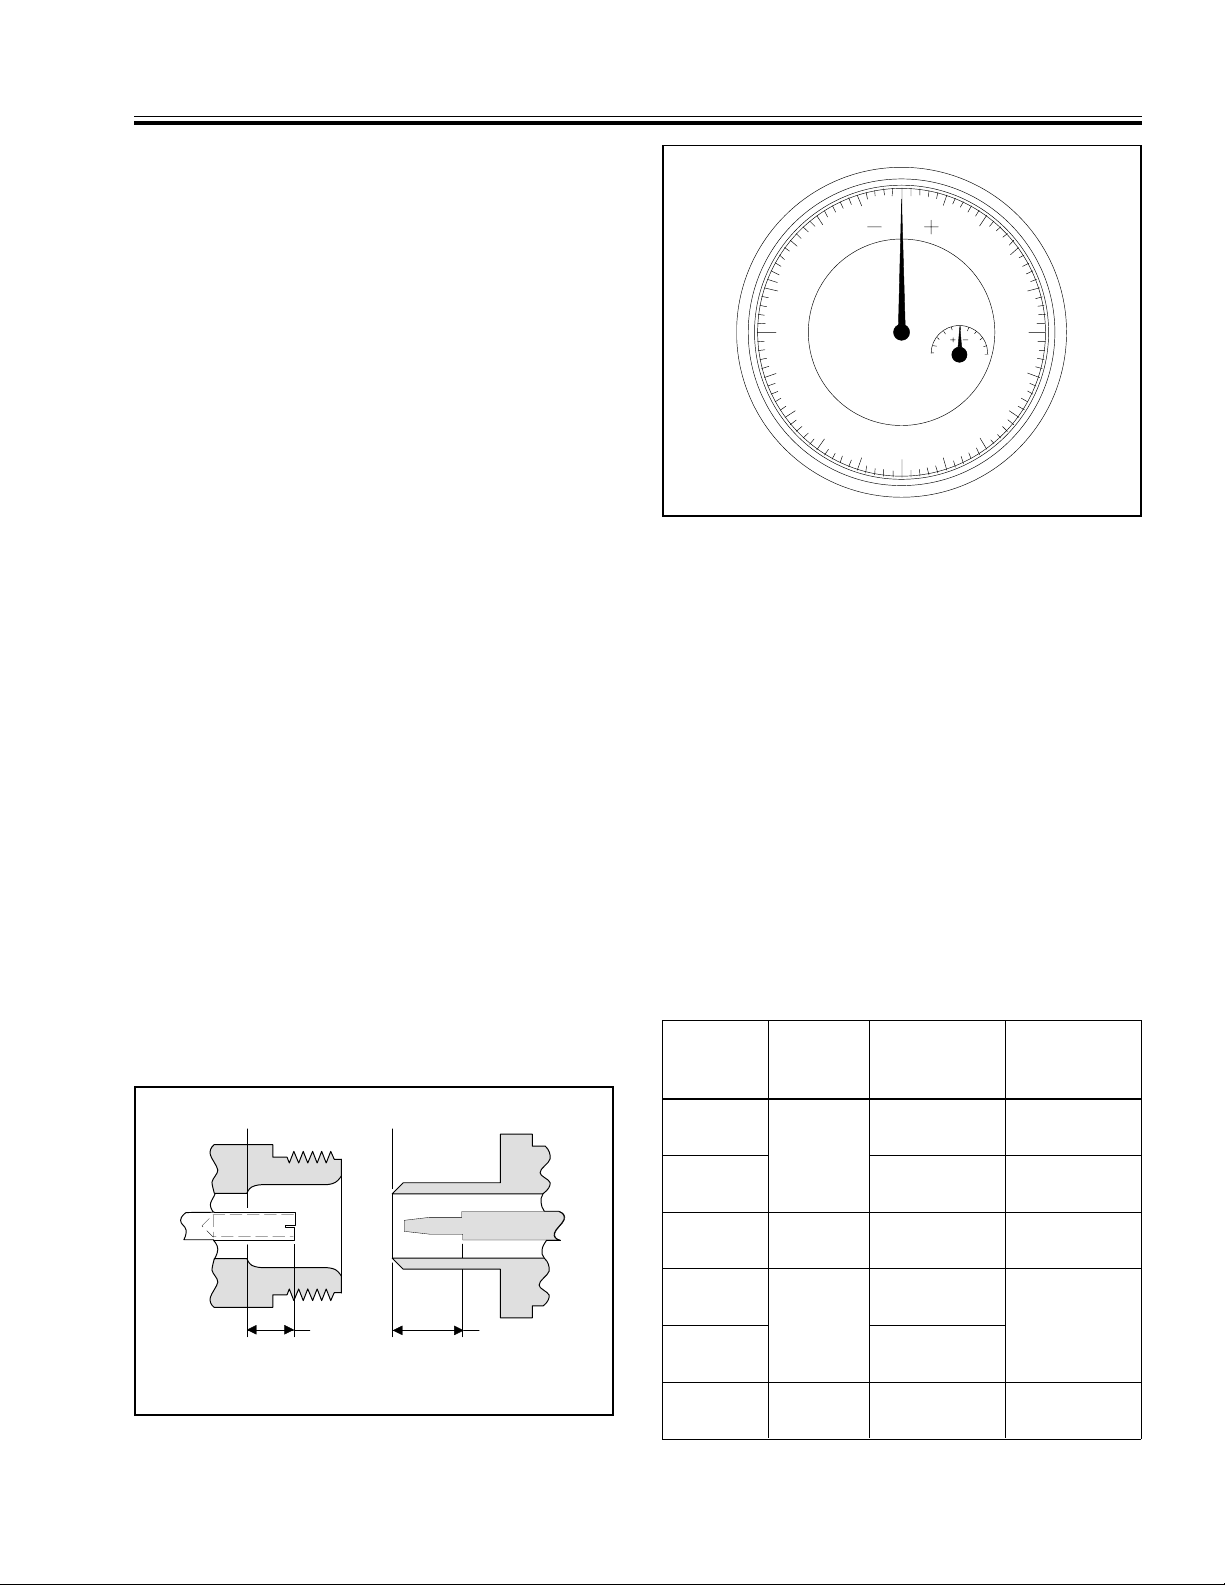
a. Bewa re of destructive Pin Depth of Mating
Connectors
Based on RF components returned for repair,
destructive pin dept h of mating conn ectors is t he
major cause of failure in the field. When an RF
component connector is mated with a connector
having a destructive pin depth, damage will usually occur to the RF component connector. A destructive pin depth is one that is too long in
respect to the reference plane of the connector
(Figure 1-2).
The center pin of a pr ec isio n R F co m po nent c on nector has a precision tolerance measured in
mils (1/1000 inch). The mating connectors of
various RF components may not be precision
types. Consequently, the center pins of these devices may not have the proper depth. The pin
depth of DUT connectors should be measured to
assure compatibility before attempting to mate
“+” region, the center pin is too long (see Table
1-10). Mating under this condition will probably
damage the precision RF component connector.
If the test device connector measures out of tolerance in the “–” region, the center pin is too
short. This will not cause damage, but it will
result in a poor connection and a consequent
degradation in performance.
b. Avoid Over-Torquing Connectors
Over-torquing connectors is destructive; it may
damage the connector cente r pin. Always use a
connector torque wrench (8 inch-pounds) when
tightening GPC-7, WSMA, and K type connectors. (Finger-tight is usually sufficient for Type
N connectors). Never use pliers to tighten
connectors.
Figure 1-3. Pin Depth Gauge
them with SWR Autotester or detector connectors. A WILTRON Pin Depth Gauge (Figure 1-3),
or equivalent, can be used for this p urpose. If the
measured connector is out of tolerance in the
REFERENCE
PLANE
REFERENCE
PLANE
PIN
DEPTH
(INCHES)
FEMALE
0.207
+0.000
-0.0001
PIN
DEPTH
(INCHES)
MALE
0.207
+0.001
-0.000
Figure 1-2. N Connector Pin Depth Definition
Table 1-10. Allowable Mating Connector Pin Depth
Test Port
Connector
Type
N-Male
N-Female 207+0.000
GPC-7 01-161
WSMA-
Male
WSMAFemale
K-Male,
K-Female
Wiltron
Gauging
Set Model
01-163
01-162
01-162
Pin Depth
(Mils)
207–0.000
+
0.003
–
0.003
+
0.000
–
0.003
–
0.0025
–
0.0035
+
0.003
–
0.007
+
0.000
–
0.005
Pin Depth
Gauge
Reading
207 +0 .000
–
0.003
Same as
Pin Depth
Same as
Pin Depth
Same as
Pin Depth
Same as
Pin Depth
54XXA OM 1-13
Page 18
PRECAUTIONS FOR USE OF
AUTOTESTERS AND RF DETECTORS I GENERAL INFORMATION
c. Avoid Mechanical Shock
Do not drop or otherwise treat RF components
roughly. These devices are designed to withstand
years of normal bench handling. However, mechanical shock will significantly reduce their
service life.
d. Avoid Applying Exces sive Power
Series 560-9XXXX SWR Autotesters are rated at
+27 dBm (0.5 W) maximum input power, and
Series 560-7XXX Detectors are rated at +20 dBm
maximum input power. Exceeding these input
power levels, even for short durations, can permanently damage the internal components of
these devices.
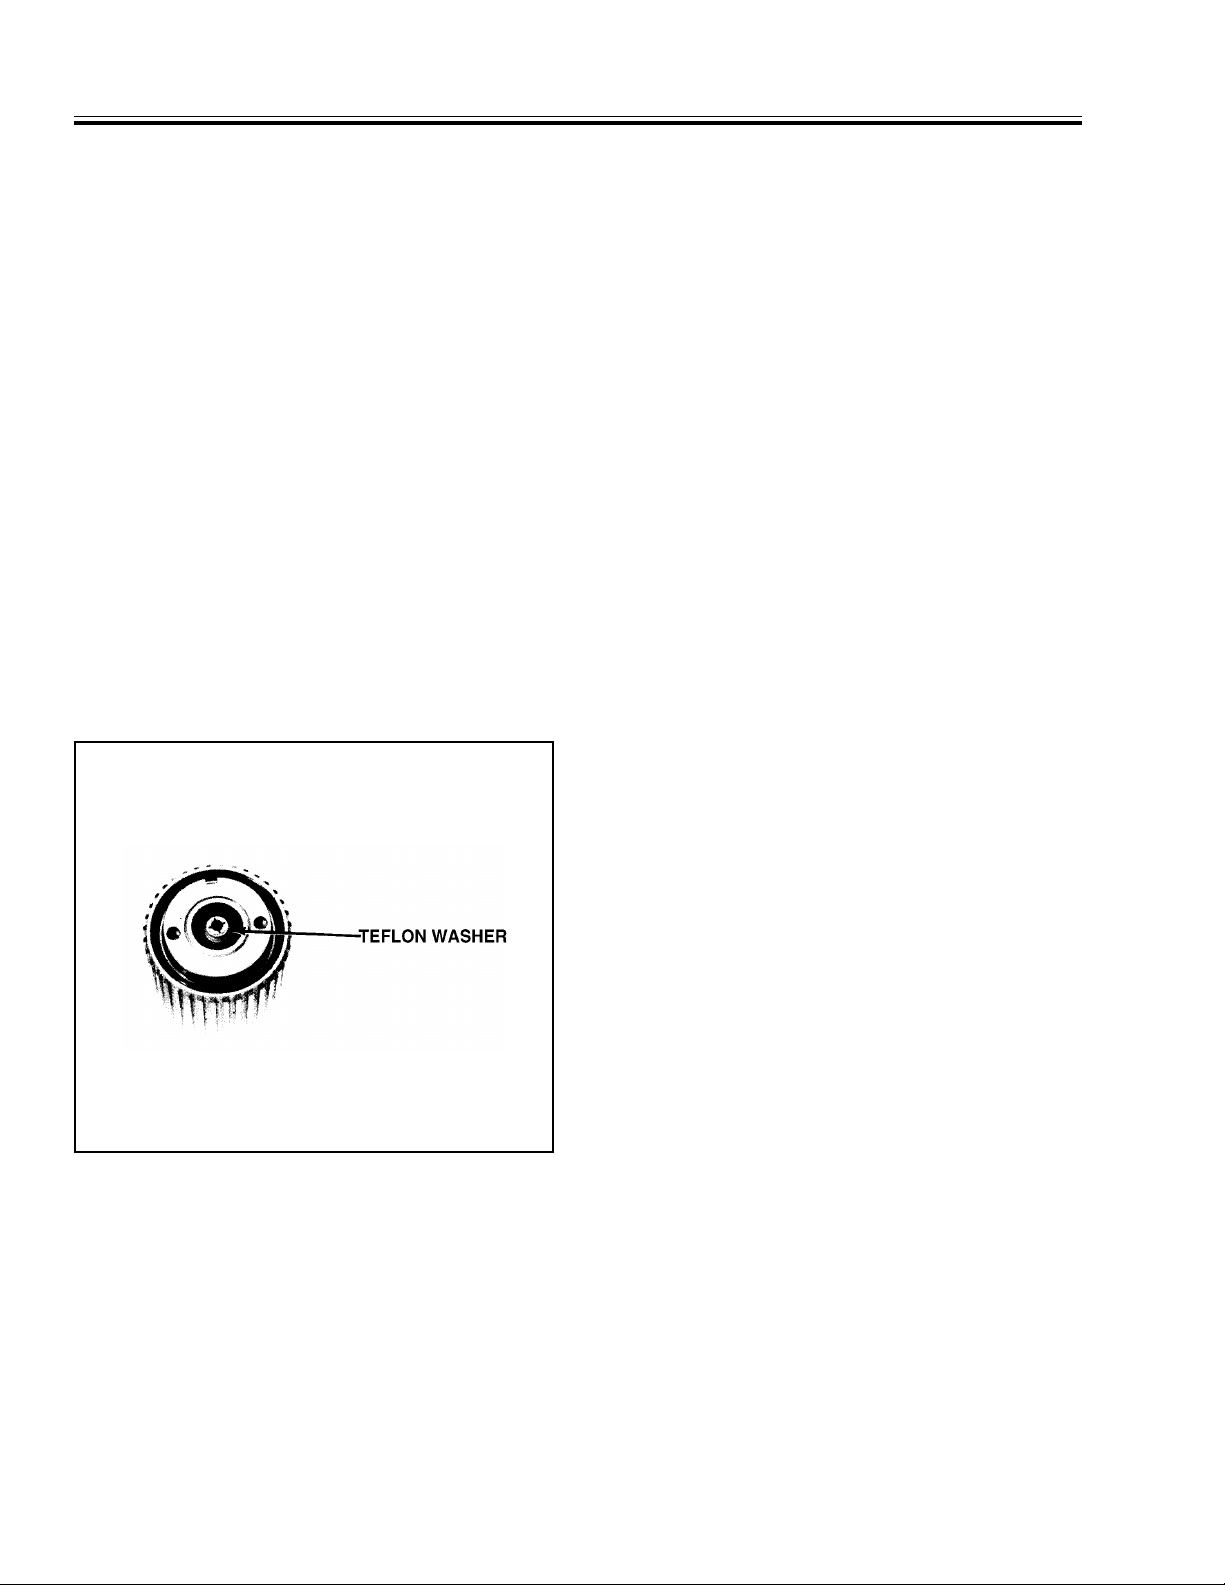
e. Not Disturb Teflon Tuning Washers On
Connector Center Pins
The center conductor of many RF component
connectors contains a small teflon tuning washer
that located near the point of mating (Figure
1-7). This washer compensates for minor impedance discontinuities at the interface. Do not dis-
turb this wa sher. The location of this washer is
critical to the performance of the component.
connectors of the 54XXA and other WILTRON
RF signal sources. Figure 1-5 shows a typical
compensation washer installation.
g. Keep Connectors Clean
The precise geometry that makes possible the
RF component’s high performance can be easily
disturbed by dirt and other contamination adhering to connector interfaces. When not in use,
keep the connectors covered.
To clean the connector interfaces, use a clean
cotton swab that has been dampened with den atured alcohol. Proper techniques for cleaning
GPC type connectors are as follows.
• Always use denatured alcohol as cleaning
solvent. Never use industrial solvent or water ,
as damage to the connectors may result.
• Use only a small amount of alcohol; otherwise,
prolonged drying of the connector may be
required.
• Never put lateral pressure on the center pin
of the connector.
• Verify that no cotton or other foreign material
remains in the connector after cleaning it.
• If available, use compressed air to remove foreign particles and to dry the connector.
• After cleaning, verify that the center pin has
not been bent or damaged.
NOTE
The teflon washer is shown on a GPC-7
connector. A similar washer may be installed
on any WILTRON precision connector.
Figure 1-4. Typical Tuning Washer Usage
f. Compensation Washers (WSMA Connectors)
WSMA connectors are optimized fo r connection
to standard SMA connectors. Whenever two
WSMA connectors are mated, a beryllium copper
compensation washer should be inserted
between the two connectors near the point of
mating (to provide optimum mating depth for
this connector combination). The only exceptions
are: the WSMA Open/Short, and the RF Output
NOTE
Most cotton swabs are too large to fit
into the smaller connector types. In
these cases it is nece ssary to peel off
most of the cotton and then twist the
remaining cotton tight. Be sure that
the remaining cotton does not get
stuck in the connector.
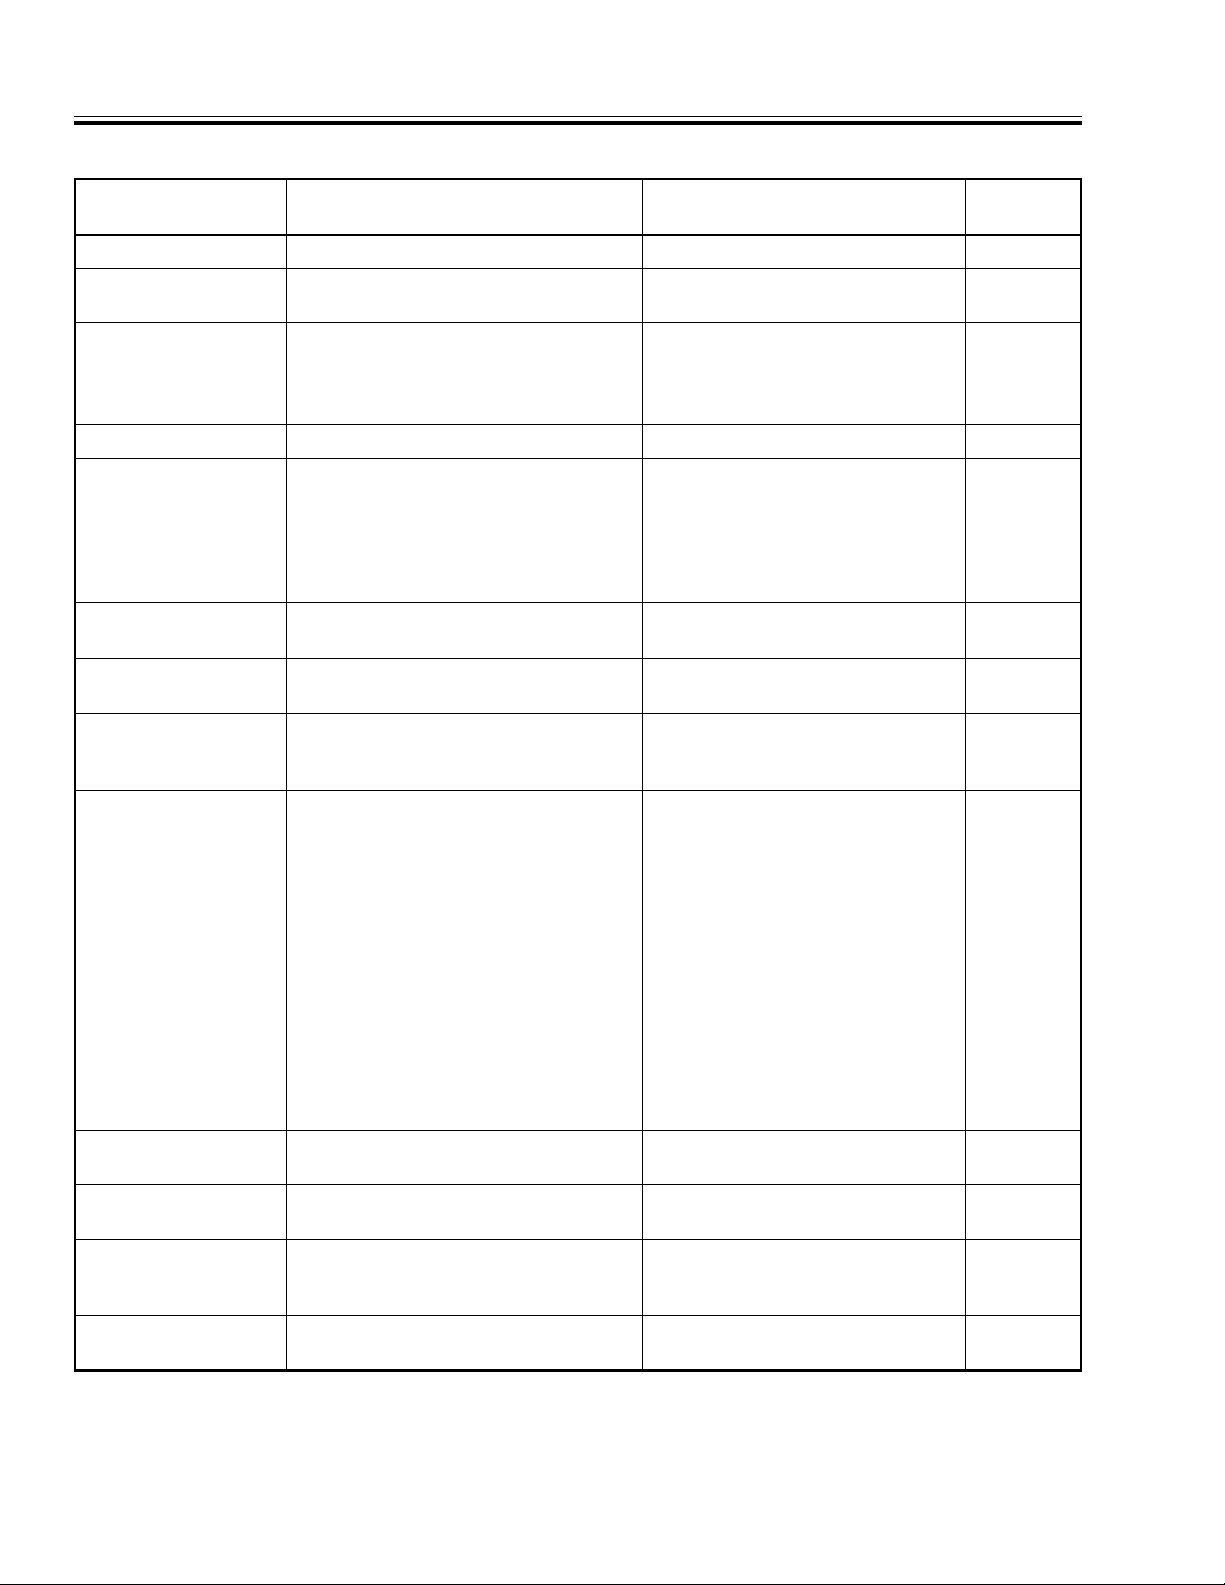
1-11 RE COMMENDED TEST EQUIPMENT
Table 1-10 is a list of recommended test equipment
required for performance verification and calibration
procedures and for troubleshooting Model 54XXA
Scalar Measurement systems. Each equipme nt entry includes a USE code that indicates the type of
usage for that piece of equipment. These codes are
described below.
Code Type of Testing
C Calibration
P Performance Verification
T Troubleshooting
1-14 54XXA OM
Page 19
PRECAUTIONS FOR USE OF
I GENERAL INFORMATION AUTOTESTERS AND RF DETECTORS
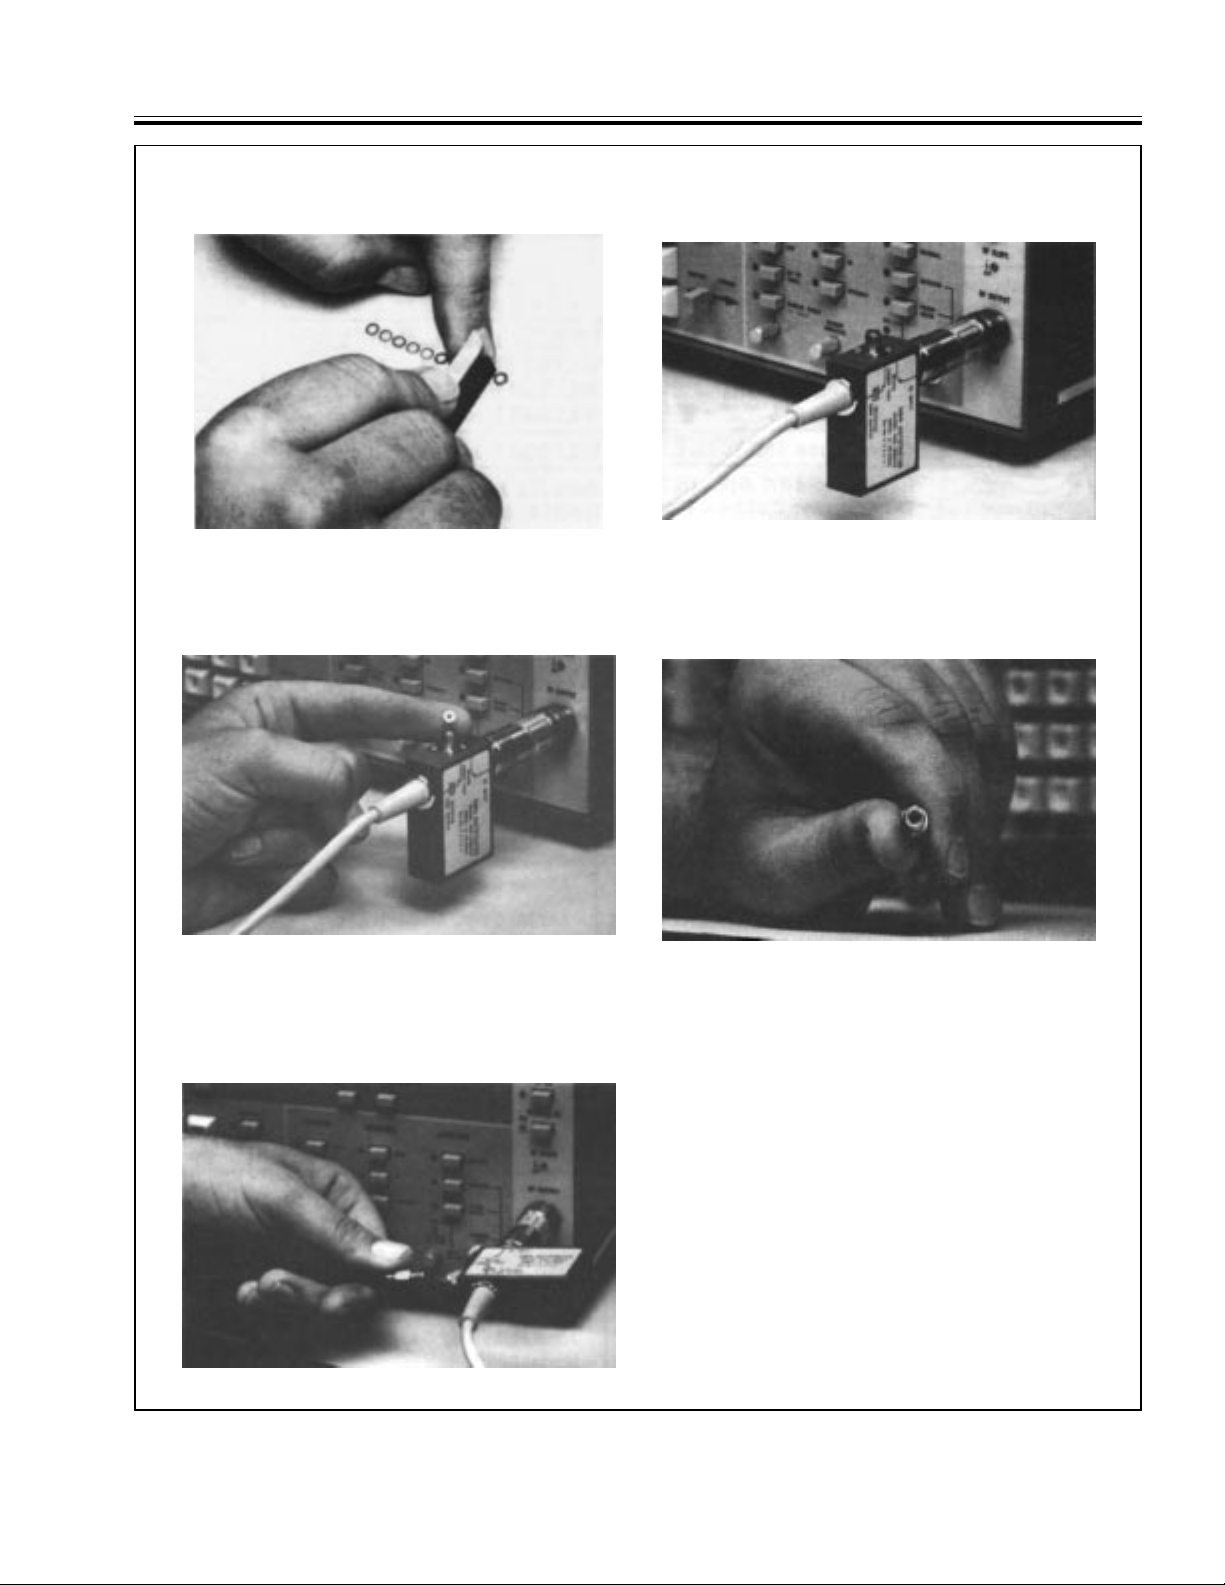
CONNECTING A 19SF50 AIR LINE TO A 560-98SF50 SWR AUTOTESTER
(WSMA to WSMA Connection)
1. Se parate a sing le WSMA connector
compensation washer and trim away the
interconne cting tabs.
3.
Insert the compensation washer into the
opening of the WSMA female connector, as
shown.
2. Co nnec t th e 56 0-9 8SF50 SW R Aut otes ter
input port to the signal source RF output port,
and loosely tighten connector. Orient the
WSMA female connector (t est port) up .
4.
Connect bead ed end of the air line per appli cation. Tilt the air line hor izonta lly. At unbeaded end, center the inner conductor with
the center of the connector opening.
5. Loo sen the SWR Au totester input po rt connector and rotate unit horizontally, as shown at
left. Align unbe aded end o f A ir Li ne w ith tes t
port connector and carefully mate connectors.
Tighten all connectors carefully.
NOTE
For a 560-98S50 SWR Autotester
(male WSMA test port) in combination
with a 19SF50 Air Line, insert the
compensation washer into the fem ale
WSMA connector of the air line
(beaded end).
Figure 1-5. Example Use of Compensation Washer with WSMA Connectors
54XXA OM 1-15
Page 20
RECOMMENDED TEST EQUIPMENT I GENERAL INFORMATION
Table 1-11. Recommended Test Equipment
INSTRUMENT
Adaptor Cable Simulates 560-7 Series det ectors WILTRON Model 560-10BX P
Computer/ Controller Personal computer, equipped with
National PCIIA GPIB interface card
RF Detector
Impedance Adapter
Digital Multimeter Resolution: 4-1/2 digits (to 20V )
1. 50Ω input, 1.0 to 3000 MHz*
2. 75Ω input, 1.0 to 3000 MHz**
3. 0.010 to 18.5 GHz
4. 0.010 to 26.5 GHz
Converts from 50Ω To 75 Ω
DC Accuracy:
DC Input Impedance:
AC Accuracy:
(to 20 kHz)
AC Input Impedance: 1 MΩ
Frequency Counter
Frequency:
Input Impeda nce
Modulation M eter
Oscilloscope
Bandwidth:
Accuracy: ±3 % of FSD at 1 kHz
Bandwidth
Sensitivity:
Horiz. Sensit ivity:
Power Meter, with:
Power Range:
Other:
Power Sensor*
50Ω in put
Power Sensor**
75Ω in put
Power Sens or Fr equenc y Rang e: 0. 10 to 18 .0 GHz
Frequency Rang e: 1.0 MHz to 2.0 GHz
Power Range:
Frequency Rang e: 1.0 MHz to 5.5 GHz
Power Range:
Power Range:
Power Range:
Power Sensor#
Frequency Ra nge: 0.05 to 26.5 GH z
Power Range:
Power Range:
Atten, Calibration
Printer Parallel Int erfac e opera tion WILTRON, Model 2225C Ink Je t
Spectrum Analyzer
Atten: 30 d B, used with MA47 02A/0 4A
Frequency Range:
CRITICAL
SPECIFICATION
#
0.002% + 2 counts
10 MΩ
0.07% + 100 counts
0.1 to 26.5 GHz
: 50Ω
15 kHz
: DC to 150 MHz
2 mV
50 ns/division
+10 to –55 dBm
50 MHz Calibrated Output
–30 to +20 dBm Anritsu Corp., M odel M A4601 A
–30 to +20 dBm
–30 to +20 dBm
–70 to –20 dBm
–30 to +20 dBm
–70 to –20 dBm
0.01 to 26.5 GHz
Any IBM compatible (or WILTRON
Model 85, or HP Model 20 0)
WILTRON Model 5400-71N50
WILTRON Model 5400-71N75
WILTRON Model 560-7N50
WILTRON Model 560-7K50
WILTRON Model 12N75B P,T
John Fluke Mfg Co. Inc.,
Model 8840A, with
Option 8840A-09, True RMS AC
EIP Microwave, In c., Model 57 8A P, C
Marconi Instruments Inc.,
Model 2304
Tektronix, Inc.
Model 2445
Anritsu Corp., Model ML4803A P, T
Anritsu Corp., Model MA4603A
with J0365 Conve rsion Conn ector
Anritsu Corp., Model MA4701A
Anritsu Corp., Model MA4702A
Anritsu Corp., Model MA4703A
Anritsu Corp., Model MA4704A
Anritsu Corp., Model MP47A
Printer, or equivalent
Anritsu Corp., Model MS2802 P, T
RECOMMENDED
MANUFACTURER/MODEL
USE
P, C
C, T
Power Rang e: +1 0 dB to –60 d Bm
Step Attenuator
Voltage Standard Range: –1.462V to –1.313 mV
Attenuation Range:
0.000 to 18.0 GHz
0.000 to 26.5 GHz
Accuracy: 0.002% of set value.
60 dB, 10 dB/s tep
Hewlett-Pack ard, Mode l 8495B
Hewlett-Pack ard, Mode l 8495D
John Fluke Mfg Co. Inc.,
Model 335D
P, C
P, C, T
P
P
T
P
1-16 54XXA OM
Page 21

SECTION II
INSTALLATION
Table of Contents
2-1 INTRODUCTION . . . . . . . . . . . . . . . . . . . . . . . . . . . . . 2-3
2-2 INITIAL INSPECTION . . . . . . . . . . . . . . . . . . . . . . . . . . 2-3
2-3 PREPARATION FOR USE . . . . . . . . . . . . . . . . . . . . . . . . 2-3
2-4 GPIB SETUP AND INTERCONNECTION . . . . . . . . . . . . . . . . 2-3
Interface Connector . . . . . . . . . . . . . . . . . . . . . . . . . . . . 2-3
Cable Length Restrictions . . . . . . . . . . . . . . . . . . . . . . . . . 2-3
System GPIB Interconnection . . . . . . . . . . . . . . . . . . . . . . . 2-4
GPIB Interface to an External Plotter . . . . . . . . . . . . . . . . . . 2-4
GPIB Addresses . . . . . . . . . . . . . . . . . . . . . . . . . . . . . . 2-4
2-5 EXTERNAL MONITOR CONNECTOR . . . . . . . . . . . . . . . . . . 2-4
2-6 PREPARATION FOR STORAGE AND/OR SHIPMENT . . . . . . . . 2-4
Preparation for Storage . . . . . . . . . . . . . . . . . . . . . . . . . . 2-4
Preparation for Shipment . . . . . . . . . . . . . . . . . . . . . . . . . 2-4
54XXA OM 2-1/2-2
Page 22

SECTION II
INSTALLATION
2-1 INTRODUCTION
This section provides information for the initial inspection and preparation for use of the 54XXA Scalar Measurement System. Information for interfacing the 54XXA to the IEEE-488 General Purpose
Interface Bus and reshipment and storage information is also included.
2-2 INITIAL INSPECTION
Inspect the shipping container for damage. If the
container or cushioning material is damaged, retain
until the contents of the shipment have been
checked against the packing list and the instrument
has been checked for mechanical and electrical operation.
If the 54XXA is damaged mechanically, notify your
local sales representative or WILTRON Customer
Service. If either the shipping container is d amaged
or the cushioning material shows signs of stress,
notify the carrier as well as WILTRON. Keep the
shipping materials for the carrier’s inspection.
The 54XXA GPIB controller operates with any IBM
XT, AT, or PS/2 compatible computer/controller
equipped with a National Instruments GPIBPCII/IIA interface card and NI-488 MS-DOS Handler Software. The procedures for installing this
hardware and software in your computer is contained in Appendix B at the rear of this manual.
2-4.1 Interface Connector
Interface between the 54XXA and other devices o n
the GPIB is via a standard 24-wire GPIB interface
cable. This cable uses a double-sided connector; one
connector face is a plug, the other a receptacle.
These double-function connectors allow parallel connection of two or more cables to a single instrument
connector. The pin assignments for the rear panel
GPIB connector are shown in Figure A-3, located in
the Appendix.
2-3 PREPARATION FOR USE
Preparation for use consists of checking that the
rear panel line voltage module is s et for the correct
line voltage. The voltage selector drum of this mod ule may be set for either 115 or 230 Vac operation;
see Figure 2-1. If the selector drum setting is incorrect for the line voltage available, set it to the correct setting and insert the correct line fuse as
shown in the chart in Figure 2-1.
2-4 GPIB SETUP AND
INTERCONNECTION
If equipped with Option 03, all functions of the
54XXA (except power on/off) can be controlled remotely by an external computer/controller via the
IEEE-488 GPIB. The information in this section
pertains to interface connections and cable requirements fo r the rear panel GPIB connector. Refer to
the GPIB Users Guide (located behind the Supplements/Options tab) for information about remote
operation of the 54XXA using the GPIB.
2-4.2 Cable Length Restrict io ns
The GPIB system can accommodate up to 15 instruments at any on e time. To achieve design pe rformance on the bus, proper timing and voltage level
relationships must be maintained. If either the cable length between separate instruments or the accumulated cable length between all instruments is
too long, the data and control lines cannot be driven
properly and the system may fail to perform. Cable
length restrictions are as follows:
• No more than 15 instruments may be installed
on the bus.
• Total accumulative cable length in meters may
not exceed two times the number of bus instruments or 20 meters—whichever is less.
NOTE
For low EMI applications, the GPIB cable
should be a fully shielded type, with wellgrounded metal-shell connectors.
54XXA OM 2-3
Page 23

PREPARATION FOR STORAGE AND/OR SHIPMENT II INSTALLATION
2-4.3 System GPIB Interconnection
The rear panel GPIB IEEE-488 co nnector is us ed to
interface the 54XXA to an external computer/
controller (or plotter) via a standard GPIB cable.
The WILTRON Part numbers for standard GPIB
cables of various lengths are list ed in Section I.
2-4.4 GPIB Interface to an External Plotter
If equipped with Option 03, the 54XXA GPIB inte rface can be configured to control a suitable external
plotter (refer to Table 1-2 and to Sectio n III—Front
Panel Operation). In this mode of operation, the
GPIB is dedicated to this applicatio n and only the
54XXA and the plotter are connected to the GPIB.
Standard GPIB cables are used to interconnect to
the plotter.
2-4.5 GPIB Addresses
The 54XXA leaves the factory with the default
GPIB address set to 6 and the external plotter
interface default address set to 8. These addresses may be changed using the menus invoked
by the front panel SYSTEM MENU key. This pr ocedure is explained in Section III.
2-5 EXTERNAL MONITOR CONNECTOR
The rear panel EXTERNAL MONITOR connector
allows the internal display information of the
54XXA to be connected to an external VGA monitor
(either color or monochrome). The pinout of this
15-pin Type D connector is shown in Figure A-2,
located in the Appendix.
2-6.2 Preparation for Shipment
To provide maximum protection against damage in
transit, the 54XXA should be repackaged in the
original shipping container. If this container is no
longer available and the 54XXA is being returned to
WILTRON for repair, advise WILTRON Customer
Service; they will send a new shipping container
free of charge. In the event neither of these two
options is possible, instructions for packaging and
shipment are given below.
a. Use a Suitable Container
Obtain a corrugated cardboard carton with a
275-pound test strength. This carton should
have inside dimensions of no less than six
inches larger than the instrument dimensions
to allow for cushioning.
b. Protect the Instrument
Surround the instrument with polyethylene
sheeting to protect the finish.
c. Cushion the Instrument
Cushion the instrument on all sides by tightly
packing dunnage or urethane foam between the
carton and the instrument. Provide at least
three inches of dunnage on all sides.
d. Seal the Container
Seal the carton by using either shipping tape or
an industrial stapler.
2-6 PREPARATION FOR STORAGE
AND/OR SHIPMENT
The following paragraphs describe the procedure for
preparing the 54XXA for storage or shipment.
2-6.1 Preparation for Storage
Preparing the 54XXA for storage consis ts of cleaning the unit, packing the inside with moisture-absorbing desiccant crystals, and storing the unit in a
temperature environment that is maintained
between –40 and +70 degrees centigrade (–40 to
156 degrees Fahrenheit).
2-4 54XXA OM
e. Address the Contai ner
If the instrument is being returned to WILTRON for service, m ark the WIL TRON addr ess
and your return address on the carton in one or
more prominent locations. For international
customers, us e the address of your local representative (Table 2-1). For U.S.A. customers, use
the WILTRON address shown below:
WILTRON Company
ATTN: Customer Service
490 Jarvis Drive
Morgan Hill, CA 95037-2809
Page 24
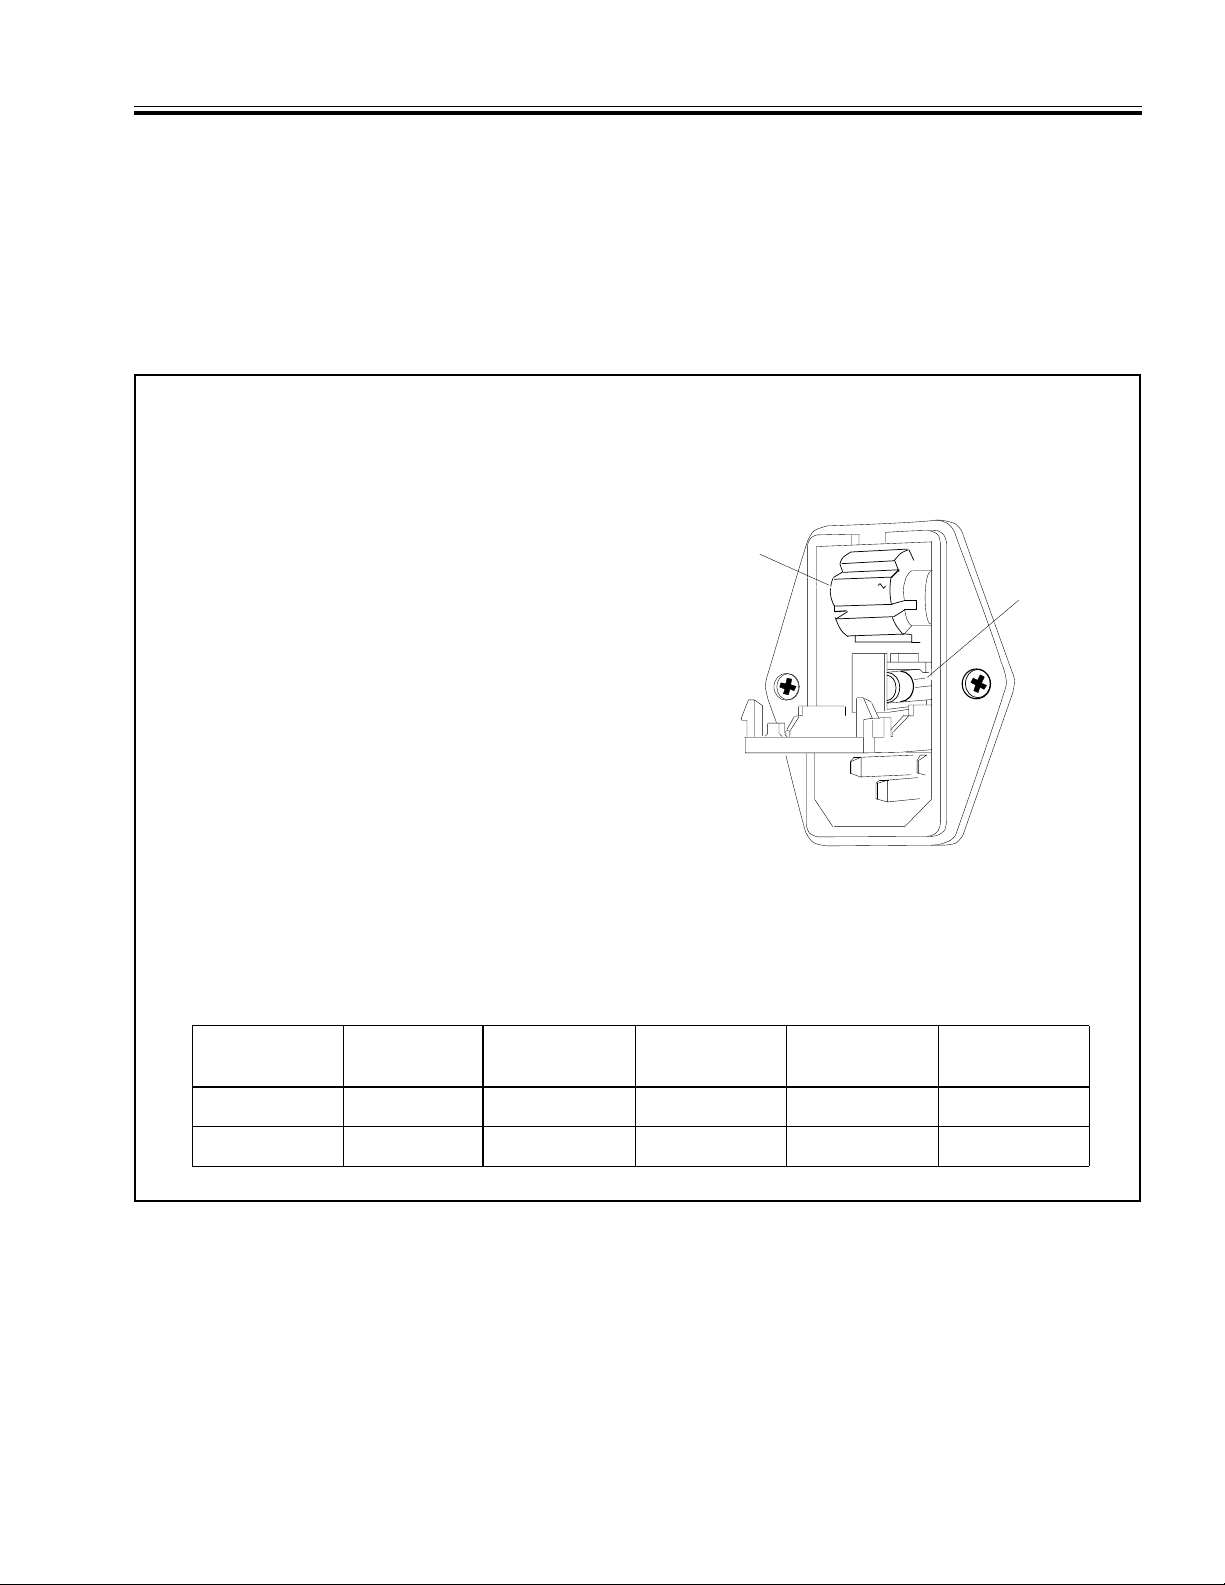
LINE VOLTAGE SELECTOR MODULE
VOLTAGE
SELECTOR
DRUM
FUSE CAVITY
230Vac
II INSTALLATION LINE VOLTAGE SELECTOR MODULE
To change the line voltage from that shown on the Line Voltage Module selector drum, proceed as follows:
(a) Remove the power cord from the line voltage module.
(b) Inser t the blade of a sm all screwdriver i nto the slot at
the top-center of the module, and pry open the cover.
(c) Remove the voltage selector drum by pulling straight
out.
(d) Rotate the drum so that the desired line voltage
marking faces out, then reinstall the drum.
(e) Remove the fuse cartridge from the right-hand
fuseholder. The fuse cartridge is identified with a white
arrow and is located be ne ath the voltage sele ct or drum.
(f) Check that the proper fuse is installed (see table).
(g) Change to the correct fuse, if necessary, and replace
the fuse cartridge.
(h) Close the cover, and ensure that the desired line
voltage value is displayed through the opening in the
cover.
(i) Reinstall the line cord.
Line Volta ge
Setting
115Vac USA/Japan 4.0A , Anti surge 3 AG 631-16 553-221
230 Vac UK /Europe 2.0A, Antisu rge 5 x 20 mm 631-67 553-240
Fuse Sizes, Ratings, and Part Numbers
Area
Fuse
Rating
Fuse
Size
Wiltron P/N
Fuse
Figure 2-1. Setting the Line Voltage Module Operating Voltage
Wiltron P/N
Fuse Holder
54XXA OM 2-5
Page 25

WILTRON SERVICE CENTERS II INSTALLATION
Table 2-1. WILTRON Service Ce nters
UNITED STATES
WILTRON COMPANY
490 Jarvis Drive
Morgan Hill, CA 95037
Tel ephone: (408) 778-2000
Tel ex: 285227 WILTRON MH
FAX: (408) 778-0239
-
2809
ANRITSU WILTRON SALES
COMPANY
685 Jarvis Drive
Morgan Hill, CA 95037
Tel ephone: (408) 776-8300
FAX: (408) 776-1744
-
2809
ANRITSU WILTRON SALES
COMPANY
10 Kingsbridge Road
Fairfield, NJ 07004
Tel ephone: (201) 227-8999
FAX: 201-575-0092
AUSTRALIA
WILTRON PTY. LTD..
Level 2, 410 Church Street
North Parramatta
NSW 2151 Australia
Tel ephone: 026-30-81-66
Fax: 026-83-68-84
BRAZIL
ANRITSU WILTRON ELECTRONICA LTDA.
Praia de Botafogo, 440-SL 2401-Botafogo
2225-Rio de Janeiro-RJ-Brasil
Tel ephone: 021-28-69-141
Fax: 021-53-71-456
CANADA
ANRITSU WILTRON INSTRUMENTS LTD.
215 Stafford Road, Unit 102
Nepean, Ontario K2H 9C1
Tel ephone: (613) 828-4090
FAX: (613) 828-5400
CHINA
WILTRON BEIJING SERVICE CENTER
416W Beijing Fourtune Building
5 Dong San Huan Bei Lu
Chao Yang Qu, Beijing 100004, China
Tel ephone: 86-1-50-17-559
FAX: 86-1-50-17-558
FRANCE
ANRITSU WILTRON S.A
9 Avenue du Quebec
Zone de Courtaboeuf
91951 Les Ulis Cedex
Tel ephone: 016-44-66-546
FAX: 016-44-61-065
GERMANY
ANRITSU WILTRON GmbH
Rudolf Diesel Strabe 17
8031 Gilching
Tel ephone: 08-10-58-055
Tel ex: (841) 528523
FAX: 08-10-51-700
INDIA
MEERA AGENCIES (P) LTD.
A-23 Hauz Khas
New Delhi 110 016
Tel ephone: 011-685-3959
FAX: 011-686-6720
ISRAEL
TECH-CENT, LTD
Haarad St. No.7, Ramat Haahayal
Tel -Aviv 69701
Tel ephone: (03) 64-78-563
FAX: (03) 64-78-334
ITALY
ANRITSU WILTRON Sp.A
Roma Office
Via E. Vittorini, 129
00144 Roma EUR
Tel ephone: (06) 50-22-666
FAX: (06) 50-22-4252
JAPAN
ANRITSU CORPORATION
1800 Onna Atsugi-shi
Kanagawa-Prf. 243 Japan
Tel ephone: 0462-23-1111
FAX: 0462-25-8379
KOREA
WILTRON CORPORATION
#2103 Korea World Trade Center
159-1 Samsung-Dong
Kangnam-ku, Seoul
Tel ephone: (02) 551-2250
FAX: (02) 551-4941
SWEDEN
ANRITSU WILTRON AB
Box 247
S-127 25 Skarholmen
Tel ephone: (08) 74-05-840
Tel ex: (854) 81-35-089
FAX: (08) 71-09-960
TAIWAN
WILTRON CO., LTD.
8F, N o. 96, Section 3
Chien Kuo N. Road
Taipei, Taiwan, R.O.C.
Tel ephone: (02) 515-6050
FAX: (02) 505-5519
UNITED KINGDOM
ANRITSU WILTRON LTD.
200 Capability Green
Luton, Bedfordshire
LU1 3LU, England
Tel ephone: 05-82-41-88-53
Tel ex: (851) 826750
FAX: 05-82-31-303
2-6 54XXA OM
Page 26

SECTION III
FRONT PANEL OPERATION
Table of Contents
3-1 INTRODUCTION . . . . . . . . . . . . . . . . . . . . . . . . . . . . . 3-3
3-2 CRT DISPLAY . . . . . . . . . . . . . . . . . . . . . . . . . . . . . . . 3-3
3-3 INITIAL 54XXA CONTROL SETTINGS . . . . . . . . . . . . . . . . . 3-3
3-4 CONTROL KEY FUNCTIONAL GROUPS . . . . . . . . . . . . . . . . 3-3
Control Key Operation . . . . . . . . . . . . . . . . . . . . . . . . . . . 3-4
Setup Menu Operation . . . . . . . . . . . . . . . . . . . . . . . . . . . 3-4
3-5 POWER-ON SELF TEST AND FRONT PANEL LED ERROR CODES 3-4
3-6 WARNING/ERROR MESSAGES . . . . . . . . . . . . . . . . . . . . . 3-4
3-7 REAR PANEL CONNECTORS . . . . . . . . . . . . . . . . . . . . . . 3-4
3-8 LOWER PANEL CONTROLS AND CONNECTORS . . . . . . . . . . 3-7
POWER ON/OFF Pushbutton . . . . . . . . . . . . . . . . . . . . . . . 3-7
INTENSITY Control Pushbutton . . . . . . . . . . . . . . . . . . . . . 3-7
GRATICULE ON/OFF Pushbutton . . . . . . . . . . . . . . . . . . . . 3-7
TRACE HOLD Key . . . . . . . . . . . . . . . . . . . . . . . . . . . . . 3-7
MENU Up/Down Key . . . . . . . . . . . . . . . . . . . . . . . . . . . 3-7
SELECT Key . . . . . . . . . . . . . . . . . . . . . . . . . . . . . . . . 3-7
INPUT A Connector . . . . . . . . . . . . . . . . . . . . . . . . . . . . 3-7
INPUT B Connector . . . . . . . . . . . . . . . . . . . . . . . . . . . . 3-8
INPUT R Connector . . . . . . . . . . . . . . . . . . . . . . . . . . . . 3-8
3-9 DATA ENTRY KEY GROUP . . . . . . . . . . . . . . . . . . . . . . . 3-8
Data Entry Keypad . . . . . . . . . . . . . . . . . . . . . . . . . . . . . 3-8
Data Entry Knob . . . . . . . . . . . . . . . . . . . . . . . . . . . . . 3-8
ENTER Key . . . . . . . . . . . . . . . . . . . . . . . . . . . . . . . . . 3-8
CLEAR Key . . . . . . . . . . . . . . . . . . . . . . . . . . . . . . . . . 3-8
3-10 NETWORK ANALYZER KEY GROUP AND MENUS . . . . . . . . . 3-9
DISPLAY ON/OFF Key and Indicator . . . . . . . . . . . . . . . . . . 3-9
OFFSET/RESOLUTION Key and Menus . . . . . . . . . . . . . . . . . 3-9
AUTOSCALE Key . . . . . . . . . . . . . . . . . . . . . . . . . . . . . 3-9
LIMITS Key and Menus . . . . . . . . . . . . . . . . . . . . . . . . . . 3-9
MENU Key and Menus . . . . . . . . . . . . . . . . . . . . . . . . . . 3-9
CALIBRATION Key and Menus . . . . . . . . . . . . . . . . . . . . . 3-10
54XXA OM 3-1
Page 27

Table of Contents (Continued)
Paragraph Title Page
UNCAL Indicator . . . . . . . . . . . . . . . . . . . . . . . . . . . . 3-10
3-11 SOURCE KEY GROUP AND MENUS . . . . . . . . . . . . . . . . . 3-10
FREQUENCY Key and Menu . . . . . . . . . . . . . . . . . . . . . . 3-10
ALTERNATE SWEEP Key and Menus . . . . . . . . . . . . . . . . 3-11
MARKERS Key and Menu . . . . . . . . . . . . . . . . . . . . . . . 3-11
OUTPUT POWER Key . . . . . . . . . . . . . . . . . . . . . . . . . 3-11
RF ON/OFF Key and Indicator . . . . . . . . . . . . . . . . . . . . . 3-11
LEVELING Key and Indicators . . . . . . . . . . . . . . . . . . . . . 3-11
3-12 SYSTEM FUNCTION KEY GROUP AND MENUS . . . . . . . . . . 3-12
SYSTEM MENU Key and Menus . . . . . . . . . . . . . . . . . . . . 3-12
SAVE/RECALL Key and Menus . . . . . . . . . . . . . . . . . . . . 3-13
REMOTE Indicator . . . . . . . . . . . . . . . . . . . . . . . . . . . 3-14
RETURN TO LOCAL Key . . . . . . . . . . . . . . . . . . . . . . . . 3-14
SELF TEST Key . . . . . . . . . . . . . . . . . . . . . . . . . . . . . 3-14
3-13 CURSOR FUNCTION KEYS, INDICATORS AND MENUS . . . . . 3-14
Cursor Measurements Functions . . . . . . . . . . . . . . . . . . . . 3-14
CURSOR ON/OFF Key and Indicator . . . . . . . . . . . . . . . . . 3-14
CURSOR ON/OFF Key Menus . . . . . . . . . . . . . . . . . . . . . 3-15
RELATIVE Cursor Key and Indicator . . . . . . . . . . . . . . . . . 3-15
RELATIVE Cursor Key Menu . . . . . . . . . . . . . . . . . . . . . 3-15
BANDWIDTH Search Function . . . . . . . . . . . . . . . . . . . . . 3-15
3-14 HARD COPY KEYS, INDICATORS AND MENUS . . . . . . . . . . 3-16
MENU Key . . . . . . . . . . . . . . . . . . . . . . . . . . . . . . . . 3-16
PRINTER/PLOTTER Indicators . . . . . . . . . . . . . . . . . . . . 3-16
START Key . . . . . . . . . . . . . . . . . . . . . . . . . . . . . . . . 3-16
STOP Key . . . . . . . . . . . . . . . . . . . . . . . . . . . . . . . . 3-16
3-15 ENHANCEMENT KEYS, INDICATORS, AND MENUS . . . . . . . 3-17
AVERAGING Key, Indicators and Menu . . . . . . . . . . . . . . . . 3-17
SMOOTHING Key, Indicators and Menu . . . . . . . . . . . . . . . 3-17
Smoothing Mode Selection . . . . . . . . . . . . . . . . . . . . . . . 3-17
3-2 54XXA OM
Page 28

SECTION III
FRONT PANEL OPERATION
3-1 INTRODUCTION
This section describes:
• The f ront panel controls and connectors
• The set up menus displayed by the front panel
keys
• The CRT screen measurement display and
annotation
• The o peration of the 54XXA Scalar Measurement
System using the front p anel controls and menus
• The rear panel connectors
3-2 CRT DISPLAY
The CRT screen di s pla y sh ow s mea su re men t re su l ts
and setup information. It also displays set up menus
that are used in conjunction with the front panel
control keys to control the instrument meas urement
parameters.
• Measurement Display and Annotation — The
measurement screen display (Figure 3-1)
includes one or two measurement traces, measurement function settings, cursors, markers,
limit lines, and the signal source frequency and
output power parameters. The measurement
traces are referred to as display channels 1 and
2. They are set up via the display channel
menus. If the signal source is programmed for
alternating frequency ranges, then trace 1 displays the main setting and trace 2 displays the
alternative settings.
• Netwo rk Analyzer Settings — The tw o lines la-
beled “1:” and “2:” across the to p of the screen
display the type of measurement sele cted and
the offset and vertical resolution values for
traces 1, 2, or both. The input connector selected for each trace is also shown. The Network Analyzer menu selections control the vertical axis of the display.
• Model/Status Information — The box in the
top right side of the screen displays model number and status information. Examples:
“ALTERNATE SWEEP” is displayed when an
alternate sweep setup has been selected;
“HOLD” is displayed when the instrument is in
the Hold mode.
• S ource F requenc y, Power And Horizo ntal Reso -
lution (graticule) Settings — The three lines
along the bottom of the screen display:
• Signal s ource start/stop f requencies
• Alt ernate sweep st art/stop freq uencies
• Horizontal resolution (Graticule values) of
the displayed traces
• Power output of the signal source
• Detec tor Offsets, if us ed
The 54XXA automatically selects the correct
horizontal resolution and graticule divisions
for optimum display of the selected frequencysweep widt h. In t he alt ernate- setup mode,
the graticule is fixed at ten vertical and horizontal divisions. All frequencies are displayed
in MHz for models 5407 /5409/5411, and in
GHz for all other models. The Signal source
menu selections control the horizontal axis of
the display.
3-3 INITIAL 54XXA CONTROL SETTINGS
When turned on, the control settings for all 54XXA
functions are set to those in effect during the last
usage of the unit. These settings may be reset to the
factory-selected values by using the RESET selection
from the SYSTEM menu. The default settings are
listed in Table A-1 in the Appendix.
3-4 CONTROL KEY FUNCTIONAL
GROUPS
The front panel control keys and knobs are located
in the functional groups listed below and shown in
Figure 3-2 (page 3-6). With the exception of the DA TA
ENTRY group, each control k ey group is used to se t
the operation of a specific set of 54XXA functions.
(The DATA ENTRY keys and knob are used to enter
and modify data for many menu selections.) These
control key groups and associated menus are further
described in the remainder of this section.
• Lower Panel Controls: POWER, INTENSITY, etc.
• DATA ENTRY Key Group
• NETWORK ANALYZER Key Group
• SOURCE Key Group
54XXA OM 3-3
Page 29

POWER-ON SELF TEST AND FRONT PANEL LED ERROR CODES III FRONT PANEL OPERATION
• SYSTEM FUNCTION Key Group
• CURSOR Key Gr oup
• HA RD COPY Key Group
• ENHANCEMENT Key Group
3-4.1 Control Key Operation
Many of the fro nt panel control keys pr oduce setup
menus when pressed. These menus appear at the
right side of the screen display (Figure 3-1). Other
keys, such as AUTOSCALE, SELF TEST, etc.,
perform specific functions directly.
3-4.2 Setup Menu Operation
Setup menu items are selected by using the
MENU Up/Down key to position the cursor next to
the desired menu selection and pressing the SELECT
key. There are three types of menu selection items:
• Those that perform specific functions directly
when selected .
• Those that require data parameter entry before
the ENTER key is pressed.
• Those that produce submenus when selected.
Menu selections may be cancelled (before the ENTER
key is pres sed) by p ressing the CLEAR key.
NOTE
While reading this section, follow along
using the front panel controls and associated menus. R efer to the figur es that describe the menus in each group. The annotation for these figures describe each
menu selection in detail.
3-5 POWER-ON SELF TEST AND FRONT
PANEL LED ERROR CODES
When the 54XXA is turned on, or the SELF TEST key
is depressed, the instrument undergoes a comprehensive self test. If the self te st passe s, the message
“ALL TESTS PASSED” is displayed on the screen and
the “TRACE HOLD” LED flashes briefly.
If the self test fails, an error message is displayed
and one of the control panel LED indicators will
flash steadily . A different LED indicator will flash for
each specific type of fault. The LED indicator fault
detection codes are listed in Table A-2 in the Appendix. This coding makes it possible to locate a fault
even if the CRT or display circuitry has failed.
3-6 WARNING/ERROR MESSAGES
If an unusual condition is detected during instrument operation, a warning or error message will be
displayed in the lower corner of the screen display.
These warning/error messages are listed and described in Table A-3 (in the Appendix). Suggested
remedial action is included for each message.
3-7 REAR PANEL CONNECTORS
The locations of the 54XXA rear panel connectors are
shown in Figure A-1 (in the Appendix). The rear
panel contains the line voltage module, multi-pin
GPIB and printer connectors, and additional BNC
type input/output connectors. Setup of the line
voltage module and connection to the GPIB connector are described in Section II. The characteristics of
the PARALLEL PRINTER INTERFACE, HORIZONTAL
OUTPUT, and optional EXTERNAL ALC INPUT connectors are also described in Figure A-1. The rear
panel also contains a Printer Switch Setting chart
(shown in Table A-5)
3-4 54XXA OM
Page 30
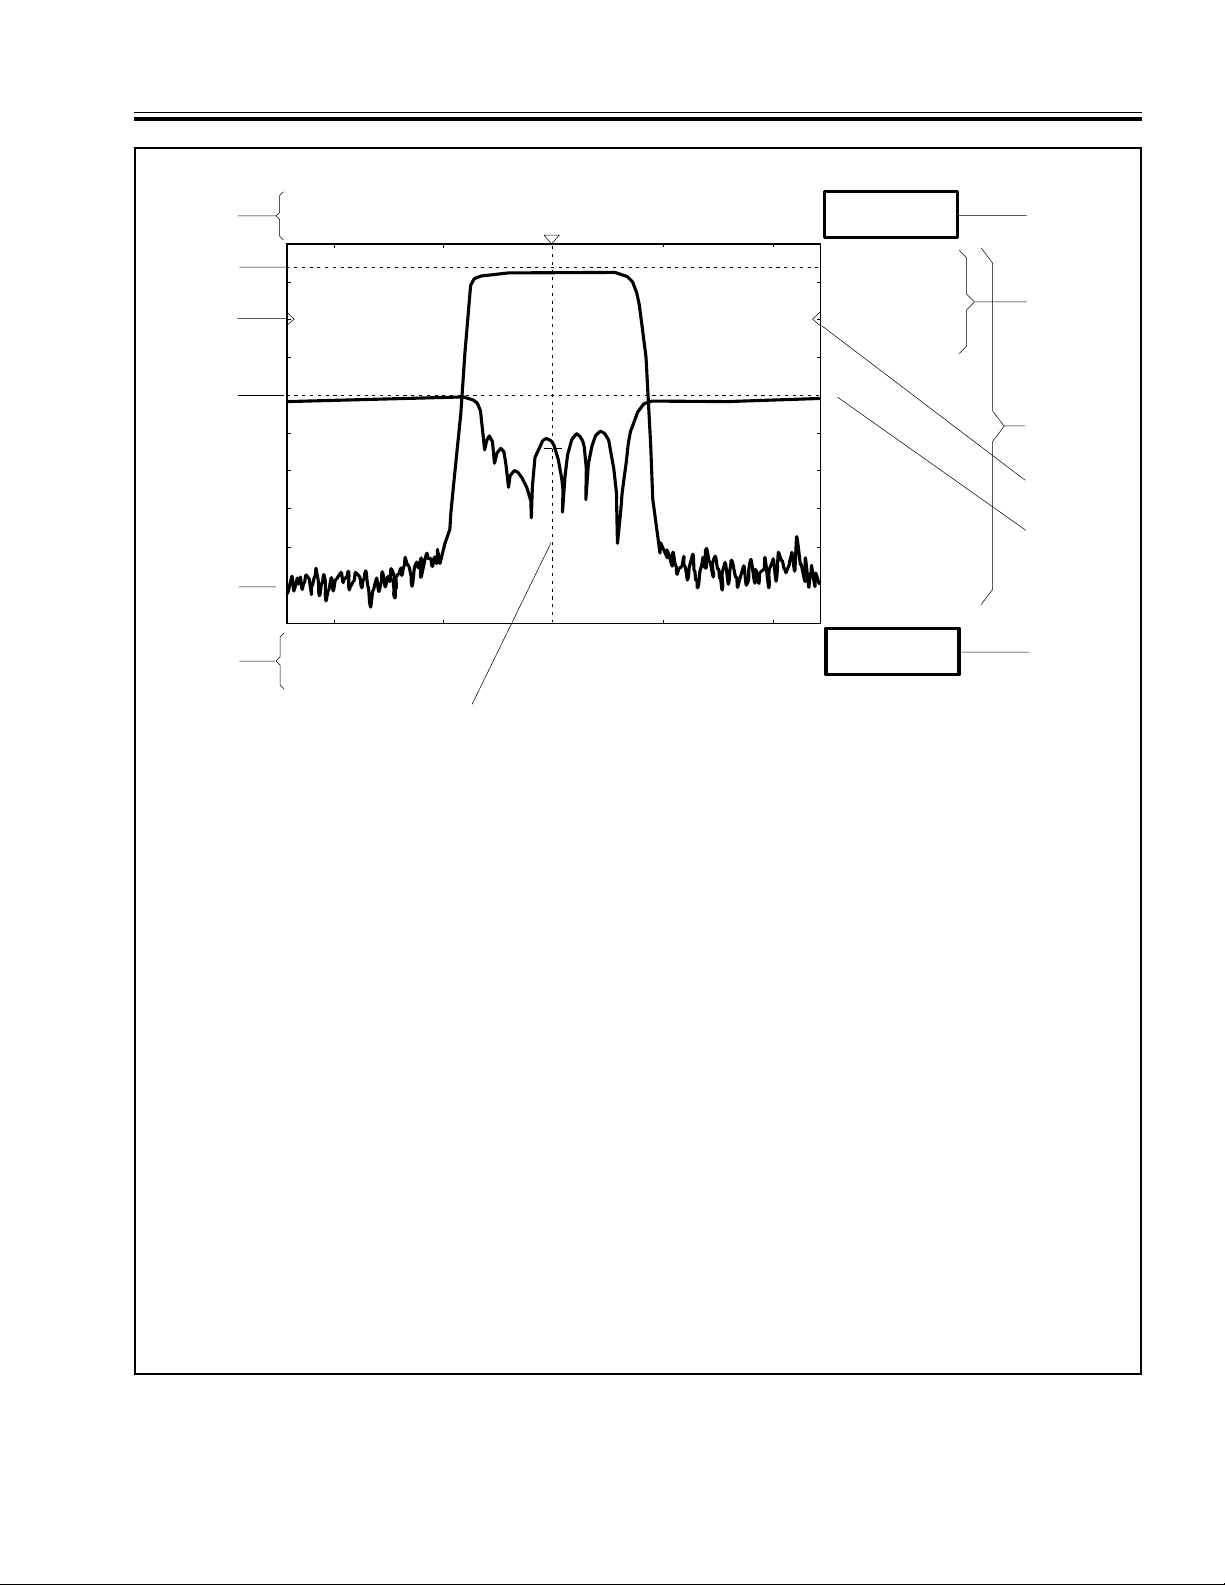
III FRONT PANEL OPERATION REAR PANEL CONNECTORS
1
2: RETN LOSS (B)
1: TRANSM SSN (A)
7.0 dB/ DI V
10.0 dB/DIV
2
3
4
1
5
CENTER: 3. 0000 GHz WIDTH: 1 . 0000 GHz
6
200 MHz/DI V
401 pts LEVEL: +7.0 dBm
7
1. Network Analyzer Setup Parameters: These two
lines display the setup parameters for Channel 1
(and Channel 2, if used).
2. Upper Limit Line: Upper test limit lin e. Menu selectable as c omplex limit lin e (up to 10 segme nts)
or simple str aight l ine.
3. Ref erence Line Indicat or (Chann el 1):
Indicates reference point for all channel 1 amplitude
values. Position of line on display selectable via
menu and Data Entry Knob.
4. Lower Limit Line: Lower test limit line (see 2,
above).
5. Channel 1 Measureme nt Trace: Display of measured values for Channel 1. Number of measurement points di splayed is menu selectable (see below).
6. Frequency Source Setup Parameters:
Top two lines (below graticule) display the frequency setup parameters for the internal frequency
source and screen display. Frequencies are displayed in MHz for models 5407A/5409A/5411A,
and in GHz for all other models. Bo ttom line displays the numb er of mea surem ent poi nts (i.e. , output frequencies) and the source RF output level
currently select ed.
OFFSET -10.0 dB
OFFSET +20.0 dB
5417A
CURSOR
1: -1.63dB
2: -18.76 dB
3.0001GHz
2
PRESS SELECT
FOR
CURSOR MENU
1: -1.63 dB
2: -18.76 d B
7. Cursor Position Indicator: This dotted vertical
line indicat es the curre nt frequenc y location of the
cursor. Cursor position continuously variable via
Data Entry Knob.
8. System Message Display Area: System error/ warning messages are displayed in this area.
As shown, alternate cursor readout may be displayed here also (menu selectable).
9. Channel 2 Measureme nt Trace: Display of measured values for Channel 2.
10. Cursor Readout/Menu Display Area: Cursor
readout values or setup menus are displayed in this
area of the scre en.
11. Ref erence Line Indica tor (C hannel 2):
Indicates reference point for all Channel 2 amplitude values (see 3, above).
12. Cursor Data Readout Display: Readout da ta for
main cursor and/or “relative” cursor (if active) displayed here. Frequencies are displayed in MHz for
models 5407A/5409A/5411A, and in GHz for all
other model s.
13. Sys tem St atus Di splay: System status conditions
displayed here, such as: TRACE HOLD, ALTERNATE SWEEP, etc. Model number is default
display.
13
12
10
11
9
8
Figure 3-1. Typical Model 54XXA Screen Displ ay
54XXA OM 3-5
Page 31
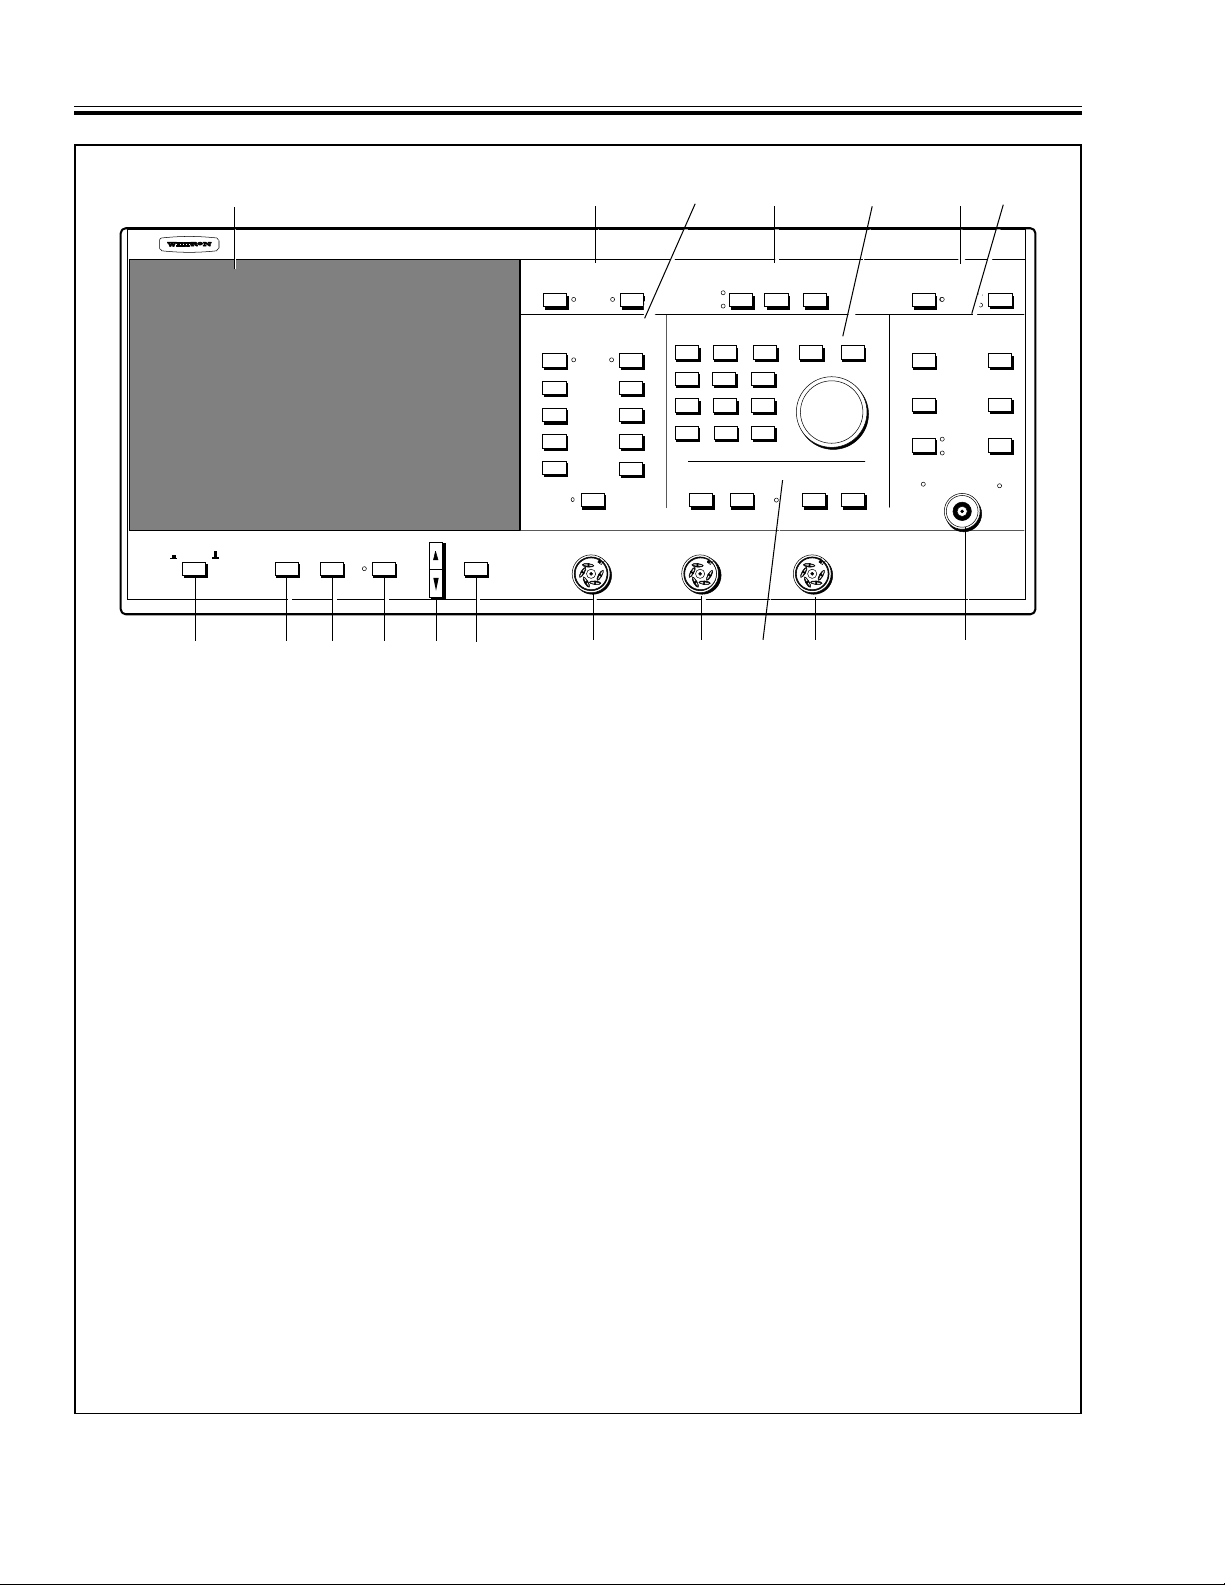
FRONT PANEL CONTROLS AND CONNECTORS III FRONT PANEL OPERATION
18
SCALAR MEASUREMENT SYSTEM
POWER INTENSITY
MENU
1 23456 7 8 911
1. POWER ON/OFF: When pressed to ON, power is
applied to t he ins trument and a self test is initia ted.
2. INTENSIT Y: Displays menu that allo ws adjustment
screen display an d graticule intensity.
3. GRA TICULE ON/OFF: T urns the display graticule on
and off. Tick marks showing w he re th e gr a tic ule lin es
would be are displayed when the graticule is off.
4. TRACE HOLD Key and Indicator: Freezes the
measured data, which can then be manipulated as
desired. Indica tor is lit w henever dat a is frozen .
5. MENU Up and Down Keys: Moves the menu cursor
up or down t o indi cate m enu opti ons on the CRT.
6. SELECT: Implements the menu option selected by
the menu cur sor.
7. R INPUT Connector: Input for measurement channel R (This connec tor suppl ied with Optio n 05.)
8. A INPUT Connector: Input for measurement channel A.
9. B INPUT Connector: Input for measurement channel B.
17
CURSOR
NETWORK ANALYZER DATA ENTRY SOURCE
1
CHANNEL
2
INPUT R INPUT A INPUT B
16 15 14 13
MODEL 5417A 10 MHz to 8.4 GHz
HARD COPY ENHANCEMENT
SYSTEM FUNCTIONS
RF OUTPUT
50 Ω
10
save/recall front panel setu ps, return the i nstrument
to local operat ion, etc. REMOTE indic ator is lit when
the analyzer is in the GPIB mode .
12. SOURCE Keys: Keys and menus control sweep frequency param eters and set up fr equenc y ma rke rs fo r
screen display. Key functions turn RF output on/off
and select i nternal /extern al lev eling.
13. ENHANCEMENT Keys and Indicators: Allows set
up of data averagin g and smooth ing param eters.
14. DATA ENTRY Keys and Knob: Used to enter/
change numerical data in setup menus. When cursor
is on, knob contr ols positi on of cursor.
15. HARD COPY Keys: In itiate s a ha rd-c opy pr int out of
measurement results to a printer or plotter in either
graphic or tabular form. The MENU key displays a
menu showing th e availabl e print and plo t options.
16. NETWORK ANALYZER Keys and Indicators: Key
functions and men us con tr o l netw o rk an al yz er me as urement and display functions: set measurement type
for each measurement trace, turn traces on/off, adjust
display scaling and offset, set measurement limit
lines, etc.
12
10. RF OUTPUT Connector: RF output of the frequency
source.
17. CURSOR keys and Indicators: Keys and menus
control selection and function of the main cursor and
relative curso r on the disp lay.
11. SYSTEM FUNCTION Keys and Indicator: Key
functions and menus control overall system operations: restor e front pa nel control s to facto ry selected
settings, set the number of measurement data points,
18. CRT: Displays measurement results for selected display channel(s). Displays control and calibration
setup menus as sel ecte d by fr ont pane l cont rol k eys.
Figure 3-2. 54XXA Series Scalar Measurement System Front Panel Controls and Connectors
3-6 54XXA OM
Page 32
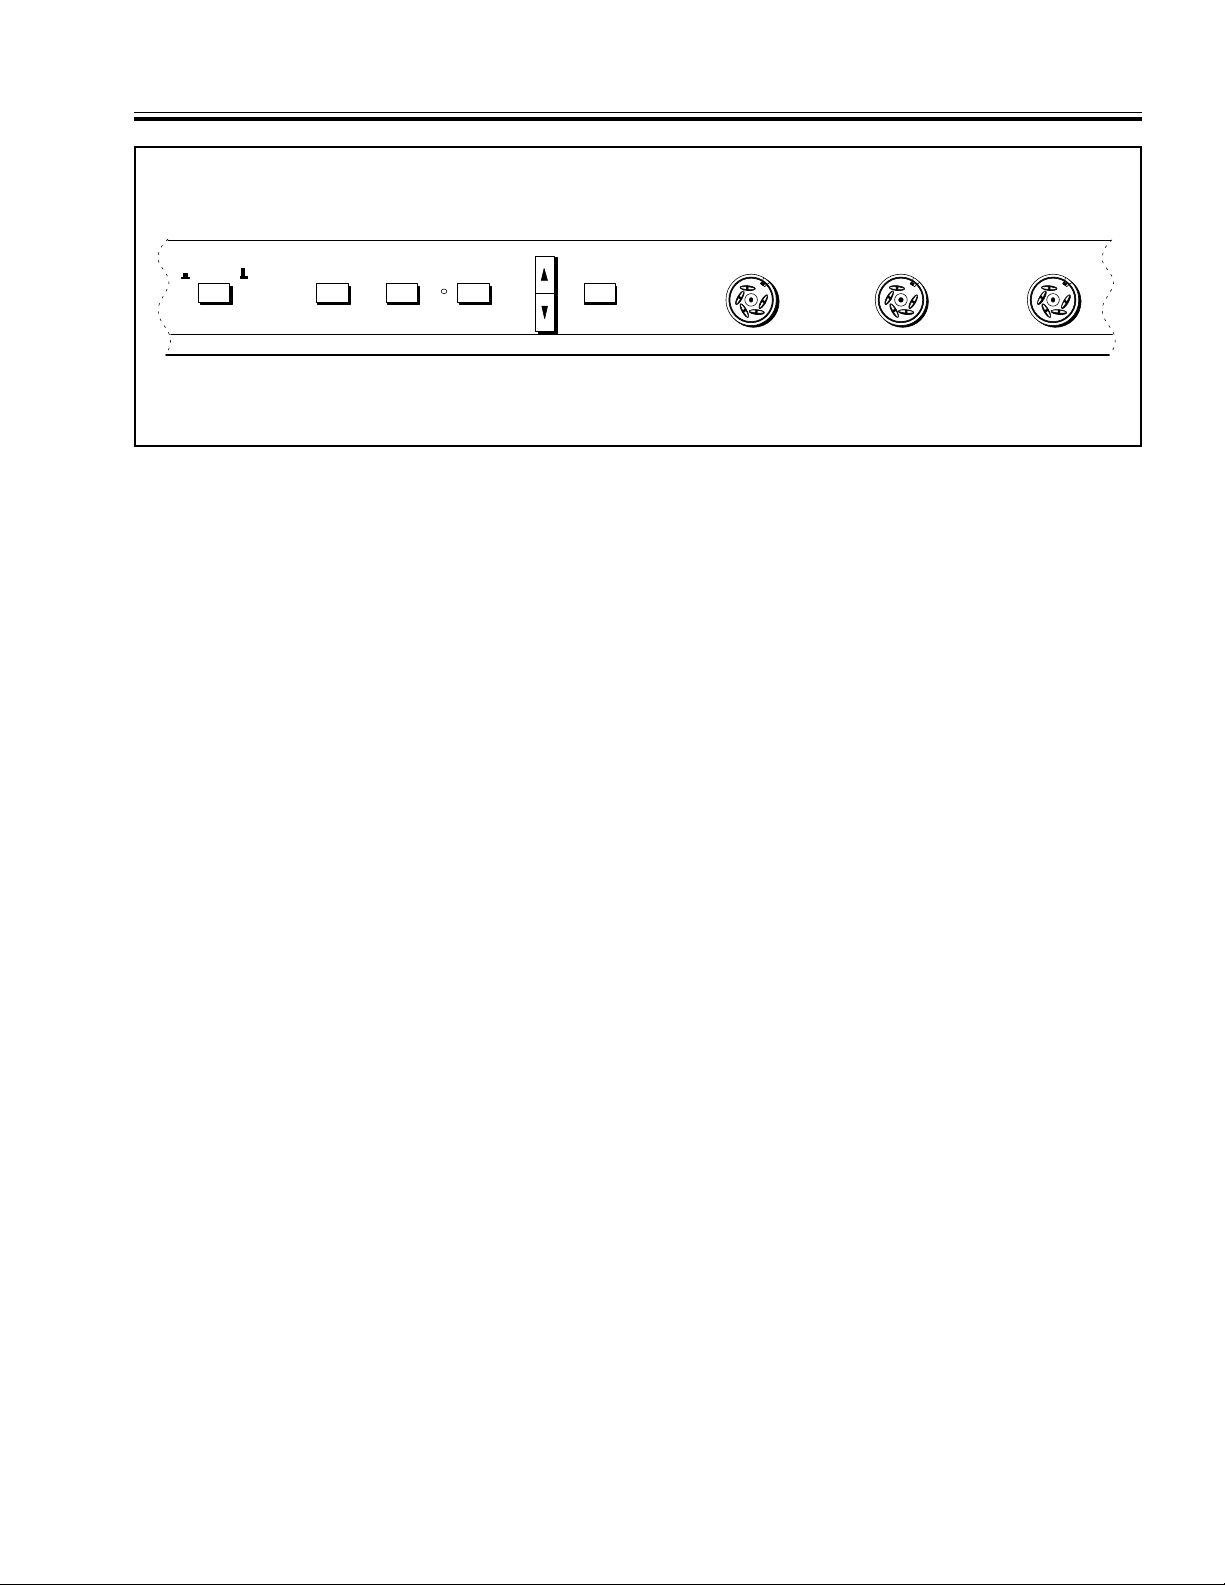
III FRONT PANEL OPERATION LOWER PANEL CONTROLS AND CONNECTORS
POWER
INTENSITY
GRATICULE
ON/OFF SELECT
TRACE
HOLD
Figure 3-3. Lower Panel Controls and Connectors
MENU
3-8 LOWER PANEL CONTROLS AND
CONNECTORS
The lower panel control keys and connectors (Figure 3-3) perform the following functions:
• Turn the instrument on and off.
• Control t he screen display intensity.
• Control t he screen display graticule.
• Freeze the display data (stop measurement).
• Allow the user to move the menu cursor and select
desired menu items .
• Provide input connection to the signal processing,
switching, and display circuitry of the 54XXA via
the three input signal connectors, INPUT A, IN-
PUT B and INPUT R.
INPUT R INPUT A INPUT B
3-8.3 GRATICULE ON/OFF Pushbutton
Turns the screen display graticule on and off. When
off, tick lines are displayed in the margins to show
the location of the graticule markings.
3-8.4 TRACE HOLD Key
Freezes the measurement data, which can then be
manipulated:
(1) by adding or changing limit or marker values, or
(2) by changing offset or resolution values.
Indicator is lit while the data is frozen, which occurs
when the TRACE HOLD or (HARD COPY) START
keys are activated.
3-8.5 MENU Up /Down Key
Moves the menu cursor up or down to indicate the
3-8.1 POWER ON/ O FF Pushbutton
menu item that can be selected. These keys are
active whenever any menu is displayed.
This latching pushbutton turns the instrument on
and off. When pressed ON, it applies power to the
unit and initiates a self test. The self test function
is described in paragraph 3-12.5 (SELF TEST Key).
3-8.6 SELECT Key
When pressed, sele cts the menu item ad jac ent to t he
menu cursor. (This key is used in conjunction with
3-8.2 INTENSITY Control Pushbutton
Displays the intensity control menu on the screen;
see Figure 3-24 (page 3-35). The selections from this
menu enable the user to adjust the CRT and/or
graticule display intensity using either the data entry knob or the ke ypad.
the MENU up/down key.)
3-8.7 INPUT A Connector
The signal applied to this connector is processed
according to the setup menu selections chosen by the
user. The resulting signal may then be displayed on
54XXA OM 3-7
Page 33
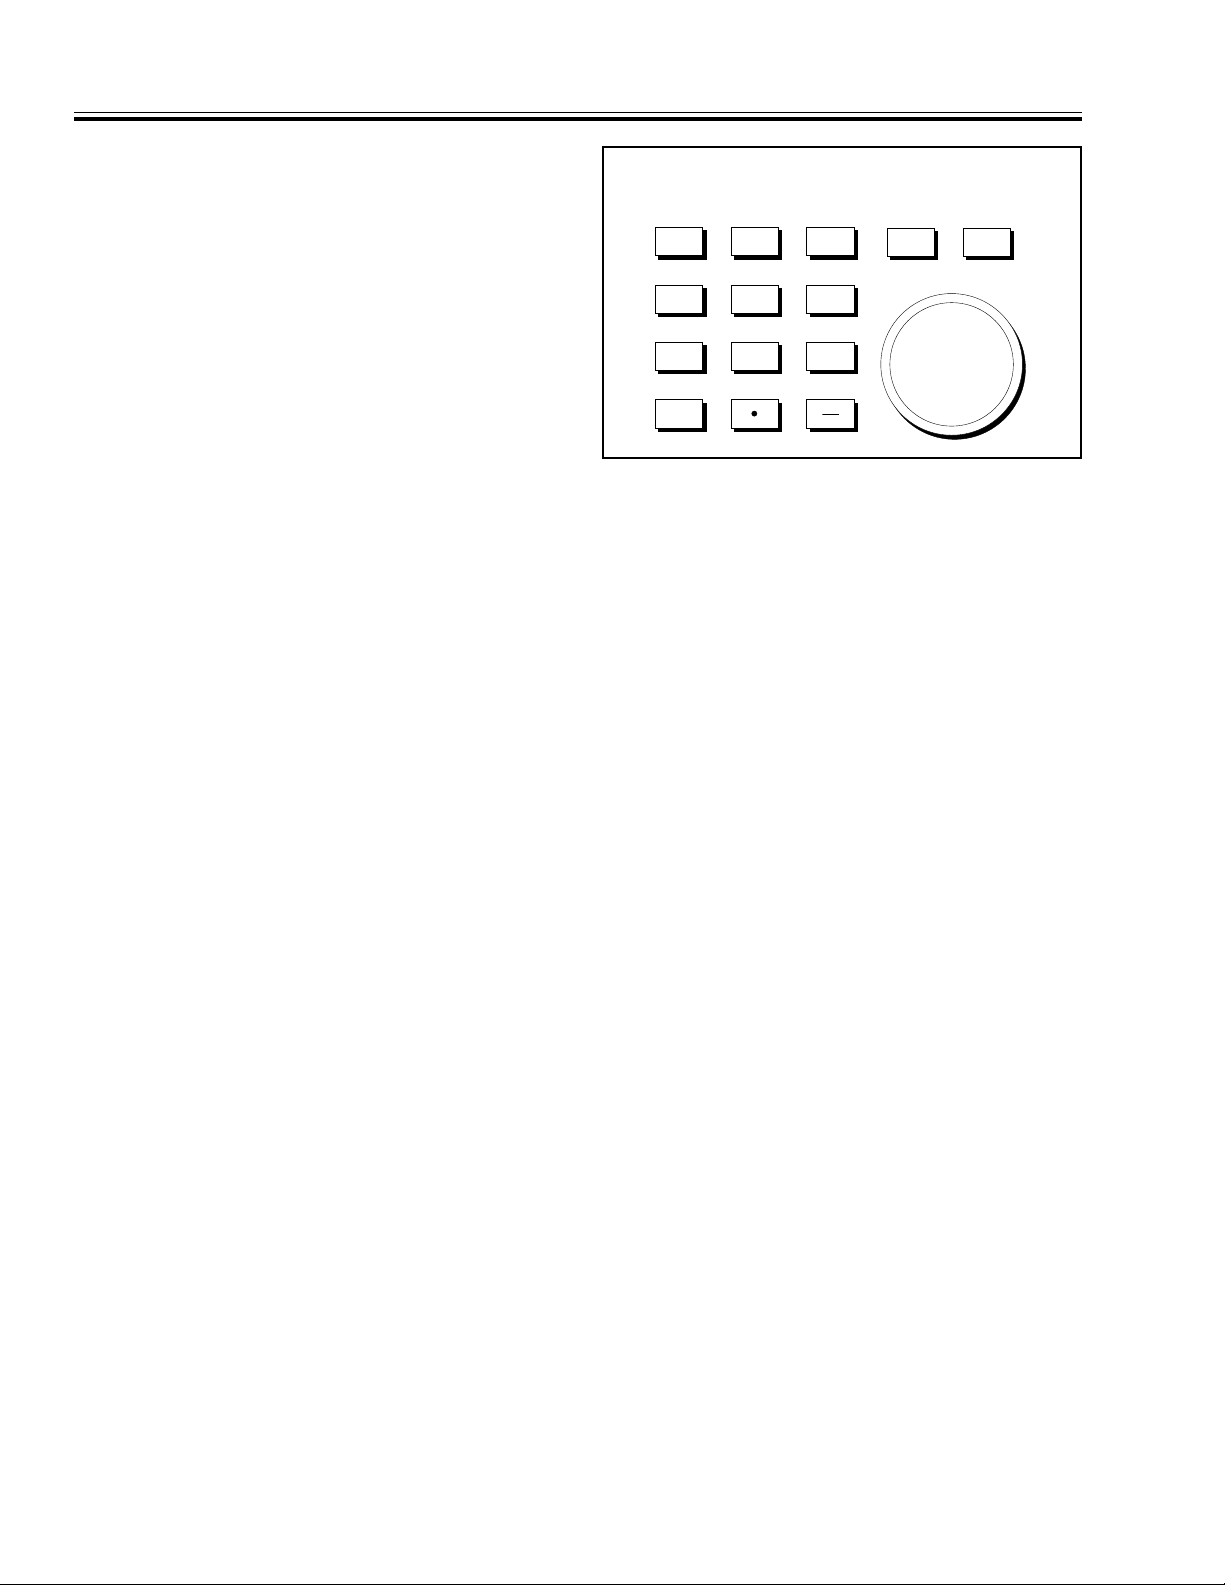
DATA ENTRY KEY GROUP III FRONT PANEL OPERATION
either display trace (Channel 1) or (Channel 2) under menu control. The software default measurement mode displays the INPUT A signal as a transmission type measurement displayed on Channel 1.
3-8.8 INPUT B Connector
Second input signal connector. The signal applied to
this input is processed and displayed in the same
manner as for the INPUT A signal, according to the
setup menu selections chosen by the user. The software default measurement mode displays the B Input signal as a reflection type measurement displayed on Channel 2.
3-8.9 INPUT R Connector
The third (optional) input signal connector is similar
to inputs A and B. It can be used for ratio type
measurements, wh ere the processed INPUT R signal
is logarithmically subtracted from either the
INPUT A signal (Ratio A/R measurement), or
INPUT B signal (Ratio B/R measurement). These
measurement functions are set up via me nu selection.
DATA ENTRY
ENTER
7 8 9
654
123
0
Figure 3-4. DATA ENTRY Keys and Knob
3-9 DATA ENTRY KEY GROUP
The DATA ENTRY keys and data entry knob (Fig-
ure 3-4) are used to ente r data into the set up menu
selections. The units associated with the entered
data are determined by the menu displayed during
entry and by the model: levels in dB (or dBr) for all
models, frequency in MHz for models 5407A, 5409A
and 5411A, and in GHz for all other models. Units
are not entered wit h data.
CLEAR
NOTE
The input signals applied to the front
panel input connectors are typically output signals from SWR Autotesters and detectors. These signals are low-level, lowfrequency signals with dc components.
Refer to Section IV — Measurement and
Calibration Procedures for information
about typical measurement setups and
usage.
3-9.1 Data Entry Keypad
This keypad consists of keys 0–9, “.” and “–”. Thes e
keys are used with the setup menus to enter required operational parameters.
3-9.2 Data Entry Knob
Changes the values of an active parameter during
menu entry (curso r position , offset, reso lution, etc.).
Fast knob movement changes the data in large increments, slow movement allows f ine changes to be
made.
3-9.3 ENTER Key
Term inates t he data en try sequen ce. When pr essed,
data entered via the ke ypad or the data entry kn ob
are input to the 54XXA control logic. This key is also
used for other functions, when so specified by a
menu function.
3-9.4 CLEAR Key
Clears entered value, if pressed before the ENTRY
key. Also clears a disp laye d menu, entr y erro rs, complex limit segment identifiers, and CURSOR NOT
FOUND message.
3-8 54XXA OM
Page 34
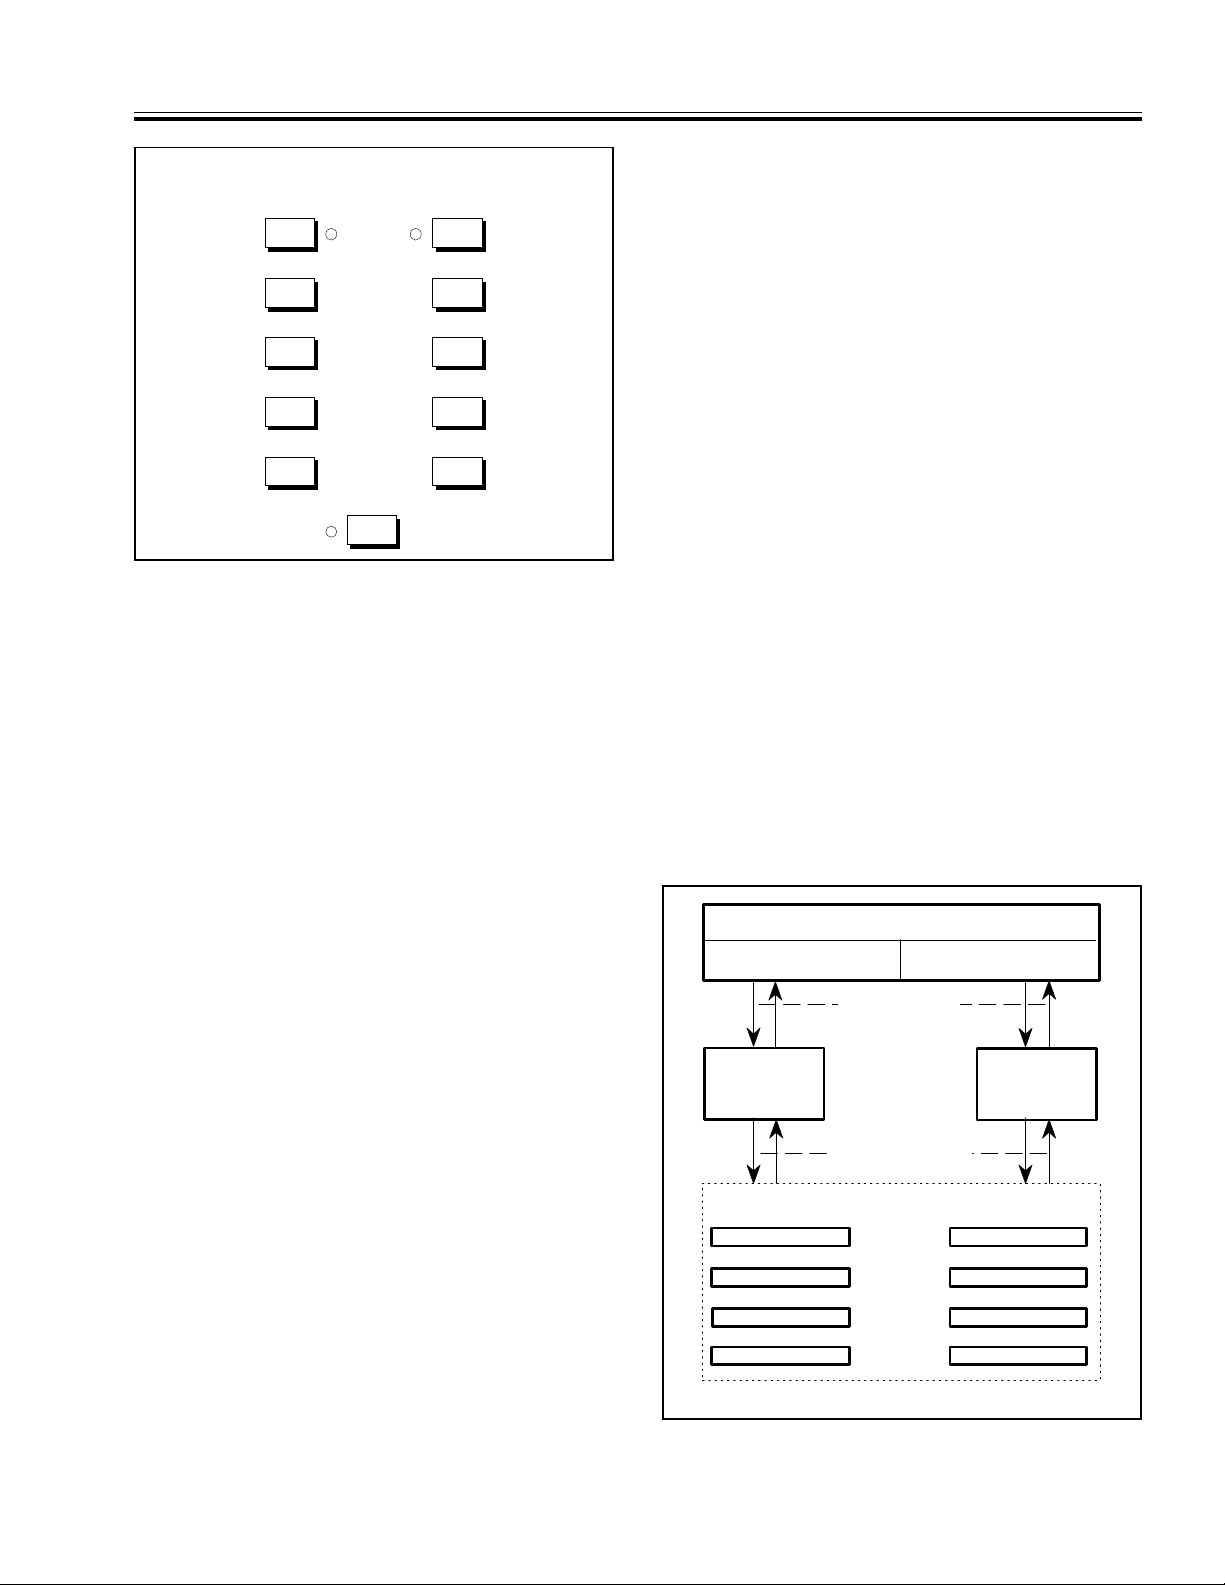
LOC 1
LOC 2
LOC 3
LOC 4
TRACE MEMORY STORAGE**
SCREEN DISPLAY
CHANNEL 1
* Volatile Memory ** Non-Volatile Memory
SAVE/RECALL
MENU OPERATIONS
ACTIVE*
TRACE
MEMORY 1
ACTIVE*
TRACE
MEMORY 2
ANALYZER
TRACE
MEMORY MENU
OPERATIONS
CHANNEL 2
III FRONT PANEL OPERATION NETWORK ANALYZER KEY GROUP AND MENUS
NETWORK ANALYZER
1 CHANNEL 2
UNCAL
Figure 3-5. NETWORK ANALYZER Key Group
3-10 NETWORK ANALYZER KEY GROUP
AND MENUS
This key group consists of two sets of similar control
keys (Figure 3-5). One set controls measurement
trace 1 and the other controls measurement trace 2.
The front panel designations for the two measurement traces are Channel l and Channel 2, respectively. The corresponding key functions for
Channel 1 and Channel 2 are identical. The setup
menus invoked by the keys in this key group are
shown in Figure 3-18 (behind Operating Menus tab).
DISPLAY
ON/OFF
OFFSET/
RESOLUTION
AUTOSCALE
LIMITS
MENU
CALIBRATION
3-10.3 AUTOSCALE Key
Sets the screen display for the designated measurement trace at optimum offset and resolution values
for viewing the measured data.
3-10.4 LIMITS Key and Menus
Measurement limits are displa yed as lim it lines on the
screen display. Limit lines may be made up of either a
single line, or multiple lines (complex). Selection of
complex limits allow up to ten different limit values
(limit line seg ments) to be spec ified across the meas urement frequency span (for upper and lower limits.)
The LI MITS key displays a menu (Figure 3-18) that
enables/disables testing to limits for the selected measurement trace. Selections from this menu display submenus that further define the limit para meters.
3-10.5 MENU Key and Menus
Displays a me nu (Figure 3 -18) that allows the typ e of
measurement to be specified for the associated measurement trace. Submenus to this menu allow definition of input connector, type of measurement display,
and (display) trace memory usage.
The TRACE MEMORY and TRACE MEMORY
STORAGE submenus allow two sets of measurement
trace data to be stored to “active” trace memory
(Figure 3-6). There is one memory for each display
3-10.1 DISPLAY ON / O FF Key and Indicator
This key turns on the designated measurement trace
(Channel 1 or 2), the reference line indicator, and the
limit lines (if used) that are associated with this
trace. The LED that is adjacent t o the DISP LAY key
is lit when the trace is on (Figure 3-5).
When both channels are off, the unit is in the CW
Mode. In this mode, the internal signal source may
be used independently; refer to paragraph 3-11.
3-10.2 OFFSET/RESOLUTION Key and Menus
Displays a menu (Figure 3-18) that allows OFFSET
and RESOLUTION (display scaling) values t o be sp ec i-
fied for the associated measurement trace. In the normal measurement mode with the cursor displayed on
screen, pressing the SELECT key causes the trace at
the cursor to move to the reference line.
54XXA OM 3-9
Figure 3-6. Trace Memo ry Storage Locati ons
Page 35
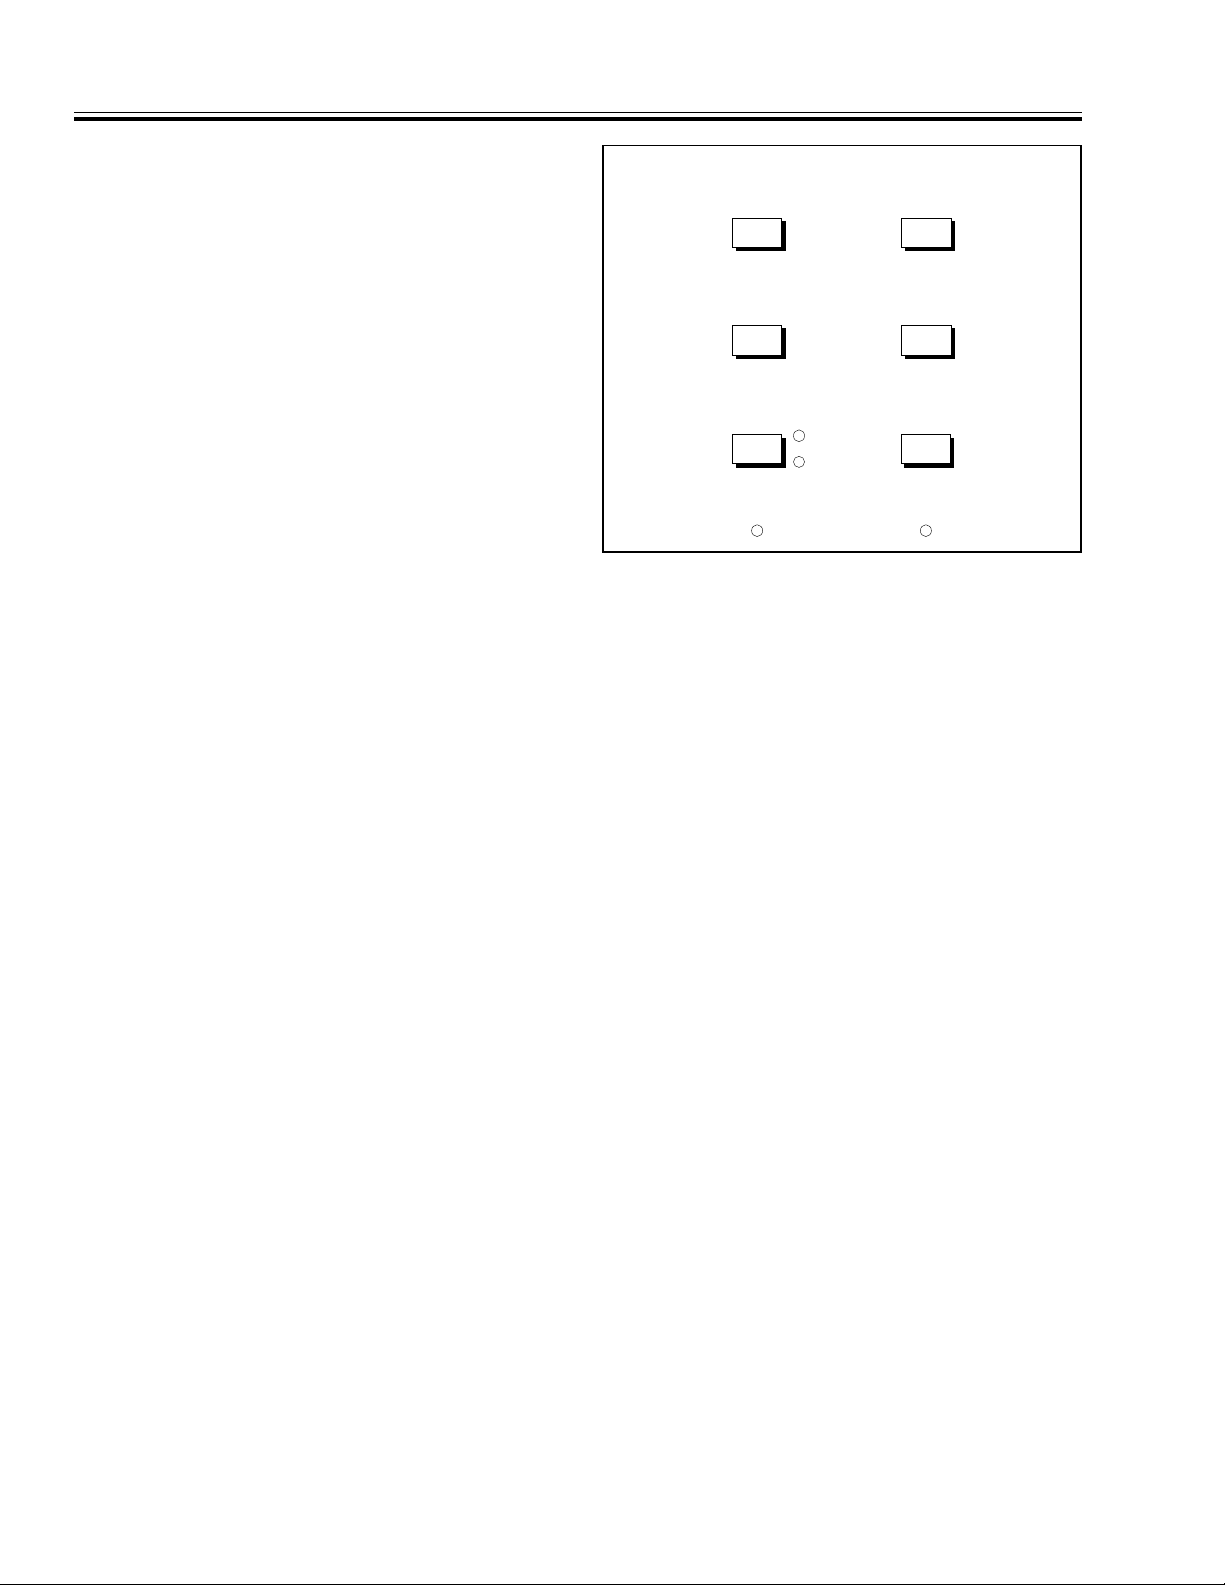
SOURCE
INTERNAL
EXTERNAL
FREQUENCY
MARKERS
ALTERNATE
SWEEP
OUTPUT
POWER
LEVELING RF ON /OF F
RF OFFUNLEVELED
SOURCE KEY GROUP AND MENUS III FRONT PANEL OPERATION
channel. Active trace memory is volatile; the stored
data is lost when the 54XXA is powered down.
The trace data stored in active memory may contain
simple or complex limit line data. T his data may be
subtracted from subsequent measurement trace
data; see TRACE MEMORY submenu shown in Fig-
ure 3-18.
NOTE
To store measurement trace data to
non-volatile trace memory locations (Figure 3-6) and to retrieve trace data previously stored in these memories, use the
SAVE/RECALL key and menu functions,
which are described in paragraph 3-12.2.
Figure 3-7. SOURCE Keys and Indicators
3-10.6 CALIBRATION Key and Menus
3-11 S OURCE KEY GROUP AND MENUS
This key displays a series o f menus that guide the
user through the calibration procedure that is
appropriate to the current test se tup. “Calibration”
is an equipment normalization procedure that
should be performed whenever the measurement
This key group consists of the keys and indicator
LEDs shown in Figure 3-7. The menus associated
with these keys are shown in Figure 3-19 (located
behind Operating Menus tab).
type or the test setup is changed (or as required
periodically). Refer to Section IV — Measurement
and Calibration Procedures — for an explanation of
The two operating modes of the 54XXA internal
signal source are:
the CALIBRATION key menus and pr ocedures.
• Normal M ode — when either measurement chan-
NOTE
Service type calibration procedures are
described in the 54XXA Scalar Measurement System Maintenance Manual.
nel is turned on.
• CW Mode — when both measurement channels
are turned off. The sou rce operating frequen cy in
this mode is either the START frequency, or, for
CENTER/WIDTH mode:
3-10.7 UNCAL Indicat or
This LED indicator is lit when either measurement
channel requires re-calibration. This is usually due
to a significant change of the front panel control
settings for the signal source or either measurement
channel.
3-10 54XXA OM
Frequency = CENTER freq – 1/2 WIDTH freq.
3-11.1 FREQUENCY Key and Menu
Displays one of two menus that allow the user to
enter the operating frequency parameters for the
signal source (Figure 3-19). The first menu pertains
to the Start/Stop Frequency mode of operation; the
other pertains to the Ce nter F req uenc y/Width mode.
All frequencies displayed by these menus are in MHz
for models 5407A, 5409A, and 5411A, they are displayed in GHz for all other models. Each menu may
be accessed from the other.
Page 36

III FRONT PANEL OPERATION SOURCE KEY GROUP AND MENUS
3-11.2 ALTERNATE SWEEP Key and Menus
Selects Alternate Sweep mode and displays one of
two menus (Figure 3-19) that allow the user to enter
the operating frequency parameters for the main
and alternate sweeps. In this mode, the main swee p
parameters apply to display Channel 1 and the alternate sweep parameters apply to Channel 2. Similar to the FREQUENCY key menus, the first menu
pertains to the Start/Stop mode of operation; the
second to the Ce nter F requenc y/Width mode .
3-11.3 MARKERS Key and Menu
Displays one of two marker frequency input/data
readout menus (Figure 3-19). The SELECT key allows toggling between the menu for MARKERS 1–4
or MARKERS 5–8. Each menu allows the frequency
for each of the four markers to be specified and
displays the data readout for bot h channels at the
marker frequencies selected. The selectable fre-
quency range is –999 to +999 MHz for models 5407A,
5409A and 5411A and –999 to +999 GHz for all other
models. The marker selected for data entry is referred to as the “Active Marker.”
NOTE
Negative frequency units (example:
–1.500 GHz) may be used when unit is
operated in the Frequency Scaling Mode.
(Refer to paragraph 3-12.1(f) for information about this mode of operatio n.)
NOTE
When frequency markers coincide with
displayed graticule lines, the resultant
vertical line approximates a solid line.
3-11.4 OUTPUT POWER Key
Allows the RF output level (power) of the signal
source to be set (Figure 3-19). The data entry keys
or the data entry knob may be used to enter the
desired power level. The screen display “LEVEL”
indicator is highlighted to show the new value.
3-11.5 RF ON / OFF Ke y and Indi cator
This key turns the signal source RF output power on
or off. The RF OFF indicator is lit when the output
power is off.
3-11.6 LEVELING Key and Indicators
This key connects the internal RF output power lev eling circuits to either the internal RF output detector signal or the external detector output signal from
the rear panel EXTERNAL ALC INPUT. The INTER-
NAL and EXTERNAL LEDs indicate the detector se-
lected. The UNLEVELED LED is lit whenever the
source RF output is unleveled. This condition is usually caused by insufficient signal applied to the EX-
TERNAL ALC INPUT.
CAUTION
Frequency markers are displayed on the measurement screen as dashed vertical lines with an identifying number at t he bo tt om of t he s cr ee n (s ee Fi gu re
3-14). The currently selected marker (Active
Marker) is displayed with a box around the marker
number . This marker may be toggled off/on by selecting the marker menu and pressing the SELECT key.
54XXA OM 3-11
Depending on the application, excessive
source RF output power may be produced
with no input connected to the EXTERNAL
ALC INPUT. Damage to sensitive test devices or sensitive test components may
result. Always setup for this mode of operation with the source output off.
Page 37
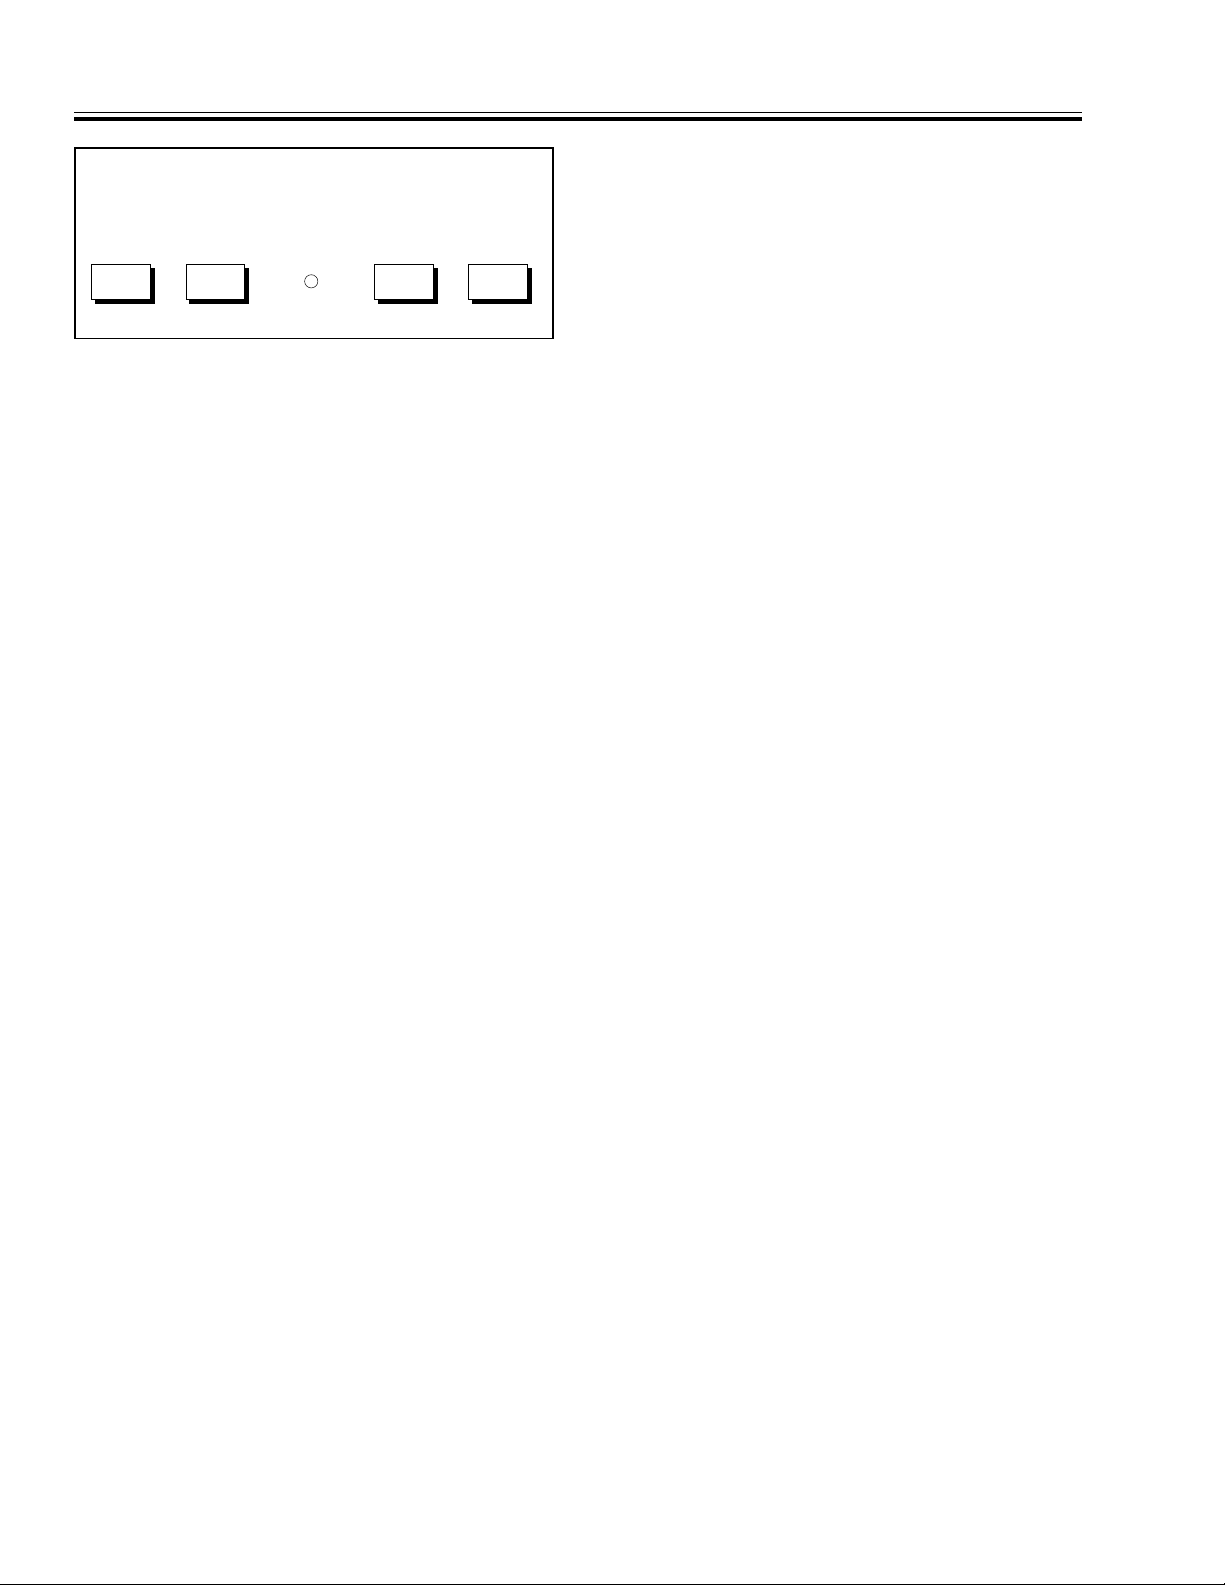
SYSTEM FUNCTION KEY GROUP AND MENUS III FRONT PANEL OPERATION
cure” operating mode. In this mode of operation,
all signal source frequency information is re-
SYSTEM
MENU
SYSTEM FUNCTIONS
SAVE/
RECALL
REMOTE
RETURN
TO LOCAL
SELF
TEST
moved from the screen display (including cursor,
marker, and limits readouts and menu displays).
Likewise, all hard-copy output produced while in
this mode will not contain frequency information. It is not possible to change signal source
operating frequency parameters, or any other
Figure 3-8. SYSTEM FUNCTIONS Key Group
frequency parameters, while in this operating
mode.
3-12 S YSTEM FUNCTION KEY GROUP
AND MENUS
This key group consists of the keys and indicator
LED shown in Figure 3-8. The main menus and
submenus associated with these keys are described
below and in Figures 3-20 and 3-21 (located behind
Operating Menus tab).
The secure operating mode may be cancelled using the RESET menu selection from the SYSTEM
menu, or, by selecting a saved front panel setup
that does not contain this operating mode. When
invoked from the secure mode, the RESET function will not save Cal Data, Markers or Limits
information. However, the secure operating
mode may be saved as part of a front-panel setup
through power-down and self-test.
3-12.1 SYSTEM MENU Key and Menus
d. Configure Analyzer – Displays a submenu
Displays the menu shown in Figure 3-20. Submenus
from this menu perform the following functions:
that allows control of the following functions of
the network analyzer portion of the 54X XA:
• Reset the 54XXA to factory -selected initial front
panel control settings.
• S et the configuration of the frequency source and
network analyzer portions of the 54XXA.
• S elect testing modes f or different applications.
The submenus selected from the main menu enable
the user to control the system configuration and
measurement functions listed below:
a. M easurement Data Points – Sets the num-
ber of measurement Data Points to 51, 101, 201,
or 401. (This also sets the number of frequencies
output by the internal signal source for each
measurement trace.)
b. Controls Reset Function – Resets the 54XXA
front panel control settings to factory-selected
values. Previously saved Calibration, Frequency
Marker and Limits data may be selectively retained through the reset function via selections
from the RESET submenu (Figure 3-20).
This reset function does not clear any detector
offsets in effect. To clear detector offsets, press
the CALIBRATION key and select DETECTOR
OFFSETS from the menu; then enter a zero
offset value. (Refer to Section IV — Measurement and Calibration Procedures.)
c. Configure Source – This selection displays a
submenu that allows the user to sele ct the “Se-
• Selection of the measurement channel(s)
affected by the TRACE HOLD key.
• Cause Cursor readout data to be displayed
continuously in the lower right portion of the
screen. The cursor readout d ata displayed is
identical to that displayed by the CURSOR
key data readout function (when invoked).
This readout will not be present if an Error/Warning mes sage is displayed.
• Sele ct measurement channels affected by the
data smoothing function (refer to SMOOTH-
ING key menus, Figure 3-24). Channel 1 or 2,
or both, may be selected.
e. Plotter Address – Displays a submenu that
allows the user to s et the GPIB address for the
external plotter (Figure 3-20).
f. System Applications – These menu selections
allow the user to control the following measurement applications functions listed below. Each is
controlled by a separate submenu (Figure 3-20).
• Select trace search functions. These functions
find and hold maximum/minimum trace values for measur ement.
• Perform amplifier gain compression tests.
This mode of operation automatically steps
the signal source power output and halts
when gain compression (or pre-selected out-
3-12 54XXA OM
Page 38

III FRONT PANEL OPERATION SYSTEM FUNCTION KEY GROUP AND MENUS
put level) is reached. Limits are used to detect
the required compression level.
• Select titling and labeling functions. These
utility functions allow the measurement
display titles and labeling to be changed.
• Control the color attributes of an external
VGA monitor (if used). The attributes of the
display Text, Channel 1/C hannel 2 traces,
and Graticule may be set individually.
• Set up and invoke the Frequency Scaling
function. This function causes the 54XXA to
display operating frequency values that are
“scaled” from those actually output by the
frequency source (see example below). These
scaled values are also us ed for hard copy output. The relationship between the actual output frequency (Int Freq) and that displayed
(User Freq) is as follows:
User
Freq
=
Int Freq
×
m
+
d
f
Where:
m = Frequency M ultiplier, an integer
value, range 1 – 10;
d = Frequency Divisor, an integer
value, range 1 – 10;
f = Freque ncy Offs et val ue,
range: ±9999.99 MHz for
models 5407A/ 5409A/5411A
and ±99.9999 GHz for all
other models.
EXAMPLE:
m = 10, d = 2, and f = 40 will cause
model 5428A to display 80 to 102 GHz
with a true output of 8 to 12.4 GHz.
• Set Autozero function on or off. The OFF se-
lection holds the autozero circuit correction
voltage of each active measurement channel
at the current value and causes the frequency
source output to be on continuously . This function is useful for testing devices that require
continuous stimulus during test.
3-12.2 SAVE/RECALL Key and Menus
Displays the main SAVE/RECALL menu shown in
Figure 3-21. Submenus from this menu control the
trace memory/setup data store/retrieve functions
listed below . All memory storage locations associated
with the SAVE/RECALL key are non-volatile mem-
ory. Data stored in these locations is saved throughout power-down and st artup cycl es.
• S ave or recall up to nine front panel setups to or
from memory locations 1 through 9.
• Save or recall a calibration setup and associated
measurement dat a to or from trace memo ry storage locations 1 through 4.
• Set up titles for the saved setup/calibration data
that may include date and identification information. This allows the saved setups to be recalled
by title.
• P review s aved calibration and/or se tup data prior
to use.
• Save or recall up to four sets of trace memory data
for each display channel (Figure 3-6, page 3-9).
The saved measurement trace data may include
simple or complex limit line information.
NOTE
There are two additional “active”
trace memories that are accessed via
the menus from the (NETWORK ANA-
LYZER) MENU key. Refer to paragraph 3-10 and Figure 3-6.
• Configure SAVE/ RECALL key for “Single Button
Recall” mode of operation (Figure 3-21). Once
this operating mode has been set up, any previously-saved front panel setup (or calibration/front panel setup, or trace memory data
store) can be recalled by pressing the SAVE/ RE-
CALL key and the keypad number that corresponds to the desired setup.
All other front panel functions (cursor readout,
data entry, etc.) perform normally while this operating mode is active, and all front panel functions are usable with any recalled setup. (Single
Button Recall is temporarily suspended until the
regular front panel operation is completed.)
The “RECALL ONL Y MODE” message is displayed
in the System Status Display box in the upper
right portion of the screen wh enever this operat ing mode is active. This o perating mode remains
active until cancelled. It can be cancelled by using
the SAVE / R ECALL MODE selection from the Re-
call Mode Setup menu or by using the RESET
menu selection from the SYSTEM menu.
Submenus invoked from the main SAVE/RECALL
key menu set up the operations described above. The
selection parameters for these submenus are described in Figure 3-21.
54XXA OM 3-13
Page 39
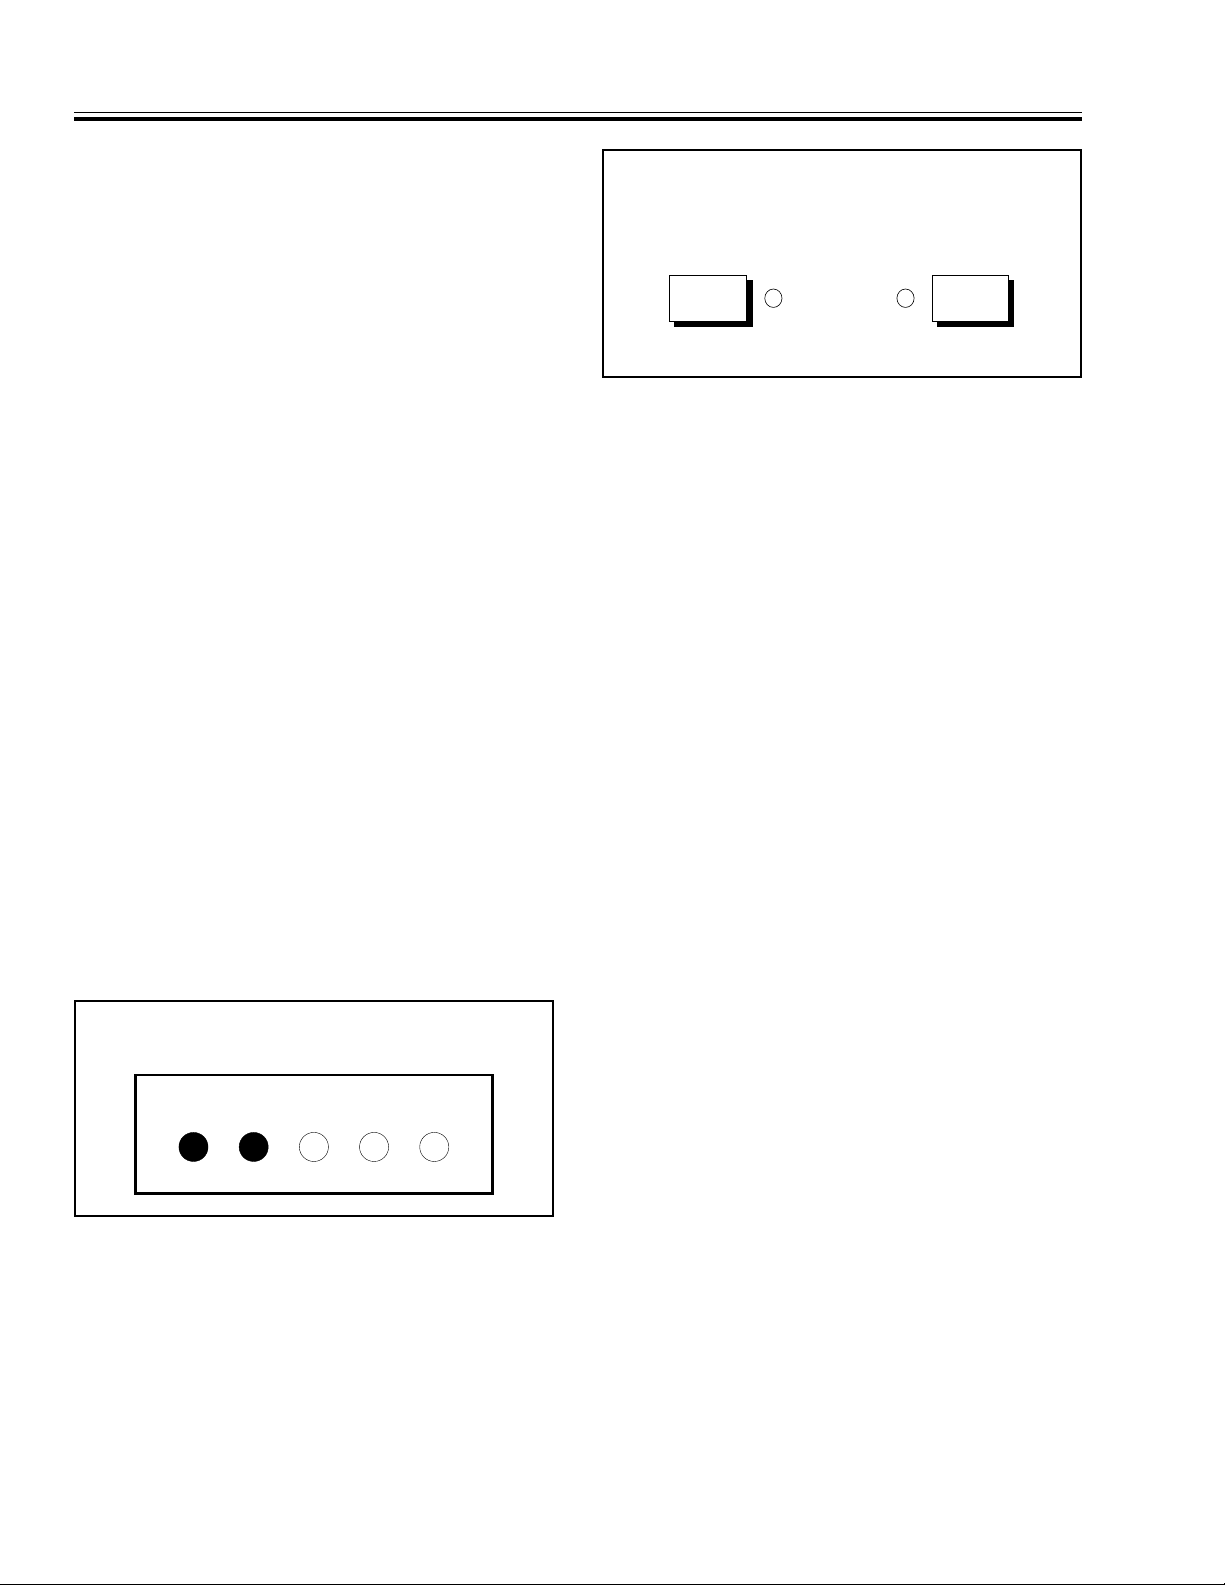
CURSOR FUNCTION KEYS, INDICATORS AND MENUS III FRONT PANEL OPERATION
3-12.3 REMOTE Indicator
This LED is lit when the 54XXA is in the remote
(GPIB) mode. In this mode, the GPIB status is als o
displayed on the screen as shown in Figure 3-9. The
CURSOR
RELATIVEON/OFF
acronyms used are: R (Remote), T (Talk), L (Listen),
S (SRQ), and LL (Local Lockout).
3-12.4 RETURN TO LOCAL Key
When pressed while in the GPIB mode, this key
Figure 3-10. CURSOR Keys and Indicators
causes the 54XXA to return to the local mode. The
54XXA will not return to the local mode if the local
lockout (LLO) interface function message has been
3-13 C URSOR FUNCTION KEYS,
INDICATORS AND MENUS
received from the external computer/controller (refer
to the 54XXA GPIB User’s Guide).
When pressed while in the local mode, the current
GPIB address displays on the screen. This ad dress
The CURSOR keys and indicators are shown in Figure 3-10. The menus displayed by these keys are
shown in Figure 3-22 (behind Operating Menus tab).
may be changed by entering a new value via the
numeric keypad and pressing ENTER (Figure 3-21).
The GPIB address is saved in non-volatile memory
as part of the power-up reset parameters (refer to
paragraph 3-3).
3-13.1 Cursor Measurements Functions
The 54XXA includes the following cursor search and
readout functions:
3-12.5 SELF TEST Key
This key initiates a self test of the analyzer and
signal source. If the unit functions properly, the
screen displays “ALL TESTS PASSED”. If the self
test fails, the screen displays a failure message. In
addition, one of the f ront panel LED indicators will
flash steadily to indicate a specific fault. The LED
coding for Self Test errors are listed in Table A-2 in
the Appendi x.
GPIB
STATUS
RLLSLT
Figure 3-9. GPIB Status Screen Display
• Main Cursor Readout
• Main/Relativ e Cursor Readout
• Maximum (Peak) Search
• Minimum Search
• Next Marker
• Active Marker
• dB S earch (Absolute – left, right, or bandwidth)
• dB S earch (Relative)
The menu selections for these functions are described in the following paragraphs.
3-13.2 CURSOR ON/OFF Key and In dicat or
Turns the main cursor portion of the screen display
on/off. When pres sed ON, the cursor is positioned at
the location o n the screen display where las t used.
The frequency and amplitude of the measured data
at the cursor trace position are displayed on the
right side of the screen (Figure 3-1). The cursor readout display is described in Figure 3-22.
The position of the cursor is continuously variable
using the data entry knob. The LED indicator
associated with the main cursor ON/OFF key will be
lit whenever this function is active.
3-14 54XXA OM
Page 40
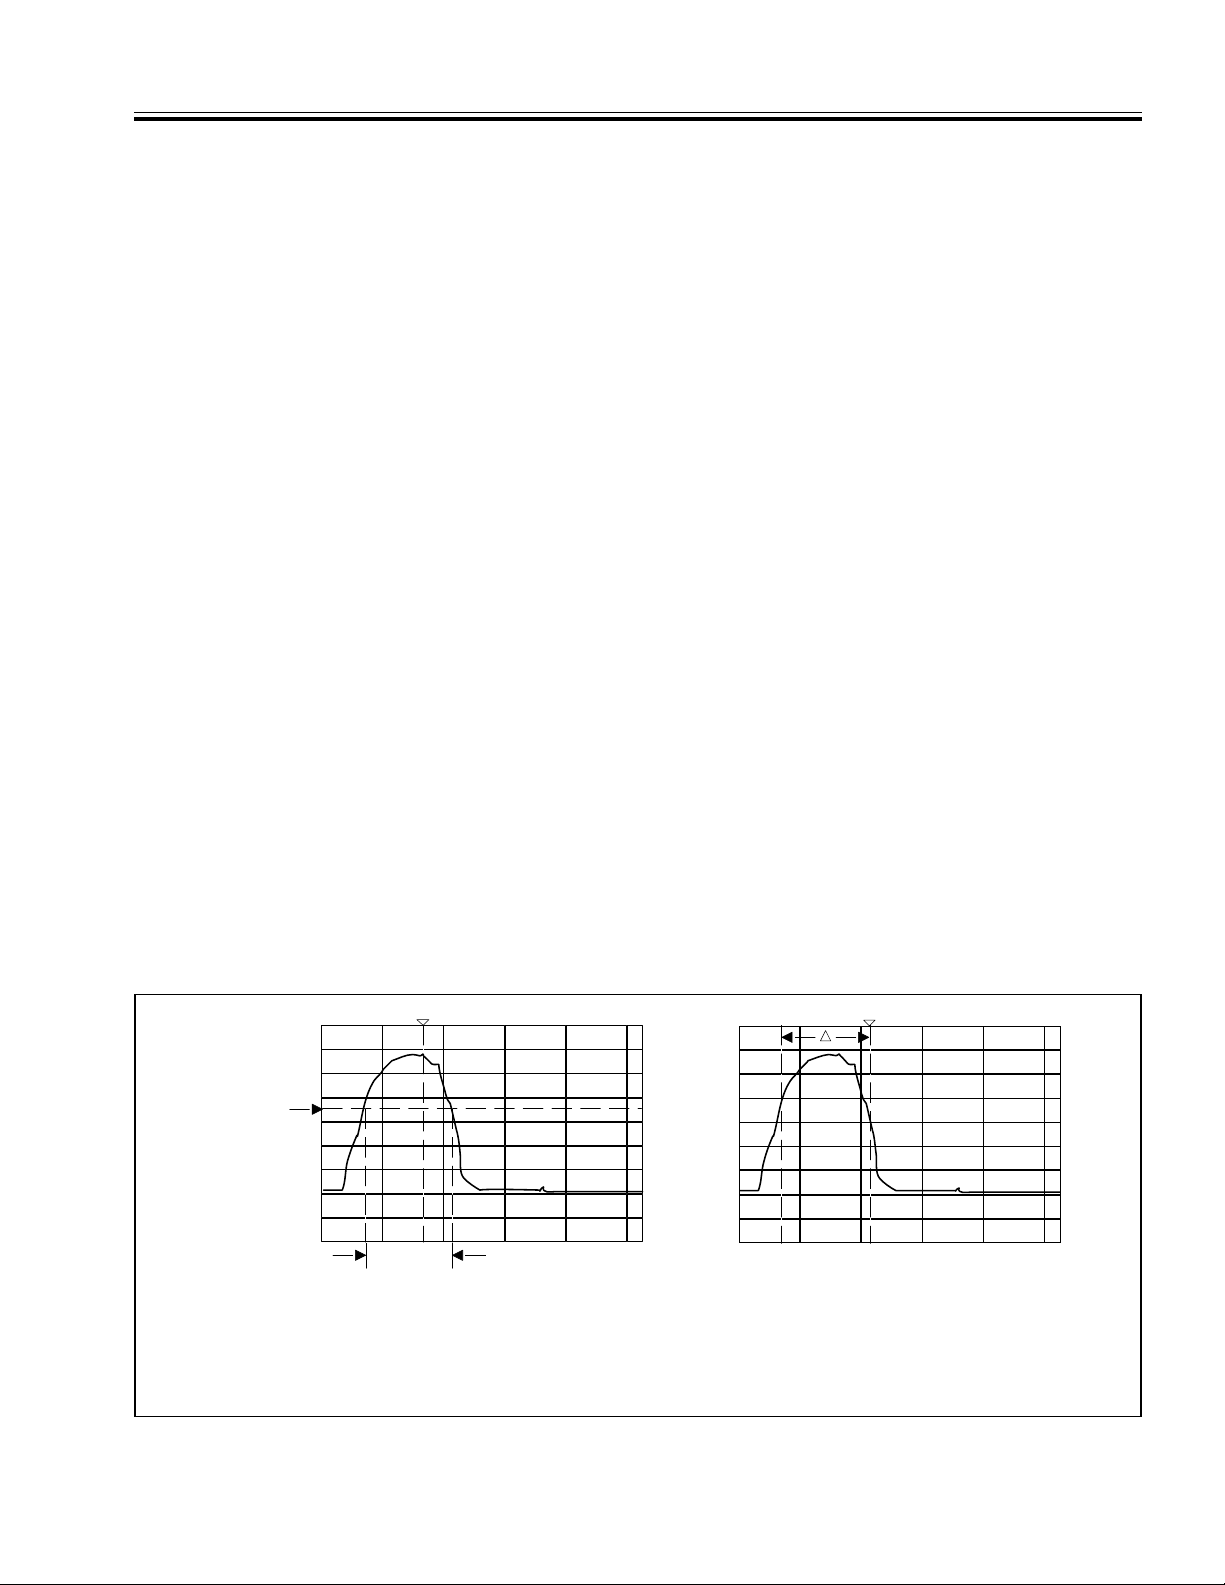
III FRONT PANEL OPERATION CURSOR FUNCTION KEYS, INDICATORS AND MENUS
NOTE
If the NEXT MKR selection has been previously selected (and if frequency markers
have been set up), pressing the SELECT
key will move the cursor to the next frequency marker.
3-13.3 CURSOR ON/O FF Key Menus
Whenever the cu rsor readout is display ed, pressing
the SELECT key will invoke the cursor function
main menu (Figure 3-22). The submenus selected
from the main menu are us ed to se t up the curso r
functions listed in paragraph 3-13.1. Using the
SETUP and OPTIONS submenus, se arches may be
performed using absolute search values (in dB or
dBm) or using relative search values (in dBr). Relative searches may also be set up by invoking the
search from the RELATIVE cursor key main menu.
3-13.4 RELATIVE Cursor Key and I ndicat or
Turns Relative Cursor mode on/off. When key is
pressed, a second (relative) cursor is displayed on
the screen at the same position as the main cursor.
The “active” (main) cursor will then move away from
this position as the data entry knob is varied. (Or it
will advance to the next frequency marker position
if the SELECT key is pressed—see note above). The
LED indicator associated with the RELATIVE key is
lit whenever this function is active.
The difference in amplitude and frequency between
the “active” (main) cursor position and the relative
cursor position are displayed on the right side of the
screen. The amplitude difference is displayed in dBr
(dB relative to the current active cursor value). The
readout display also includes readout data for the
active cursor (Figure 3-22). Data for both measurement traces are displayed if bo th are used.
If the EXCHANGE REF CURSOR line of the menu is
highlighted, pressing the SELECT key swaps the
positions of the main cursor and relative cursor; otherwise, the CURSOR menu is selected. This feature
may be used to establish the present main cursor
position as the new reference frequency point for
bandwidth measurements.
3-13.5 RELATIVE Curs or Key Men u
Pressing the SELECT key with the relative cursor
data displayed invokes the main menu for t he relative cursor function. This menu is similar to the
main menu for the main cursor. All searches
initiated from this menu will be performed relative
to the value at the current m ain cursor position, or
to the peak value for the channel selected (Figure 3-22).
3-13.6 BANDWIDTH Search Function
Selecting the BANDWIDTH curs or s earch t ype from
the cursor submenus will set up the 54XXA to perform bandwidth measurements. The search value
(absolute or relative) must be specified (in dB) as
part of the menu selection. An example of this type
of measurement is shown in Figure 3-11.
SEARCH
VALUE
SEARCH
RANGE
1. Set cursor within the desired
Search Range that includes
the Search Value.
Figure 3-11. dB Se arch–Bandw idth Me asureme nt
2. Select Cursor menu options
for BANDWIDTH type Search
(enter Search Value as indicated).
Two cursors will diverge to indicate
bandwidth measurement.
54XXA OM 3-15
Page 41
HARD COPY KEYS, INDICATORS AND MENUS III FRONT PANEL OPERATION
• Print measurement data at frequency markers
only.
PRINTER
MENU
HARD COPY
START STOP
• Print measurement limit values in tabulated
form (printe r only).
• P lot screen measureme nt display on a plotter.
PLOTTER
Figure 3-12. HARD COPY Key Group
3-14 HARD COPY KEYS, INDICATORS
AND MENUS
The HARD COPY key group is shown in Figure 3-12.
The main menus and submenus associated with
these keys are described in Figure 3-23 (behind Operating Menus tab).
NOTE
Before data can be sent to an external
plotter, the 54XXA GPIB interface must
be set to the Plotter Mode; see Figure 3-23. (In this mode of operation, only
the 54XXA and plotter may be connected
to the GPIB; refer to S ection II .
3-14.1 MENU Key
Displays one of two main menus that enable the user
to select the type of hard copy output that is produced from the measurement data. These menus
configure the 54XXA to output data to either a
printer or a plotter (Figure 3-23). The printer output
may be either a tabular printout of the measurement
data, a “plot” of the screen display, or both (Figures 3-14 thru 3-17).
• Plot graticule lines, cursor information, titles,
or measurement traces, from the screen display
separately .
The main menus and submenus are explained in
Figure 3-23. Examples of hard copy print outs are
shown in Figure 3-14 through 3-17.
3-14.2 PRINTER/ PLOTTER Indi cators
When lit, these LED indicators designate which type
of hard copy output the 54XXA is set up to produce.
3-14.3 START Key
Freezes the displayed data and lo ads the printer or
plotter buffer with the measurement data. When
data transfer is complete, the output device starts
printing or plotting and the 54XXA is again usable
for measurements. The type of hard copy produced
is determined by the last PRINTER/PLOTTER
MENU options selected.
When plotter ou tput is used, Pl ot Pro gress M essages
that indicate normal and abnormal plotter conditions are displayed in the menu area at the right side
of the screen. Plot progress messages are transient;
they are only displayed momentarily . The menu area
returns to the previous display when the output data
transfer is completed. These messag es are listed in
Table 3-1.
Either menu may be accessed from the other; both
types of hard copy output may be defined before
output begins. The PRINTER and PLOTTER LEDs
indicate which hard copy output device has been
defined. The output options available from these
menus are:
• Print the screen measurement display on a
printer.
• P rint a tabulation of the measurement values
(printer only) .
3-14.4 STOP Key
Stops Hard copy output operation. If output is to
printer, stop may be delayed, depending on size of
printer buffer (if any). If to plotter, the current data
string is plotted and the plotter is left in a reset
state.
If both hardcopy output devices are active, only the
device indicated by the LEDs will be stopped. T o stop
the other device, select the appropriate hard copy
main menu then press STOP.
3-16 54XXA OM
Page 42
III FRONT PANEL OPERATION PLOT PROGRESS MESSAGES
ENHANCEMENT
AVERAGING SMOOTHING
CHANNEL 1
CHANNEL 2
Figure 3-13. ENHANCEMENT Keys and I ndica-
tors
3-15 ENHANCEMENT KEYS, INDICATORS,
AND MENUS
The ENHANCEMENT keys and indicators are shown
in Figure 3-13. The menus invoked by the keys in
this group are shown in Figure 3-24. The usage and
operation of these menus are further described below.
3-15.1 AVERAGING Key, Indicators and Menu
Displays a menu that allo ws the user to select data
averaging over 2 to 256 successive sweeps. Data
averaging can be selected for measurem ent channel
1 or 2, or both. When a channel selection is made,
the CHANNEL 1 and/or CHANNEL 2 LED indicator
next to the AVERAGING key will be lit accordingly.
Table 3-1.
Plot Progress
Message
PLEASE WAIT
LOADING
PLOT BUFFER
PLOTTER TYPE
7470A
PLEASE WAIT
LOADING
PLOT BUFFER
PLOTTER TYPE
7470A
NOT READY
HARDCOPY
FAILED
PLEASE WAIT
LOADING
PLOT BUFFER
Then ↓
PLOTTER
NOT READY
Plot Progress Messages
Plot
Progress
Normal Normal
Error Plotter needs to be re-
Error Plot STOP command
Error Plotter disconnected; or,
(Error)
Plotter Condition
initialized (on /off or
replace paper); or,
no paper cond ition; or,
PAPER UNCLAMPED
ERROR.
issued; or,
plotter disconnected or
plotter stopped during
plot
plotter GPIB interf ace
problem
This form of data smoothing retains measurement
bandwidth, but requires more time to generate the
measurement data and display. It is an effective
method of re ducing the effe cts of random type n oise
in the measurement data.
3-15.2 SMOOTHING Key, Indicators and Menu
Displays a menu that allows five levels of trace
smoothing filtering to be selecte d for the channel(s)
selected (Figure 3-24). This form of data smoothing
reduces the effective bandwidth of the measurement
display system and requires some extra time; however, the display is correct aft er just one swee p.
3-15.3 Smoothing Mode Selection
Selection of the measurement channel(s) acted on by
the SMOOTHING submenu selections is done from
the ANALYZER configuration submenu, which is
invoked from the SYSTEM MENU Key main menu
(Figure 3-20). The ANALYZER submenu allows the
user to set for COUPLED smoothing (i.e., measurement Channels 1 and 2, are set to the same data
smoothing level), or INDEPENDENT smoothing (i.e.,
measurement channels may be set to different levels). When a channel selection is made, the CHAN-
NEL 1 and/or CHANNEL 2 LED indicator next to the
SMOOTHING key will be lit accordingly.
54XXA OM 3-17
Page 43
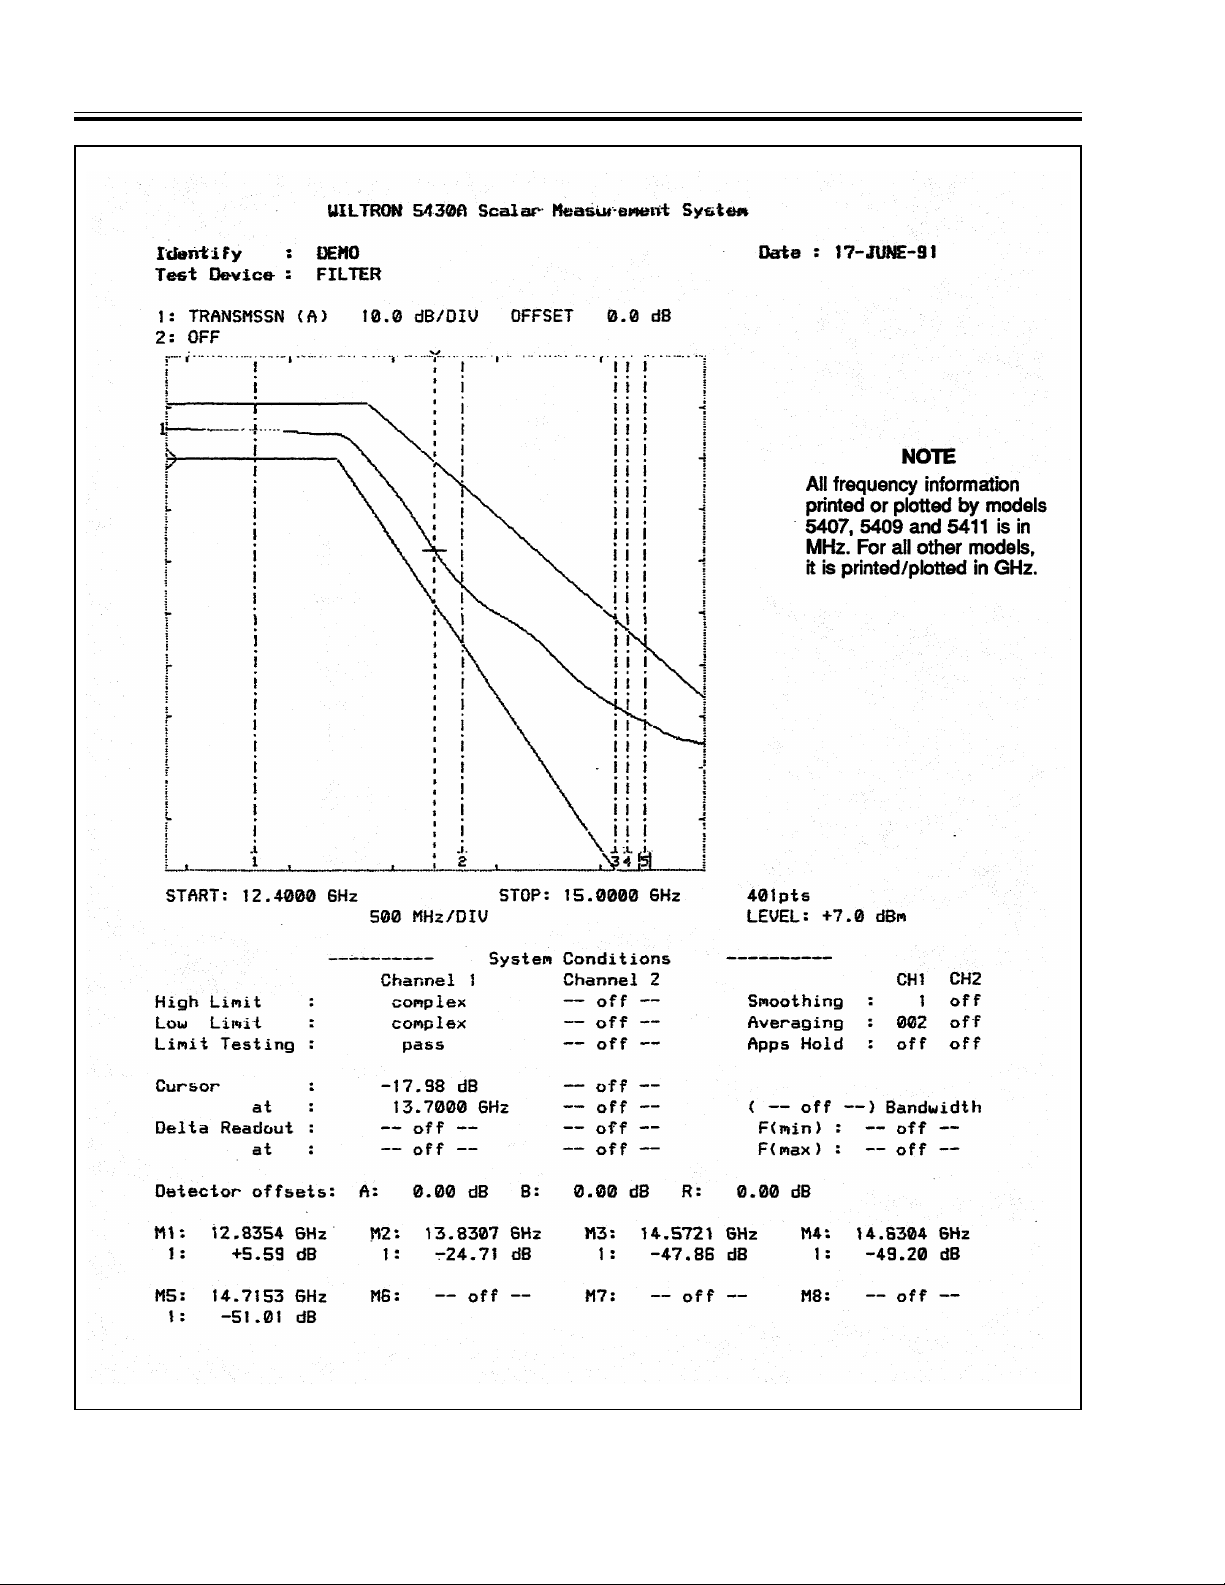
HARD COPY PRINTOUT EXAMPLES III FRONT PANEL OPERATION
Figure 3-14. Example of Hard Copy Plot Print-
3-18 54XXA OM
Page 44
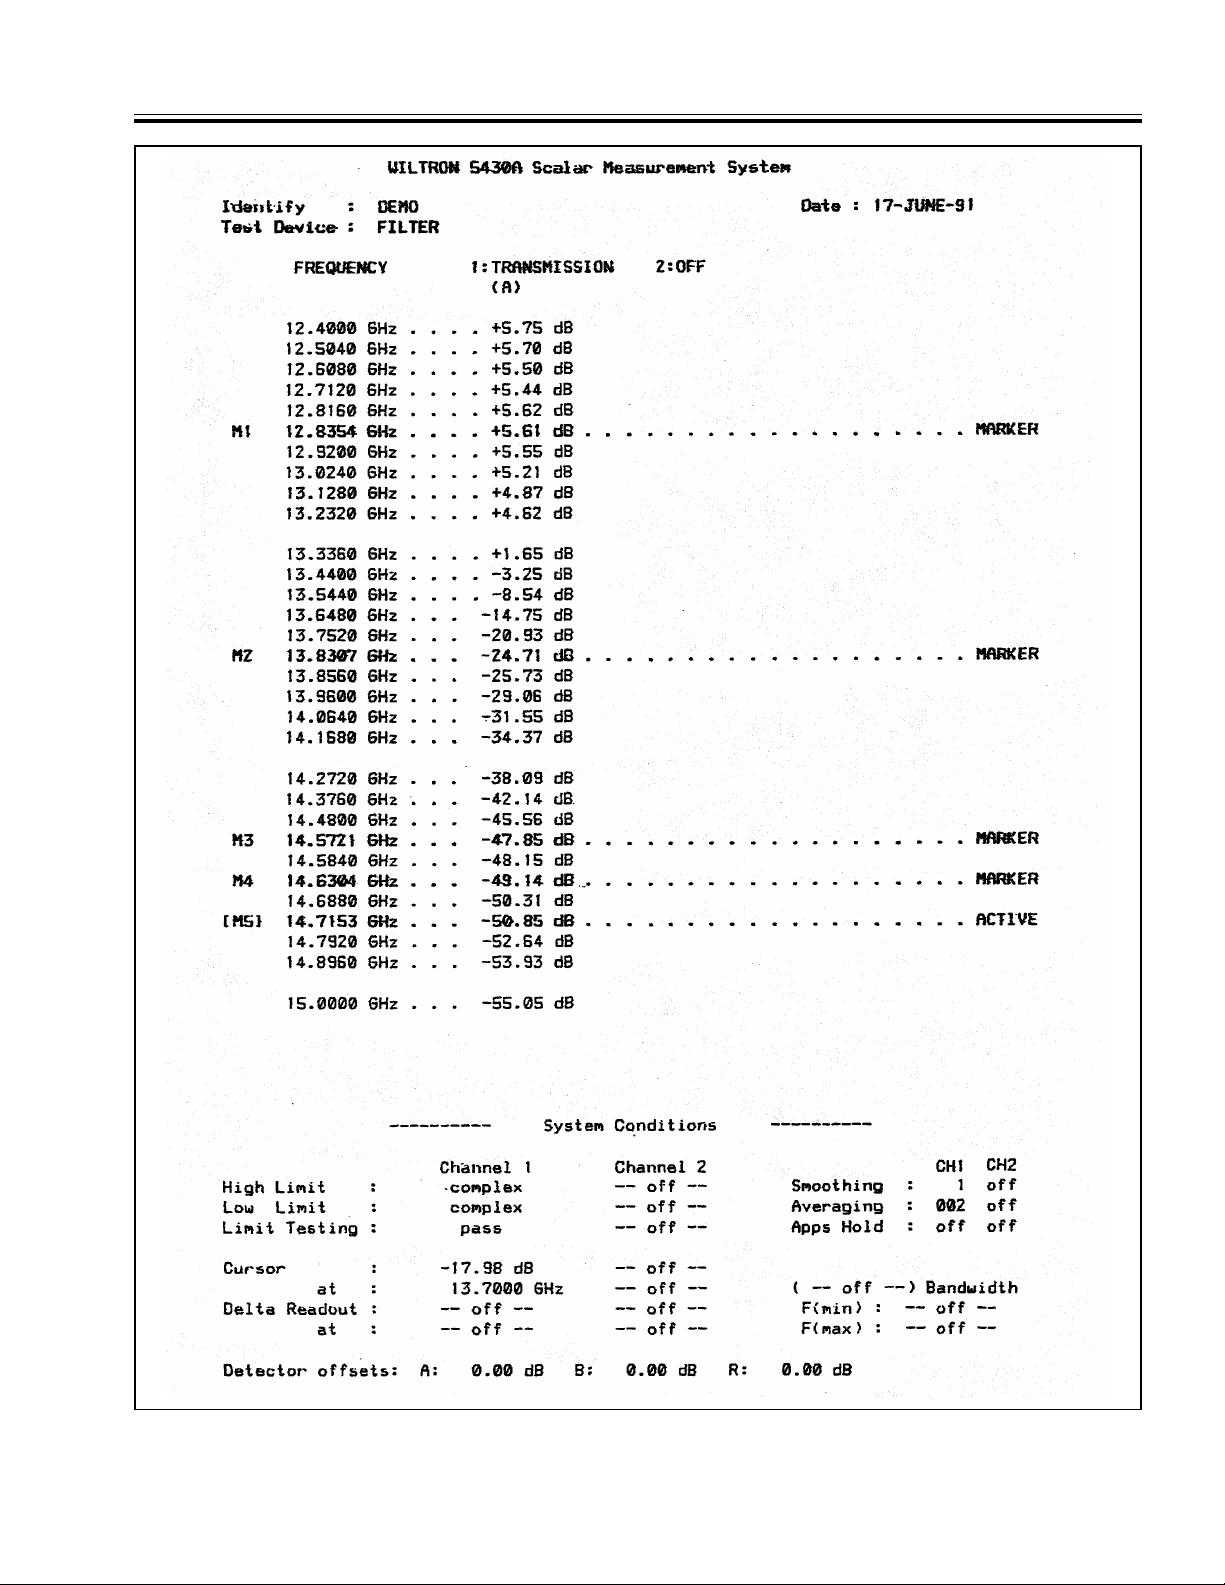
III FRONT PANEL OPERATION HARD COPY PRINTOUT EXAMPLES
Figure 3-15. Example of Hard Copy Tabula r Data Pri ntout
54XXA OM 3-19
Page 45
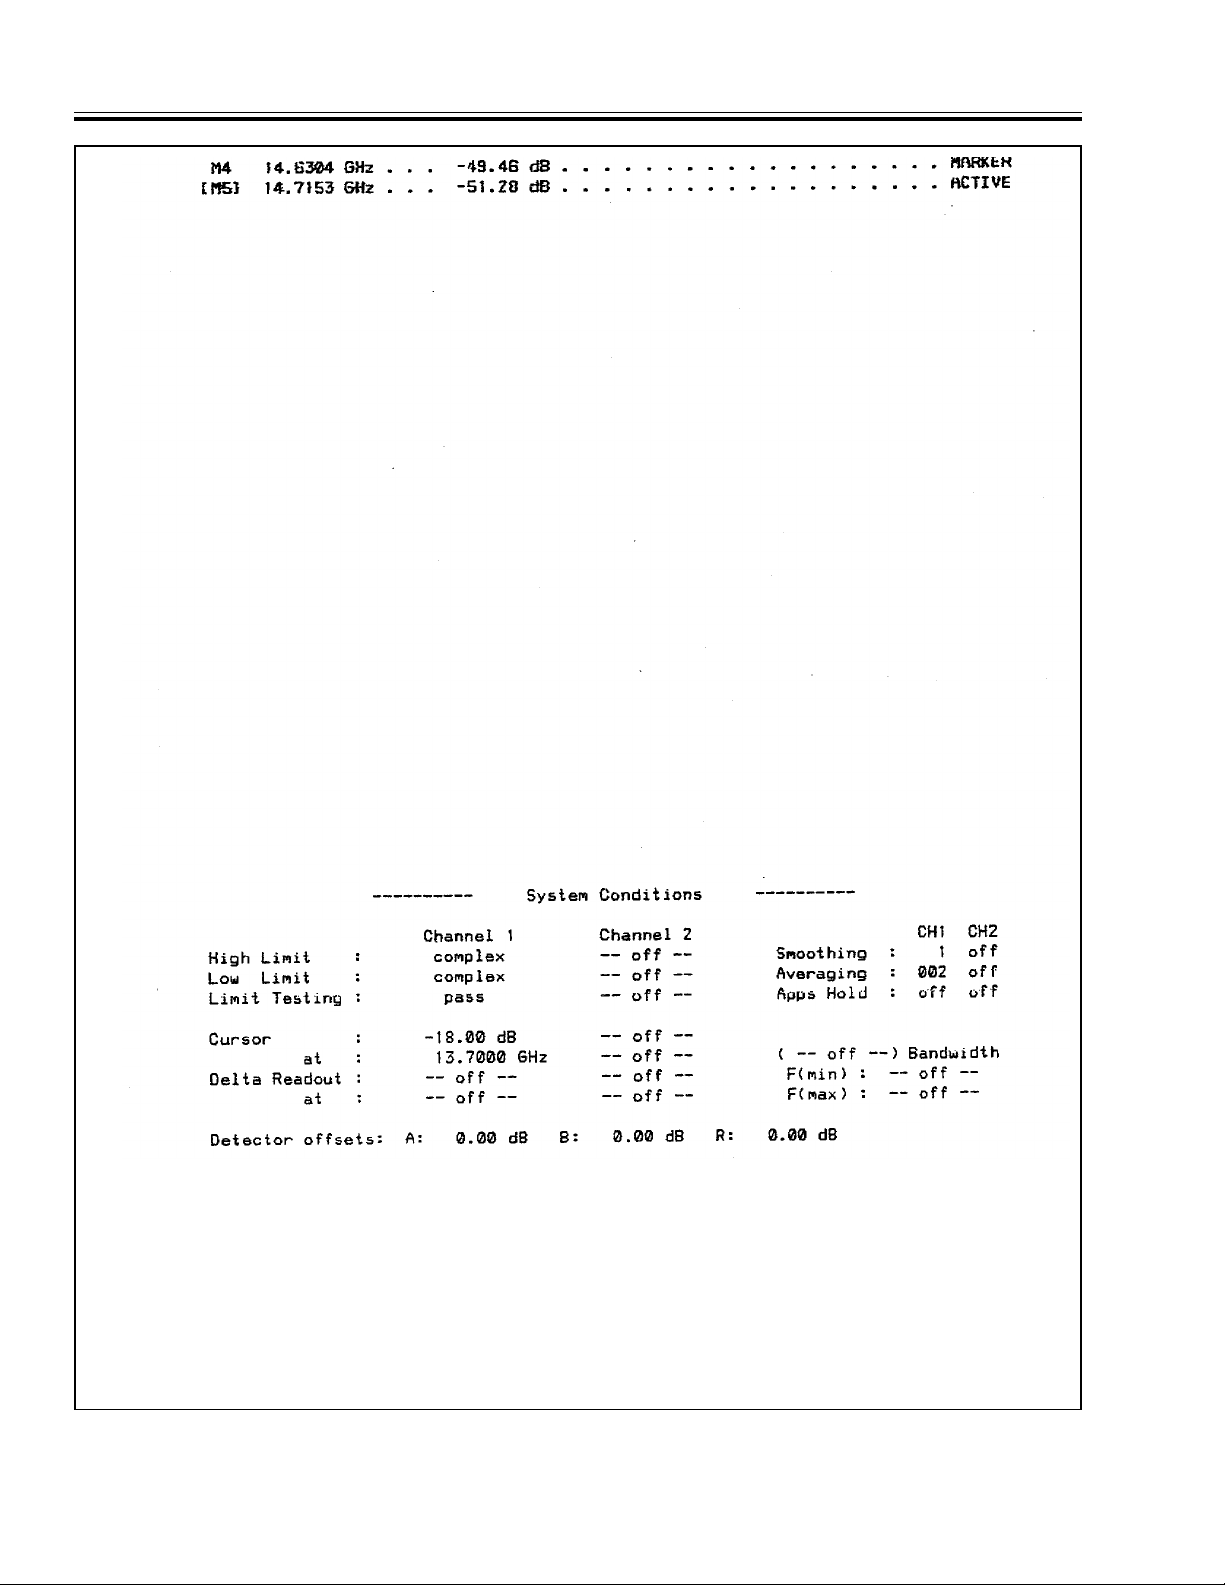
HARD COPY PRINTOUT EXAMPLES III FRONT PANEL OPERATION
Figure 3-16. Exa mple o f Hard C opy P rintou t of M arker Only
3-20 54XXA OM
Page 46
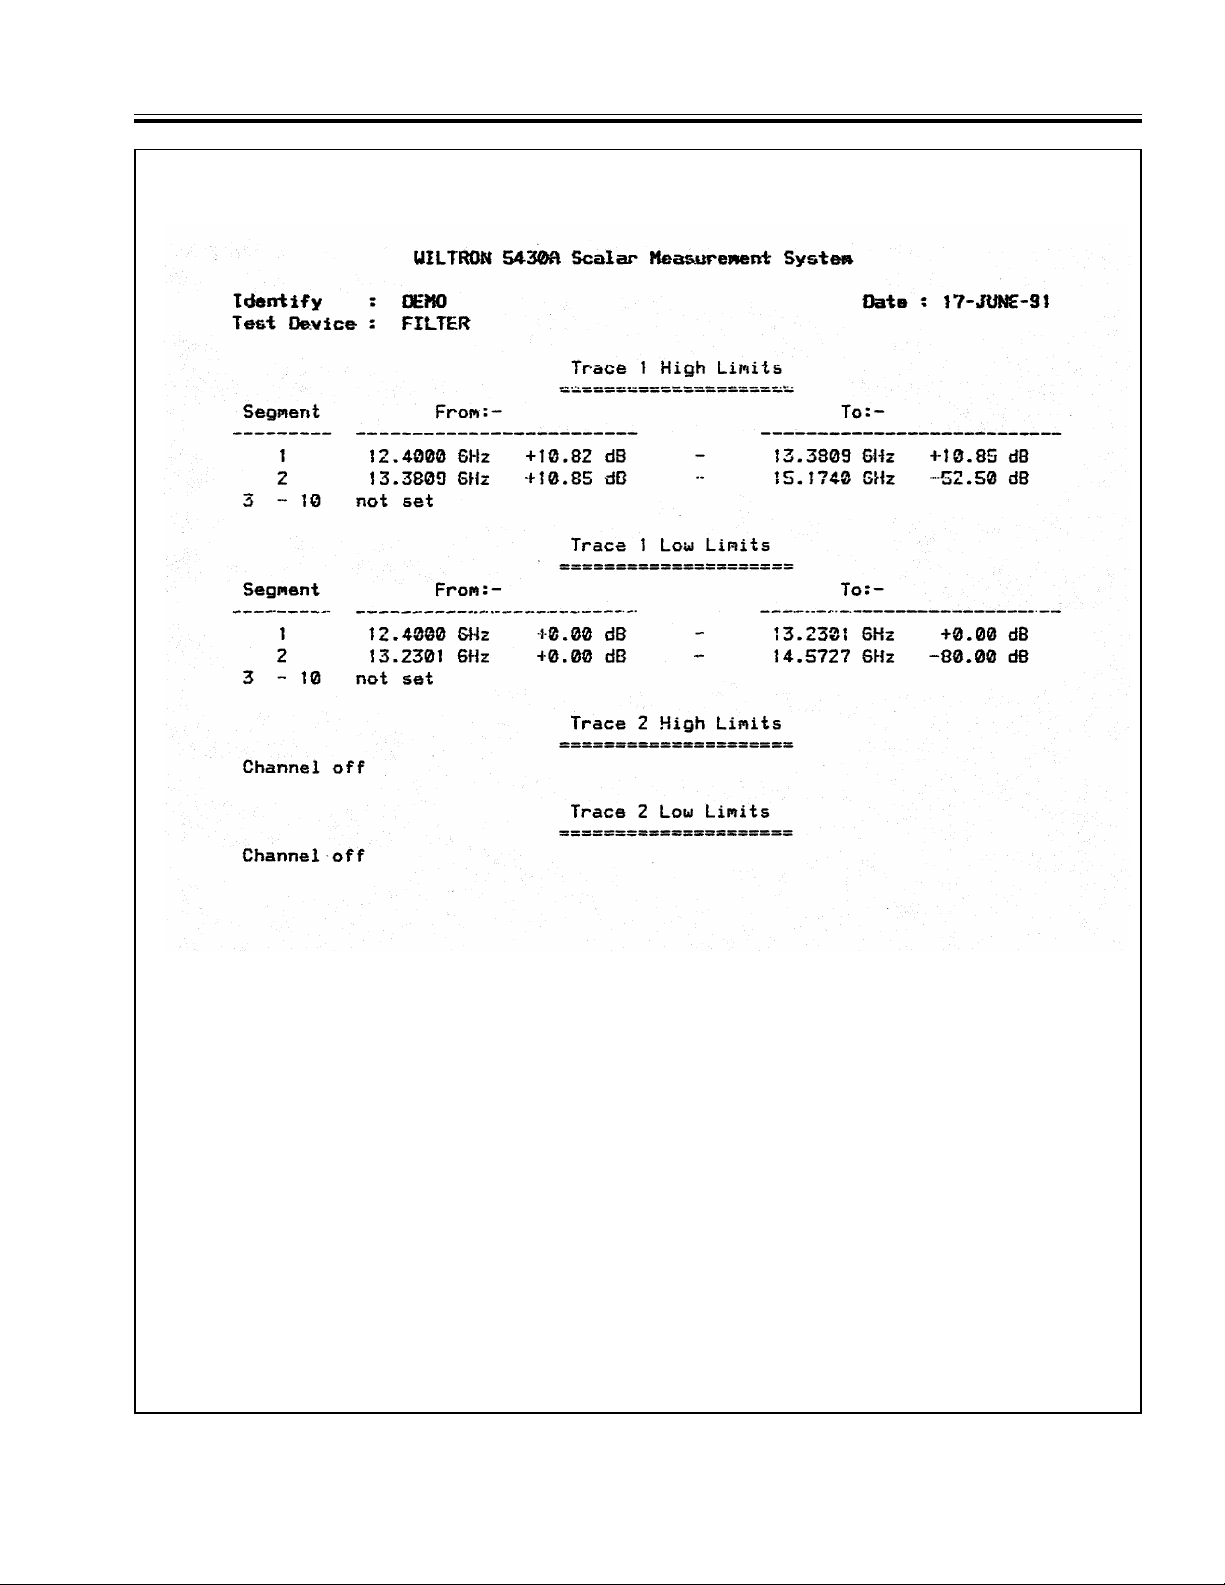
III FRONT PANEL OPERATION HARD COPY PRINTOUT EXAMPLES
Figure 3-17. Exam ple of Hard Cop y Printout of Limits Only Data
54XXA OM 3-21/3-22
Page 47
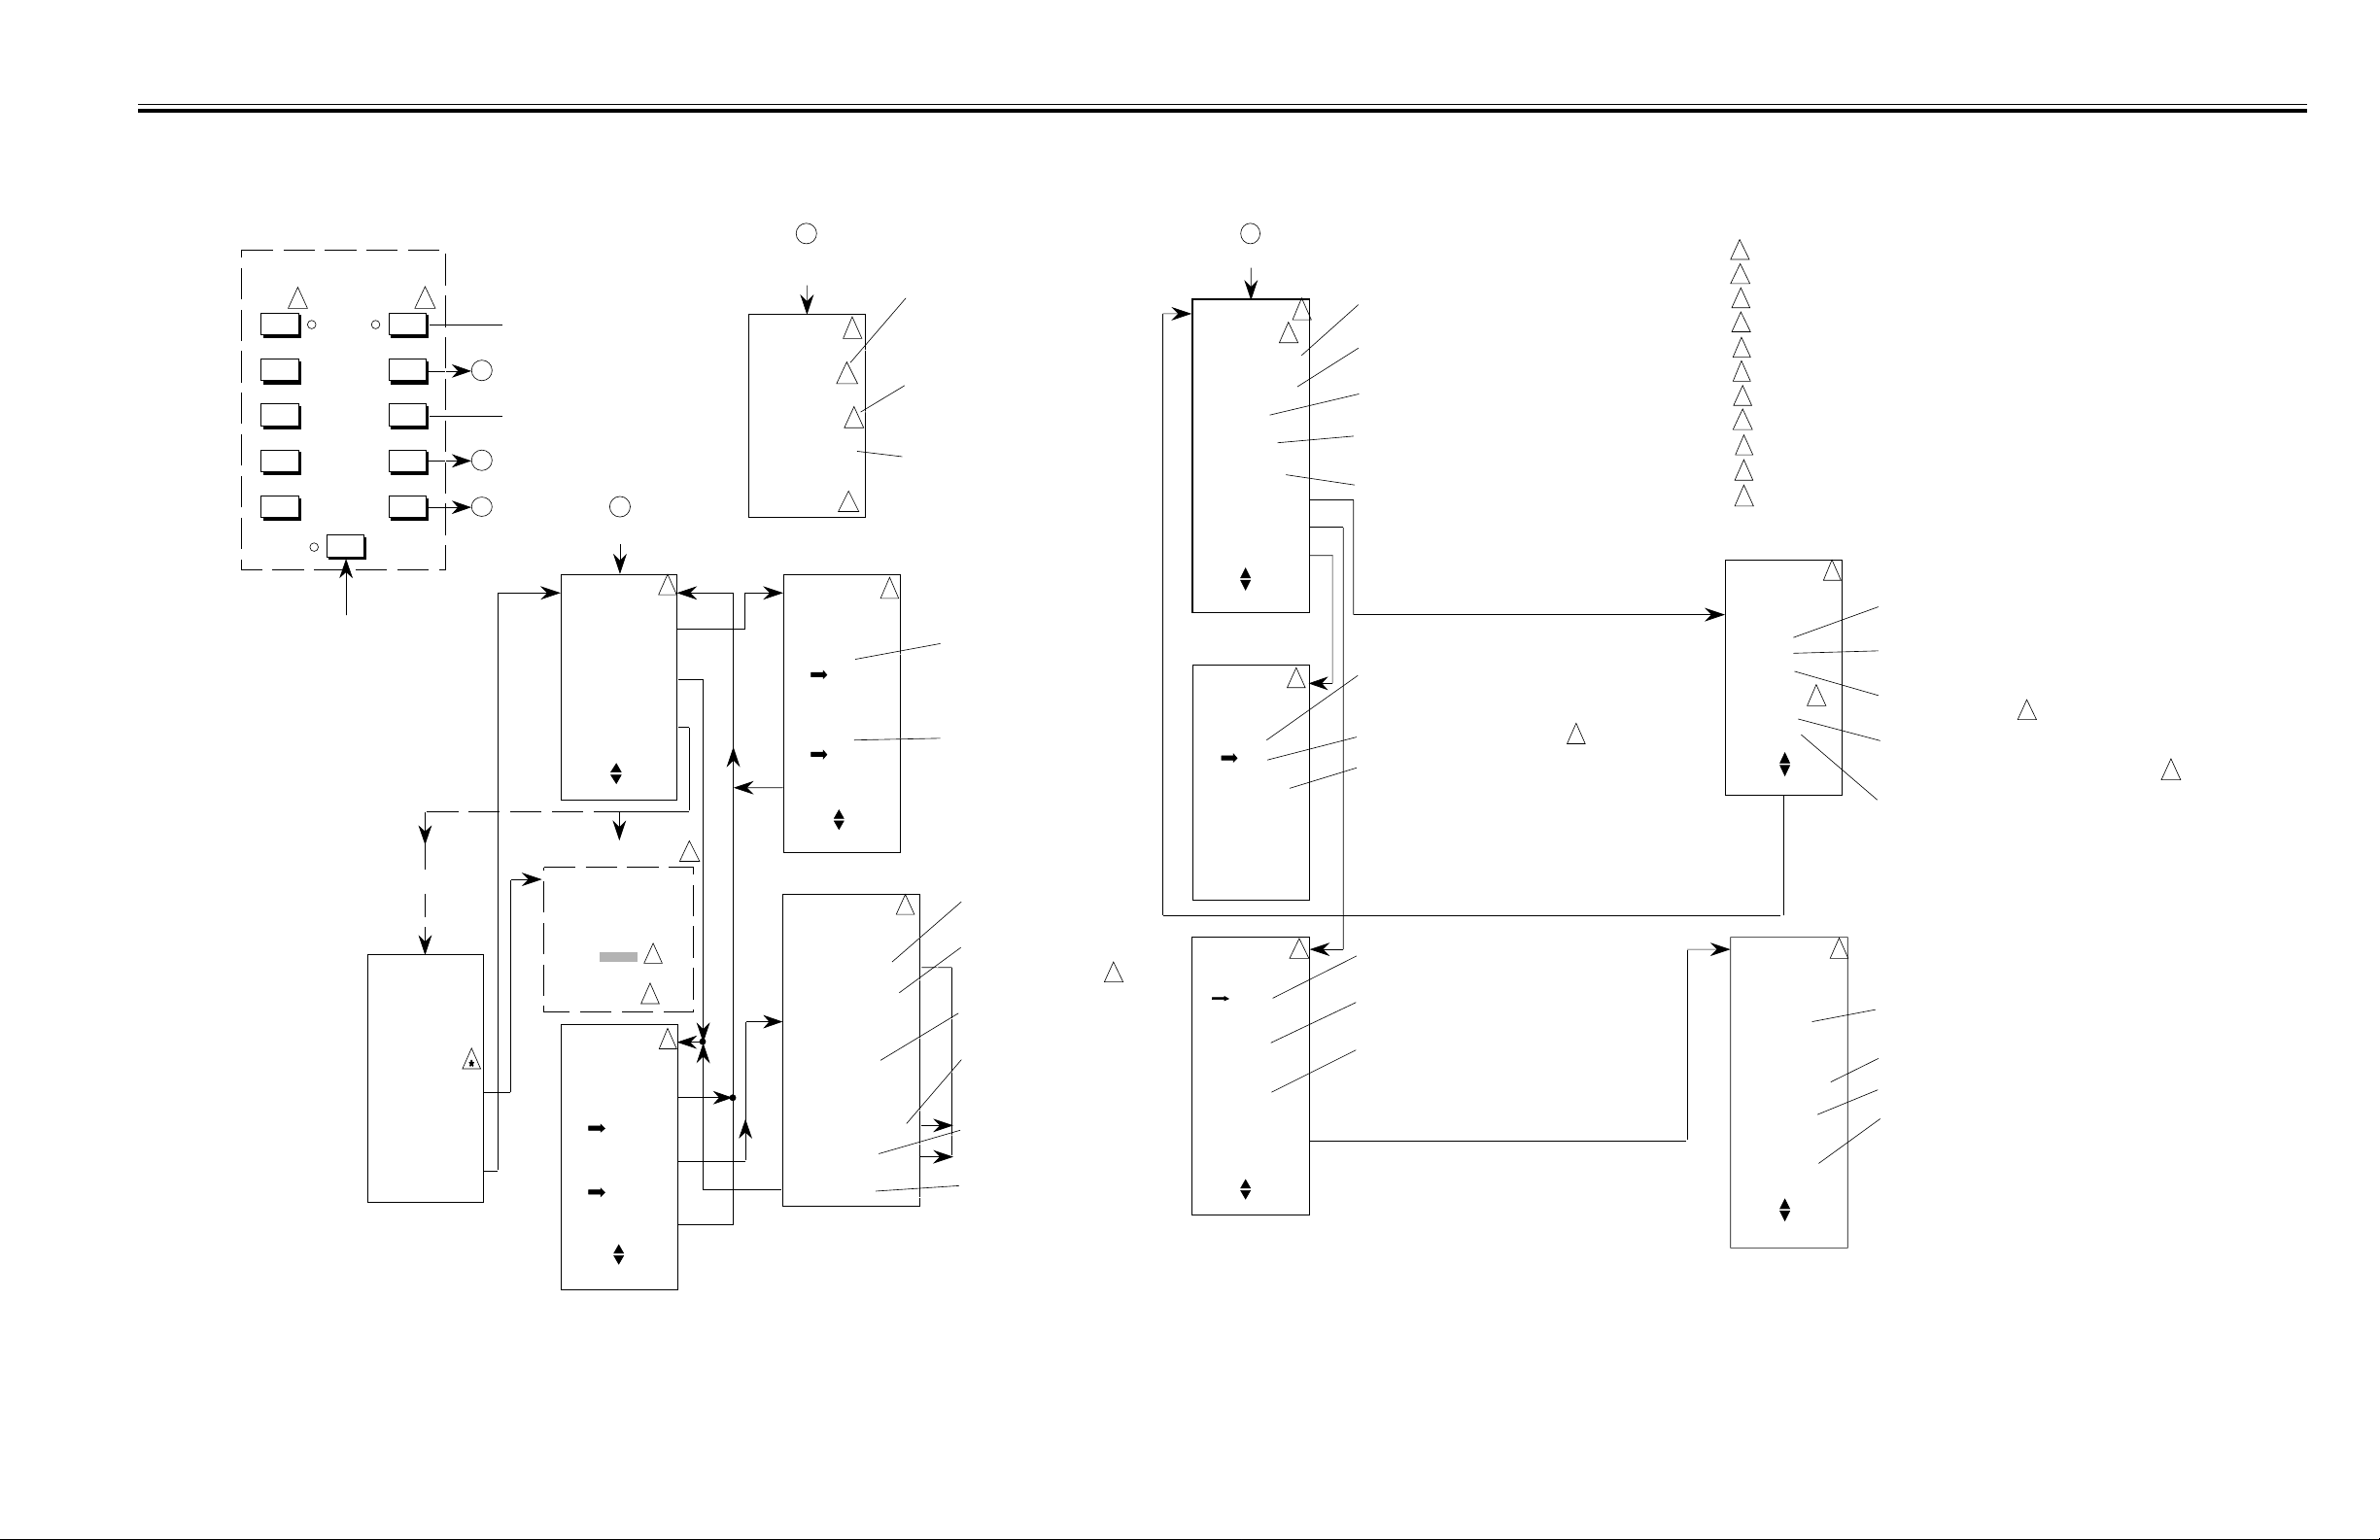
III FRONT PANEL OPERATION NETWORK ANALYZER KEY GROUP MENUS
KEY GROUP
NETWORK ANALYZER
1
1
CHANNEL
DISPLAY
ON/OFF
OFFSET/
RESOLUTION
AUTOSCALE
LIMITS
MENU
CALIBRATION
Starts the Calibration
Sequence; see text.
2
If Fill Limit
Array Violatio n:
WARNING
CHANNEL: n
COMPLEX
LIMITS
OVERLAP AT
XXXX GHz
PRESS SELECT
TO CONTINUE
PRESS LIMITS
TO AMMEND
1
OR
Turns designated measurement trace
(Channel 1 or 2) on or off. Also turns on
associated reference line indicator, limit
lines, and CHANNEL indicator (LED).
A
Sets screen display for the designated
measurement trace at optimum offset
and resolution values for viewing the
measured data.
B
C
B
LIMITS
CHANNEL: n
LIMITS MENU
SINGLE LINE
LIMITS
COMPLEX
LIMITS
TEST
LIMITS
USE THEN
PRESS SELECT
SCREEN DISPLAY:
TESTING
FOR LIMITS
CHANNEL 1
XXXXX
CHANNEL 2
XXXXX
CHANNEL: n
COMPLEX
LIMITS
ENTER HIGH
ENTER LOW
MAIN MENU
2
4
4
2
ON
OFF
ON
OFF
A
OFFSET/
C
MENU
RESOLUTION
Enter desired value into menu via the
DATA ENTRY keys (or knob). Entry
CHANNEL: n
OFFSET
XX.X dB
RESOLUTION
XX.X dB/DIV
PRESS SELECT
TO MOVE TRACE
AT CURSOR TO
REF LINE
8
(HIGH OR LOW) LIMIT
2
7
6
CHANNEL: n
LIMITS
HIGH LIMIT
+X.XX dB
ON
OFF
LOW LIMIT
+X.XX dB
ON
OFF
MAIN MENU
USE THEN
PRESS SELECT
CHANNEL: n
COMPLEX
SEGMENT X
FREQUENCIES:
XX.XXXX GHz
XX.XXXX GHz
LEVEL:
X.XX dB
X.XX dB
NEXT SEGMENT
CLEAR
DONE
specifies the dB (or SWR) value to be
assigned to the Reference Line for trace
(n).
Enter desired value into menu display.
This value specifies the value (in dB or
SWR) of each vertical division of the
7
measurement display.
Press SELECT (with Cursor on) to move
the trace displayed at Cursor to the
Reference Line.
2
ON selection allows high limit line
to be specified for measurement
trace (n). Enter limit value in dB
(or SWR). OFF selection turns
off limit function.
ON selection allows low limit line
to be specified for measurement
trace n. Enter limit value in dB
(or SWR). OFF selection turns
off limit function.
2
Designates limit line segment
(number).
Enter frequencies of the start and
stop points of the limit line
segment to be specified.
Enter high and low level limits for
segment.
Selects data entry for next limit
line segment. Start Frequency and
Level are set to current values for
currently selected segment.
Deletes the frequency and level
specifications for the limit line
segment selected.
Terminates complex limit line
specification procedure (all
segments specified).
*
CHANNEL: n
INPUT: B
TRANSMISSION
RETURN LOSS
SWR
POWER
VIEW CAL
SELECT INPUT
TRACE MEMORY
REF LINE
USE THEN
PRESS SELECT
CHANNEL: n
REFERENCE
LINE
USE KNOB
TO ADJUST
POSITION
PRESS CLEAR
WHEN
FINISHED
CHANNEL: n
TRACE MEMORY
VIEW
TRACE DATA
VIEW
TRACE MEMORY
VIEW
(DATA-MEM)
TRACE MEMORY
STORAGE MENU
USE THEN
PRES S SE LE CT
2
3
2
ON
OFF
2
Configures measurement trace (n) for
Transmission Measurement.
Configures measurement trace (n) for
Return Loss measurement.
Configures measurement trace (n) for SWR
(Standing-Wave Ratio) measurement.
Configures measurement trace (n) for
Power measurement.
Displays Calibration Data for measurement
channel associated with measurement
trace (n).
Turns on reference line indicator for
measurement trace (n), and allows vertical
position to be adjusted.
Turns off reference line for trace (n).
Adjusts vertical position of reference line for
trace (n).
Displays current measurement trace (n)
without Active Trace Memory applied,
Displays currently stored Active Trace
Memory for trace (n).
Displays current measurement trace (n)
with Active Trace Memory subtracted.
9
NOTES:
Corresponding Key functions for Channel 1 and Channel 2 are identical.
1
Displays Selected Measurement Trace (Channel 1 or 2)
2
Displays currently selected Input Connector.
3
PASS/FAIL message displayed here. If fail, frequency is also displayed.
4
Ratio not used for Power measurements.
5
Only displayed when Cursor is on.
6
Or SWR value.
7
Displayed on right side of measurement screen.
8
Alternate presentation: ">" and "<" mark reference line position.
9
0
These selections will not be presented for 54XXA's without Input R
All frequency information displayed by these menus is in MHz for Models 5407/09/1
*
It is displayed in GHz for all other models.
A
B
R
A/R
B/R
LOAD
WITH
2
Connects signal from the input connector to the
measurement trace (n).
Connects signal from the input B connector to the
measurement trace (n).
5
Connects signal from the input R connector to the
measurement trace (n).
Subtracts the signal from the input R from the signal
from the input A (logarithmically). The resultant
signal is displayed on the measurement trace (n).
Same as above, using the signal from the input B
connector.
2
Loads Active Trace Memory for
trace (n) with:
1 Current measurement data
2 Current High Limit data
3 Current Low LImit data
0
0
CHANNEL: n
SELECT INPUT
NON-RATIO
RATIO:
USE THEN
PRESS SELECT
CHANNEL: n
TRACE MEMORY
STORAGE MENU
TRACE MEMORY
TRACE DATA
ACTIVE
HIGH LIMIT
ACTIVE
LOW LIMIT
USE THEN
PRES S SE LE CT
USE THEN
PRESS SELECT
54XXA OM 3-23/3-24
Figure 3-18. NETWORK ANALYZER Key Group Menus
Page 48
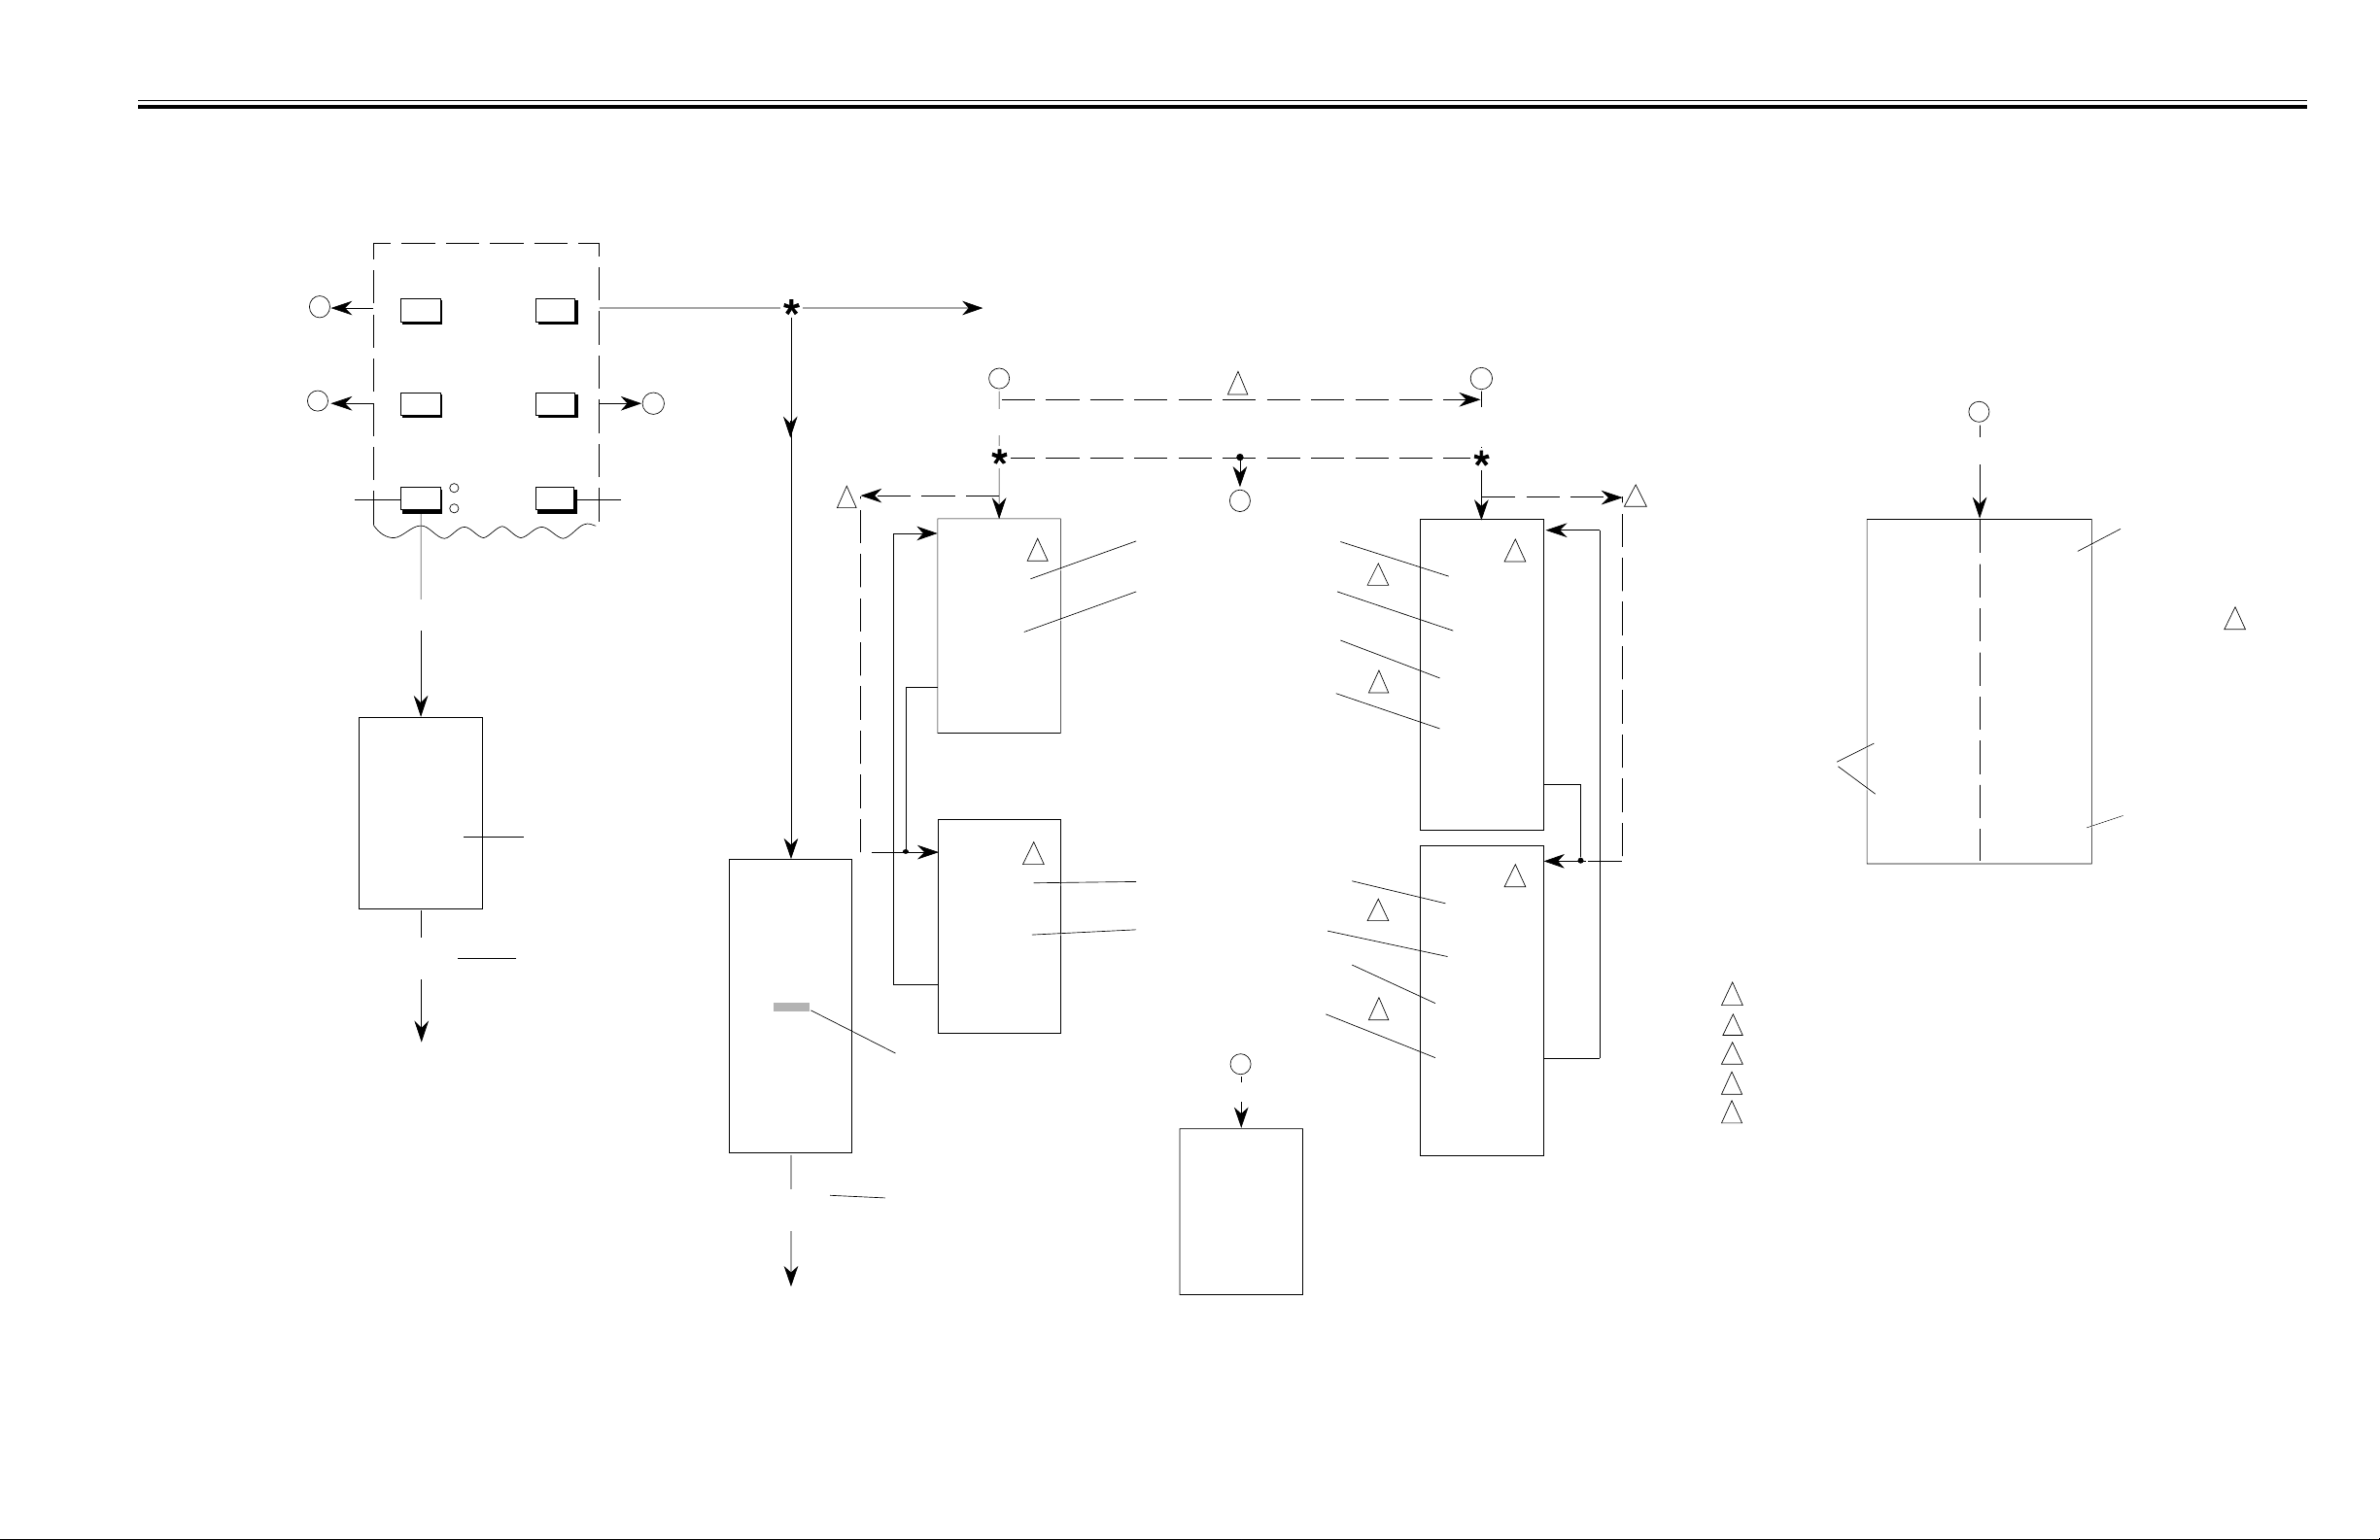
III FRONT PANEL OPERATION SOURCE KEY GROUP MENUS
r
l
h
KEY GROUP
A
B
Selects between the internal
power detector and external
power detector to be used
with the RF output leveling
circuits (see text).
SOURCE
FREQUENCY
INTERNAL
EXTERNAL
ALTERNATE
Connect output of external
detector to rear panel
EXTERNAL ALC input
connector (see text).
Message displayed briefly
MARKERS
LEVELING RF ON/OFF
EXTERNAL
Selected
EXTERNAL
LEVELING
CONNECT
EXTERNAL
LEVELING
DETECTOR
PRESS SELECT
WHEN READY
EXTERNAL
LEVELING
PASSED
Returns to previous
operating mode.
OUTPUT
POWER
SWEEP
C
Turns the frequency
source RF Output
power on and off;
see text.
POWER LEVEL
MENU
SET EXTERNAL
LEVELING
POWER
XX.X
MAY NEED
RESCALING
PRESS SELECT
TO RESCALE
EXTERNAL
DETECTOR
INTERNAL
LEVELING
selected
EXTERNAL
LEVELING
selected
2
Press Key and use Keypad or Data Entry
knob to enter the desired frequency source
RF Output power (in dBm). Value will be
displayed at bottom of screen display.
A
FREQUENCY
FREQUENCY
MENU
START:
XX.XXXX GHz
STOP:
XX.XXXX GHz
PRESS SELECT
FOR
CENTER/WIDTH
FREQUENCY
MENU
CENTER:
XX.XXXX GHz
WIDTH:
XX.XXXX GHz
PRESS SELECT
FOR
START/STOP
Enter the desired
frequency source RF
Output power level.
1
If "SECURE MODE" ActiveIf "SECURE MODE" Active
D
5
5
Enter the sweep Start Frequency
in GHz (or MHz).
Enter the sweep Stop Frequency
in GHz.
Enter the sweep Start Frequency
in GHz for Alternate Sweep.
Enter the sweep Stop Frequency
in GHz for Alternate Sweep.
Enter the sweep Center Frequency
in GHz.
Enter the Sweep Width in GHz.
Enter the sweep Center Frequency
in GHz for Alternate Sweep.
Enter the Sweep Width in GHz
of Alternate Sweep.
D
SECURE MODE
FREQUENCY
MENU
C
ALTERNATE
SWEEP
2
FREQUENCY
MENU
5
3
4
3
4
START:
XX.XXXX GHz
STOP:
XX.XXXX GHz
ALT START:
XX.XXXX GHz
ALT STOP:
XX.XXXX GHz
PRESS SELECT
FOR
CENTER/WIDTH
FREQUENCY
MENU
5
CENTER:
XX.XXXX GHz
WIDTH:
XX.XXXX GHz
ALT CENTER:
XX.XXXX GHz
ALT WIDTH:
XX.XXXX GHz
PRESS SELECT
FOR
START/STOP
Use MENU UP/DOWN
and SELECT keys to
select marker M1-M8
as Active Marker.
If Alternate Sweep mode previously selected
1
If Center/Width frequency entry previously selected
2
CHAN 1 trace in Alternate Sweep mode (Main Sweep)
3
CHAN 2 trace
4
All frequency information displayed by these menus is in MHz for
5
Models 5407/09/11. It is displayed in GHz for all other models.
MARKERS 1-4 MARKERS 5-8
M1: 8.1000
1: -8.25dB
2: +1.31dB
M2: 9.1000
1: -6.40dB
2: +3.21dB
M3: -- OFF-
M4: 11.1000
1: -5.66dB
2: -5.67dB
MARKERS 5-8
PRESS SELECT
FOR ON/OFF
B
MARKERS
M5: 10.0000
1: +2.22dB
2: +2.31dB
M6: --OFF--
M7: --OFF--
M8: --OFF--
MARKERS 1-4
PRESS SELECT
FOR ON/OFF
Enter desired marke
frequency with Data
Entry knob. Data at
marker frequency wi
be displayed for bot
channels (if on).
Press SELECT key
to toggle Active
Marker On/Off.
5
EXTERNAL
LEVELING
PASSED
Returns to previous
operating mode.
Message displayed briefly
54XXA OM 3-25/3-26
SECURE MODE
ACTIVE
USE RESET
TO RESTORE
FREQ DISPLAY
Figure 3-19. SOURCE Key Group Menus
Page 49
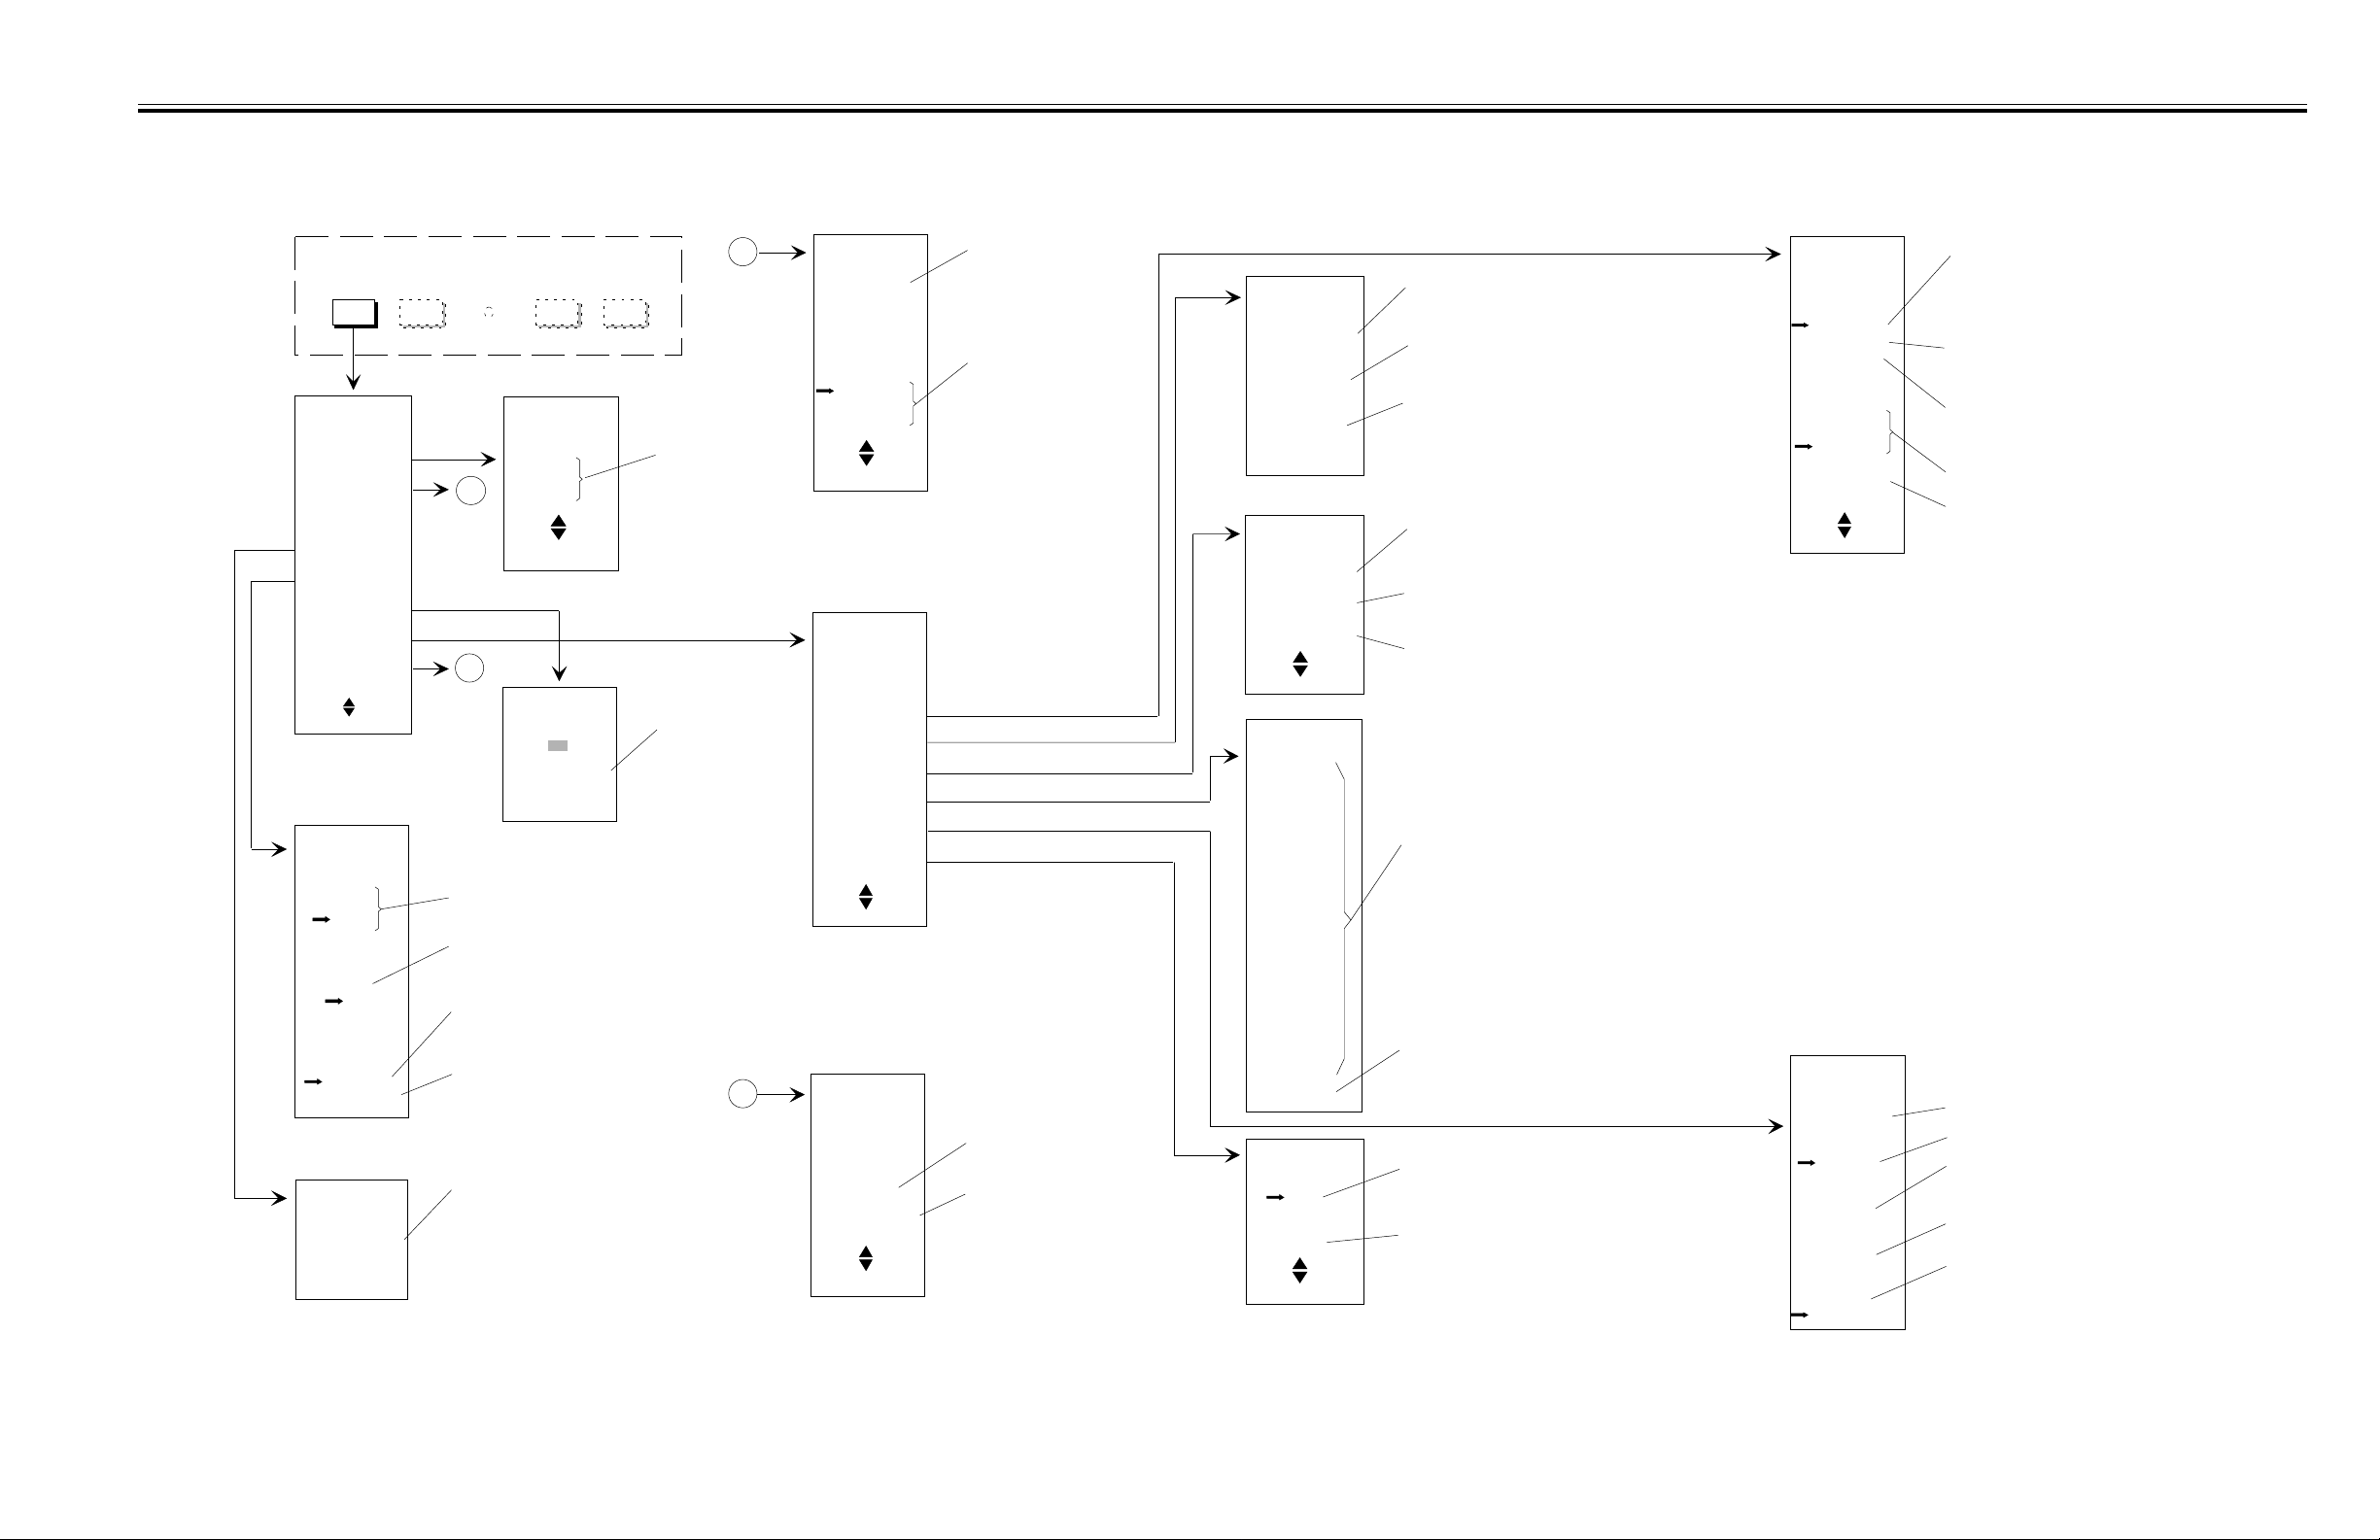
III FRONT PANEL OPERATION SYSTEM MENU KEY MENUS
SYSTEM
MENU
SYSTEM
MENU
DATA POINTS
RESET
CONFIGURE:
SOURCE
ANALYZER
PLOTTER
APPLICATIONS
GPIB MODE
USE THEN
PRESS SELECT
ANALYZER
TRACE HOLD:
CH1
CH2
BOTH
AUX CURSOR
READO UT
YES
NO
SMOOTHING
MODE
COUPLED
INDEPENDNT
SOURCE
OPERATION
PRESS SELECT
TO
ACTIVATE
SECURE MODE
KEY GROUP
SYSTEM FU N CT I ONS
SAVE/
RECALL
REMOTE
A
B
Freezes data (stops measurement)
for Channel 1 or Channel 2, or both.
Duplicates cursor readout display in
Error Message area of screen
display, if no error messages are
displayed.
Smoothing operation set by
SMOOTHING key menus apply to
both channels. See Figure 3-24
Smoothing operation set by
SMOOTHING key menus apply to
Channel 1 and /or Channel 2
independently. See Figure 3-24
When in SECURE MODE, all source
frequency information displayed below
graticule is replaced with "SECURE MODE
ACTIVE". All other frequency information
displays (cursor and menu displays for
markers, limits, etc.) are removed. Refer to
text.
RETURN
TO LOCAL
FREQ UE NCY
DATA P O IN T S
51
101
201
401
USE THEN
PRESS SELECT
SET PLOTTER
ADDRESS
8
SET ADDRESS
USING KNOB
OR KEYPAD
SELF
TEST
Selects the number
of measurement
points (frequency
source output
frequencies) per
measurement trace.
Use Data Entry
Knob or Keypad to
enter GPIB address
for external GPIB
controlled plotter
(default = 8). Press
CLEAR to exit.
A
RESET MENU
RESTORE
DEFAULT
SETUP
SELECT DATA
TO KEEP
CAL DATA
MARKERS
LIMITS
USE THEN
PRESS SELECT
SYSTEM
APPLICATION
SELECT
ROUTINE:
TRACES
AMPLIFIER
TITLES
COLOR
USER SCALING
AUTOZERO
USE THEN
PRESS SELECT
B
GPIB
MODE CHANGE
WARNI NG:
See note on
Rear Pan el
SYSTEM
PLOTTER ONLY
USE THEN
PRESS SELECT
Resets the 54XXA front
panel control settings to
factory-selected values.
All previously saved data
is erased, unless
specifically saved.
Allows previously saved
data to be retained
during system reset
operation (normally
erased). One, two, or all
three types may be
retained. Not active for
"SECURE" operating
mode; refer to text.
Exits to GPIB Address Setup
menu (Figure 3-21)
Sets 54XXA GPIB Interface to
PLOTTER mode. Then exits
to plotter setup menu (Figure
3-23)
AMPLIFIER
FUNCTI ON
START POWER
XX.X
MAX POWER
XX.X
INCREASE
POWER UNTI L
LIMITS FAIL
TITLE
FUNCT ION S
USER TITLES
STND TITL ES
ENTER TI TLES
USE THEN
PRESS SELECT
Text Col or
R 0
G 15
B 15
CH1 Color
R 15
G 15
B 0
CH 2 Color
R 15
G 0
B 0
Grat Col or
R 0
G 15
B 0
PRESET
AUTOZERO
MODE
ON
(default)
OFF
USE THEN
PRESS SELECT
Sets the initial power level of the
frequency source for the test. The test
restarts at this point each time test is
run.
Sets the maximum allowable power
level that will be output by the frequency
source during test.
Initiates test using initial power and
maximum power level values currently
set. Test terminates if either Channel 1
or Channel 2 limits are reached, or
maximum power level is reached (see
text).
Causes previously defined User Titles
to be used for screen display
measurement type titles. If titles for both
channels are currently defined, both willl
be displayed.
Reverts to standard screen display
measurement type titles
(TRANSMSSN, RETN LOSS, ETC).
Displays submenu to define User Titles
for Channel 1 and/or Channel 2.
Submenu "IDENTIFY" and "TEST
DEVICE" apply to Channel 1 and
Channel 2, respectively.
Sets the color characteristics of the text,
Channel 1 trace, Channel 2 trace, and
graticle for the external VGA monitor
display (Refer to Sections I and II). The
characteristics of the display text,
Channel 1 trace, Channel 2 trace, and
graticule elements can each be set
seperately.
Each group of three selections sets the
red, green, and blue component for the
associated display element. A value of
"0" designates full-off, and "15"
designates full on. The values shown
are power-on reset default values.
Resets the color display characteristics
to the power-on reset default values.
Turns Autozero function on
(normal operating mode - see
text).
Holds Autozero circuit
correction signal of each
active channel at current
value. This value remains
unchanged until function
returned to "on" (see text).
TRACE
FUNCT ION S
CHANNEL 1
MAX HOLD
MIN HOLD
MAX-MIN
CHANNEL 2
MAX HOLD
MIN HOLD
MAX-MIN
CLEAR ALL
USE THEN
PRESS SELECT
FREQUENCY
SCALING
MULTIPLIER
n
DIVISOR
n
OFFSET
XX.XXXX GHz
SELECT
SCALING
USER
STANDARD
Captures, displays, and holds the
maximum measurement values for
Channel 1 during succesive sweeps.
"AH" is displayed at the bottom of the
screen for all trace-hold operations.*
Captures, displays, and holds the
minimum measurementvalues for
Channel 1 during succesive sweeps.
Captures, displays, and holds both
maximum and minimum measurement
values for Channel 1 during succesive
sweeps.
Same as above, but for Channel 2.
Cancels trace-hold mode operation and
returns to normal measurement mode.
*Example: "AH12" displayed at bottom
of screen when Application Trace Hold
is Active for Channel 1 and Channel 2.
Enter integer value, from 1 to 10 (default
value = 1)
Enter integer value, from 1 to 10 (default
value = 1)
Enter Offset value, 0 to +/- 99.9999 MHz for
Models 5407/09/11, 0 to +/- 99.9999 GHz for
all other models (default value = 0).
Invokes Frequency Scaling mode (if off).
Uses currently set scaling parameters; see
text.
Cancels Frequency Scaling mode.
54XXA OM 3-27/3-28
Figure 3-20. SYSTEM MENU Key M enus
Page 50
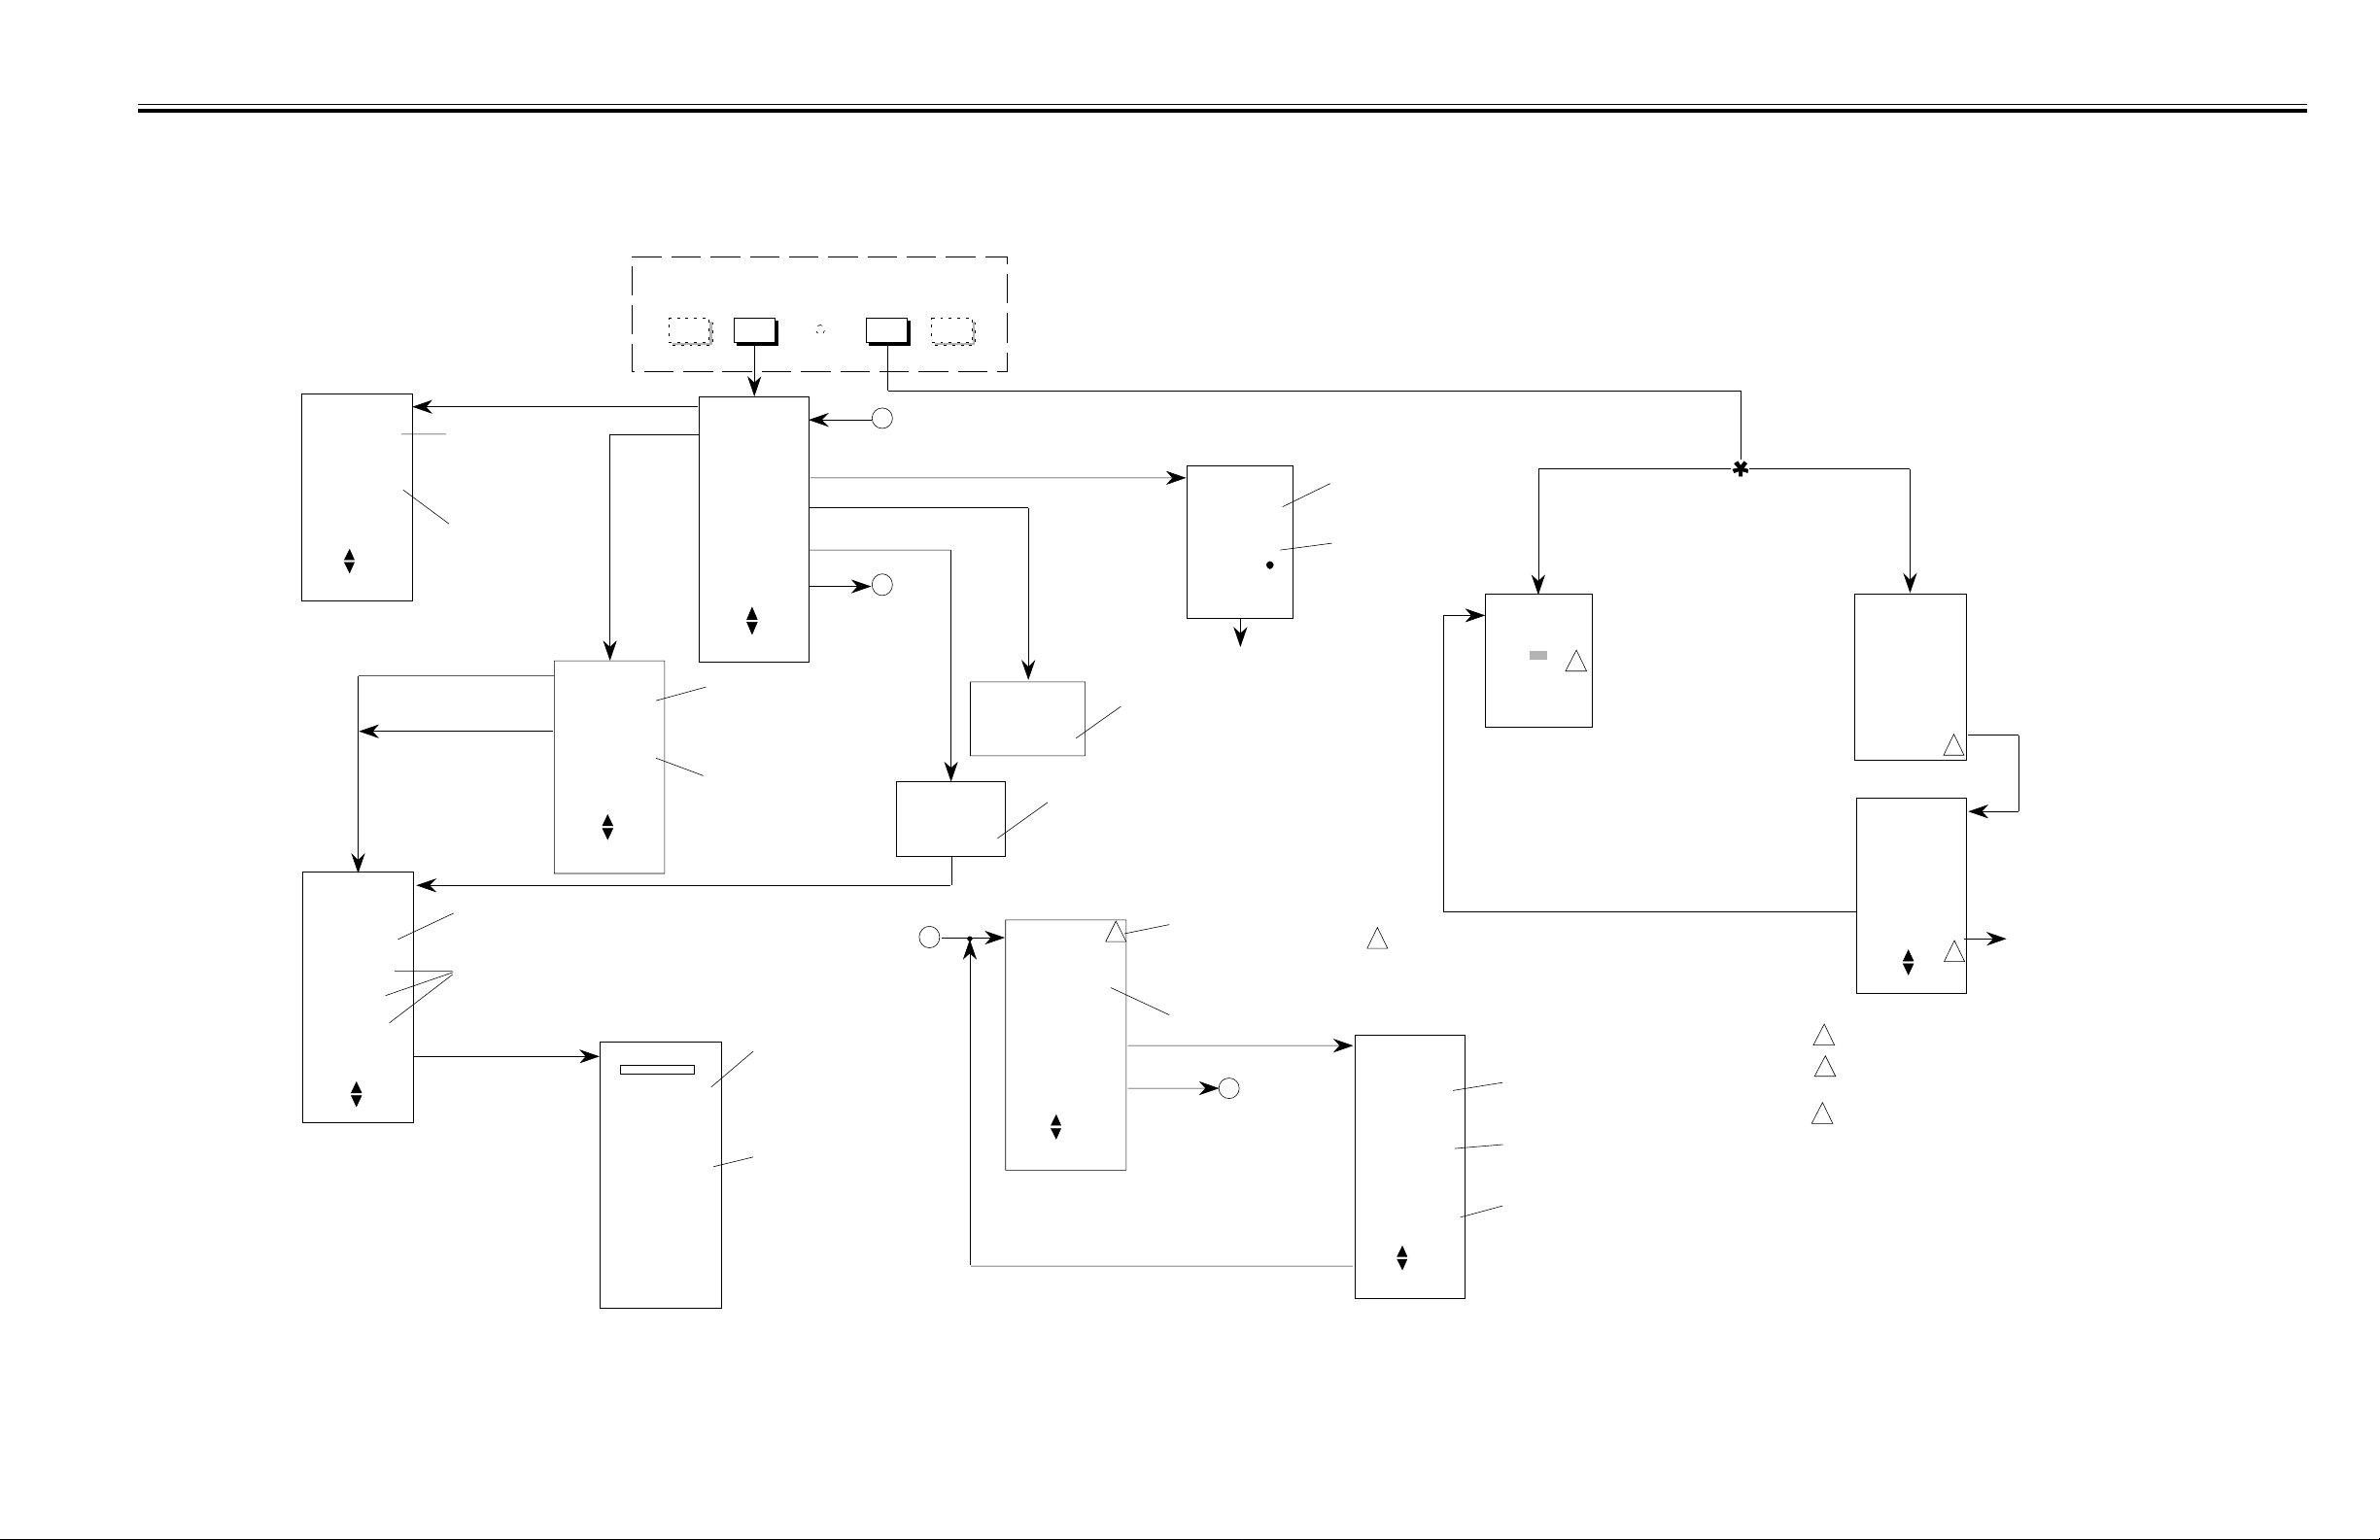
SAVE/RECALL KEY MENUS AND
3
III FRONT PANEL OPERATION RETURN TO LOCAL KEY MENUS
KEY GROUP
SYSTEM
MENU
SYSTEM FUNCTIONS
SAVE/
RECALL
REMOTE
RETURN
TO LOCAL
SELF
TEST
RECALL
FRONT PANEL
SET UP ONLY
(1 TO 9)
CALIBRATION
TRACE MEMORY
AND SET UP
(1 TO 4 ONLY)
USE THEN
ENTER MEMORY
NUMBER
SET UP TITLES
AVAILABLE:
(LAST ONE)
(IDENTIFY)
(DATE)
(DEVICE)
ENTER NEW
TITLE
USE THEN
PRESS SELECT
Recalls a previously
stored control panel
setup from setup
storage memory
locations 1 thru 9.
Recalls a previously
saved calibration,
trace, and front panel
setup from setup
storage memory
locations 1 - 4.
SAVE
FRONT PANEL
SET U P ON L Y
(1 TO 9)
CALIBRATION
TRACE MEMORY
AND SET UP
(1 TO 4 ONLY)
USE THEN
ENTER MEMORY
NUMBER
Selects the title last used for
selected store location as
the new title.
Lists the title items entered
via the "HARD COPY" key
menus. Any of the listed title
items may be applied to the
new title.
TITLE ENTRY*
ABCDEFGHIJKL
MNOPQRSTUVWX
YZ 0123456789
# ( ) +- . , / < > ?
CLR DEL DONE
USE KNOB TO
SELECT TEXT
PRESS ENTER
OR SELECT
OR USE
KEYPAD
RECALL
SAVE
PREVIEW
RECALL TRACE
MEMORIES
SAVE TRACE
MEMORIES
CONFIGURE
RECALL ONLY
USE THEN
PRESS SELECT
Stores the current front panel
setup into setup storage
memory location 1 - 9. Also
displays the SET UP TITLES
submenu.
Stores the current calibration,
trace, and front panel setup
into setup storage memory
location 1 - 4. Also displays
the SETUP TITLES submenu.
Use Data Entry knob to select
desired character, then press
ENTER or SELECT. Repeat as
necessary to complete title string.
Keypad keys may be used for
numeric character entry.
Select CLR to clear entire title
entry; select DEL to erase
previous character entered; select
DONE to exit.
*Same as HARD COPY TITLE
ENTRY Menu.
B
A
SAVE TRACE
ENTER 1 TO 4
MEMORY
A
RECALL TRACE
MEMORY
ENTER 1 TO 4
Stores the currently displayed trace data into
trace memory storage location (1 - 4). Limits
or complex limits setup information may also
be stored (see text). This menu exits to SET
UP TITLES menu.
RECALL MODE
FRONT PANEL
SETUP ONLY
ENTER SETUP
TO BE
RECALLED
CONFIGURE
RECALL MODE
SAVE/RECALL
MODE
USE THEN
ENTER MEMORY
NUMBER
PREVIEW
FOR SET UP
PRESS 1 - 9
FOR INDEX
PRESS
PRESS 0 TO
EXIT
Exits to previous
measurement screen.
Recalls the trace data information
that was previously stored in trace
storage memory location (1 - 4).
3
Menu title displayed will reflect
recall data/mode currently active.
Refer to text for description of
operation in Single - Button Recall
mode.
Enter number of Setup to be
recalled.
B
(Return to main menu)
Displays front panel setups
on the screen from memory
locations 1 - 9.
Lists stored setups on
the screen by title.
3
CONFIGURE
RECALL MODE
FRONT PANEL
SET UP ONLY
(1 TO 9)
CALIBRATION
TRACE MEMORY
AND SET UP
(1 - 4 ONLY)
TRACE MEMORY
(1 - 4 ONLY)
USE THEN
ENTER MEMORY
NUMBER
GPIB Interface
Set to SYSTEM Mode
SET GPIB
ADDRESS
6
SET ADDRESS
USING KNOB
OR KEYPAD
Enter number of Front Panel
Setup for Single Button
Recall.
If setting for Calibration
Setup recall, enter number
of desired setup.
If setting for Trace Memory
data recall, enter number of
desired Trace Memory.
1
GPIB Interface
Set to PLOTTER Mode
GPIB MODE
IS SET TO
PLOTTER ONLY
SYSTEM
GPIB MODE IS
NOT SELECTED
PRESS SELECT
TO CHANGE
GPIB MODE
MODE CHANGE
WARNING:
SEE NOTE ON
REAR PANEL
SYSTEM
PLOTTER ONLY
USE THEN
PRESS SELECT
1
To exit this menu, press CLEAR Key
2
To exit these menus without change, press
CLEAR key (or any menu function key).
3
Alternate menu titles:
RECALL MODE
CALIBRATION
TRACE MEMORY
AND SETUP
GPIB
2
2
(or)
RECALL MODE
TRACE MEMORY
To Plotter Setup
menu; See Figure 3-2
54XXA OM 3-29/3-30
Figure 3-21. SAVE/RECALL Key Menus an d
RETURN TO LOCAL Key Menus
Page 51
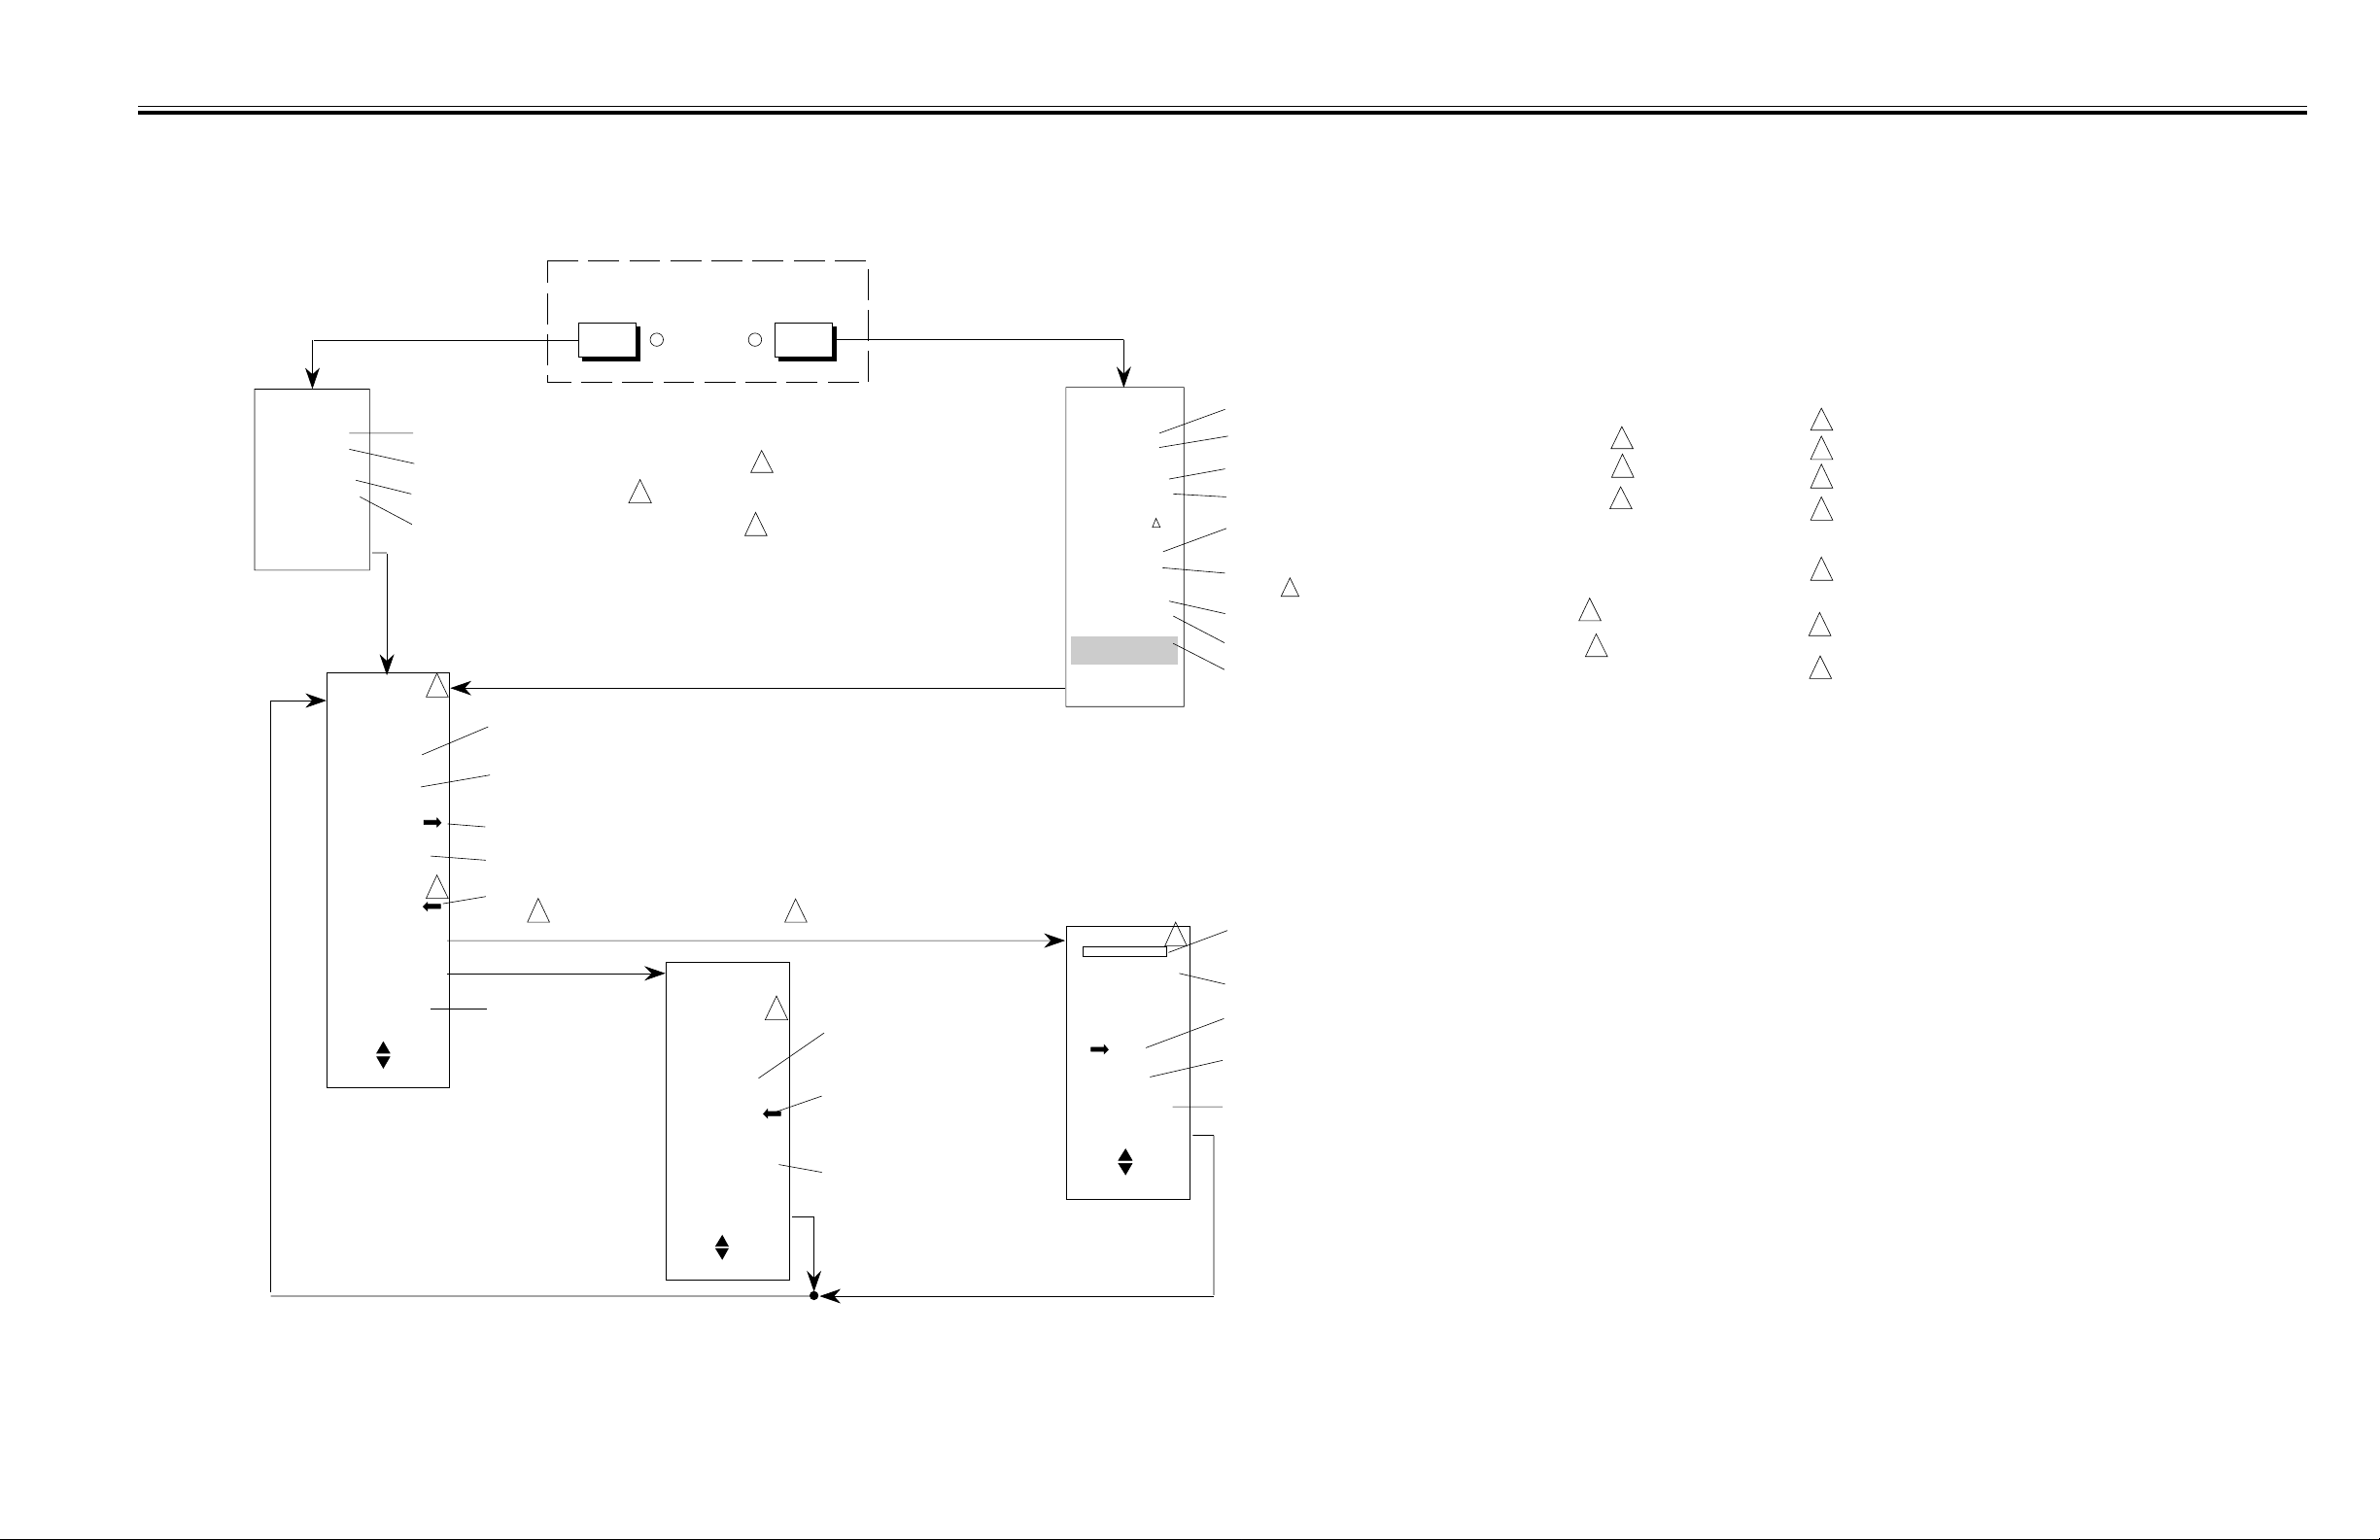
III FRONT PANEL OPERATION CURSOR KEY GROUP MENUS
s
KEY GROUP
CURSOR
RELATIVEON/OFF
CURSOR
1: XX.XXdB
2: XX.XXdB
XX.XXXXGHz
(XX.XXXXGHz)
PRESS SELECT
FOR
CURSOR MENU
CHANNEL 1
MOVE CURSOR
ACTIVE MKR
dB SEARCH
SET CHAN 2
USE THEN
PRESS SELECT
TO
MAXIMUM
MINIMUM
NEXT MKR
X.XX dBr L
SETUP
OPTIONS
Amplitude readout at main cursor position for Trace 1.
Amplitude readout at main cursor position for Trace 2.
Frequency at main cursor position.
Frequency of alternate sweep at main cursor position.
3
Moves the cursor to the maximum value of the measurement
trace data.
Moves the cursor to the minimum value of the measurement
trace data.
Moves the cursor to the next frequency marker.
Moves the cursor to the active frequency marker.
4
Initiates the cursor search function defined by the Setup
menu . The search value (absolute or relative ) is
6
indicated along with the search type.
Changes Cursor operation
to opposite channel.
7
CURSOR
OPTIONS
CHANNEL 1
SEARCH FOR:-
MIN-MAX
0.00 dBr L
FROM MAX
REPEAT SRCH
EACH SWEEP
MAIN MENU
1
2
5
3
Initiates a search that places active
cursor on maximum peak value and
relative cursor on minimum value.
Initiates search to value relative to
maximum trace value. Search type
and search value as set in Setup
Menu.
Repeats the selected cursor search
for each measurement sweep.
CURSOR
1: XX.XXdB
2: XX.XXdB
XX.XXXXGHz
(XX.XXXXGHz)
RELATIVE( )
1: XX.XXdB
2: XX.XXdB
XX.XXXXGHz
(XX.XXXXGHz)
EXCHANGE
REF CURSOR
CURSOR MENU
CHANNEL 1
SEARCH VALUE
XX.XX dB
SEARCH TYPE
LEFT
RIGHT
BANDWIDTH
MAIN MENU
USE THEN
PRESS SELECT
Amplitude readout at active (main) cursor position for Trace 1.
Amplitude readout at active (main) cursor position for Trace 2.
Frequency readout at active (main) cursor position for Trace 1.
Frequency readout at active (main) cursor position for Trace 2.
Amplitude difference between main and relative cursors for
Trace 1.
Amplitude difference between main and relative cursors for
Trace 2.
1
Frequency difference between main and relative cursors.
Frequency difference between cursors for Alternate sweep.
Select to interchange frequency positions of main and
relative cursors.
"RELATIVE" will be displayed here if using Relative cursor (SEARCH
3
TYPE= Relative). Will be blank if using active cursor (SEARCH TYPE=
absolute).
Enter the amplitude value for selected cursor search function (in dB).
Sets up a dB search to the left of the present main cursor position. Value
searched for is the dB SEARCH value.
Sets up a dB search to right of the present main cursor position. Value
searched for is the dB SEARCH value.
Sets up a bandwidth cursor search. Set cursor within search range before
initiating search . (The two cursors will diverge to indicate bandwidth - see
text.)
1
7
1
7
2
NOTES:
1
Displayed only if Trace 2 is used.
2
Displayed only if Alternate Sweep is used.
3
Display channel presently selected for cursor operation.
4
L signifies LEFT search
R signifies RIGHT search
BW signifies Bandwidth search
5
"dB" signifies search to absolute dB value. "dBr" signifie
search to value relative to current active cursor value
(setup menu) or to trace maximum value (Options menu)
6
Subsequent use of the "dB" search function from the
Options menu will modify this selection.
7
All frequency information displayed by these menus is in
MHz for Models 5407/09/11. It is displayed in GHz for all
other models.
USE THEN
PRESS SELECT
54XXA OM 3-31/3-32
Figure 3-22. CURSOR Key Gro up Menus
Page 52
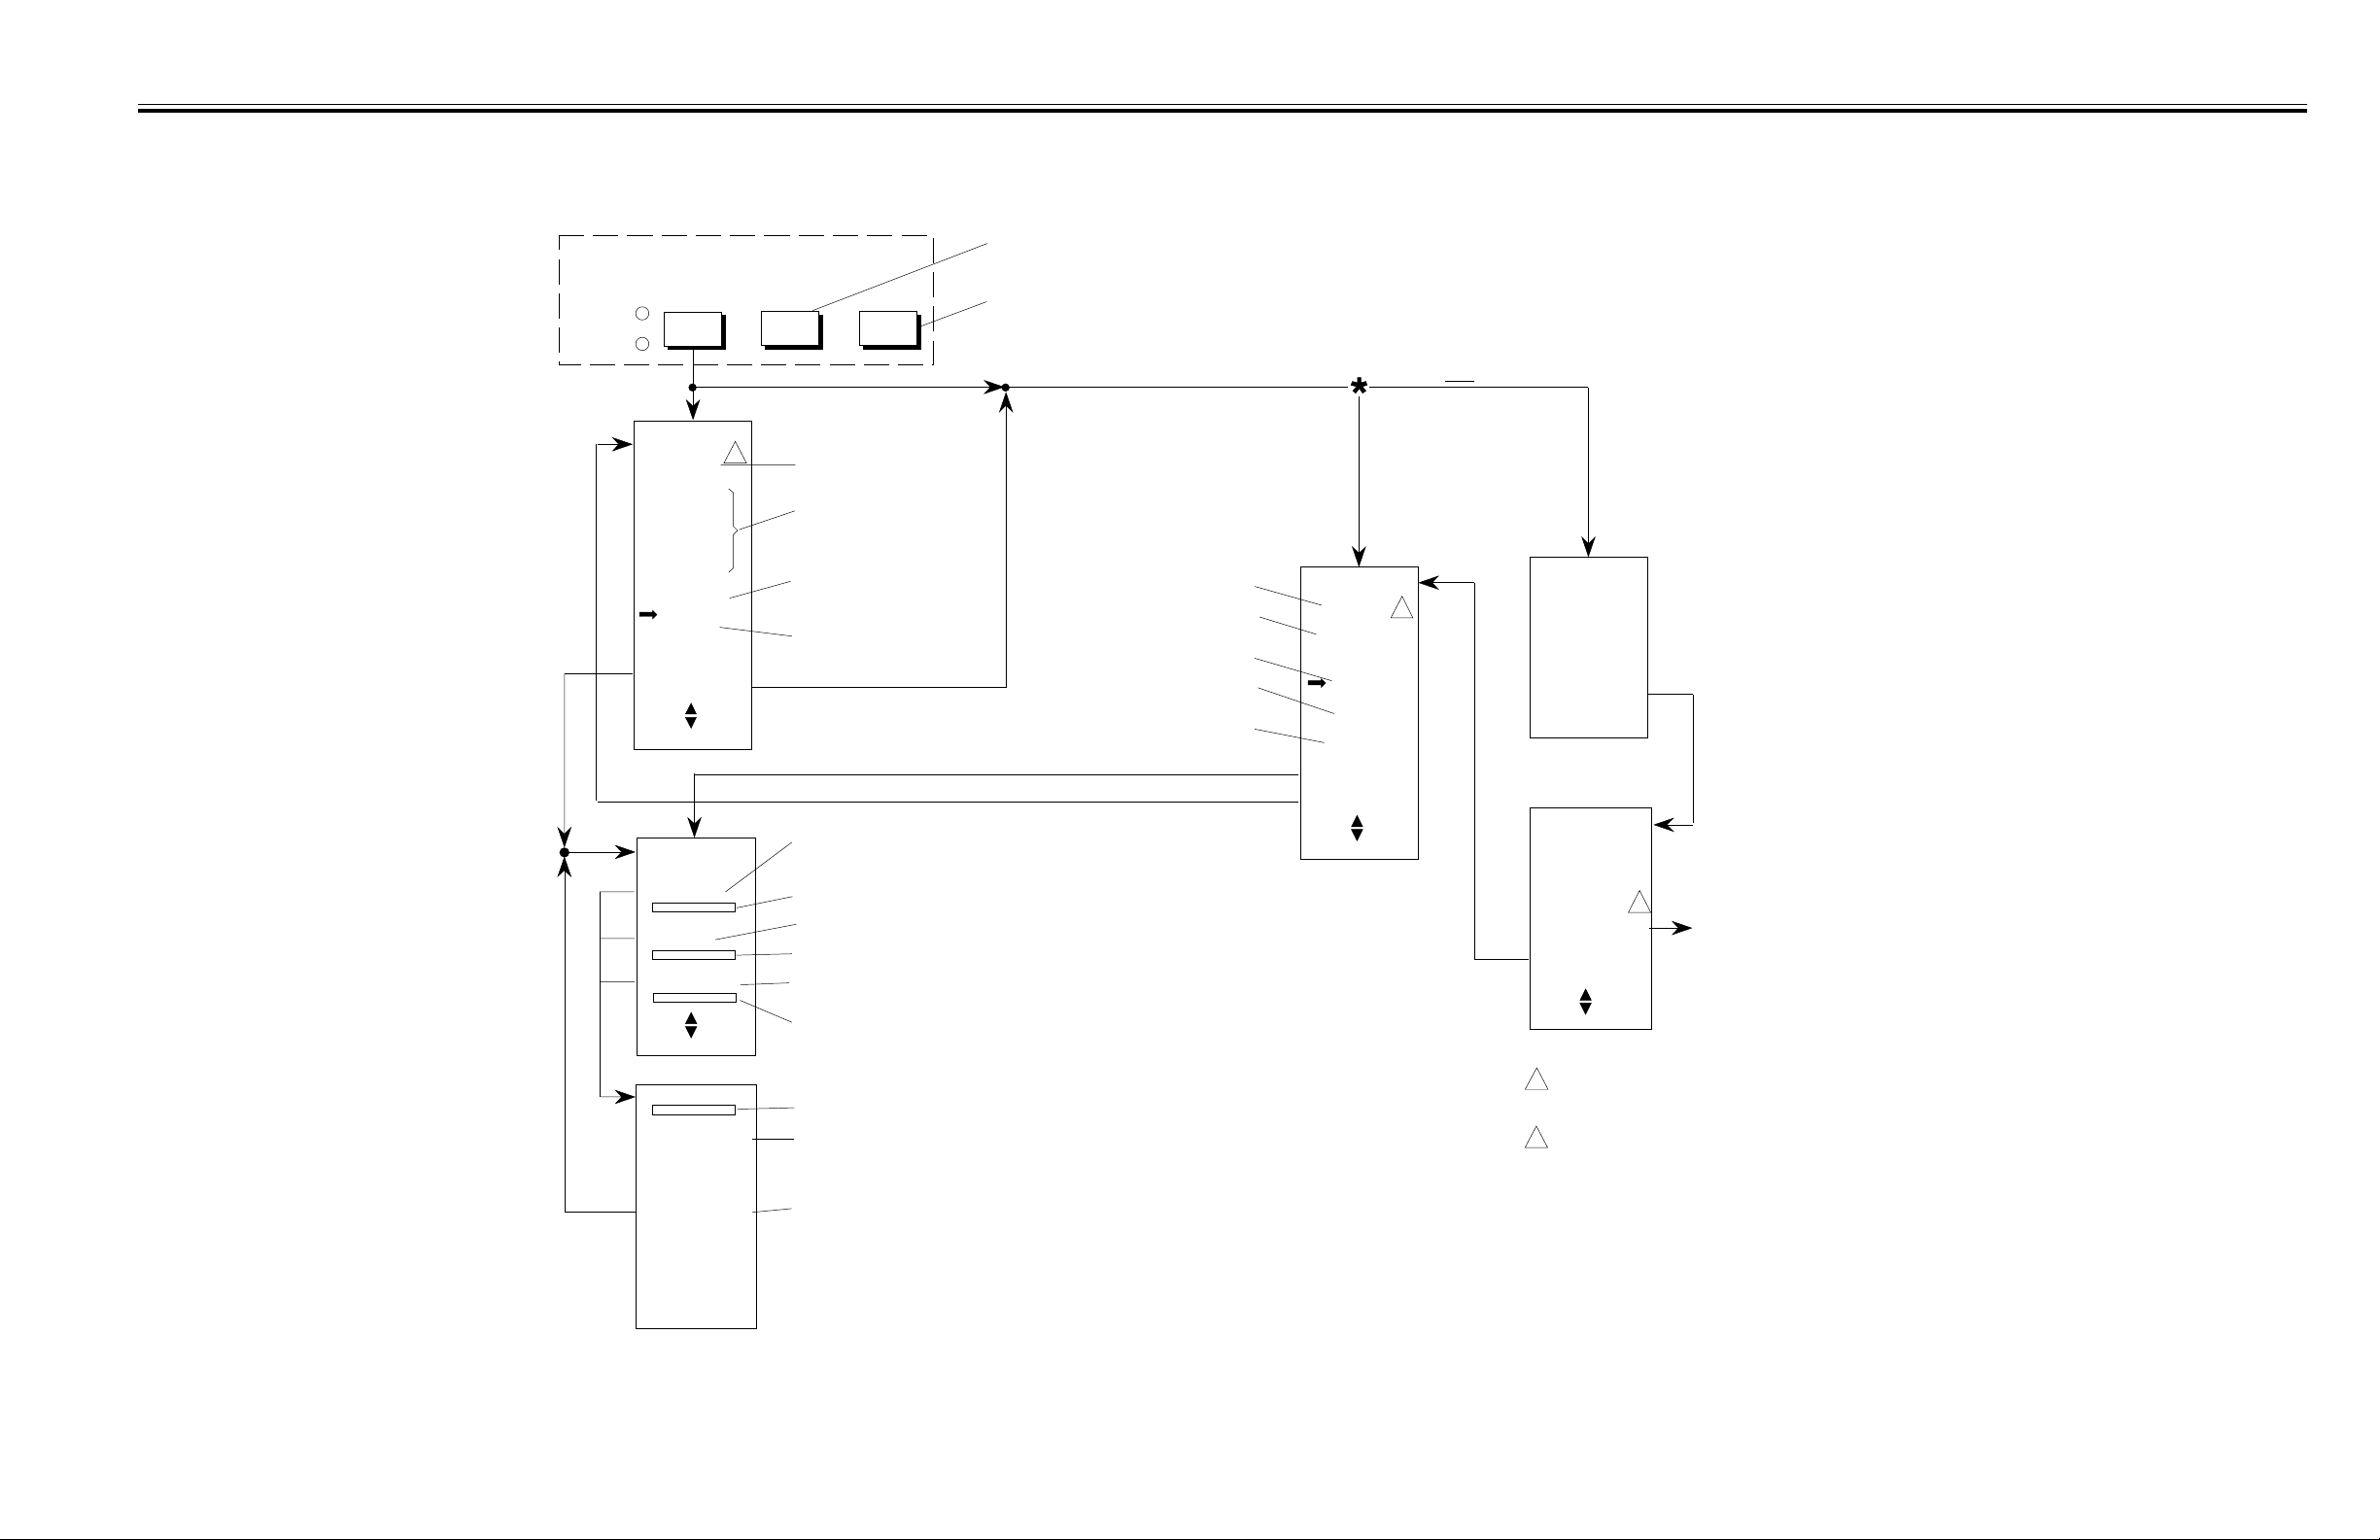
III FRONT PANEL OPERATION HARD COPY KEY GROUP MENUS
KEY GROUP
Starts printing/plotting operation. The type of
hard copy produced is determined by the
PRINTER/PLOTTER MENU options selected.
Stops Hard copy output operation for device
indicated by LED(s). If output is to printer,
stop is almost immediate (set text). If to
plotter, the current data string is plotted and
the plotter is left in a reset state.
PRINTER
PLOTTER
MENU
HARD COPY
START STOP
OR
GPIB Interface
NOT
Set to Plotter Mode
MNOPQRSTUVWX
DONE
PRINTER MENU
GRAPH
TABULAR:
26 POINT
51 POINT
101 POINT
201 POINT
401 POINT
MARKERS
LIMITS
ENTER TITLES
PLOTTER MENU
USE THEN
PRESS SELECT
SELECT TITLE
TO ENTER
IDENTITY
TEST DEVICE
USE THEN
PRESS SELECT
TITLE ENTRY
ABCDEFGHIJKL
YZ 0123456789
# ( ) +- . , / < > ?
CLR DEL DONE
USE KNOB TO
SELECT TEXT
PRESS ENTER
OR SELECT
OR USE
KEYPAD
2
DATE
Prints the measurement
screen display on the printer.
Selects the number of data
points to be printed per
measurement channel
- 26, 51, 101, 201, or 401.
Prints data only from
the frequency-marker
measurement points.
Prints measurement limit
data only.
Up to twelve characters may be entered as an identifier for the
type of test (such as, TNSM for transmission, RL for return
loss, PWR for power or a name for operator ID).
Present Identity string displayed here, when selected.
Date can be entered as any combination of numbers or letters
Present Date string displayed here, when selected.
Up to twelve characters may be entered as an identifier for the
device under test name.
Present Test Device string displayed here, when selected.
When Title Entry completed, press CLEAR (or any other menu
key) to exit.
Selected entry string displayed here.
Use knob or UP/DOWN keys to select desired character, then
press ENTER or SELECT. Repeat as necessary to complete
title string. Keypad keys may be used for numeric character
entry.
Select CLR to clear entire title entry: select DEL to erase
previous character entered; select DONE to exit.
Plots the screen display on plotter.
Plots only the graticule data from the
Plots only the measurement trace data.
Plots only the titling data from the
Plots only the cursor readout data.
screen display.
screen display.
PLOTTER MENU
PLOT ALL
PLOT ONLY:
GRATICULE
TRACES
CURSOR
ENTER TITLES
PRINTER MENU
USE THEN
PRESS SELECT
2
TITLE
GPIB Interface
Set to Plotter Mode
PLOTTER ONLY
GPIB MODE IS
NOT SELECTED
PRESS SELECT
MODE CHANGE
SEE NOTE ON
REAR PANEL
PLOTTER ONLY
USE THEN
PRESS SELECT
1
2
GPIB MODE
IS SET TO
SYSTEM
TO CHANGE
GPIB MODE
GPIB
WARNING:
1
SYSTEM
In the GPIB PLOTTER mode of operation,
only the 54XXA and external plotter may be
connected to the GPIB.
All frequency information printed or plotted by
models 5407/09/11 is in MHz. For all other
models, it is printed/plotted in GHz.
To GPIB Address Setup menu;
see RETURN TO LOCAL key
menus, Figure 3-21
54XXA OM 3-33/3-34
Figure 3-23. HARD COPY Key Group Menus
Page 53
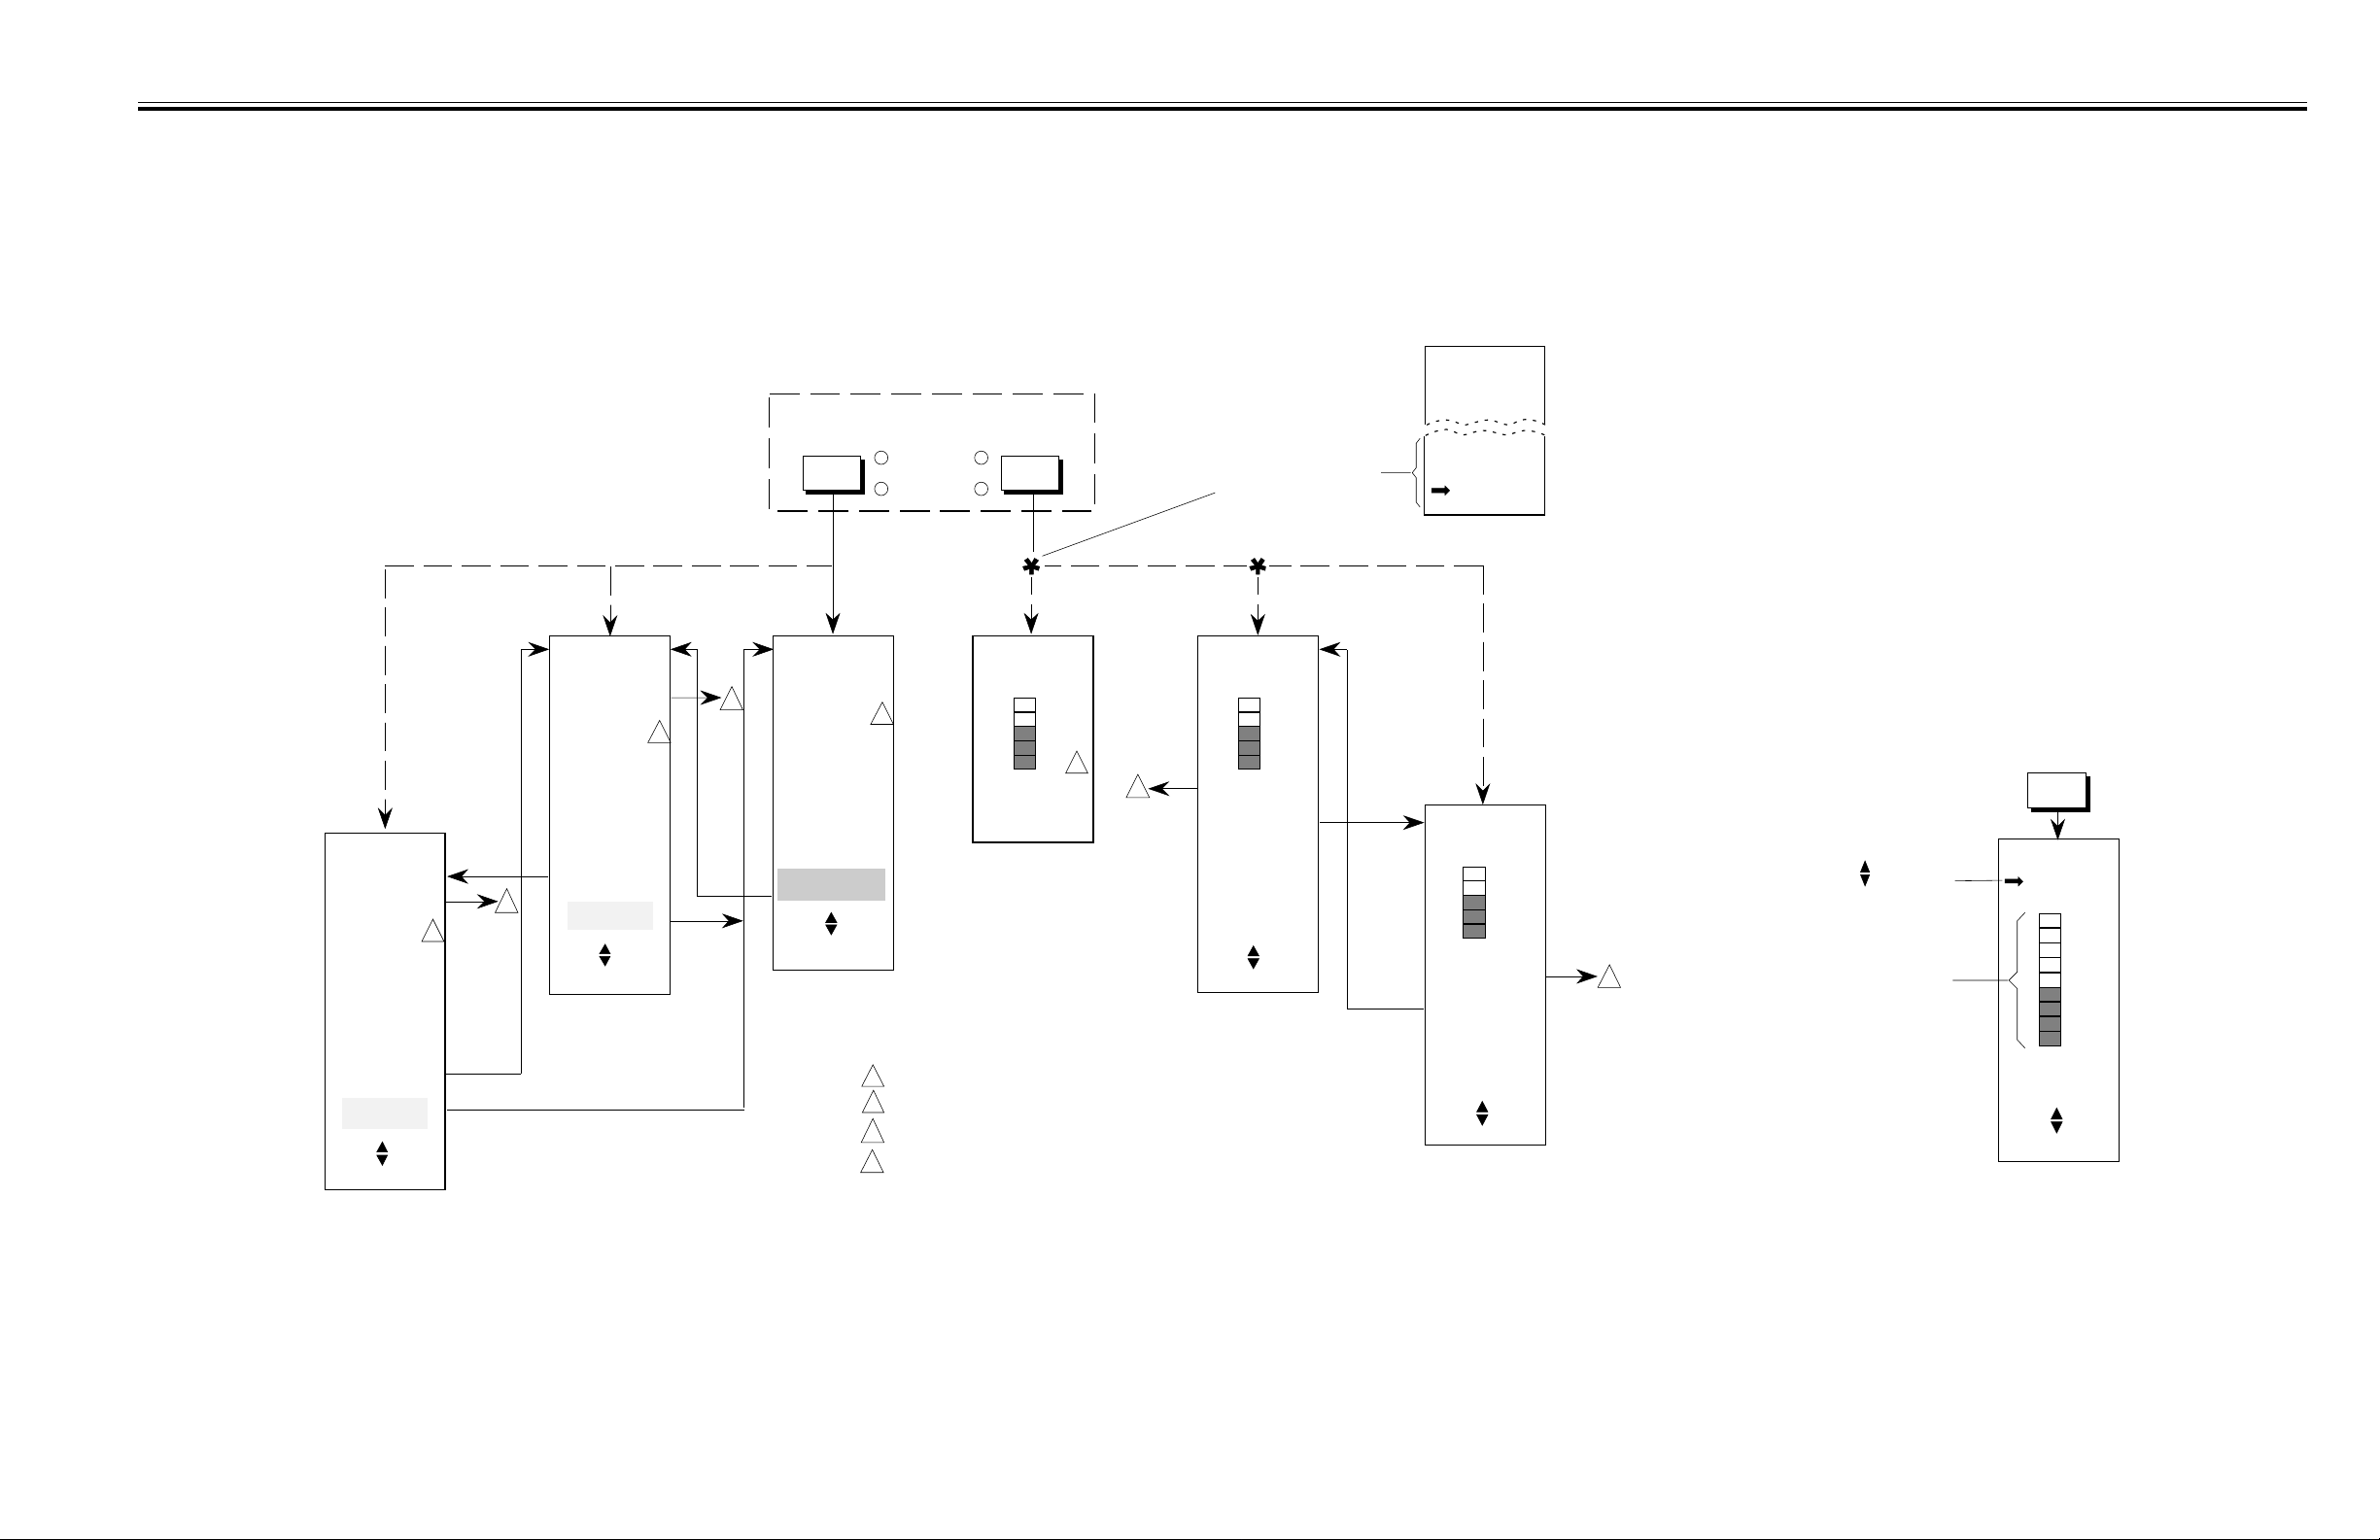
ENHANCEMENT KEY GROUP MENUS AND
III FRONT PANEL OPERATION INTENSITY KEY MENU
ANALYZER
KEY GROUP
ENHANCEMENT
AVERAGING SMOOTHING
CHANNEL 1
CHANNEL 2
Coupled or Independent as
set by ANALYZER menu.
(See SYSTEM MENU key
menus - Figure 3-20.)
If Channel 2 previously selected
TRACE HOLD:
CH 1
SMOOTHING
MODE
COUPLED
INDEPENDNT
AVERAGING
CHANNEL 2
OFF
2 SWEEPS
4 SWEEPS
8 SWEEPS
16 SWEEPS
32 SWEEPS
64 SWEEPS
128 SWEEPS
256 SWEEPS
SET CHAN 1
COUPLE
CHANNELS
USE THEN
PRESS SELECT
AVERAGING
CHANNEL 1
OFF
2 SWEEPS
4 SWEEPS
8 SWEEPS
16 SWEEPS
32 SWEEPS
64 SWEEPS
128 SWEEPS
256 SWEEPS
SET CHAN 2
3
1
COUPLE
CHANNELS
USE THEN
PRESS SELECT
1
3
AVERAGING
CH1 + CH2
2 SWEEPS
4 SWEEPS
8 SWEEPS
16 SWEEPS
32 SWEEPS
64 SWEEPS
128 SWEEPS
256 SWEEPS
INDEPENDENT
CHANNELS
USE THEN
PRESS SELECT
NOTES
3
4
1
1
To turn off Averaging from this menu, press AVERAGING key.
2
To turn off Smoothing from this menu, press SMOOTHING key.
Turns off Averaging for indicated channel, then exits to display mode.
Turns off Smoothing for indicated channel then exits to display mode.
SMOOTHING
CH1 + CH2
MAX
5
4
3
2
1
MIN
USE KNOB OR
KEYPAD TO
SET LEVEL
2
4
SMOOTHING
CHANNEL 1
MAX
5
4
3
2
1
MIN
OFF
SET CHAN 2
USE
KEYPAD TO
SET LEVEL
USE THEN
PRESS SELECT
SMOOTHING
CHANNEL 2
MAX
5
4
3
2
1
MIN
OFF
SET CHAN 1
USE
KEYPAD TO
SET LEVEL
USE THEN
PRESS SELECT
INTENSITY KEY
INTENSITY
Use MENU key to select
trace display or graticule
intensity adjustment;
4
then press SELECT. When
this portion displayed,
use knob or keypad to set
intensity to desired level.
MONITOR
GRATICULE
9
MAX
8
7
6
5
4
3
2
1
MIN
USE KNOB OR
KEYPAD ENTRY
USE THEN
PRESS SELECT
54XXA OM 3-35/3-36
Figure 3-24. ENHANCEMENT Key Gro up Menus
and INTENSITY Key Menu
Page 54

SECTION IV
MEASUREMENT AND CALIBRATION
PROCEDURES
Table of Contents
4-1 INTRODUCTION . . . . . . . . . . . . . . . . . . . . . . . . . . . . . 4-3
4-2 OPERATIONAL CHECKOUT PROCEDURE . . . . . . . . . . . . . . 4-3
4-3 CALIBRATION PROCEDURE . . . . . . . . . . . . . . . . . . . . . . 4-3
Calibration Menu . . . . . . . . . . . . . . . . . . . . . . . . . . . . . . 4-3
4-4 MEASUREMENT PROCEDURES . . . . . . . . . . . . . . . . . . . . 4-3
Transmission and Return Loss Measurements . . . . . . . . . . . . . . 4-3
Alternate Sweep Measurements . . . . . . . . . . . . . . . . . . . . . . 4-4
Ratio Mode Measurements . . . . . . . . . . . . . . . . . . . . . . . . . 4-4
Absolute Power Measurements . . . . . . . . . . . . . . . . . . . . . . 4-4
Other Measurement Procedures . . . . . . . . . . . . . . . . . . . . . . 4-4
54XXA OM 4-1/4-2
Page 55

SECTION IV
MEASUREMENT AND CALIBRATION
PROCEDURES
4-1 INTRODUCTION
This section describes:
How to check that the instrument is operating
•
properly.
How to perform a measurement setup calibration.
•
How to make transmission, return loss, power,
•
and alternate sweep frequency range measurements.
4-2 OPERATIONAL CHECKOUT
PROCEDURE
The 54XXA Scalar Measurement System undergoes
a comprehensive self test when turned on, or when
the SELF TEST key is pressed. The “ALL TESTS
PASSED” message that displays on the screen at the
conclusion of the self test signifies t hat all internal
control circuits are operating properly.
To perform a simple operational check that confirms
that the frequency source and network analyzer circuits are functioning, follow the procedure outlined
in Table 4-1.
4-3 CALIBRATION PROCEDURE
Before the 54XXA is used for a transmission or reflection measurement, a test setup normalization
procedure must be performed. This procedure is re-
ferred to as “calibration.” Calibration is the process
whereby losses inherent in a transmission or return
loss measurement system are measured, stored in
internal memory, and later subtracted from the test
measurement data. As a result, subsequent screen
displays (and test data) reflect the characteristics of
the test device only.
NOTE
A calibration is not required before using
the 54XXA to perform power measurements.
When the CALIBRATION key is presse d, a series of
menus/instructions are displayed that guide the
user through the calibration procedure. The calibration procedure should be performed using the same
test set up (with the device -under -test re moved) that
will be used for the actual test. This includes using
the same power level and measurement frequencies
as for the actual test. A typical setup for transmission and return loss measurements (and calibration)
is shown in Figure 4-1.
4-3.1 Calibration Menu
The main calibration menu has three selections:
a. START CAL — This selection disp lays the in-
structions / m enus for the normal calibration sequence for transmission and reflection measurements (Table 4-2).
b. DETECTOR OFFSE TS — This selection al-
lows an offset (express ed in dB) to be specified
for any detector use d with th e A, B, or R inputs.
These values remain in memory, ev en after the
54XXA is powered down. The offsets can be
cleared by reselecting DETECTOR OFFSETS
and entering “0 dB.” Whenever one or more detector offsets are use d, a status message is displayed at the bottom of the screen. Example:
“DET OFS ABR” indicates that non-zero offsets
have been entered for each of the three inputs.
c. DC CAL MENU — This selection is used in
conjunction with the POWER selection from the
NETWORK ANALYZER menus for Channel 1
and/or Channel 2 to perform absolute power
measurements. Refer to Table 4-6 (page 4-14).
4-4 MEASUREMENT PROCEDURES
The 54XXA Scalar Measurement System can be used
to make transmission loss or gain, return loss, absolute power, and SWR measurements. Any of these
measurements can be set up using feat ures such as
alternate sweep frequency ranges, and/or trace
memory subtraction.
4-4.1 Transmission and Return Loss
Measurements
The procedure for making transmission and return
loss measurements is described in Table 4-3 on
page 4-7. A screen display for a typical application is
54XXA OM 4-3
Page 56
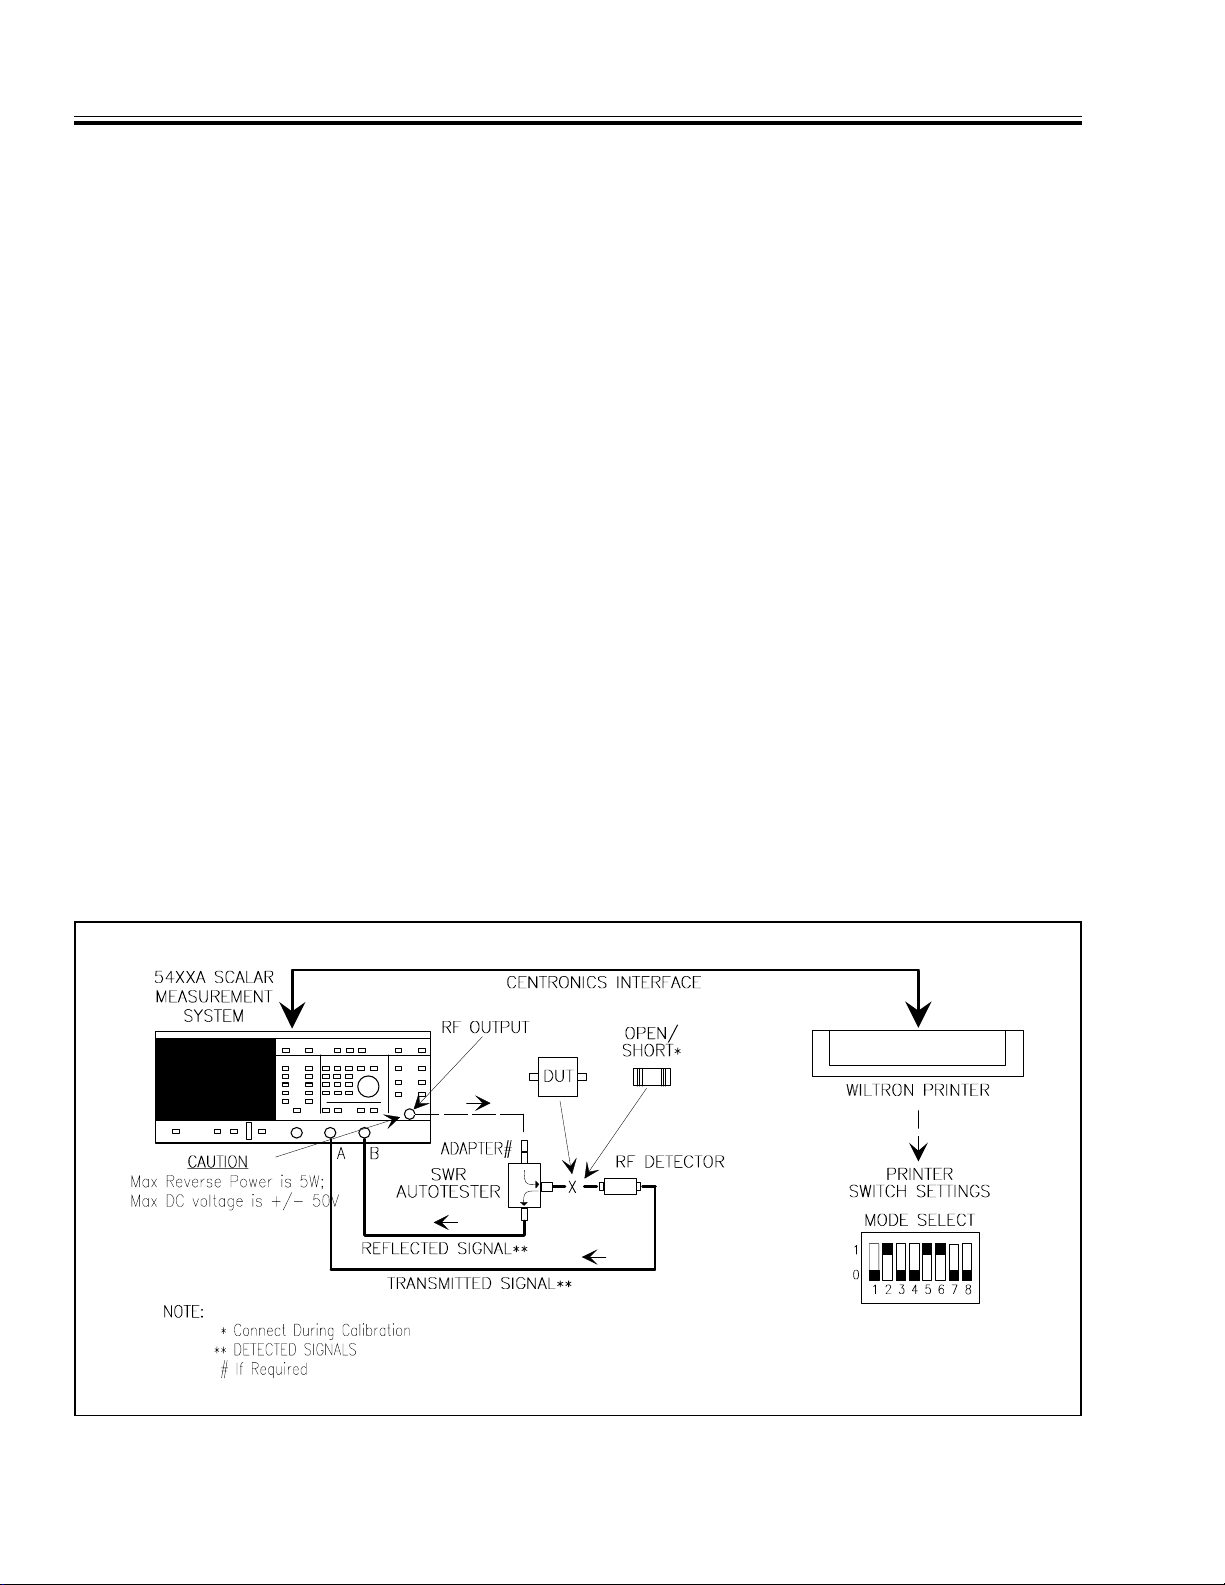
OPERATIONAL CHECKOUT PROCEDURE IV MEASUREMENT AND CALIBRATION PROCEDURES
shown in the table. The typical equipment setup for
these types of measurements is shown in Figure 4-1.
4-4.2 Alter nate S weep Me asurem ents
The procedur e fo r mak ing al ter na te sw ee p mea surements is described in Table 4-4 (page 4-10). The
equipment setup for this type of measurement is
generally the same as for transmission and return
loss measurements. In this mode, the second (alternate setup) sweep parameters are set differently
from the regular sweep — usually with a reduced
frequency s pan. (This produces an expanded measurement display for the second sweep.) The alternate sweep mode is controlled via the menus associated with the ALTERNATE SWEEP key.
4-4.3 Ratio Mode Measurements
Ratio-mode measurements arithmetically subtract
the R input from e ither the A or B input. This type
of measurement is set up by using the NETWORK
ANALYZER channel setup menus for Channel 1
and/or Channel 2. The procedur e for making these
measurements is described in Table 4-5 (page 4-12).
A typical equipment setup for this measurement is
shown in Figure 4-3.
The ratio measurement mode has many uses. It can
be used to compensate for the effects of a long signal
transmission path, such as where the device-under-
test (DUT) is located remotely from the 54XXA
system. Using extender cables between the
Autotester (and/or detector) and the 54XXA, it is
possible to locate the DUT up to 200 feet from the
54XXA (refer to Section I). Ratio mode can also be
used to maintain system calibration when the RF
OUTPUT level is changed during the test.
4-4.4 Absolute Power Measurements
The procedure f or making absolut e power measure ments is described in Table 4-6 (page 4-14) . A typical
equipment setup for this measurement type is
shown in the diagram included in the table.
4-4.5 Other Measurement Procedures
Additional information pertaining to 54XXA measurement procedures are included in the three application notes that are located behind the “Supplements/Options” tab at t he rear of this manual:
Application Note 5400A-1 — Testing Microwave
•
Amplifiers.
Application Note 5400A-2 — Testing Microwave
•
Mixers.
Application Note 5400A-3 — Programming the
•
5400A System Using Microsoft QuickBASIC
Microsoft QuickBASIC is a registered trademark of Microsoft
Corporation.
.
Figure 4-1. Typical Equipment Setup for Transmission and Return Loss Measurements
4-4 54XXA OM
Page 57
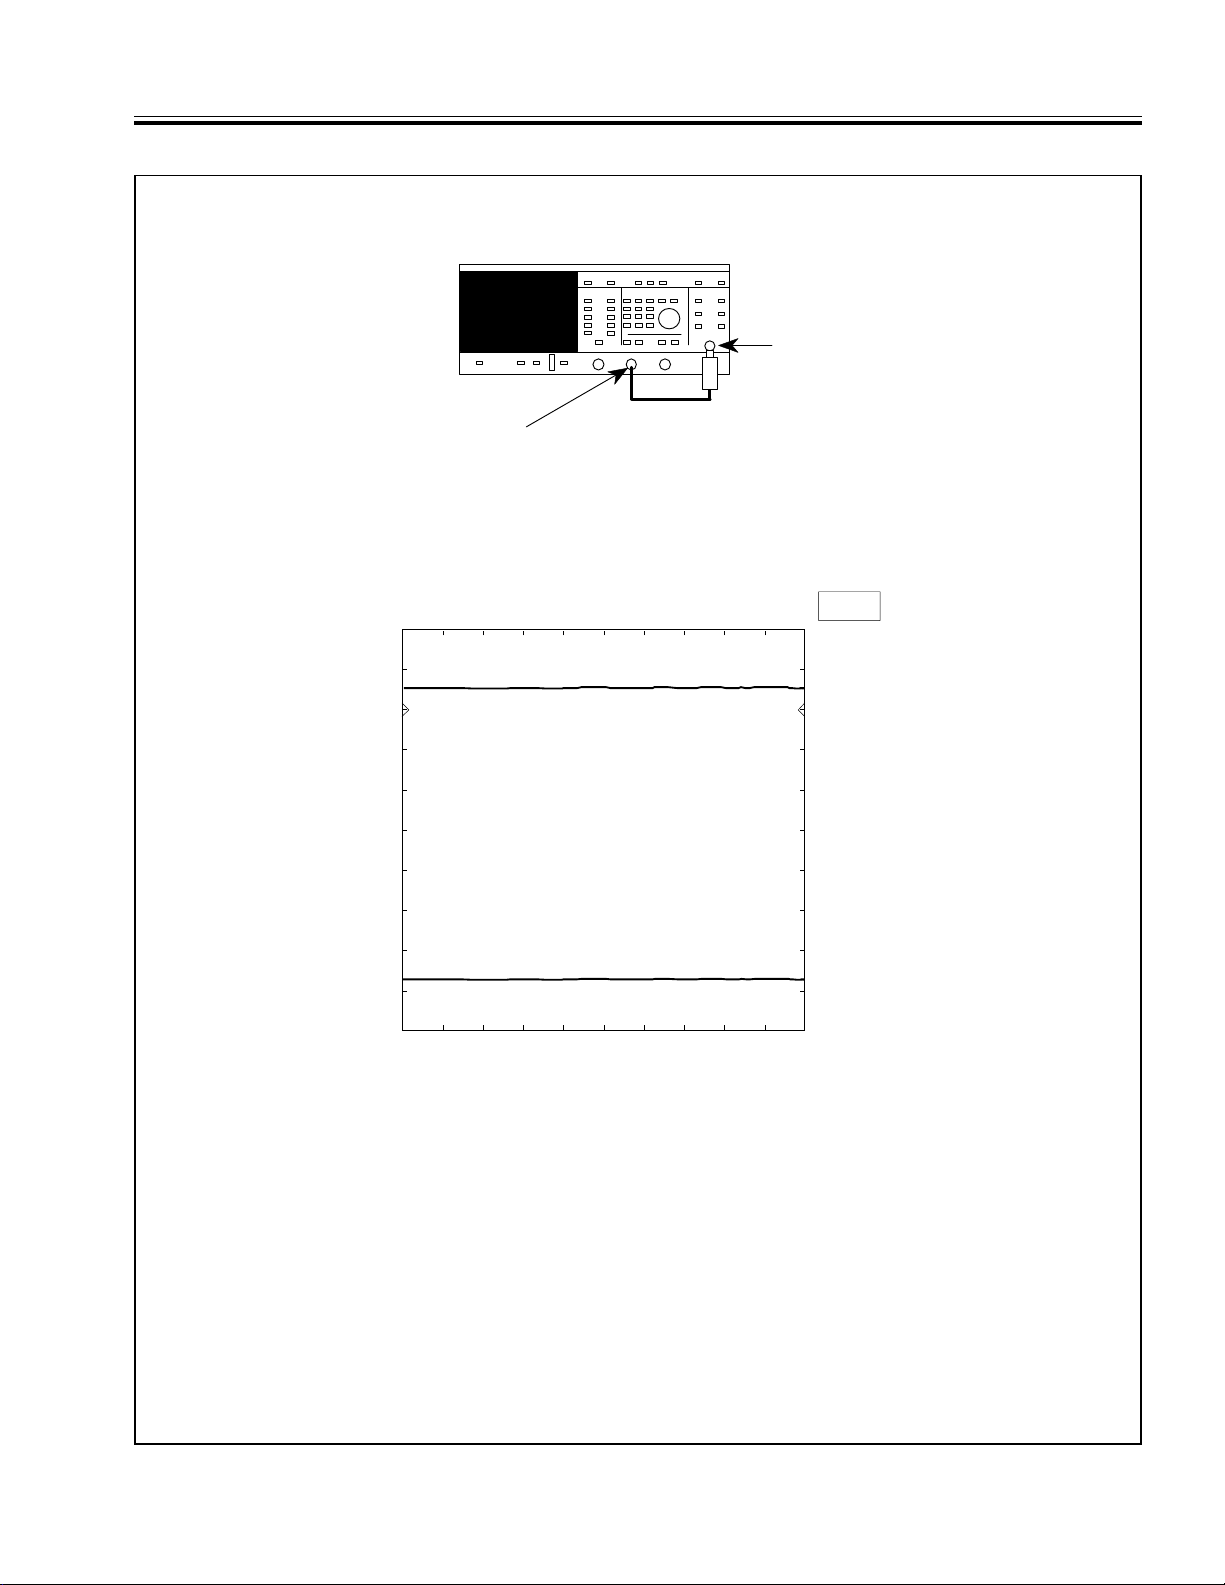
54XXA SCALAR MEASUREMENT SYSTEM
RF OUT
A INPUT
200 MHz/DIV
10.0 dB/DIV OFFSET
10.0 dB/DIV OFFSET
1: TRANSMSSN (A)
2: RETN LOSS (B)
+0.0dB
+0.0dB
START: 0.0100 GHz
401 pts
STOP: 8.4 GHz
LEVEL +7.0 dBm
1
2
5417A
IV MEASUREMENT AND CALIBRATION PROCEDURES OPERATIONAL CHECKOUT PROCEDURE
Table 4-1.
Operational Checkout Procedure
1. Connect the RF detector between the RF OUTPUT connector and the INPUT A connector, as shown below.
2. Depres s the 5 4XXA POWER pus hbutto n (on). At the co nclusi on of th e self t est, “ALL TESTS PASSED” will be dis-
played and the sc reen sh ould b e simi lar to that s hown below. The displ ay may differ fr om that shown , as th e
54XXA will power-up with the s ame co ntrol s etting s as wh en tur ned off. I f nece ssary, select the RESET func tion
from the SYSTEM MENU to return the 54XXA to factory-sel ected cont rol setting s. (Note: de fault settin gs for different models differ, for example: models 5407 A, 5409A, an d 5411A display freque ncies in MH z.)
3. Press the GRATICULE ON/OFF key to turn on the graticule display.
4. Press the Channel 2 D ISPLAY ON/ O FF key to off to remo ve trace 2 fr om the scr een display.
5. Press the OUTPUT POWER key (SOURCE key group) and set the power level to 0.0 dBm.
6. Press the Channel 1 MENU key and select the POWER menu option. Then select SELECT INPUTS option and
set for INPUT A.
7. Press the CURSOR key to obtain a cursor data readout display.
8. Press the RF ON / O FF ke y (to off) and conf irm that the tr ace moves downward to a noise floo r of approxi mately
–60 dBm.
9. Press the RF ON / O FF ke y (to on) and co nfirm that th e cursor re adout valu e is approx imately 0. 0 dBm.
10. Press the OUTPUT POWER key and set the power level to +6 .0 dBm; confirm that the cursor readout value
changes to approximately +6 .0 dBm.
54XXA OM 4-5
Page 58
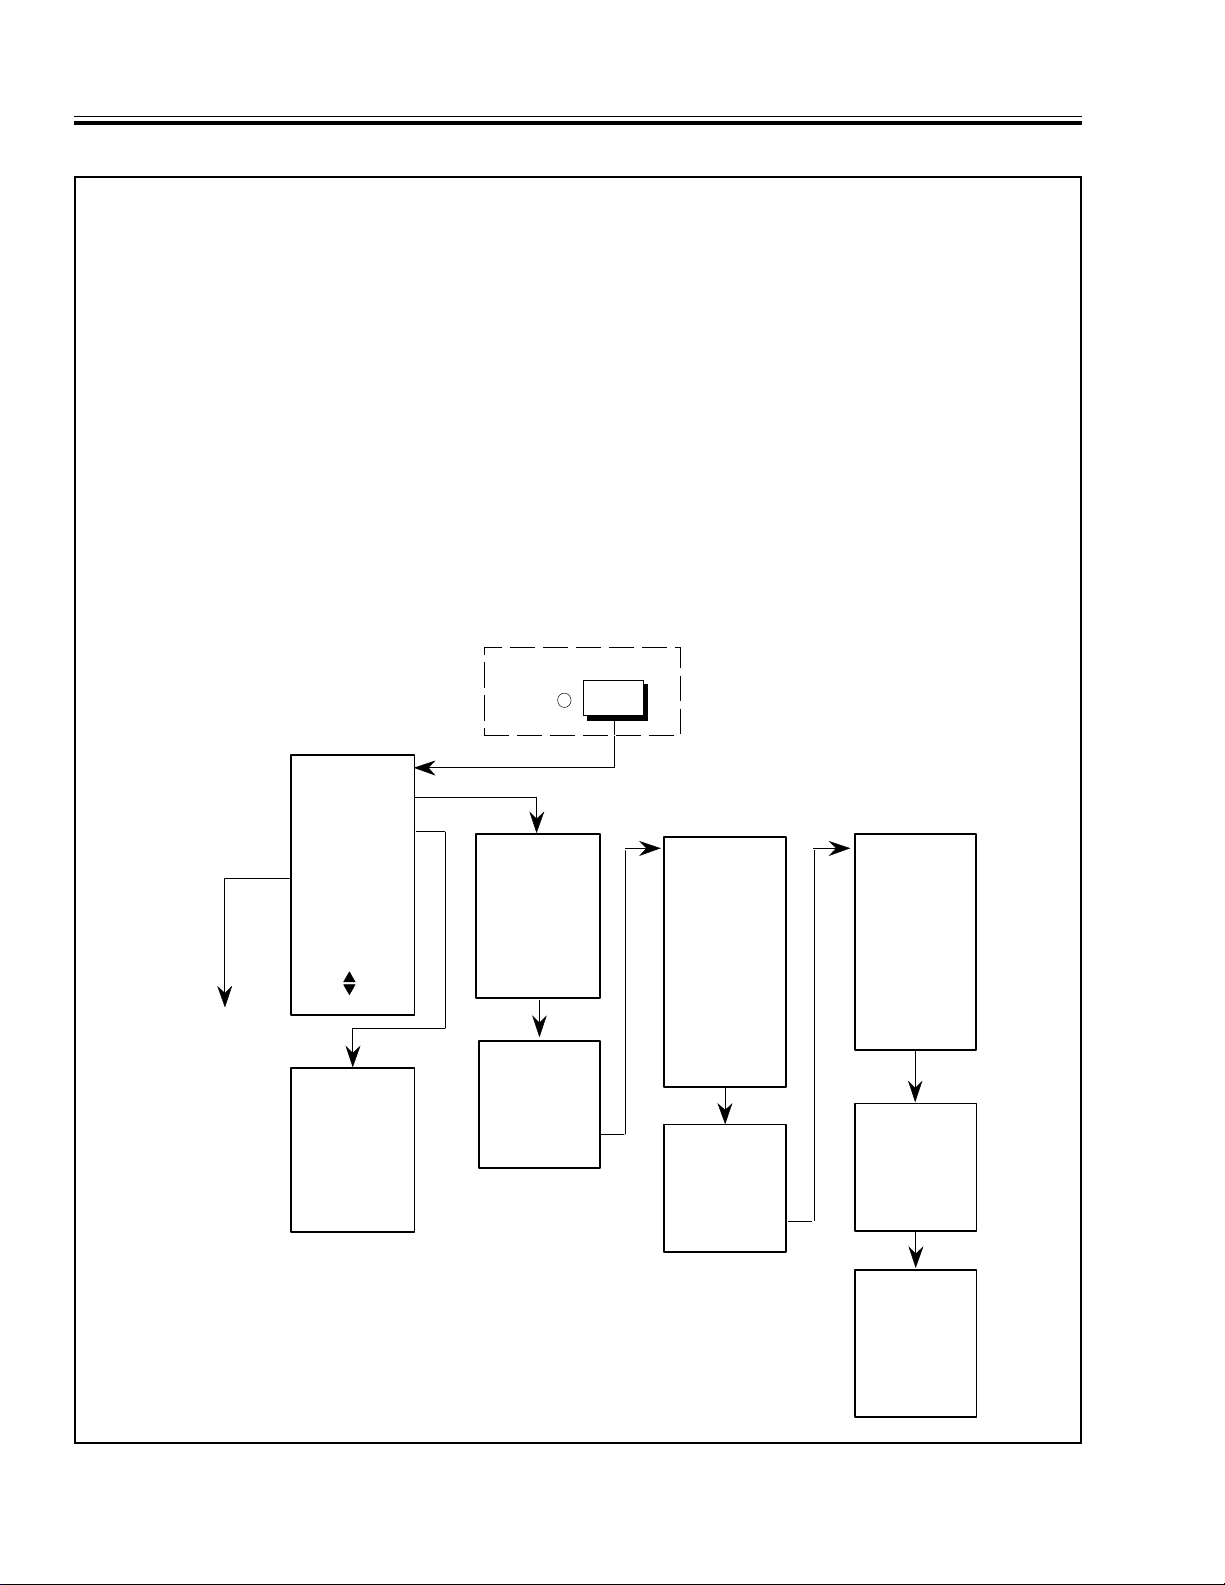
CALIBRATION PROCEDURE IV MEASUREMENT AND CALIBRATION PROCEDURES
Table 4-2. CALIBRATION Key Menus and Pro cedure
CALIBRATION is the proce ss wh ereby losse s inhe rent in a tr ansmis sion o r retu rn loss mea suremen t syst em ar e
measured and stored in internal memory. This stored “calibration data” is then later subtracted from subsequent
measurem ent data.
Pressing th e CALI BRATION key initiate s the sequence of me nus sh own bel ow. This sequen ce is fo r a typ ical t est
setup (Figur e 4- 1) whe re the Channel 1 tr ace ha s been s elec ted to d isplay tran smissi on los s (or gain) from input A
and the Channel 2 trace displays return loss from input B.
When the ca libra tion seq uenc e is com plet e, the los ses inhe ren t in t he S WR A utote ster, Adapter , RF detect or an d
cabling will have been measured and stored. In all future measurement
the same output power level
, the stored loss es will be subt racted fro m subseq uent measu rement data . Conse-
that use the same test configuration and
quently, the results displayed will be the measured characteristics of the test device plus minor (non-recurring) errors.
Proceed as follow s:
• Verify the 54XXA passes the Self Test satisfactorily.
• Connect test equipment per Figure 4-1 (page 4-4), except do not connect the Open/Short. (Use an adapter between
the 54XXA RF OUTPUT connect or and th e SWR A utotes ter, if necessary.)
• S e t the 54 X XA signal sou r ce to th e f r eq uenc y r a ng e a nd pow er o ut pu t l ev el
that will be used during the ac tu al te st.
KEY
CALIBRATION
See
Absolute Power
Measurement
(Table 4-6)
CALIBRATION
START CAL
DETECTOR
OFFSETS
DC CAL MENU
PRESS CLEAR
TO RETURN TO
MEASUREMENT
MODE
USE THEN
PRESS SELECT
DETECTOR
OFFSETS
A: = X.XX dB
B: = X.XX dB
R: = X.XX dB#
ENTER VALUES
PRESS CLEAR
WHEN DONE
UNCAL
TRANSMISSION
CALIBRATION
CONNECT "A"
DETECTOR TO
TEST PORT**
PRESS SELECT
WHEN READY
CALIBRATION
WAIT
CALIBRATION
DATA BEING
TAKEN
RETURN LOSS
CALIBRATION*
STEP 1
CONNECT
AUTOTESTER
TO INPUT "B"
CONNECT OPEN
TO TEST PORT
PRESS SE LEC T
WHEN READY
CALIBRATION*
WAIT
CALIBRATION
DATA BEING
TAKEN
RETURN LOSS
CALIBRATION*
STEP 2
REMOVE OPEN
AND CONNECT
SHORT
TO TEST PORT
PRESS SE LEC T
WHEN READY
CALIBRATION*
WAIT
CALIBRATION
DATA BEING
TAKEN
CALIBRATION
COMPLETED
*Not displayed for Transmission Only Calibration
**If test setup is for transmission loss only, "TEST PORT" is the port to
which the test device connects (typically the 54XXA RF OUTPUT).
#Not displayed for 54XXA's without Input R
CONNECT
TEST DEVICE
PRESS SE LEC T
WHEN READY
4-6 54XXA OM
Page 59
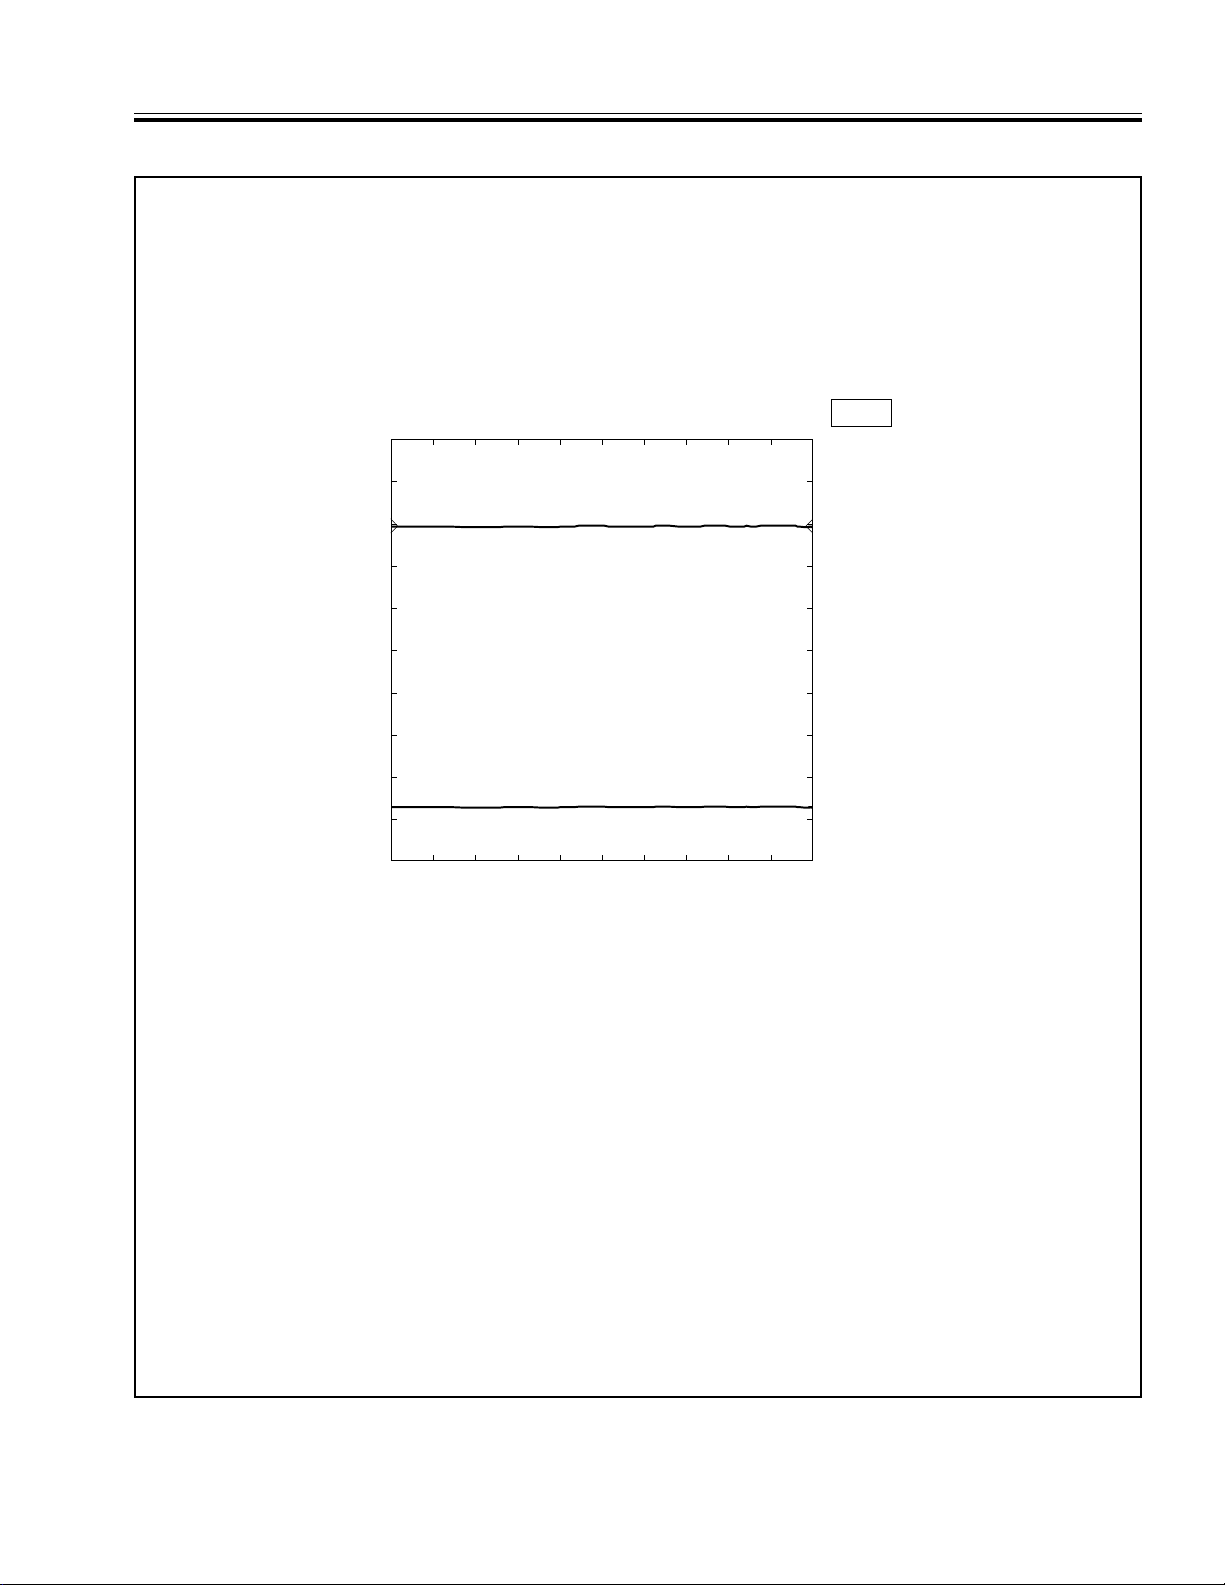
10.0 dB/DIV OFFSET
10.0 dB/DIV OFFSET
1: TRANSMSSN (A)
2: RETN LOSS (B )
+0.0dB
+0.0dB
1
2
200 MHz/DIV
START: 0.0100 GHz
401 pts
STOP: 8.4000 GHz
LEVEL +7.0 dBm
5417A
IV MEASUREMENT AND TRANSMISSION AND
AND CALIBRATION PROCEDURES RETURN LOSS MEASUREMENTS
Table 4-3. Transmission and Return Loss Measurements (Sheet 1 of 3)
Setup and Calibration
1. Connect test equipment per Figure 4-1, except do not connect the test device. Turn the printer on.
2. Depress the 54XXA POWER pushbutton (on). At the conclusion of the self test, “ALL TESTS PASSED” will be
displayed and the screen display should resemble that shown below. The control settings may differ from those
shown, as the 54XXA will come on line with the same control settings as when turned off. Ensure that both
channels are ON and that Chan nel 1 is set for TRANSMISSION a nd Chan nel 2 for RETURN LOSS.
3. Set the 54XXA signal source to the desired frequency range and power output level for the test. For the example
included in t his table (next page) the start frequency is 2.0 GHz; the stop frequency is 8.4 GHz; and the power
output is set to +7.0 dBm.
4. Press the CALIBRATION key and follow the directions given in the calibration menu sequence. (Refer to Table 4-6
for an explanation of the calibration menus.) After finishing the calibration, connect the test device and RF detector
as shown in Figu re 4-1.
Transmission Loss Measurement
5. Measure the transmission loss as follows:
a. Press the Channel 2 DISPLAY ON/OFF key to off.
b. Press the Chan nel 1 AUTOS CALE ke y. Thi s give s an o ptimum vertic al dis play of the test d ata.
6. Read the transmission loss by interpolating the displayed graphic, or read out the measurement data at points of
interest by us ing the cur sor funct ions, as des cribed in step #7 (next pa ge). The ex ample on the next page sho ws
a screen display f or a tra ns mi ssio n m ea su rem en t o f t he up pe r frequency respons e of a band-pass fi lt er. The model
used in thi s example is a model 541 7A. Models 5407A, 5409A, and 5411A do not operate at th e frequencies
shown, howeve r they perfo rm identica lly withi n their freq uency ran ges.
54XXA MM 4-7
Page 60
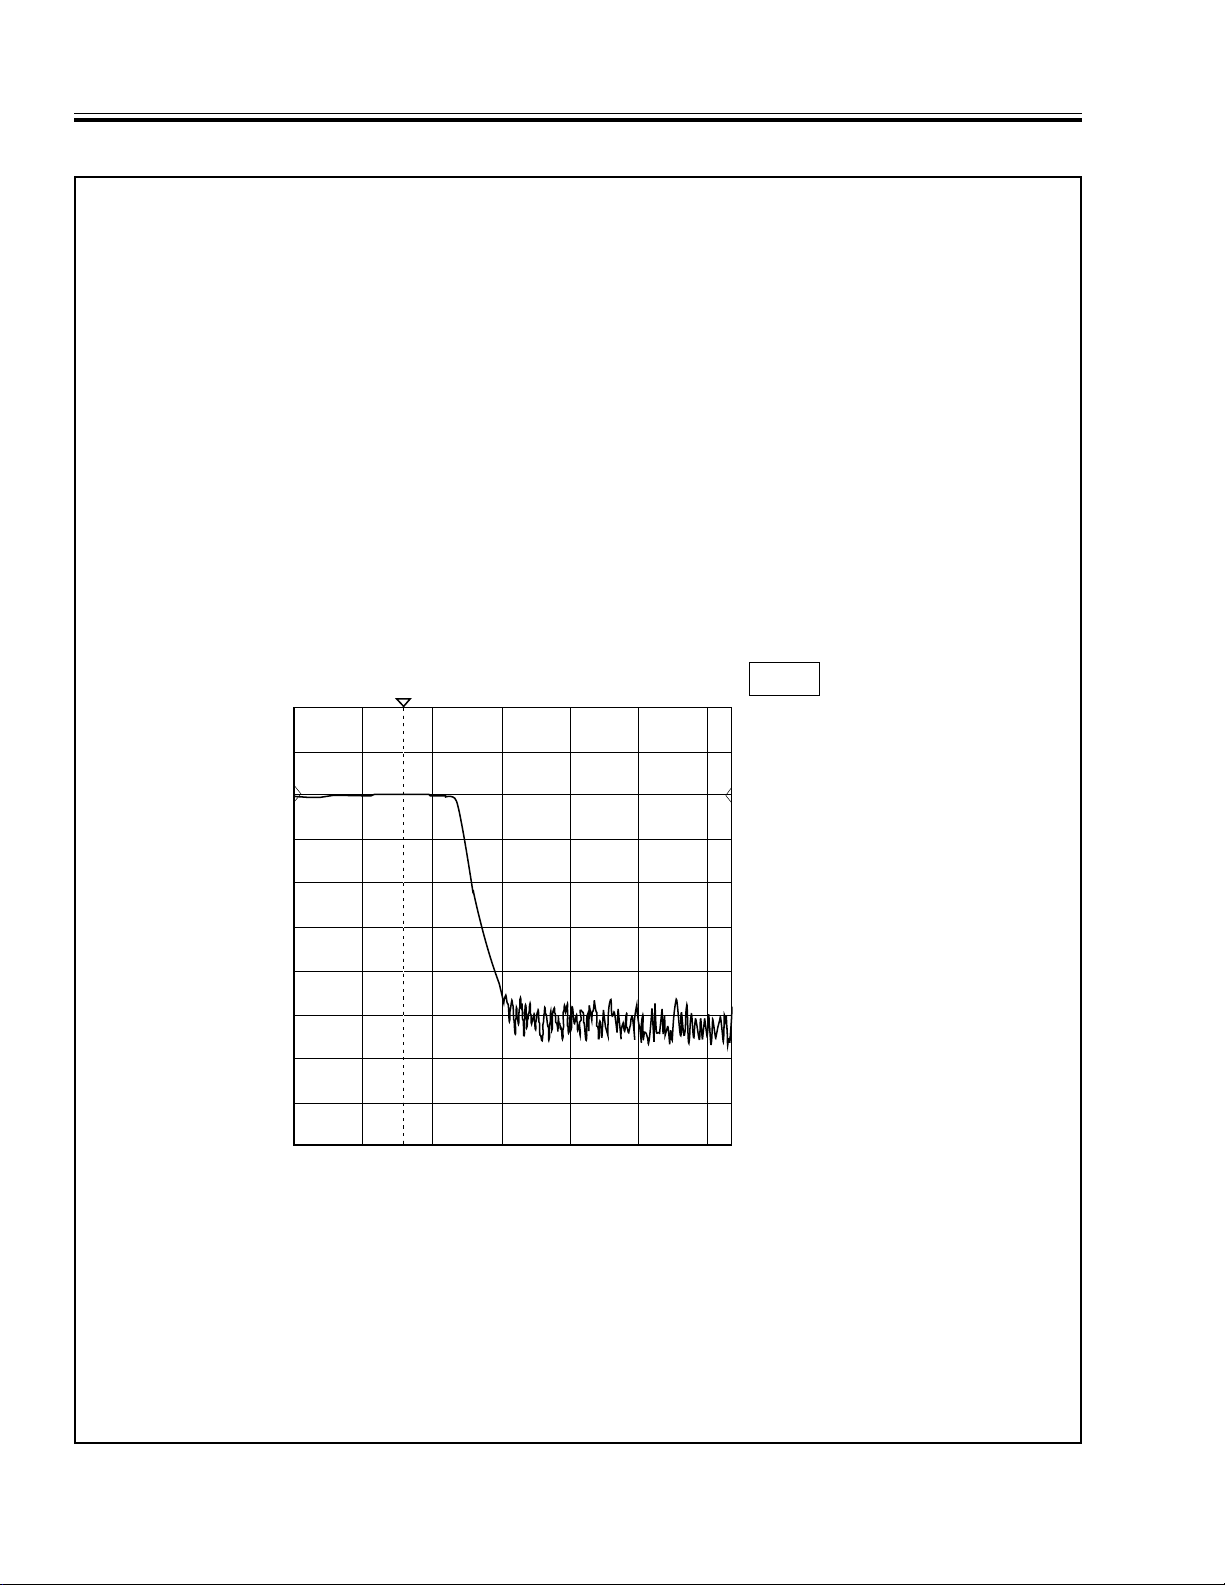
START: 2.0000 GHz
401 pts
STOP: 8.4000 GHz
LEVEL +7.0 dBm
10.0 dB/DIV1: TRANSMSSN (A)
2: OFF
OFFSET 0.0 dB
1
5417A
1 GHz/DIV
CURSOR
1: +0.16 dB
3.5411 GHz
PRESS SELECT
FOR
CURSOR MENU
TRANSMISSION AND IV MEASUREMENT AND
RETURN LOSS MEASUREMENTS AND CALIBRATION PROCEDURES
Table 4-3. Transmission and Return Loss Measurements (Sheet 2 of 3)
7. To use the cursor functions to read out the results of a measurement, proceed as follows:
a. Pre ss the CURSOR key. The cursor readout menu will display the readout data at the present cursor position.
b. Use the DATA ENTRY kn ob to move the cursor to the desired po int on the mea suremen t trace.
c. Read t he tr an sm is si on l ev el fr om t he c urs or r eado ut d is pl ay . Fo r t he ex am pl e s ho wn, th e t ran sm is si on l ev el a t
3.5411 GHz is +0.16 dB.
d. Using the DATA EN TRY knob, move the curso r to the bottom of the filter sk irt and read the frequency an d
transmission level at the select ed point. For the exa mple shown at 5.25 00 GHz the transmission loss varies
between appro ximately –47dB and –52 dB.
e. To reduce the variation of the transmission loss reading, and to provide a more accurate reading, proceed as
follows:
(1) Press the S MOOTHING k ey (E NHANCE MENT ke y gro up) and select a smoo thing level of 3.
(2) Press the SYSTEM MENU key (SYSTEM FUNCTIONS key group), select DATA POINTS and set
FREQUENCY DATA POINTS to 401 (if not already set).
(3) Read the t ransmis sion l evel f rom t he cur sor r eadout as befo re; n ote that the r eading is m uch stea dier.
(4) Return Smoothing to off.
8. Make a har d copy printo ut of the trans missio n loss data as follows:
a. Pre ss the HARD COPY MENU k ey.
b. If device identify, date, and test device information is required, then select “ENTER TITLES” (refer to
Section III – Fro nt Panel Oper ation, as nece ssary) .
c. Select PRINT GRAPH to print the displayed graphic, or select 26, 51, 101, 201, or 401 under “TABULAR:” to
print a tabulation at the selected number of frequency points. You may also choose to print out a tabulation at
only the marker frequencie s (if frequenc y markers ha ve been set up) .
4-8 54XXA MM
Page 61
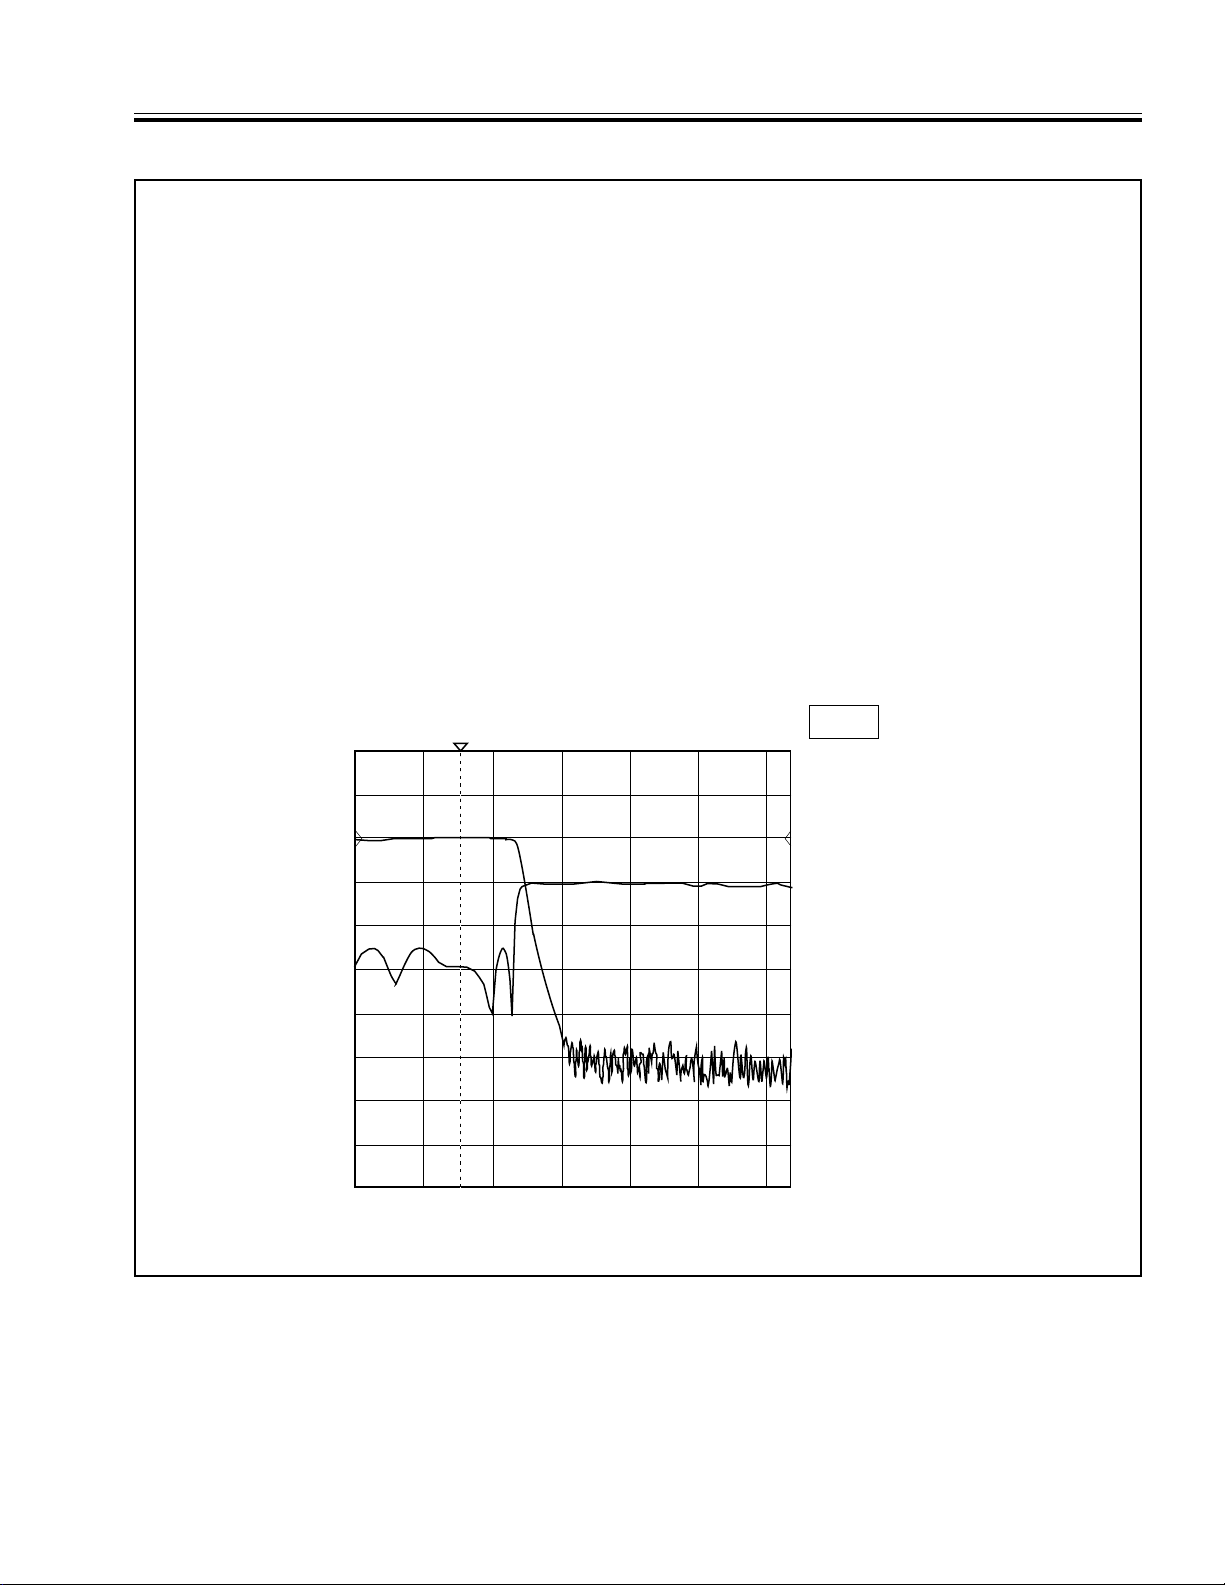
START: 2.0000 GHz
401 pts
STOP: 8.4000 GHz
LEVEL +7.0 dBm
10.0 dB/DIV
10.0 dB/DIV
1: TRANSMSSN (A)
2: RETN LOSS
OFFSET 0.0 dB
OFFSET +10.0 dB
2
1
5417A
1 GHz/DIV
CURSOR
1: +0.16 dB
2: -19.16 dB
3.5411 GHz
PRESS SELECT
FOR
CURSOR MENU
IV MEASUREMENT AND TRANSMISSION AND
AND CALIBRATION PROCEDURES RETURN LOSS MEASUREMENTS
Table 4-3. Transmission and Return Loss Measurements (Sheet 3 of 3)
d. When using the WILTRON Model Ink Jet 2225C printer, verify that the rear switch settings are as shown in
Figure 4-1. (If the switc h settings are c hanged, turn pri nter off, and then on again.) Als o verify that pow er is
applied to the printer and that the reset indicator is not flashing (if necessary, press the printer RESET switch).
e. Press the START PRINT key to print out the data.
f. The printout should resemble the example screen display shown below. Note that both transmission and return
loss measure ments are shown in this ex ample (C hannel 2 DISP LAY ON/OFF k ey on).
9. If a plotter is connected, selecting the PLOTTER MENU will allow you to plot either graticules, traces, titling, cursor
information, o r a ll o f th es e it em s (se le ct t he “PLOT ALL” function — refer to Section III – Front Panel Operation).
Return Loss Measurement
10. Measure th e return los s of the devic e under tes t as follow s:
a. Press Channel 1 DISP LAY ON/ OFF key to of f.
b. Press Channe l 2 DIS PLAY ON/OFF k ey to on.
c. Press Channel 2 AUTOSCALE key.
11. Use the cu rsor read out functi on to obta in return lo ss measu rement da ta at frequ encies of interes t (see step #7).
12. To make a hard cop y pri ntou t of the retu rn lo ss dat a, proc eed in the sam e mann er as des cri bed in step # 8 abov e.
54XXA MM 4-9
Page 62

ALTERNATING SWEEP MEASUREMENTS IV MEASUREMENT AND CALIBRATION PROCEDURES
Table 4-4. Alternating Sweep Measurement (Sheet 1 of 1)
Setup and Cal ibration
1. Connect test equipment per Figure 4-1, except do not connect the test device. Turn the printer on.
2. Depress the 54XXA POWER pushbutton (on).
3. At the conclusion of the self test, set up and calibrate the 54XXA with Input A (Channel 1) set for transmission
measurement and Input B (Channel 2) set for return loss measurement. Refer to steps 2 through 4 of Table 4-3
and to Table 4-2, as necessary.
Transmission Loss Measurement
4. Set Chann els 1 and 2 to dis play transm ission , with both cha nnels usin g Input A, as follows:
a. Press the Channe l 1 MEN U key.
b. Move the cursor to hi ghlight TRANSMISSION and press the SELECT key.
c. Move th e cursor to hi ghlight SELECT INPUT and press the SELECT key.
d. Move the cursor to hi ghlight A and press the SELECT key.
e. Repeat steps a thru d for Channel 2.
4. Measure th e transmi ssion lo ss in the Alter nate Swee p Mode as foll ows:
a. Press the Channel 1 AUTOSCALE key. This gives an optimum vertical display of the test data. (Press the
Channel 2 DISPLA Y ON/OFF key to off , if desire d, to view Chann el A only.)
b. Press ALTERNATE SWEEP key.
c. Choose a p ort io n o f the me as ur e me nt tr a ce th at is to be di sp la ye d wi th an ex pa nd ed fre qu en cy sc al e. Use th e
DATA ENTRY keypad or rotary knob to enter the ALT START sweep frequency for that sweep portion.
d. Using the MENU UP/DOWN key, move the menu cursor to ALT STOP and enter the desired sweep s top
frequency.
e. Press the Chan nel 2 DISPLA Y ON/OF F key to on ( if off) , and press the Chan nel 2 AU TOSCAL E key. Ref er
to Figure 4- 2, part a, which show s an exam ple of a t ransmissi on measur ement of the frequency response o f
a 500 MHz filter us ing the Alt ernate Swee p Mode.
6. Use the cursor readout function to obtain transmission measurement data at frequencies of interest (refer to
step #7 of Table 4-3 ).
7. If desired, make a hard copy printout of the transmission loss data as described in Step 8 of Table 4-3.
Return Loss Measurement
8. Set Chann el 2 to display r eturn los s using Inpu t B, as follow s:
a. Pre ss the CH2 MENU key.
b. Move the cursor to hi ghlight RETURN LOSS and press the SELECT key.
c. Move th e cursor to hi ghlight SELECT INPUT and press the SELECT key.
d. Move the cursor to hi ghlight B and press the SELECT key.
e. Repeat steps 4 a. thru 4 d. (above) for Channel 2.
9. An example of a return loss measurement using the Alternate Sweep Mode is shown in Figure 4-2, part b.
10. Use the cu rso r read out fu ncti on to ob tain retur n loss mea surem en t data at frequ enci es of inte rest ( ref er to st ep #7
of Table 4-3). If desired, m ake a hard copy printout of the return loss data as de scribed in Step 8 of Table 4-3.
4-10 54XXA MM
Page 63
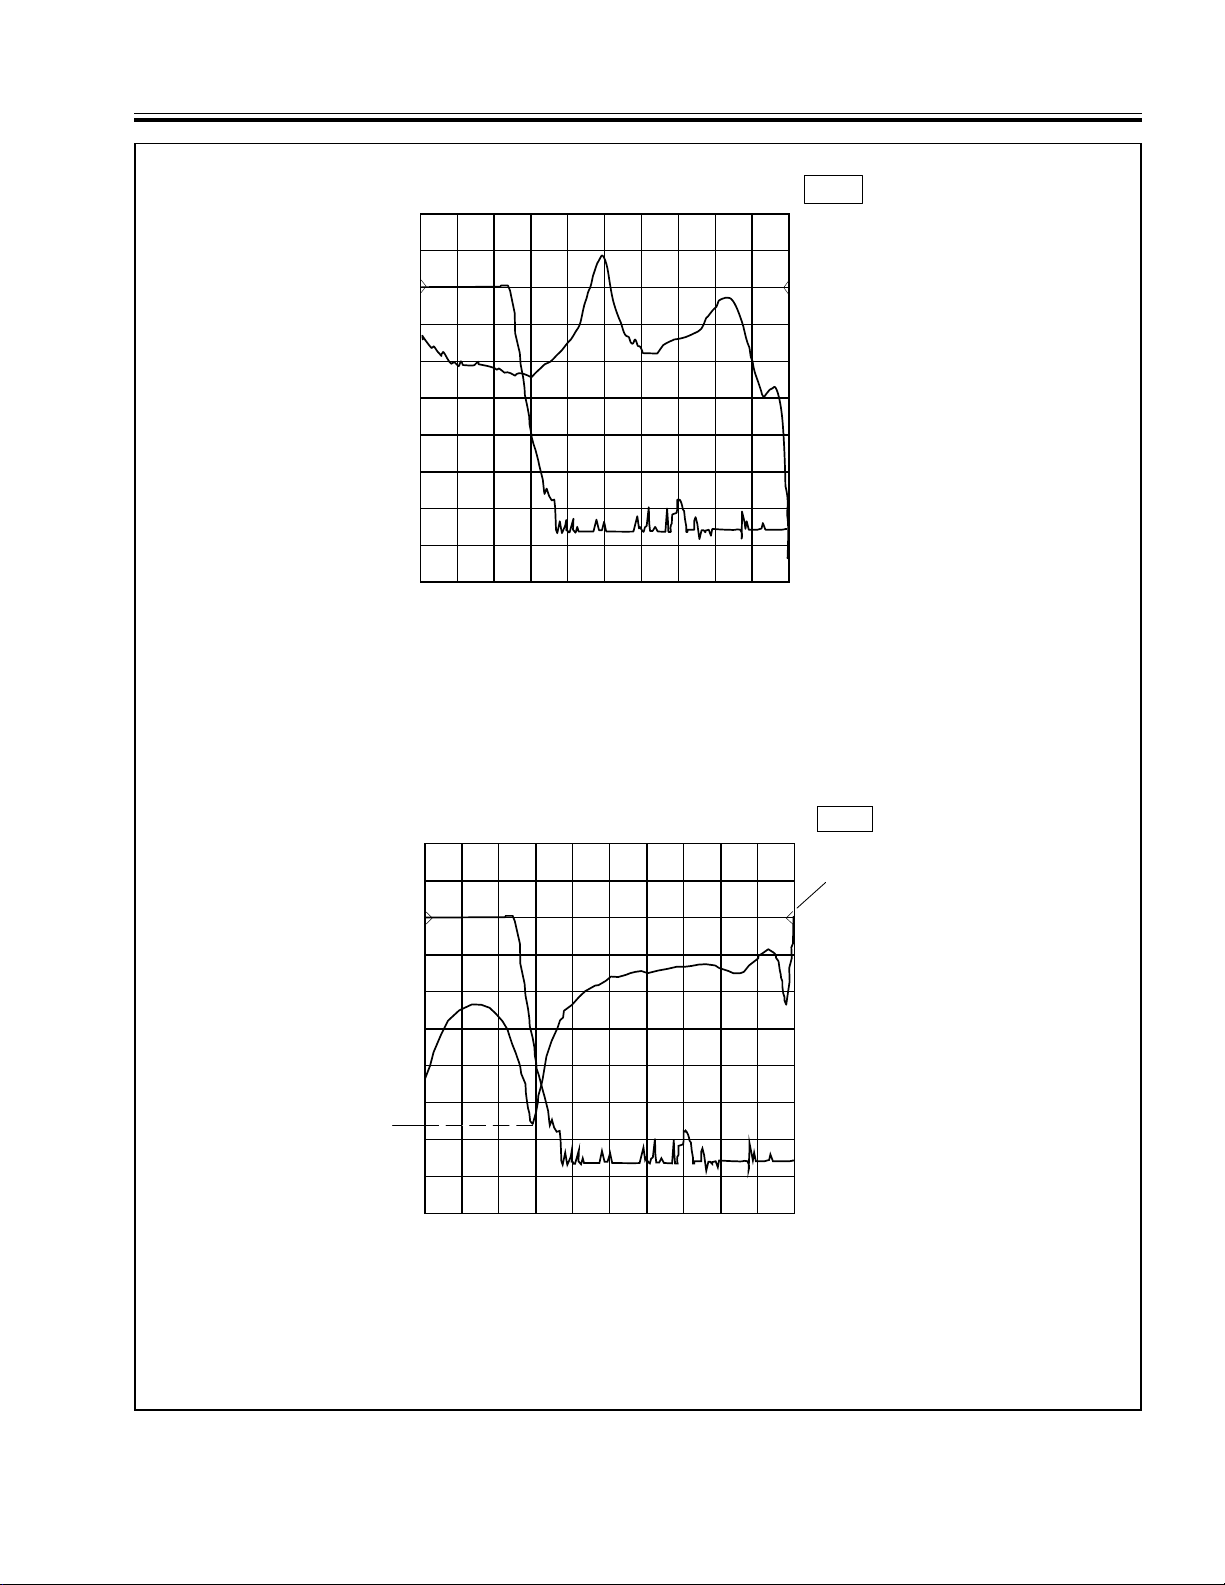
10.0 dB/DIV
0.1 dB/DIV
1: TRANSMSSN (A)
2: TRANSMSSN (A)
OFFSET +0.0 dB
OFFSET -0.1 dB
2
1
START: 0.0100 GHz
START: 0.0100 GHz
401 pts
STOP: 2.0000 GHz
STOP: 0.5000 GHz
LEVEL: +7.0 dBm
(ALT)
5417A
-66 dB
TRACE 2
OFFSET
REFERENCE
(-10 dB)
START: 0.0100 GHz
START: 0.0100 GHz
401 pts
10.0 dB/DIV
10.0 dB/DIV
OFFSET +0.0 dB
OFFSET -10.0 dB
1: TRANSMSSN (A)
2: RETN LOSS (B)
STOP: 2.0000 GHz
STOP: 0.5000 GHz
LEVEL: +7.0 dBm
(ALT)
2
1
5417A
IV MEASUREMENT AND CALIBRATION PROCEDURES ALTERNATING SWEEP MEASUREMENTS
a. Alternating sweep mode measurement display of the transmission characteristics of a 500 MHz filter. The pass
band starts at 10 MHz and extends to about 500 MHz. Trace 2 shows an expanded view of the pass band. The
start and stop frequencies fo r trace 2 are marked “ALT” in the second frequenc y parameter line belo w the
graticle d isplay .
b. Alternating sweep mode measurement display of the return loss characteristics of the same 500 MHz filter.
Trace 2 shows an expanded view of the return loss characteristics. As shown, the maximum return loss is
approximately 66 dB at 500 MHz; the minumum is approximately 10 dB. (Note that the Trace 2 Reference Line
is offset by –10 dB .)
Figure 4-2. Examples o f Alternating Swee p Mode M easurements
54XXA MM 4-11
Page 64

RATIO MODE MEASUREMENTS IV MEASUREMENT AND CALIBRATION PROCEDURES
Table 4-5. Rat io Mode Me asurement (Sheet 1 of 1)
Setup and Calibration
1. Connect test equipment per Figure 4-3, except do not connect the test device. Turn the printer on.
2. Depress the 54XXA POWER pushbutton (on). Verify the 54XXA passes the Self Test satisfactorily.
3. Using the menus associated with the (NETWORK ANALYZER) MENU key, select TRANSMISSION mode and
RATIO A/R for display channe l 1; sel ect RETURN LOSS an d RATIO B/R for display channel 2.
4. Set the 54XXA signal source to the desired frequency range and power output level for the test. For the example
included in this table: start frequency is 0.700 GHz; stop frequency is 3.5 GHz; depress OUTPUT POWER and set
output level to –10 dBm.
5. Perform the calibration procedure as per Table 4-2.
Transmission Loss Measurement (Ratio Mode)
6. Press the Channel 2 DISPLAY ON/OFF key to off.
7. Press t he Chan nel 1 AUTOS CALE ke y. Thi s give s an o ptimum vertic al dis play of the test d ata.
8. Read the transmission loss (ratio A/R) by using the cursor data readout function to obtain measurement data at
frequencie s of interest (see Table 4- 3, Step 7). An example of a ratio mode measurem ent display is shown in
Figure 4-4. This figure shows both transmission loss (Trace 1) and return loss (Trace 2).
10. If desired, make a hard copy printout of the transmission loss data as described in Step 8 of Table 4-3.
Return Loss Measurement
11. Press the Channe l 2 DI SPLAY ON/OFF ke y to o n, and t he Chan nel 1 D ISPLAY ON/OFF ke y to o ff.
12. Press the Channel 2 AUTOSCALE key.
13. Read the retu rn lo ss (ra tio B /R) by usi ng the curs or da ta read out fu ncti on (s ee Tabl e 4-3, Step 7).
14. If desir ed, ma ke a har d cop y print out of the re turn lo ss dat a as d escri bed in Step 8 of Tabl e 4-3 .
4-12 54XXA MM
Page 65
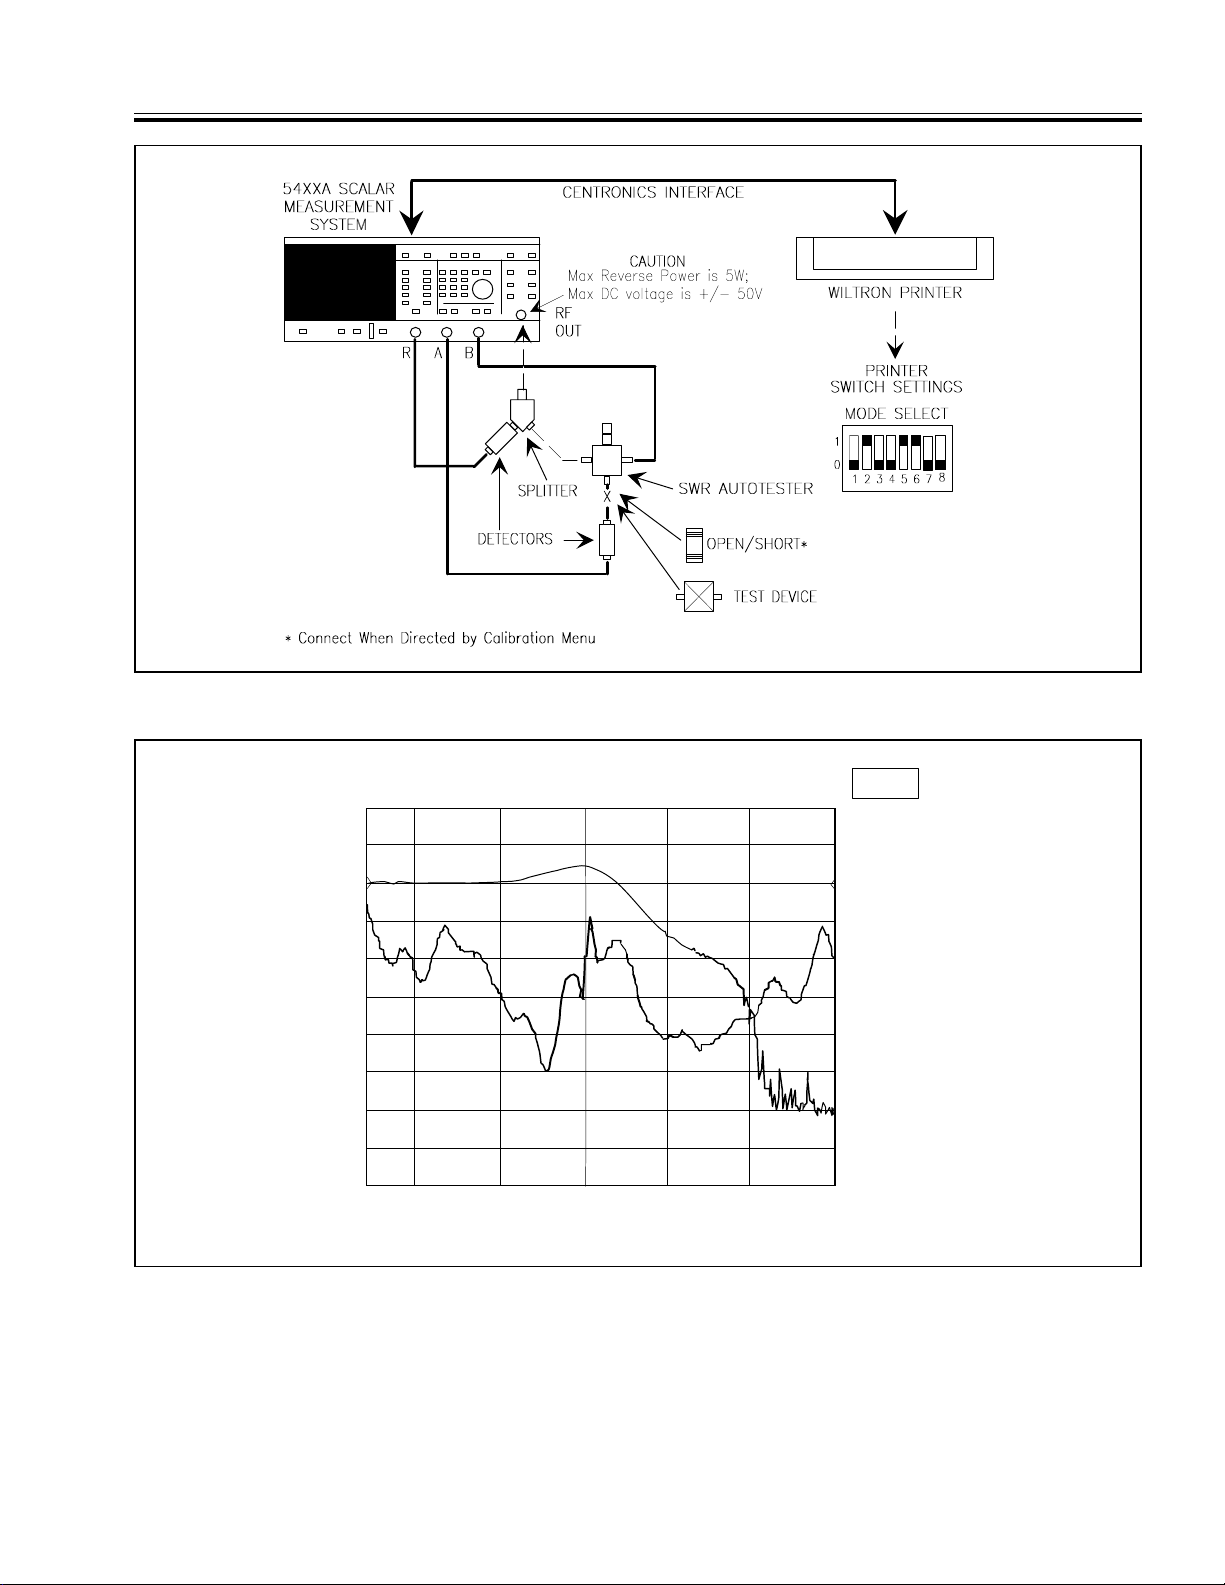
1
2
1: TRANSMSSN (A/R)
2: RETN LOSS (B/R)
OFFSET -17.0 dB
OFFSET +20.0 dB
0.1 dB/DIV
5.0 dB/DIV
START: 0.7000 GHz
401 pts
STOP: 3.5000 GHz
LEVEL: -10.0 dBm
500 MHz/DIV
5417A
IV MEASUREMENT AND CALIBRATION PROCEDURES RATIO MODE MEASUREMENTS
Figure 4-3. Typical Equipment Setup for Ratio Mode Measurements
54XXA MM 4-13
Figure 4-4. Example of Ratio Mode Measurement Displa y
Page 66
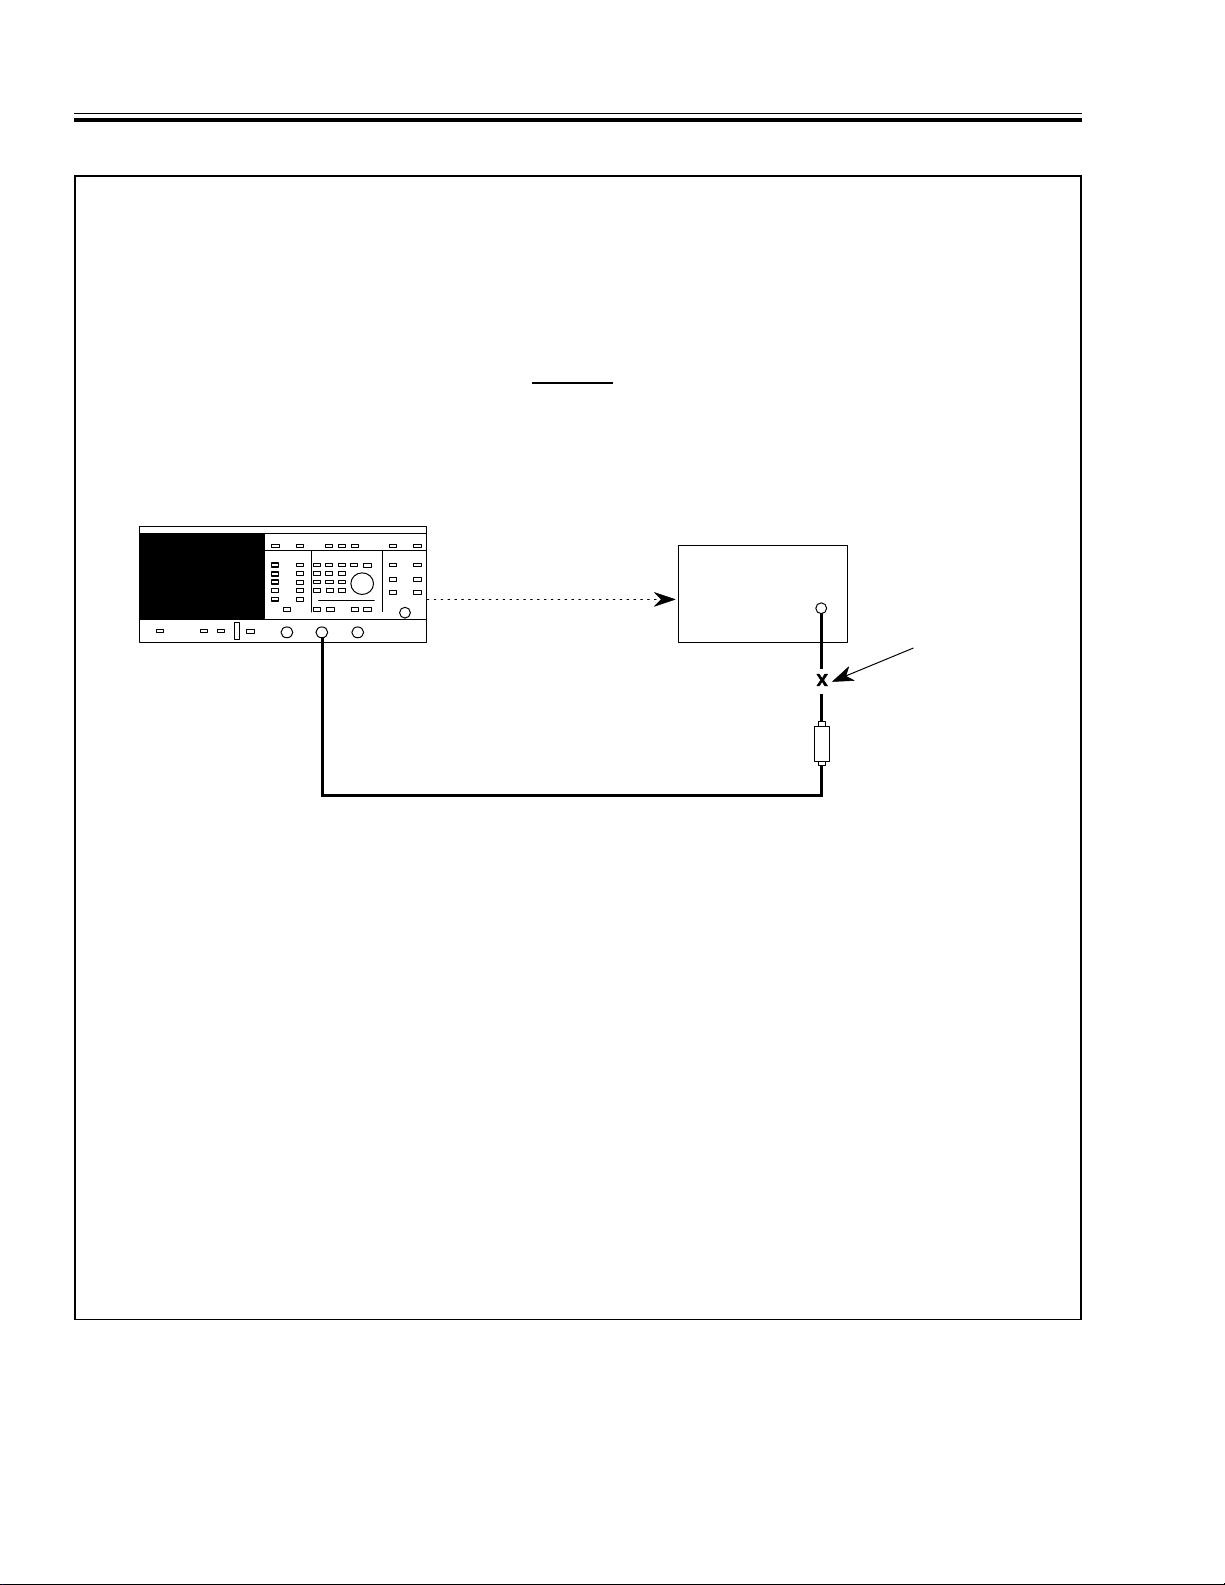
ABSOLUTE POWER MEASUREMENT IV MEASUREMENT AND CALIBRATION PROCEDURES
Table 4-6. Absolute Power Measurement (1 of 2)
1. Perform the 54XXA Operational Checkout Procedure as described in Table 4-1.
2. Verify that the output of the external RF source to be measured is off. Connect the RF detector between the 54XXA
INPUT A connector and the RF source, as shown in the setup diagram. For a swept frequency power
measurement, the 54XXA and the RF source must be synchronized. The signal from the 54XXA rear panel
HORIZONTAL OUTPUT can be used to trigger (or drive) the RF source for this application.
CAUTION
Before perf orm in g t he me as ure me nt , de te rmi ne tha t th e po wer outp ut of th e RF so ur c e wil l no t
exceed the maximum input power limit for the detector and/or matching adaptors used. Use a
suitable at tenuator, if necessa ry.
54XXA SCALAR MEASUREMENT SYSTEM
SYNCHRONIZATION SIGNAL
(See Text)
A
RF SOURCE TO BE MEASURED
OUT
IMPEDANCE
ADAPTOR/
ATTENUATOR
(IF USED)
DETECTOR
3. Set the Channel 2 display off.
5. Press the Channel 1 MENU key and select the POWER measur ement option .
7. Verify that input “A” is selected as the input co nnector for Channel 1.
8. Press t he CALIBRA TION key and se lect the DC CAL MENU option.
9. Using the MENU and SELECT keys, select the “ON” option from the SET DC CAL submenu (se e menu diag ram) .
NOTE
This mode of o peration sets the 54XXA to perform (power) measurements with the autozero
function of each active (i.e., POWER measurement) channel disabled. The autozero correction
voltage for each active channel is held at the value in effect when the DC CAL function was
enabled. The message “DC CAL” is displayed in the upper right corner of th e screen when
this operating mode is active.
While in the DC CAL mode, if the measurement input connector is changed (INPUT A, B, R),
or a different detector is connected, e tc., then a wa rning message w ill be displa yed. To c lear
this condit ion, turn the RF s ource power off and press SELECT to r e-establish the au tozero
values.
4-14 54XXA OM
Page 67
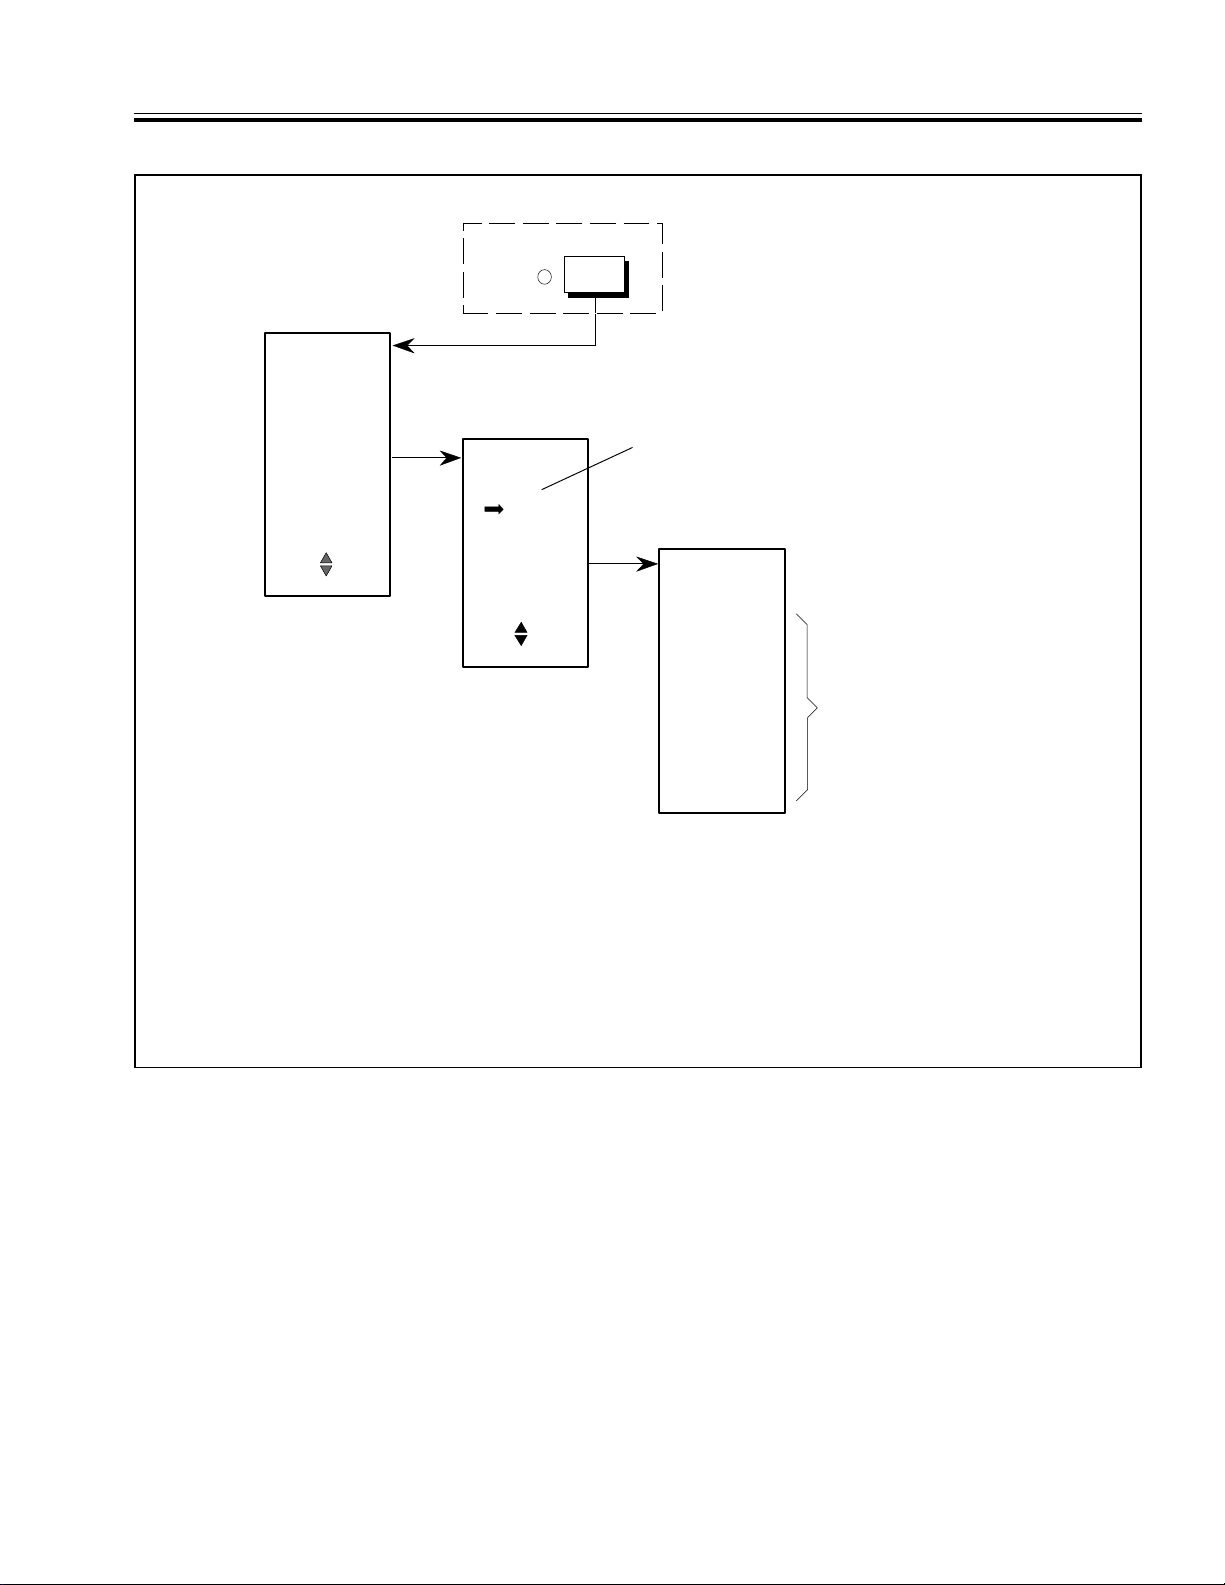
IV MEASUREMENT AND CALIBRATION PROCEDURES ABSOLUTE POWER MEASUREMENT
Table 4-6. Absolute Power Measurement (2 of 2)
KEY
CALIBRATION
UNCAL
CALIBRATION
START CAL
DETECTOR
OFFSETS
DC CAL MENU
PRESS CLEAR
TO RETURN TO
MEASUREMENT
MODE
USE THEN
PRESS SELECT
*If not set for POWER measurement, an error message
will be displayed.
**Or suitable input device. If no input connection (or if
changed), error message will be displayed.
#This display is used for maintenance/troubleshooting
procedures.
++Not displayed for 54XXA's without Input R
SET DC CAL
ON
OFF
PRESS ENTER
TO DISPLAY
LOG/TEMP
CORRECTION
USE THEN
PRESS SELECT
Set the 54XXA to perform (power) measurements with the
Autozero function off (see note). To use, the selected
channel must be set for POWER measurement* and a
detector** connected to the selected input.
#
LOG/TEMP
READINGS
INPUT A
L: +0.30
T: -0.05
INPUT B
L: -0.03
T: +0.02
INPUT R++
L: - - - - -
T: - - - - -
Log conformity and Temperature
compensation readings displayed for
the input device connected to each
active (power measurement) channel.
10. Set the output of the external RF source on. Press the Channel 1 AUTOSCALE key. This gives an optimum ver tical
display of the test data.
11. Press the CURSOR ON/OFF key to on.
12. Usin g the DATA ENTRY rotar y knob, move the curs or from the low to the high end s of the trace and read the
RF source out put pow er (in dBm) at the f requenc ies of i nterest .
54XXA OM 4-15/4-16
Page 68

SECTION V
PERFORMANCE VERIFICATION PROCEDURES
Table of Contents
5-1 INTRODUCTION . . . . . . . . . . . . . . . . . . . . . . . . . . . . . 5-3
5-2 RECOMMENDED TEST EQUIPMENT . . . . . . . . . . . . . . . . . 5-3
5-3 TEST RECORDS . . . . . . . . . . . . . . . . . . . . . . . . . . . . . . 5-3
5-4 FRONT PANEL OPERATION TEST . . . . . . . . . . . . . . . . . . . 5-3
5-5 CW FREQUENCY ACCURACY TEST . . . . . . . . . . . . . . . . . . 5-3
5-6 OUTPUT POWER ACCURACY/ FLATNESS TEST . . . . . . . . . . . 5-7
5-7 SIGNAL CHANNEL VERIFICATION TESTS . . . . . . . . . . . . . 5-10
DC Voltage Method . . . . . . . . . . . . . . . . . . . . . . . . . . . . 5-10
50MHz Accuracy Test . . . . . . . . . . . . . . . . . . . . . . . . . . 5-11
Mid Band Frequency RF Test . . . . . . . . . . . . . . . . . . . . . . 5-12
Measurement Uncertainties In Mid Band Frequency
RF Test Method . . . . . . . . . . . . . . . . . . . . . . . . . . . . . 5-17
5-8 RESIDUAL FM TEST . . . . . . . . . . . . . . . . . . . . . . . . . . 5-18
5-9 SOURCE OUTPUT SIGNAL PURITY TESTS . . . . . . . . . . . . . 5-19
5-10 PRINTER OPERATION TEST . . . . . . . . . . . . . . . . . . . . . 5-20
5-11 GPIB OPERATION TEST . . . . . . . . . . . . . . . . . . . . . . . . 5-20
54XXAOM 5-1/5-2
Page 69

SECTION V
PERFORMANCE VERIFICATION PROCEDURES
5-1 INTRODUCTION
This section provides performance verification
procedures for all standard models of WILTRON
54XXA Scalar Measurement Systems. All of the tests
in this section are performed using the 54XXA front
panel controls and screen displays. No internal
circuits or adjustments are disturbed. If the results
of all tests presented in this section are within specification, the 54XXA tested is operating normally and
does not require calibration.
5-2 RECOMMENDED TEST EQUIPMENT
The recommended test equipment for each of the
performance verification tests is listed along with
the procedure for each test. All of the test equipment
used in these tests is also listed in Table 1-11 (in
Section I — General Information). If the recommended equipment is not available , then other test
equipment with suitable characteristics may be substituted.
NOTE
It is recommended that all test equipment
be allowed to warm up at least 30 minutes
prior to performing any of the performance verification tests.
a. E quipment Required
54XXA under test.
b. Procedure
1. Verify that the 54XXA rear panel voltage selector module is set to the correct value. Connect the power cable to the 54XXA and switch
the unit on.
2. Observe that during power up all of the front
panel LED’s are first turned on and then off
again. This verifies that all LED’s are functioning.
3. The 54XXA will display “ALL TESTS
PASSED” at the end of the self test if no defects are found.
4. Press the SYSTEM MENU key and select “RE-
SET” using the MENU up/down and SELECT
keys. From the RESET MENU select “RE-
STORE DEFAULT SETUP” This will set the
54XXA to initial factory settings.
5. Press each key of each key group and verify
that the 54XXA responds correctly.
6. To test the DATA ENTRY knob, press the
INTENSITY key and turn the knob clockwise
to increase the intensity and then counterclockwise to decrease it.
5-3 TEST RECORDS
Tables 5-1, 5-2, and 5-3 contain test record forms
that can be photocopied and used to keep an
accurate performance verification test record for
your 54XXA. These tables are included as part of the
performance verification procedures and contain test
information for all 54XXA models. Specification Tables 1-3, 1-4, and 1-5 (in Section I — General
Information) are used as the specification reference
throughout this section.
5-4 FRONT PANEL OPERATION TEST
This test verifies that all the front panel switches
and LED’s are operational. The test involves pressing each key of each key group and checking that the
54XXA responds corr ectly.
54XXA OM 5-3
5-5 CW FREQUENCY ACCURACY TEST
This test verifies that t he CW frequency accuracy of
the 54XXA tested is within specification. Table 5-1
contains a test record that you can copy and use to
record the results of the test.
a. E quipment Required
When testing the Network Analyzer
key group keys, ensure that Channel 1 and 2 are switched on.
Microwave F reque ncy coun ter, EIP Microwave
Inc. model 578A, or equivalent.
Impedance Adaptor, 50Ω to 75Ω,
WILTRON 12N75B. (Required only for
54XXA’s with 75Ω Signal Source outputs.)
NOTE
Page 70
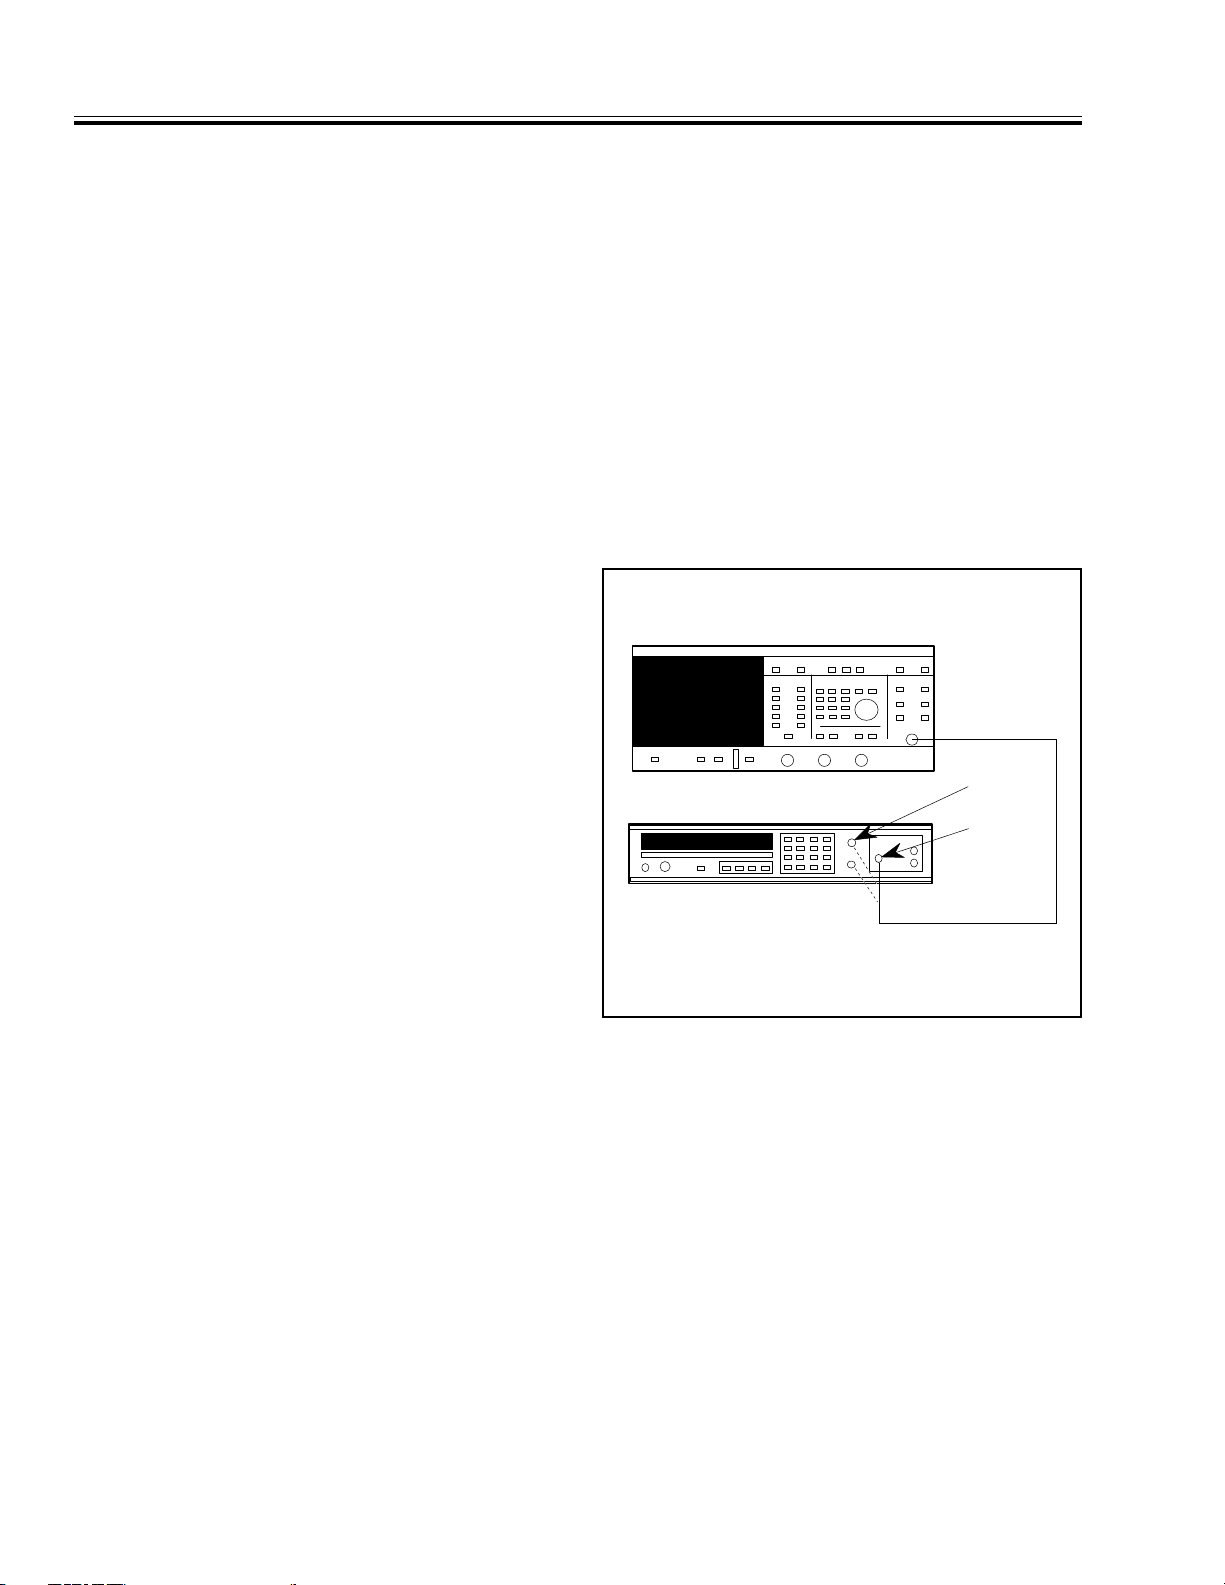
5400 SCALAR MEASUREMENT SYSTEM
EIP 578 FREQUENCY COUNTER
BAND 2
INPUT
BAND 3
INPUT
RF OUTPUT
BAND 1
INPUT
*
For Models 5407A, 5409A, or 5411A; See Text.
*
CW FREQUENCY ACCURACY TEST V PERFORMANCE VERIFICATION PROCEDURES
b. Procedure
1. Connect the test equipment as shown in Figure 5-1 and turn the equipment on.
2. Press the SYSTEM MENU key and select “RE-
SET” using the MENU up/down and SELECT
keys. From the RESET MENU select “RE-
STORE DEFAULT SETUP”. This will set the
54XXA to initial factory settings.
3. Press the OUTPUT POWER key and set the
power to 2.0 dBm.
4. Turn both 54XXA measurement channels off
using the DISPLAY ON/OFF keys.
5. Ensure the counter is connected to the RF
OUTPUT of the 54XXA. Set the Counter to
measure 1 KHz resolution. For models with
75Ω output, connect to the counter input using the 12N75 Impedance Adaptor.
6. Press the frequency key and press select. This
will display the CENTER/WIDTH menu. Set
the width to 0 GHz (or MHz).
7. Set the center frequency to the first test
frequency for the model being tested (Table 5-1).
8. Set the counter to the correct range and connect to the correct counter input (Band 1,
Band 2, or Band 3) for the frequency being
measured. For models 5407A, 5409A, or
5411A, connect to the Band 1 input.
9. Verify that the counter reading is within
±
100 KHz of the value shown on the test record for models 5407A, 5409A, and 5411A (T able 5-1, Sheet 2). For all other models, verify
that it is within ±200 KHz (Table 5-1).
10. Record the counter reading in Table 5-1.
11. Enter the next test frequency from Table 5-1
into the 54XXA. Repeat steps 8 thru 10 until
all the test frequencies in T able 5-1 have been
tested.
NOTE
When a frequency is entered, it is
Frequency Locked to the reference
and then released. After being released, the frequency may drift.
Pressing the CLEAR key and then the
SELECT key re-locks the frequency.
(During normal operation, the frequency is locked at the start of every
sweep, even if the width is se t to zero.)
Figure 5-1. Equipment Setup for CW Frequency Test
5-4 54XXA OM
Page 71
V PERFORMANCE VERIFICATION PROCEDURES CW FREQUENCY ACCURACY TEST
Table 5-1.
CW Frequency Accuracy Chart /T est Record (Sheet 1 o f 2)
Model 54 A Serial No. Date
5417A/5447A 5431A
0.0100*
0.5000
1.0000
1.5000
2.0000
5417A/5419A/5437A/5447A 13.0000
2.0000*
2.5000
3.0000
3.5000
4.0000
4.5000
5.0000
5.5000
6.0000
6.5000
7.0000
7.5000
8.0000
8.4000
8.6000
5428A/5437A/5447A 16.5000
8.0000*
8.5000
9.0000
9.5000
10.0000
10.5000
11.0000
11.5000
12.0000
12.4000
10.0000*
10.5000
11.0000
11.5000
12.0000
12.5000
13.5000
14.0000
14.5000
15.0000
15.5000
16.0000
5430A/5437A/5447A
12.4000*
13.0000
13.5000
14.0000
14.5000
15.0000
15.5000
16.0000
17.0000
17.5000
18.0000
18.5000
19.0000
19.5000
20.0000
∗
Specification for all frequencies listed above is ± 200 kHz. All frequencies are in GHz.
54XXA OM 5-5
Page 72
CW FREQUENCY ACCURACY TEST V PERFORMANCE VERIFICATION PROCEDURES
Table 5-1.
CW Frequency Accuracy Chart /T est Record (Sheet 2 o f 2)
Model 54 A Serial No. Date
5436A
17.0000*
17.5000
18.0000
18.5000
19.0000
19.5000
20.0000
20.5000
21.0000
21.5000
∗
Specification for all frequencies listed above is ± 200 kHz. All frequencies are in GHz.
22.0000
22.5000
23.0000
23.5000
24.0000
24.5000
25.0000
25.5000
26.0000
26.5000
5407A 5409A 5411A Value
1.00* 1.00* 1.00*
250.00 250.00 250.00
500.00 500.00 500.00
750.00 750.00 750.00
1000.00 1000.00 1000.00
1250.00 1250.00
1500.00 1500.00
1750.00 1750.00
2000.00 2000.00
2250.00
2500.00
2750.00
3000.00
∗
Specification for all frequencies listed above is ± 100 kHz. All frequencies are in MHz.
5-6 54XXA OM
Page 73
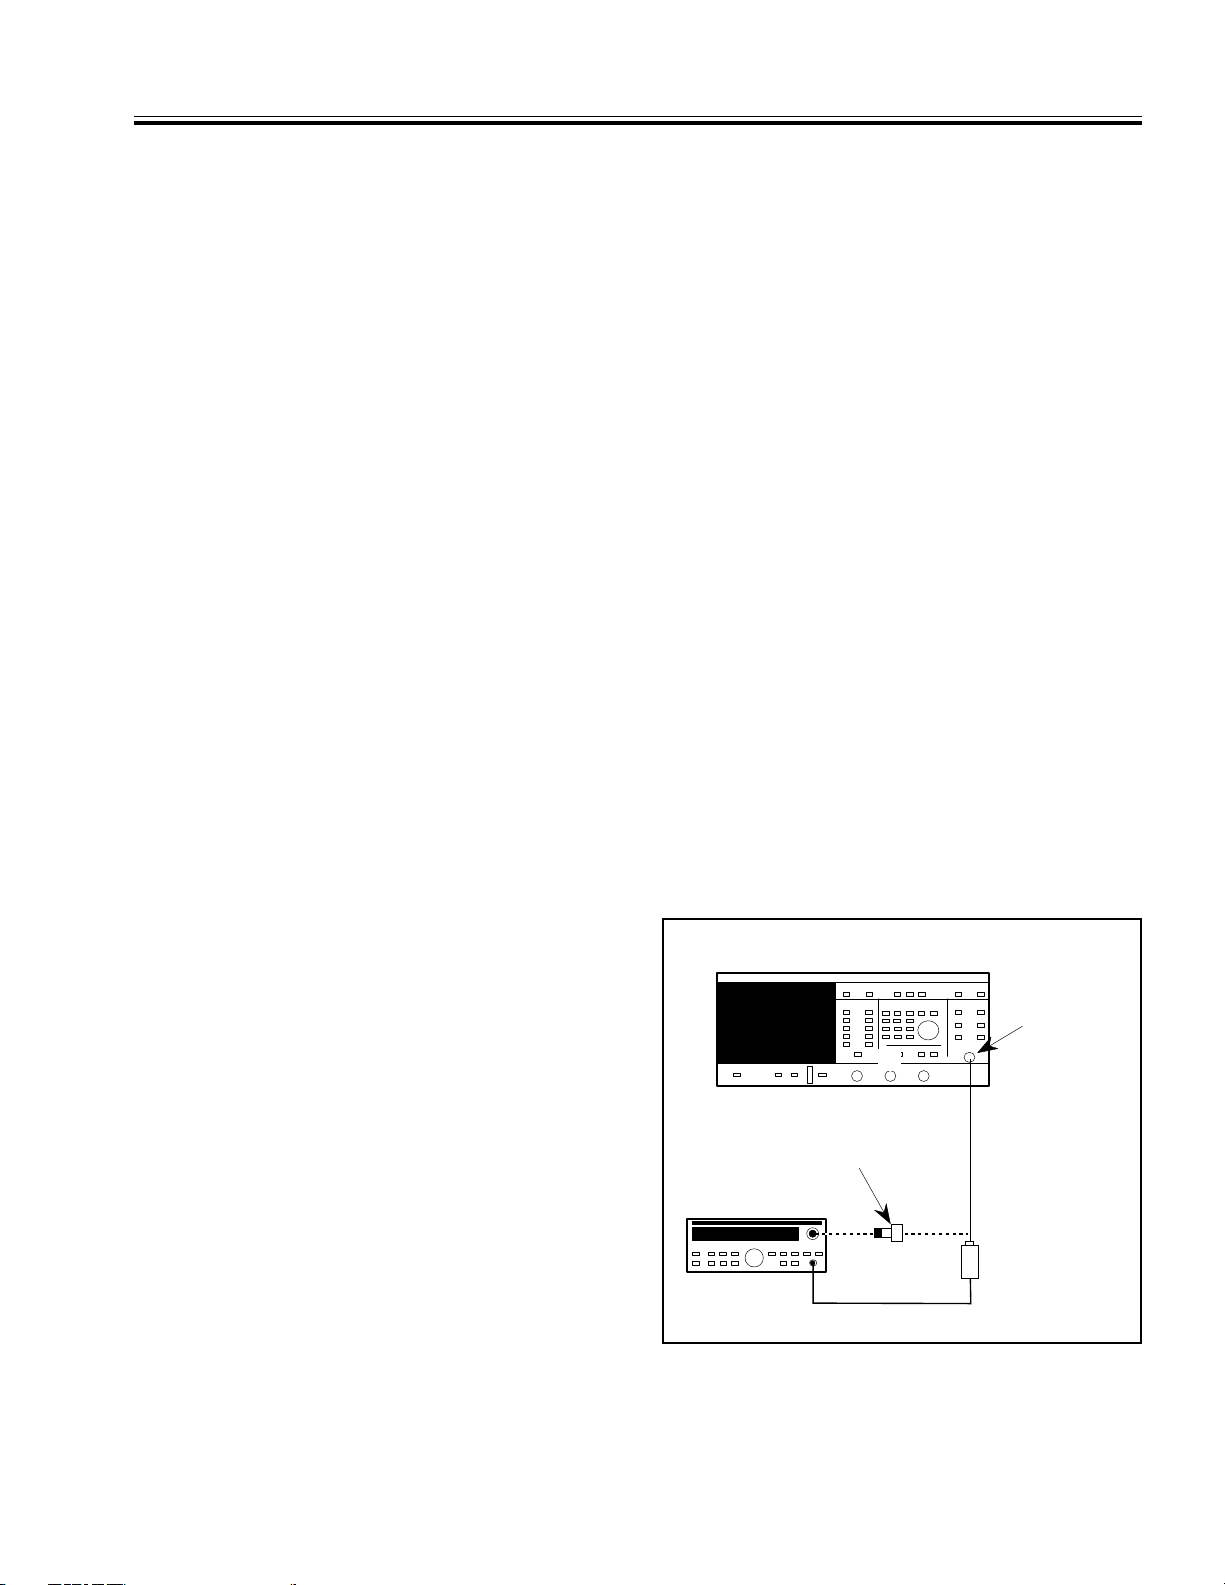
5400 SCALAR MEASUREMENT SYSTEM
POWER SENSOR
*
ANRITSU ML 4803A
POWER METER
RF OUTPUT
A
J0365 CONVERSION
CONNECTOR FOR 54XXA's
WITH 75
W
OUTPUTS
*
*
See Text
V PERFORMANCE VERIFICATION PROCEDURES OUTPUT POWER ACCURACY/ FLATNESS TEST
5-6 OUTPUT POWER ACCURACY/
FLATNESS TEST
This test verifies that t he outp ut power produced by
the 54XXA RF source is within specified limits
throughout the frequency range of the unit. The
specifications for each model are listed in Table 1-5
(in Section I — General Information). A test record
that you can copy and use to record test results is
contained in Tables 5-2a, 5-2b, and 5-2c.
a. E quipment Required
Anritsu ML4803A Power Meter, and:
Anritsu MA4601A power sensor for models
5407A, 5409A, and 5411A with 50Ω Signal
Source output.
Anritsu MA4603A power sensor and J0365
Conversion Connector for models 5407A,
5409A, and 5411A with 75Ω Signal Source out-
put.
Anritsu MA4701A/MA4702A power sensors
for models 5417A through 5431A and
model 5447A.
Anritsu MA4703A/MA4704A power sensors
for model 5436A.
Refer to Table 1-11 (Recomme nded Test Equipment) for further information, as required.
b. Procedure
1. For all models, 5411A thru 5447A: connect
high power sensor MA4701A or MA4703A, as
appropriate, to the power meter. Perform a
calibration as instructed in the Anritsu
ML4803A operations and service manual.
4. Turn both measurement channels off using
the DISPLAY ON/OFF keys. Press the
OUTPUT POWER key and set the power as
follows:
• For all models, 5411A thru 5447A, that do
not have an internal step attenuator: set
the power to +7.0 dBm (Table 5-2a).
• For models 5407A, 5409A, and 5411A that
do not have an internal step attenuator, set
the power to +12.0 dBm (Table 5-2b).
• For all models that are equipped with an
internal step attenuator, set the power to
+4.0 dBm (Table 5-2c).
5. Press the FREQUENCY key and then press
SELECT. Set the frequency width to 0 GHz (or
MHz) and the center frequency to the first
value listed in frequency Table 5-1. For example: 0.0100 GHz for the 5417A.
NOTE
Several photocopies of Table 5-1 are
useful as worksheets when performing the remainder of this procedure.
6. Ensu re the power met er sensor is connec ted
to the 54XXA RF output and the power meter
Cal Factor is set correctly for the frequency
under test.
For models 5407A, 5409A, and 5411A
equipped with a 50Ω signal source output:
connect the MA4601A power sensor to the
power meter and perform a calibration. For
units equipped with a 75Ω signal source output, the J0365 Conversion Connector must be
used in conjunction with the MA4603A power
sensor. Refer to the operatin g proce dure i n the
Anritsu ML4803A operations and service
manual.
2. Set up the equipment as shown in Figure 5-2,
and turn the equipment on.
3. Press the SYSTEM MENU key and select “RE-
SET” using the MENU up/down and SELECT
keys. From the RESET MENU select “RE-
STORE DEFAULT SETUP”.
54XXA OM 5-7
Figure 5-2. Equipment Setup for Po wer Accuracy/
Flatness Test
Page 74

OUTPUT POWER ACCURACY/ FLATNESS TEST V PERFORMANCE VERIFICATION PROCEDURES
7. Note the reading of the power meter and
observe that the power level is within the
power accuracy specification for the particular
54XXA model, as listed in Table 1-5 (in Sec-
tion I — General Information). Then set the
54XXA center frequency to the next frequency
listed in Table 5-1.
8. Repeat step 7 until the 54XXA RF power has
been measured at all the frequencies listed in
Table 5-1. Record the highest and lowest
power readings in Table 5-2a, 5-2b or 5-2c, as
appropriate. (Use Tables 5-2a or 5-2b for un its
not equipped with an internal step
attenuator; use Table 5-2c for units equipped
with an internal step attenuator.)
NOTE
For 5411A’s equipped with 75Ω signal source output, this measure-
ment is possible only to 2.0 GHz,
maximum.
9. The flatness at a particular power level is the
difference (in dB) between the highest and
lowest powe r level throughout the frequency
range. Refer to Table 1-5, as necessary.
10. For all models, 5417A thru 5447A, that do not
have an internal step attenuator, set the
power to 0.0 dBm. Then repeat steps 5 thru 9
(Table 5-2a).
For models 5407A, 5409A, and 5411A t hat do
not have an internal step attenuator, set the
output power to +2.0 dBm. Then repeat steps
5 thru 9 (Table 5-2b).
11. For all models that are equipped with an
internal step attenuator press the OUTPUT
POWER key and set the power to – 3.0 dBm.
Then repeat steps 5 thru 9 (Table 5-2c).
12. If the 54XXA being tested is equipped with an
internal step attenuator, perform the next
step. If not, go to paragraph 5-7 (Signal Channel Verification Test).
13. Reduce the 54XXA RF output power in 10 dB
steps per Table 5-2c, and repeat steps 5 thru 9
for each power level. When measuring
–23 dBm and below, use the appropriated
power sensor as described below.
For all models, 5417A thru 5447A: when
measuring power levels – 23 dBm and below,
connect the appropriate low power sensor
(MA4702A or MA4704A) to the power meter.
Perform a calibration and set the Cal Factor
for the 54XXA frequency being measured.
For models 5407A, 5409A, and 5411A
equipped w ith 50Ω signal sour ce outpu t: when
measuring power levels –23 dBm and below,
connect the MA4702A low power sensor to the
power meter. Perform a calibration and set
the Cal Factor for the 54XXA frequency being
measured. Use 10 MHz as the lowest frequency
when performing these tests.
NOTE
For units equipped with 75Ω signal
source output, measurement below
–30 dBm is not possible with the
equipment specified.
5-8 54XXA OM
Page 75
V PERFORMANCE VERIFICATION PROCEDURES OUTPUT POWER ACCURACY/ FLATNESS TEST
Table 5-2.
Output Power Accuracy and Flatness Test Chart / T est Record
Model 54 A Serial No. Date
Table 5-2a: All Models, 5417A thru 5447A,
Without Step-Att enuator
54XXA Set Power
dBm
+7.0
0.0
Max Power
dBm
Min Power
dBm
Table 5-2b: Models 5407A, 5409A, and 5411A,
Without Step-Attenuator*
54XXA Set Power
dBm
+12.0
+2.0
Max Power
dBm
Min Power
dBm
Flatness Difference
Max – Min dB
Flatness Difference
M ax – Min dB
Table 5-2c: All Models,
With Step-Attenuator
54XXA Set Power
dBm
+4.0
–3.0
–13.0
–23.0
–33.0**
–43.0**
–53.0**
∗ For 5411A’s equipped with 75Ω output and no internal step attenuator, the maximum frequency that can be measured
is 2.0 GHz.
∗∗ For Models 5407A, 5409A, and 5411A equipped with 75Ω output and an internal step attenuator, measurement below
–30 dBm is not possible.
Max Power
dBm
Min Power
dBm
Flatness Difference
Max – Min dB
54XXA OM 5-9
Page 76
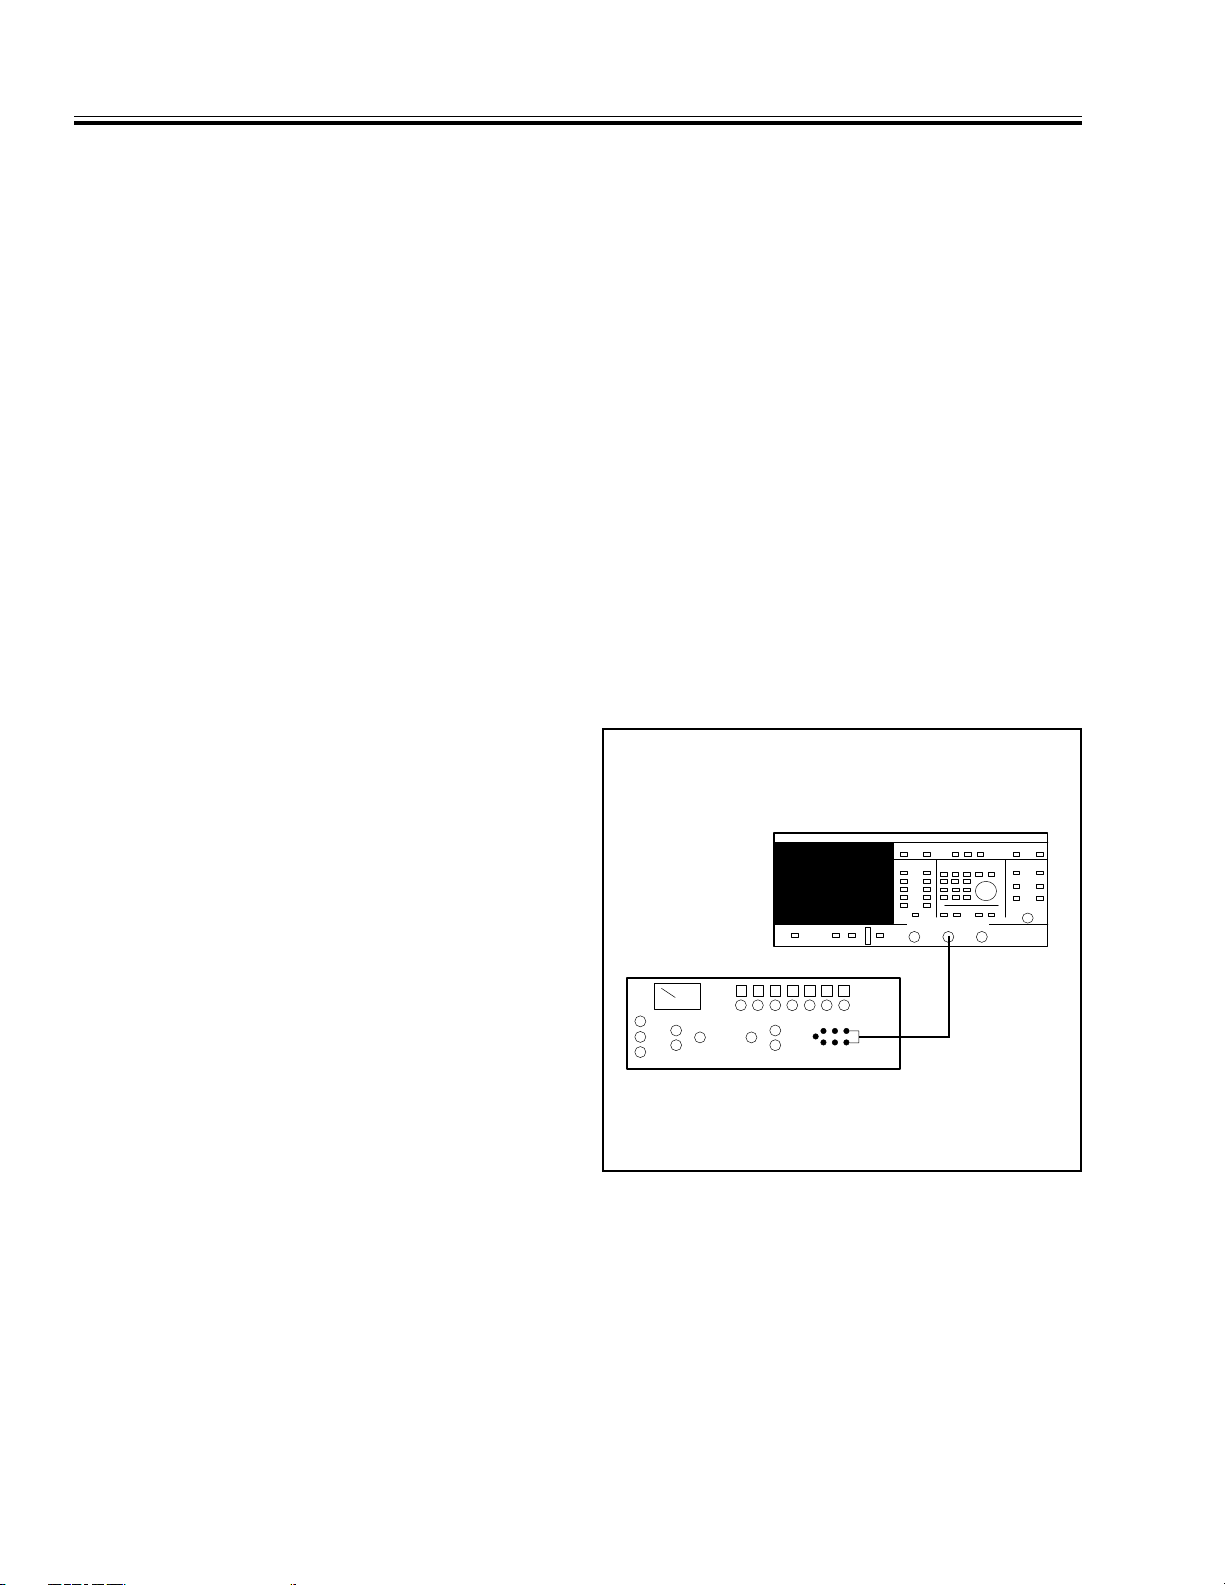
5400 SCALAR MEASUREMENT SYSTEM
FLUKE 335D VOLTAGE STANDARD
560 - 10BX
CABLE
RAB
SIGNAL CHANNEL VERIFICATION TESTS V PERFORMANCE VERIFICATION PROCEDURES
5-7 SIGNAL CHANNEL VERIFICATION
TESTS
The signal channel verification is made up of three
individual parts:
Part 1 is a DC voltage calibration method test where
a known DC voltage is injected into the input of the
54XXA (paragraph 5-7.1).
Part 2 is a 50 MHz RF verification test using the
Anritsu power meter 50 MHz, 0dBm power reference
as a standard (paragraph 5-7.2).
Part 3 is a mid band frequency test that uses a
known RF input (paragraph 5-7.3). This test is susceptible to various measurement uncertainties,
which are explained in paragraph 5-7.4.
5-7.1 DC Voltage Method
The DC voltage method uses highly accurate DC
voltages to simulate input RF power inputs. This
test introduces fewest source errors. A 560-10BX
adaptor cable is used to connect the output of the DC
Voltage St andard to the input of the 54XXA.
5. Press the CALIBRATION key and select “DC
CAL MENU”.
6. Allow the 54XXA to sweep for 5 seconds.
7. With the SET DC MENU displayed, move the
highlighted cursor to “ON” and press SE-
LECT. The 54XXA should display a noise floor
on Channel 1 in power mode with “DC CAL”
displayed in the to p right hand corner of the
screen display.
8. Set the voltage standard output to the first
value listed in Table 5-3a (page 5-15).
9. Press the CURSOR key to obtain a cursor
readout on the 54XXA display. Verify that the
cursor readout value is within the tolerance
specified in Table 5-3a. Record the readout
value in the table.
10. Repeat step 9 for the remaining two voltag e
values in Table 5-3a.
11. Repeat steps 2 to 10 for signal channel inputs
B and R.
a. E quipment Required
Fluke 335D Voltage Standard
WILTRON 560-10BX Adapter Cable.
b. Procedure
1. Set up the equipment as shown in Figure 5-3,
and turn the equipment on.
2. Press the SYSTEM MENU key and select “RE-
SET” using the MENU up/down and SELECT
keys. From the RESET MENU select “RE-
STORE DEFAULT SETUP”. This will set the
54XXA to initial factory settings.
3. Turn Channel 2 off. Press the Channel 1
MENU key and set for power measurement
using INPUT A as input.
4. Turn the voltage standard output to off. This
will be used as a zero volt reference input t o
the 54XXA.
Figure 5-3. Equipment Setup for DC Voltage Method
Signal Channel Verification Test
5-10 54XXA OM
Page 77
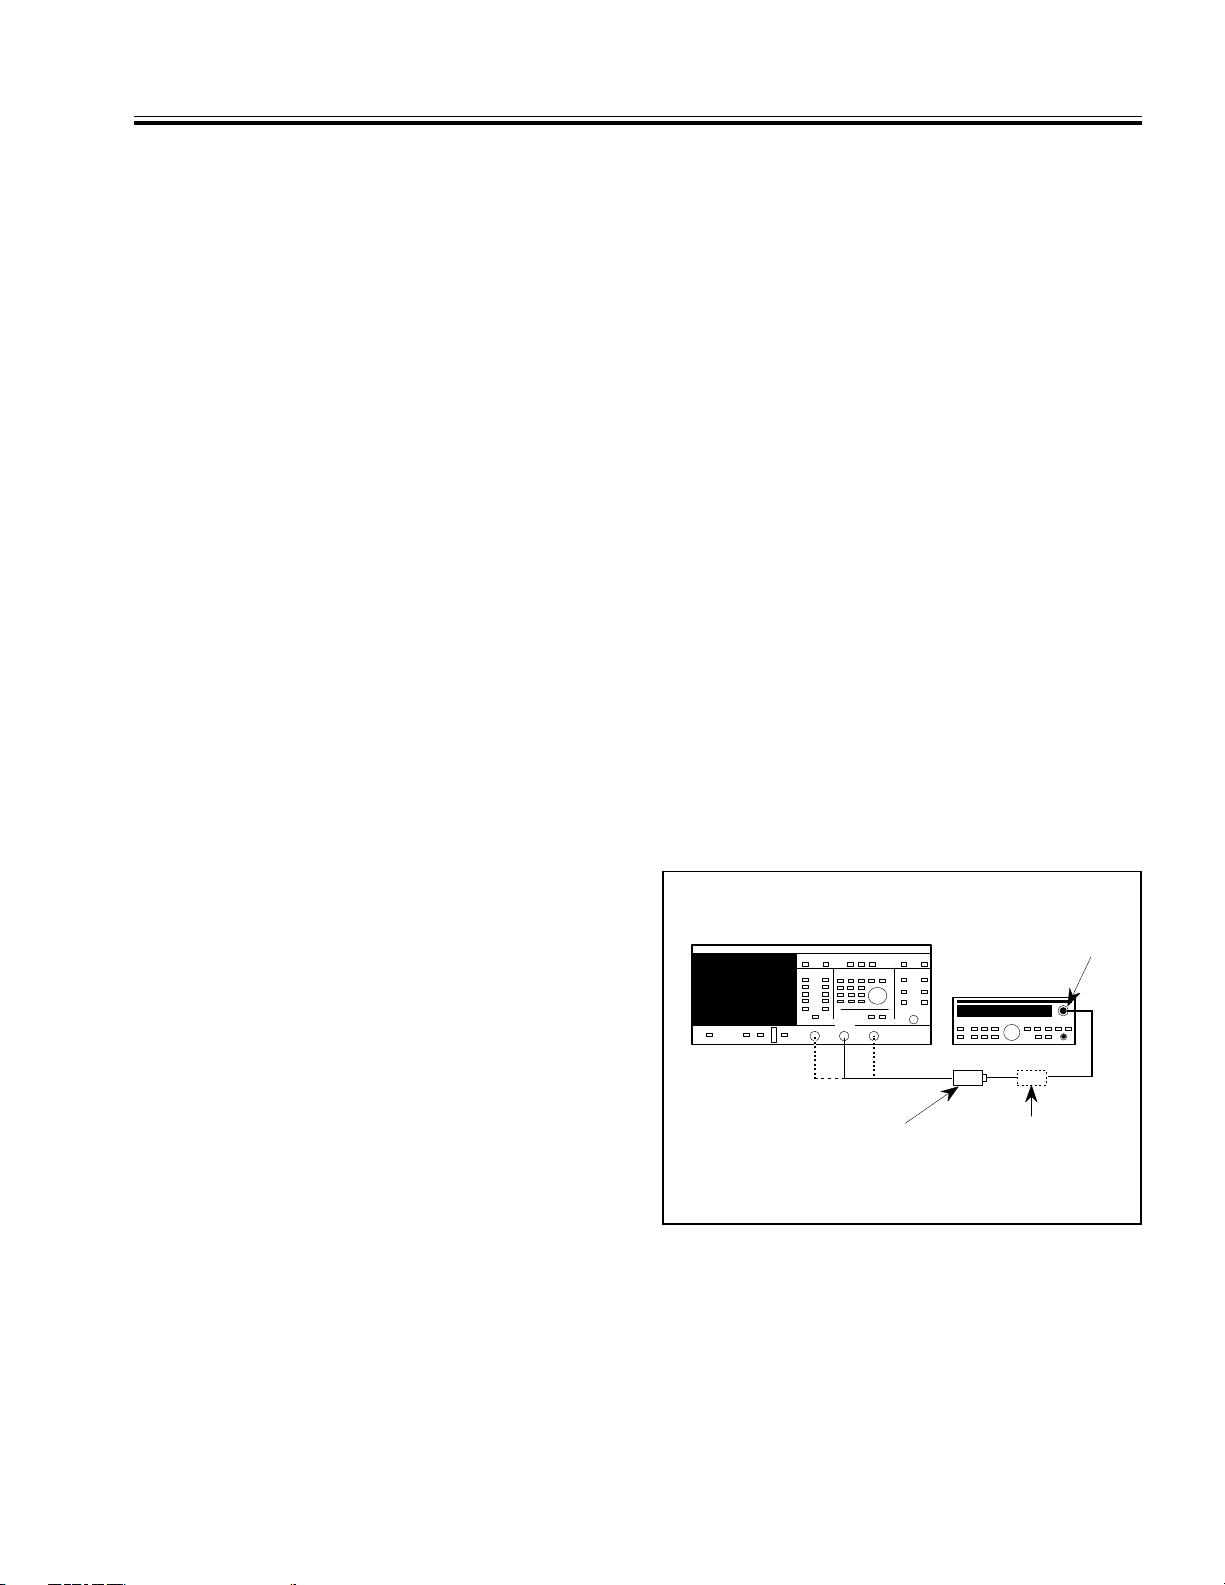
5400 SCALAR MEASUREMENT SYSTEM
30 dB ATTENUATOR
ANRITSU MP47A
RF DETECTOR*
ANRITSU ML 4803A
POWER METER
*See Text
CAL OUTPUT
A
V PERFORMANCE VERIFICATION PROCEDURES SIGNAL CHANNEL VERIFICATION TESTS
5-7.2 50MHz Accuracy Test
This test confirms the performance of the 54XXA at
50 MHz using 0 dBm and –30 dBm reference signals.
NOTE
If the 54XXA being tested is a model
5407A, 5409A, 5411A, 5417A, or 5447A,
this test need not be performed; go to
paragraph 5-7.3 (Mid Band Frequency
RF Test).
The 50 MHz calibration output of the Anritsu power
meter is used as the 0 dBm reference signal for this
test. This same reference signal is used in conjunction with the 30 dB attenuator from the Anritsu
MA4702A power sensor to produce the –30 dBm
reference signal. The measurement performance of
the 54XXA at 50 MHz can thus be confirmed at these
two levels.
During the test, the 54XXA is set to the “DC CAL”
mode to measure the fixed power output of the power
meter; this mode enables the 54XXA to make accurate power measurements by disabling the auto zero
function of each s ignal channel (refer to Sect ion IV,
Table 4-6).
a. E quipment Required
Anritsu ML4803A Power Meter
Anritsu MP47A 30 dB Attenuator
RF Detector, WILTRON 560-7N50 for all mod-
els except 5436A
RF Detector, WILTRON 560-7K50 for
model 5436A
b. Procedure
1. Set up the equipment as shown in Figure 5-4,
and turn the equipment on.
4. Connect the RF detector to the 54XXA Input A
connector and to the power meter 50 MHz
reference signal connector (CAL OUTPUT).
Switch the power meter reference signal off.
5. Press the CALIBRATION key and select
“DC CAL MENU”.
6. Allow the 54XXA to sweep for 5 seconds and
then select the “ON” option from the SET DC
CAL menu. The 54XXA should display
“DC CAL” in the top right hand corner of the
screen display.
7. Press the CURSOR key to obtain cursor readout on the 54XXA screen display.
8. Switch the power meter 50 MHz reference
signal ON and verify that the 54XXA cursor
reading is 0.00 dBm ±0.30 dBm. Record the
reading in Table 5-3b in the space provided.
9. Disconnect the detector from the power meter
CAL OUTPUT connector and connect the
30 dB attenuator between the detector and
the CAL OUTPUT connector. Verify that the
54XXA cursor readout is 30.00 ±0.45 dBm.
Record the reading in Table 5-3b.
10. Repeat steps 2 to 9 for signal channel inputs B
and R.
2. Press the SYSTEM MENU key and select “RE-
SET” using the MENU up/down and SELECT
keys. From the RESET MENU select “RE-
STORE DEFAULT SETUP”.
3. Turn Channel 2 off. Press the Channel 1
MENU key and set for power measurement
using INPUT A as input.
54XXA OM 5-11
Figure 5-4. Equipment Setup for 50 MHz Standard
Source Signal Channel Verification Test
Page 78
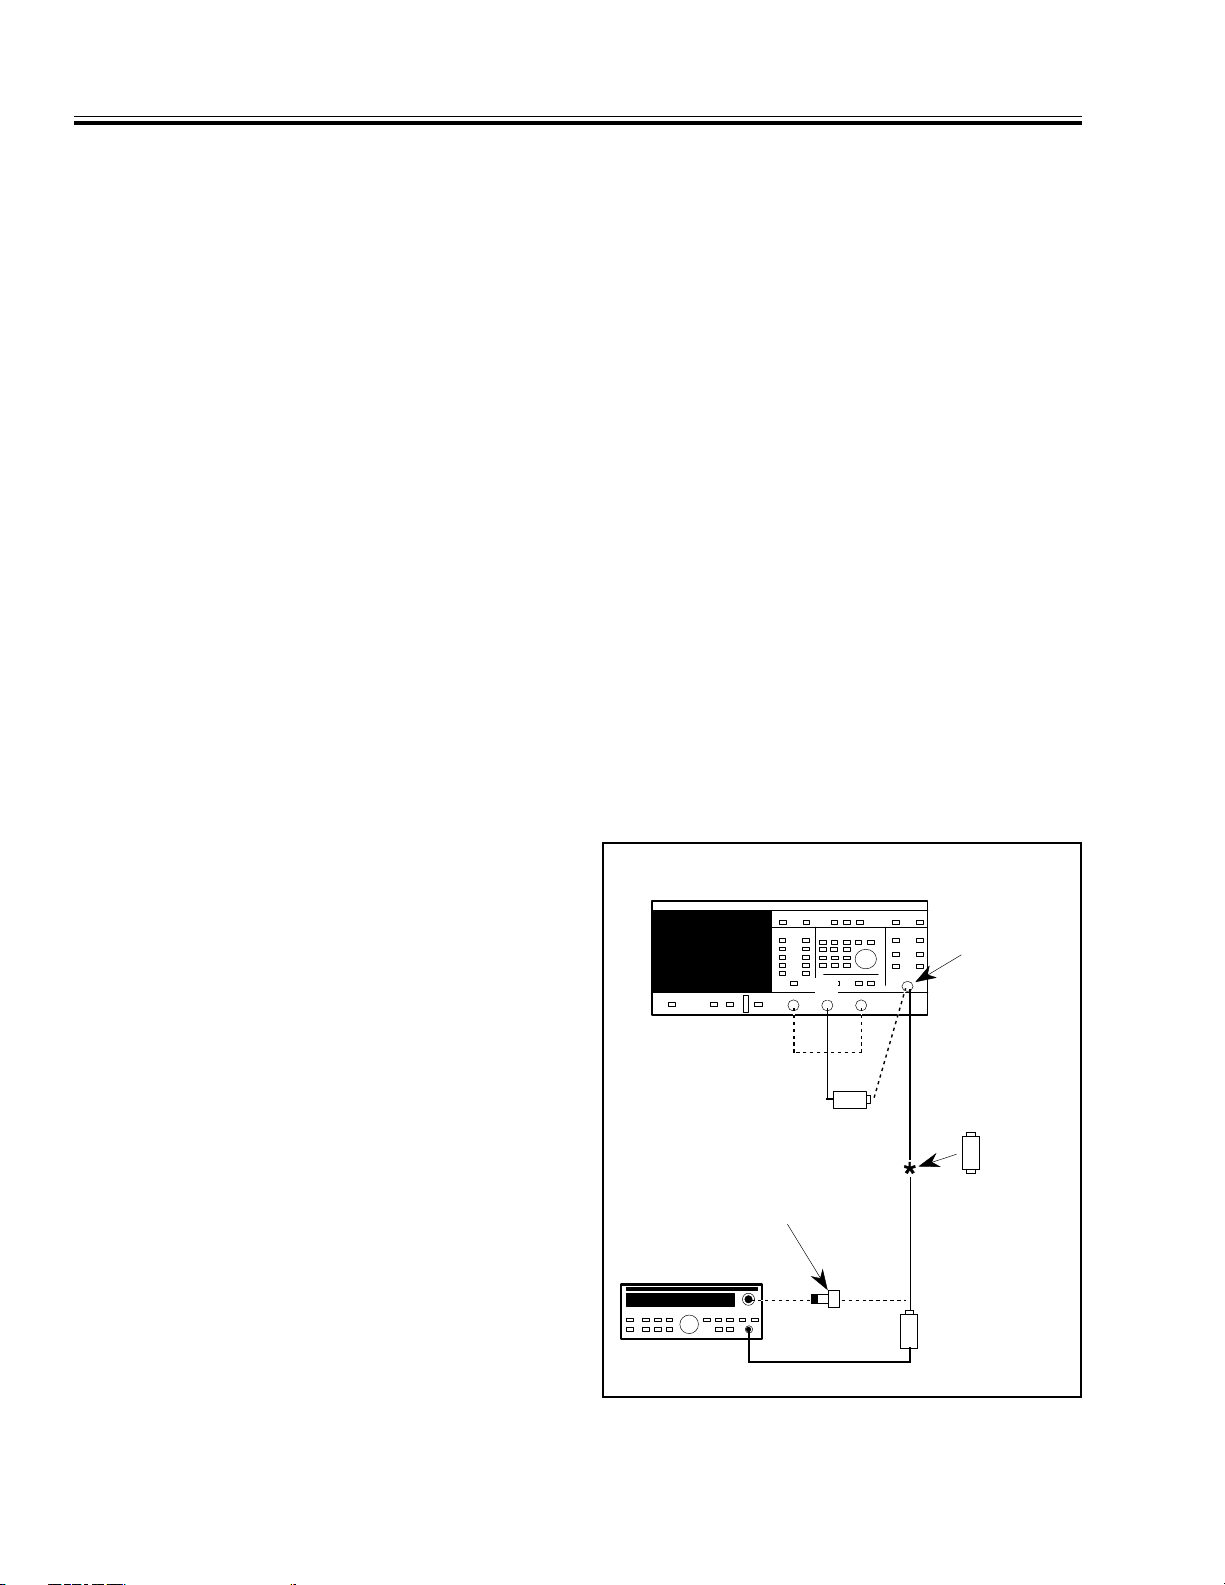
5400 SCALAR MEASUREMENT SYSTEM
STEP
ATTENUATOR
(if required)
*
POWER SENSOR
*
POWER SENSOR
*
ANRITSU ML 4803A
POWER METER
RF OUTPUT
A
J0365 CONVERSION
CONNECTOR FOR 54XXA's
WITH 75 Ω OUTPUTS
*
*
See Text
SIGNAL CHANNEL VERIFICATION TESTS V PERFORMANCE VERIFICATION PROCEDURES
5-7.3 Mid Band Frequency RF Test
This set of measurements confirms the power measurement accuracy of the complete system, including
each of the analyzer signal channel inputs. The tests
are performed at two points in the dynamic range of
the analyzer’s signal channels at the a mid-band
frequency for the particular 54XXA model. These
measurements have inherent inaccuracies, which
are explained in the next paragraph, 5-7.4.
a. E quipment Required
Anritsu ML4803A Power Meter, and:
Anritsu MA4601A power sensor for models
5407A, 5409A, and 5411A with 50Ω Signal
Source output.
Anritsu MA4603A power sensor and J0365
Conversion Connector for models 5407A,
5409A, and 5411A with 75Ω Signal Source out-
put.
Anritsu MA4701A/MA4702A power sensors
for models 5417A through 5431A and
model 5447A.
Anritsu MA4703A/MA4704A power sensors
for model 5436A.
RF Detector, WILTRON 5400-71N50 for models
5407A, 5409A, and 5411A with 50Ω Signal
Source output.
RF Detector, WILTRON 5400-71N75 for models
5407A, 5409A, and 5411A with 75Ω Signal
Source output.
RF Detector, WILTRON 560-7N50 for models
5417A through 5431A and model 5447A.
RF Detector, WILTRON 560-7K50 for
model 5436A.
60 dB Step Attenuator, Hewlett Packard
Model 8495B or 8495D (0.00 to 26.5 GHz).
(Used only for 54XXA’s not equipped with
internal attenuator).
b. Procedure
1. Set up the equipment as shown in Figure 5-5,
and turn the equipment on.
For all models, 5411A thru 5447A: connect
high power sensor MA4701A or MA4703A, as
appropriate, to the power meter. Perform a
calibration as instructed in the Anritsu
ML4803A operations and service manual. Do
not connect the power sensor to the 54XXA RF
OUTPUT at this time.
connect the MA4601A power sensor to the
power meter. F or units equipped with a 75
signal source output, connect the MA4603A
power sensor (in conjunction with the J0365
Conversion Connector) to the power meter
(see Figure 5-5). Perform a calibration as instructed in the Anritsu ML4803A operations
and service manual. Do not connect the power
sensor to th e 54 XXA RF OUTPUT at this time.
2. Press the SYSTEM MENU key and select “RE-
SET” using the MENU up/down and SELECT
keys. From the RESET MENU select “RE-
STORE DEFAULT SETUP”. This will set the
54XXA to initial factory settings.
3. For all models 5419A thru 5436A: press the
FREQUENCY key and then press SELECT.
Set the width to 0 GHz (or MHz). (This sets
the 54XXA to the mid-band frequency for the
particular model.) Press the OUTPUT POWER
key and set the power to +2.0 dBm.
For models 5407A, 5409A, 5411A, 5417A and
5447A: set the center frequency to 50 MHz.
For all of these models (with 50Ω and 75
signal source outputs), press the OUTPUT
POWER key and set the power to +2.0 dBm.
Ω
Ω
For models 5407A, 5409A, and 5411A
equipped with a 50Ω signal source output:
Figure 5-5. Equipment Setup for Mid Band RF
Frequency Signal Channel Verification Test
5-12 54XXA OM
Page 79

V PERFORMANCE VERIFICATION PROCEDURES SIGNAL CHANNEL VERIFICATION TESTS
4. Turn both measurement channels off using
the DISPLAY ON/OFF keys.
5. Press the SYSTEM MENU key and select
“DATA POINTS.” Select “101” from the
FREQUENCY DATA POINTS menu.
6. Connect the power sensor to the 54XXA
RF OUTPUT connector. Ensure that the power
meter Cal Factor is set correctly for the
frequency under test.
For all models equipped with a 50Ω signal
source output, including models 5407A,
5409A, and 5411A, record the power meter
reading in Table 5-3c. Disconnect the power
sensor from the 54XXA.
For all 5407A, 5409A, and 5411A units
equipped with a 75Ω signal source output,
record the power meter reading in Table 5-3d.
Disconnec t th e p ow er se ns or fr om t he 5 4XX A.
7. Connect the appropriate RF detector for the
54XXA model being tested between the
54XXA A INPUT and the RF OUTPUT
connector. (See Equipmen t Required, above.)
8. Press the Channel 1 MENU key and set for
power measurement using INPUT A as inp ut.
9. Press the CURSOR key to obtain a cursor
readout on the 54XXA screen display. Record
the cursor reading in the space provided in
Table 5-3c, or Table 5-3d, as appropriate. The
difference between the power meter reading
taken in Step 7 and the cursor reading is the
54XXA Signal Channel Error.
10. Calculate the maximum allowable signal
channel error using the formula below. This
Absolute
Power
Accuracy
Channel
= √
Accuracy
2
Detector Freq
+
Response
2
formula calculates the overall error as the
root-sum-square of all the relevant measurement errors.
For models 5419A thru 5436A, refer to Figures 5-7 and 5-8 (page 5-17) to determine the
Channel Accuracy value and the Detector Frequency Response value at the mid-band frequency and input power level used for the
test. For models 5407A, 5409A, and 5411A,
Refer to Table 1-3 (page 1-8) to determine the
Channel Accuracy value and the Detector
Frequency Response value at 50 MHz. (Re-
minder: 50 MHz is used as the test frequency
for models 5407A, 5409A, 5411A, and 5417A
and 5447A.)
11. Verify that the 54XXA cursor reading is less
than the maximum allowable error calculated
in step 10.
12. Repeat steps 6 thru 11 for signal channel inputs B (and R, if present).
13. Switch off measurement Channel 1 using the
DISPLAY ON/OFF key.
14. For all 5407A, 5409A, and 5411A units
equipped w i th a 7 5Ω signal source output and
not equipped with an internal step attenuator: press the OUTPUT POWER key and se t
the power to +10 dBm. Repeat steps 6 thru 11
for signal channel inputs A, B (and R, if present). Record readings and results in Table
5-3d. (Go to paragraph 5.7.4 at end of test.)
15.
For all models equipped with a 50Ω signal
source output (including models 5407A,
5409A, and 5411A), connect the low power
sensor, MA4702A, to the power meter and
perform a calibration.
For model 5436A: connect the low power sensor, MA4704A, to the power meter and perform a calibration.
16.
For all 54XXA models equipped with a 50
Ω
signal source output and an internal step
attenuator, go to step 26.
For all 5407A, 5409A, and 5411A units
equipped wit h a 75Ω signal source output and
an internal step attenuator, go to step 35.
17.
For all models equipped with a 50Ω signal
source output (including models 5407A,
5409A, and 5411A) and not equipped with an
internal step attenuator: connect the external
step attenuator to the 54XXA RF OUTPUT
connector and set it for 50 dB attenuation.
Then perform steps 18 thru 25 below.
18. Connec t the po we r se ns or to th e ou tput of the
attenuator. Press the 54XXA RF ON /O FF key
to turn the RF power output off.
19. Zero the power meter. Press the 54XXA RF
ON/OFF key to turn the R F po we r ou tp u t on.
20. Record the power meter reading in the space
provided in Table 5-3c. Disconnect the power
sensor from the 54XXA.
54XXA OM 5-13
Page 80

SIGNAL CHANNEL VERIFICATION TESTS V PERFORMANCE VERIFICATION PROCEDURES
21. Connect the RF detect or between the 54XXA
INPUT A connector and the output of the step
attenuator. Press the Channel 1 MENU key
and set for power measurement using IN-
PUT A as input.
22. Press the AVERAGING key and select 128 averages. Wait for the averaging counter to
reach 128. Then press the cursor key to obtain
a cursor readout on the 54XXA screen display.
23. Record the 54XXA cursor reading in the space
provide in Table 5-3c. The difference between
the power meter reading taken in Step 20 and
the cursor reading is the Signal Channel Error.
24. Calculate the maximum allowable error as in
step 10. Verify that the 54XXA cursor reading
is less than the calculated maximum allowable error.
25. Repeat steps 21 thru 24 for signal channel
inputs B (and R, if present). Go to paragraph 5.7.4 at end of test.
26.
For all 54XXA models equipped with a 50
signal sour ce outpu t and with an internal step
attenuator: Press the 54XXA OUTPUT
POWER key and set the pow er to –48 dBm.
Then perform steps 27 thru 34 below.
27. Connect the power sensor of the power meter
to the 54XXA RF OUTPUT connector. Press
the 54XXA RF ON/OFF key to turn the RF
power output off.
Ω
28. Zero the power meter. Press the 54XXA RF
ON/OFF key to turn the R F po we r ou tp u t on.
29. Record the power meter reading in the space
provide in Table 5-3c. Disconnect the power
sensor from the 54XXA.
30. Connect the RF detect or between the 54XXA
INPUT A connector and the 54XXA RF OUT-
PUT connector. Press the Channel 1 MENU
key and set for power measurement using INPUT A as input.
31. Press the AVERAGING key and select 128 averages. Wait for the averaging counter to
reach 128. Press the cursor key to obtain a
cursor readout on the 54X XA screen display.
32. Record the 54XXA cursor reading in the space
provide in Table 5-3c. The difference between
the power meter reading taken in Step 29 and
the cursor reading is the 54XXA Signal Channel Error.
33. Calculate the maximum allowable error as in
step 10. Verify that the 54XXA cursor reading
is less than the calculated error value.
34. Repeat steps 30 thru 33 for signal channel
inputs B (and R, if present). Go to paragraph 5.7.4 at end of test.
35. For all 5407A, 5409A, and 5411A units
equipped wit h a 75Ω signal source output and
with an internal step attenuator: press the
OUTPUT POWER key and set the power to
–20 dBm. Repeat steps 6 thru 11 for signal
5-14 54XXA OM
Page 81
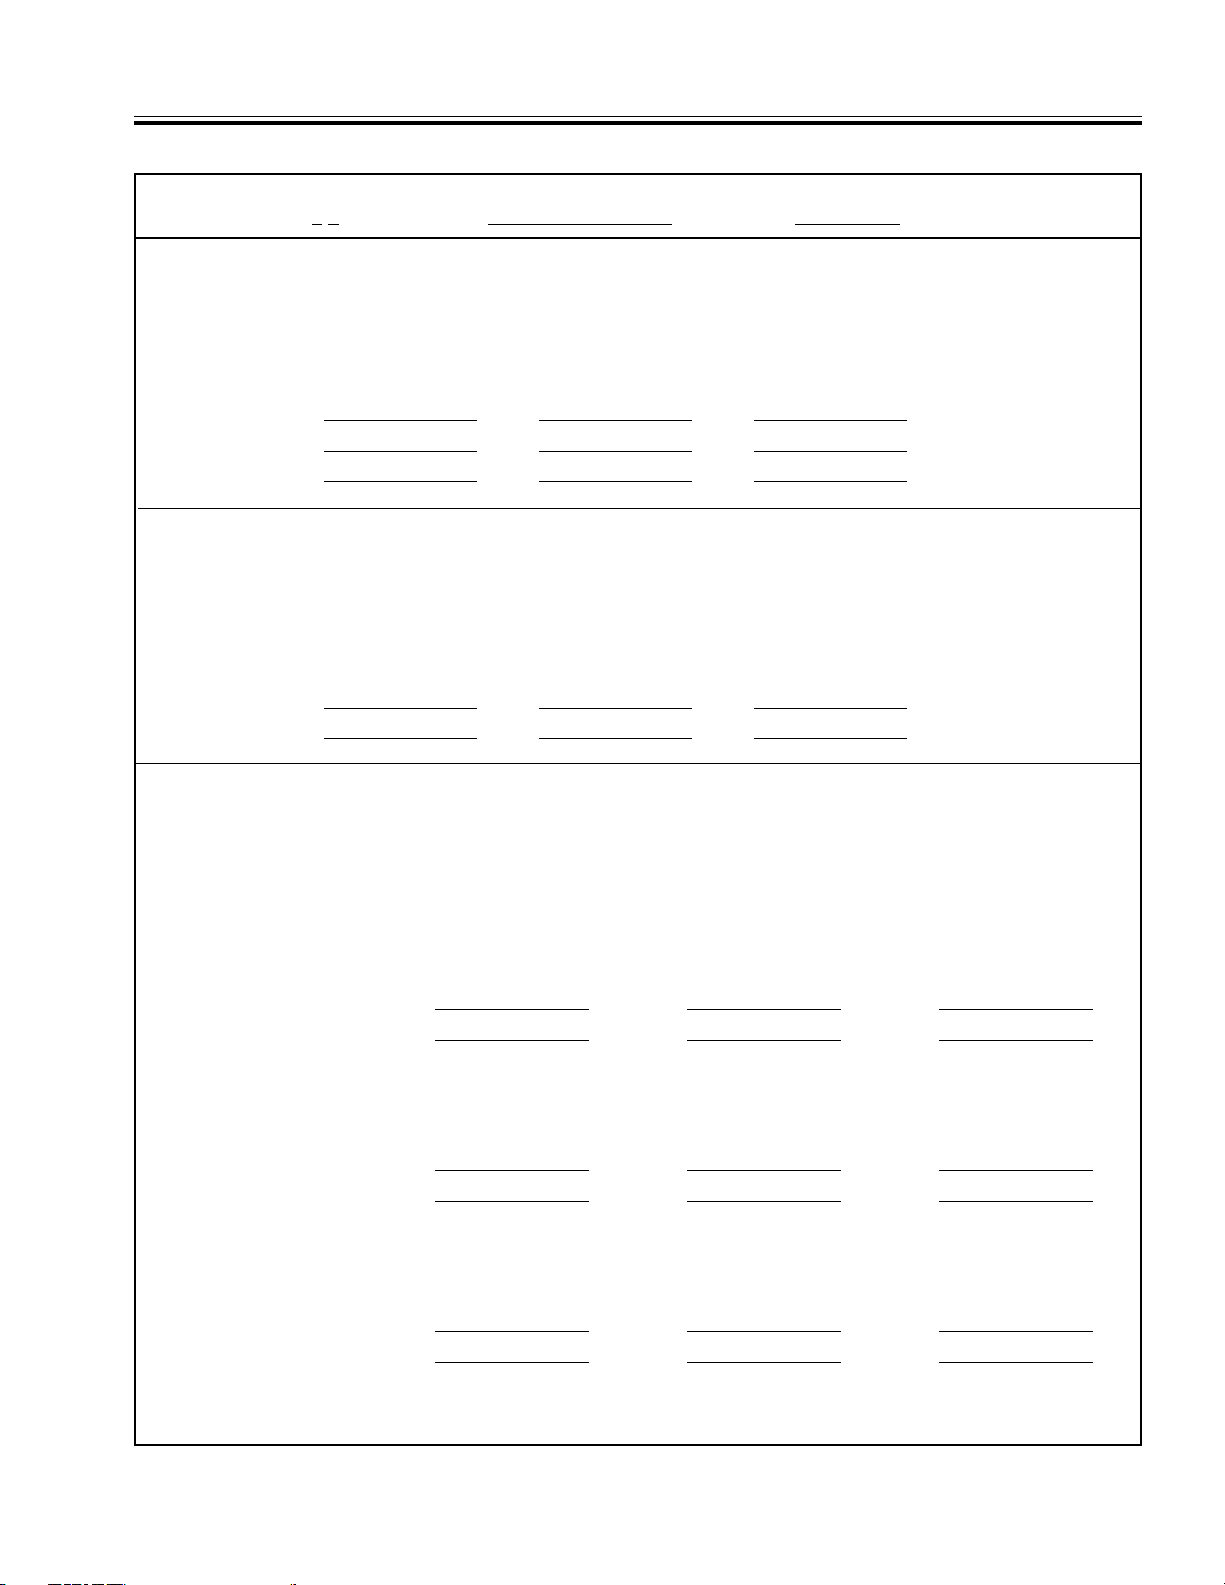
V PERFORMANCE VERIFICATION PROCEDURES SIGNAL CHANNEL VERIFICATION TESTS
Table 5-3.
Signal Channel Verification Tests Chart / T e st Record (Sheet 1 of
Model 54 A Serial No. Date
Table 5-3a: Signal Channel Verification Test,
DC Cal Method
DC Voltage 54XXA Cursor Readout Value Specified Limits
Input A Input B Input R
–1.462 V
–0.6208 V
–1.313 mV
+16.00 +0.25, –0.10
+9.00 +0.12, –0.10
–26.00 +0.34, –0.34
dBm
Table 5-3b: Signal Channel Verification Test,
Standard 50 MHz Source Method
50 MHz Ref 54XXA Cursor Readout Value Specified Limits
Input A Input B Input R
0.00 dBm 0.00 +0.30, – 0.30
–30.00 dBm
–30.00 +0.45, –0.45
dBm
Table 5-3c: Signal Channel Verification Test,
Mid Band RF Input Method
All Models with 50Ω Signal Source Output, 5407A thru 5447A
Input A
Measurement
Power*
+2.00 dBm
–4 8.00 dB m
Measurement
Power*
+2.00 dBm
–4 8.00 dB m
Measurement
Power*
+2.00 dBm
–4 8.00 dB m
Power Meter
Reading dBm
Input B
Power Meter
Reading dBm
Input R
Power Meter
Reading dBm
54XXA Cursor
Reading
54XXA Cursor
Reading
54XXA Cursor
Reading
54XXA Signal
Channel Error**
54XXA Signal
Channel Error**
54XXA Signal
Channel Error* *
54XXA OM 5-15
Page 82

SIGNAL CHANNEL VERIFICATION TESTS V PERFORMANCE VERIFICATION PROCEDURES
Table 5-3.
Signal Channel Verification Tests Chart / T e st Record (Sheet 2 of 2 )
Model 54 A Serial No. Date
Table 5-3d: Signal Channel Verification Test,
Models 5407A, 5409A, and 5411A with 75Ω Signal Source Output
Measurement
Power, w it h I nt .
Step-Atten.*
+2.00 dBm +2.00 dBm
–20.00 dBm +10.00 dBm
Measurement
Power*
+2.00 dBm +2.00 dBm
–20.00 dBm +10.00 dBm
Measurement
Power, without
In t. Step-Atten.**
Measurement
Power, without
In t. Step-Atten.**
Mid Band RF Input Method
Input A
Power Meter
Reading dBm
Input B
Power Meter
Reading dBm
54XXA Cursor
Reading
54XXA Cursor
Reading
54XXA Signal
Channel Error**
54XXA Signal
Channel Error**
Input R
Measurement
Power*
+2.00 dBm +2.00 dBm
–20.00 dBm +10.00 dBm
∗ This test performed at 50 MHz for models 5407A, 5409A, 5411A, 5417A, and 5447A.
∗∗ Allowable limits and measurement error sources are explained in text.
Measurement
Power, without
In t. Step-Atten.**
Power Meter
Reading dBm
54XXA Cursor
Reading
54XXA Signal
Channel Error**
5-16 54XXA OM
Page 83
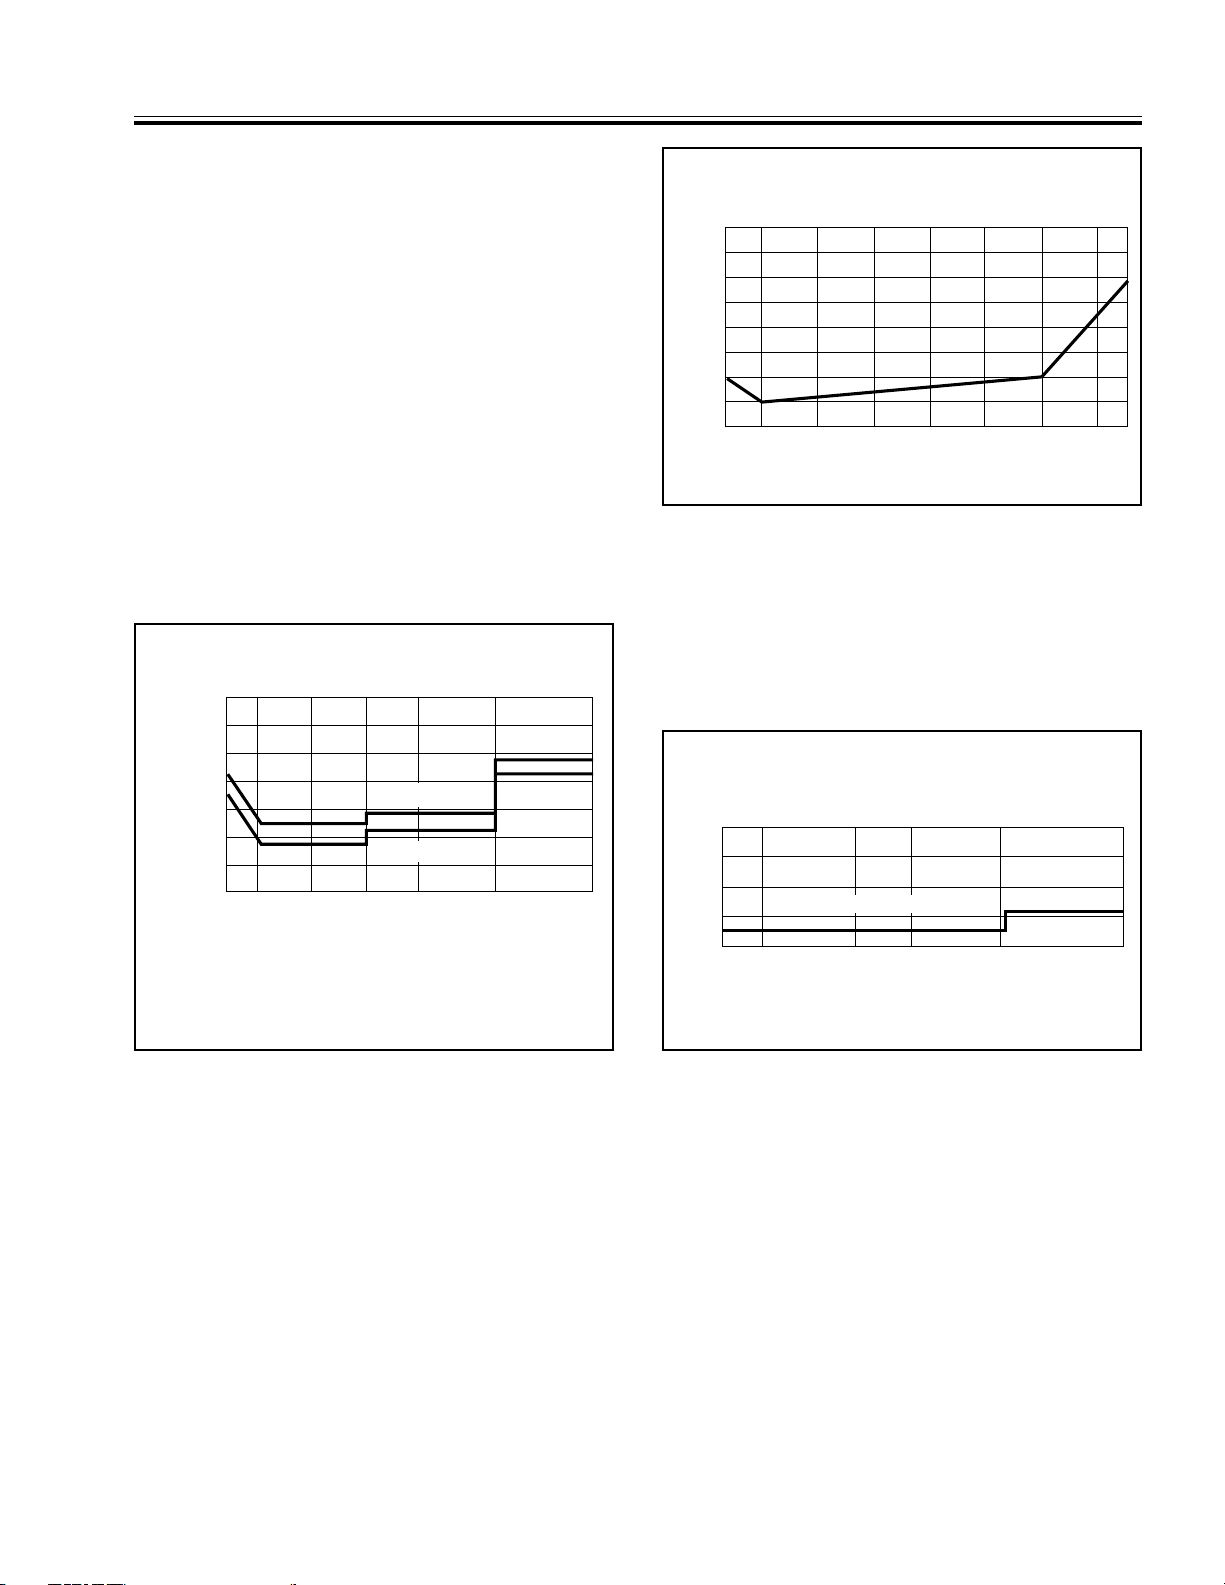
Input Power (dBm)
+16 +10 0 -10 -20 -30 -40 -50 -55
1.6
1.4
1.2
1.0
0.8
0.6
0.4
0.2
0.0
Accuracy (+/- dB)
4
3
2
1
0
12.4 18.5
26.5
Frequency (GHz)
0.0 2.0
8.0
Frequency Response
(+/- dB)
Maximum Variation
V PERFORMANCE VERIFICATION PROCEDURES SIGNAL CHANNEL VERIFICATION TESTS
channel inputs A, B (and R, if presen t). Record
readings and results in Table 5-3d.
Channel Accuracy (25°C)
5-7.4 Measurement Uncertainties In Mid
Band Frequency RF Test Method
The signal channel verification measurements using
the mid-band RF frequency test method (paragraph 5-7.3) contains inherent measurement uncertainties. These uncertainties are explained in the
following paragraphs.
a. Detector/Source Match Interaction Uncer-
tainty
The mismatch between the RF source and the RF
detector contributes a possible error source known
Figure 5-7. 54XXA Signal Ch annel Accuracy
as source match uncertainty. This uncertainty is
dependent on the return loss of the detector, the
b. Source Harmonics
input source impedance, and the power level meas-
In the linear range of the RF detector between
+16 dBm and –15 dBm, harmonics of the 54XXA
Mismatch Uncertainty (Typical)*
1.4
1.2
1.0
0.8
0.6
0.4
Uncertainty Caused
by Mismatch (+/- dB)
0.2
Transmission Measurement
0
.01 .04 4
15 dB Return Loss
20 dB Return Loss
8 12.4
Frequency (GHz)
18.5
26.5
source co ntribu te to errors in me asurem ent.
c. Signal Channel Accuracy
560-7 Series Detector Frequency Response
∗
Va ries with the return los s of the detector, SWR Auto tester,
connecting cables, the source impedance of the sweep
generator, an d the value of the m easured reflection.
Figure 5-6. Typi cal 54XXA Sy stem Mism atch
Uncertainty
ured. Figure 5-6 shows the possible mismatch error
related to the return loss of the detector and the
frequency me asured.
54XXA OM 5-17
Figure 5-8. Detector Freq uency Response
The 54XXA signal channel measurement accuracy
varies with input signal power. As the power level
being measured decreases the error increases, as
shown in Figure 5-7.
Page 84
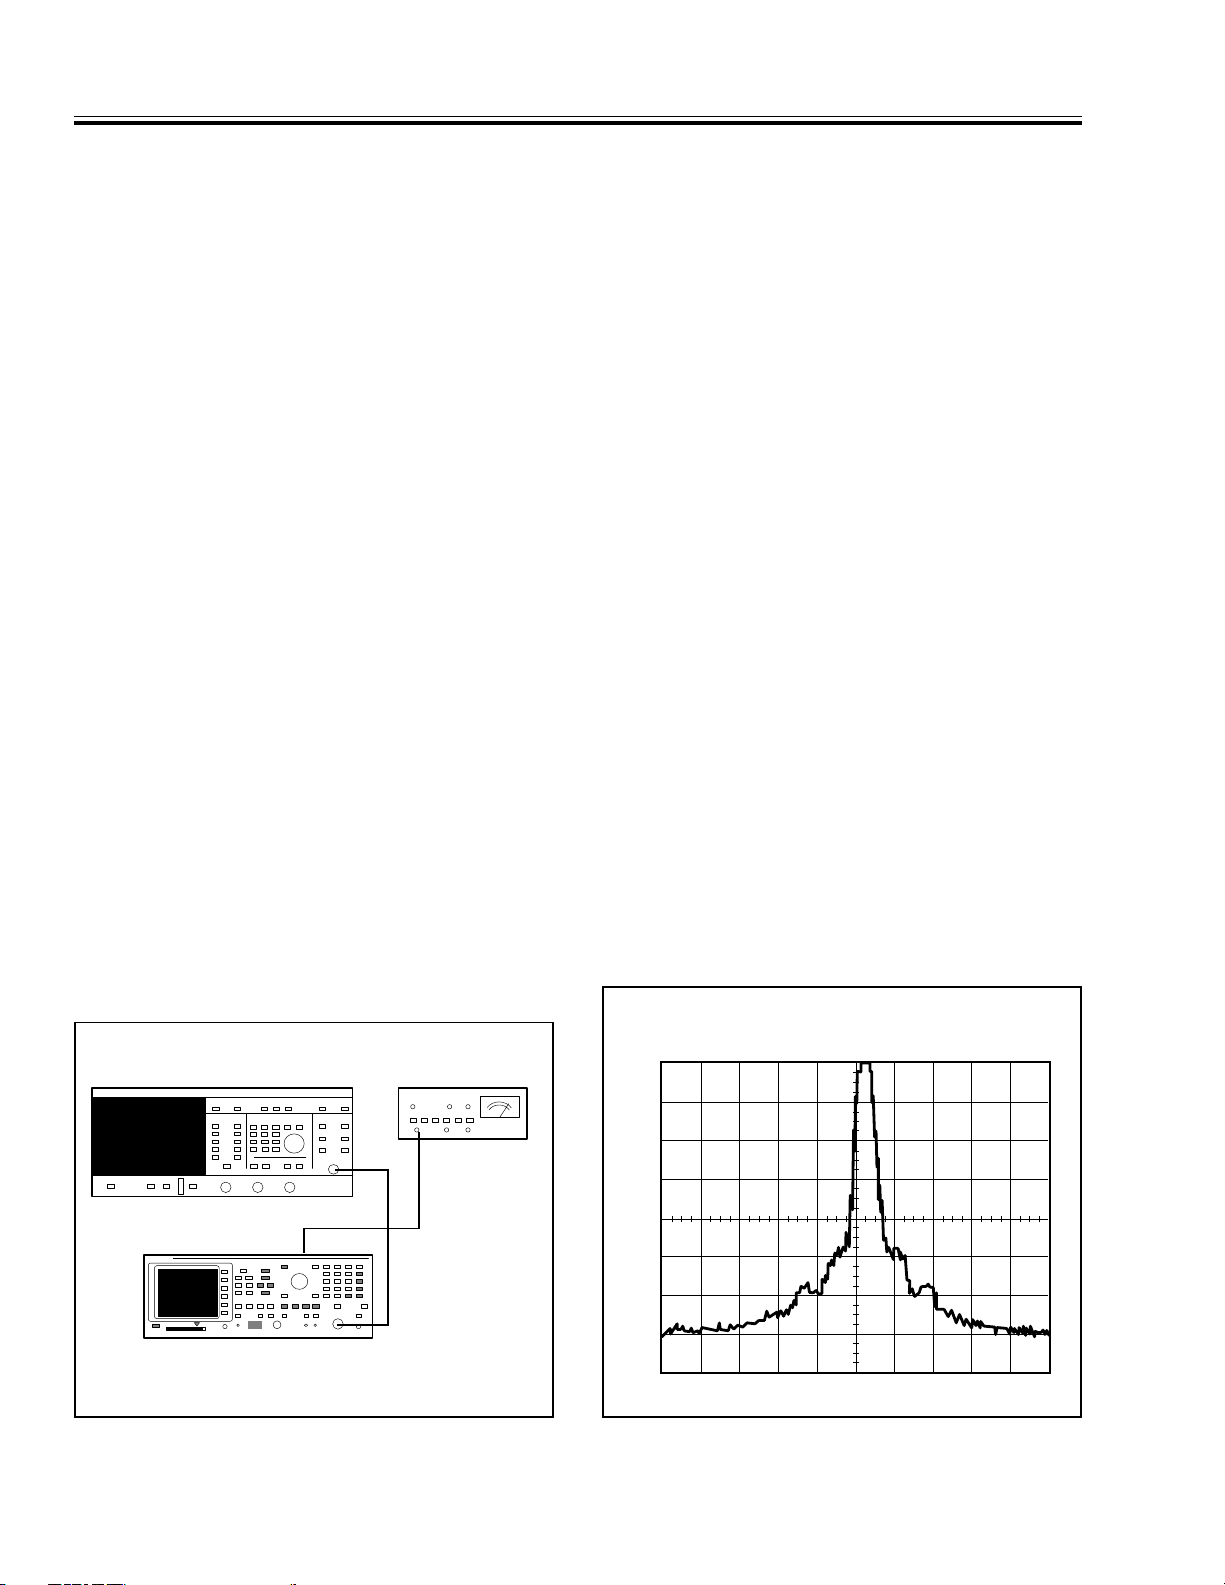
10 dB/DIVISION
0
-10
-20
-30
-40
-50
RESIDUAL FM TEST V PERFORMANCE VERIFICATION PROCEDURES
d. Detector Frequency Response
The frequency response of the 560-7 series detector
introduces a possible measureme nt error, as shown
in Figure 5-8. This type of error is normally removed when a calibration is performed.
5-8 RESIDUAL FM TEST
This test verifies that the residual FM of the 54XXA
signal source is within specified limits. The s pecification for this characteristic is different for the various 54XXA models. The residual FM specification for
each model type is listed in Table 1-5 in the General
Information section of the manual.
The residual FM measurement is made at the highest signal source output frequency for the particular
54XXA model, as this is the frequency at which the
residual FM is maximum. The Anritsu MS2802 spectrum analyzer is used to down convert the 54XXA
signal source output so that the Marconi TF2304
Modulation meter can be used to measure the FM
products.
a. E quipment Required
Anritsu MS2802 Spectrum Analyzer.
Marconi TF 2304 Modulation Meter.
b. Procedure
1. Set up the equipment as shown in Figure 5-9,
and turn the equipment on.
2. Press the SYSTEM MENU key and select “RE-
SET” using the MENU up/down and SELECT
keys. From the RESET MENU select “RE-
STORE DEFAULT SETUP”.
3. Turn both measurement channels off using
the DISPLAY ON/OFF keys. Press the
OUTPUT POWER key and set the power to
+4.0 dBm (+7 dBm for units without an internal step attenuator).
4. Press the FREQUENCY key and set the
START frequency to the same value as the
STOP frequency. The 54XXA should now be in
CW mode at the highest signal frequency for
that model.
5. Tune the spectrum analyzer to center the
54XXA output signal at the center frequency
graticule line.
6. Adjust the sp ectrum analyzer reference level
to place the to p of the waveform on the refer ence level graticule line.
7. Set the spectrum analyzer frequency span/div
to 100 kHz. The spectrum analyzer display
should resemble Figure 5-10.
8. Now set the frequency span/div to 10 mS (zero
span). Re-adjust the tuning control to place
the trace on the reference level g raticule, as
necessary.
9. View the modulation meter and ensure that
the HIGH and LOW indicators are off. Read
the frequency deviation meter and verify that
the value is within the specified limits for the
particular 54XXA model as listed in Table 1-5.
5400 SCALAR MEASUREMENT SYSTEM MODULATION METER
Figure 5-9. Equipment Setup For Residual FM Test
5-18 54XXA OM
RF IN
RF OUT
IF OUT
RF INPUT
ANRITSU MS 2802A
SPECTRUM ANALYZER
Figure 5-10. Spectrum Analyzer Screen Displa y
Page 85
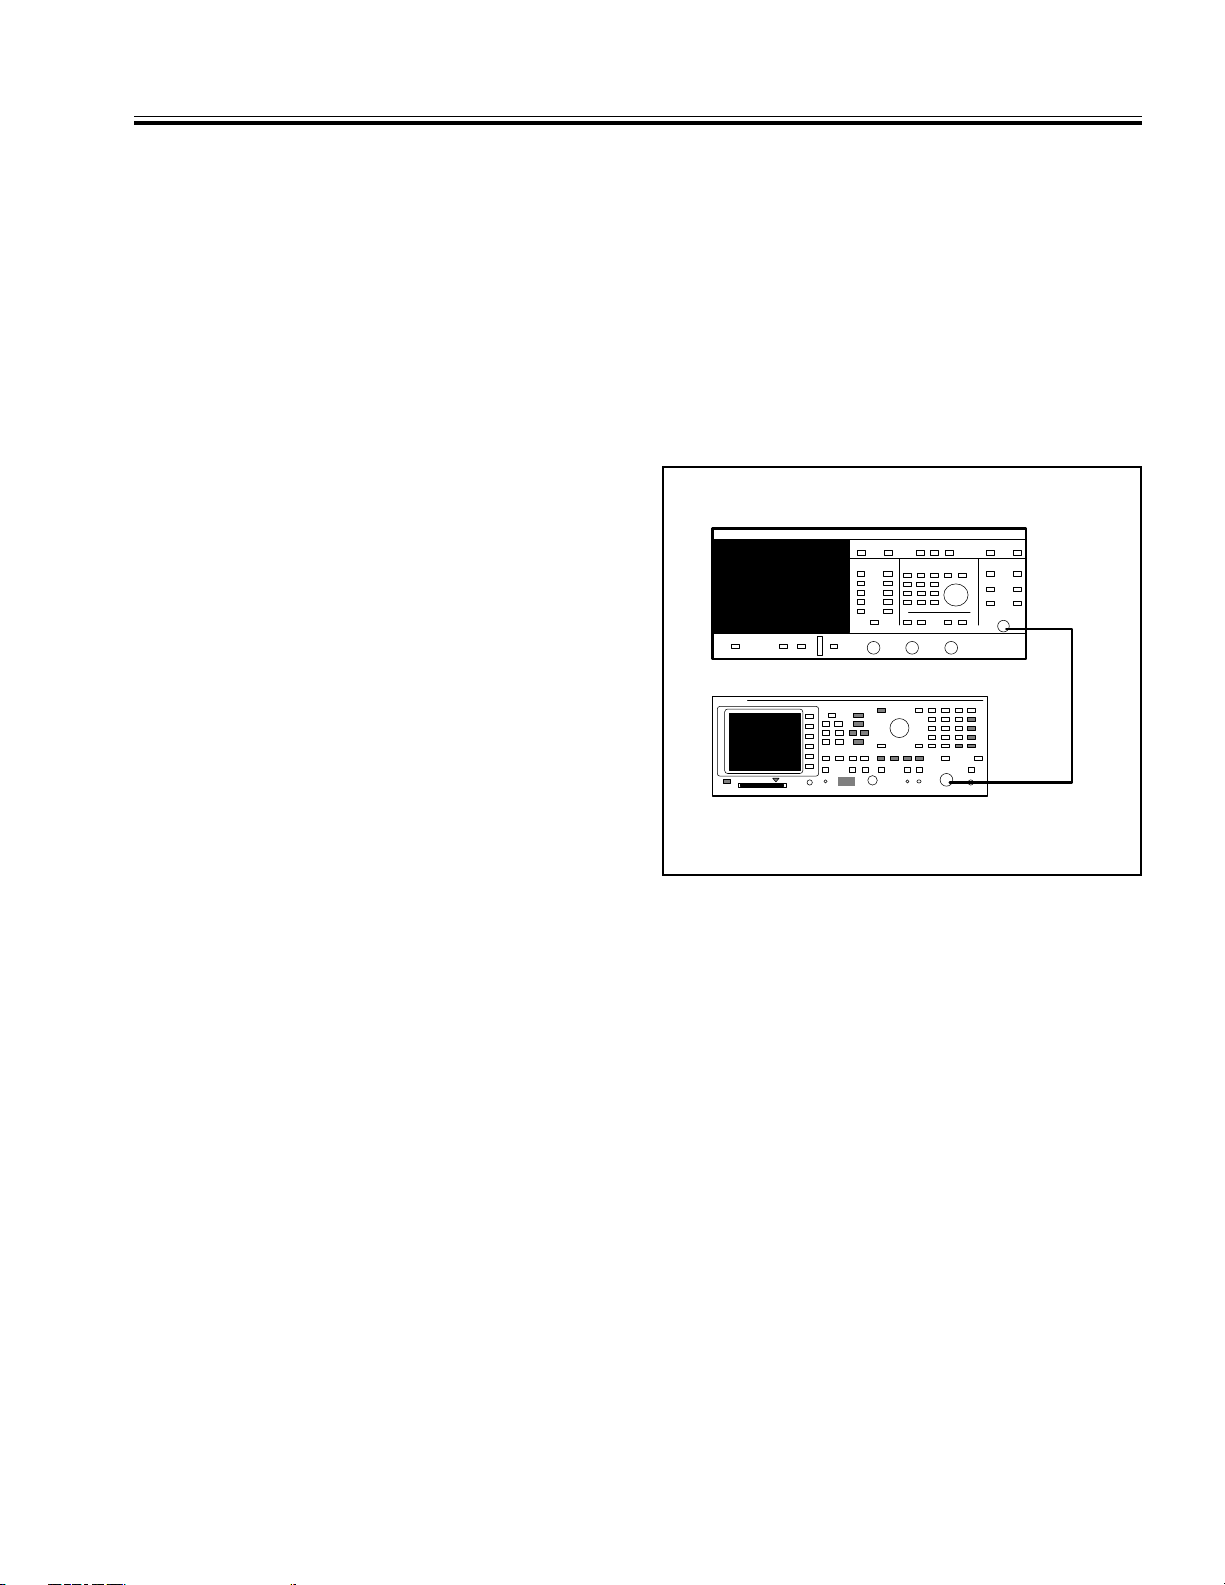
5400 SCALAR MEASUREMENT SYSTEM
ANRITSU MS 2802A
SPECTRUM ANALYZER
RF OUT
RF IN
V PERFORMANCE VERIFICATION PROCEDURES SOURCE OUTPUT SIGNAL PURITY TESTS
10. If the unit is a 5417A perform the following
steps, otherwise go to paragraph 5-9, Source
Output Signal Test.
11. Press the 54XXA FREQUENCY key. Set the
center freq uency to 1 .9 GHz; thus set ting th e
5417A in the low-frequency band. Then repeat
steps 5 thru 9.
5-9 SOURCE OUTPUT SIGNAL PURITY
TESTS
This test verifies that the harmonic and nonharmonic (spurious) signals from the 54XXA signal
source are within the specified limits. The specification for these characteristics are different for the
various 54XXA models; they are listed in Table 1-5
in the General Information section of the manual.
a. E quipment Required
Anritsu MS2802 Spectrum Analyzer
b. Procedure
1. Set up the equipment as shown in Figure 5-11, and turn the equipment on.
2. Press the SYSTEM MENU key and select “RE-
SET” using the MENU up/down and SELECT
keys. From the RESET MENU select “RE-
STORE DEFAULT SETUP”.
+4.0 dBm (+7 dBm for units without an internal step attenuator).
4. Press the FREQUENCY key and then press
SELECT. Set the width to 0 GHz (or MHz).
Select the “CENTER/WIDTH” FREQUENCY
menu and use the data e ntry knob to adjust
the frequency to the minimum value allowed.
5. Adjust the spectrum analyzer frequency
span/div and resolution bandwidth controls to
view the 54XXA output signal.
3. Turn both measurement channels off using
the DISPLAY ON/OFF keys. Press the
OUTPUT POWER key and set the power to
Figure 5-11. Equipment Setup for Source Output
Signal Purity Test
54XXA OM 5-19
Page 86
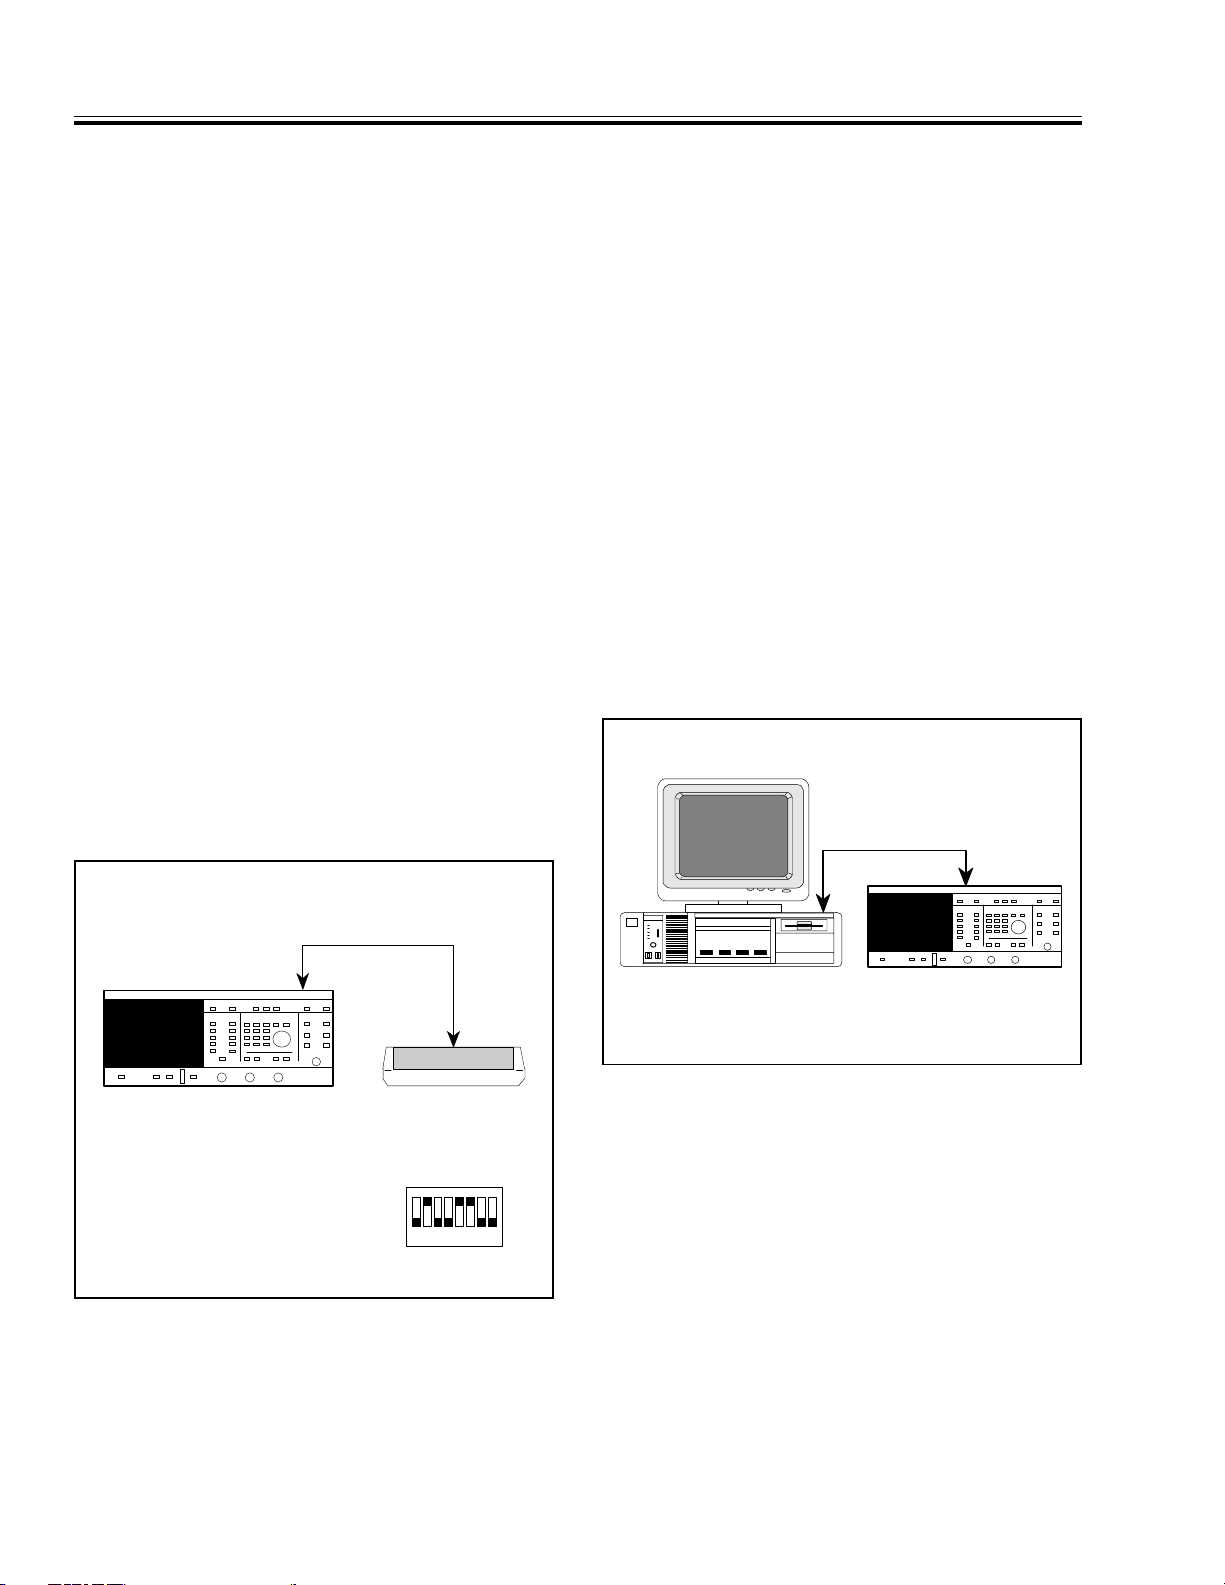
5400 SCALAR
MEASUREMENT SYSTEM
GPIB CABLE
EXTERNAL
COMPUTER/CONTROLLER
PRINTER OPERATION TEST V PERFORMANCE VERIFICATION PROCEDURES
6. Adjust the reference level control for 0 dB/Division.
7. While monitoring the spectrum analyzer
display, use the Data Entry knob to slowly
increase the 54XXA frequency throughout its
range. Verify that the harmonics and nonharmonics are within the specified limits listed in
Table 1-5.
5-10 PRINTER OPERATION TEST
This test confirm the centronics printer interface is
operational. The test involves connecting a centronics interface printer to the 54XXA and confirming
that a graphics dump can be performed.
a. Equipment
WILTRON model 2225C Ink Jet Printer, or
equivalent, with associated parallel interface
cable.
b. Procedure
1. Connect the test equipment as shown in Figure 5-12 and turn the equipment on. Use the
interface cable to connect the printer to the
54XXA rear panel PARALLEL PRINTER
INTERFACE connector.
keys. From the RESET MENU select “RE-
STORE DEFAULT SETUP”.
3. Check that the printer has sufficient paper
and is “on line.”
4. Press the HARD COPY key and then press the
START key. The printer should print a copy of
the 54XXA screen display. This will take
approximately one minute to complete.
5-11 GPIB OPERATION TEST
Only perform this section if the 54XXA has the GPIB
option fitted. This test checks that the 54XXA can
communicate to and from a controller.
a. E quipment Required
Personal Computer equipped with National
PCIIA GPIB Interface Card, or HP 200 Series
Computer, or Wiltron 85 Controller, or equivalent.
2. Press the SYSTEM MENU key and select “RESET” using the MENU up/down and SELECT
5400 SCALAR MEASUREMENT SYSTEM
Figure 5-12. Equipment Setup for Printer Operation
Test
PARALLEL
INTERFACE CABLE
WILTRON MODEL 2225C
INK JET PRINTER
SWITCH SETTINGS
MODE SELECT
1
0
1 2345678
Figure 5-13. Equipment Setup for GPIB Operation
Test
PRINTER
5-20 54XXA OM
Page 87

V PERFORMANCE VERIFICATION PROCEDURES GPIB OPERATION TEST
a. GPIB Operation Test Program For PC With National PCIIA Card
Ö'0)" 4EST 0ROGRAM
Ö).#,5$% Ö#QB<QBDEC BASÖ Ö 'IVE ACTUAL PATHNAME
#,3
DUT ),&).$Ø$%6 Ö $%6 ISNAME IN )"#/.&
#!,, )"724 DUTØ/)$Ù Ö 3END /UTPUT)$ENTIFY COMMAND
IDENT 30!#%
#!,, )"2$DUT IDENT Ö 2ECEIVE DATA FROM 88!
02).4 Ø 4HEUNIT UNDER TEST IS A Ù ,%&4IDENT
02).4
02).4 Ø 4HEFIRMWARE VERSION IS Ù -)$IDENT
%.$
Note: Before load ing this pr ogram, th e software for the Nationa l PCIIA Card and the Quick Bas ic operat ing
system must be lo aded into th e PC.
b. GPIB Operation Test Program For HP 200 or WILTRON 85 Controller
/54054 Ø/)$Ù
%.4%2 !
02).4
02).4
02).4
02).4 Ø4(% 5.)4 5.$%2 4%34 )3 !Ù
!;=
02).4
02).4
02).4 Ø4(% &)2-7!2% 6%23)/. )3 Ù
!;=
02).4
02).4
02).4
02).4
%.$
Figure 5-14. 54XXA GPIB Function Test Programs
b. Procedure
1. Connect the test equipment as shown in Figure 5-13 and turn the equipment on.
2. Select the appropriate test program for the
computer or controller used wit h the 54XXA
from the two that are listed in Figure 5-14.
3. Load the sele cted program and check that it
operates correctly. The computer/controller
should display the model type of the 54XXA
and the 54XXA firmware revision on the computer display monitor.
54XXA OM 5-21/5-22
Page 88

APPENDIX A
Table of Contents
A-1 POWER-ON DEFAULT CONTROL SETTINGS . . . . . . . . . . . . 3-3
A-2 FRONT PANEL LED ERROR CODES . . . . . . . . . . . . . . . . . 3-3
A-3 54XXA ERROR WARNING MESSAGES . . . . . . . . . . . . . . . . 1-4
A-4 REAR PANEL CONNECTORS . . . . . . . . . . . . . . . . . . . . . . 3-8
A-5 PRINTER SWITCH SETTINGS . . . . . . . . . . . . . . . . . . . . . 3-10
54XXA OM A-1/A-2
Page 89
POWER-ON DEFAULT CONTROL SETTINGS
APPENDIX FRONT PANEL LED ERROR CODES
A-1 POWER-ON DEFAULT CONTROL SETTINGS
Table A-1. Reset Default Front Panel Control Settings
Control Setting Default Control Setting Default
Alternate Frequency Mode Off Width Frequency HBEF – LBEF
Averaging Mode Off Power Output Level : W/O Atten. With Atten.
Current Swee p Mode Start/Stop Mode
Cursor Off
Graticule Off Model 5436: +10 dBm + 7 dB m
Hardcopy Pl ot Type Plot All All Other Model s: + 7 dBm + 4 dBm
Hardcopy Print Type Print All Limits Off
Leveling Mode Internal Markers Off
Printer Select On Measurement Mode, Ch 1 Transmission, Input A
RF Power On Measurement Mode, Ch 2 Return Loss, Input B
Frequency In formation Displaye d Reference Line Off
Smoothing Mode Off Offset 0 dB
Trace Hold Off Resolution 10 dB
Number of Da ta Po ints 401 Print Text String Le ngth 12 Spaces
Start Frequency Low Band Edge Freq (LBEF)* User Title String Length 12 Spaces
Stop Freque ncy High Band E dge Fr eq (HB EF)* GPIB
Center Frequency
LBEF + ((HBEF – LBEF) ÷ 2)
Models 5407/09/11, 50Ω:
Models 5407/09/11, 75Ω:
+12 dbm +10 dbm
+10 dbm + 8 dbm
System, Main Address = 6
Plotter Address = 8
∗ Per Table 1-1.
A-2 FRONT PANEL LED ERROR CODES
The following table lists the 54XXA Self Test front panel LED error codes. These codes relate to error
conditions detected during the self test. (Refer to paragraph 3-5 in Section III — Front Panel Operation.)
Table A-2. Front Panel LED Error Co des
LED Name Condition/Fault LED Name Condition/Fault
HARDCOPY
PRINTER *
HARDCOPY
PLOTTER
CURSOR
ON/OFF
CURSOR
RELATIVE
DISPLAY, CHAN 1 A7 EPROM U31 check sum fail RF ON N/A (reserved)
DISPLAY, CHAN 2 A7 PROGRAM RAM fail REMOTE A2 KEYBOARD INTERFACE fail
AVERAGING
CHANNEL 1
AVERAGING
CHANNEL 2
CPU ASM test running SMOOTHING,
CHAN’S 1 & 2
A6/A7 PERSONALITY fail, or
A7 POWER-DOWN fail
A7 EPROM U32 check sum fail LEVELING
A7 EPROM U30 check sum fail UNLEVELED A7 GPIB Interface fail
A8 LOAD GSP fail CALIBRATION
A8 PIPE INTERFACE fail TRACE HOLD* Self Test finished
LEVELING
INTERNAL
EXTERNAL
UNCAL* *
A7 NON VOLATILE RAM fail
A7 INTERRUPT CONTROLLER fail
A7 TIMESLICE GENERATOR fail
A3 SIGNAL CHANNEL PRESET or
A5 SIGNAL CHANNEL ADC fail
PRINTER LED normally flashes during Self Test; TRACE HOLD LE D f la she s b ri ef ly at en d o f Se lf Test
∗
∗∗ This LED designates one of two failures
54XXA OM A-3
Page 90
ERROR/WARNING MESSAGES APPENDIX
A-3 54XXA ERROR WARNING MESSAGES
The following table lists the warning and error messages that are disp layed on the 54XXA screen whenever
the error conditions described in the table have been detected. (Refer to paragraph 3-6 in Section III — Front
Panel Operation.)
Table A-3.
54XXA Warning/Error Messages (1 of 4)
E R R O R / W A R N I N G M E S S A G E S
Error/warning messages are displayed by the 54XXA for the conditions described below. These messages warn that
some unusual instrument condition exists. In some cases, the user may elect to continue to use the 54XXA without taking
the suggested remedia l actio n inclu ded with the e rror messa ge descrip tion belo w. (This is not possible with Error Warning
Message #14 — s ee be lo w.) Use cautio n wh en in te rpr e ti ng th e m ea su rem en t r e sult s w hen op er a ti ng th e 5 4X XA with an
error warn ing me ssage displa yed. So me (or all) of the data m ay be in er ror.
The error warning message is displayed in a warning message box located in the lower right corner of the screen display.
This message box displays an error/warning number (XXX) along with the error message. If the screen display error
message box als o contai ns a “ 1:” or “2:” before the er ror mes sage, t he erro r mess age rela tes to measu remen t chan nel
1 or 2, respectively. The error/warning number will also be returned as part of the 54XXA response to a Return Status
(RS) GPIB co mmand issued during these c onditi ons.
Hardcopy output from the 54XXA under these conditions will include a warning message box (shown below) that will be
located at the bo ttom ri ght of the pr intout or plo t. Note that this b ox als o shows the e rror/ warnin g number.
Instrument
Warning : XXX
Displayed
Error /
Warning
Number
Type Description
Screen Display
Warning Box
Message
000 O No error or warning
001
002
003
004
005
006
WWCalibration Start Error, Channel 1
WWCalibration Stop Error, Channel 1
WWNot Calibrated, Channel 1
A null value is return ed as part of t he 54XX A response to a ’RS’ GPIB com mand
issued duri ng norm al ope ratio n.
Calibration Start Error, Channel 2
Calibration Stop Error, Channel 2
Problem:
The new frequency range includes frequencies outside the current calibrated
range for the indi cated chan nel. If a start error, the new start frequ ency is be low
the calibration start frequency. If a stop error, the new stop frequency is above
the calibration stop frequency.
Remedy:
Re-calibrat e usin g the new sta rt/stop freque ncy va lues o r adj ust ne w curr ent
frequency ra nge to fall w ithin exis ting cal ibratio n range.
Not Calibrated, Channel 2
Problem:
The 54XXA was calib rated w ith a d ifferent i nput c onnect or se lected f or chan nel.
Remedy:
Re-calibrat e the 54XXA with current se ttings, or proceed wi th caution : measurement results must b e inte rprete d to c ompens ate fo r the p roblem.
(None)
n*: CAL START
XX.XXXX GHz
n*: CAL STOP
XX.XXXX GHz
n*: NOT CAL
CHANNEL
A-4 54XXA OM
Page 91

APPENDIX ERROR/WARNING MESSAGES
Error /
Warning
Table A-3.
Type Description
54XXA Warning/Error Messages (2 of 4)
Screen Display
Number
007 W Invalid Calibration Data INVALID
CAL DATA
Problem:
Subtract Trace Memo ry featur e presen tly sel ected.
Remedy:
Re-calibrate, or de- selec t Subtra ct Trace Memo ry from measur ement se tup.
008
009
010
011
WWTrace Memory Start Error, Channel 1
Trace Memory Start Error, Channel 2
WWTrace Memory Stop Error, Channel 1
Trace Memory Stop Error, Channel 2
n*: MEM START
XX.XXXX GHz
n*: MEM STOP
XX.XXXX GHz
Problem:
The current fre quency ra nge includes frequenc ies outsid e of the range co vered
by the specified Trace Memory.
Remedy:
Adjust current frequency range or cancel use of the specified Trace Memory.
012
013
WWCalibration Power Error, Channel 1
Calibration Power Error, Channel 2
CAL POWER
n*: XX.XX dBm
Problem:
The current outp ut power is di fferent from th e power valu e used duri ng the last
calibratio n.
Remedy:
Re-calibrat e using new pow er level or adjust cur rent power level to cal ibration
value.
Warning Box
Message
014 U Keypad Entry Error ENTRY ERROR
RE-ENTER
Problem:
The last key pad in put is not wi thin c redib le lim its for the c urrent data paramet er.
Remedy:
Re-enter vali d data value via keypad or spinwheel .
NOTE:
This is an
ERROR
condition. Furt her use of the in strumen t is not possi ble until
the condition ca using the err or has bee n correcte d.
015
016
WWNo Calibration Data, Channel 1
No Calibration Data, Channel 2
n*: NO CAL
DATA
Problem:
No calibration data exists for the indi cated channe l.
Remedy:
Perform cal ibrat ion incl uding design ated c hannel or cha nge me asure ment t ype
for the channel.
NOTES:
∗
n = Channel Number
F hardware fault
O OK, information message only (GPIB)
U user error, keyboard input, etc.
W warning only, see expanatory text at top of table.
54XXA OM A-5
Page 92

ERROR/WARNING MESSAGES APPENDIX
Error /
Warning
Number
017
018
Table A-3.
Type Description
WWCalibration Data On ly for Transmissi on, Chan nel 1
Calibration Data On ly for Transmissi on, Chan nel 2
54XXA Warning/Error Messages (3 of 4)
Screen Display
Warning Box
Message
n*: CAL IS
TRANSMSSN
Problem:
Channel set to meas ure Retu rn Loss or SW R, but the cali bration dat a for
channel is for Transmis sion.
Remedy:
Perform cal ibrat ion for curre nt mea surem ent ty pe or chang e channe l
measurement type.
019
020
WWCalibration Data On ly for Retur n Los s or S WR, Ch annel 1
Calibration Data On ly for Retur n Los s or S WR, Ch annel 2
n*: CAL IS
RET LOSS
Problem:
Channel set t o meas ure Transmis sion , but th e cali brati on data for ch annel is for
Return Loss or SWR.
Remedy:
Perform cal ibrat ion for curre nt mea surem ent ty pe or chang e channe l
measurement type.
021 W Curso r Search Fa iled NOT FOUND
Problem:
The last cursor se arch comm and was una ble to find th e requested value(s) on
the current trac e.
Remedy:
Amend sear ch targ ets, s earch t ype, o r curs or mo de. (R eminde r: if Re lative Mode
Cursor is enabl ed, targe t values are in terprete d as relati ve to the valu e at the
current cursor.)
022
023
WWTrace Memory Invalid D isplay Re solution , Channel 1
Trace Memory Invalid D isplay Re solution , Channel 2
TRACE MEM
101 pts
Problem:
The requested trace memory was captured with a resolution inconsistent with
current se ttings .
Remedy:
Recall a different trace memory, change resolution, or disable trace memory
subtraction.
024 W External ALC Uncalibrated EXT ALC
UNCAL
Problem:
External A LC sel ected , but has not yet been r escale d.
Remedy:
Perform External ALC calibration.
025 W N/A (Reserved) N/A (Reserved)
NOTES:
∗
n = Channel Number
F hardware fault
O OK, information message only (GPIB)
U user error, keyboard input, etc.
W warning only, see expanatory text at top of table.
A-6 54XXA OM
Page 93
APPENDIX ERROR/WARNING MESSAGES
Table A-3.
Error /
Warning
Number
026 F Frequency Calibration Fa ult FREQUENCY
027 W Invalid Calibration Mode NOT CAL
Type Description
Problem:
A serious fault condition has been detected during the frequency calibration
process. The error codes (nnn) that are displayed with the Frequency
Calibration F ault war ning m essage are lis ted in Table A-4.
Remedy:
Report the p roblem to you r WILTRON Service C enter (refer to Table 2-1).
Problem:
Attempting to use Frequency Scaling mode with standard calibration data.
Remedy :
Perform a new cali bration , or cancel Frequency S caling mod e.
54XXA Warning/Error Messages (4 of 4)
Screen Display
Warning Box
Message
LOCK nnn
MODE
Table A-4.
The following i s a list of calibr ation err or codes th at are displa yed along wit h the Frequ ency Calibr ation Fau lt
warning message (see Error/Warning Number 26 in Table A-3).
Calibration
Error Code
201 General, no 500 MHz mark ers
202 Start DAC main band, 500 MH z marker (s) mis sing; or, top or bottom freq uency(s ) not corre ctly set
203 Start DAC main band, 1s t MHz marker s (top) wr ong
204 Start DAC main band, 500 MH z marker size error
205 Error DAC, 25 MHz marker spacing wrong
206 Width DAC main band, 500 MHz marker(s) missing
207 Width DA C main band , 1st MHz mark ers (top ) wrong
208 Width DAC main band, 500 MH z marker si ze error
209 Width DAC fm, 25 MHz mark er spacing wr ong
210 HET band, 500 MHz marker missing
Frequency Calibration Fault Warning M essage Error Code s
Error Description
211 HET band, 25 MHz and 500 MHz marker spacing wrong
212 HET band, 25 MHz marker spac ing wrong
54XXA OM A-7
Page 94
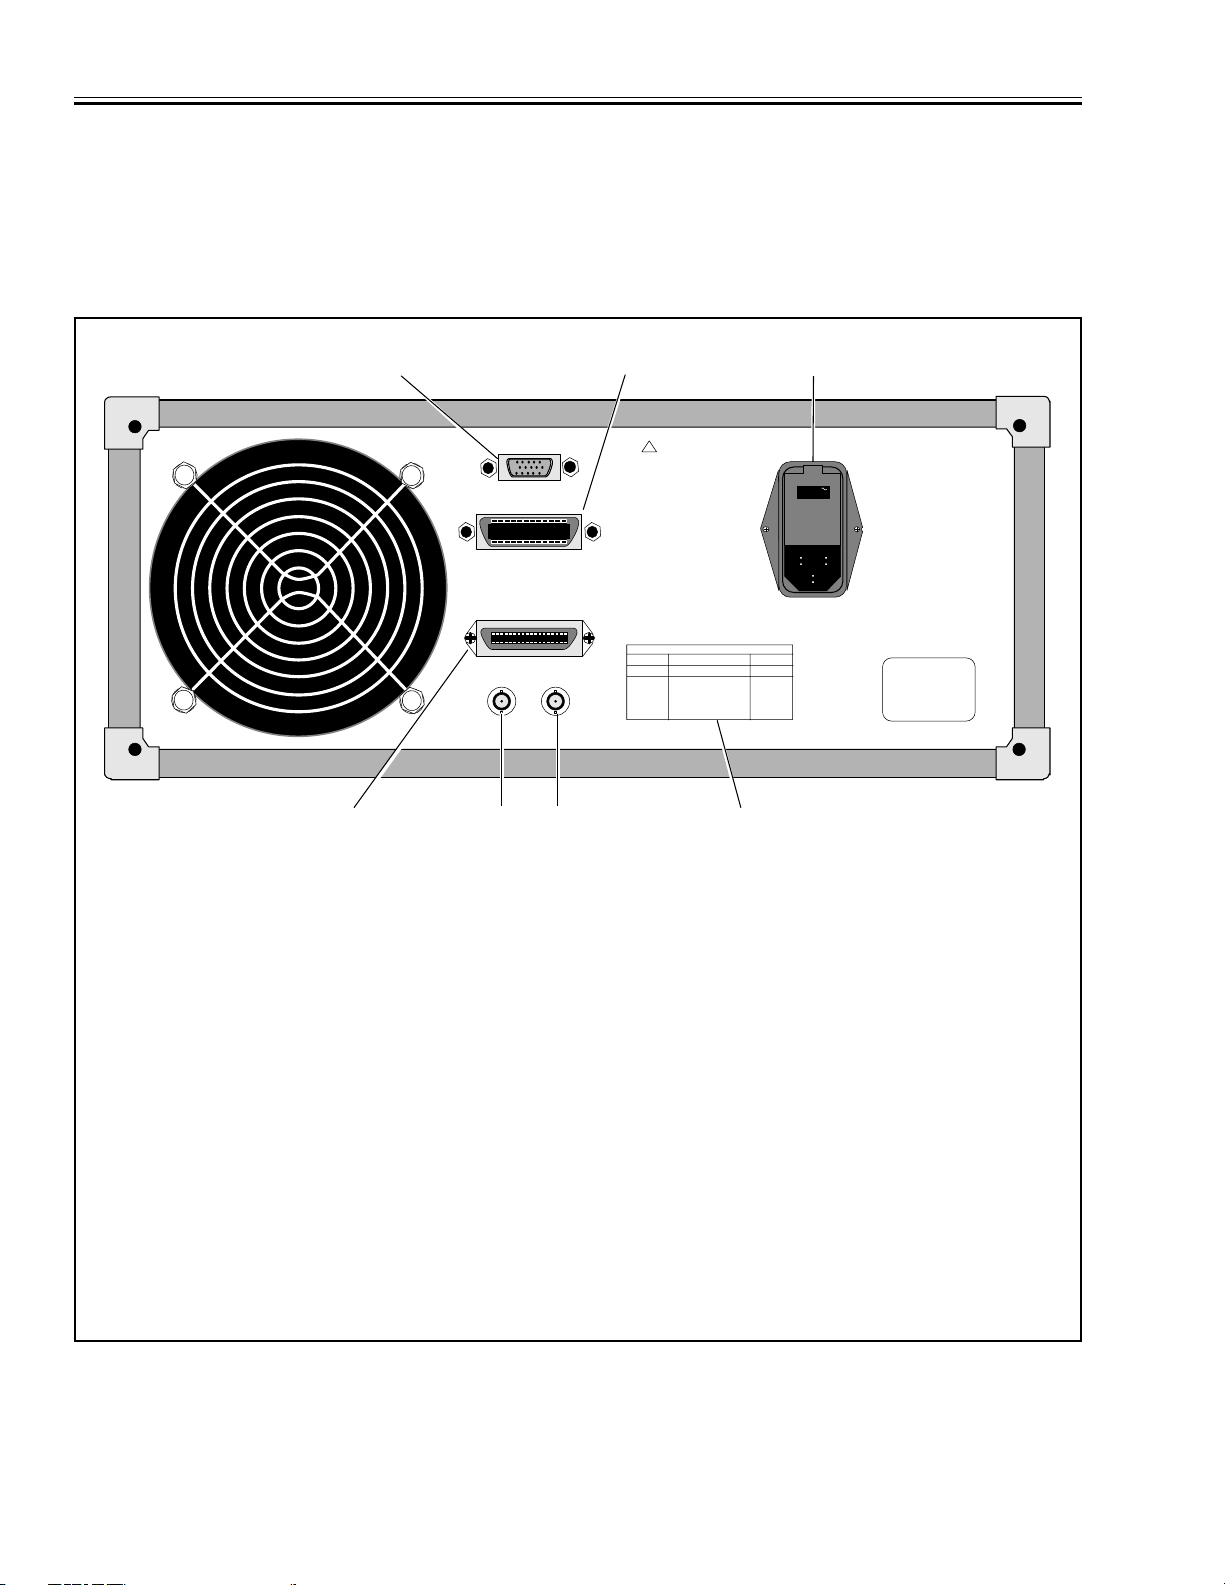
REAR PANEL CONNECTORS APPENDIX
A-4 REAR PANEL CONNECTORS
The layout of the 54XXA rear panel is shown in the figure below. A brief description of the function of each
connector is included. For instructions for setting the Line Voltage Module to the correct line voltage refer to
Figure 2-1 in Section II — Installation. Refer to Figures A-2 and A-3 for pinout information for the EXTERNAL
MONITOR and IEEE-488 GPIB connectors.
321
EXT ERNAL MONIT OR
GPIB/IEEE 488 INSTRUMENT INTERFACE
OR GPIB/IEEE 488 PLOTTER CONTROL
THE FUNCTION OF THIS CONNECTOR IS
SELECTED THROUGH A FRONT PANEL MENU
BY PRESSING THE SYSTEM KEY.
PARALLEL PRINTER INTERFACE
HORIZONTAL
EXTERNAL
ALC INPUT
456
1.
EXTERNAL MONITOR: Connects internal display
information t o ext ern al VGA type monitor via st andard VGA interface ca bl e. T he p in ou t for this co nn ec tor is shown in Figure A-2.
2 GPIB/I EEE-488 INSTRUMENT INTERFACE (Op-
tion 03): General Purpose Interface bus connector.
Connects 54XXA to external system controller or
external GPIB controlled pl otter via stand ard GPIB
interface cabl e. Refer t o Section I I – Instal lation. T he
pinout for this connector is shown in Figure A-3.
3. LINE VOLTAGE MODULE: AC power input and line
voltage select switch. Refer to Section II – Installation,
Figure 2-1.
4. PARALLEL PRINTER INTERFACE: Provides
standard Centronics parallel interface to external
printer.
OUTPUT
!
WARNING:
TO PREVENT ELECTRIC SHOCK
THIS INSTRUMENT MUST BE
EARTH GROUNDED.
DO NOT REMOVE COVERS.
REFER SERVICING
TO QUALIFIED PERSONNEL.
115Vac
FUSE:
220/240V 1.2A AS
110/120V 2.5A AS
48-66Hz 160VA MAX
7
5. EXTERNAL ALC INPUT (Option 06): Connects
external de tector signa l to internal RF output leveling circuits for signal source. Selection of internal or
external ALC detectors is made via the LEVELING
key located in the SOURCE key group. External
level detector signal output requirements: positive
or negative po larity sign al, 5 –200 mV amplitude.
6. HORIZONTAL OUTPUT: Sweep Ramp output
signal, 0 to +10 V (nominal). Inst antaneous voltage
proportional to present position of sweep within
sweep range.
7. PRINTER SWITCH SETTINGS CHART: This chart
shows the correct switch settings for common printers using Centronics parallel inter face. A copy of
this chart is co ntained in Table A-5.
Registered trademark
Figure A-1. 54XXA Rear Panel Layout Showing Connector Locations
A-8 54XXAOM
Page 95
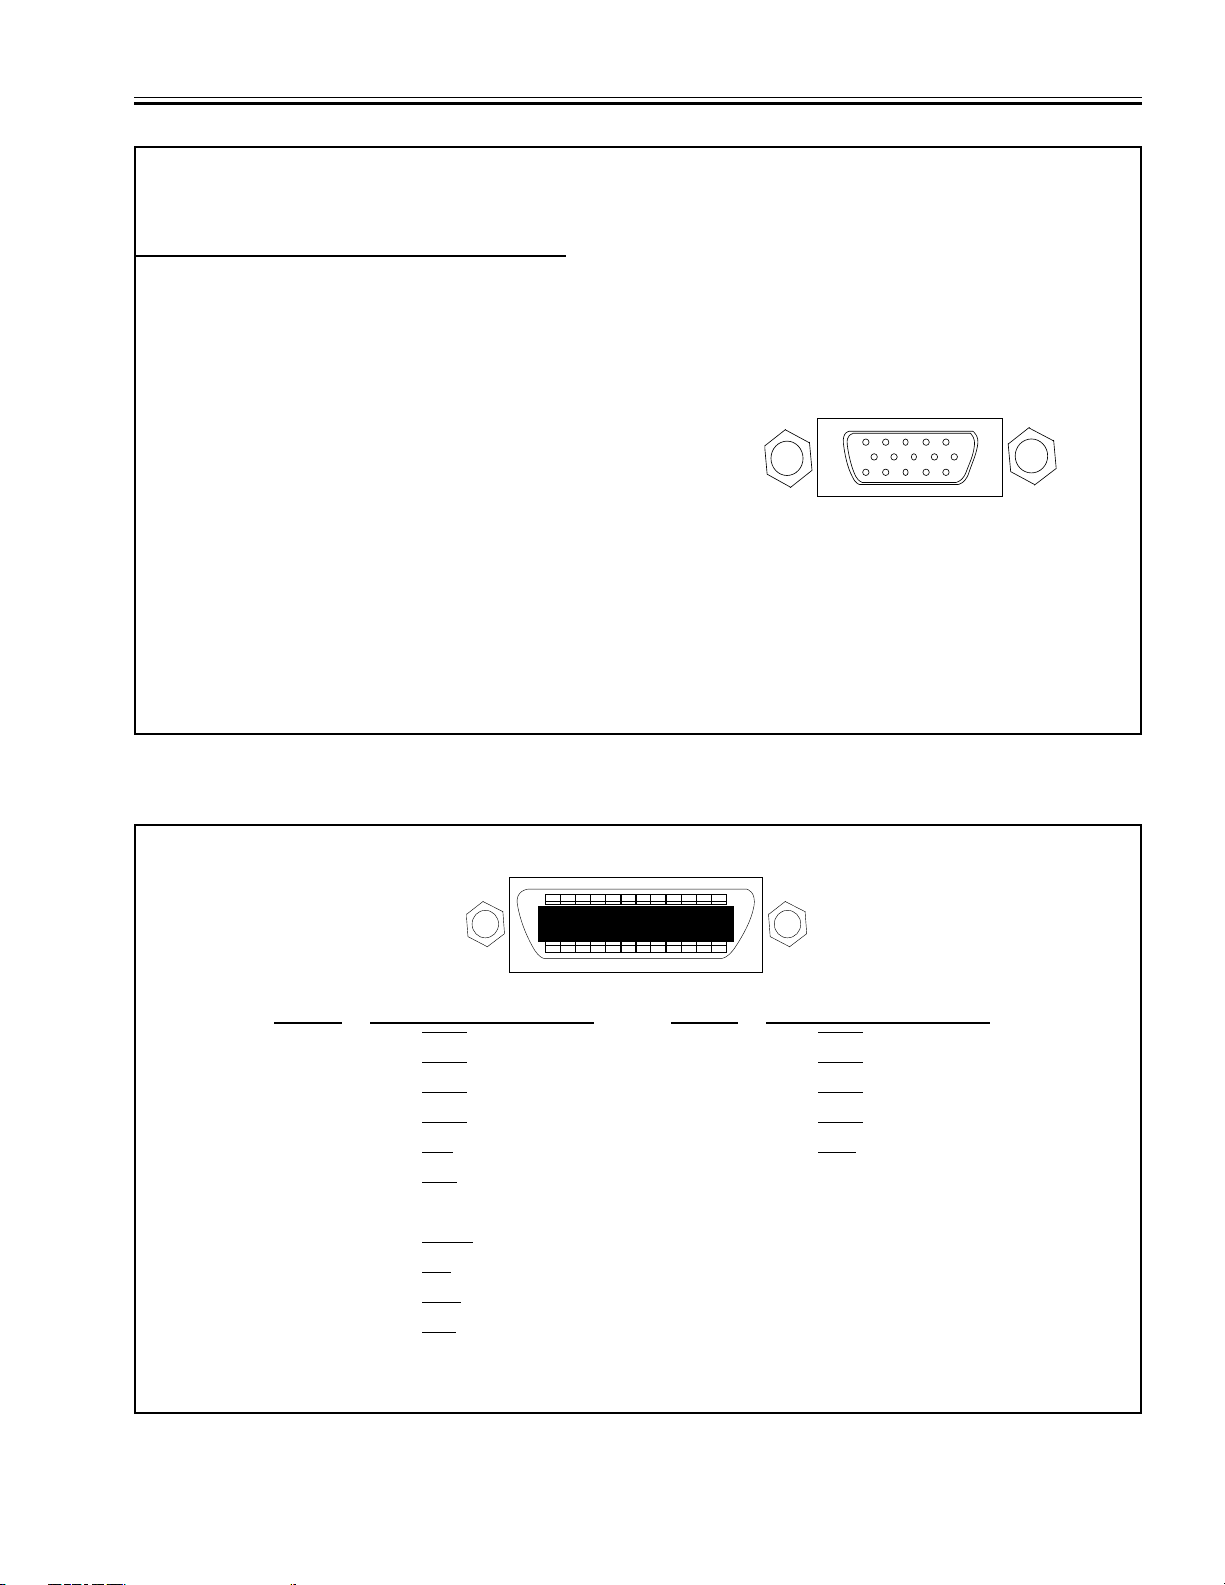
EXTERNAL MONITOR
1
6
1115
5
10
112
1324
GPIB IEEE - 488
APPENDIX REAR PANEL CONNECTORS
PIN
NO.
PIN NAME /FUNCTION
Monochrome Color
1 not used Red Signal
2 Mono Dots Green Signal
3 not used Blue Signal
4 not used not used
5 not used not used
6 Key Pin Red Retu rn
7 Mono Return Green Return
8 not used Blue Return
9 no pin no pin
10 Digital Ground Digital Ground
11 not used Digital Ground
12 not used not used
13 H Sync H Sync
14 V Sync V Sync
15 not used not used
Figure A-2. Pinout of EXTERNAL MONITOR Rear Panel Connector
54XXAOM A-9
PIN NO. FUNCTION/ DESCRIPTION PIN NO. FUNCTION / DESCRIPTION
1
2
3
4
5
6
DIO1 13 DIO5
DIO2 14 DIO6
DIO3 15 DIO7
DIO4 16 DIO8
EOI 17 REN
DAV 18 Logic Ground
7 NRFD 19 Logic Ground
8
9
10
11
12 Chassis Ground 24 Logic Ground
NDAC 20 Logi c Ground
IFC 21 Logic Ground
SRQ 22 Logic Ground
ATN 23 Logic Ground
Figure A-3. Pinout for Rear Panel GPIB Connector
Page 96
REAR PANEL CONNECTORS APPENDIX
A-5 PRINTER S WITCH SETTINGS
The following table lists the correct switch settings for common printers used with the 54XXA. (Refer to
paragraph 3-14 in Section III — Front Panel Operation.)
Table A-5. 54XXA Printer Switch Settings
PRINTER SWITCH SETTINGS
(OFF=0, ON=1) SW1 SW2
PRINTER 12345678 1234
EPSON FX100 0 1 1 1 0 1 1 1 1 1 0 0
EPSON RX80 0 0 0 0 0 1 1 1 1 1 0 0
EPSON LX80 0 0 0 0 0 1 1 1 1 1 0 0
HP THINK JET 01001100 –– ––
EPSON LQ850 1 0 0 0 0 0 0 0 0 0 0 0
EPSON LQ550 1 0 0 0 0 0 0 0 0 0 0 0
A-10 54XXAOM
Page 97
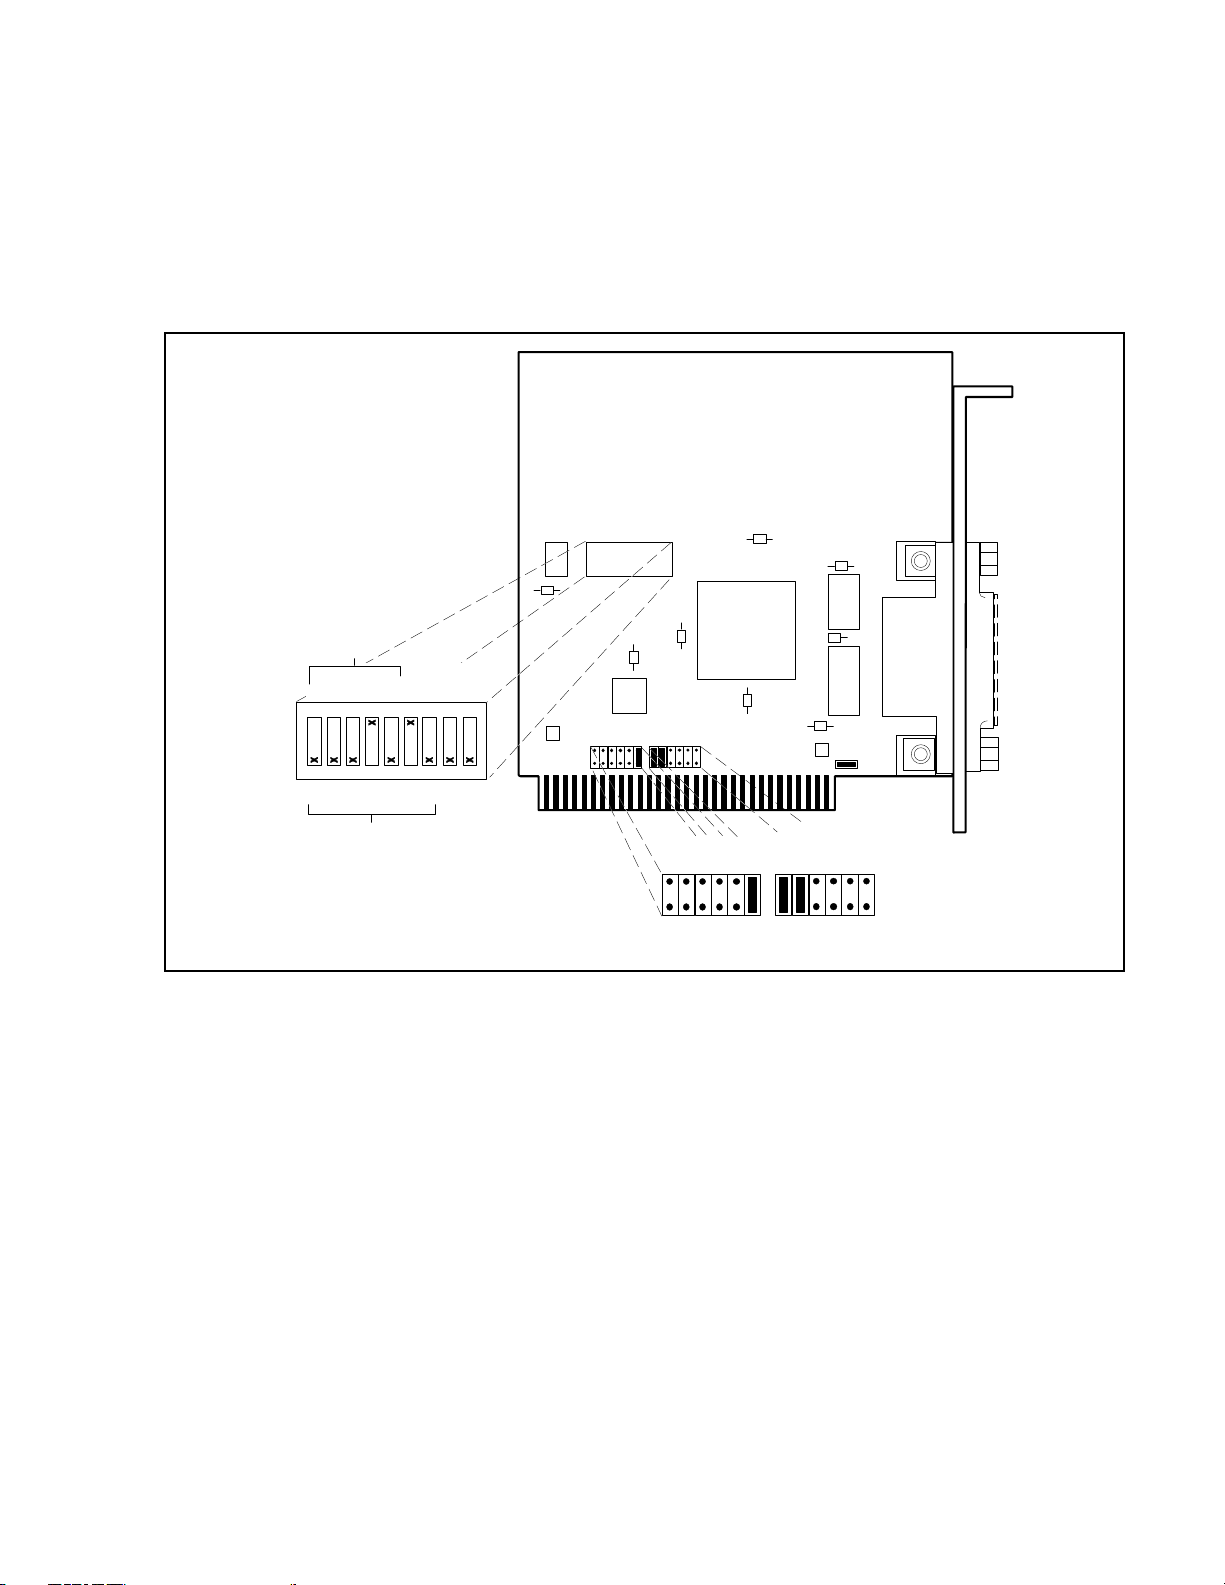
Installation and Configuration Instructions
for the National Instruments GPIB-PCII/IIA Card
PCIIA
I0I1I2
A14
123456789
0
U2
OFF
1
A3A4A5A6A7A8A9
A13
APPENDIX B
and NI-488 MS-DOS Handler Software
9914
PCIIA
W1
PCII
7210
PCII
I/O ADDRESS
SELECTION
IRQ2
IRQ3
IRQ4
IRQ5
INTERRUPT
SELECTION
IRQ6
IRQ7
DRQ1
A
B
DMA CHANNEL
SELECTION
DACK1
DRQ2
DACK2
DRQ3
DACK3
Figure B-1. GPIB-PCII/IIA Hardware Configuration
B1 INSTALLING THE GPIB-PCII/IIA CARD
The following steps provide detailed instructions for installing the National Instruments GPIB-PCII/IIA
Interface Card (P/N 181065-02) into a personal computer.
1. Before installation, set the switches and jumpers on the GPIB-PCII/IIA card as shown in Figure B-1.
2. Turn off the com puter a nd unplu g the power co rd from the p ower s ource.
3. Remove the top cover from the computer and install the GPIB-PCII/IIA card into any unused slot.
Install the card with the IEEE-488 connector protruding out of the back panel.
4. Secure the card by fastening the GPIB-PCII/IIA mounting bracket to the back panel rail with a screw,
then replace t he compute r cover.
5. Plug the power cord into the power source and power up (boot) the computer.
54XXA OM B-1
Page 98

INSTALLING NI-488
MS-DOS HANDLER SOFTWARE APPENDIX B
B2 INSTALLING AND CONFIGURING THE NI-488 MS-DOS HANDLER SOFTWARE
The following steps provide detaile d instructions f or installing the N I-488 MS-DOS Handler soft ware in
support of the GPIB-PCII/IIA card and for changing the default software configuration options of the
handler.
NOTE
When installing the MS-DOS Handler software, use only the National Instruments
NI-488 Distribution Disk for GPIB-PCII/PCIIA MS-DOS Handler, P/N 420039-09, Revision C.11. Use of any other versions of the GPIB handler software can cause interfacing
problems between the handler and the d evices on the bus.
1. Insert the NI-488 Distribution Disk fo r the GPIB-PCII/IIA MS-DOS Handler into the disk drive. At
the DOS prompt:
Type: !
Press: <ENTER> (The A:\DOS prompt will appear.)
2. Run the installation program IBSTART and specify the start up (boot) drive. For example, if C: is the
boot drive, at the DOS prompt:
Type : )"34!24 #
Press: < ENTER>
3. Follow the instructions on the display. The installation program first copies the files, GPIB.COM and
IBCONF.EXE, from the distribution disk to the root directory of the boot drive, then creates the
directory GPIB-PC on the boot drive and copies all the files on the distribution disk into this directory .
Next the program adds the line, DEVICE = GPIB.COM, to the computer’s CONFIG.SYS file so that
DOS will load the handler whenever the computer is booted. The program then prompts you to run
the hardware diagnostic program (IBDIAG) to insure the GPIB-PCII/IIA card is installed and working
properly.
4. Run the software program (IBCONF) to change the default software configuration options of the GPIB
handler. At the DOS prompt:
Typ e : )"#/.&
Press: <ENTER>
5. Follow the instructions on the display. The program firsts displays a device map for the GPIB card
(Figure B-2). Select the GPIB-PCII/IIA Card or device whose parameters you wish to display, then
press the function key, F8 . Change the configuration of the GPIB-PC-II/IIA card to that shown in
Figure B-3 and verify the configuration of the device DEV6 matches Figure B-4.
6. Reboot your computer to install the GPIB handler software and the software configuration changes.
7. Run the software diagnostic prog ram (IBTEST) to verify that the GP IB handler software is installed
correctly. To do this, at the DOS prompt:
Typ e : #$<'0)"0#
Press: <ENTER>
Type: )"4%34
Press: <ENTER>
If errors are encountered, refer to Appendix B of the GPIB-PC Users Manual, that accompanied your
GPIB board, for an explanation of the errors and their solutions.
B-2 54XXA OM
Page 99
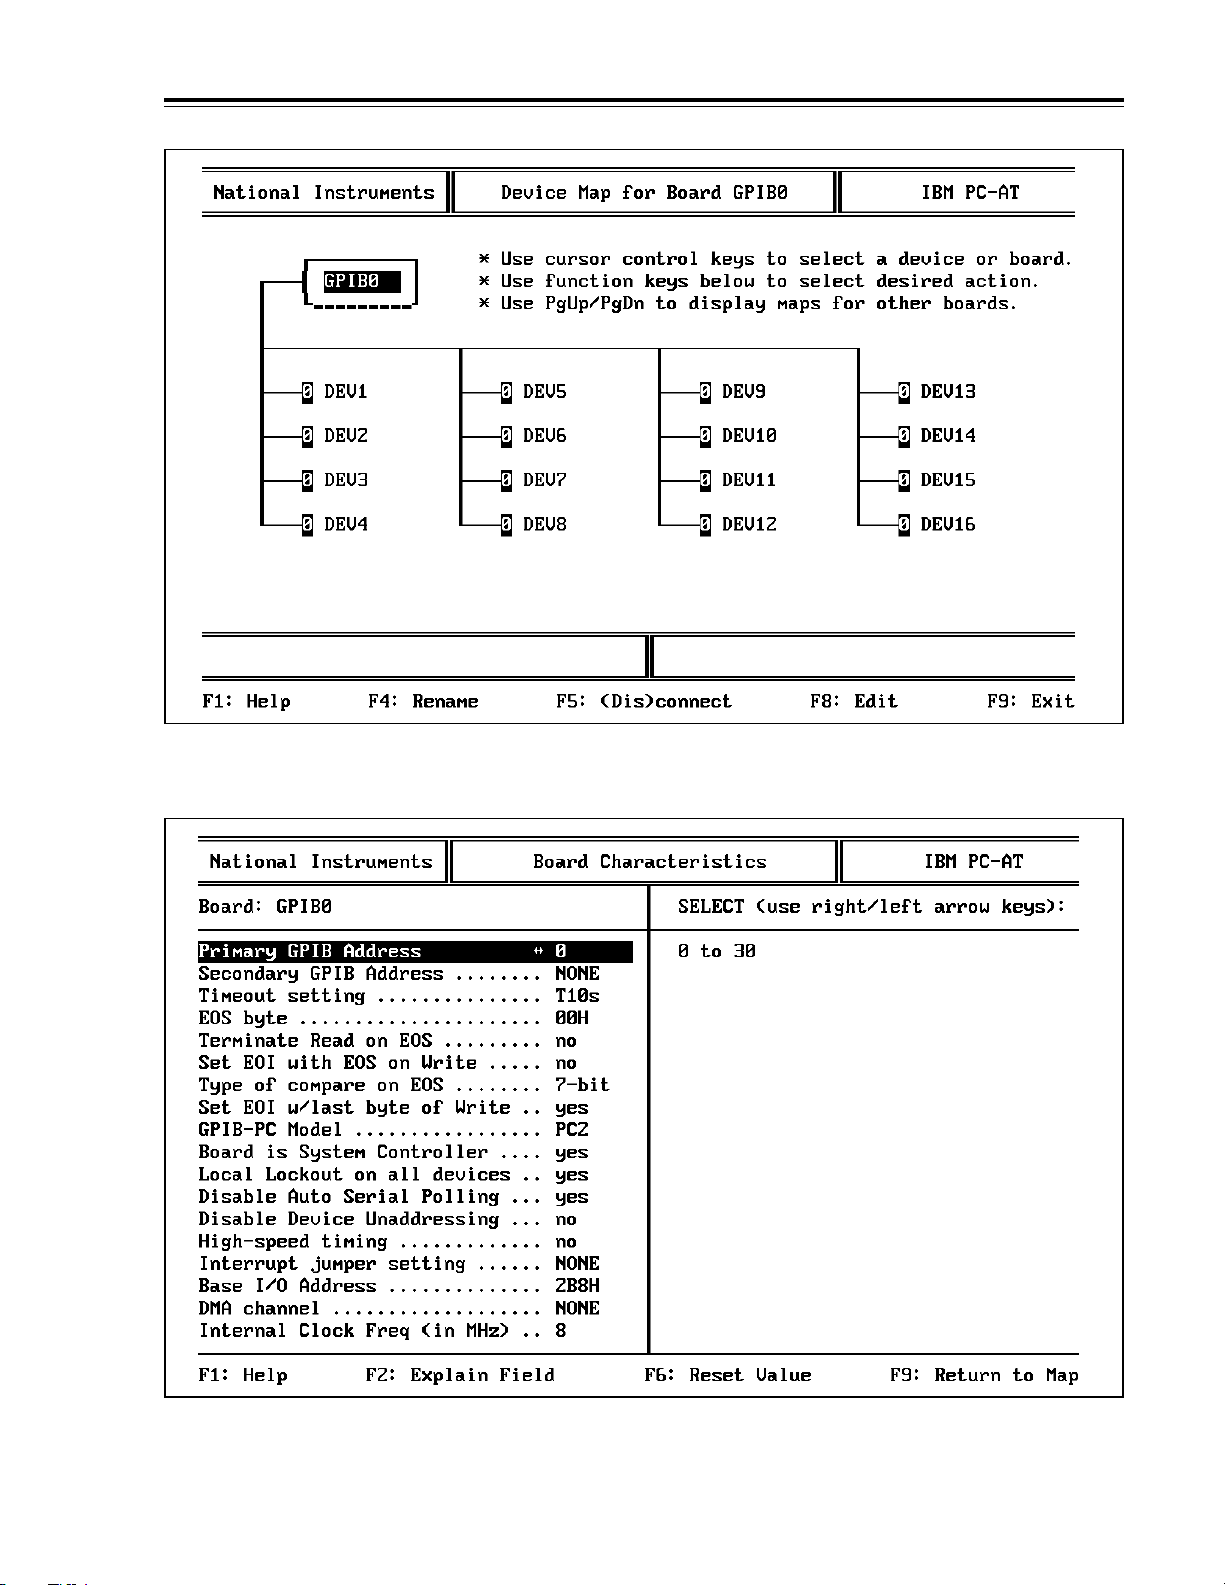
INSTALLING NI-488
APPENDIX B MS-DOS HANDLER SOFTWARE
Figure B-2. Device Map for the GPIB-PCII/IIA Card
Figure B-3. GPIB-PCII/IIA Card Conf igura tion P arame ters
54XXA OM B-3
Page 100
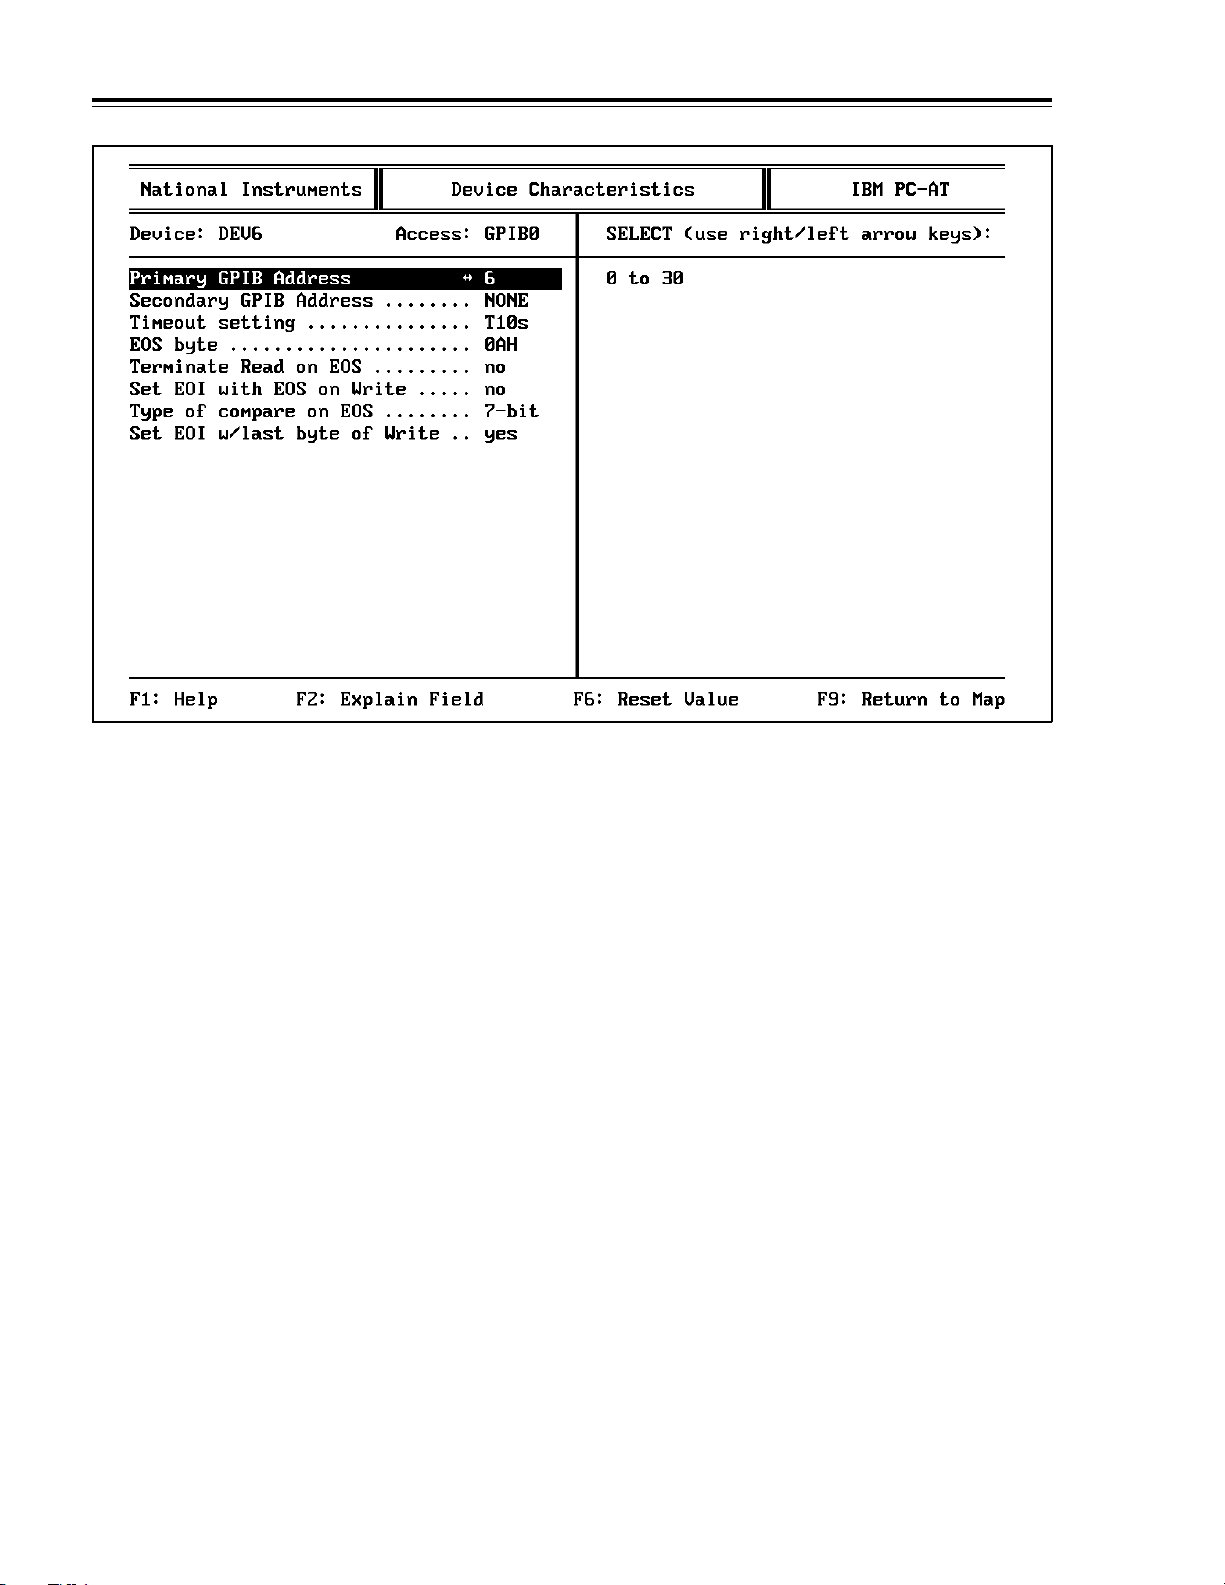
INSTALLING NI-488
MS-DOS HANDLER SOFTWARE APPENDIX B
Figure B-4. GPIB Device 6 (360 VNA) Configuration Parameters
B-4 54XXA OM
 Loading...