

Wilden PX1500 Engineering, Operation & Maintenance
EOM
Engineering
Operation &
Maintenance
PX1500
Advanced™ Series
Metal Pump
Where Innovation Flows
www.wildenpump.com
WI L- 112 30 - E -11
Replaces WIL-11230-E-10

TABLE OF CONTENTS
SECTION 1 CAUTIONS—READ FIRST! . . . . . . . . . . . . . . . . . . . . . . . . . . . . . . . . . . . . . . . . . . . . . .1
SECTION 2 WILDEN PUMP DESIGNATION SYSTEM . . . . . . . . . . . . . . . . . . . . . . . . . . . . . . . . .2
SECTION 3 HOW IT WORKS—PUMP & AIR DISTRIBUTION SYSTEM . . . . . . . . . . . . . . . . 3
SECTION 4 DIMENSIONAL DRAWINGS . . . . . . . . . . . . . . . . . . . . . . . . . . . . . . . . . . . . . . . . . . . . .4
SECTION 5 PERFORMANCE
PX1500 Performance
Operating Principle . . . . . . . . . . . . . . . . . . . . . . . . . . . . . . . . . . . . . . . . . . . . . . . . . . . . .8
How to Use this EMS Curve . . . . . . . . . . . . . . . . . . . . . . . . . . . . . . . . . . . . . . . . . . . . . .9
PX1500 Aluminum Performance Curves
Rubber-Fitted . . . . . . . . . . . . . . . . . . . . . . . . . . . . . . . . . . . . . . . . . . . . . . . . . . . . . . .12
TPE-Fitted . . . . . . . . . . . . . . . . . . . . . . . . . . . . . . . . . . . . . . . . . . . . . . . . . . . . . . . . . .13
PTFE-Fitted . . . . . . . . . . . . . . . . . . . . . . . . . . . . . . . . . . . . . . . . . . . . . . . . . . . . . . . . .14
Full Stroke PTFE-Fitted . . . . . . . . . . . . . . . . . . . . . . . . . . . . . . . . . . . . . . . . . . . . . . .15
Ultra-Flex™-Fitted . . . . . . . . . . . . . . . . . . . . . . . . . . . . . . . . . . . . . . . . . . . . . . . . . . .16
PX1500 Stainless Steel Performance Curves
Rubber-Fitted . . . . . . . . . . . . . . . . . . . . . . . . . . . . . . . . . . . . . . . . . . . . . . . . . . . . . . .17
TPE-Fitted . . . . . . . . . . . . . . . . . . . . . . . . . . . . . . . . . . . . . . . . . . . . . . . . . . . . . . . . . .18
PTFE-Fitted . . . . . . . . . . . . . . . . . . . . . . . . . . . . . . . . . . . . . . . . . . . . . . . . . . . . . . . . . 19
Full Stroke PTFE-Fitted . . . . . . . . . . . . . . . . . . . . . . . . . . . . . . . . . . . . . . . . . . . . . . .20
Ultra-Flex™-Fitted . . . . . . . . . . . . . . . . . . . . . . . . . . . . . . . . . . . . . . . . . . . . . . . . . . .21
PX1500 Stainless Steel Drop-In Performance Curves
Rubber-Fitted . . . . . . . . . . . . . . . . . . . . . . . . . . . . . . . . . . . . . . . . . . . . . . . . . . . . . . .22
TPE-Fitted . . . . . . . . . . . . . . . . . . . . . . . . . . . . . . . . . . . . . . . . . . . . . . . . . . . . . . . . . .23
PTFE-Fitted . . . . . . . . . . . . . . . . . . . . . . . . . . . . . . . . . . . . . . . . . . . . . . . . . . . . . . . . .24
Full Stroke PTFE-Fitted . . . . . . . . . . . . . . . . . . . . . . . . . . . . . . . . . . . . . . . . . . . . . . .25
Ultra-Flex™-Fitted . . . . . . . . . . . . . . . . . . . . . . . . . . . . . . . . . . . . . . . . . . . . . . . . . . .26
Suction Lift Curves
PX1500 Aluminum . . . . . . . . . . . . . . . . . . . . . . . . . . . . . . . . . . . . . . . . . . . . . . . . . .27
PX1500 Stainless Steel & Alloy C . . . . . . . . . . . . . . . . . . . . . . . . . . . . . . . . . . . . . .27
PX1500 Stainless Steel Drop-In . . . . . . . . . . . . . . . . . . . . . . . . . . . . . . . . . . . . . . . .28
SECTION 6 SUGGESTED INSTALLATION, OPERATION & TROUBLESHOOTING . . . . . . .30
SECTION 7 ASSEMBLY / DISASSEMBLY . . . . . . . . . . . . . . . . . . . . . . . . . . . . . . . . . . . . . . . . . . .33
SECTION 8 EXPLODED VIEW & PARTS LISTING
PX1500 Aluminum . . . . . . . . . . . . . . . . . . . . . . . . . . . . . . . . . . . . . . . . . . . . . . . . . . . . . . .40
PX1500 Stainless Steel . . . . . . . . . . . . . . . . . . . . . . . . . . . . . . . . . . . . . . . . . . . . . . . . . . . .44
PX1500 Stainless Steel Drop-In . . . . . . . . . . . . . . . . . . . . . . . . . . . . . . . . . . . . . . . . . . . . .48
SECTION 9 ELASTOMER OPTIONS . . . . . . . . . . . . . . . . . . . . . . . . . . . . . . . . . . . . . . . . . . . . . . . . .51
Section 1
CAUTIONS—READ FIRST!
CAUTION: Do not apply compressed air to the
exhaust port — pump will not function.
CAUTION: Do not over-lubricate air supply —
excess lubrication will reduce pump performance.
Pump is pre-lubed.
TEMPERATURE LIMITS:
Neoprene –17.7°C to 93.3°C 0°F to 200°F
Buna-N –12.2°C to 82.2°C 10°F to 180°F
EPDM –51.1°C to 137.8°C –60°F to 280°F
Viton
Wil-Flex™ –40°C to 107.2°C –40°F to 225°F
Sanifl ex™ –28.9°C to 104.4°C –20°F to 220°F
Polyurethane –12.2°C to 65.6°C 10°F to 150°F
Tetra-Flex™ PTFE w/Neoprene Backed
4.4°C to 107.2°C 40°F to 225°F
Tetra-Flex™ PTFE w/EPDM Backed
-10°C to 137°C 14°F to 280°F
PTFE 4.4°C to 104.4°C 40°F to 220°F
®
–40°C to 176.7°C –40°F to 350°F
CAUTION: When choosing pump materials, be
sure to check the temperature limits for all wetted
components. Example: Viton® has a maximum
limit of 176.7°C (350°F) but polypropylene has a
maximum limit of only 79°C (175°F).
CAUTION: Pumps should be thoroughly fl ushed
before installing into process lines. FDA and
USDA approved pumps should be cleaned and/
or sanitized before being used.
CAUTION: Always wear safety glasses when
operating pump. If diaphragm rupture occurs,
material being pumped may be forced out air
exhaust.
CAUTION: Before any maintenance or repair is
attempted, the compressed air line to the pump
should be disconnected and all air pressure
allowed to bleed from pump. Disconnect all
intake, discharge and air lines. Drain the pump
by turning it upside down and allowing any fl uid
to fl ow into a suitable container.
CAUTION: Blow out air line for 10 to 20 seconds
before attaching to pump to make sure all pipeline
debris is clear. Use an in-line air fi lter. A 5µ (micron)
air fi lter is recommended.
NOTE: When installing PTFE diaphragms, it is
important to tighten outer pistons simultaneously
(t urning in opp osite direc tions) to en sure tight fi t.
(See torque specifi cations in Section 7.)
CAUTION: Maximum temperature limits are
based upon mechanical stress only. Certain
chemicals will signifi cantly reduce maximum
safe operating temperatures. Consult Chemical
Resistance Guide (E4) for chemical compatibility
and temperature limits.
WARNING: Prevention of static sparking — If
static sparking occurs, fi re or explosion could
result. Pump, valves, and containers must be
grounded to a proper grounding point when
handling fl ammable fl uids and whenever
discharge of static electricity is a hazard.
CAUTION: Do not exceed 8.6 bar (125 psig) air
supply pressure.
CAUTION: The process fl uid and cleaning fl uids
must be chemically compatible with all wetted
pump components (see E4).
CAUTION: Do not exceed 82°C (180°F) air inlet
temperature for Pro-Flo X™ models.
NOTE: Cast Iron PTFE-fi tted pumps come
standard from the factory with expanded PTFE
gaskets installed in the diaphragm bead of the
liquid chamber. PTFE gaskets cannot be re-used.
Consult PS-TG for installation instructions during
reassembly.
NOTE: Before starting disassembly, mark a line
from each liquid chamber to its corresponding air
chamber. This line will assist in proper alignment
during reassembly.
CAUTION: Pro-Flo® pumps cannot be used in
submersible applications. Pro-Flo X™ is available
in both submersible and non-submersible
options. Do not use non-submersible Pro-Flo X™
models in submersible applications. Turbo-Flo®
pumps can be used in submersible applications.
CAUTION: Tighten all hardware prior to installation.
WI L-11230-E-11 1 WILDEN PUMP & ENGINEERING, LLC
Section 2
WILDEN PUMP DESIGNATION SYSTEM
PX1500 METAL
76 mm (3") Pump
Maximum Flow Rate:
1030 lpm (272 gpm)
LEGEND
PX1500/XXXXX/XXX/XX/XXX/ XXXX
MODEL
AIR CHAMBERS
WETTED PAR TS & OUTER PISTON
MATERIAL CODES
MODEL
PX1500 = 76 mm (3")
XPX150 0 = 76 mm (3 " ) ATEX
WETTED PARTS/OUTER PISTON
AA = ALUMINUM / ALUMINUM
HH = ALL OY C / ALL OY C
SS = STAINLESS STEEL /
STAINLESS STEEL
AIR CHAMBERS
A = ALUMINUM
S = STAINLESS STEEL
C = PFA COATED
CENTER BLOCK
A = ALUMINUM
S = STAINLESS STEEL
P = POLYPROPYLENE
AIR VALVE
A = ALUMINUM
S = STAINLESS STEEL
P = POLYPROPYLENE
NOTE:
1
Reduced stroke PTFE-fitted pumps require stainless outer pistons.
Full Stroke PTFE-fitted pumps can have either stainless or aluminum outer pistons.
2
Meets the requirements of ATEX.
DIAPHRAGMS
BNS = BUNA-N (Red Dot)
XBS = CONDUCTIVE BUNA-N
(Two Red Dots)
1
EPS = EPDM (Blue Dot)
PUS = POLYURETHANE (Clear)
NES = NEOPRENE (Green Dot)
TEU = PTFE w/EPDM
BACK-UP (White)
TNU = PTFE w/NEOPRENE
BACK-UP (White)
FSS = SANIFLEX™ [Hytrel®
(Cream)]
FWS = SANITARY WIL-FLEXTM
VTS = VITON® (White Dot)
WFS = WIL-FLEX™ [Santoprene
(Orange Dot)]
TSU = PTFE W/SANIFLEX™
BACK-UP (White)
BNU = BUNA-N, ULTRA-FLEX™
EPU = EPDM, ULTRA-FLEX™
NEU = NEOPRENE,ULTRA-FLEX™
VTU = VITON®, ULTRA-FLEX™
TSS = FULL STROKE PTFE
W/SANIFLEX™ BACK-UP
TWS = FULL STROKE PTFE
W/WIL-FLEX™ BACK-UP
DIAPHRAGMS
AIR VALVE
CENTER BLOCK
2
2
2
2
O-RINGS
VALVE SEAT
VALVE BALL S
BALL VALVES
BN = BUNA-N (Red Dot)
FS = SANIFLEX™
[Hytrel® (Cream)]
EP = EPDM (Blue Dot)
NE = NEOPRENE (Green Dot)
PU = POLYURETHANE (Brown)
TF = PTFE (White)
VT = VITON® (Silver or White Dot)
WF = WIL-FLEX™ [Santoprene
(Orange Dot)]
VALVE SEAT
BN = BUNA-N (Red Dot)
EP = EPDM (Blue Dot)
®
FS = SANIFLEX™ [Hytrel®
(Cream)]
NE = NEOPRENE (Green Dot)
PU = POLYURETHANE (Brown)
VT = VITON® (Silver or
White Dot)
WF = WIL-FLEX™ [Santoprene®
(Orange Dot)]
M = MILD STEEL
S = STAINLESS STEEL
H = ALLOY C
VALVE SEAT O-RING
TF = PTFE (White)
SPECIALTY
CODE
(if applicable)
2
2
®
2
2
SPECIALTY CODES
Drop-In:
0044 Stallion balls & seats ONLY
0100 Wil-Gard II™ 110V
0102 Wil-Gard II™ sensor wires ONLY
0103 Wil-Gard II™ 220V
0320 Submersible center block
0323 Submersible center block, DIN flange
0540 ANSI flange
0544 DIN flange
NOTE: MOST EL AS TOMERIC MATERIALS USE COLORED DO TS FOR IDENT IFICATION.
NOTE: Not all models are available with all material options.
®
Viton
is a registered trademark of DuPont Dow Elastomers.
WILDEN PUMP & ENGINEERING, LLC 2 WI L-11230-E-11
0677 Center Ported, NPT Inlet & Discharge
0678 Center Ported, BSPT Inlet & Discharge
0685 Center Ported, NPT Inlet & Discharge, PCM Sensor & Wires
0687 Center Ported, NPT Inlet & Discharge, Single-point Exhaust
0688 Center Ported, BSPT Inlet and Discharge manifolds, Single-point Exhaust
0689 Center Ported, NPT inlet and discharge with external SS fasteners
0693 Center Ported, NPT, PFA Coated
Section 3
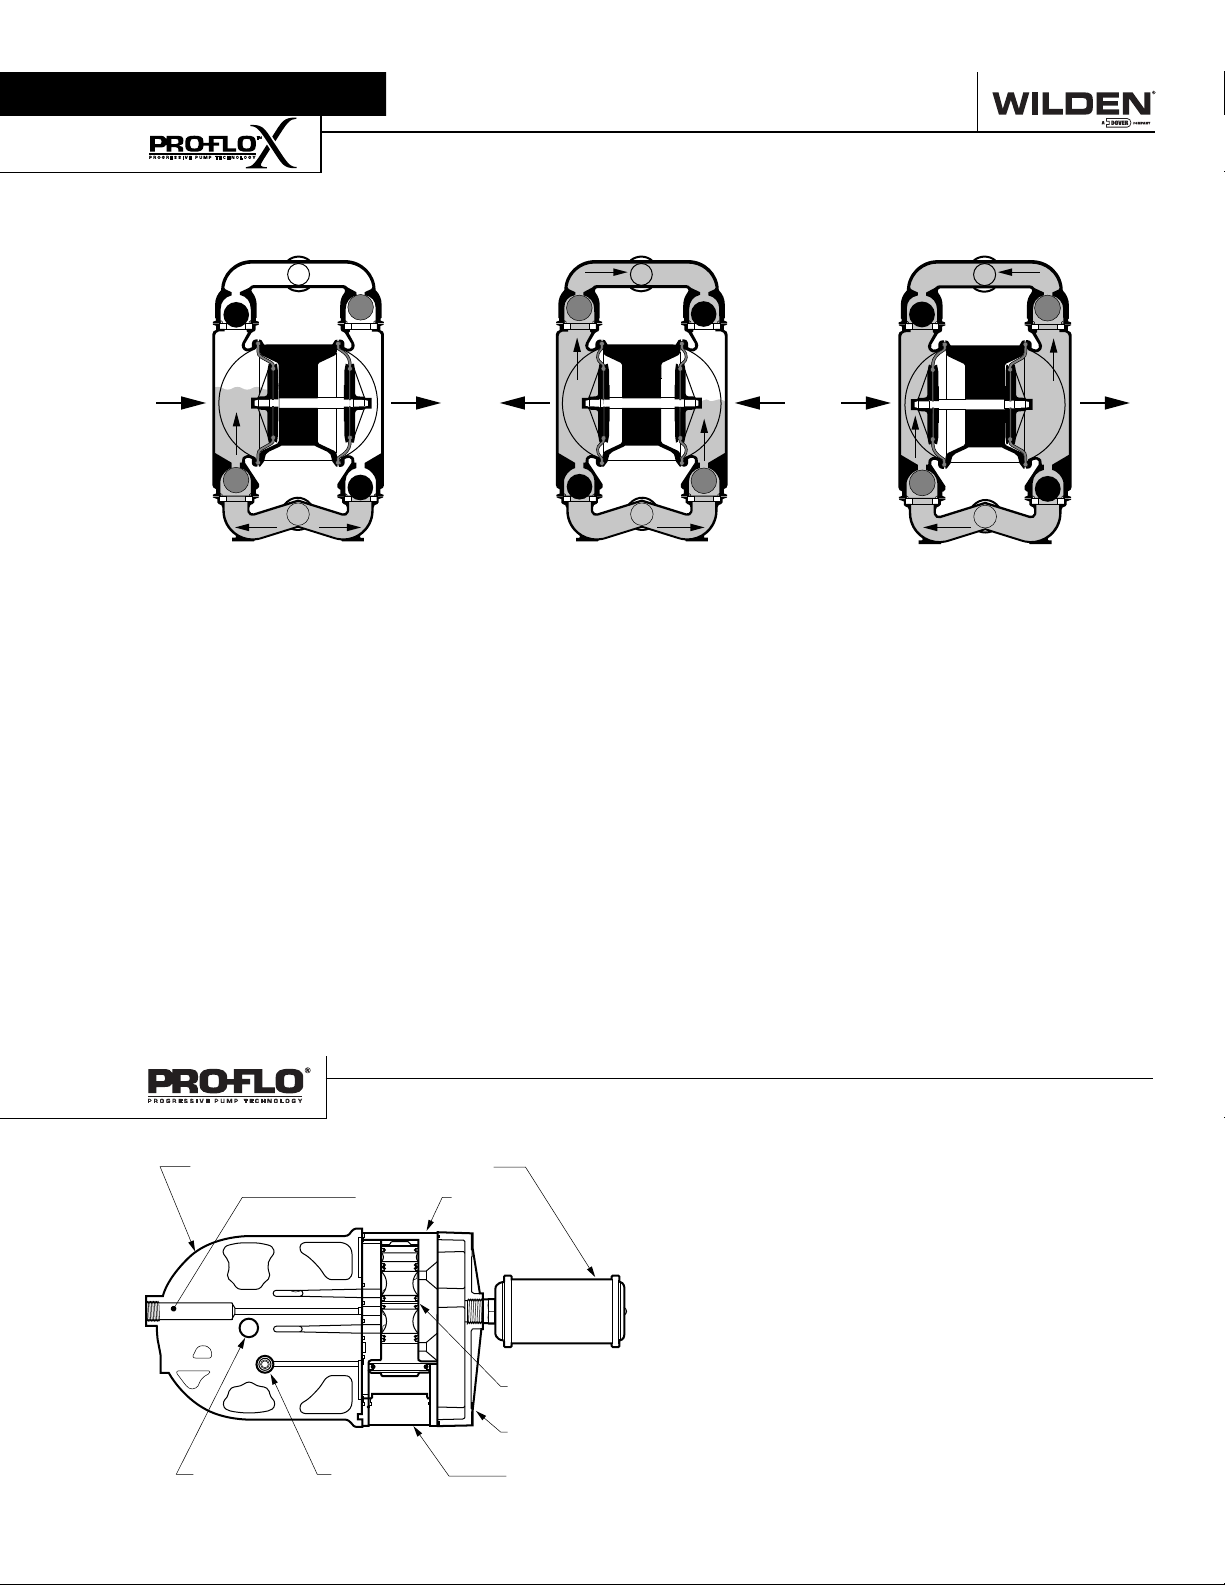
HOW IT WORKS—PUMP
The Wilden diaphragm pump is an air-operated, positive displacement, self-priming pump. These drawings show fl ow pattern
through the pump upon its initial stroke. It is assumed the pump has no fl uid in it prior to its initial stroke.
#,/3%$
/54,%4
/0%.
"!
).,%4
FIGURE 1 The air valve dir ects pre ssurized
air to the back side of diaphragm A. The
compressed air is applied directly to the
liquid column separated by elastomeric
diaphragms. The diaphragm acts as
a separation membrane between the
compressed air and liquid, balancing the
load and removing mechanical stress
from the diaphragm. The compressed
air moves the diaphragm away from
the center of the pump. The opposite
diaphragm is pulled in by the shaft
connected to the pressurized diaphragm.
Diaphragm B is on its suction stroke; air
behind the diaphragm has been forced
out to atmosphere through the exhaust
port of the pump. The movement of
diaphragm B toward the center of the
pump creates a vacuum within chamber B.
Atmospheric pressure forces fl uid into
the inlet manifold forcing the inlet valve
ball off its seat. Liquid is free to move
past the inlet valve ball and fi ll the liquid
chamber (see shaded area).
#,/3%$/0%.
#,/3%$ /0%.
FIGURE 2
phragm
of its discharge stroke, the air valve
redirects pressurized air to the back side of
diaphragm B. The pressurized air forces
diaphragm B away from the center
while pulling diaphragm A to the center.
Diaphragm B is now on its discharge
stroke. Diaphragm B forces the inlet valve
ball onto its seat due to the hydraulic
forces developed in the liquid chamber
and manifold of the pump. These same
hydraulic forces lift the discharge valve
ball off its seat, while the opposite
discharge valve ball is forced onto its seat,
forcing fl uid to fl ow through the pump
discharge. The movement of diaphragm A
toward the center of the pump creates a
vacuum within liquid chamber A. Atmospheric pressure forces fl uid into the inlet
manifold of the pump. The inlet valve ball
is forced off its seat allowing the fl uid
being pumped to fi ll the liquid chamber.
/0%.
/54,%4
#,/3%$
"!
).,%4
When the pressurized dia-
, diaphragm A, reaches the limit
#,/3%$ /0%.
"!
/0%.
FIGURE 3 At completion of the stroke,
the air valve again redirects air to the
back side of diaphragm A, which starts
diaphragm B on its exhaust stroke. As
the pump reaches its original starting
point, each diaphragm has gone through
one exhaust and one discharge stroke.
This constitutes one complete pumping
cycle. The pump may take several cycles
to completely prime depending on the
conditions of the application.
/54,%4
).,%4
#,/3%$
HOW IT WORKS—AIR DISTRIBUTION SYSTEM
-5&&,%2#%.4%23%#4)/.
!)2).,%4 !)26!,6%
!)26!,6%30//,
-5&&,%20,!4%
-!).3(!&4
WI L-11230-E-11 3 WILDEN PUMP & ENGINEERING, LLC
0),/430//,
%.$#!0
The Pro -Flo
moving parts: the air valve spool and the pilot spool. The heart of
the system is the air valve spool and air valve. This valve design
incorporates an unbalanced spool. The smaller end of the spool
is pressurized continuously, while the large end is alternately
pressurized then exhausted to move the spool. The spool directs
pressurized air to one air chamber while exhausting the other.
The air causes the main shaft /diaphragm assembly to shift to
one side — discharging liquid on that side and pulling liquid in
on the other side. When the shaft reaches the end of its stroke,
the inner piston actuates the pilot spool, which pressurizes and
exhausts the large end of the air valve spool. The repositioning
of the air valve spool routes the air to the other air chamber.
®
patented air distribution system incorporates two
Section 4
DIMENSIONAL DRAWINGS
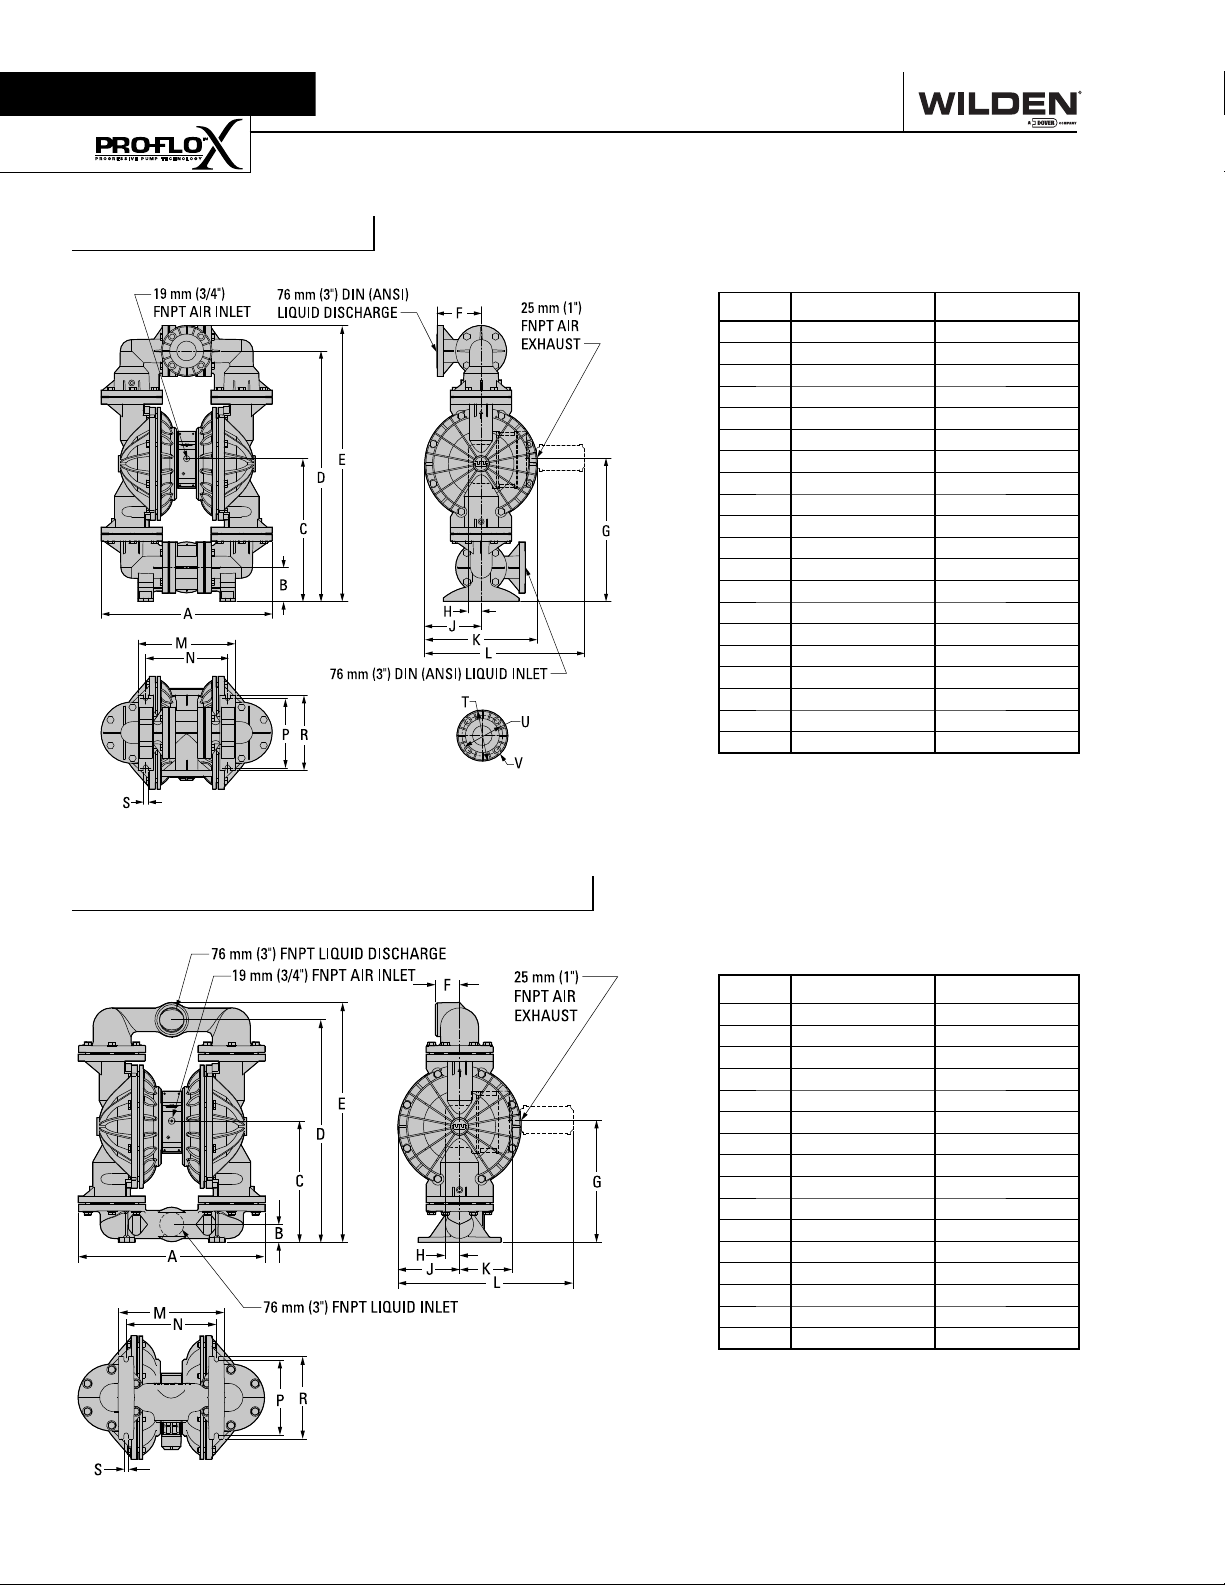
PX1500 Aluminum
DIMENSIONS
ITEM METRIC (mm) STANDARD (inch)
A 615 24.2
B 127 5.0
C 533 21.0
D 934 36.8
E 1031 40.6
F 165 6.5
G 536 21.1
H 48 1.9
J 211 8.3
K 422 16.6
L 597 23.5
M 363 14.3
N 307 12.1
P 259 10.2
R 282 11.1
S 18 0.7
DIN (mm) ANSI (inch)
T 200 DIA. 7.5 DIA.
U 160 DIA. 6.0 DIA.
V 18 DIA. 0.8 DIA.
PX1500 Aluminum Drop-In Type
DIMENSIONS
ITEM METRIC (mm) STANDARD (inch)
A 635 25.0
B 61 2.4
C 414 16.3
D 760 29.9
E 818 32.2
F 84 3.3
G 417 16.4
H 48 1.9
J 211 8.3
K 178 7.0
L 597 23.5
M 358 14.1
N 307 12.1
P 257 10.1
R 282 11.1
S 15 0.6
WILDEN PUMP & ENGINEERING, LLC 4 WI L-11230-E-11
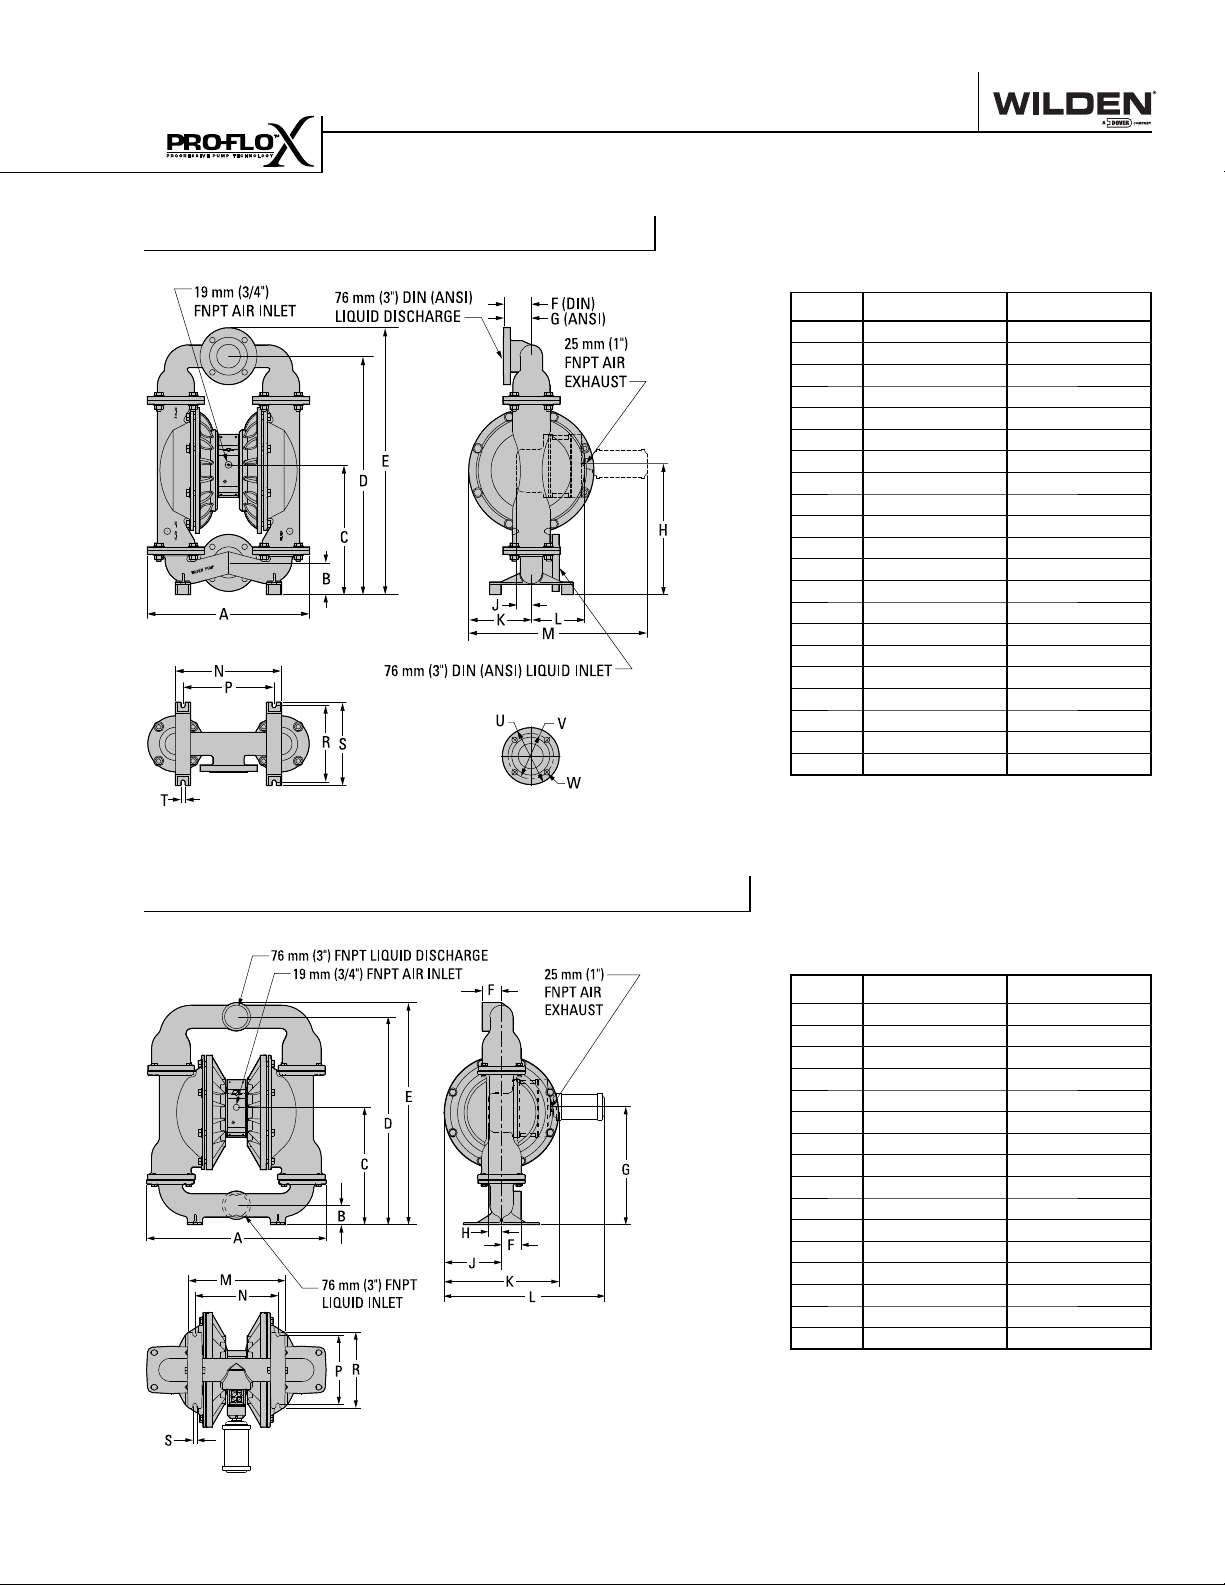
DIMENSIONAL DRAWINGS
PX1500 Stainless Steel/Alloy C
DIMENSIONS
ITEM METRIC (mm) STANDARD (inch)
A 541 21.3
B 107 4.2
C 434 17.1
D 798 31.4
E 894 35.2
F 89 3.5
G 91 3.6
H 437 17.2
J 48 1.9
K 211 8.3
L 178 7.0
M 597 23.5
N 356 14.0
P 305 12.0
R 257 10.1
S 279 11.0
T 15 0.6
DIN (mm) ANSI (inch)
U 200 DIA. 7.5 DIA.
V 160 DIA. 6.0 DIA.
W 18 DIA. 0.8 DIA.
PX1500 Stainless Steel Drop-In Type
DIMENSIONS
ITEM METRIC (mm) STANDARD (inch)
A 650 25.6
B 71 2.8
C 432 17
D 765 30.1
E 815 32.1
F 71 2.8
G 434 17.1
H 48 1.9
J 211 8.3
K 422 16.6
L 589 23.2
M 356 14
N 305 12
P 257 10.1
R 279 11
S 15 0.6
REV A
WI L-11230-E-11 5 WILDEN PUMP & ENGINEERING, LLC
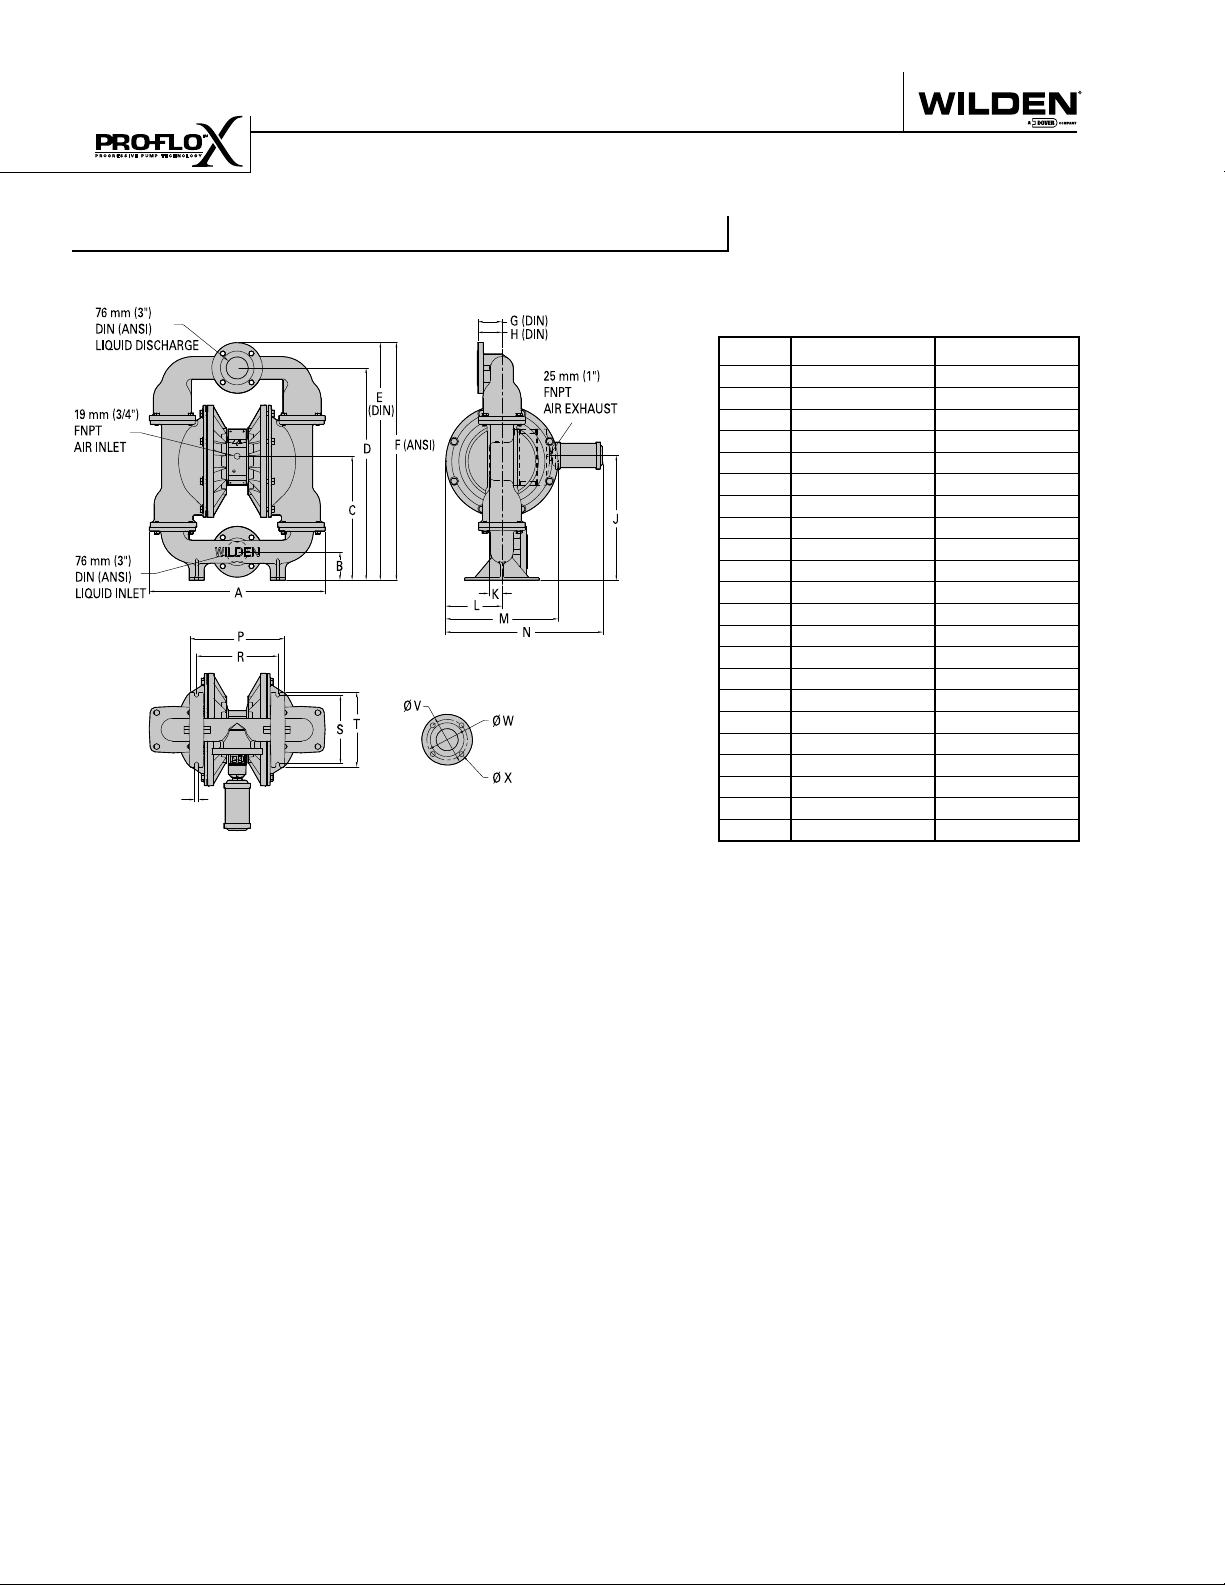
DIMENSIONAL DRAWINGS
PX1500 Stainless Steel Drop-In Flanged
DIMENSIONS
ITEM METRIC (mm) STANDARD (inch)
A 659 26.0
B 105 4.1
C 465 18.3
D 796 31.3
E 896 35.3
F 890 35.1
G 88 3.5
H 90 3.6
J 467 18.4
K 49 1.9
L 211 8.3
M 422 16.6
N 591 23.3
P 356 14.0
R 305 12.0
S 256 10.1
T 279 11.0
U14 .6
DIN (mm) ANSI (inch)
V 200 DIA. 7.5 DIA.
W 160 DIA. 6.0 DIA.
X 18 DIA. 0.8 DIA.
REV A
WILDEN PUMP & ENGINEERING, LLC 6 WI L-11230-E-11
PX1500
M E T A L
PX1500 PERFORMANCE
Section 5
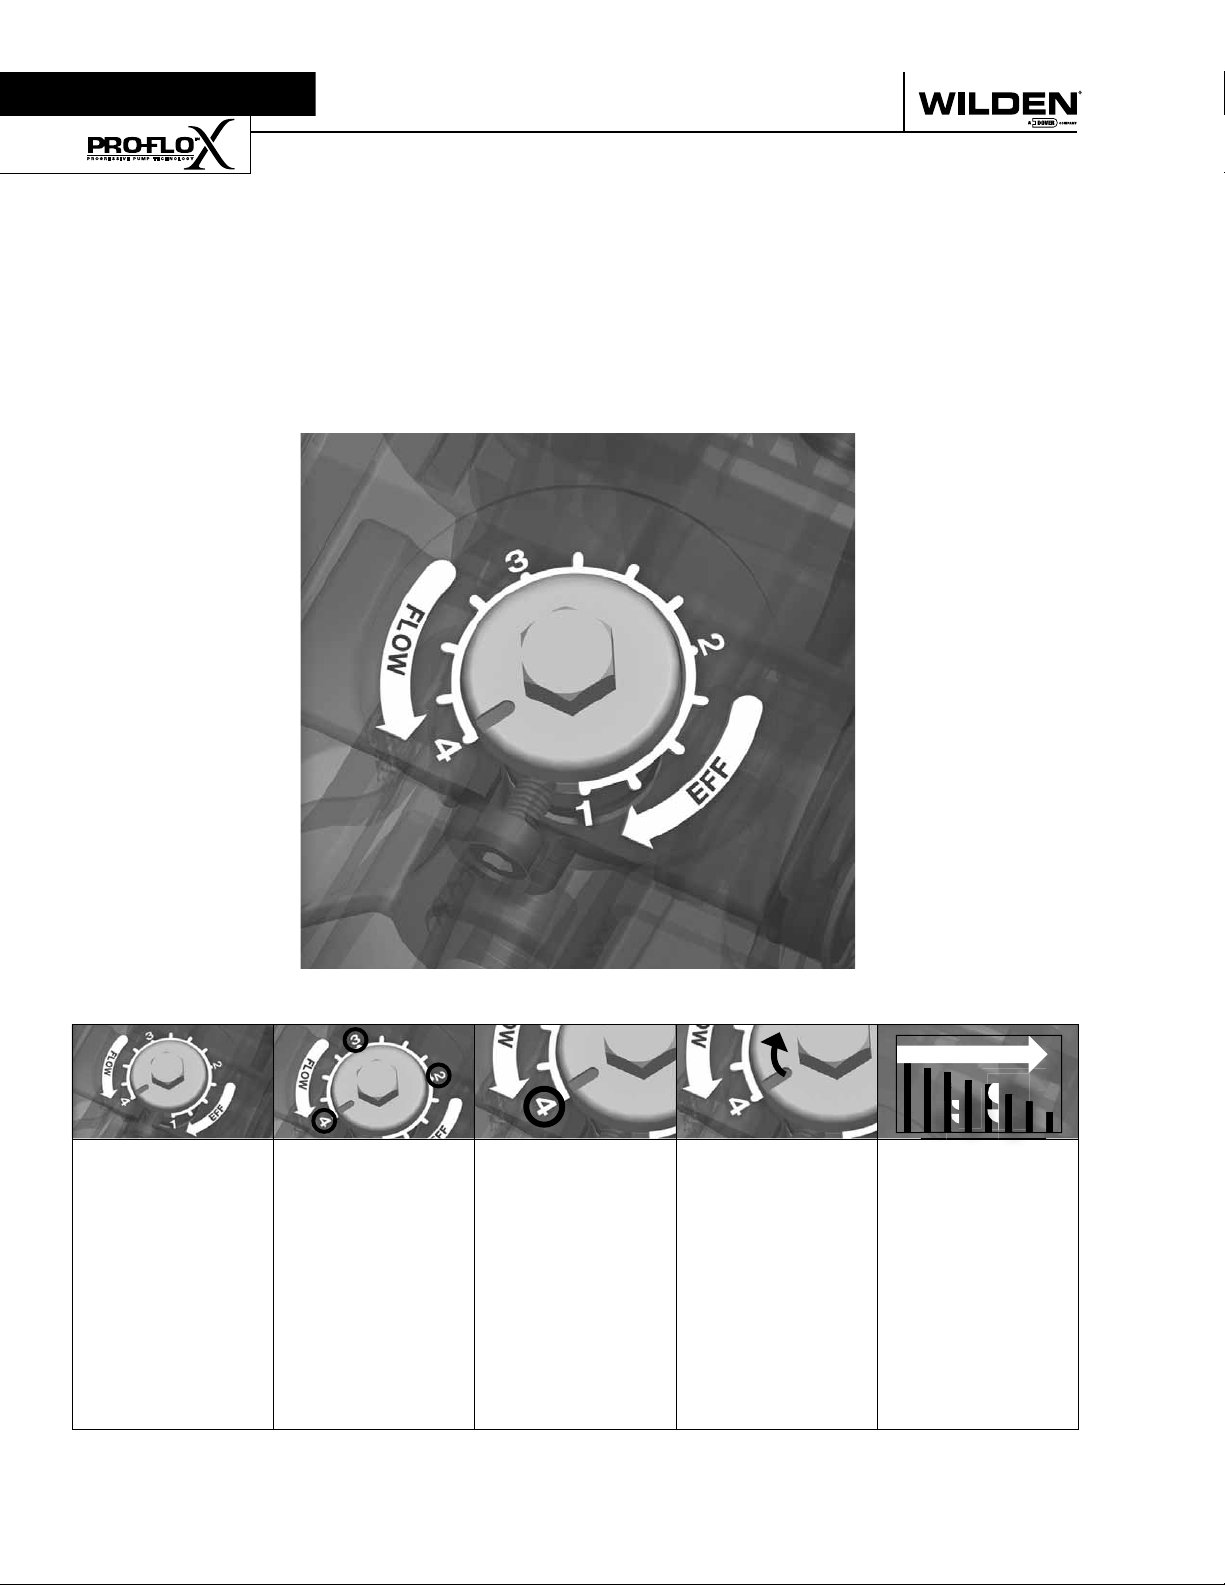
Pro-Flo X
The Pro-Flo X™ air distribution system with the
revolutionary Effi ciency Management System (EMS)
offers fl exibility never before seen in the world of
AODD pumps. The
patent-pending EMS
is simple and easy
to use. With the
turn of an integrated
TM
Operating Principle
control dial, the operator can select the optimal
balance of fl ow and effi ciency that best meets the
application needs. Pro-Flo X™ provides higher
performance, lower
operational costs
and fl exibility that
exceeds previous
industry standards.
AIR CONSUMPTION
$
$
$
Turning the dial
changes the
relationship
between air inlet
and exhaust
porting.
WILDEN PUMP & ENGINEERING, LLC 8 PX1500 Performance
Each dial setting
represents an
entirely different
fl ow curve
Pro-Flo X™ pumps
are shipped from
the factory on
setting 4, which
is the highest
fl ow rate setting
possible
Moving the dial
from setting 4
causes a decrease
in fl ow and an even
greater decrease in
air consumption.
When the air
consumption
decreases more
than the fl ow
rate, effi ciency
is improved and
operating costs
are reduced.
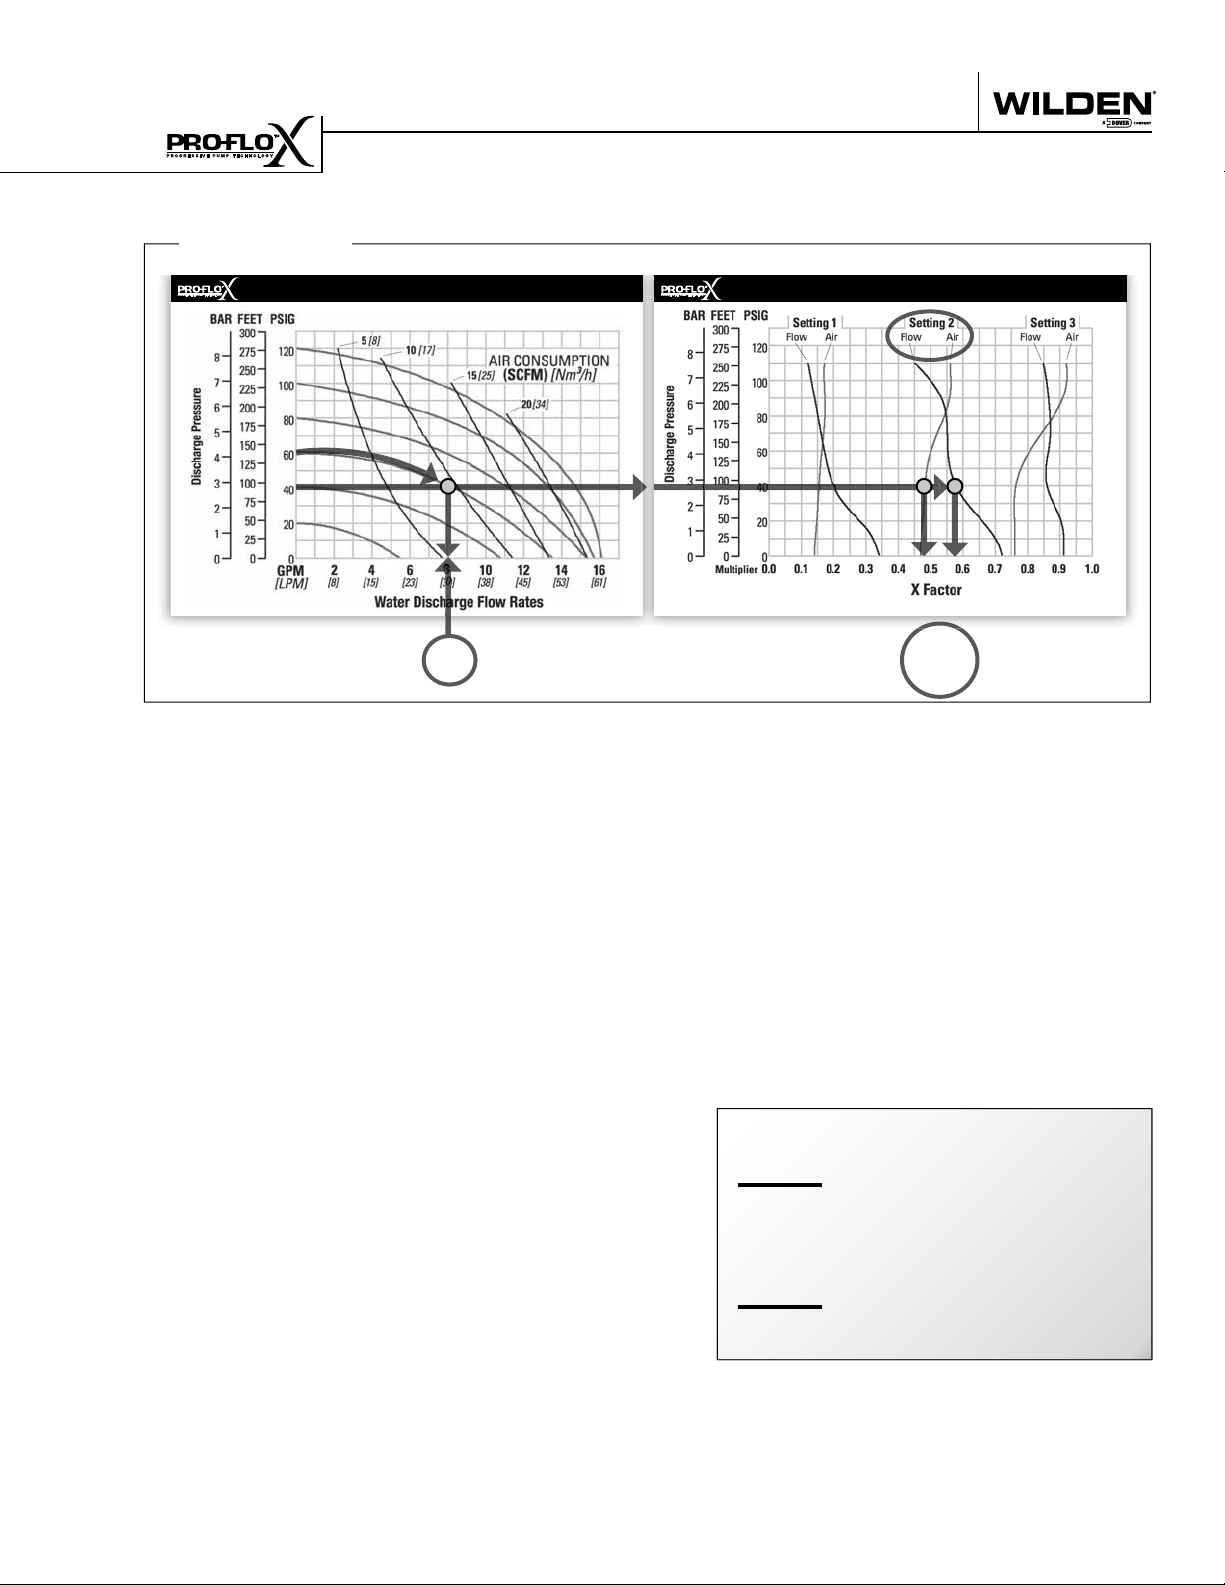
Example 1
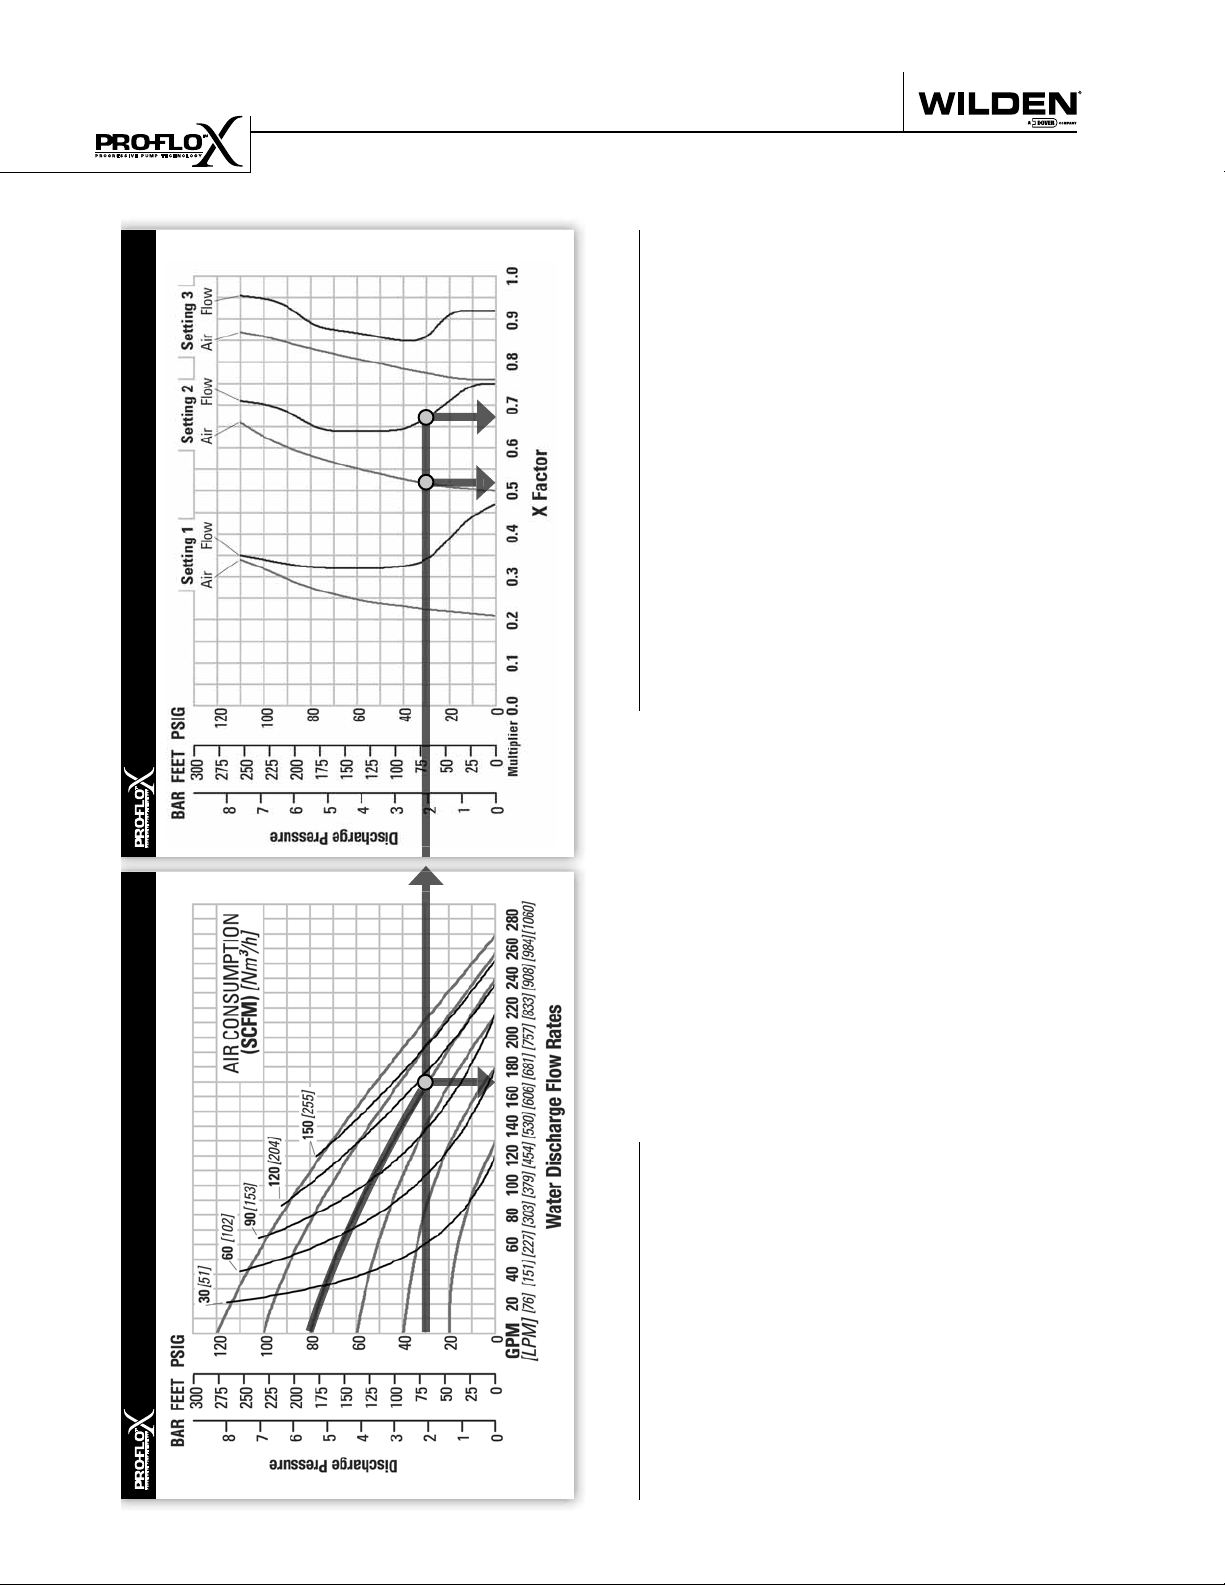
HOW TO USE THIS EMS CURVE
SETTING 4 PERFORMANCE CURVE
Figure 1 Figure 2
Example data point = Example data point =
This is an example showing how to determine fl ow rate and
air consumption for your Pro-Flo X™ pump using the Effi ciency Management System (EMS) curve and the performance
curve. For this example we will be using 4.1 bar (60 psig) inlet
air pressure and 2.8 bar (40 psig) discharge pressure and EMS
setting 2.
Step 1:
Identifying performance at setting 4. Locate
the curve that represents the fl ow rate of the
pump with 4.1 bar (60 psig) air inlet pressure.
Mark the point where this curve crosses the
horizontal line representing 2.8 bar (40 psig)
discharge pressure. (Figure 1). After locating
your performance point on the fl ow curve,
draw a vertical line downward until reaching
the bottom scale on the chart. Identify the fl ow
rate (in this case, 8.2 gpm). Observe location
of performance point relative to air consumption curves and approximate air consumption
value (in this case, 9.8 scfm).
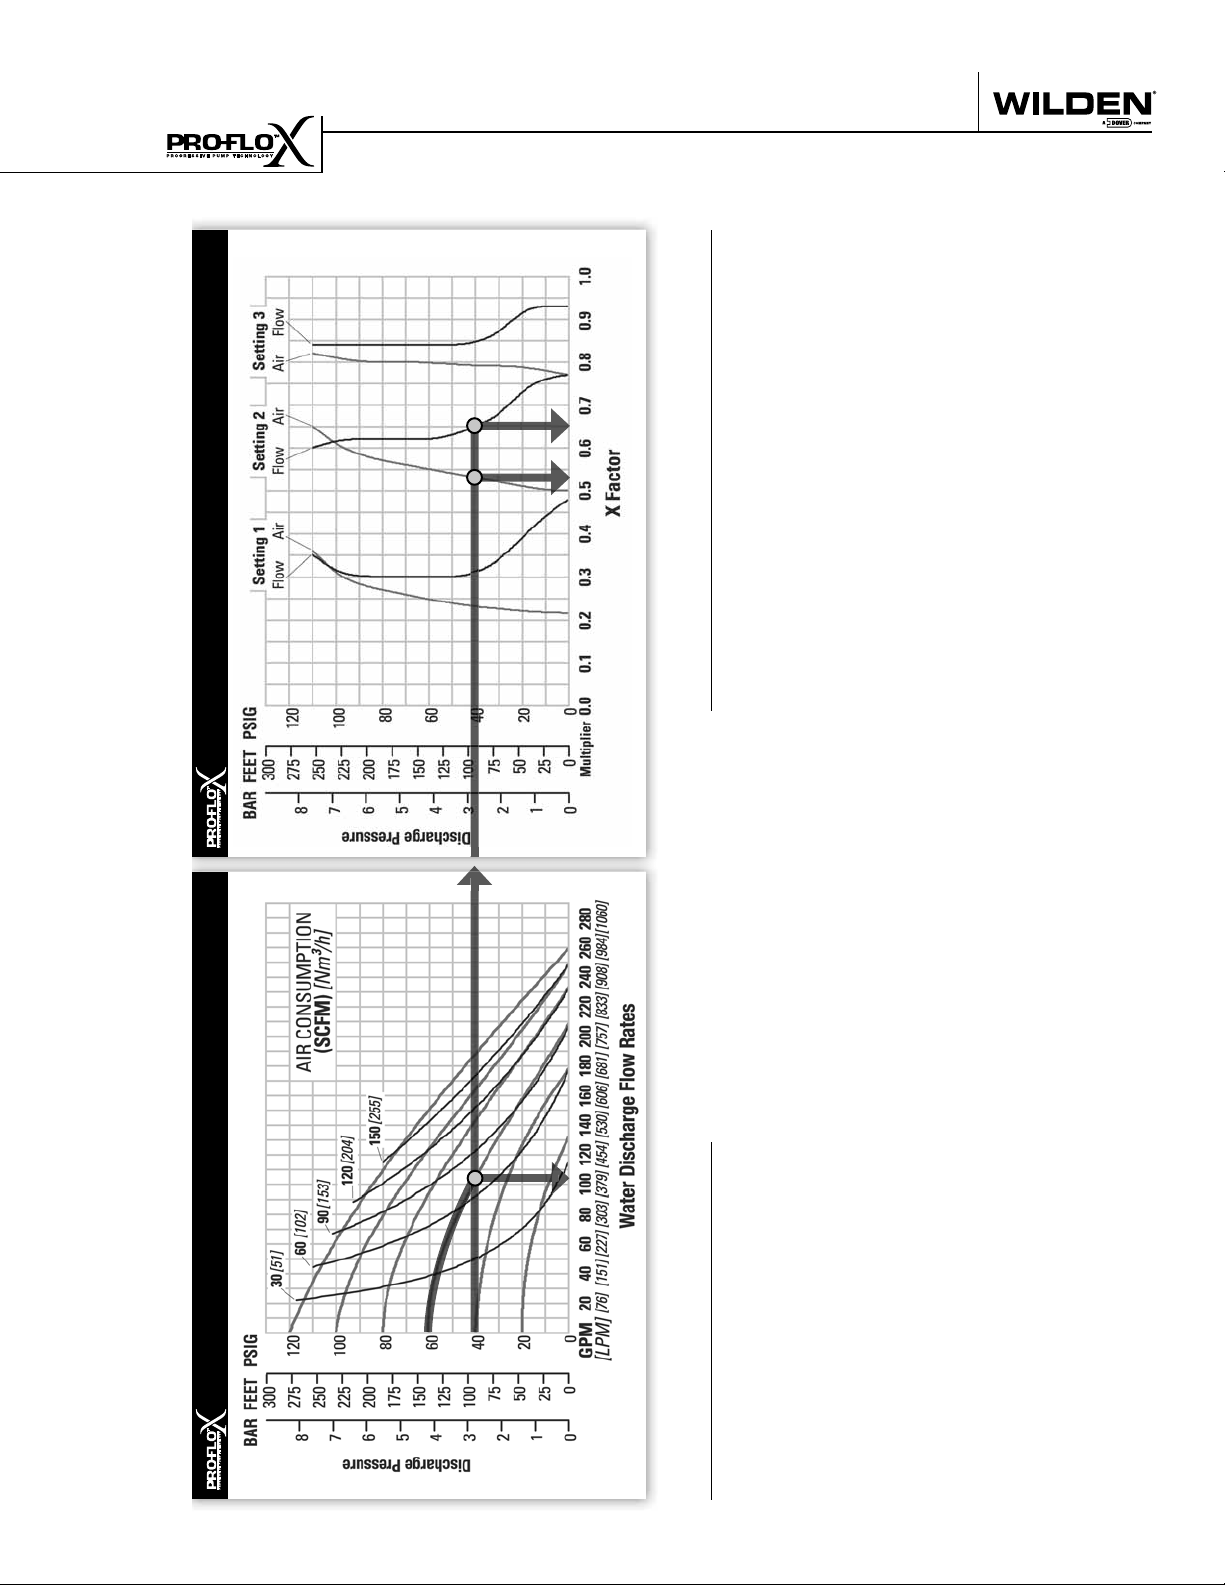
8.2
GPM
curve, draw vertical lines downward until
reaching the bottom scale on the chart. This
identifi es the fl ow X Factor (in this case, 0.58)
and air X Factor (in this case, 0.48).
Step 3:
Calculating performance for specific EMS
setting. Multiply the fl ow rate (8.2 gpm)
obtained in Step 1 by the fl ow X Factor multiplier (0.58) in Step 2 to determine the fl ow rate
at EMS setting 2. Multiply the air consumption (9.8 scfm) obtained in Step 1 by the air
X Factor multiplier (0.48) in Step 2 to determine the air consumption at EMS setting 2
(Figure 3).
8.2
gpm
.58
4.8
gpm
0.58
0.48
(fl ow rate for Setting 4)
(Flow X Factor setting 2)
(Flow rate for setting 2)
EMS CURVE
fl ow multiplier
air multiplier
Step 2:
Determining flow and air X Factors. Locate
your discharge pressure (40 psig) on the vertical axis of the EMS curve (Figure 2). Follow
along the 2.8 bar (40 psig) horizontal line until
intersecting both fl ow and air curves for your
desired EMS setting (in this case, setting 2).
Mark the points where the EMS curves intersect the horizontal discharge pressure line.
After locating your EMS points on the EMS
PX1500 Performance 9 WILDEN PUMP & ENGINEERING, LLC
9.8
scfm
(air consumption for setting 4)
.48
4.7
Figure 3
The fl ow rate and air consumption at Setting
2 are found to be 18.2 lpm (4.8 gpm) and 7.9
Nm3/h (4.7 scfm) respectively.
(Air X Factor setting 2)
scfm
(air consumption for setting 2)
HOW TO USE THIS EMS CURVE
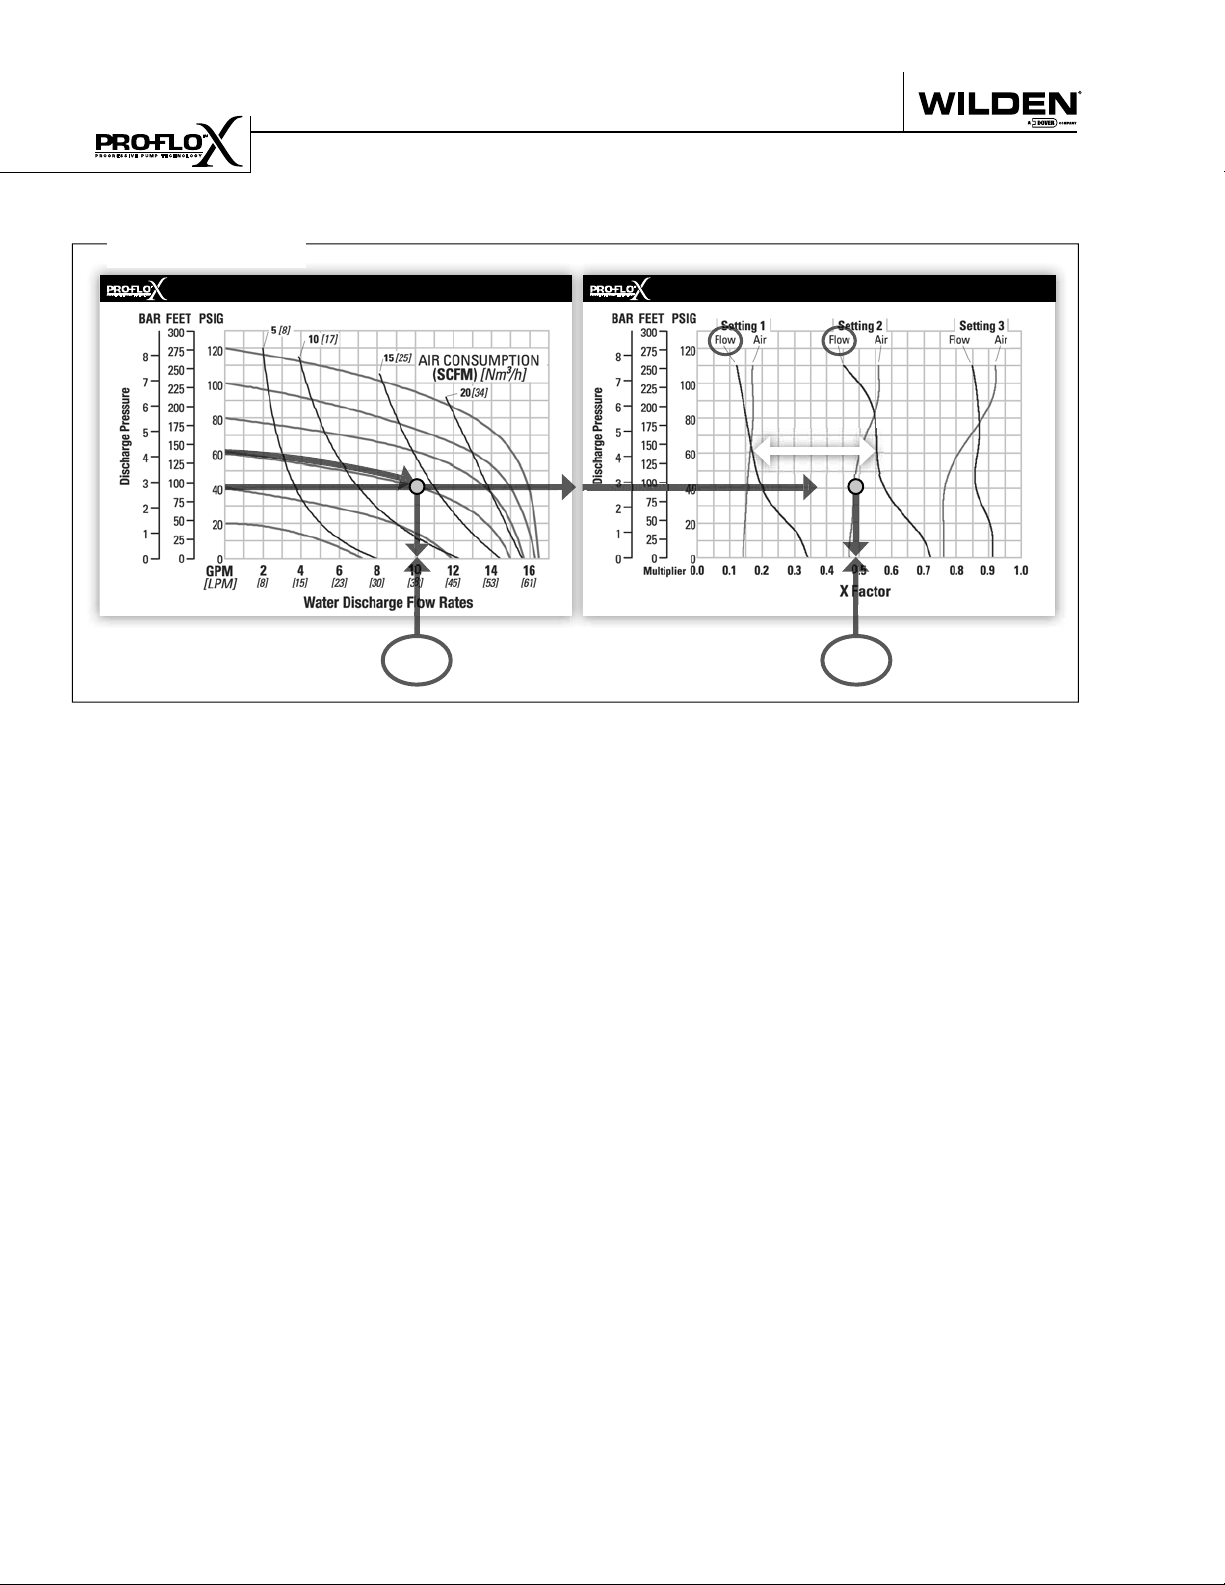
Example 2.1
SETTING 4 PERFORMANCE CURVE
Figure 4
Example data point =
This is an example showing how to determine the inlet air
pressure and the EMS setting for your Pro-Flo X™ pump to
optimize the pump for a specifi c application. For this example we will be using an application requirement of 18.9 lpm
(5 gpm) fl ow rate against 2.8 bar (40 psig) discharge pressure.
This example will illustrate how to calculate the air consumption that could be expected at this operational point.
10.2
gpm
DETERMINE EMS SETTING
Step 1
: Establish inlet air pressure. Higher air pres-
sures will typically allow the pump to run
more effi ciently, however, available plant air
pressure can vary greatly. If an operating
pressure of 6.9 bar (100 psig) is chosen when
EMS Flow
Settings 1 & 2
0.49
In our example it is 38.6 lpm (10.2 gpm). This
is the setting 4 fl ow rate. Observe the location of the performance point relative to air
consumption curves and approximate air
consumption value. In our example setting
4 air consumption is 24 Nm3/h (14 scfm).
See fi gure 4.
Step 3
: Determine flow X Factor. Divide the required
fl ow rate 18.9 lpm (5 gpm) by the setting 4 fl ow
rate 38.6 lpm (10.2 gpm) to determine the fl ow
X Factor for the application.
5
gpm / 10.2 gpm = 0.49 (flow X Factor)
EMS CURVE
Figure 5
fl ow multiplier
plant air frequently dips to 6.2 bar (90 psig)
Step 4
pump performance will vary. Choose an operating pressure that is within your compressed
air system's capabilities. For this example we
will choose 4.1 bar (60 psig).
: Determine EMS setting from the flow
X Factor. Plot the point representing the fl ow
X Factor (0.49) and the application discharge
pressure 2.8 bar (40 psig) on the EMS curve.
This is done by following the horizontal 2.8
Step 2
: Determine performance point at setting 4. For
this example an inlet air pressure of 4.1 bar
(60 psig) inlet air pressure has been chosen.
Locate the curve that represents the performance of the pump with 4.1 bar (60 psig) inlet
air pressure. Mark the point where this curve
crosses the horizontal line representing 2.8
bar (40 psig) discharge pressure. After locating this point on the fl ow curve, draw a vertical line downward until reaching the bottom
scale on the chart and identify the fl ow rate.
bar (40 psig) psig discharge pressure line until
it crosses the vertical 0.49 X Factor line. Typically, this point lies between two fl ow EMS
setting curves (in this case, the point lies between the fl ow curves for EMS setting 1 and
2). Observe the location of the point relative
to the two curves it lies between and approximate the EMS setting (fi gure 5). For more precise results you can mathematically interpolate between the two curves to determine the
optimal EMS setting.
For this example the EMS setting is 1.8.
WILDEN PUMP & ENGINEERING, LLC 10 PX1500 Performance
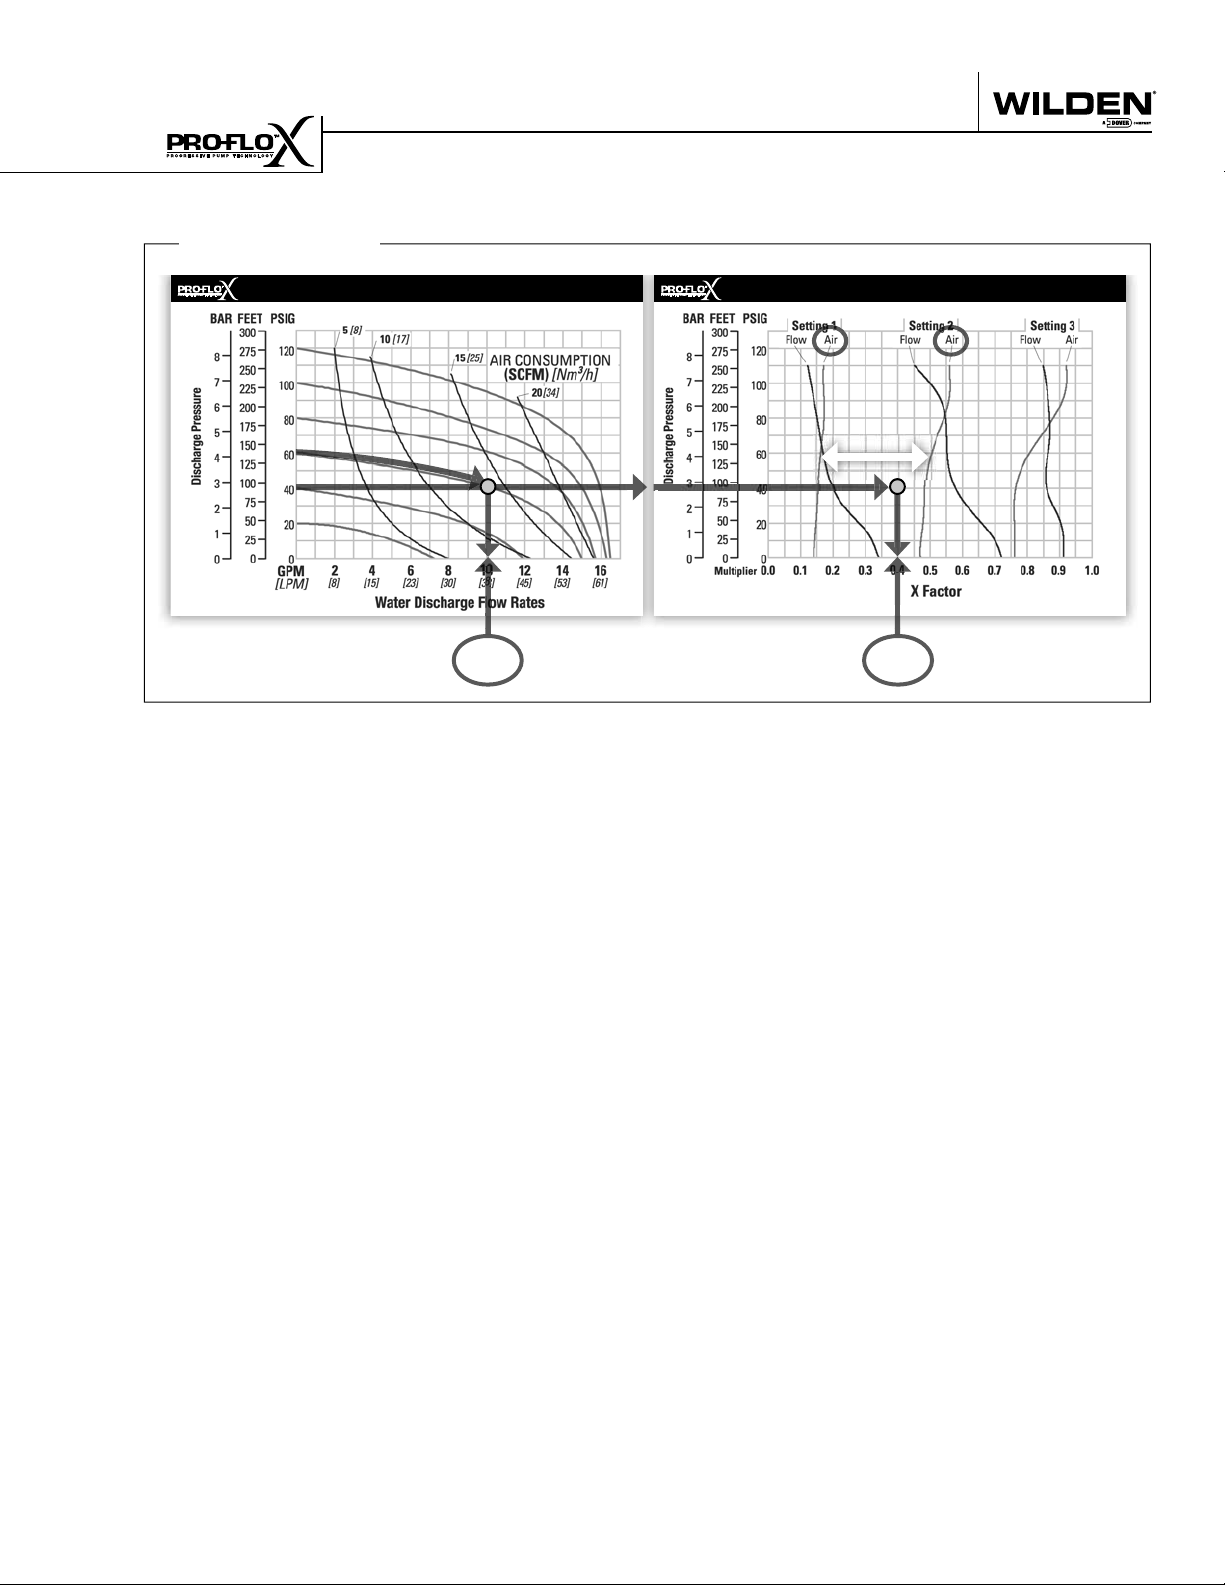
HOW TO USE THIS EMS CURVE
Example 2.2
SETTING 4 PERFORMANCE CURVE
Figure 6
Example data point =
10.2
gpm
Determine air consumption at a specific
EMS setting.
Step 1
: Determine air X Factor. In order to determine
the air X Factor, identify the two air EMS setting curves closest to the EMS setting established in example 2.1 (in this case, the point lies
between the air curves for EMS setting 1 and
2). The point representing your EMS setting
(1.8) must be approximated and plotted on the
EMS curve along the horizontal line representing your discharge pressure (in this case, 40
psig). This air point is different than the fl ow
point plotted in example 2.1. After estimating
(or interpolating) this point on the curve, draw
a vertical line downward until reaching the
bottom scale on the chart and identify the air
X Factor (fi gure 7).
EMS CURVE
EMS Air
Settings 1 & 2
Figure 7
Example data point =
Step 2
: Determine air consumption. Multiply your
setting 4 air consumption (14 scfm) value by
the air X Factor obtained above (0.40) to determine your actual air consumption.
1
4 scfm x 0.40 = 5.6 SCFM
In summary, for an application requiring 18.9 lpm
(5 gpm) against 2.8 bar (40 psig) discharge pressure,
the pump inlet air pressure should be set to 4.1 bar
(60 psig) and the EMS dial should be set to 1.8. The
pump would then consume 9.5 Nm3/h (5.6 scfm) of
compressed air.
0.40
air multiplier
For this example the air X Factor is 0.40
PX1500 Performance 11 WILDEN PUMP & ENGINEERING, LLC
EMS CURVE
PERFORMANCE
/h (113 scfm)
3
EXAMPLE
A PX1500 aluminum, Rubber-fi tted pump operating at EMS setting 4,
achieved a fl ow rate of 640 lpm (169 gpm) using 192 Nm
of air when run at 5.5 bar (80 psig) air inlet pressure and 2.1 bar
(30 psig) discharge pressure (See dot on performance curve).
The end user did not require that much fl ow and wanted to reduce
air consumption at his facility. He determined that EMS setting 2
would meet his needs. At 2.1 bar (30 psig) discharge pressure and
EMS setting 2, the fl ow “X factor” is 0.67 and the air “X factor” is
0.52 (see dots on EMS curve).
/h (59 scfm). The fl ow rate was reduced by 33% while
3
Multiplying the original setting 4 values by the “X factors” provides
the setting 2 fl ow rate of 429 lpm (113 gpm) and an air consumption
of 100 Nm
the air consumption was reduced by 48%, thus providing increased
effi ciency.
For a detailed example for how to set your EMS, see beginning of
performance curve section.
Caution: Do not exceed 8.6 bar (125 psig) air supply pressure.
The Effi ciency Management System (EMS)
can be used to optimize the performance of
your Wilden pump for specifi c applications.
The pump is delivered with the EMS adjusted
to setting 4, which allows maximum fl ow.
The EMS curve allows the pump user to deter-
mine fl ow and air consumption at each EMS
setting. For any EMS setting and discharge
pressure, the “X factor” is used as a multi-
plier with the original values from the setting
4 performance curve to calculate the actual
fl ow and air consumption values for that spe-
cifi c EMS setting. Note: you can interpolate
between the setting curves for operation at
intermediate EMS settings.
1
SETTING 4 PERFORMANCE CURVE
Displacement per stroke was calculated at 4.8 bar (70 psig)
TECHNICAL DATA
Height . . . . . . . . . . . . . . . . . . . . . . . . .1031 mm (40.6”)
Width. . . . . . . . . . . . . . . . . . . . . . . . . . .615 mm (24.2”)
Depth. . . . . . . . . . . . . . . . . . . . . . . . . . .422 mm (16.6”)
Ship Weight . . . . . . . . . . . Aluminum 83 kg (182 lbs.)
Aluminum Drop-In 70 kg (152 lbs.)
Air Inlet . . . . . . . . . . . . . . . . . . . . . . . . . . 19 mm (3/4”)
Inlet . . . . . . . . . . . . . . . . . . . . . . . . . . . . . . . 76 mm (3”)
Outlet. . . . . . . . . . . . . . . . . . . . . . . . . . . . . . 76 mm (3”)
Suction Lift . . . . . . . . . . . . . . . . . . . . .6.1 m Dry (19.9’)
8.8 m Wet (28.9’)
Disp. Per Stroke. . . . . . . . . . . . . . . . 5.22 l (1.38 gal.)
Max. Flow Rate . . . . . . . . . . . . . .1021 lpm (270 gpm)
PX1500 ALUMINUM RUBBER-FITTED
WILDEN PUMP & ENGINEERING, LLC 12 PX1500 Performance
Max. Size Solids . . . . . . . . . . . . . . . . . 12.7 mm (1/2”)
air inlet pressure against a 2 bar (30 psig) head pressure.
1
EMS CURVE
PERFORMANCE
/h (72 scfm)
3
of air when run at 4.1 bar (60 psig) air inlet pressure and 2.8 bar (40
psig) discharge pressure (See dot on performance curve).
The end user did not require that much fl ow and wanted to reduce
air consumption at his facility. He determined that EMS setting 2
would meet his needs. At 2.8 bar (40 psig) discharge pressure and
EMS setting 2, the fl ow “X factor” is 0.65 and the air “X factor” is
EXAMPLE
A PX1500 aluminum, TPE-fi tted pump operating at EMS setting 4,
achieved a fl ow rate of 394 lpm (104 gpm) using 122 Nm
0.53 (see dots on EMS curve).
/h (38 scfm). The fl ow rate was reduced by 35% while
3
Multiplying the original setting 4 values by the “X factors” provides
the setting 2 fl ow rate of 256 lpm (68 gpm) and an air consumption
of 65 Nm
the air consumption was reduced by 47%, thus providing increased
effi ciency.
For a detailed example for how to set your EMS, see beginning of
performance curve section.
Caution: Do not exceed 8.6 bar (125 psig) air supply pressure.
The Effi ciency Management System (EMS)
can be used to optimize the performance of
your Wilden pump for specifi c applications.
The pump is delivered with the EMS adjusted
to setting 4, which allows maximum fl ow.
The EMS curve allows the pump user to deter-
mine fl ow and air consumption at each EMS
setting. For any EMS setting and discharge
pressure, the “X factor” is used as a multi-
plier with the original values from the setting
4 performance curve to calculate the actual
fl ow and air consumption values for that spe-
cifi c EMS setting. Note: you can interpolate
between the setting curves for operation at
intermediate EMS settings.
1
SETTING 4 PERFORMANCE CURVE
Displacement per stroke was calculated at 4.8 bar (70 psig)
TECHNICAL DATA
Height . . . . . . . . . . . . . . . . . . . . . . . . .1031 mm (40.6”)
Width. . . . . . . . . . . . . . . . . . . . . . . . . . .615 mm (24.2”)
Depth. . . . . . . . . . . . . . . . . . . . . . . . . . .422 mm (16.6”)
Ship Weight . . . . . . . . . . . Aluminum 83 kg (182 lbs.)
Aluminum Drop-In 70 kg (152 lbs.)
Air Inlet . . . . . . . . . . . . . . . . . . . . . . . . . . 19 mm (3/4”)
Inlet . . . . . . . . . . . . . . . . . . . . . . . . . . . . . . . 76 mm (3”)
Outlet. . . . . . . . . . . . . . . . . . . . . . . . . . . . . . 76 mm (3”)
Suction Lift . . . . . . . . . . . . . . . . . . . . .6.6 m Dry (21.7’)
8.8 m Wet (28.9’)
Disp. Per Stroke. . . . . . . . . . . . . . . . 4.47 l (1.18 gal.)
Max. Flow Rate . . . . . . . . . . . . . . .984 lpm (260 gpm)
PX1500 ALUMINUM TPE-FITTED
PX1500 Performance 13 WILDEN PUMP & ENGINEERING, LLC
Max. Size Solids . . . . . . . . . . . . . . . . . 12.7 mm (1/2”)
air inlet pressure against a 2 bar (30 psig) head pressure.
1
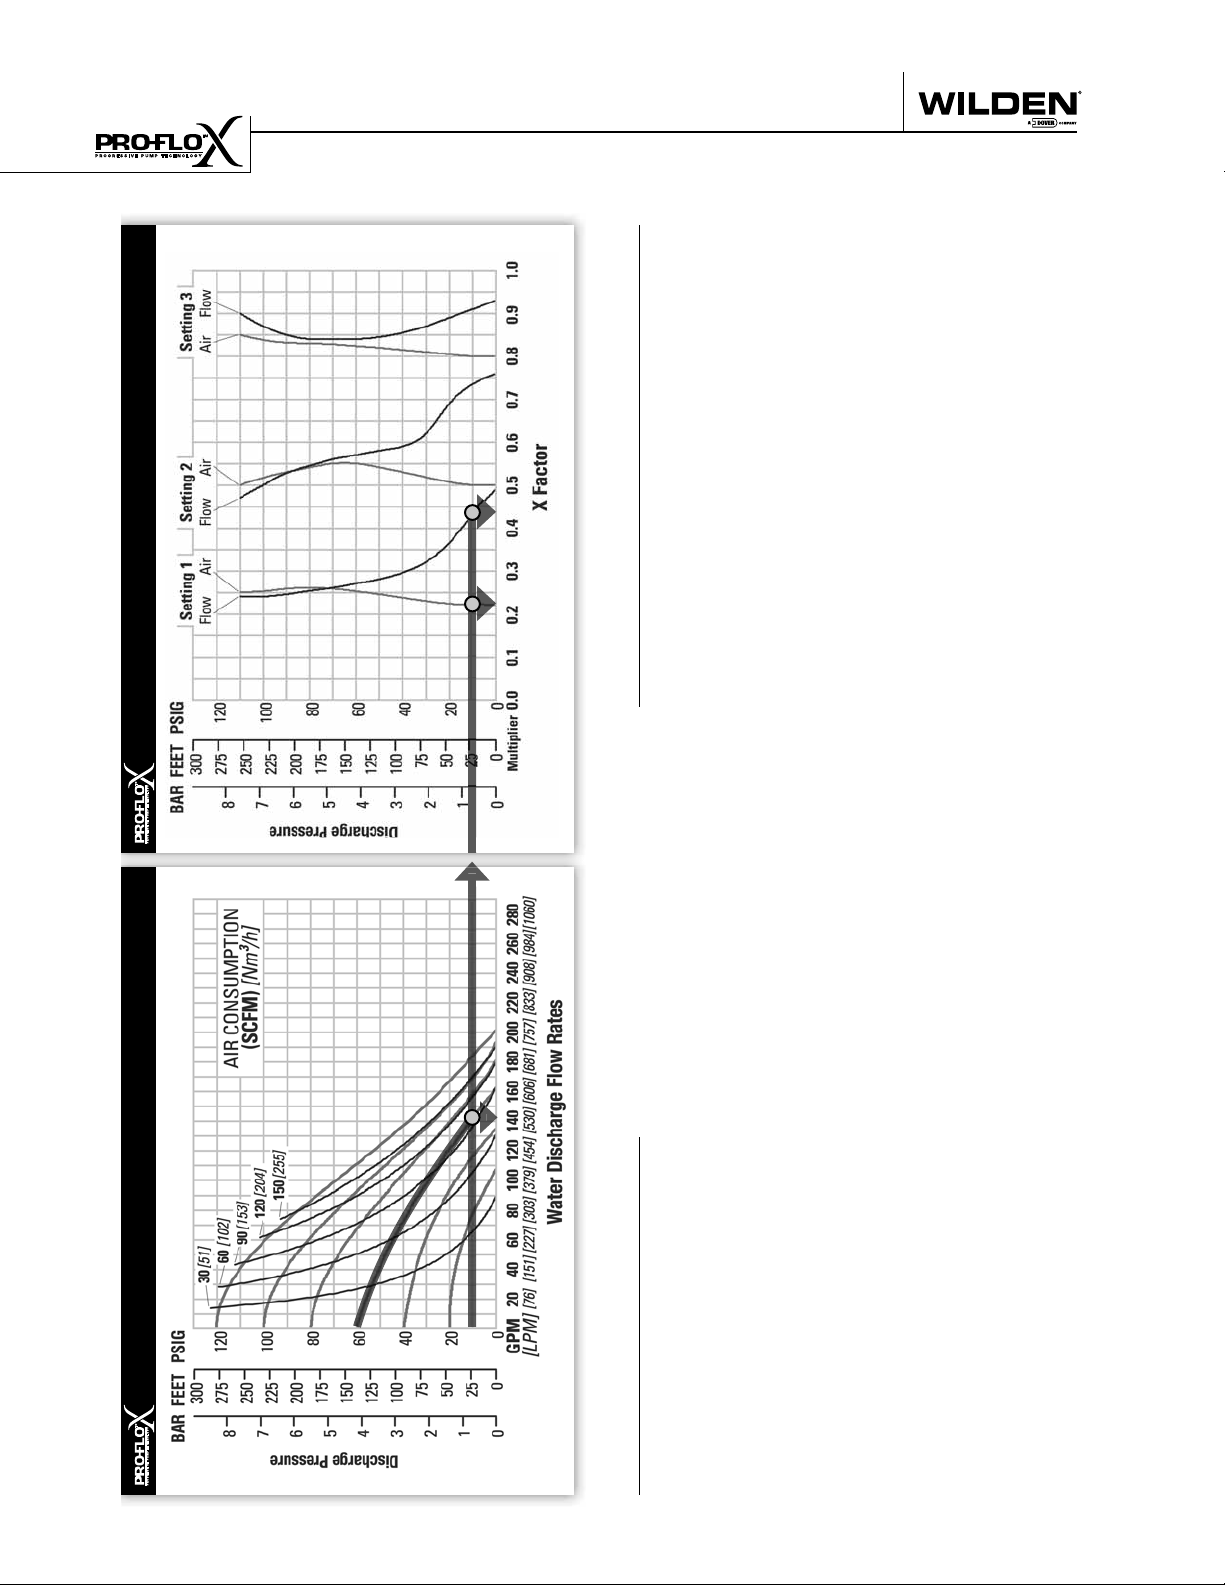
EMS CURVE
PERFORMANCE
/h (94 scfm)
3
of air when run at 4.1 bar (60 psig) air inlet pressure and 0.7 bar (10
psig) discharge pressure (See dot on performance curve).
The end user did not require that much fl ow and wanted to reduce
air consumption at his facility. He determined that EMS setting 1
would meet his needs. At 0.7 bar (10 psig) discharge pressure and
EMS setting 1, the fl ow “X factor” is 0.43 and the air “X factor” is
EXAMPLE
A PX1500 aluminum, PTFE-fi tted pump operating at EMS setting 4,
achieved a fl ow rate of 538 lpm (142 gpm) using 160 Nm
0.22 (see dots on EMS curve).
/h (21 scfm). The fl ow rate was reduced by 57% while the
3
air consumption was reduced by 78%, thus providing increased ef-
fi ciency.
For a detailed example for how to set your EMS, see beginning of
performance curve section.
Multiplying the original setting 4 values by the “X factors” provides
the setting 1 fl ow rate of 231 lpm (61 gpm) and an air consumption
of 35 Nm
Caution: Do not exceed 8.6 bar (125 psig) air supply pressure.
The Effi ciency Management System (EMS)
can be used to optimize the performance of
your Wilden pump for specifi c applications.
The pump is delivered with the EMS adjusted
to setting 4, which allows maximum fl ow.
The EMS curve allows the pump user to deter-
mine fl ow and air consumption at each EMS
setting. For any EMS setting and discharge
pressure, the “X factor” is used as a multi-
plier with the original values from the setting
4 performance curve to calculate the actual
fl ow and air consumption values for that spe-
cifi c EMS setting. Note: you can interpolate
between the setting curves for operation at
intermediate EMS settings
1
SETTING 4 PERFORMANCE CURVE
Displacement per stroke was calculated at 4.8 bar (70 psig)
TECHNICAL DATA
Height . . . . . . . . . . . . . . . . . . . . . . . . .1031 mm (40.6”)
Width. . . . . . . . . . . . . . . . . . . . . . . . . . .615 mm (24.2”)
Depth. . . . . . . . . . . . . . . . . . . . . . . . . . .422 mm (16.6”)
Ship Weight . . . . . . . . . . . Aluminum 83 kg (182 lbs.)
Aluminum Drop-In 70 kg (152 lbs.)
Air Inlet . . . . . . . . . . . . . . . . . . . . . . . . . . 19 mm (3/4”)
Inlet . . . . . . . . . . . . . . . . . . . . . . . . . . . . . . . 76 mm (3”)
Outlet. . . . . . . . . . . . . . . . . . . . . . . . . . . . . . 76 mm (3”)
Suction Lift . . . . . . . . . . . . . . . . . . . . .4.4 m Dry (14.4’)
7.8 m Wet (25.6’)
Disp. Per Stroke. . . . . . . . . . . . . . . . 3.48 l (0.92 gal.)
Max. Flow Rate . . . . . . . . . . . . . . .765 lpm (202 gpm)
PX1500 ALUMINUM PTFE-FITTED
WILDEN PUMP & ENGINEERING, LLC 14 PX1500 Performance
Max. Size Solids . . . . . . . . . . . . . . . . . 12.7 mm (1/2”)
air inlet pressure against a 2 bar (30 psig) head pressure.
1
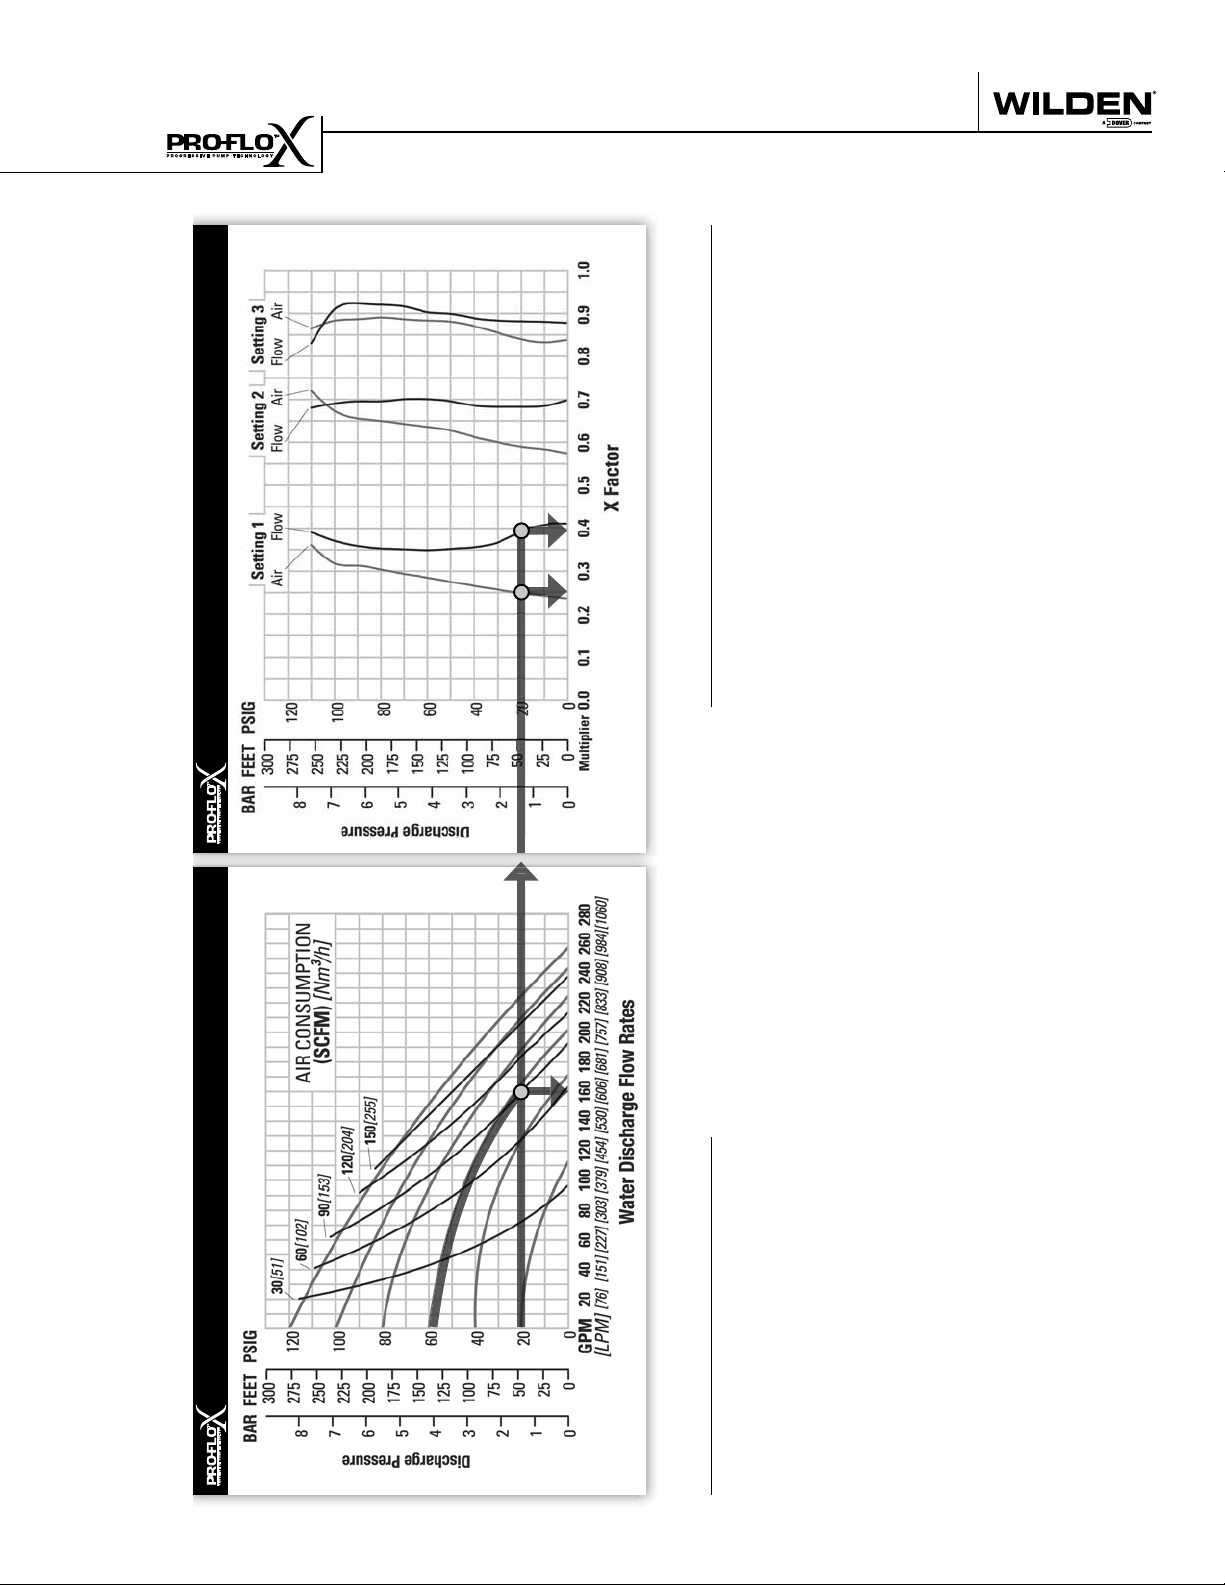
EMS CURVE
PERFORMANCE
/h
3
EXAMPLE
A PX1500 aluminum, Full Flow PTFE fi tted pump operating at EMS
setting 4, achieved a fl ow rate of 606 lpm (160 gpm) using 153 Nm
(90 scfm) of air when run at 4.0 bar (58 psig) air inlet pressure and 1.4
bar (20 psig) discharge pressure (See dot on performance curve).
The end user did not require that much fl ow and wanted to reduce
air consumption at his facility. He determined that EMS setting 1
would meet his needs. At 1.4 bar (20 psig) discharge pressure and
EMS setting 1, the fl ow “X factor” is 0.39 and the air “X factor” is
0.25 (see dots on EMS curve).
/h (23 scfm). The fl ow rate was reduced by 61% while
3
the air consumption was reduced by 75%, thus providing increased
effi ciency.
For a detailed example for how to set your EMS, see beginning of
performance curve section.
Multiplying the original setting 4 values by the “X factors” provides
the setting 1 fl ow rate of 236 lpm (62 gpm) and an air consumption
of 38 Nm
Caution: Do not exceed 8.6 bar (125 psig) air supply pressure.
The Effi ciency Management System (EMS)
can be used to optimize the performance of
your Wilden pump for specifi c applications.
The pump is delivered with the EMS adjusted
to setting 4, which allows maximum fl ow.
The EMS curve allows the pump user to deter-
mine fl ow and air consumption at each EMS
setting. For any EMS setting and discharge
pressure, the “X factor” is used as a multi-
plier with the original values from the setting
4 performance curve to calculate the actual
fl ow and air consumption values for that spe-
cifi c EMS setting. Note: you can interpolate
between the setting curves for operation at
intermediate EMS settings
1
SETTING 4 PERFORMANCE CURVE
Displacement per stroke was calculated at 4.8 bar (70 psig)
TECHNICAL DATA
Height . . . . . . . . . . . . . . . . . . . . . . . . .1031 mm (40.6”)
Width. . . . . . . . . . . . . . . . . . . . . . . . . . .615 mm (24.2”)
Depth. . . . . . . . . . . . . . . . . . . . . . . . . . .422 mm (16.6”)
Ship Weight . . . . . . . . . . . Aluminum 83 kg (182 lbs.)
Aluminum Drop-in 70 kg (152 lbs.)
Air Inlet . . . . . . . . . . . . . . . . . . . . . . . . . . 19 mm (3/4”)
Inlet . . . . . . . . . . . . . . . . . . . . . . . . . . . . . . . 76 mm (3”)
Outlet. . . . . . . . . . . . . . . . . . . . . . . . . . . . . . 76 mm (3”)
Suction Lift . . . . . . . . . . . . . . . . . . . . .6.4 m Dry (21.0’)
9.0 m Wet (29.5’)
Disp. Per Stroke. . . . . . . . . . . . . . . . . 5.3 l (1.39 gal.)
Max. Flow Rate . . . . . . . . . . . . . 974 lpm (257.3 gpm)
PX1500 ALUMINUM FULL STROKE PTFE-FITTED
PX1500 Performance 15 WILDEN PUMP & ENGINEERING, LLC
Max. Size Solids . . . . . . . . . . . . . . . . . 12.7 mm (1/2”)
air inlet pressure against a 2 bar (30 psig) head pressure.
1
 Loading...