

Page 1

WET Labs, Inc.
P.O. Box 518
Philomath, OR 97370
Tel: 541-929-5650
fax: 541-929-5277
www.wetlabs.com
WETView 7.0
User’s Guide
WETView 7.0 User’s Guide (WETView) Revision F 9 February 2004
Page 2

Page 3

Table of Contents
1. Introduction................................................................................... 1
2. System Requirements and Installation......................................... 1
2.1 Installing the Software ....................................................................................... 1
3. Quick Start.................................................................................... 1
4. Operation Overview...................................................................... 2
4.1 Controlling WETView....................................................................................... 2
4.2 How Data is Collected ....................................................................................... 2
4.3 Displaying Data ................................................................................................. 3
4.4 Rescaling Graphs ............................................................................................... 3
5. Collecting, Graphing, and Saving Data ........................................ 4
5.1 WETView Menus .............................................................................................. 4
5.2 Opening a Device............................................................................................... 5
5.3 Opening and Saving a Data File ........................................................................ 5
5.4 Collecting Data .................................................................................................. 6
5.5 Graphing Data.................................................................................................... 6
6. Configuration ................................................................................ 8
Appendix A—ac-9 Meter Files.......................................................... 11
ac-9 Configuration File................................................................................................. 11
ac-9 WETView Data Files............................................................................................ 11
ac-9 Raw Data............................................................................................................... 14
Appendix B—ac-s Meter Files .......................................................... 18
ac-s Configuration File ................................................................................................. 18
ac-s WETView Data Files ............................................................................................ 20
ac-s Raw Data ............................................................................................................... 22
WETView 7.0 User’s Guide (WETView) Revision F 9 February 2004 i
Page 4

Page 5

1. Introduction
WETView is a data acquisition and display program for acquiring and viewing the data
produced by WET Labs absorption and attenuation instruments. It runs on IBM PC
compatible computers. This document describes what is required to run WETView, how
to install it and how to use it.
2. System Requirements and Installation
It is recommended you have at least a 90 Mhz Pentium with at least 16 Mb of memory.
You will need about 3 Mb of disk space for the WETView program and related files. The
speed of the processor limits how much real-time graphing can be accomplished without
data loss. The size of memory limits the number of data points that can be plotted in one
run. WETView requires Windows 95 or newer operating system.
The WETView CD contains five files: SETUP.EXE, Wethsx.001, Wethsx.002,
*.dev and *.cal.
Once installed, the WETView directory contains the following files:
• setup.exe WETView installation executable
• uninst.dll File associated with uninstall utility
• uninst.exe The uninstall utility
• uninst.lrm File associated with uninstall utility
• Wethsx.001File associated with program file
• Wethsx.002File associated with program file
• WetView.exe WETView program
• WETVIEW.UIR WETView user interface resource file
• *.DEV Device configuration files (the actual name(s) of these files depend
upon the instrument(s) that you have purchased)
2.1 Installing the Software
1. Insert the CD.
2. Open the CD and double-click on the SETUP.EXE icon. SETUP will guide you
through the rest of the installation process.
3. Copy the *.dev and *.cal files to the hard disk. WETView initially looks for the
.dev file in the installation directory (default is c:\Program
Files\wetlabs\wetview7).
WETView 7.0 User’s Guide (WETView) Revision F 9 February 2004 1
Page 6

Page 7

3. Quick Start
This section gives instructions for you to quickly get a single meter connected and
displaying data. fter installing the software:
1. Connect the meter to an appropriate power supply.
2. Connect the data line to one of the communication ports on your computer.
3. Turn the meter power supply on.
4. Start the WETView program.
5. Open a device configuration file by pressing the ^O to Open button at the top of the
screen (or by typing control-O). A dialog box will appear, allowing you to select a
file to open.
6. Select the COM port to which you attached the meter.
7. Press the F1 to Start button at the top of the screen.
8. After several seconds, stop the acquisition by pressing the F2 to Stop button.
9. Save the newly acquired data to a file. Name the file TMP.DAT.
10. Rescale the graph by selecting the All channels button in the lower right corner of
the screen. You can zoom in on one channel by press the colored button next to the
channel’s name on the right-hand side of the screen.
11. Open the data file you have just created by selecting File/Open .DAT file... from the
File menu. Choose the file named TMP.DAT.
12. View the data in the file by pressing the “F1 to Start” button at the top of the screen.
WETView 7.0 User’s Guide (WETView) Revision F 9 February 2004 1
Page 8
4. Operation Overview
WETView acquires data from WET Labs’ ac meters and displays collected data.
WETView can perform these tasks simultaneously or independently.
4.1 Controlling WETView
You may use a mouse or keyboard commands to control WETView. The assigned
function keys are:
F1
Start acquiring data
F2
F3
F4
F5
F6
F7
F8
^O (control-O) Opens a device for data acquisition.
To operate controls on the screen using the keyboard, select the control by tabbing
until the desired control is highlighted, then change its value. The method for
changing a control’s value depends on the type of control:
• For a text or numeric field, type the desired value.
• For a radio button, type a space to toggle its value.
• For a button, type Return to activate the button.
Most dialog boxes have an OK and a Cancel button. The function key F1 will select
OK and the Esc key will cancel the dialog.
Stop acquiring data
Bring up Graph Options dialog
Bring up Binning Options dialog
Move data on graph to the left (or down)
Move data on graph to the right (or up)
Zoom graph in
Zoom graph out
4.2 How Data is Collected
As data is collected, it is averaged into bins. The average of each bin is stored and can be
written to a file after the acquisition is complete. The number of samples per bin is set by
the user via the Options/Channels/Binning… menu item. Once the data has been averaged
into bins, those bins can be further averaged into bins of bins for plotting.
Regardless of which channels are being displayed, all data acquired from an
instrument is stored and can be saved to a data file.
2 WETView 7.0 User’s Guide (WETView) Revision F 9 February 2004
Page 9

4.3 Displaying Data
Data can be read directly from an instrument and displayed in real time, or it can be
read from a previously stored data file. You may configure the X and Y ranges for
graphs and select which traces are to be plotted. Collected data may be averaged into
bins for display. Thus, you can average acquired data into bins of 4 samples each, and
then display bins of 12 samples each by selecting a collection bin size of 4 and a
display bin size of 3.
4.4 Rescaling Graphs
When data is displayed in a graph, you can rescale the graph’s bounds to zoom in on
a single channel by clicking on the small button associated with the channel's label
(on the right side of the screen). Clicking on the All channels button will rescale the
graph so that all displayed channels will be shown.
In the lower right corner of the screen are four buttons for navigating around a
displayed graph. You can zoom in (magnify) a graph, or zoom out.
You can also move the bounds on the graph to shift the viewed data to the right or left
on the current graph (for strip charts, these move the graph up and down).
You can change other characteristics of a graph by selecting Options/Graph (or,
equivalently, the Graph/Options menu item).
WETView 7.0 User’s Guide (WETView) Revision F 9 February 2004 3
Page 10
5. Collecting, Graphing, and Saving Data
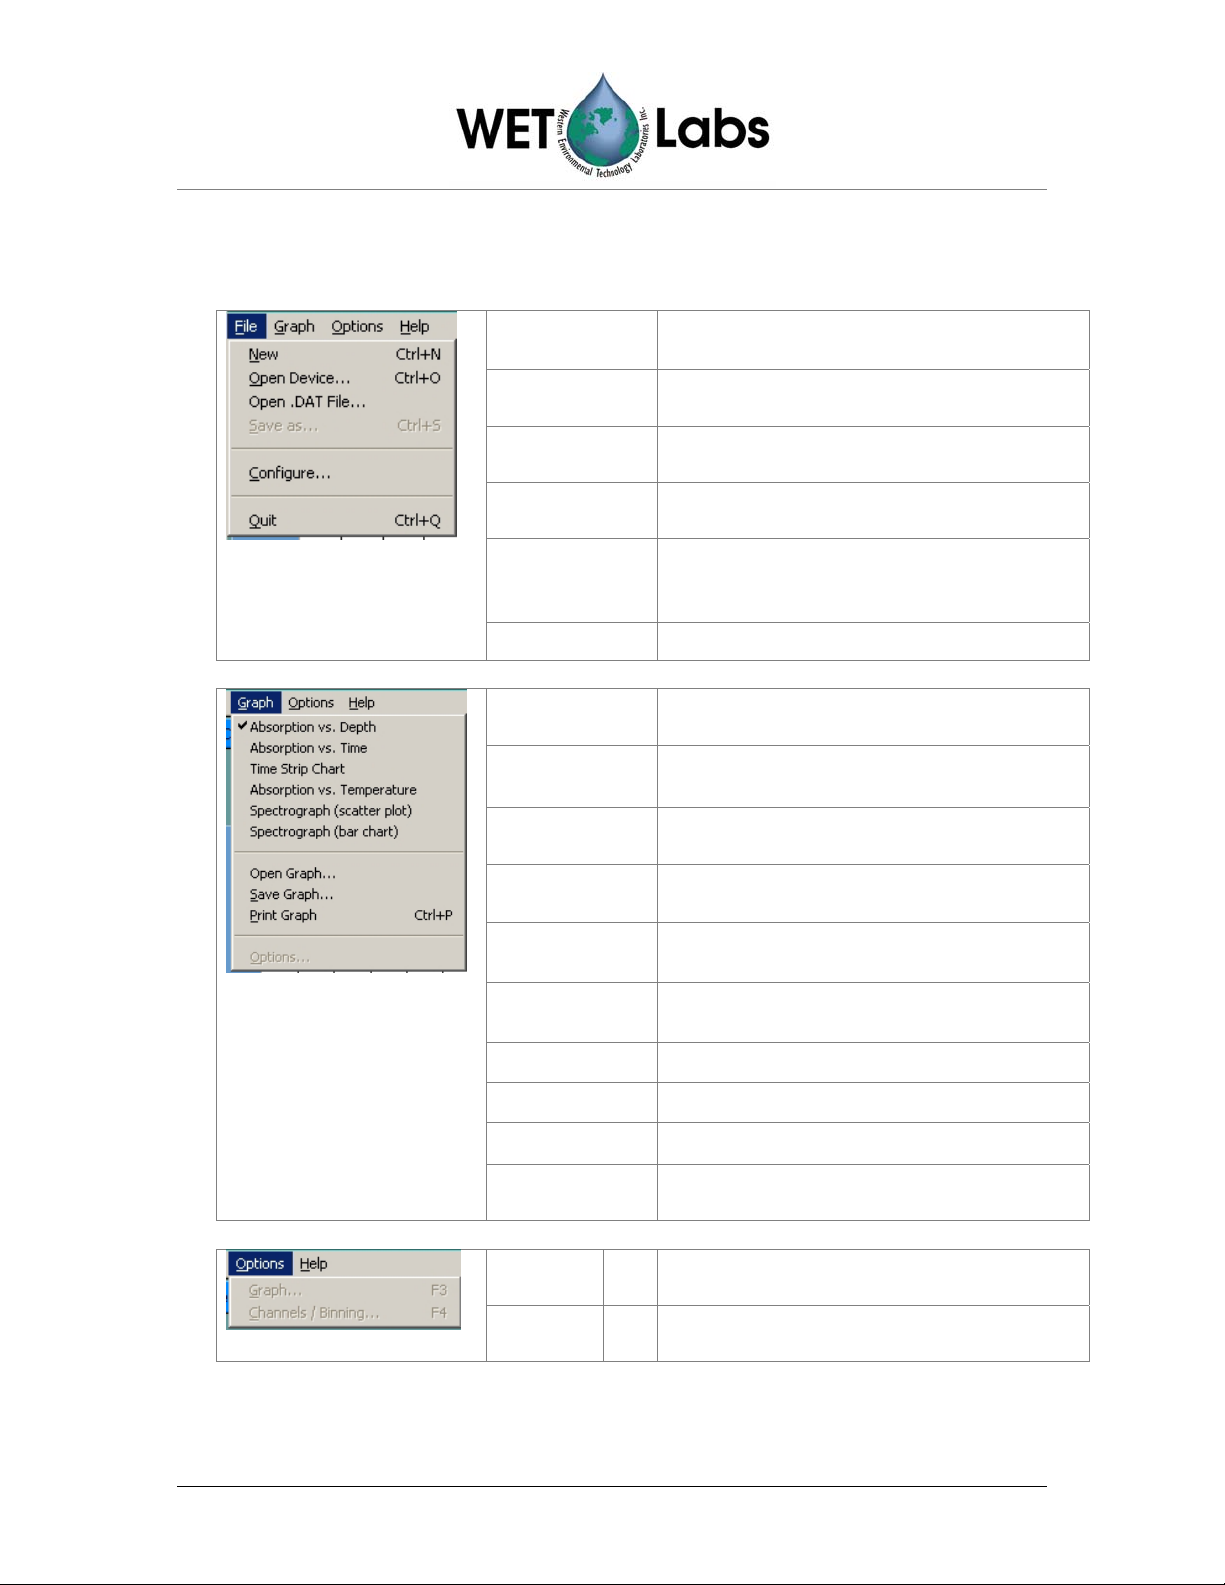
5.1 WETView Menus
New
Open Device
Open .DAT File
Save as
Configure
Quit
Absorption vs.
Depth
Absorption vs.
Time
Time Strip Chart
Absorption vs.
Temperature
Spectrograph
(Scatter plot)
Spectrograph (bar
chart)
Open Graph...
Clears the current graph and disconnects
from the current instrument.
Chooses which type of device to collect
data from.
Opens a previously saved data file for
display.
Saves the most recently acquired data into
a data file.
Allows you to edit the configuration for
an instrument, including the calibration
constants.
Quits the WETView program.
Selects the vertical graph of absorption
versus depth.
Selects the vertical graph of absorption
versus time.
Selects the horizontal strip chart for
display (absorption vs. time).
Selects the vertical graph of absorption
versus temperature.
Selects the scatter plot of
absorption/attenuation vs. wavelength.
Selects the spectrum display of
absorption/attenuation vs. wavelength.
Opens a graph file for viewing.
Save Graph...
Print Graph...
Options...(F3)
Saves the current graph to a file.
Prints the current graph to a printer.
Allows you to configure the scaling of
graphical output.
Graph…
F3
Allows you to configure the scaling of
graphical output.
Channels/
Binning...
F4
Allows you to set the bin size for
sampling and the traces to display.
4 WETView 7.0 User’s Guide (WETView) Revision F 9 February 2004
Page 11

5.2 Opening a Device
Select File/Open Device… to open an instrument for data collection. (You are
opening a device configuration file that describes the device to be used.)
Once you have selected an instrument, you will be asked to identify the source of the
data stream. This can be either a communication port that the device is connected to
or a binary file. (A binary file is created by using a communications program to read a
device’s data from a serial port and write it directly to a file in binary format.) Choose
COM1, COM2, or .RAW File.
Once you have selected the appropriate port(s), WETView attempts to synchronize
with the device on that port. If there is any error in doing this, it will be reported
immediately. Possible errors are:
Port timed
out
Bad format
from source
Once WETView connects to the instrument, it checks to see if the serial number of
the instrument matches the serial number given in the configuration file. If it doesn't
match, you are warned, but can elect to continue.
If the serial numbers do not match, the calibration information stored in the
configuration file probably will not be correct for the instrument, so collected data
WETView timed out trying to read data from the selected port.
Was the correct port selected? Are cables and connections correct?
WETView did receive data from the selected port, but it did not
recognize the data stream. Is the correct device connected to the
selected port? Is it turned on?
Caution
is suspect.
! Software Error: Current version may always display this warning regardless of matching
serial numbers.
5.3 Opening and Saving a Data File
Select File/Open .DAT File… to open a WETView data file for graphing. Choose
the file you want to open. Once the file is open, select Start from the Acquire menu
(or type F1). Possible errors in opening the file:
File not found
Bad file format
WETView 7.0 User’s Guide (WETView) Revision F 9 February 2004 5
The file you named does not exist. Did you type the name
correctly?
WETView did not recognize the format of the file. Did you
select a data file that was created by WETView?
Page 12

Strange error
opening file
WETView ran into an unanticipated error. Did you select a data
file that was created by WETView?
Select File/Save as... to save the most recently acquired data to a text file. By
convention, data files have the extension .DAT, though this is not required.
As WETView collects data, it writes that data to a temporary file called
WETVIEW.TMP. When you request to save the data, the file is renamed to the name
you specify. If you quit WETView without saving the data, the WETVIEW.TMP file
is not deleted, so you can manually rename it if you wish.
Note
Because the temporary file, WETVIEW.TMP, is renamed when you save it, the file
cannot be saved to a disk other than the one that contains the current directory.
5.4 Collecting Data
Press the F1 to Start button to begin acquiring data from the currently opened
device. This item is highlighted only if you have a device open. The function key F1
works as well. As data is acquired, the traces you have selected (via the Options/
Channels/Binning menu) are graphed. Graphing the data points uses memory and
for long collection runs WETView may exhaust all available memory (this is not true
for the Strip Chart graph). If WETView runs out of memory, it erases the graph and
begins graphing from where it left off. All collected data is saved in a file, whether or
not it was erased from the graph.
5.4.1 Changing the Data Collection Options
Select Options/Channels/Binning to select which traces to display and to set the
collection and display bin sizes.
5.4.2 Ending Data Collection, Exiting WETView
Once acquisition begins, an F2 to Stop button is displayed near the top of the
screen. Selecting that button with the mouse, or pressing the F2 key stops data
acquisition. Select Quit to quit the WETView program.
5.5 Graphing Data
Select Graph/Open Graph... to open a previously saved graph file. By convention,
WETView expects graph files to have a .GPH extension.
Select Graph/Save Graph.… to save the current graph to a file. The graph may be
opened later and viewed, rescaled, and printed.
Select Graph/Print Graph.… to print the currently displayed graph.
6 WETView 7.0 User’s Guide (WETView) Revision F 9 February 2004
Page 13

5.5.1 Selecting the Graph to Display
WETView provides four types of graphs:
1. A vertical X-Y graph of absorption versus depth
2. A vertical X-Y graph of absorption versus time
3. A horizontal strip chart of absorption versus time
4. A vertical graph of absorption versus temperature.
There are trade-offs to be considered when choosing which display to use.
The X-Y graphs accurately plot either time and absorption or depth and
absorption, whereas the strip chart accurately plots absorption, but uses a constant
time base. However, the strip chart scrolls continuously as data is collected, so
you can have detailed view of the most recently received data, whereas the X-Y
graph is static. When the data runs off the graph, it is not visible until you stop
data acquisition and rescale the graph. In either case, all data acquired is logged to
the data file.
The absorption versus temperature graph is used for temperature calibration. The
temperature reported is the temperature internal to the instrument, not the ambient
temperature. Also, since the temperature is reported once for each set of ten data
lines, all ten data lines will be plotted at the same temperature. We recommend
setting the collection bin size to a multiple of 10.
5.5.2 Changing Graph Options
Select Graph/Options... to change the appearance of the currently displayed
graph. For X-Y graphs, you may set the X and Y ranges and the number of
divisions for each axis. For strip charts, you may set the Y range and the speed
that the chart scrolls.
WETView 7.0 User’s Guide (WETView) Revision F 9 February 2004 7
Page 14

6. Configuration
The ac-9 measures the absorption and attenuation of 9 different wavelengths of light; the
ac-s measures from 80–90. Configuration is specific to each type of device. Each of the
measured quantities has a calibration offset added to it so that the resulting number is the
difference between a clean water measurement and the measurement in the field. You can
manually set the value of this offset for each channel; however, determining the correct
value to use is not trivial.
Caution
We recommend you change only the instrument description and the color used
for plotting it. Changing the baud rate will most likely cause WETView to be
unable to communicate with the instrument. Changing the calibration constants
will affect the accuracy of your results.
Usually, a “clean water calibration run” is performed. Chemically pure water is run
through the instrument and the values for absorption and attenuation are averaged over a
number of samples. These values are then used as the calibration offsets.
You can change the following settings for the ac-9 meter:
• calibration offsets for absorption measurements
• calibration offset for depth measurement
You can change the following settings for the ac-s meter:
• calibration offsets for absorption/attenuation measurements
To change an instrument’s calibration, a new device file must be collected. The steps
of this process are outlined below.
1. Ensure the instrument is properly connected to a power supply and host computer,
and that WETView is properly loaded and operational. Open the Configuration
screen by selecting File/Configure…. Choose a device file. The window below
(either ac-9 or ac-s) will appear.
8 WETView 7.0 User’s Guide (WETView) Revision F 9 February 2004
Page 15

ac-9 configuration screen
ac-s configuration screen
WETView 7.0 User’s Guide (WETView) Revision F 9 February 2004 9
Page 16

2. The lower left-hand corner of the window has a Channel Calibration box with
control buttons for Zero All and Auto Cal.
• The Zero All button sets all of the calibration offsets to 0.0 so you can collect
the raw (uncorrected) values from the meter. Note that these values are always
temperature-compensated.
• The Auto Cal control collects and averages the new offsets for a device file.
Note the option for number of samples to average. Select the number of
individual samples you wish to average by using this control. The default is 10
samples.
3. Once you have selected the number of samples over which to average, you then
can engage the Auto Cal control. A temporary pop-up window will notify you as
the calibration takes place. After the operation is complete, exit the Configuration
dialog box by pressing OK in the lower right hand corner.
4. When you exit you will be prompted as to whether you want to save the new
offset values.
Caution
Unless you deliberately save a device file the offsets you have collected
will not be permanently stored.
5. You may write over an older device file if you choose, but the program will ask
you if you are sure you want to do this. Otherwise you may write to a new file.
6. Before you can use the new values, reload the newly made device file using
File/Open Device.
10 WETView 7.0 User’s Guide (WETView) Revision F 9 February 2004
Page 17

Appendix A—ac-9 Meter Files
ac-9 Configuration File
Configuration files (with file extension .DEV) give calibration and other information
specific to a particular unit. These files are tab-delimited text files and have the
following format:
Line 1 Device name.
Line 2 Serial number: the serial number of the device that was used to collect the
data.
Line 3 Version number of the following structure. This should be “2.”
Line 4 Reserved for future use.
Line 5 Calibrations for depth meter: there are two values, the first is an offset and
the second is a multiplier.
Line 6 RS-232 baud rate that the instrument uses
Line 7 Optical path length through water (in meters).
Line 8 Number of temperature compensation bins.
Line 9 Several values (the count is given in the preceding line); each value is the
average temperature of the temperature bin.
Line 10–27 Each line describes one channel of the instrument; the first three fields are:
label for identifying the channel
color for plotting
clean water calibration constant (offset)
The rest of the line contains temperature compensation values that
correspond to the temperature bins given in the previous line.
Line 28 Reserved for future use
Line 29 Extra capabilities mask. This is a list of capabilities that the meter may have
in addition to the standard product. Currently, only one such capability
exists: an external temperature sensor. If the first number on this line is non-
zero, the meter supports such a sensor.
ac-9 WETView Data Files
WETView saves data files in tab-delimited format. The file format of WETView files
is described below.
Line 1: Header line. Identifies the version of the program that created the file, and the
time and date of creation.
Lines 2–30: Exactly the same format as the configuration file. These lines contain the
calibration information that was used while collecting the data.
Line 31: Collection bin size. The number of samples that were averaged into each bin
during collection.
Data lines
The rest of the file contains lines of data values. Each line of data starts with a zero-
based time stamp. Times are given in milliseconds. The rest of the fields on the line
WETView 7.0 User’s Guide (WETView) Revision F 9 February 2004 11
Page 18

are the data from the device. The data is given as absorption values, after
referencing, calibration and temperature correction.
Reference lines
A reference line is a data line that has some extra information appended to it.
1. The first number after the data values is the temperature (deg C).
2. The second number is the sample rate (samples per second).
3. The third number is the depth (in meters, if the meter supports depth).
4. The fourth number is the external temperature, if the meter supports it.
5. The rest of the line contains channel reference values.
A full data line with references then looks like:
Time Chan
Chan2 ... Chann Temp Rate Depth ExtTemp Ref1 Ref2 ... Refn
1
The reference values are raw values; no scaling or calibration is applied to them.
These are the values that are used in computing the data values for the following set
of data lines.
There is a possible ambiguity when the collection bin size is greater than one. Since
a bin contains multiple samples, some of the samples in a bin may be computed
with one set of reference values and others computed with a different set. The ac-9
uses one set of references for every ten samples. If the collection bin size is six, the
first bin (six samples) uses the same reference values, but the second bin uses one
set of references for the first four samples and a different set for the last two
samples. This makes deconvoluting to the raw data rather complicated.
If you need to deconvolute to raw data, choose a bin size of 1, 2, 5, 10 or an integer
multiple of ten. This ensures that the reference values given for a bin apply to all
samples in that bin.
Example
For example, given the configuration file:
ac9 Absorption and Attenuation Meter
04000103 ; serial number
2 ; structure version number
Reserved ; reserved for future
5.41000 0.27000 ; depth calibration
19200 ; baud rate
0.10 ; pathlength = 10 cm
a650 Blue 1.20000 23.00000 2.43000
a560 Green 1.13000 23.00000 2.45000
12 WETView 7.0 User’s Guide (WETView) Revision F 9 February 2004
a532 Brown 1.24000 23.00000 2.65000
c712 Red 1.08000 23.00000 2.31000
c676 Magenta 1.41000 23.00000 2.74000
c660 Gray 1.55000 23.00000 2.56000
a488 LtBlue 1.16000 23.00000 2.44000
a456 LtGreen 1.19000 23.00000 2.52000
a412 Yellow 1.33000 23.00000 2.54000
c650 Blue 0.98000 23.00000 2.47000
c560 Green 1.58000 23.00000 2.36000
c532 Brown 1.94000 23.00000 2.51000
a712 Red 1.32000 23.00000 2.57000
Page 19

a676 Magenta 1.74000 23.00000 2.46000
a660 Gray 1.83000 23.00000 2.49000
c488 LtBlue 1.35000 23.00000 2.38000
c456 LtGreen 1.50000 23.00000 2.33000
c412 Yellow 1.11000 23.00000 2.39000
0.0035 0.004 0.015 0.02 0.015 0.02 2500 2000 1000 0.01 0.01 …
0 ; auxiliary capabilities
The data file for an ac-9 begins as:
WetView ver 5.0 06/22/93 08:17:44
ac9 Absorption and Attenuation Meter
04000103 ; serial number
2 ; structure version number
Reserved ; reserved for future
5.41000 0.27000 ; depth calibration
19200 ; baud rate
0.10 ; pathlength = 10 cm
a650 Blue 1.20000 23.00000 2.43000
a560 Green 1.13000 23.00000 2.45000
a532 Brown 1.24000 23.00000 2.65000
c712 Red 1.08000 23.00000 2.31000
c676 Magenta 1.41000 23.00000 2.74000
c660 Gray 1.55000 23.00000 2.56000
a488 LtBlue 1.16000 23.00000 2.44000
a456 LtGreen 1.19000 23.00000 2.52000
a412 Yellow 1.33000 23.00000 2.54000
c650 Blue 0.98000 23.00000 2.47000
c560 Green 1.58000 23.00000 2.36000
c532 Brown 1.94000 23.00000 2.51000
a712 Red 1.32000 23.00000 2.57000
a676 Magenta 1.74000 23.00000 2.46000
a660 Gray 1.83000 23.00000 2.49000
c488 LtBlue 1.35000 23.00000 2.38000
c456 LtGreen 1.50000 23.00000 2.33000
c412 Yellow 1.11000 23.00000 2.39000
0.0035 0.004 0.015 0.02 0.015 0.02 2500 2000 1000 0.01 0.01 …
0 ; auxiliary capabilities
1 ; acquisition binsize
0 1.53275 1.13881 1.31256 0.51315 1.41231 2.51512 ...
160 1.53070 1.13055 1.31583 0.51229 1.41614 2.51415 ...
330 1.53627 1.13536 1.31511 0.51467 1.41151 2.51614 ...
(etc)
The fields for the reference line for the ac-9 are:
field # contents
1 time in milliseconds
2 absorption for 650 nm
3 absorption for 560 nm
4 absorption for 532 nm
5 attenuation for 712 nm
6 attenuation for 676 nm
7 attenuation for 660 nm
8 absorption for 488 nm
9 absorption for 456 nm
10 absorption for 412 nm
11 attenuation for 650 nm
12 attenuation for 560 nm
WETView 7.0 User’s Guide (WETView) Revision F 9 February 2004 13
Page 20

13 attenuation for 532 nm
14 absorption for 712 nm
15 absorption for 676 nm
16 absorption for 660 nm
17 attenuation for 488 nm
18 attenuation for 456 nm
19 attenuation for 412 nm
20 temperature (oC)
21 sample rate (samples per second)
22 depth (meters)
23 reserved
24 reference for a650
25 reference for a560
26 reference for a532
27 reference for c712
28 reference for c676
29 reference for c660
30 reference for a488
31 reference for a456
32 reference for a412
33 reference for c650
34 reference for c560
35 reference for c532
36 reference for a712
37 reference for a676
38 reference for a660
39 reference for c488
40 reference for c456
41 reference for c412
The information in a data line is exactly the same as the first 19 fields of the reference line.
ac-9 Raw Data
Below is one record of raw data that was captured from the device. It has been
converted to hexadecimal, formatted and commented. Note that the two-byte and fourbyte values are byte-reversed. That is, the bytes within a word are read from right to
left. This reflects the way the Intel 386 and 486 processors store values in memory.
00FF00FF registration word
7A02 record length, from this word through checksum
21010000 serial number
0000 status
DB13 sample rate
1600 depth
34FF external temperature
6410 171E 89 2D20 0F 0319 1B … first sample, time and data
7510 171E CB 2C20 EE 0119 A3 … second sample, time and data
8510 161E 84 2E20 0A 0119 F2 … o
9510 131E F1 2920 DE FE18 DF … o
A510 151E 9B 2B20 BC 0119 51 … o
B510 151E 7A 2B20 BA 0119 9A …
14 WETView 7.0 User’s Guide (WETView) Revision F 9 February 2004
Page 21

C510 161E 5D 2C20 99 0019 49 …
D510 141E F5 2B20 85 0019 B1 …
E510 121E 3F 2820 76 FF18 11 …
F610 141E 05 2A20 5E 0019 35 … tenth sample, time and data
7804 C8 B604 C0 A603 66 … 3 references and temperature
9701 temperature
65D00000 checksum (FF00FF00 through refs)
00000000 padding (4 null bytes)
Registration word = 00FF00FF hex
Record length = 7A02 hex = 634 bytes
Serial number = 00000121
This is the thirty-third ac-9 meter produced. Production numbers
begin with 0100 hex.
Status = 0000 Zero indicates normal operation.
Sample rate = 14F9 hex = 5083
This is a count of the time used to take one sample. It is scaled by
0.0000316 to match the hardware’s clock rate, then inverted to give
samples per second:
1 / (5083 * 0.0000316) = 6.226
Depth = 0016 hex = 22
This reflects the voltage read from the depth sensor. It is scaled and
offset by the values from the configuration file.
22 * 0.3 + 5.3 = 11.9 meters
External Temp = 34FF hex
This word is ignored for this meter because the meter does not have
an external temperature probe in it. This is determined by the last line
of the configuration file: the value is zero.
For the purpose of this discussion, we skip to the third-from-last line of the data record.
This is the reference line, and values here will be used in the computation of the
absorption values for each channel.
WETView 7.0 User’s Guide (WETView) Revision F 9 February 2004 15
Page 22

(
−
Reference a610
Temperature = 0F01 hex = 271
Absorption 610 = 171E 89 hex = 8986135
= 7804 C8 hex = 13108344
This is the reference value for the first channel (ab610). This is a 24-bit
value indicating the output from an analog to digital converter. This
represents a fraction of the input voltage. To convert from counts to this
fraction, the value is divided by 2
13108344/16777216 = 0.7813
The temperature is given as a reading from a thermistor. The manufacturer
of the thermistor provides a table correlating the reading (counts) to
temperature. That table fits the polynomial equation given above. Using
407 counts, we get: 10.61831
+ 0.045113 * 271
+ -4891.32 * 1/271
+ 208130.2 * 1/271
2
+ 1171473 * 1/2713 = 7.69 degrees C
This is the signal value for the first channel (a610). This 24-bit value is
converted to raw voltage in the same manner as for reference values.
8986135 / 16777216 = 0.5356 VDC
Raw absorption is computed from the signal and reference values as
described above:
E
sig
−=ln
a
raw
E
ref
Z
The device’s optical path length is read from the configuration file.
0.5356
ln
−
0.7813
a
raw
=
25.0
24
(16777216).
=
1-
meter 1.5103
The temperature correction is then applied using the temperature from the
reference line and the channel’s correction table from the configuration file.
The approximate correction value is linearly interpolated from the table.
First, the correct temperature bin is determined by finding the two bin
temperatures, T
the values, ∆
and T1, that bracket the current temperature. Then, using
0
Tn
and ∆
+∆=∆
, from the table,
Tn+1
)
TT
0
()
()
*
TT
−
01
∆−∆
+1
TnTnTnT
where,
∆
=compensation constant
T
T=current temperature, 7.69
=first bin temperature, 5.5233
T
0
16 WETView 7.0 User’s Guide (WETView) Revision F 9 February 2004
Page 23

(
−
∆
−
+
′
T1=second bin temperature, 8.4553
∆
=first value, 0.1411
Tn
∆
=second value, 0.1028
Tn+1
Using these values,
)
1411.0 =−
T
Subtracting this from the raw absorption,
′
=
=
Finally, adding in the calibration offset for a610,
+=∆
()
aa
1.3976
Traw
0.1127 1.5103
−=
5233.569.7
−
5233.54553.8
()
= Caa
0.1127m 1411.01028.0*
1-
+=
9.0218
=
Checksum = 65D00000 = 53349
The checksum is the sum of all the bytes of the record, beginning with the
registration word and ending with the temperature. For this record, the
checksum is 53349. This is used to verify that the record was received
correctly by WETView.
Padding
= 00000000
These four null bytes separate records. They are ignored. The advantage of
having them is that if a character is lost in transmission, WETView will
read one byte past the end of the corrupted record. If there were no padding
bytes, the first byte of the next record would have been read, corrupting
that record as well. With the padding bytes, however, if a character is lost
in transmission, then WETView will read one byte past the end of the
record, which will be a padding byte, and it can be safely discarded. The
next record will be read correctly.
7.62423976.1
WETView 7.0 User’s Guide (WETView) Revision F 9 February 2004 17
Page 24

Appendix B—ac-s Meter Files
ac-s Configuration File
ac-s configuration files (with file extension .DEV) give calibration and other information
specific to a particular meter. These files are tab-delimited text files and have the following
format:
Line 1 Device name.
Line 2 Serial number. The serial number of the device that was used to collect the data.
Line 3 Version number of the following structure. This should be “3” or greater.
Line 4 Reserved for future use.
Line 5 Calibrations for depth meter: there are two values, the first is an offset and the
second is a multiplier.
Line 6 Serial port baud rate the instrument uses.
Line 7 Optical path length through water (in meters).
Line 8 Number of output wavelengths.
Line 9 Number of temperature compensation bins.
Line 10 Several values (the count is given in the preceding line); each value is the
average temperature for each temperature bin.
Lines
11–varies
(dependent on
value in line 8)
Varies
(dependent on
value in line 8)
Each line describes one wavelength pair of the instrument; the first five fields
are:
label for identifying the c wavelength
label for identifying the a wavelength
color for plotting within WETView
clean water calibration constant for attenuation, c
clean water calibration constant for absorption, a
The rest of the line contains temperature compensation values that correspond
to the temperature bins given in the previous line. The first n values are for c,
the next n values are for a, where n is the number of temperature bins.
Reserved for future use.
18 WETView 7.0 User’s Guide (WETView) Revision F 9 February 2004
Page 25

For example:
ACS Meter
53000002 ; Serial number
3 ; structure version number
Reserved
0 1 ; Depth calibration
115200 ; Baud rate
0.25 ; Path length (meters)
80–90 ; output wavelengths
63 ; number of temperature bins
7.632727 8.171312 8.706667 9.219706 9.727826…
C398.6 A397.5 8 1.691751 -0.80038 0.018293 0.017729 0.017763 0.016839…
C402.2 A400.9 10 1.770073 -0.41443 0.018396 0.018062 0.017715 0.016939…
C405.7 A404.5 11 1.81221 -0.09669 0.018499 0.018026 0.017409 0.016157…
C409.4 A408.2 12 1.82833 0.132231 0.015788 0.015389 0.014772 0.013682…
C413.0 A411.8 13 1.84002 0.285005 0.018766 0.01837 0.018024 0.016658…
C417.0 A415.7 15 1.850093 0.382613 0.016909 0.01643 0.015824 0.015166…
C420.9 A419.6 16 1.856859 0.453001 0.016226 0.015822 0.015416 0.014600…
…
C730.6 A730.7 106 -0.28523 0.017783 0.004847 0.004845 0.004855 0.004802
C734.2 A734.4 107 -0.50568 -0.17825 0.004823 0.004771 0.004818 0.004686
C737.9 A737.9 109 -0.676 -0.32109 0.004798 0.004803 0.004837 0.004833
C741.5 A741.4 110 -0.78822 -0.40855 0.004683 0.004676 0.004701 0.004667
C745.2 A744.9 111 -0.85581 -0.45682 0.004321 0.00431 0.004344 0.004257
C748.8 A748.6 112 -0.89734 -0.47902 0.004134 0.004146 0.004179 0.004176
C752.3 A752.0 114 -0.91907 -0.48634 0.004145 0.004146 0.004201 0.004071
C755.5 A755.5 115 -0.93167 -0.48493 0.003956 0.00395 0.003961 0.003925
0 0 0 000000 0
WETView 7.0 User’s Guide (WETView) Revision F 9 February 2004 19
Page 26

ac-s WETView Data Files
WETView saves data files in tab-delimited format. The file format for data files is as follows:
Line 1 Header line. Identifies the version of the program that created the file,
and the time and date of creation.
Line 2–98 Exactly the same format as the configuration file. These lines contain
the calibration information that was used while collecting the data.
Line 99 Acquisition bin size
Line 100 Wavelength labels
Lines
101–n
Data lines. Each line starts with a zero-based time stamp. Times are in
milliseconds from the time the data collection starts. The first 86
columns are “c” values, followed by the “a” values. then internal
temperature, , , , and.
After the data, there are eight additional columns:
1. instrument temperature (deg C)
4. filter wheel speed diagnostic
5. pressure
6. external temperature
7. four columns of dark values
A data line then looks like:
Time c(λ
), c(λ2),… c(λn), a(λ1), a(λ2), … a(λn) int. temp, diagnostic, pressure, ext. temp, dark, dark, dark, dark
1
Example data file:
WetView
ver 7.0 11/3/03 9:26:13
ACS Meter
53000002 ; serial number
3 ; structure version number
Reserved
0 1 ; Depth calibration
115200 ; Baud rate
0.25 ; Path length (meters)
80–90 ;Output wavelengths
33 ; number of temperature bins
0 ; temperature bins
C399.574 A397.577 8 0.834057 -0.40889 0.012469 0.012711 0.01349…
C403.161 A401.155 10 0.839778 -0.18519 0.012172 0.012505 0.012554…
C406.76 A404.773 11 0.849354 0.051999 0.011779 0.01243 0.012282…
C410.482 A408.416 12 0.855933 0.245707 0.011866 0.012792 0.012571…
20 WETView 7.0 User’s Guide (WETView) Revision F 9 February 2004
Page 27

C414.072 A412.172 13 0.867732 0.384503 0.013137 0.013593 0.01367…
C417.901 A416.138 15 0.881948 0.478344 0.01188 0.012485 0.012429…
C421.964 A420.024 16 0.902806 0.541544 0.012572 0.013131 0.013225…
C426.069 A424.002 17 0.92668 0.586729 0.013561 0.014083 0.01365…
C430.248 A428.324 18 0.944917 0.625062 0.01167 0.012394 0.01234…
C434.416 A432.434 20 0.960641 0.661356 0.012023 0.012732 0.012885…
C438.594 A436.657 21 0.973538 0.695719 0.01173 0.012489 0.012435…
C442.707 A440.827 22 0.986726 0.730411 0.011702 0.012497 0.012462…
C446.933 A445.194 23 0.997492 0.764348 0.011456 0.01212 0.012393…
C451.282 A449.474 LtBlue 1.009458 0.798393 0.012098 0.012729 0.012767…
C455.74 A453.843 26 1.023926 0.831253 0.012313 0.012988 0.013176…
º
º
º
C750.235 A748.13 112 1.201872 2.112206 0.00529 0.006012 0.006551…
C753.62 A751.57 114 1.201639 2.122247 0.005119 0.005896 0.006448…
C756.521 A754.65 115 1.200377 2.132103 0.005052 0.005757 0.006322…
0 0 0 00000 0…
10 ; acquisition binsize …
C399.574 C403.161 C406.76 C410.482 C414.072 C417.901 C421.964 C426.069…
4500 -0.00283 -0.00193 -0.00485 -0.00604 -0.00795 -0.00449 -0.00593 -0.00623…
9500 -0.00425 -0.00287 -0.00725 -0.00765 -0.00751 -0.00633 -0.00714 -0.00646…
14500 -0.00554 -0.00699 -0.00338 -0.00722 -0.00529 -0.0079 -0.00491 -0.00707…
19500 -0.00561 -0.00444 -0.00816 -0.0049 -0.00278 -0.0085 -0.00445 -0.00557…
24500 -0.00364 -0.00055 -0.0018 -0.00276 -0.00429 -0.00345 -0.00506 -0.0055 …
29500 -0.0036 -0.00869 -0.00621 -0.0041 -0.00558 -0.00591 -0.00664 -0.0048…
34500 0.00088 -0.00263 -0.00256 -0.00676 -0.00609 -0.0044 -0.00618 -0.00556…
39500 0.00213 -0.0038 -0.00233 -0.00397 -0.00695 -0.00422 -0.00369 -0.00527…
º
º
º
WETView 7.0 User’s Guide (WETView) Revision F 9 February 2004 21
Page 28

ac-s Raw Data
Below is one record of raw data that was captured from the device. It has been
converted to hexadecimal, formatted and commented.
ff00ff00
02D0
04
01
53
000002
4e1a
01ba
02a1
7ae4
b9d7
01d5
02b0
00071b02
01
56
0405
0363
04f4
0310
0498
20bb
19bf
2c49
2c1c
2243
00
Packet registration
Record length of full packet (not including chksum) = 720
Packet Type 03 and above designates an ac-s meter
unused by ac-s
meter type—53 indicates an ac-s
serial number
sample to sample delta time in 25 µs counts (0.49985 sec)
Reserved
Reserved
raw external temp counts = 26.82 °C
raw internal temp counts = 27.93 °C
Reserved
Reserved
time in milliseconds since power up (465666 = 7.761 mins)
Reserved
Number of output wavelengths = 80–90 decimal (86 in this example)
raw cref1 counts
raw aref1 counts
raw csig1 counts
raw asig1 counts
raw cref2 counts
raw cref86 counts
raw aref86 counts
raw csig86 counts
raw asig86 counts
Checksum
pad byte
22 WETView 7.0 User’s Guide (WETView) Revision F 9 February 2004
Page 29

Registration
= FF00FF00 hex
word
Record
= 02D0 hex = 720 bytes
length
Packet type = 04
Reserved for future use.
Reserved = 01
Meter Type = 53
Serial
Number
= 000002
This is the second ac-s meter produced (production numbers begin with
0000 hex).
Status = 4E1A Sample to sample delta time in 25 us counts (0.49985 sec)
Reserved <2 undefined bytes>
Reserved for future use.
Reserved <2 undefined bytes>
Reserved for future use.
External
Temperature
= 7AE4 hex = 31460
The external temperature is derived from a voltage drop across a
thermistor. The temperature is calculated from a polynomial to convert
counts to temperature.
Internal
Temperature
The polynomial to convert counts to temperature is:
23
×+××
d + counts c counts b + countsa =y
where a = -7.1023317 E-13, b = 7.09341920 E-8, c = -3.87065673 E-3,
and d = 95.8241397
which yields an external temperature of 22.14ºC
= B9D7 hex = 47575
The internal temperature is derived from a voltage drop across a
thermistor. The temperature is calculated from an equation to convert the
thermistor resistance to temperature. The equation for converting the raw
A/D counts to volts is:
volts = (5 × counts / 65535) which yields 3.6297
The volts are then converted to resistance using the equation:
resistance = 10,000×volts/(4.516 – volts) which yields 40,956.7 ohms
The equation to convert resistance to temperature is:
WETView 7.0 User’s Guide (WETView) Revision F 9 February 2004 23
Page 30

=
temp
1
3
×+×+
))(ln()ln(
rescresba
15.273
−
where a = 0.00093135, b = 0.000221631, and c = 0.000000125741
which yields
=
T
1
()
40956ln 40956 ln
++
cba
Cº 91.17 15.2733=−
24 WETView 7.0 User’s Guide (WETView) Revision F 9 February 2004
Page 31

Reserved <4 undefined bytes>
−
Reserved for future use.
Time since
power up
Number of
output
wavelengths
Data,
wavelength 1
= 0071b02 hex = 465666ms = 7.761 minutes
=56 hex = 86
= 0405 0363 04f4 0310 hex = 1029 867 1268 784
This is the data read for the first wavelength: c reference, a reference c,
and a channels, respectively. Raw absorption is computed from the signal
and reference values as described above:
E
sig
−=ln
a
raw
Which yields a
c
= -ln(1268/1029)/0.25 = -0.835 m-1.
raw
E
ref
Z
= –ln(784/867)/0.25 = 0.402 m-1 and
raw
The channel's calibration constant and the device's optical path length
are read from the configuration file.
The temperature correction is then applied using the internal temperature
and the channel's correction table from the configuration file. The
approximate correction value is linearly interpolated from the table.
First, the correct temperature bin is determined by finding the two bin
temperatures, T
using the values, ∆
and T1, that bracket the current temperature. Then,
0
and ∆
Tn
, from the table,
Tn+1
()
TT
0
vK
T
+=
0
()
−
()
* vv
−
TT
01
01
where,
∆
= compensation constant
T
T = current temperature, 27.93
= first bin temperature, 27.75
T
0
= second bin temperature, 28.2625
T
1
∆
= first value, 0.010124
Tn
∆
= second value, 0.015096
Tn+1
Using these values,
∆
= 0.010124+(27.93-27.75)/(28.2625-27.75) * (0.015096-
T
0.010124)
= 0.012
WETView 7.0 User’s Guide (WETView) Revision F 9 February 2004 25
Page 32

Subtracting this from the raw absorption,
a’ = 0.402 – 0.012 = 0.039
Finally, adding in the calibration offset for a397.5,
a = a’ + C = 0.039 -0.431 = -0.392
Checksum = 2243 = 8771
The checksum is the sum of all the bytes of the record, beginning with
the registration word and ending with the byte just before this checksum.
For this record, the checksum is 8771. This is used to verify that the
record was received correctly by WETView.
26 WETView 7.0 User’s Guide (WETView) Revision F 9 February 2004
Page 33

Revision History
Revision Date Revision Description Originator
A 02/08/00 Begin revision control H. Van Zee
B 04/12/00 Correct calibration offset for ac-9 (DCR 20) C. de Lespinasse
C 05/23/00 Correct data and device files for HiStar (DCR 31) D. Hankins, H. Van Zee
D 07/12/00 Correct equation on temperature correction
algorithm (DCR 47)
E 4/12/01 Delete references to three-spectrometer HiStar
(DCR 102)
E1 2/4/04 Update to include ac-s, delete HiStar references B. Rhoades
F 2/9/04 Approved revisons in E1 (DCR 359) D. Hankins, B. Rhoades
C. de Lespinasse
D. Hankins
WETView 7.0 User’s Guide (WETView) Revision F 9 February 2004
 Loading...