

Page 1
DataVU 7 - Operating Manual
59484
Page 2
Menu structure of the paperless recorder
v Chapter 8 "Device Manager"
v Chapter 7 "Memory Manager"
v Chapter 6 "Alarm and Event Lists"
v Chapter 4 "Visualization"
v Chapter 5 "Memory Presentation (History)"
Page 3

Contents
1 Introduction 9
1.1 Preface ........................................................................................................ 9
1.2 Arrangement of the Documentation ...................................................... 10
1.3 Typographical Conventions .................................................................... 12
2 Instrument Description 15
2.1 Displays and Controls ............................................................................. 17
2.2 Analog Inputs ........................................................................................... 20
2.3 Binary Inputs/Outputs ............................................................................. 21
2.4 Relay Outputs ........................................................................................... 22
2.5 Counter/Integrators ................................................................................. 22
2.5.1 Counter ...................................................................................................... 23
2.5.2 Integrators .................................................................................................. 23
2.5.3 Operating time counter .............................................................................. 24
2.5.4 High-speed counters ................................................................................. 24
2.5.5 Flow rate quantity ...................................................................................... 24
2.5.6 Recording period of the counts ................................................................. 25
2.5.7 Reset counters ........................................................................................... 26
2.5.8 Response to setting the time ..................................................................... 26
2.5.9 Response to instrument reconfiguration .................................................... 27
2.5.10 Response to reconfiguration of the counters on the instrument ............... 27
2.5.11 Response to reconfiguration of counters with setup program .................. 27
2.6 Math/Logic Module .................................................................................. 28
2.7 Binary Signals ........................................................................................... 31
2.8 Operating Modes ..................................................................................... 34
2.8.1 Normal, Timed, and Event Mode ............................................................... 34
2.8.2 Eco mode ................................................................................................... 35
2.9 Data Storage ............................................................................................ 37
2.10 Reading out Data ..................................................................................... 39
2.11 Archiving and Evaluating Data ................................................................
40
3 Operating Principle 43
3.1 Operating Principle and Graphic Elements ........................................... 43
3.2 Operating Example .................................................................................. 48
Page 4

Contents
3.3 Group and Plant Management (Batches) ............................................... 50
4 Visualization 53
4.1 Activating the Operator Level ................................................................. 53
4.2 Overview of Header Lines ....................................................................... 54
4.3 Curve Presentation .................................................................................. 55
4.4 Bar Graph Presentation ........................................................................... 56
4.5 Text Picture Presentation ........................................................................ 57
4.6 Process Image Presentation ................................................................... 58
4.7 Binary diagram presentation .................................................................. 58
4.8 Reports ..................................................................................................... 59
4.9 Batches/Plants ......................................................................................... 60
4.9.1 Current Batches ......................................................................................... 60
4.9.2 Completed Batches ................................................................................... 62
4.9.3 Batch Control with Barcode Reader .......................................................... 63
4.10 Counters and Integrators ........................................................................ 66
4.11 Comment Entry ........................................................................................ 67
5 Memory Presentation (History) 69
6 Alarm and Event Lists 73
6.1 Call from One of the Visualization Modes ............................................. 74
6.2 Call from the Memory Presentation ....................................................... 76
6.3 Symbols .................................................................................................... 76
7 Memory Manager 77
8 Device Manager 81
8.1 Close Device Manager ............................................................................ 82
8.2 Log-in and Log-out .................................................................................. 82
8.3 Device information ................................................................................... 84
8.4 Device Audit Trail ..................................................................................... 89
Page 5

Contents
8.5 Configuration ............................................................................................ 90
8.6 Parameterization ...................................................................................... 90
8.7 Service ...................................................................................................... 91
9 Parameterization 93
9.1 Fine calibration ......................................................................................... 94
9.2 Counters/integrators ............................................................................... 94
9.3 Date and time ........................................................................................... 94
9.4 Batches/plants ......................................................................................... 95
10 Configuration - General 97
11 Configuration - Device Data 99
12 Configuration - Screen 101
12.1 Brightness … Show text image ........................................................... 101
12.2 Show process image … Bar code -> current batch ........................... 102
13 Configuration - Analog Inputs 105
13.1 Sensor … Offset ..................................................................................... 105
13.2 Filter Constant … Unit ........................................................................... 106
13.3 Comma format … Alarm Configuration ............................................... 108
13.4 Alarm configuration ............................................................................... 109
13.4.1 Status … Alarm text 2 .............................................................................. 109
13.4.2 Alarm rejection ......................................................................................... 110
14 Configuration - Binary Inputs/Outputs 111
14.1 Function … Alarm Configuration .......................................................... 111
14.2 Alarm Configuration .............................................................................. 112
15 Configuration - Relay 115
Page 6

Contents
16 Configuration - External Analog Inputs 117
16.1 Range Start … Alarm Configuration .................................................... 117
16.2 Alarm configuration ............................................................................... 118
16.2.1 Status … Alarm text 2 .............................................................................. 118
16.2.2 Alarm rejection ......................................................................................... 120
17 Configuration - External Binary Inputs 121
17.1 Channel Name … Alarm Configuration ................................................ 121
17.2 Alarm Configuration .............................................................................. 122
18 Configuration - Groups 125
18.1 Parameter ............................................................................................... 126
18.2 Analog Channels .................................................................................... 127
18.3 Binary Channels ..................................................................................... 130
18.4 Counters/Integrators ............................................................................. 130
18.5 Diagram View ......................................................................................... 131
18.6 Normal Operation .................................................................................. 133
18.7 Event Mode ............................................................................................. 135
18.8 Timed Mode ............................................................................................ 136
19 Configuration Report 137
19.1 Total … Period ........................................................................................ 137
19.2 External … Out of range ........................................................................ 139
20 Configuration - Limit Monitoring 141
20.1 Function … Alarm Configuration .......................................................... 141
20.2 Alarm Configuration .............................................................................. 143
21 Configuration - Counters/Integrators 145
21.1 General Setting ...................................................................................... 145
21.2 Function … Specific Setting ................................................................. 147
21.3 Input Signal … Decimal Place ............................................................... 149
Page 7

Contents
21.4 Range Start … Alarm Configuration .................................................... 151
21.5 Alarm Configuration .............................................................................. 152
22 Configuration - Interface 155
22.1 Ethernet .................................................................................................. 156
22.2 RS232/RS485 .......................................................................................... 158
22.2.1 General .................................................................................................... 158
22.2.2 Modbus master ........................................................................................ 159
22.3 RS232 for Barcode Reader ................................................................... 161
23 Configuration – Batches/Plants 163
23.1 General Information on Batches .......................................................... 163
23.2 General Plant Parameters ..................................................................... 165
23.3 Plant 1 — 3 .............................................................................................. 166
23.3.1 General .................................................................................................... 166
23.3.2 Lines 1—10 .............................................................................................. 168
23.4 Final Remarks ........................................................................................ 171
24 Configuration - Date and Time 173
24.1 Time Synch. … Daylight Saving Time .................................................. 173
24.2 Start Daylight Saving ............................................................................. 175
24.3 End Daylight Saving ............................................................................... 176
25 Configuration - Undocumented Parameters 177
26 Entering text and values 179
26.1 Text entry ................................................................................................ 179
26.1.1 Entering characters .................................................................................. 179
26.1.2 Insert spaces ........................................................................................... 181
26.1.3 Delete character ....................................................................................... 181
26.1.4 Move cursor ............................................................................................. 181
26.1.5 Enter text from text list ............................................................................. 181
26.1.6 Finish entry .............................................................................................. 181
26.1.7 Reject entry .............................................................................................. 182
26.2 Entry via selection field ......................................................................... 182
Page 8

Contents
26.3 Entering values ....................................................................................... 183
26.3.1 Whole numbers (integers) ........................................................................ 183
26.3.2 Real numbers (floating point) ................................................................... 184
27 Web server 185
27.1 General .................................................................................................... 185
27.2 Online Visualization (All Visualizations Except Batches) .................... 188
27.3 Three freely programmable HTML pages ............................................ 190
27.4 Online Visualization of Current Batch Reports ................................... 191
27.5 4-Way View ............................................................................................. 192
28 Appendix 195
28.1 Bar code ................................................................................................. 195
28.1.1 Batch control ........................................................................................... 195
28.1.2 Batch texts ............................................................................................... 196
29 Index 199
Page 9

1.1 Preface
E
B
1 Introduction
Please read this manual before commissioning the instrument. Keep the
instructions in a place which is accessible to all users at all times.
Please assist us in improving these instructions where necessary.
Your comments will be appreciated.
If any difficulties should arise during commissioning, you are asked
not to carry out any manipulations that could endanger your rights
under the instrument warranty!
Please contact the nearest subsidiary or the head office in such a
case.
When returning modules, assemblies or components, the
regulations of EN 61340-5-1 and EN 61340-5-2 “Protection of
electronic devices from electrostatic phenomena” must be
observed. Use only the appropriate ESD packaging for transport.
Please note that we cannot accept any liability for damage caused
by ESD.
ESD = Electro Static Discharge
9
Page 10

1 Introduction
1.2 Arrangement of the Documentation
The documentation for this instrument is addressed to equipment
manufacturers (OEMs) and users with appropriate technical expertise. It
consists of the following parts:
Instrument documentation in printed form
59486 Operating instructions
The operating instructions are an extract from the operating manual and cover
the basic operation of the paperless recorder.
59488/59490 Installation instructions
The installation instructions describe the installation of the recorder and the
connection of the supply and signal cables. The instructions also contain a list
of the technical data.
59488 Installation instructions for recorder with zinc die-cast panel
59490 Installation instructions for recorder with stainless steel panel
Instrument documentation in the form of PDF files
The “Instrument documentation in the form of PDF files” is on the CD that is
included in the delivery.
59484 Operating manual
It contains information about commissioning, operation and parameterization
on the instrument, as well as about the setup program (available as an option).
59486 Operating instructions
The operating instructions are an extract from the operating manual and cover
the basic operation of the paperless recorder.
59494 Interface description (serial interfaces)
This provides information on communication (RS 232/RS 485) with
supervisory systems.
Interface description (Ethernet interface)
This provides information on the connection of a paperless recorder to a
company-internal network. This description is integrated into 59494.
59496 Interface description (PROFIBUS-DP interface)
10
This provides information on the connection of a paperless recorder to a
PROFIBUS-DP system.
Page 11

59488/59490 Installation instructions
The installation instructions describe the installation of the recorder and the
connection of the supply and signal cables. The instructions also contain a list
of the technical data.
59488 Installation instructions for recorder with zinc die-cast panel
59490 Installation instructions for recorder with stainless steel panel
59492 Setup program
These instructions describe the functions of the setup program. The setup
program is available as an accessory.
1 Introduction
DS-DV7-1-EN1202
59498 PC evaluation software PCA3000
59500 PCA communications software PCC
Data sheet
The data sheet contains general information, the order details and, technical
data.
The operating manual describes the operation and the features of the PC
evaluation software.
The PC evaluation software serves to visualize and evaluate process data
(measurement data, batch data, messages ...). The process data can be read
in via the CompactFlash memory card, or made available through the PCC
software.
The operating manual describes the operation and features of the PCA
Communications software.
The PCA Communications software is responsible for the data transfer from
the paperless recorder to a PC, or across a network.
11
Page 12

1 Introduction
V
E
1.3 Typographical Conventions
Warning signs
The signs for Danger and Caution are used in this manual under the following
conditions:
Danger
This symbol is used when there may be danger to personnel if the
instructions are ignored or not followed correctly!
Warning
This symbol is used when there may be damage to equipment or data if the
instructions are ignored or not followed correctly!
Warning
This symbol is used where special care is required when handling
components liable to damage through electrostatic discharge.
Note signs
1
abc
h
Note
This symbol is used when your special attention is drawn to a remark.
Reference
This symbol refers to further information in other manuals, chapters or
sections.
Footnote
Footnotes are remarks that refer to specific points in the text. Footnotes
consist of two parts:
A marker in the text, and the footnote text.
The markers in the text are arranged as continuous superscript numbers.
Action instruction
This symbol indicates that an action to be performed is described.
The individual steps are marked by this asterisk, e.g.
h Rotate control knob
h Press control knob
12
Page 13

Presentation modes
Screen texts
1 Introduction
Program
manager
Edit
Device data
Texts that are displayed in the setup program are indicated by italic script.
Menu items
Menu items in the setup and instrument software referred to in this operating
manual are shown in italics. Menu name, menu item and submenu item are
separated from each other by “
”.
13
Page 14

1 Introduction
14
Page 15
2 Instrument Description
Setup program
PC Eval. software (PCA3000)
PCA Communications software
Software
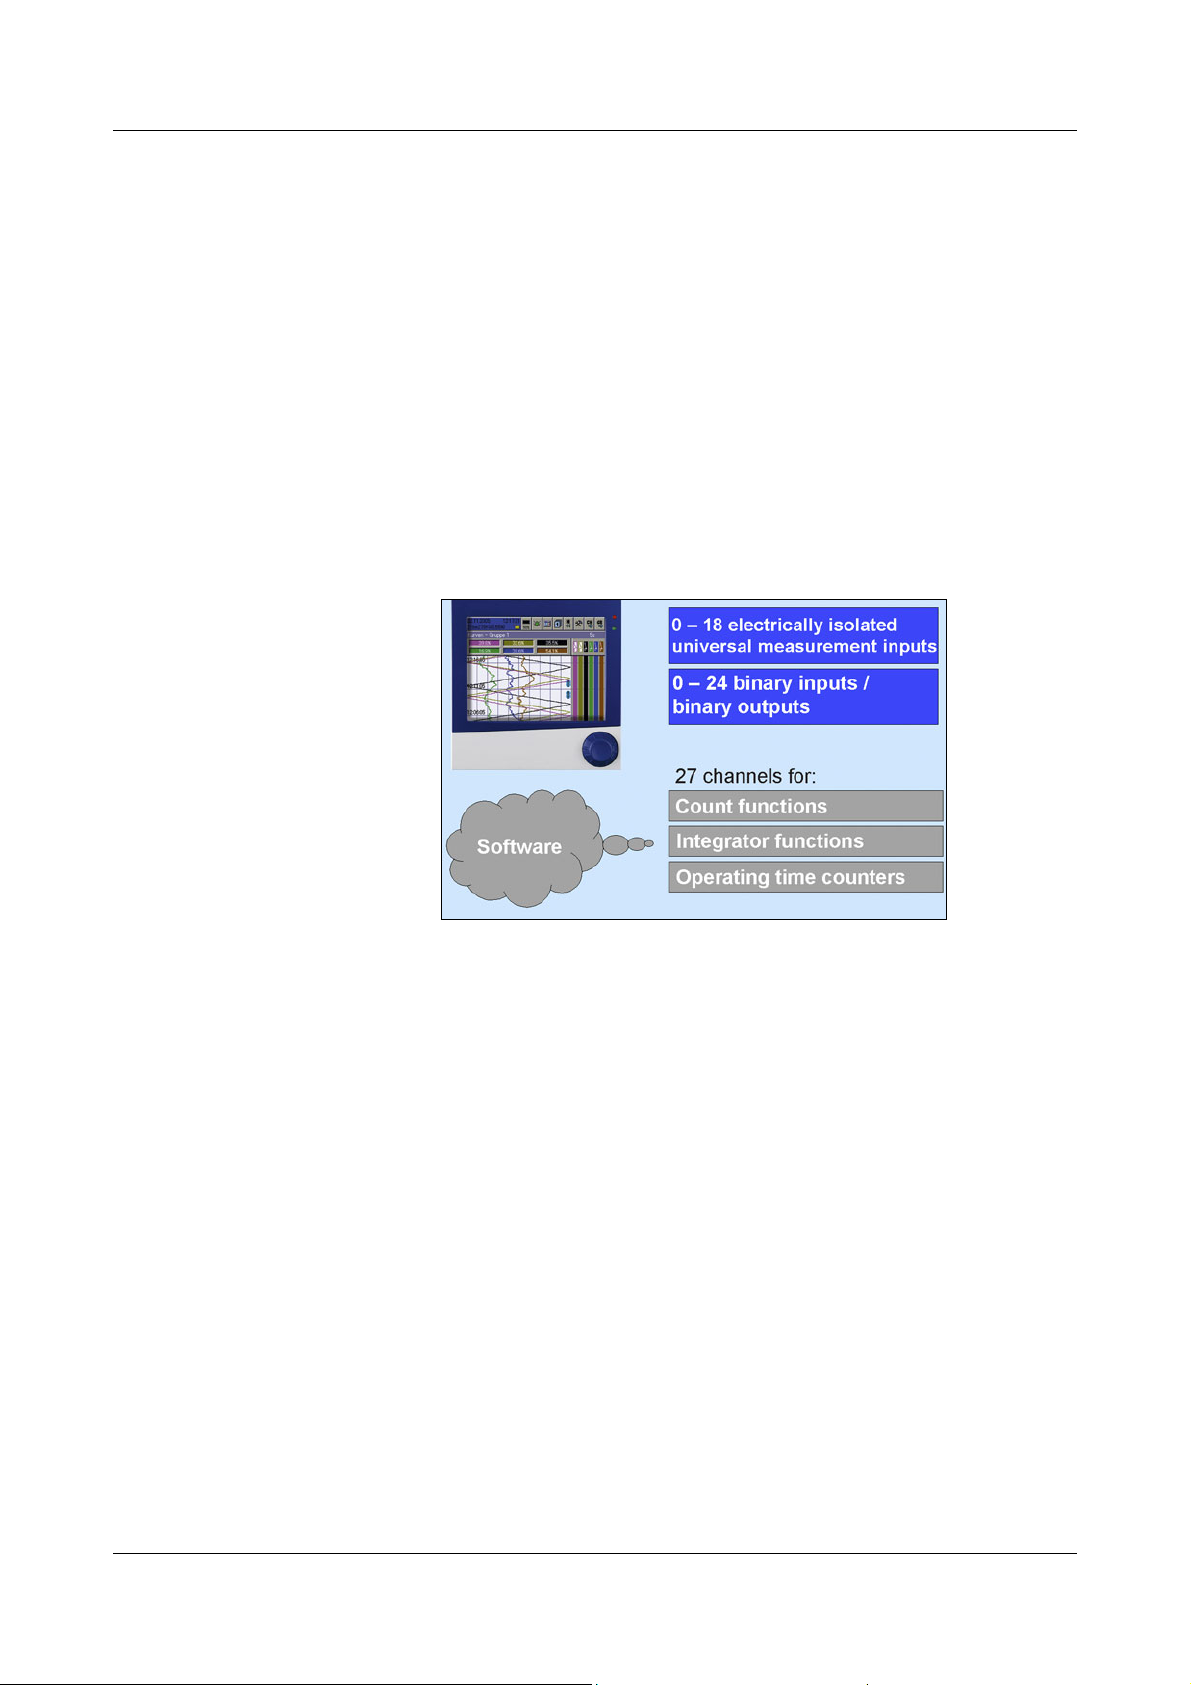
Internal channels
18x math channels
18x logic channels
27x counters / integrators
Inputs/outputs
0…18 analog inputs max.
0…24 binary inputs/outputs max.
(maximum of 3 module slots,
can be fitted with 6 analog inputs
or 3 analog inputs
and 8 binary inputs/outputs)
Display/operation
Power supply
Display
Operation
5.5" TFT color display,
320 x 240 pixels,
256 colors
control knob or touchpad
(left, right, press)
additionally
up to 24 analog inputs and
up to 24 binary inputs
Inputs via interface
1 relay (standard)
additionally
6 relays (option)
Relay outputs
AC 100...240V +10/-15%,
48...63Hz
AC/DC 20...30V, 48...63Hz
Interface
as standard
1x RS232/RS485
option
1x PROFIBUS-DP
1x Ethernet 10/100 Mbits/sec
4x USB interfaces
1x RS232 (barcode reader)
internal memory
256 Mbytes
external memory
CompactFlash card and
USB memory stick
Meas. data memory
Partlow V7
The connection diagram is described in the Installation
Instructions 59488/59490. When the paperless recorder is
delivered, a printed version of the installation instructions is
included.
59488 Installation instructions for recorder
59490 Installation instructions for recorder
with zinc die-cast panel
with stainless steel panel
15
Page 16
2 Instrument Description
Device
features
Front panel Zinc die-cast with lid Stainless steel
(enclosed)
Interfaces
locatesd on
front panel
External memory CF-card located on front
Operation Control knob Touchpad
Interfaces
located on
device‘s rear
Special features Tested acc. to KTA 3505
2x USB None
None
panel, maximum 4 GB
2x USB,
1x RS232/RS485,
1x RS232,
1x Ethernet,
1x PROFIBUS-DP (option)
2x USB,
1x RS232/RS485,
1x RS232,
1x Ethernet,
1x PROFIBUS-DP (option)
16
Page 17
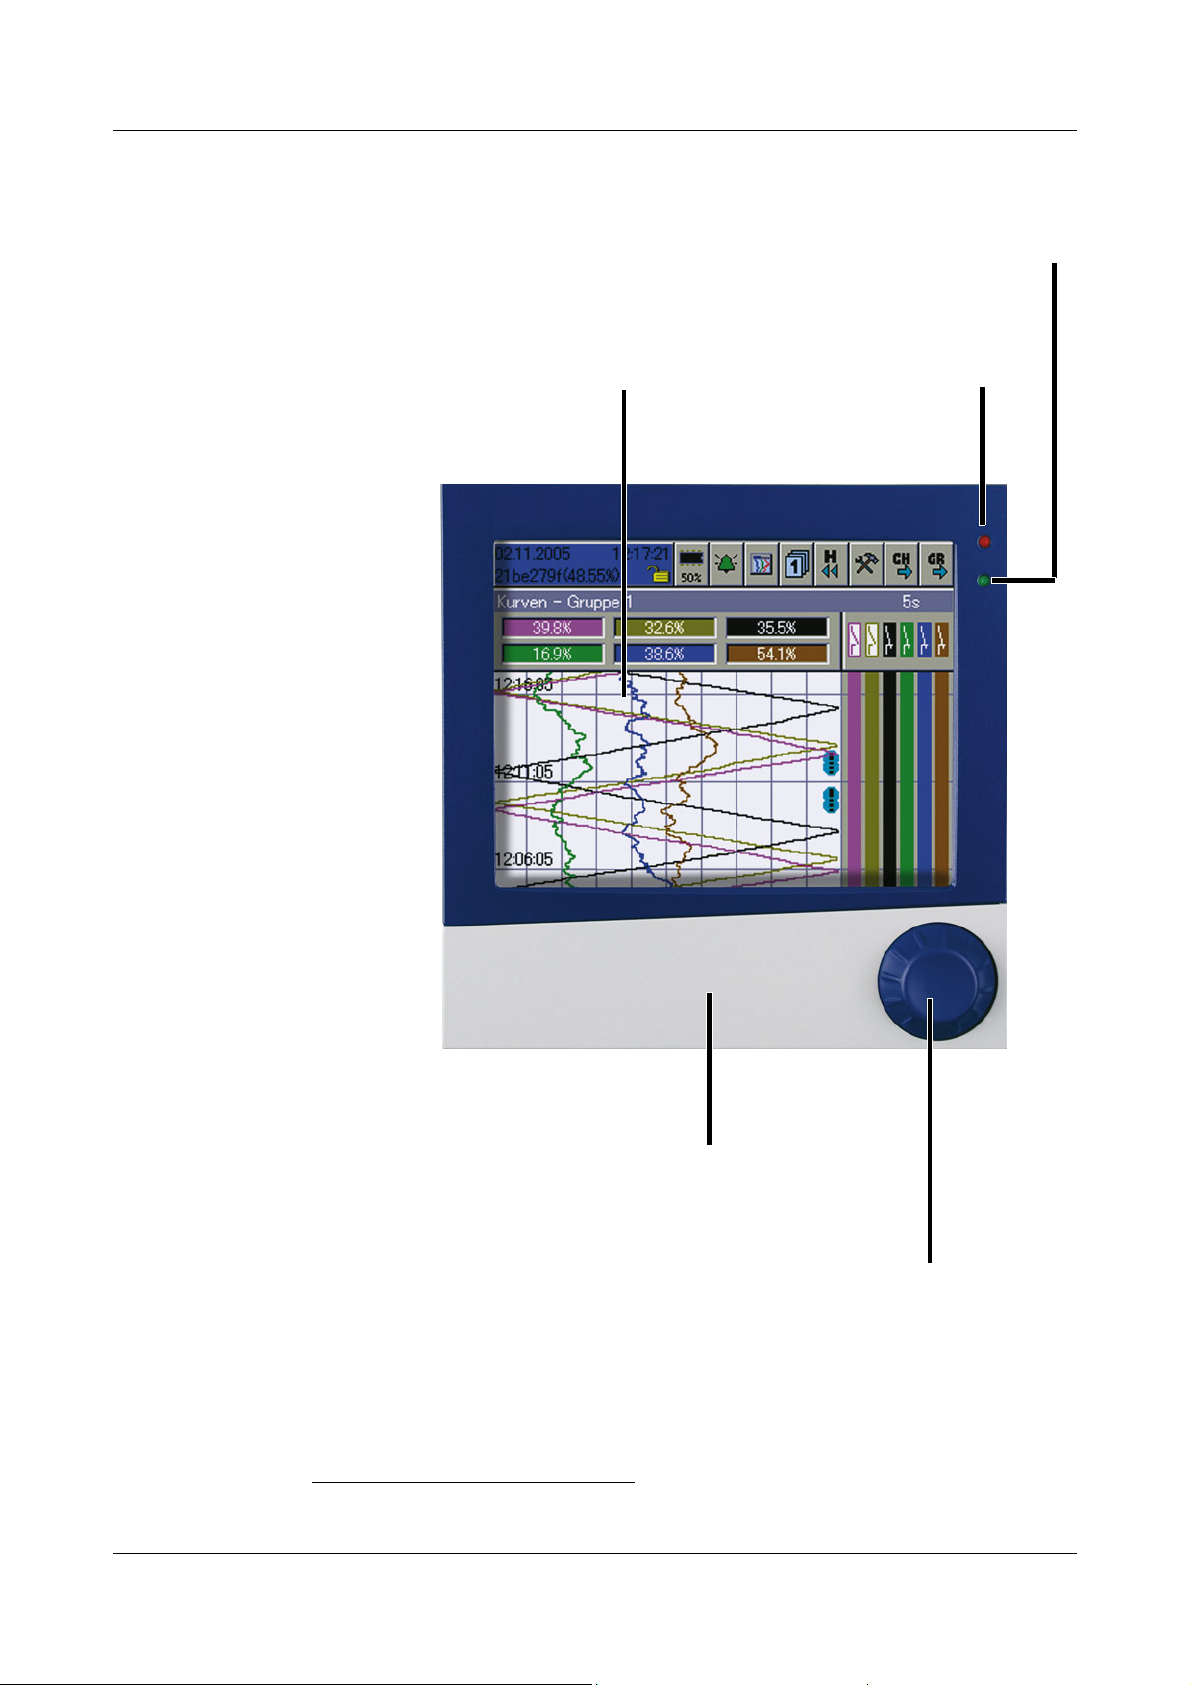
2.1 Displays and Controls
Power LED (green)
is on continuously as soon as power is applied.
Status LED (red)
is on continuously
if an alarm is present.
Cover
for the CompactFlash
®
slot
1
and the setup plug connection
Control knob
The control knob is used to configure and operate the
paperless recorder. It can be rotated in both clockwise
and anti-clockwise directions, and pressed.
TFT color display
320 x 240 pixels, 256 colors
Recorder with
zinc die-cast
panel
2 Instrument Description
1.
CompactFlash® is a registered trademark of the SanDisk Corporation.
17
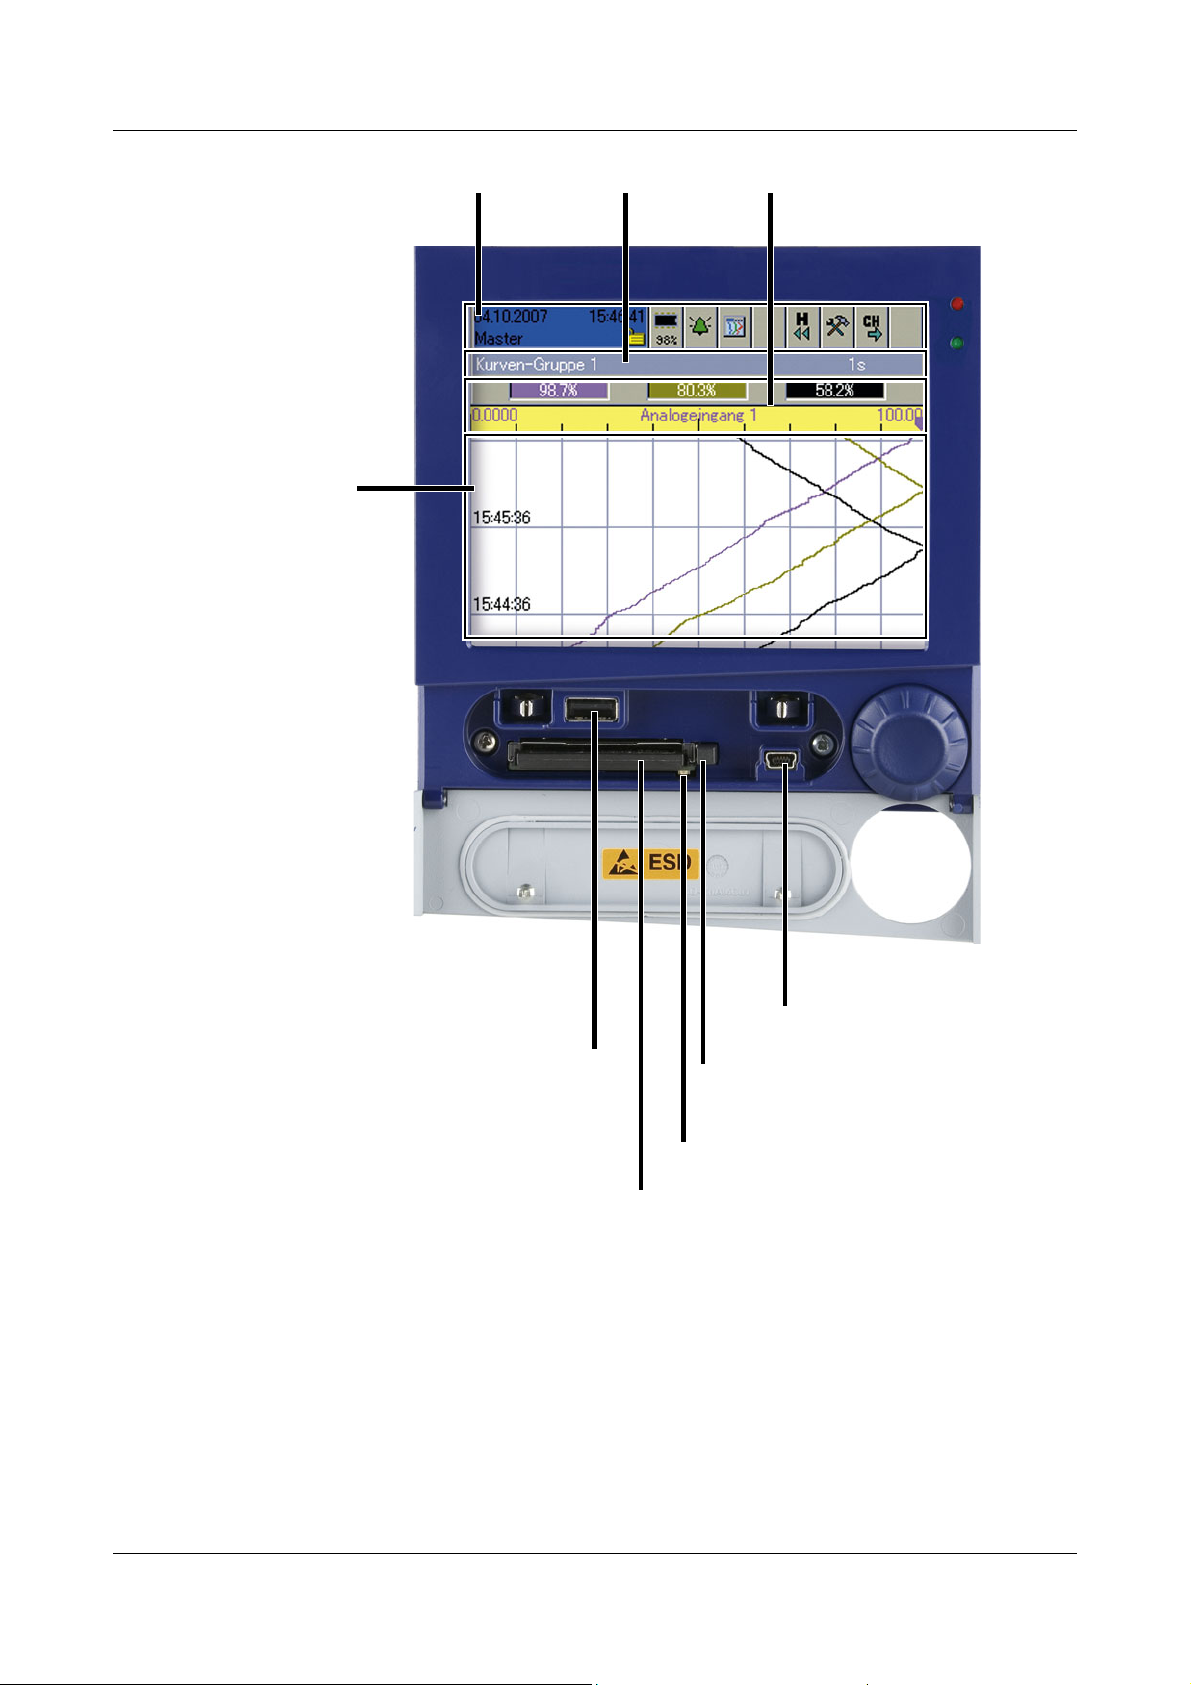
Page 18
2 Instrument Description
USB host
for data exchange
(measurement data,
configuration data,
user lists) between the
recorder and the PC
USB device
for communication with the
setup program or PCC
Header Status &
title bar
Ejector for the CompactFlash
memory card
Numerical
measurement display
Visualization window
(diagram)
CompactFlash slot
for data exchange
(measurement data, configuration
data, user lists) between the
recorder and the PC
Signal LED
Light is on during access to the
CompactFlash memory card.
Recorder with
zinc die-cast
panel
18
A
H
The CompactFlash memory card must not be removed during
access (signal LED is on).
The USB interfaces are not designed for continuous use.
The life of the background illumination can be prolonged by
using the parameter “Screen off”.
Page 19
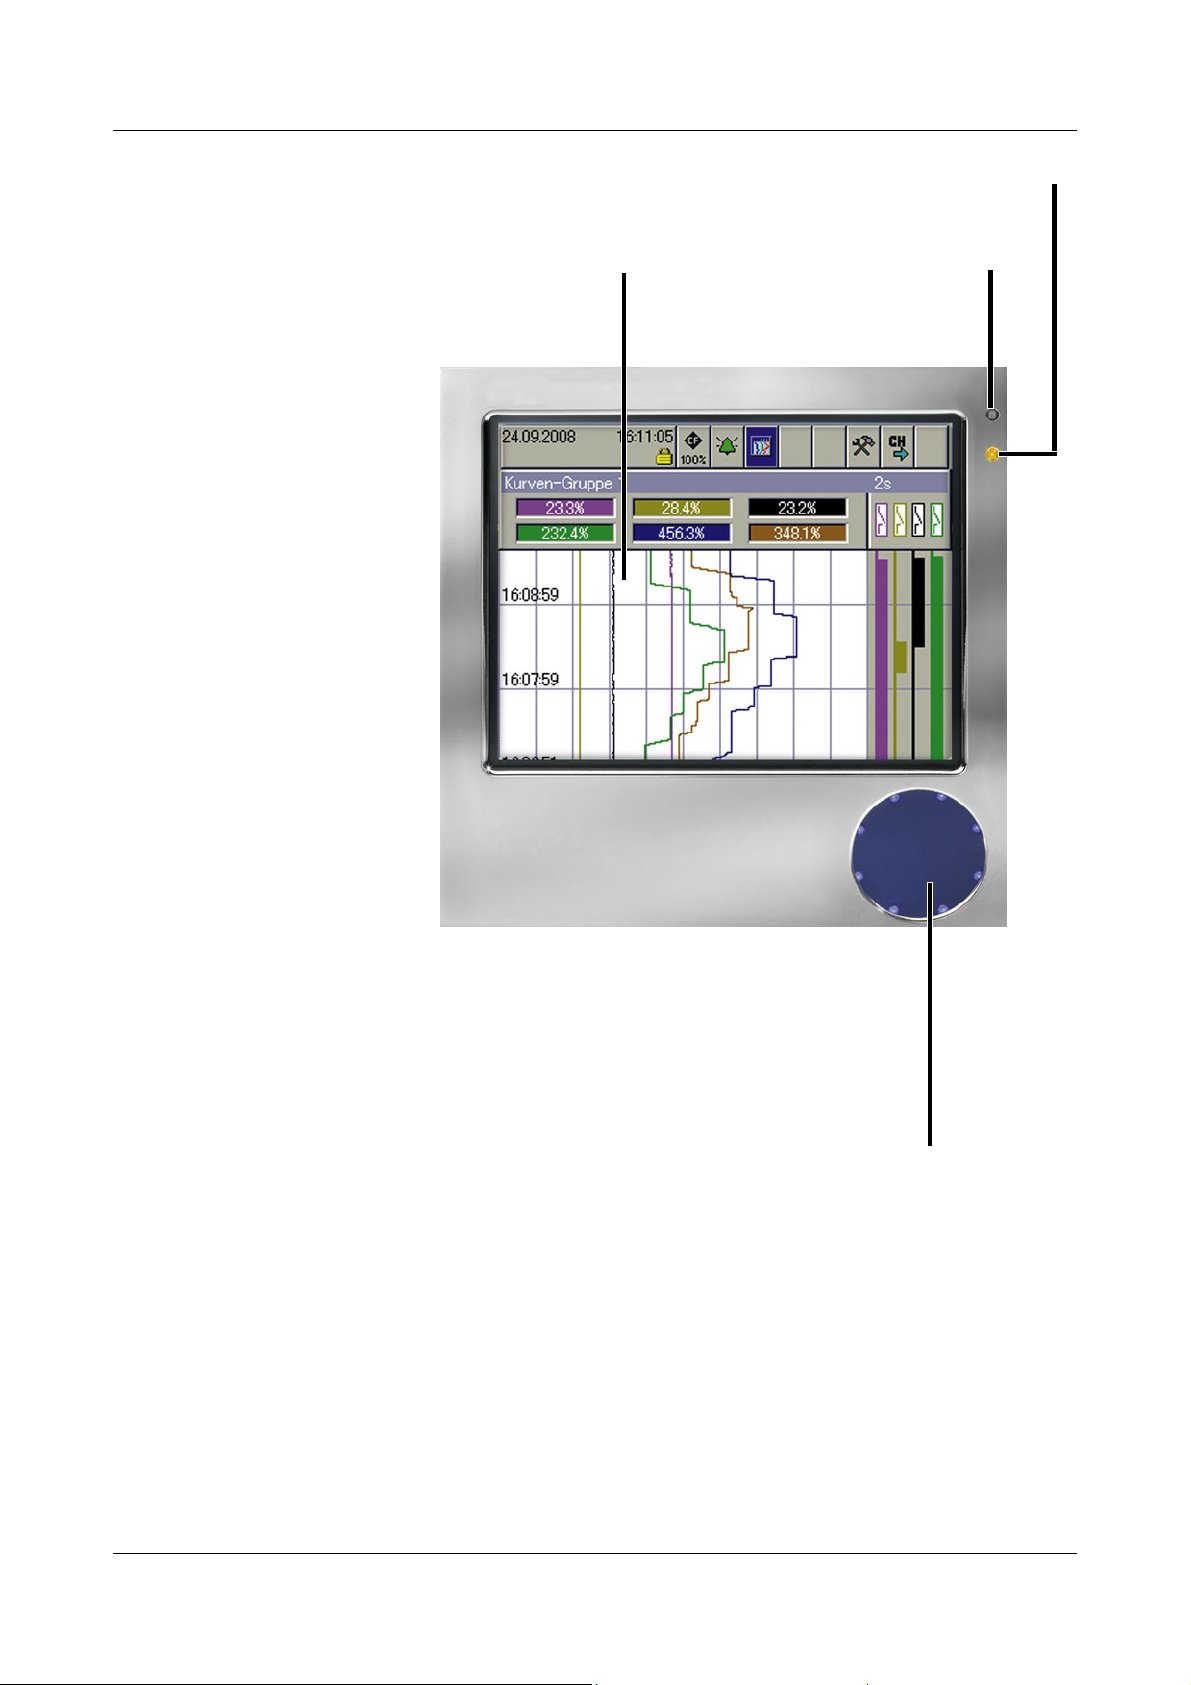
Recorder with
Power LED (green)
is on continuously as soon as power is applied.
Status LED (red)
is on continuously
if an alarm is present.
To uc h pa d
The touchpad is used to configure and operate the
recorder. A circular motion with a finger at the outer
edge has the same effect as the turning of the con-
trol knob. Tapping the middle of the touchpad has
the same effect as when the control knob is pressed.
TFT color display
320 x 240 pixels, 256 colors
stainless steel
panel
2 Instrument Description
All descriptions of the control knob in this operating manual also apply to the
touchpad.
For recorders with a stainless steel panel (extra code) the Com-
A
pactFlash memory card is not available as external memory. The
measured data can be saved through one of the interfaces or
through a USB flash drive (on the rear side).
No interfaces at the front panel are available.
The installation instructions from 59490 are to be heeded and
complied with.
19
Page 20

2 Instrument Description
2.2 Analog Inputs
Internal
analog inputs
External
analog inputs
The paperless recorder can be equipped with 0 to 18 analog inputs. During
configuration, they are designated Analog input 1 — 18.
There are two ways of finding out the exact number of analog inputs that have
been integrated:
- Check the type code on the nameplate against the type designation. Please
refer to the Installation Instructions 59488 for an explanation of the
nameplate and type designation.
- Read the information on the instrument, in the menu Device manager
Device info Hardw.
In addition to the internal analog inputs, external analog inputs can also be
connected to the recorder.
External analog inputs can be connected to the recorder via three different
interfaces. When configuring the external analog inputs, these are designated
External analog input 1 — 24.
Serial interface RS232/RS485 (Modbus)
The measured values of the external inputs can be transmitted to the recorder
via these two serial interfaces. The paperless recorder can be operated either
as a Modbus slave or as a Modbus master.
Further information on using the serial interface can be found in the Interface
Description 59494.
Ethernet interface
Further information on using the serial interface can be found in the Interface
Description 59494.
PROFIBUS-DP
This requires the extra code PROFIBUS-DP interface.
Further information on using the PROFIBUS-DP interface can be found in the
Interface Description 59496.
20
Page 21

2.3 Binary Inputs/Outputs
2 Instrument Description
Internal
binary inputs/
outputs
External
binary inputs
The recorder can be equipped with 0, 8, 16 or 24 binary inputs/outputs. During
configuration, they are designated Binary input/output 1 — 24. The function
(input or output) can be configured.
There are two ways of finding out the exact number of binary inputs/outputs
that have been implemented:
- Check the type code on the nameplate against the type designation. Please
refer to the Installation Instructions 59488 for an explanation of the
nameplate and type designation.
- Read the information on the instrument, in the menu Device manager
Device info Hardw.
In addition to the internal binary inputs/outputs, external binary inputs can also
be connected to the recorder.
Only external binary inputs are supported, but no external binary
outputs.
External binary inputs can be connected to the recorder via three different
interfaces. When configuring the external binary inputs, they are designated
External binary input 1 — 24.
Serial interface RS232/RS485 (Modbus)
The states of the external inputs can be transmitted to the recorder via these
two interfaces. The paperless recorder can be operated either as a Modbus
slave or as a Modbus master.
Further information on using the serial interface can be found in the Interface
Description 59494.
Ethernet interface
Further information on using the serial interface can be found in the Interface
Description 59494.
PROFIBUS-DP
This requires the extra code PROFIBUS-DP interface.
Further information on using the PROFIBUS-DP interface can be found in the
Interface Description 59496.
21
Page 22
2 Instrument Description
2.4 Relay Outputs
A maximum of 7 relays (1 as standard, 6 as an extra) is available to signal, for
instance, alarms or limit infringements. The action can be configured as break
(SPST-NC) or make (SPST-NO) contact.
There are two ways of finding out whether the 6 additional relays are available:
- Check the type code on the nameplate against the type designation. Please
refer to the Installation Instructions 59488 for an explanation of the
nameplate and type designation.
- Read the information on the instrument, in the menu Device manager
Device info Hardw.
2.5 Counter/Integrators
These are not electrical measurement inputs (hardware), but channels which
are calculated by the paperless recorder (software).
22
The terms counter and integrators encompass the following elements:
-Counter
- Integrators
- Operating time counter
- High-speed counter (hardware counter)
- Flow rate quantity
Page 23

2.5.1 Counter
Counter inputs - Binary inputs
-Alarms
-Errors
-...
v Chapter 2.7 “Binary Signals”
2 Instrument Description
Counting
frequency
Weighting Counted pulses are weighted by multiplying them by a factor. A down counter
8Hz max.
can be implemented by entering a negative weighting
(e.g. weighting factor -1).
2.5.2 Integrators
Integrator
inputs
Integrator
time base
Weighting Integrators are weighted by multiplying them by a factor. Negative integration
Weighting
example
- Analog inputs
- sec, min, hr and day
can be implemented by entering a negative weighting (e.g. a weighting factor
of -1).
-Flow rate
- Input signal of 0 … 20mA
corresponds to a flow rate of 0 … 1000 liters/sec
Minimum size
of the input
signal
-Time base 1sec
- Weighting 0.001 (conversion from liters to m³)
- Display of the integration value (flow rate quantity) in m³
This type of flow measurement is based on an analog input. Fast
binary inputs offer another possibility (high-speed counters).
v Chapter 2.5.5 “Flow rate quantity”
Entering a threshold (amount of the threshold value) has the effect that
integration takes place only when the value has been exceeded. No
integration will occur on falling below this value. The advantage of integration
with a threshold value larger than 0 is that possible noise from a transducer
can be suppressed in this way.
23
Page 24

2 Instrument Description
2.5.3 Operating time counter
The operating time counter will count how long a selected binary input or one
of the binary signals is closed. The time can be displayed in sec, min, hr and
days.
2.5.4 High-speed counters
Counter inputs The first two binary inputs of each module (B1, B2, B9, B10, B17, B18) can be
counted. Binary inputs are available if the module is fitted with 3 analog inputs
and 8 binary inputs.
Counting
frequency
Weighting Counted pulses can be weighted (by multiplying them by a factor). A down
Max. 10kHz
counter can be implemented by entering a negative weighting (e.g. weighting
factor -1).
2.5.5 Flow rate quantity
This makes used of the options of existing counter function to determine flow
rate quantities with the high-speed counters over the assigned time intervals
(the "pulses within the time base" are multiplied by the "weighting").
The flow rate quantity only appears on the paperless recorder.
It is not saved.
Counter inputs The first two binary inputs of each module (high-speed counters B1, B2, B9,
B10, B17, B18) can be used to measure the flow rate quantity (pulse counting).
Binary inputs are available if the module is fitted with 3 analog inputs and 8
binary inputs.
Time base sec, min, hr and day
The time base defines the duration for which pulses will be counted (gate time)
and the display interval of the flow rate quantity.
Counting
frequency
Weighting Counting pulses can be weighted (by multiplying them by a factor). A down
Max. 10kHz
counter can be implemented by entering a negative weighting (e.g. weighting
factor -1).
24
Page 25

2.5.6 Recording period of the counts
For all counters, integrators, operating time counters, and high-speed
counters, the counters are concluded and the counter states are stored and
restarted after an adjustable amount of time (recording time period). The
counter states of the most recently completed recording period can be
numerically displayed.
The following counter/integrator types are possible:
-Periodic
In addition, the time period (from 1 min to 12 hrs)must be selected in the
parameter Configuration
Period.
-External
In this case, the counter/integrator is updated only when the selected
control signal is active (e.g. binary input is closed). When the control signal
is deactivated (e.g. binary input is opened), the counter/integrator value is
saved and reset to 0.
-Daily
2 Instrument Description
Counters/Integrators General settings
- Weekly
-Monthly
-Yearly
-Total
-Daily (start — end)
In addition, the time period must be selected through the two parameters
Configuration
Configuration
counter/integrator will then only be updated from the start time. When the
end time has been reached, the counter/integrator value is saved and then
reset to 0.
Counters/Integrators General settings Start and
Counters/Integrators General settings End. The
25
Page 26

2 Instrument Description
2.5.7 Reset counters
Periodic reset There is a recording time period for each counter, integrator, operating time
counter and high-speed counter. At the end of this period, the current data
(value and time) are saved and the value reset to 0. Then the next time period
is recorded.
The overall and annual counters/integrators are an exception. These are saved
whenever any count/integration has been completed, but not reset to 0. This
means that they can be evaluated in the evaluation software PCA3000 as well.
External reset A control signal can be configured for all counters, integrators, operating time
counters and high-speed counters. The signal generates a reset of the counter
states to 0 without previous values being saved. The period for the summation
will be restarted at this point. This means that after the test run of an
installation, for instance, the recording can be freshly started; the test run
values that are not required are eliminated.
v Chapter 21.1 “General Setting”
v Chapter 21.3 “Input Signal … Decimal Place”
Reset from
control knob
The parameterization menu makes it possible to set counter states to a
specific value. The preconditions is that a user is logged in to the device.
When the value is entered after editing, a message with the new and the old
count value is entered in the event list.
The time period for the counter/integrator summation will not be restarted. The
previous counter/integrator values will also not be saved.
If you wish to save the previous counter/integrator values, you
must execute the function “Save all + update CF.” in the menu for
the memory manager.
In this way, the recording can be freshly started for individual counters/
integrators, e.g. after the test run of an installation; the test run values that are
not required will be eliminated in the process.
2.5.8 Response to setting the time
When the time is set, all counter states are completed and saved and, value is
reset to 0, and the recording period is restarted.
26
Page 27

2 Instrument Description
2.5.9 Response to instrument reconfiguration
When the instrument is reconfigured, the current counter/integrator recording
periods remain unaffected. The counter/integrator values will not be reset to 0
and the recording period will not be restarted.
The values can be deliberately reset, via the “Parameterization”
menu.
2.5.10 Response to reconfiguration of the counters on the instrument
If a counter/integrator on the instrument is reconfigured, then only the affected
counter/integrator will be concluded, saved, reset to 0 and have the recording
period restarted.
If anything is changed through reconfiguration in the menu Configuration
Counters/integrators General settings, then all counters/integrators are
concluded, saved, the values reset to 0, and the recording period is restarted.
2.5.11 Response to reconfiguration of counters with setup program
If a counter/integrator is reconfigured, the setup program will conclude and
save all counter states and reset the value to 0 and the recording period is
restarted.
27
Page 28
2 Instrument Description
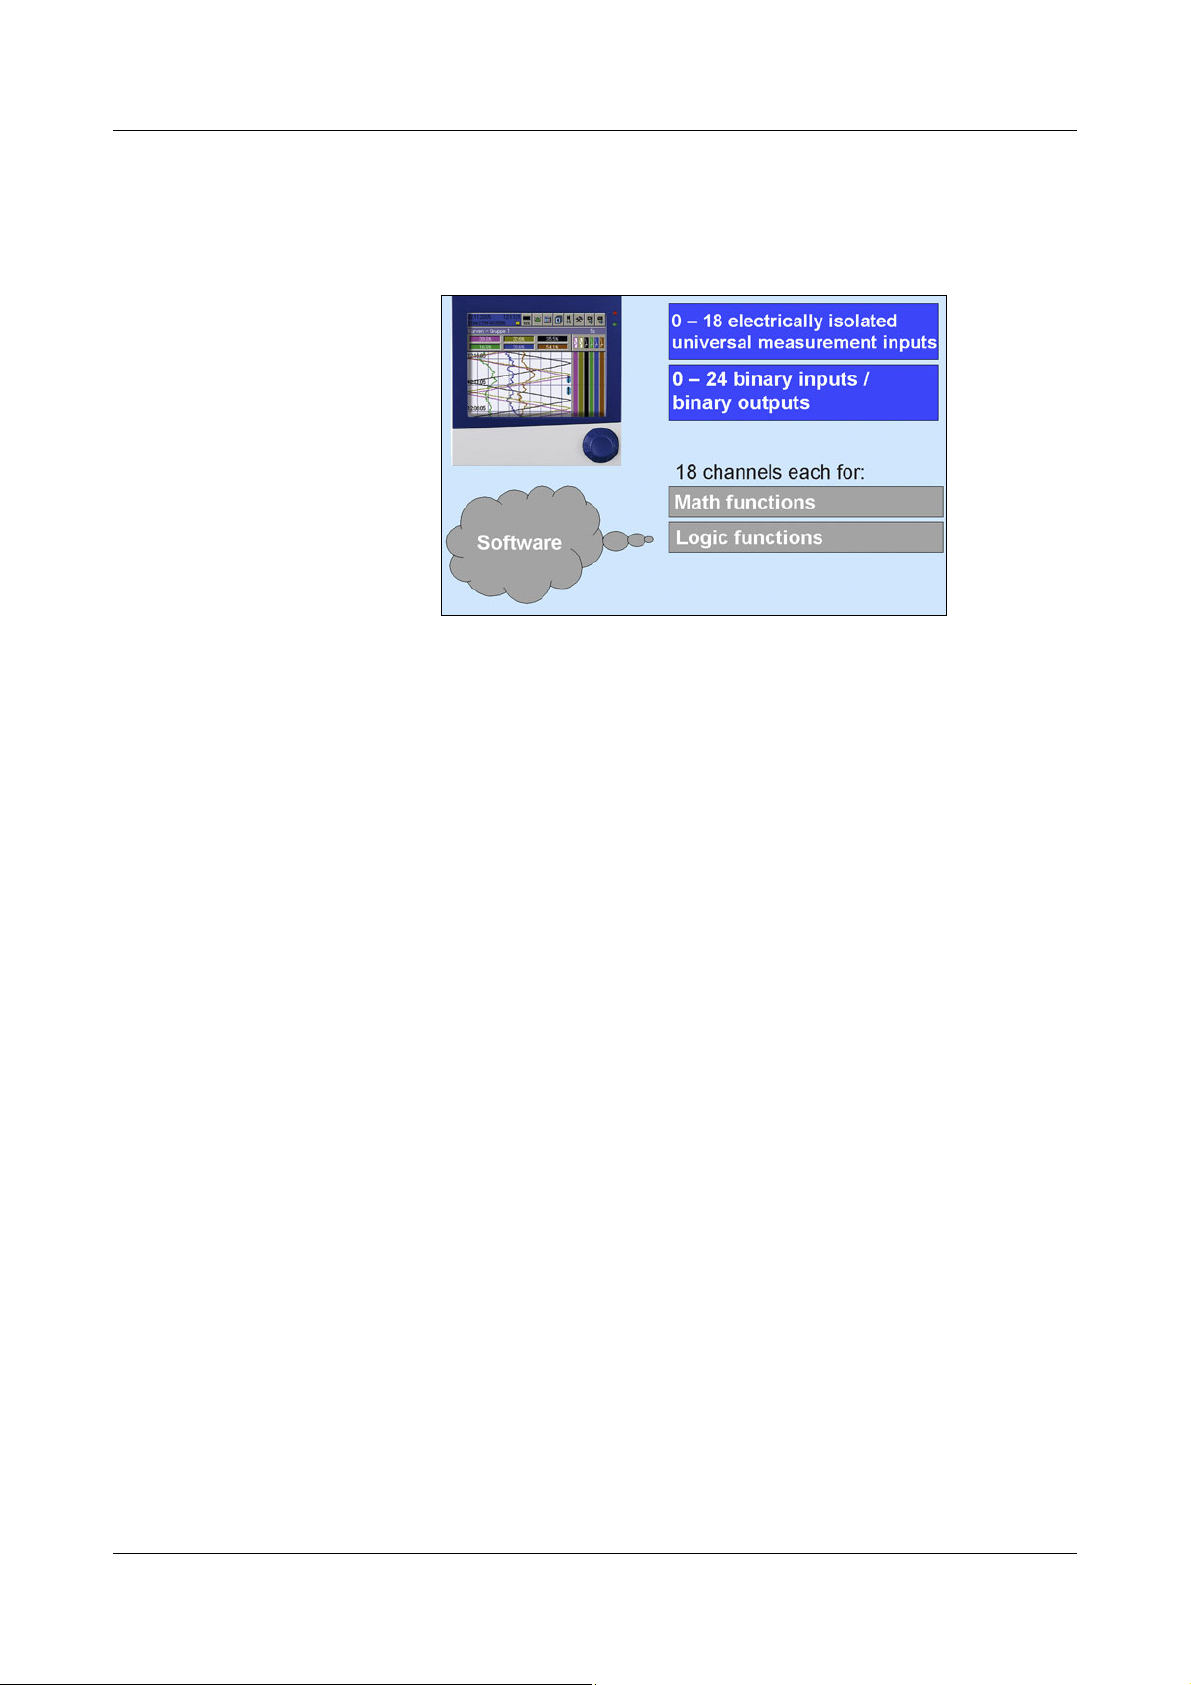
2.6 Math/Logic Module
The math and logic module is available as an extra. Like the counters/
integrators, the math and logic module are channels that are not available as
hardware but are calculated by the instrument software.
The math and logic module consists of two parts:
- the math module for calculating analog values and
- the logic module for linking Boolean values (0 or 1).
Math module The math module provides 18 measurement inputs for calculating new
“virtual” channels.
For the calculated channels, separate math channels are provided in addition
to the internal analog inputs. In configuration, you have to activate the required
math channel in the group configuration and thus assign it to a group.
Configuration
Setupprogram How a math channel is formed is determined through the setup program.
As variables for the formulae, the following may be available:
- Analog inputs
- Binary inputs
- Counters/integrators
-Alarms
-Errors
If counter/integrator values are used for calculation, then please note that their
accuracy is reduced, since, in this case, two different data formats will have to
be used for calculation. Counters/integrators are calculated in double-float
format (8 bytes per value), whereas the math module employs a single-float
format (4 bytes per value) according to the IEEE 754 standard. Nevertheless, it
is possible to include these values in the math module.
➔
Group x➔Analog channels ➔Channel x = Math x
28
Page 29
2 Instrument Description
The following fixed functions are available:
-difference
-ratio
- relative humidity
- moving average
For the moving average, the reference channel has to be entered (in most
cases, the analog input) and the time (in minutes). They will be used to
calculate the moving average.
The following operators and functions are available for formulas: +, -, *, /, (, ),
SQRT(), MIN(), MAX(), SIN(), COS(), TAN(), **, EXP(),
ABS(), INT(), FRC(), LOG(), LN().
On going above or falling below the scalable values, the math channel is
treated as for “out-of-range”.
Formulas are entered in the PC, in the setup program. It is not possible to edit
math formulas on the instrument.
Further information can be obtained from the instructions on the
setup program (59492).
Logic module Up to 18 channels are available for the logic channels.
As is the case with all the other binary signals, the calculated digital (Boolean)
values can be used for different functions:
- recording in event traces,
- as a control signal for display switch-off,
- clock time synchronization,
- operating time counter,
- externally controlled counters/integrators
- counter/integr. reset
- event mode,
- for output to a relay and
- as count input for a counter.
29
Page 30

2 Instrument Description
Following are some of the variables available for formulas:
- Binary inputs
- Logic channels
-Alarms
-Errors
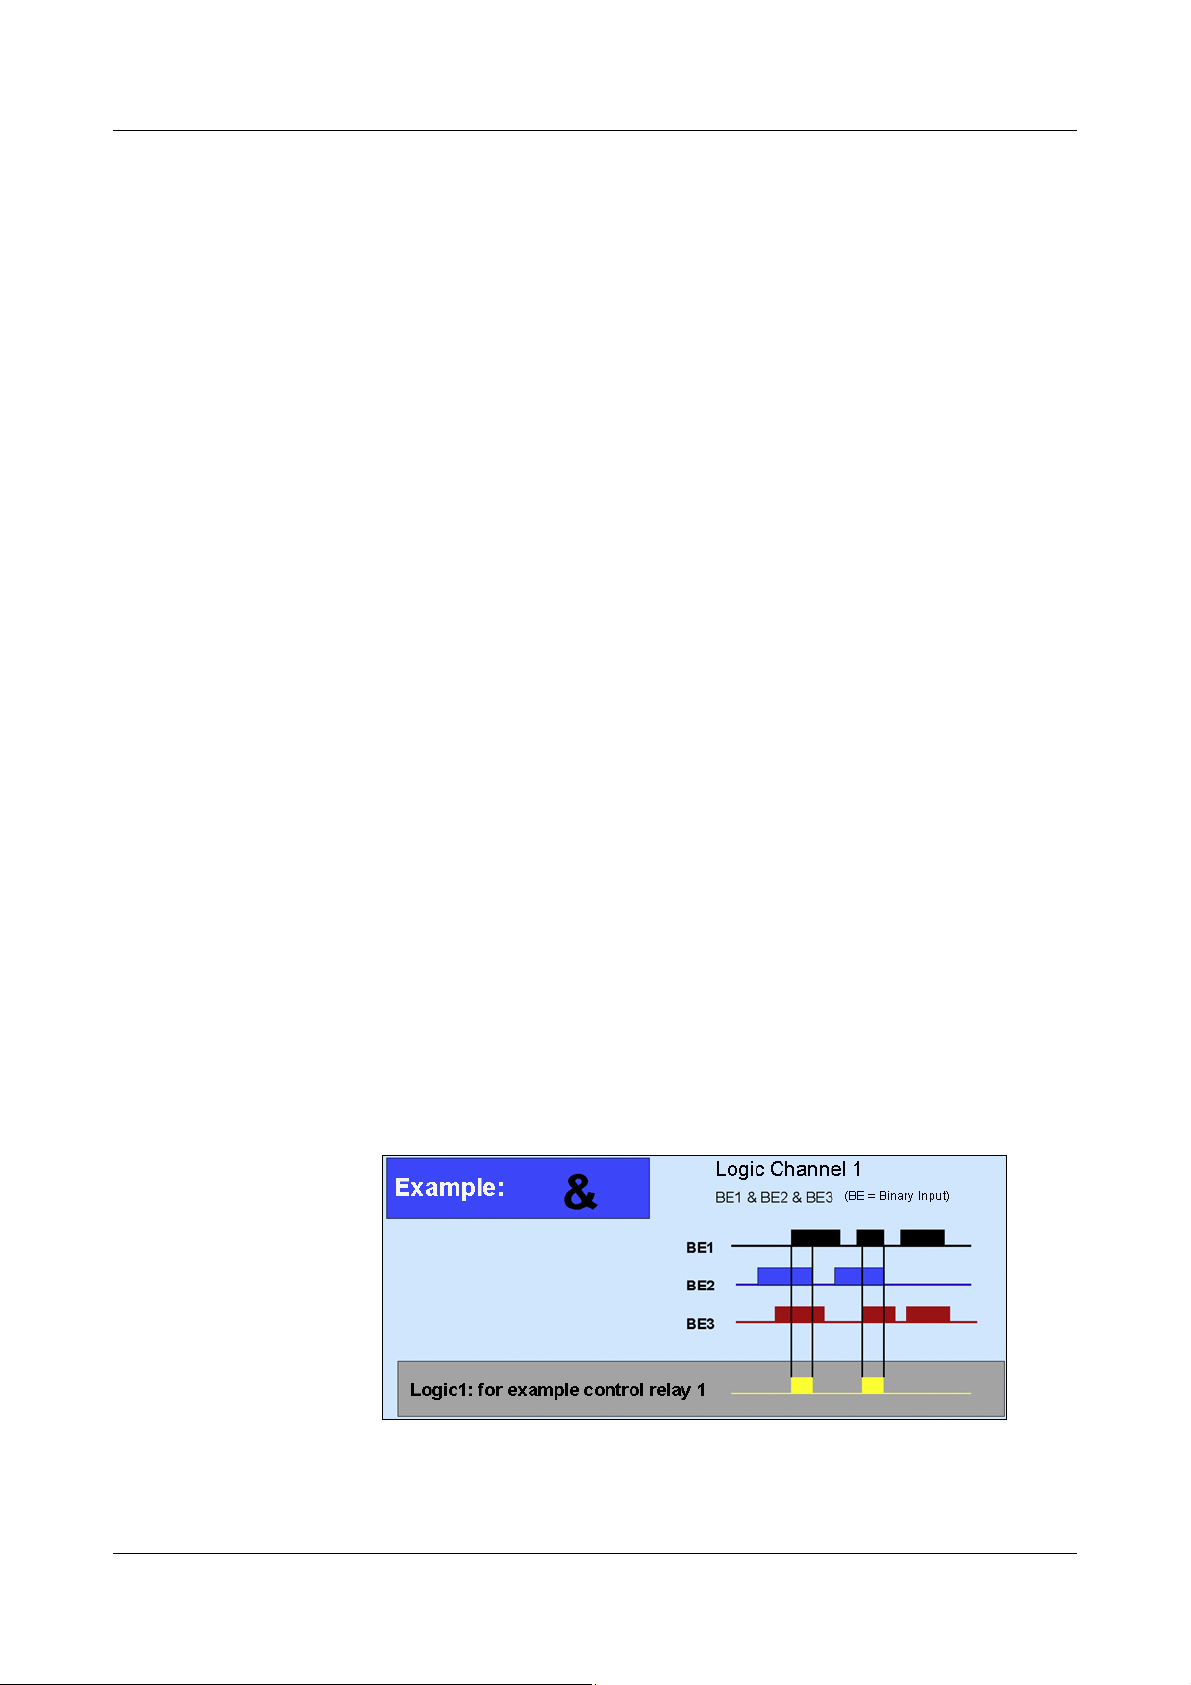
These functions can be used for formulas:
-! (NOT)
-& (AND)
-| (OR)
-^ (XOR)
- / (rising edge)
- \ (falling edge)
-( (open bracket)
-) (close bracket)
Further information can be obtained from the instructions on the
setup program (59492).
30
Page 31

2 Instrument Description
2.7 Binary Signals
Binary signals are used by the recorder, forexample to
-operate a relay,
- activate the Event operating mode,
- start external reports and
- start batch reports.
Binary signals are made visible as binary traces or switch symbols and can be
used as a basis for counters. The binary inputs (internal and external) are
binary signals.
Binary I/O The switching states of the internal binary inputs/outputs are indicated by the
binary signals. Depending on the instrument hardware level, 0, 8, 16 or 24
binary inputs/outputs are available.
v Chapter 14 “Configuration - Binary Inputs/Outputs”
Binary I/O alarm If the alarm configuration of an internal binary input/output is active, the
switching state is indicated through the corresponding binary signal. Please
note that the Alarm type must be configured for “Alarm”, and not for “Event”.
v Chapter 14.2 “Alarm Configuration”
Relays The switching states of the internal relays (1 or 7) are indicated by the binary
signals.
Limits (limit
monitoring)
Limit alarms If the alarm configuration of a limit monitoring is active, the alarm is indicated
Batch The binary signals are used to indicate whether the corresponding batch
Ext. binary input Binary signals are used to indicate the switching states of the external binary
The result of the limit monitoring (limit 1 — 9) is indicated through the binary
signals.
v Chapter 20 “Configuration - Limit Monitoring”
through the corresponding binary signal. Please note that the Alarm type must
be configured for “Alarm”, and not for “Event”.
v Chapter 20.2 “Alarm Configuration”
report for plant 1 — 3 is active, i.e. whether a batch report is currently being
run.
inputs. Up to 24 external binary inputs are available.
v Chapter 17 “Configuration - External Binary Inputs”
Alarms, ext.
binary input
If the alarm configuration of an external binary input is active, the switching
state is indicated through the corresponding binary signal. Please note that
the Alarm type must be configured for “Alarm”, and not for “Event”.
v Chapter 17.2 “Alarm Configuration”
31
Page 32

2 Instrument Description
Alarms, analog
inputs
Alarms,
counters/integr.
Group alarms The binary signals are used to indicate whether an infringement of the
The alarm monitoring states of the internal analog inputs are indicated by the
binary signals. Depending on the instrument hardware level, up to 18 internal
analog inputs are available. There are two binary alarm signals for each analog
input.
v Chapter 13 “Configuration - Analog Inputs”
The alarm monitoring states of the counters/integrators are indicated by the
binary signals. 27 counters/integrators are available. There are two binary
alarm signals for each counter/integrator.
tolerance band is present within a group, or whether there is an alarm for an
analog or binary channel. The individual channel alarms are OR-linked.
Infringement of tolerance band, group 1 — 9
There are two binary signals for each group:
- Alarm1 TL Group 1 — 9 = positive tolerance band infringement on a
channel and
- Alarm2 TL Group 1 — 9 = negative tolerance band infringement on a
channel and
v Chapter 18.2 “Analog Channels”
Alarms, ext.
Analoginputs
Combination
alarm
Alarm group 1 — 9
There is a binary signal for each group:
- Alarm Group 1 — 9 = alarm for an analog or binary channel in the
corresponding group.
v Chapter 13.4 “Alarm configuration”
The alarm monitoring states of the external analog inputs are indicated by the
binary signals. 24 external analog inputs are available. There are two binary
alarm signals for each external analog input.
v Chapter 13 “Configuration - Analog Inputs”
“Combination alarm” includes the following signals:
Signal Description
Device alarm The signal is formed from an OR link of all alarm
configurations (e.g. alarm configuration of analog inputs and
binary inputs and outputs) and the PROFIBUS
communication error signal.
Mem.al.
Read CF
The signal is activated when the device-internal memory
space available for data readout via CF card has fallen below
the selected threshold value.
32
v Chapter 2.10 “Reading out Data”
(Mem.al. = memory alarm)
Page 33

2 Instrument Description
Signal Description
CF card full The signal is activated when the memory space of a CF card
that has been inserted (external memory) has fallen below the
selected threshold value.
v Chapter 2.10 “Reading out Data”
Mem.al.
interface
Login The signal is activated as soon as a user is logged in to
Error The signal “Error” (also referred to as system error) is
Reserve 1 Currently not used.
Fieldbus
error
The signal is activated when the device-internal memory
space available for data readout via interface has fallen
below the selected threshold value.
v Chapter 2.10 “Reading out Data”
(Mem.al. = memory alarm)
instrument.
v Chapter 8.2 “Log-in and Log-out”
activated when:
- the CF card is faulty or full,
- the device battery is empty,
- the internal memory is faulty or
- a p.c.b in the device has not been calibrated.
The signal is activated when an error occurs during
communication via PROFIBUS.
Reserve 2 Currently not used.
CF card
inserted
CF card
removed
The signal is activated when a CF card is inserted in the
instrument.
The signal is activated when a CF card is removed from the
instrument.
33
Page 34

2 Instrument Description
2.8 Operating Modes
2.8.1 Normal, Timed, and Event Mode
The operating modes are used to determine the cycle in which measurement
data are stored.
3 operating
modes
Stored value The "Stored value" parameter determines what is stored: average, minimum,
Storage cycle The "Storage cycle" parameter determines the interval between two stored
The instrument has 3 operating modes:
- Normal operation
-Timed mode
-Event mode
The following settings can, among others, be made for each of the three
operating modes:
-Stored value
- Storage cycle (memory rate)
maximum or momentary value between two storage cycles, or the peak value
(envelope). With the "Peak value setting, the minimum and maximum value of
the last storage cycle will be saved.
Another option for the stored value is "Eco mode". This is a special storage
possibility, which is described separately in Chapter 2.8.2.
values. The diagram speed corresponds to the storage cycle, which means
that with a storage cycle of 5sec, for example, the stored value is entered in
the diagram every 5sec.
Normal
operation
Timed mode For timed mode, a period of time can be defined (up to 24 hrs) within which a
Event mode Event mode is activated by a control signal that is assigned to an event or
Priority The respective priorities of the operating modes are allocated as follows:
If the instrument is not in timed or event mode, normal operation is active.
specific stored value and a specific storage cycle are active.
alarm. Event mode can be used, for example, to shorten the storage cycle
when an alarm is present.
Operating mode Priority
Normal
operation
Timed mode Medium
Event mode High
Low
34
Page 35

2 Instrument Description
t1 t1
Tolerance band
t1 = storage through “Min. storage cycle” (forced storage).
The tolerance band is specified
with regard to the unit of the
analog channels (e.g. ± 1 °C).
Active
operating mode
2.8.2 Eco mode
The active operating mode is shown in the diagram by different symbols
behind the current display for the diagram speed:
Operating mode Symbol
Normal
operation
Timed mode
Event mode
The parameters for Eco mode are set in the menu for normal operation.
However, Eco mode can be used for all three operating modes.
In Eco mode, the momentary values (current values) are recorded in a
predefined minimum storage cycle (independent of the tolerance band).
35
Page 36

2 Instrument Description
10s
10s
10s
10s
10s
10s 10s 10s
t
t1
t2
t3
t4
10s
t6
t5
t1 = storage through “Min. storage cycle” (forced storage) and
application of a new tolerance band.
t2 = no storage, since the measurement is again within the tolerance
at the end of the storage cycle (10sec).
t3 = storage and application of a new tolerance band, since the
measurement has gone outside the tolerance band at the end of
the storage cycle.
t4 = storage and application of a new tolerance band, since the
measurement has gone outside the tolerance band at the end of
the storage cycle.
t5 = storage through “Min. storage cycle” (forced storage) and
application of a new tolerance band.
t6 = no storage, since the measurement is again within the tolerance
If the measurements go outside the tolerance band, and the new
measurement, which is outside the tolerance band, is present for at least the
duration of the storage cycle that was set in the active operating mode, then it
is acquired and stored and a new tolerance band is applied.
Going outside the tolerance band is not necessarily recorded. If
the measurements return inside the tolerance band within the
storage cycle (t2), then there will be no recording and “Min. storage
cycle” is still active.
36
Page 37

2 Instrument Description
A/D 2
A/D 1
CPU
(SRAM)
20
kB
20
kB
20
kB
20
kB
20
kB
Internal
memory
Analog inputs
External
CompactFlash
memory card
2.9 Data Storage
Operating
principle
Data recording Measurements are acquired continuously in a 125msec sampling cycle. Based
on these measurements, reports are compiled and limits checked. The
measurements are transferred to the main memory of the instrument,
according to the programmable storage cycle and stored value (maximum,
minimum, average, Min&Max, momentary value or economy mode).
The paperless recorder saves the data according to groups, and the input can
be assigned to several groups (up to 9).
Main memory
(SRAM)
Internal
memory
CompactFlash
memory card
(external)
The data stored in the SRAM are regularly copied to the internal memory in
20 kbyte blocks.
When a block in main memory has been filled, it is copied to the internal
memory. Internal memory has a capacity of max 256 Mbytes. Every write
action is monitored, so that any errors in saving data can be immediately
identified. The instrument monitors the capacity of the internal memory and
activates one of the “memory alarm” signals when the capacity has fallen
below the configurable residual capacity level. These signals can be used,
forinstance, to operate the alarm relay.
This is written to as a ring memory, i.e. when the memory is full, the oldest data
will automatically be overwritten by new data.
The data from the internal memory can be shown as a history presentation on
the recorder. The size of the history memory can be configured.
If an external CompactFlash memory card (Industrial Grade) is inserted into
the paperless recorder, memory blocks are automatically written to the CF
card.
The instrument monitors the capacity of the CompactFlash card and activates
the “Memory alarm (CF card)” signal if the level falls below a configurable
residual capacity. This signals can be used, for instance, to operate a relay
(warning signal “Swap CF card”).
For recorders with a stainless steel panel (extra code) the CompactFlash memory card is not available as external memory. The measured data can be saved through one of the interfaces or through a USB flash drive (on the rear side).
37
Page 38

2 Instrument Description
Data security The data are stored in coded form in a proprietary format. This ensures a high
level of data security. If the CompactFlash card is removed from the
instrument, no data will be lost immediately, as these data are still stored in the
internal memory. A loss of data will only occur if, after the CompactFlash card
has been removed, internal memory is completely rewritten as well, and no
data have been read out through the interface.
If the paperless recorder is disconnected from the supply, then:
- RAM and clock time are buffered by a lithium battery (ex-factory) for at least
10 years, with a storage capacitor for at least 2 days (ambient
temperature
-40 to +45°C),
- Measurement and configuration data in the backup memory will not be lost.
Storage cycle Different storage cycles, ranging from 125msec to 32000sec can be
configured for normal, event and timed mode under “Configuration”.
The storage cycle determines the time intervals at which the measurements
are stored.
Stored value Under this parameter, separate configurations are made for normal, event and
timed mode, to decide which value is to be stored (average, momentary,
minimum, maximum, peak values or Eco mode).
Recording
format
Recording
duration
Optimization of
recording
duration
Data are recorded encoded in a proprietary format.
The recording duration depends on various factors:
- number of analog channels and event traces being recorded
- Storage cycle (memory rate)
- number of events in the event list
The recording duration can be optimized by process-oriented selection of the
storage cycle and stored value.
In normal operation (no error, no alarm, etc.) a storage cycle that is as long as
possible (e.g. 60sec, 180sec, etc.) should be selected, depending on the
particular application.
In the event of an alarm or error, the storage cycle can be shortened via event
mode, with the effect that the measurement data are recorded with a high time
resolution.
38
Page 39

2.10 Reading out Data
In addition to automatic read-out via the CompactFlash memory card,
measurement data can also be read out through one of the interfaces (RS232,
RS485, USB device, Ethernet) and with a memory stick (USB host).
The options for reading a CF card/memory stick and interface work in a
parallel manner. For this reason, there are also two “binary signals”, which
indicate when the available storage space has fallen below a certain
configurable value.
2 Instrument Description
Memory alarm The limit for alarms can be set by the parameter
Memory alarm in the configuration level.
The parameter
to determine which storage space indication should be shown in the status
bar. The “binary signals” for storage space detection function independently of
this parameter.
Binary Signals “Mem.al. CF readout”
If this signal is set, this means that no data have been fetched via the CF card
or USB memory stick for a prolonged period, and the available capacity of the
internal memory has fallen below the configured level (this only applies if the
parameter
card").
“Mem.al. interface”
If this signal is set, this means that no data have been fetched via the interface
for a prolonged period, and the available capacity of the internal memory has
fallen below the configured level (this only applies if the parameter
Configuration ➔ Device data ➔ Data readout via... is set to “Interface”).
“CF card full”
If this signal is set, it means that not enough space is available on the CF card.
The PCA3000 program can help here. Data can be read into PCA3000, and
then saved to the hard disk or on a network, thus freeing up space on the CF
card. Alternatively, you can use a new CF card.
Configuration ➔ Device data ➔ Data readout via... can be used
Configuration ➔ Device data ➔ Data readout via ... is set to "CF
Configuration ➔ Device data ➔
Difference
between
CF card and
USB stick
v See “Binary Signals” on Page 31.
The signal is not operated in reference to a full USB memory stick.
Unlike CF cards, data are not automatically stored on an inserted USB
memory stick.
39
Page 40

2 Instrument Description
Initial
commissioning
Production phase 1 Conversion /
optimization
Production phase 2
t (time)
Process data
(e.g. Temp. in °C)
Readout via
interface
Use the PCA Communications software PCC to read out measurement data
via the serial or USB device or Ethernet interface.
Use the same archive (in the PC) for reading out data via the
interface as for a readout via the CF card. This saves having to put
together data from different files at a later date.
v Please refer to the Operating Manual 59500 for further information.
2.11 Archiving and Evaluating Data
Life-cycle data
management
The integrated life-cycle data management allows users to save all the
process data from the system that is being monitored in an archive file on their
PCs or a server system.
The recovery of configuration-dependent plant/system data, which may be
required for commissioning, maintenance or optimization during the life-cycle
of a plant or system, is enabled by the associated PC Evaluation software
PCA3000 in a dialog window.
40
Page 41

Open archive
Evaluation
software
PCA3000
2 Instrument Description
v Please refer to the Operating Manual 59498 for further information.
41
Page 42

2 Instrument Description
42
Page 43

3 Operating Principle
Function is activated when the
control knob is pressed.
Fixed functions Variable functions
with changing symbols
3.1 Operating Principle and Graphic Elements
Header
The functions of the paperless recorder are selected in the header. The
selected function is indicated by a blue background.
Recorder with control knob
- Function selection by rotating the control knob (to right or left).
- Function is activated by pressing the control knob.
Recorder with touchpad (stainless steel front panel)
- Function selection through a circular motion with a finger at the outer edge
of the touchpad (when activating the circular motion, two of the eight LEDs
in the touchpad are on).
- Function selection by tapping the middle of the touchpad (all LEDs in the
touchpad are on).
The symbols (for the variable functions) vary according to the function that is
currently active.
The following diagram shows the header for normal display when the vertical
43
Page 44

3 Operating Principle
Group
step-on
Channel
step-on
Numerical
measurement display
(diagram view)
Memory presentation / history
(visualization of the data in
internal memory)
Operator level
(visualization of current data)
Group selection
Device
manager
Memory manager
Alarm and event lists
diagram (curve display) has been selected.
Device manager v Chapter 8
Memory manager v Chapter 7
Alarm and event lists v Chapter 6
Operator level (visualization) v Chapter 4
Group selection v See “Group selection” on Page 55.
Memory presentation (History) v Chapter 5
Numerical measurement display v See “Numerical measurement display
Channel step-on v See “Channel step-on” on Page 59.
Group step-on v See “Group step-on” on Page 59.
v See “Numerical measurement display”
(diagram view)” on Page 46.
on Page 55.
44
Page 45

3 Operating Principle
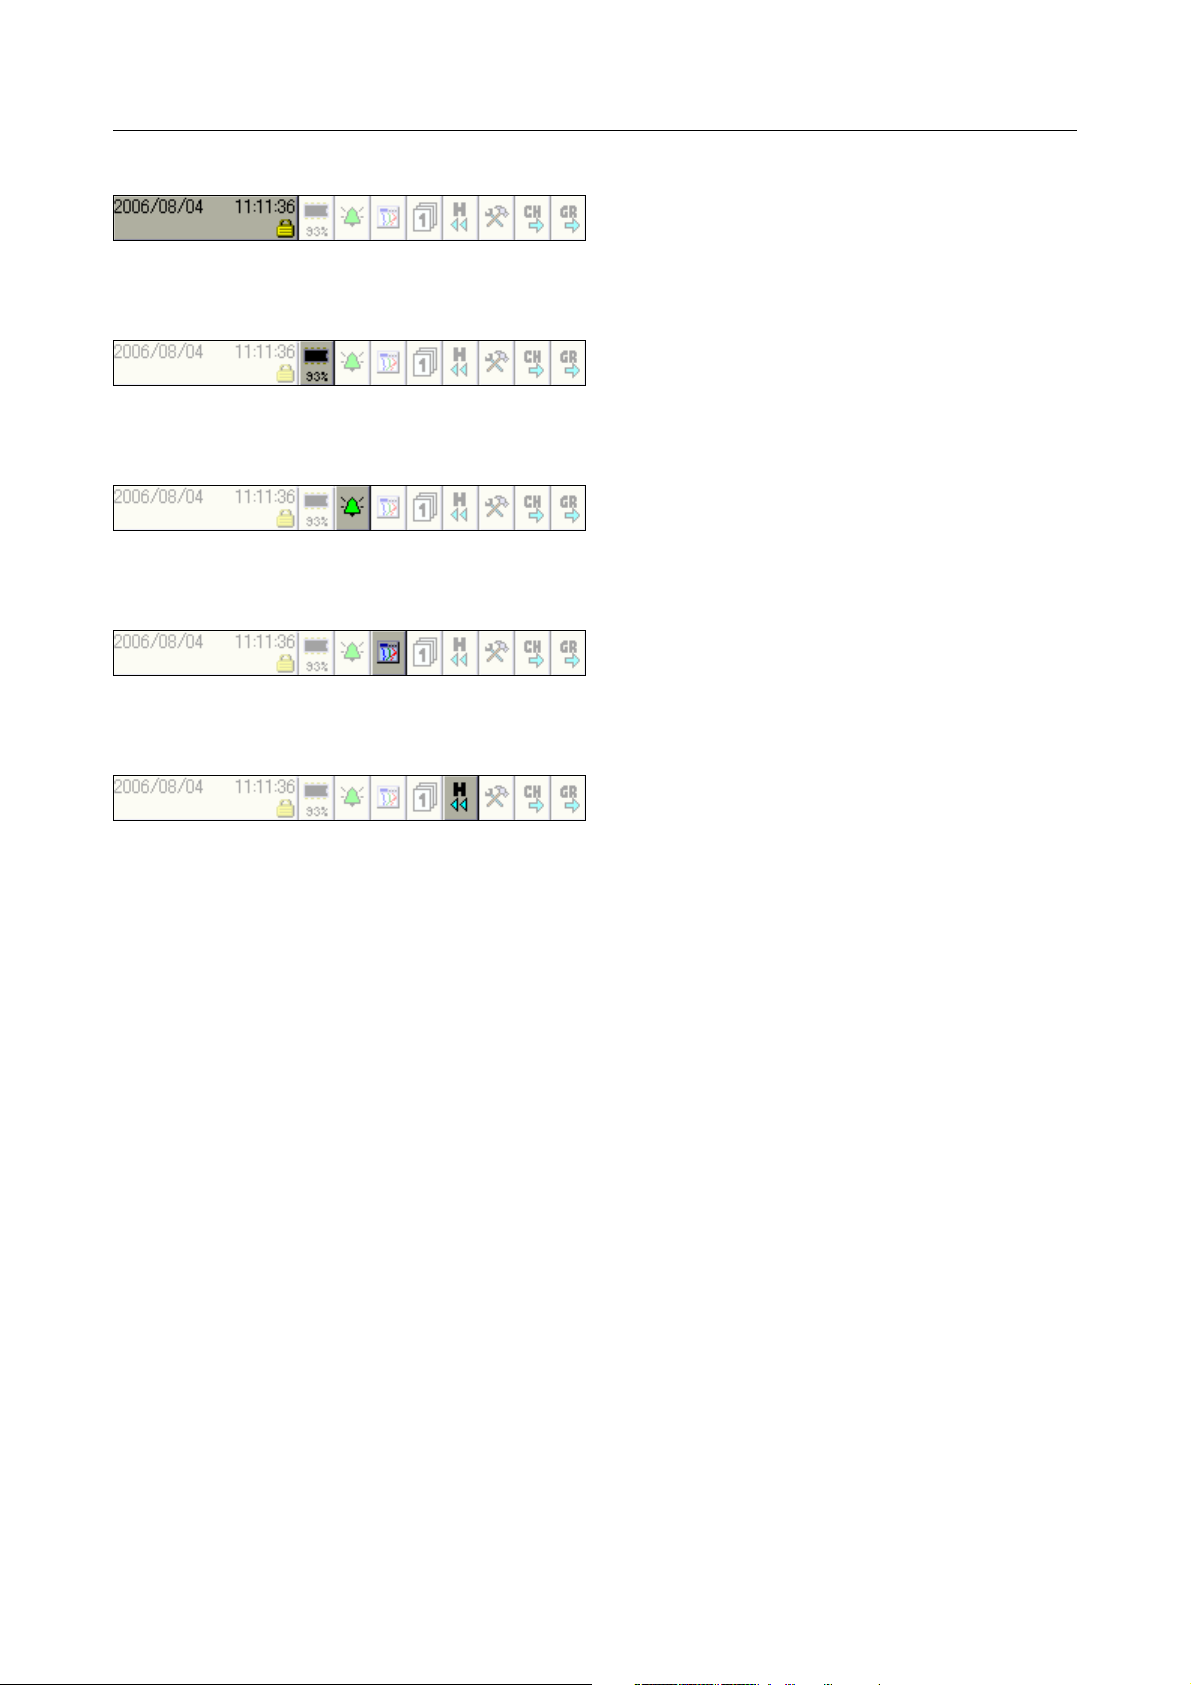
Sampling rate and operating mode
= normal mode
= event mode
= timed mode
If the text is shown in red, this indicates
an error message.
Data are currently being read by the PCA
Communications software PCC.
Data are currently being transferred to the
CF card.
Caution: Do not remove CF card!
Status
and title bar
This line (bar) shows alarm and error messages, as well as general information,
and information about the active representation mode (e.g. sampling rate). It is
automatically blanked out by the system, if necessary.
45
Page 46

3 Operating Principle
An alarm for a channel is shown in red
(HIGH alarm) or orange (LOW alarm). The
colors can be configured in the setup
program.
Numerical
measurement
display
(diagram
view)
The numerical measurement display is available for the presentation modes:
- Curves,
- history (of the curve presentation) and
- digital diagram
available.
In the curve presentation, the numerical display can be switched on or off.
This switching on or off also applies to the history presentation.
If the numerical measurement display is switched on in the history (of the
curve presentation), you can switch between MIN and MAX display. Whether
or not MIN and MAX values are both available at the same time, depends on
the settings for the group operating mode.
In the digital presentation, the diagram header can be switched on and off.
46
Page 47

Visualization
Symbols for data acquisition:
Comment has been entered
Event occurred
Alarm is no longer present
Alarm has been signaled
window
(diagram)
3 Operating Principle
In the visualization window, the measurement data are shown in graphical
form. Alarms are indicated by a red or orange color for the curve (can be
configured in the setup program).
Communication with the operator (device configuration, checking alarm and
event lists etc.) also takes place via the visualization window.
47
Page 48

3 Operating Principle
3.2 Operating Example
Start The normal display is active.
Operation
h Select the operator level by rotating the control knob.
h Activate the operator level by pressing the control knob.
48
Page 49

h Select the operator level by rotating the control knob.
h Activate the bar graph presentation by pressing the control knob.
Result The bar graph presentation starts.
3 Operating Principle
49
Page 50

3 Operating Principle
Plant number Group Plant (batch)
01…9None
11…91
21…3
4…6
7…9
1
2
Not assigned
31…3
4…6
7…9
1
2
3
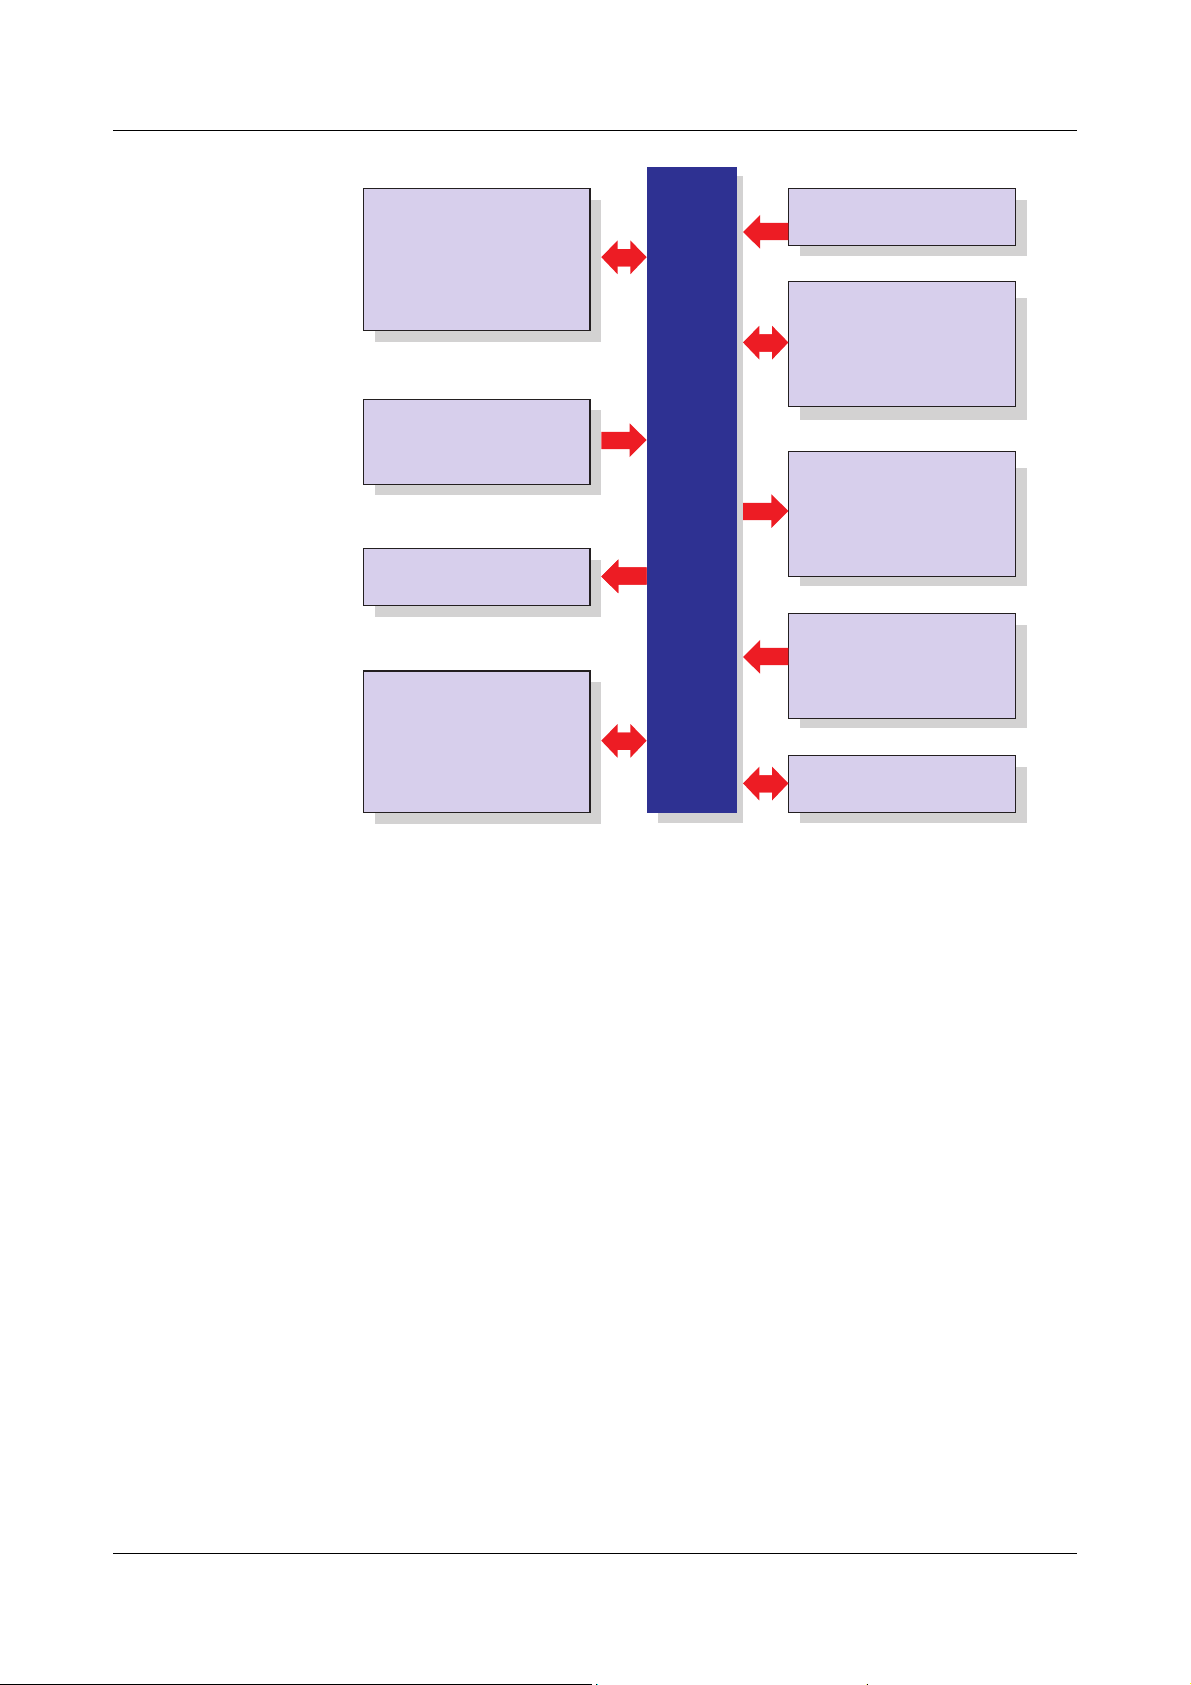
3.3 Group and Plant Management (Batches)
Within the recorder, all analog inputs, binary inputs, counters and integrators,
are collected together into groups. A maximum of nine groups is available as a
total. Each group can consist of a maximum of 6 analog inputs, 6 binary inputs
(or outputs), and 4 counters/integrators.
The visualization and storage of the analog inputs and binary inputs (outputs)
is always made on a group basis.
If plants (batches) are used, the groups have fixed assignments to the plants
(batches).
50
Page 51

3 Operating Principle
Batch for plant Main group
11
24
37
In order for a batch to be usable, its main group must be active
(status = “Display” or “Display, save”) and at least one analog
channel in the group must be assigned.
The number of plants is configured through the parameter Device manager
Configuration
plants.
Batches/plants
Gen. plant parameters
Number of
51
Page 52

3 Operating Principle
52
Page 53

4.1 Activating the Operator Level
Operator level
The type of visualization (curve presentation, bar graph etc.) is selected at the
operator level. Note that the appearance of the operator level can be
influenced by the configuration.
h Select the operator level by rotating the control knob.
h Activate the operator level by pressing the control knob.
You can alter the visualization after activating the operator level.
4 Visualization
The functions in the header line will change, depending on the visualization.
The following types of visualization are available:
Curves v Chapter 4.3
Bar graph v Chapter 4.4
Text pict ure v Chapter 4.5
Process image v Chapter 4.6
Binary v Chapter 4.7
Report v Chapter 4.8
Batch v Chapter 4.9
Counters/integrators v Chapter 4.10
Comment entry v Chapter 4.11
53
Page 54

4 Visualization
4.2 Overview of Header Lines
Curve
presentation
(diagram)
Bar graph
presentation
Text pic ture
presentation
Process image
presentation
Digital
presentation
Reports
Batches
(current)
Batches
(completed)
Counters and
integrators
Comment entry The comment entry does not have its own header. The current header will
remain when this function is activated. The comment that has been entered is
placed in the event list.
The first four functions in the header are identical for all
visualizations. These are supervisory functions (see “Header” on
page 43).
54
Differences only arise in the last five functions.
Page 55

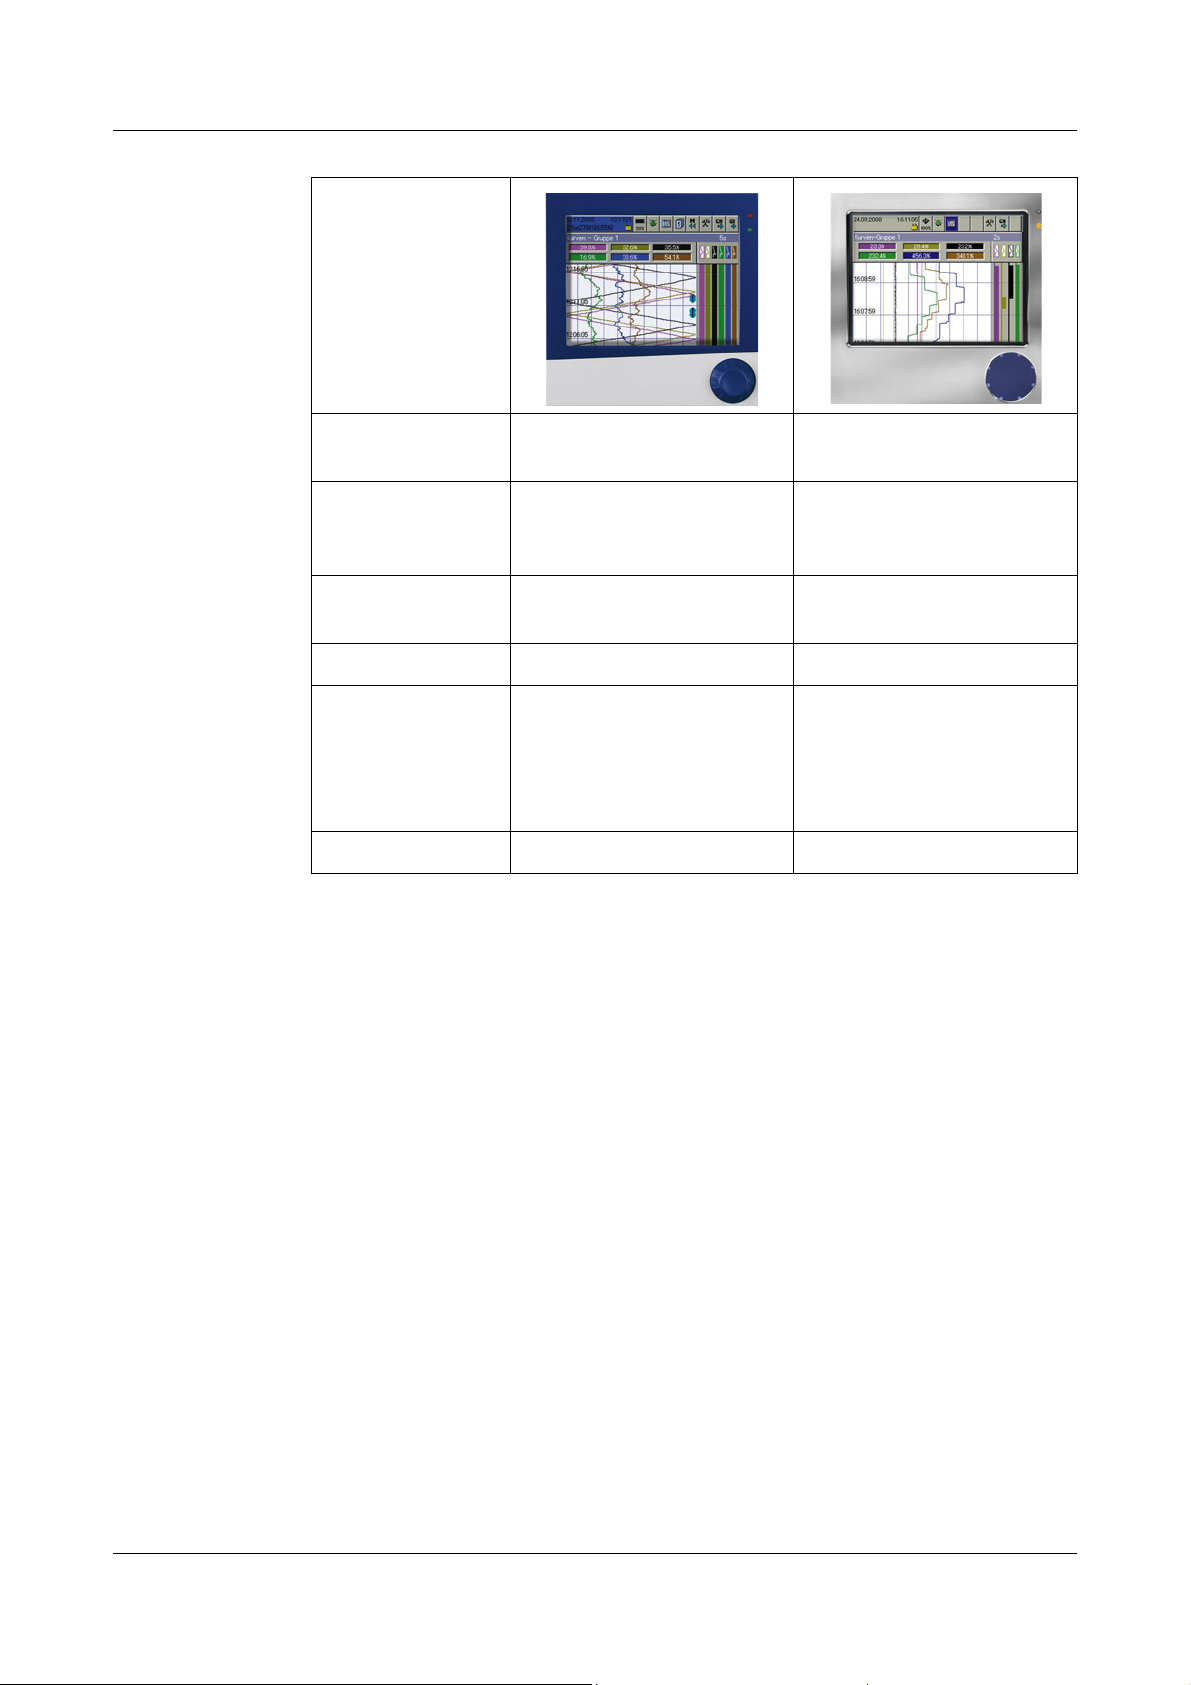
4.3 Curve Presentation
Group selection
Memory presentation
Numerical measurement display
(diagram view)
Channel step-on
Group step-on
Sampling rate
and
oper. mode:
=
Normal mode
=
Event mode
=
Timed mode
An alarm (Alarm 1 or Alarm 2) is
indicated by an orange or a red background. The
colors can be configured in the setup program.
An alarm (Alarm 1 or Alarm 2) is
indicated by a red or orange curve color.
The colors can be configured in the
setup program.
In this presentation, the individual signal traces run from top to bottom of the
display (vertical presentation).
4 Visualization
Group selection You can use this function to directly select and display any one of the groups.
Memory
presentation
This function starts the presentation of the data that are available in the history
memory.
v Chapter 5 "Memory Presentation (History)"
Numerical
measurement
display
This function is used to switch the numerical measurement display (diagram
header) and binary traces on or off, as well as to activate the envelope display.
55
Page 56

4 Visualization
Programmable
alarm limits
Group number
Configurable
alarm limits
An alarm (Alarm 1 or Alarm 2) is indicated by
an orange or red background. The colors
can be configured in the setup program.
Channel
step-on
Group
step-on
This function activates the scaling display. Repeated activation steps through
the scaling for the channels within the group, and then blanks it out again.
Unlike “Group selection”, where any group can be selected, this function is
used to select the groups one after another.
4.4 Bar Graph Presentation
In this visualization mode, the analog inputs are presented both numerically
and in bar graph form. In addition to the analog channels, the digital inputs can
also be visualized at the bottom of the display.
56
If only digital channels are to be presented, then Chapter 4.7 "Binary diagram
presentation" is recommended.
Page 57

4.5 Text Picture Presentation
Channel description
Channel name
Changeover to
1-channel
presentation
An alarm (Alarm 1 or Alarm 2) is
indicated by an orange or red background.
The colors can be configured in the setup
program.
Channel description
Channel name
Changeover to group
presentation
Programmable
alarm limits
In the presentation, the analog channels are presented numerically, together
with the channel name and the channel description. In addition to the analog
channels, the digital inputs can also be visualized at the right-hand edge of the
display.
Group
presentation
4 Visualization
1-channel
presentation
57
Page 58

4 Visualization
Switch diagram header
on/off
Diagram header
4.6 Process Image Presentation
The display shows selected measurement signals and background pictures in
a maximum of nine process images. The setup program is used to prepare
and configure the images.
Each process image can be freely configured by the user. One
background image (316 × 188 pixel) and 25 objects (analog/binary
signals, icons, texts, bars) can be used per process image.
Further information can be obtained from the instructions on the
setup program (59492).
4.7 Binary diagram presentation
In this presentation, the analog channels are left out and only the binary
channels and signals are visualized.
58
Page 59

4.8 Reports
Group selection
Report step-on
Channel step-on
Group step-on
Here you can find the
completed report data for a
Here you can find the
completed report
data for a channel.
Maximum
Minimum
Average
Time period
4 Visualization
Each one of the reports covers all the analog channels in a group. Each group
has its own configurable report.
The current reports are visualized in the presentation.
Group selection You can use this function to directly select any one of the groups and display
the report data.
Report
step-on
Channel
step-on
Group
step-on
This function is used to switch between the various types of report for the
current channel.
This function can be used to switch between the individual channels of the
group that is currently active.
Unlike “Group selection”, where any group can be selected, this function is
used to select groups one after another.
59
Page 60

4 Visualization
Edit batch
Change batch/plant
Batch start/stop
(only if configured)
Close editing
Batch
status
4.9 Batches/Plants
When recording batch processes, a distinction is made between the plant and
the batch.
The instrument can combine and record the data from up to 3 plants in
batches (batch report). The number of batches for a plant is not limited. The
instrument distinguishes between “current batch” and the most recently
“completed batch” for a plant. The number of plants that are used and the
texts in the batch template can be configured on the instrument or in the setup
program.
4.9.1 Current Batches
v This display shows the current data for the batch(es). Further information
about entering the texts in the left and right columns can be found in
Chapter 23 "Configuration – Batches/Plants".
60
The batch texts on the right-hand side can be entered with one of the
following options:
Page 61

4 Visualization
Edit
batch
Change
batch/
plant
Start/stop
batch
This function can be used to edit the batch text fields that are available
(configured for this purpose). When the function has been called up, the first
editable field in the screen template will be activated.
h Press the control knob to start editing.
h Enter the text (Chapter 26 "Entering text and values").
h Rotate the control knob to select a new field or button, and activate it by
pressing the control knob.
Switching between the individual batches/plants. Max. 3 plants can be
configured.
Use the parameter Device manager
Plant X
The following are available:
- Start/stop by a binary signal (control signal)
GeneralBatch start to configure how a batch starts and stops.
Configuration
Batches/plants
- Start/stop by a barcode reader, and
- Manual start/stop by control knob.
At least 5 seconds must elapse between the stop of a batch (batch
end) and the next start (batch start). A new batch cannot be
started until this time has elapsed.
Batch status The batch report that is displayed is active.
The batch report that is displayed is not active.
61
Page 62

4 Visualization
Batch evaluation
Change batch/plant
4.9.2 Completed Batches
Batch
evaluation
Change
batch/
plant
Completed batches can be evaluated in three different ways:
- Curves (graphical presentation)
- Report (numerical presentation)
- Attachments (e.g. recipes)
h Rotate the control knob to select a type of presentation, then press the
knob to activate this type.
Activating the door symbol in the header closes the selected presentation, and
the batch data will be displayed again.
The corresponding batch data will be shown in its own batch visualization,
depending on how many plants have been configured.
62
Page 63

4 Visualization
4.9.3 Batch Control with Barcode Reader
If a barcode reader is connected to the interface “RS232 for barcode reader”
(connector 2) or “RS232/RS485” (connector 7), then the batch start, batch
stop, and input of batch texts in a current batch report, can be controlled by
the barcode reader. The bar codes that are used all correspond to the type
“Code39”.
Preconditions - The interface must be configured for bar code operation.
Example:
Configuration
Protocol = bar code.
- The batch start (= batch stop) must be configured.
Example for batch start/stop:
Configuration
bar code.
- Every line that is to be set by the bar code must be configured.
Example for plant 1, line 1 (program name):
Configuration
column = bar code.
Interface RS232 for barcode reader General
Batch/plant Batch (Plant) 1 General Batch start =
Batch/plant Batch (Plant) 1 Line 1 Content of right
Activate
batch
Show batch
report
Before entering commands through a barcode reader, the
corresponding batch/plant 1 — 3 must be prepared by scanning in
“BATCH1 — 3” for the bar code commands, regardless of whether
or not they are automatically displayed.
If one of the visualizations is active, and nothing is being entered or edited at
the moment, then the current batch report can be inserted via the barcode
reader. The precondition is that the batch is active and the parameter is set to
Configuration
Activate and display (if required) batch report for batch (plant) 1:
Activate and display (if required) batch report for batch (plant) 2:
Screen Bar code -> current batch = Yes.
63
Page 64

4 Visualization
Activate and display (if required) batch report for batch (plant) 3:
Start and stop
batch
report
If the batch report is configured for start/stop via barcode reader, then it will be
started and stopped as follows.
Start batch:
h Scan bar code for “Batch report for batch (plant) 1 — 3”.
h Scan start.
Stop batch:
h Scan bar code for “Batch report for batch (plant) 1 — 3”.
h Scan stop.
64
If a batch report is stopped, then texts that have been activated by
a bar code will be reset to the standard text in the currently active
batch report depending on the parameter "Delete line".
In the completed batch report, the texts will be saved.
v See “Delete line” on page 170.
Page 65

4 Visualization
Activate batch
texts
Reset
entry
If a line in a batch report is configured for barcode activation, the activation
proceeds as follows.
Activate text:
h Scan bar code for “Batch report for batch (plant) 1 — 3”.
Scan text.
The first line of the activated batch report that has been configured for text
input via bar code will automatically be filled with the text that corresponds to
the bar code. If several line have been configured for barcode activation, then
they will be processed one after another, from top to bottom.
Execution of the following bar code will reset the activation of the batch texts.
The standard texts (parameter Factory setting) will be displayed, and the first
line will be prepared for input.
Summary of the
bar codes
All the bar codes that are required are also collected together in Chapter 28.1
"Bar code".
The codes for batch control (BATCH1, BATCH2, BATCH3, START,
STOP, RESET) cannot be used for setting batch texts.
65
Page 66

4 Visualization
Overview of
9 counters/
integrators
Individual display
Changeover between
overview and
individual display
Switch to the next 9 counters/integrators
Description Current value
Current value
Description
Name
Value of the last
recording time period
4.10 Counters and Integrators
In this presentation, the current states of the counters and integrators
(totalizers) are displayed, as well as the operating hours counter. Up to 9
counters and integrators can be shown in one screen template. The functional
characteristics (counter, integrator or operating hours counter) are defined in
the device configuration.
Overview
presentation
Individual
presentation
66
Page 67

4.11 Comment Entry
Plant number Group Plant (batch)
01…9None
11…91
21…3
4…6
7…9
1
2
Not assigned
31…3
4…6
7…9
1
2
3
This function can be used to enter a text (max. length 31 characters) that is
entered in the event list when the input is completed.
In curve presentation (in the displayed group), the text entry is marked by a
pencil symbol.
4 Visualization
v Chapter 6 "Alarm and Event Lists"
v Chapter 4.3 "Curve Presentation"
v Chapter 4.11 "Comment Entry"
The text can now be found in the event list, under the heading “All events”, but
also under the corresponding batch.
If batches are used (parameter: Device manager
Configuration
Number of plants is larger than 0), then the groups have a fixed
assignment to the batches.
Batches/plants
Gen. plant parameters
67
Page 68

4 Visualization
68
Page 69

5 Memory Presentation (History)
Event list
Scroll lines
Scroll pages
Zoom and Search
Numerical measurement
display
Channel step-on
End memory presentation
Present cursor position
The Memory presentation function can be used to display and check data
from the internal main memory (SRAM) of the instrument. The size of the
memory for memory presentation can be configured.
The memory presentation can be activated in the visualization modes “Curve
presentation” and “Binary presentation”, and is also used to display
completed batches.
The memory presentation can only be called up if the parameter
Configuration
to “Display, save” in the configuration for the group.
Groups Group x Parameters Status is set
Activate
memory
presentation
(History)
h In “Curve presentation” or “Digital presentation”, rotate and press the “H”
symbol to select and activate the History presentation.
A cursor is now shown in the center of the visualization window. The
corresponding measurements are shown in the line for “Numerical
measurement display”. The status and title bar shows the time corresponding
to the present cursor position, storage cycle that was used, and the scaling for
the presentation.
69
Page 70
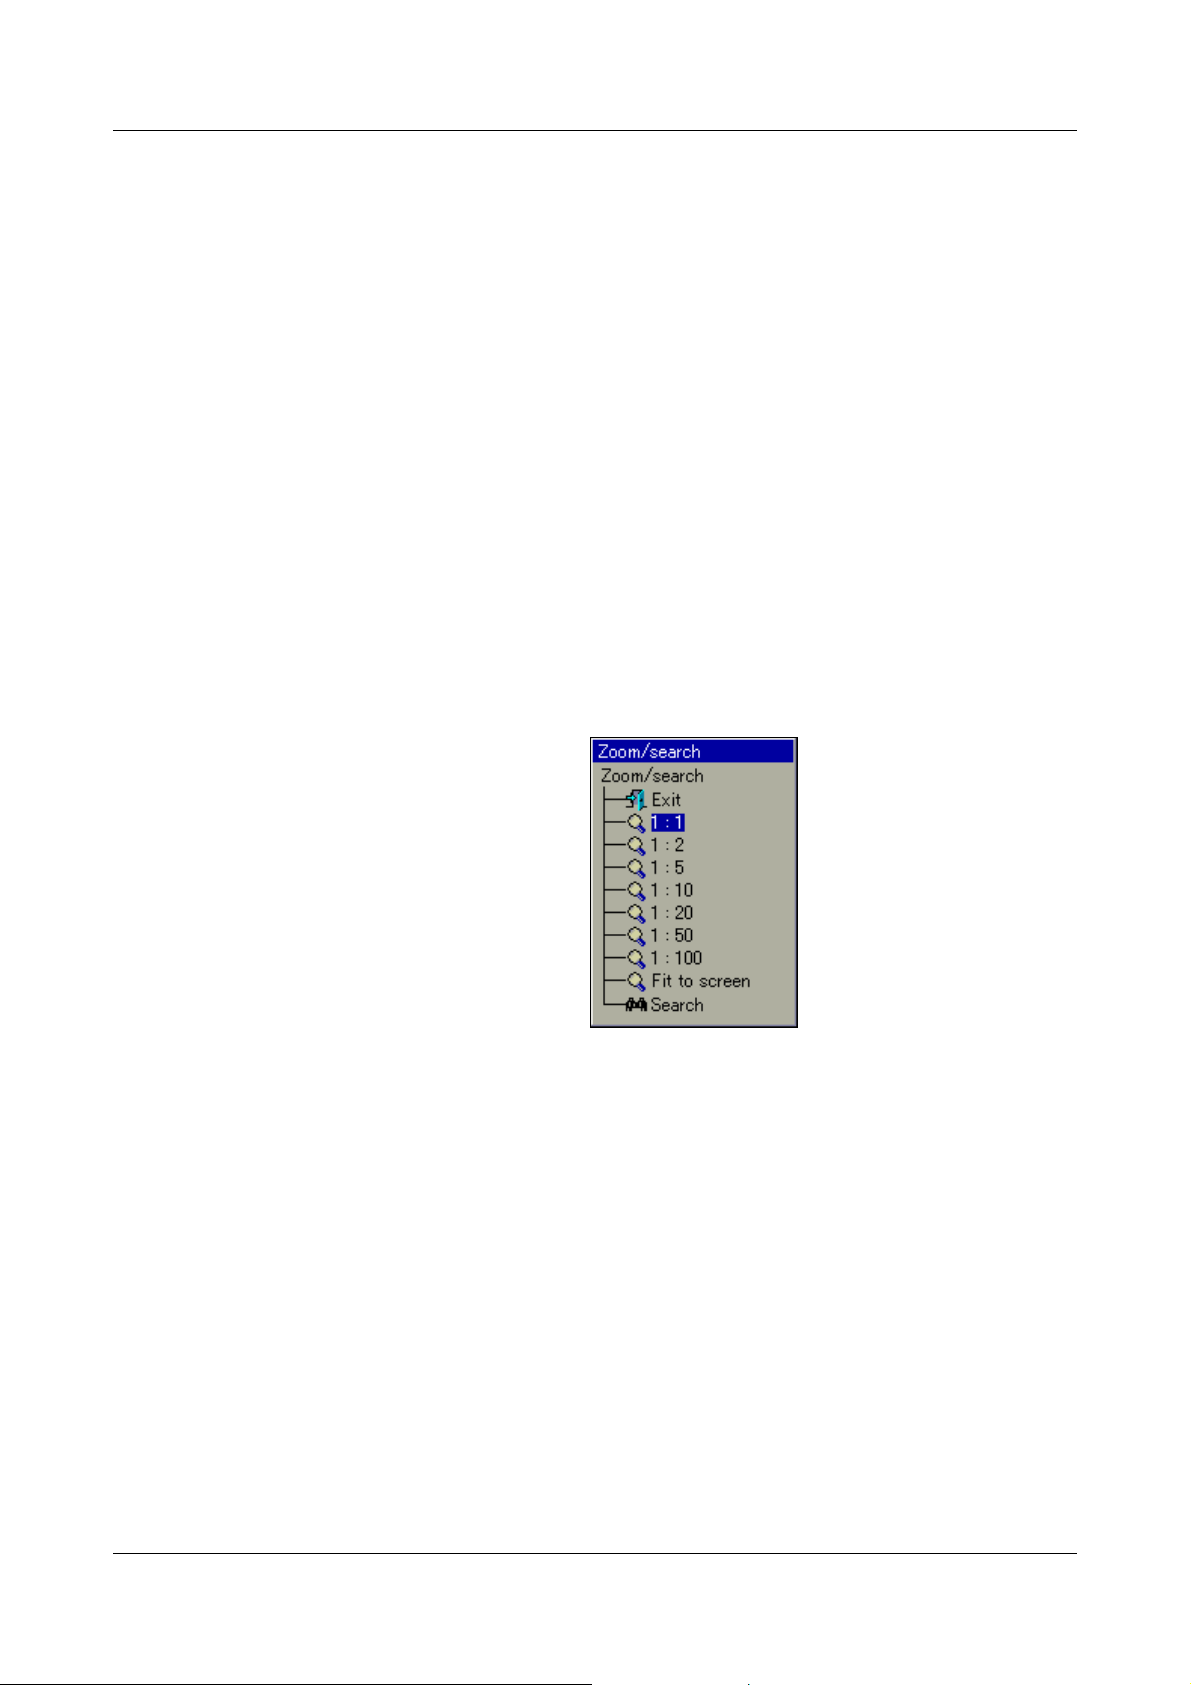
5 Memory Presentation (History)
Event list This function is used to present the event list for the group that is visible. The
message that is closest to the cursor is shown in the list.
v Chapter 6 "Alarm and Event Lists"
Scroll lines Rotating the control knob moves the cursor through the visualization window.
The data in the “Numerical measurement display” are updated every time
there is a shift. If you move right up to the edge of the window, the
measurement curve will automatically be shifted and the required data will be
presented.
“Scroll lines” can be ended by pressing the control knob.
Scroll pages Rotating the control knob moves the cursor an entire screen (=page) at a time.
The data in the “Numerical measurement display” are updated every time
there is a shift. The system automatically positions the cursor at the end of the
page, as required.
“Scroll pages” can be ended by pressing the control knob.
Zoom and
search
This function affects how many measurements are used to calculate a point in
the diagram, and to search for measurements according to date and time.
Zoom
The factory setting is “1:1”, which means that every measurement in the
History memory will be displayed. “1:2” means that every second
measurements is displayed, and so on.
h Select the zoom factor by rotating the control knob.
h Close the dialog window and activate the new zoom factor by pressing the
control knob.
70
h Selecting “Exit” closes the dialog window, and the presentation remains
unchanged.
Fit to screen
This function is only available for presenting the data for a completed batch. If
this function is selected, the zoom factor will automatically be adjusted so that
the measurement curve for the completed batch is shown in one window.
However, 1:1 presentation should be used for evaluating a batch.
Page 71

5 Memory Presentation (History)
Search
If you select “Search”, the dialog window for entering the date will be shown.
h Select the date and time, and use OK to close the dialog.
If the date that was entered is in the History memory, the cursor will move to
this position and the data will be shown.
Numerical
measurement
display
Channel stepon
Close memory
presentation
This function decides whether the MAX or MIN values are shown in the
“Numerical measurement display”. Min or Max values arise when more
measurements are recorded than are displayed. This will be the case if “Min/
Max recording” is activated in a group operating mode.
This function activates the scaling display. Repeatedly activating the function
steps through the scaling for the channels within the group, and then blanks it
out again.
This function starts the presentation of the data that are available in the
internal main memory of the instrument.
71
Page 72

5 Memory Presentation (History)
72
Page 73

6 Alarm and Event Lists
The alarm and event lists can be called up in two ways:
- A call from one of the visualization modes, e.g. curve presentation
(diagram)
(Chapter 4.2 "Overview of Header Lines")
and
- A call from the memory presentation
(Chapter 5 "Memory Presentation (History)").
Alarm lists Alarm lists contain only the alarms and errors that are currently present.
The alarm list will not be updated as long as the window is open.
Remedy: Close once, and open again. This will update the alarms.
Event lists Events list contain all the events that have occurred, including all alarms and
errors.
A maximum of 150 entries can be fitted into the two lists. The lists
will be deleted if a reconfiguration takes place.
The following description assumes that three batches are being
used. The number of batches may vary, because it can be
configured by the user.
73
Page 74

6 Alarm and Event Lists
Complete list of alarms
Batch-related
alarm lists
if the number of
batches is reduced,
then fewer entries
will be displayed.
Complete list of
events
Batch-related
event lists
6.1 Call from One of the Visualization Modes
h In the header line, rotate and press the control knob to select and activate
the bell symbol.
h Select the required list.
Activate
alarm list
Activate
event list
h Rotate the control knob to select a list, then press the knob to activate the
list.
First, the directory tree for the event lists must be “unfolded”.
h Rotate the control knob to select an event list, then press the knob to
activate the list.
74
Page 75

6 Alarm and Event Lists
h Rotate the control knob to select a list, then press the knob to activate the
list.
Example In the example, you can see a complete event list.
Close list h Close the event list by pressing the control knob.
The visualization that was active before the list was called up will now be
displayed again.
75
Page 76

6 Alarm and Event Lists
6.2 Call from the Memory Presentation
h In the header line, rotate and press the the control knob to select and
activate the bell symbol.
Only the event list for the active group will be shown in the memory
presentation. The message that is closest to the cursor is shown in the list.
Close list h Close the event list by pressing the control knob.
The memory presentation that was active before the list was called up will now
be displayed again.
6.3 Symbols
Power on (instrument has been switched on)
Power off (instrument has been switched off)
Error
Alarm disappears (alarm is no longer present)
Alarm occurs (an alarm is present)
Comment
Event occurs (e.g. binary input has been closed)
Event disappears (e.g. binary input has been opened)
76
(no
symbol)
Other messages
Page 77

7 Memory Manager
If this symbol appears in the status and title
bar, do not remove the CF card!
The memory manager contains functions for data exchange between the
paperless recorder and CF memory cards or USB memory sticks.
Symbols The symbol for the Memory manager (menu: Memory manager) in the header
can be shown in different ways.
This shows the available memory of the CompactFlash memory card that has
been inserted.
Shows the available memory of the USB memory stick.
If no CF card or no USB memory card has been inserted, then one of the
following symbols will be shown, depending on the type of data read-out that
was configured.
This shows the available internal memory for reading out data via the
CompactFlash memory card.
Activation
for CF cards
This shows the available internal memory for reading out data via the interface.
Access to the memory manager menu via the header is only
possible if a CF card is inserted in the device.
If one of the visualization modes, (see Chapter 4 - e.g. Curve
Presentation), is active when a CF card is inserted in the
instrument, then the menu appears automatically.
If not all functions are available, then you must log in to the device
first, in order to obtain the required access rights.
v Chapter 8.2 "Log-in and Log-out"
The CF card must not be removed while a data transfer to or from
the card is in progress.
77
Page 78

7 Memory Manager
Service data- > CF card
Save all + update CF card
CF card -> config. data
Config data -> CF card
Backup -> CF card
Update CF card
Close memory manager
CF card -> user list
Software update
Remove hardware safely
Activation
for USB stick
Start via menu h Activate the memory manager by rotating and pressing the control
knob (CF card must be inserted).
Access to the Memory manager menu via the header is not
possible with a USB memory stick.
If one of the visualization modes (Chapter 4 - e.g. Curve
Presentation) is active when a USB memory stick is inserted, the
menu automatically appears and remains active until the memory
stick is removed again.
If not all functions are available, then you must log in to the device
first, in order to obtain the required access rights.
v Chapter 8.2 "Log-in and Log-out"
The USB memory card must not be removed while a data transfer
to or from the stick is in progress.
78
Page 79

7 Memory Manager
The functions of the memory manager are the same for CF cards
and USB memory sticks. For USB sticks, the menu entries have
"USB stick" instead of "CF card".
Close memory
manager (Exit)
Safely
removing
hardware
Update
CF card
Backup ->
CF card
Config data ->
CF card
Close the memory manager and reactivate the previous visualization.
The function should always be called before removing a CF card or a USB
stick. This is the only way to ensure that files are properly stored on the data
storage medium.
When the message "Hardware can be removed now" appears, the data
storage medium can be removed.
Measurement data not yet saved to a CF card (a USB stick) are written to the
data storage medium.
All measurement data in the memory (also those which have already been
fetched) are written to the data storage medium.
The configuration data and the user list (for password management) are
written to the data storage medium.
CF card ->
config. data
Save all +
update CF
card
Service data ->
CF card
Software
update
CF card ->
user list
Configuration data are read into the device from the data storage medium.
This will give the recorder a new configuration.
Subsequently, the data recording will be started again.
All current reports will be concluded and written to the data storage medium,
together with the measurement data that have not yet been saved. The
present counter and integrator states will also be saved.
Special data are saved to the CF card. The function may only be carried out if
the user has been asked to do so by a service engineer from the instrument
manufacturer.
This function serves for reading in a new device software (firmware). To do this,
a special CF card is required. Only a service engineer from the instrument
manufacturer may perform the update.
The user list is read in from the data storage medium and activated in the
paperless recorder.
79
Page 80

7 Memory Manager
General
information
The function CF card update reads out data that have not yet been
read out. After read-out, data are not marked as read in the
recorder but are not deleted.
Function Backup
including what had already been read. After read-out, the data are
marked as read in the recorder. The function Backup
therefore ideal for test and service work.
Only one data storage medium can ever be inserted at a time,
either a CF memory card or a USB memory stick. Paperless
recorders without extra code Stainless steel are equipped with two
USB host interfaces (one on the front and one on the back). In this
case also, only one can be used at a time, never both together.
CF card reads all data from internal memory,
CF card is
80
Page 81

No user
Parameterization
Configuration
Device audit trail
Device information
Log-in and log-out
Close Device Manager
Service functions
logged in
“User”
logged in
8 Device Manager
The functions of the Device manager vary, depending on whether a user is
logged in or not.
User
“Master”
logged in
The differences between “No user logged in” and “User logged in”
only become visible in the submenu “Parameterization”.
81
Page 82

8 Device Manager
Log-in
Log-out
Change password
Close dialog
8.1 Close Device Manager
Close the device manager and reactivate the previous visualization.
8.2 Log-in and Log-out
h Select the Device manager in the header, by rotating the control
knob.
h Activate the Device manager by pressing the control knob.
h In the Device manager activate the function Log in.
Default
users
Log-in h In the menu Device manager
h Select the user. The user name can be changed by rotating the control
knob.
The paperless recorder is delivered ex-factory with an internal user
list which contains two users.
1. User: Master password: 9200
2. User: User password: 0
The setup program can be used to alter the two user names and
their passwords and access rights, and transfer this information to
the device.
Log-in, activate the function Log-in.
82
Page 83

8 Device Manager
h Select “OK” with the control knob, and press the control knob.
h Enter the password by rotating and pressing the control knob, and finish
the entry with “OK”.
You are now logged in to the system.
83
Page 84

8 Device Manager
Module 1 = bottom module slot
Module 2 = middle module slot
Module 3 = top module slot
Device name (configurable)
Version of device software
(firmware)
8.3 Device information
This function provides you with information on the hardware and software
components of the instrument. The momentary values of all the internal and
external inputs can also be checked.
The control knob can be rotated to display every single table. The function is
terminated by pressing the control knob.
Version
84
Page 85

Info
Module 1 = bottom module slot
Module 2 = middle module slot
Module 3 = top module slot
Date and time of
last reconfiguration
Switching state of relay 1
(fitted as standard);
0= not switched
Bottom module slot
Top m o dule s l ot
Middle module slot
RS232 for barcode reader
8 Device Manager
Hardware
85
Page 86

8 Device Manager
Display of the current
analog values from module
The * indicates that an
offset or fine calibration is
active on this channel.
Display of the current
analog values from module
States of the binary inputs/
outputs (0 = not active).
Module 1 The picture below shows a module that has been fitted with 6 analog inputs.
Depending on the hardware level, the picture may look different. Module 1 is in
the bottom module slot.
Module 2 The picture below shows a module that has been fitted with 3 analog inputs
and 8 binary inputs/outputs. Depending on the hardware level, the picture may
look different. Module 2 is in the middle slot.
86
Page 87

8 Device Manager
Switching state of relays
(0 = not switched).
Module 3 The picture below shows a module that has been fitted with a relay card
(6 relays). Depending on the hardware level, the picture may look different.
Module 3 is in the top slot.
Ext. analog
input (AE) 1 — 2
Ext. binary input
(BE)
Ext. texts The window shows the current external texts, which can be integrated into the
The two windows show the current external analog inputs. External analog
inputs are read into the recorder via one of the interfaces (e.g. through the
Modbus Master function).
The window shows the current external binary inputs. External binary inputs
are read into the recorder via one of the interfaces (e.g. through the Modbus
Master function). Unlike the internal binary inputs/outputs, external binary
outputs are not available.
batch reports as label or information text. External texts are read into the
recorder via one of the interfaces (e.g. through the Modbus Master function).
87
Page 88

8 Device Manager
Information about the current
Ethernet configuration
Information about the current
Ethernet communication
Eth. info 1
Eth. info 2
88
Parameter
Ethernet status 1
Ethernet status 2
Ethernet status 3
Ethernet status 4
Description
Received Ethernet packets
Received Ethernet packets with errors
Transmitted Ethernet packets
Transmitted Ethernet packets with errors
Page 89

8 Device Manager
Parameter
Ethernet status 5
Ethernet status 6
Ethernet status 7
Ethernet status 8
Ethernet status 9
USB info Information appears in the window via the USB interfaces. This information is
only of interest for servicing.
Interface Information about the serial interfaces and PROFIBUS DP interface appears in
the window. The user can see the set interface parameters without having to
go to the configuration. Parameters are also visible if there are no users logged
in on the instrument.
Description
Received TCP packets
Received TCP packets with errors
Transmitted TCP packets
Transmitted TCP packets with errors
Received Lease time, in seconds
8.4 Device Audit Trail
The audit trail contains a log of all user actions on the recorder.
The function is terminated by pressing the control knob.
89
Page 90

8 Device Manager
8.5 Configuration
This function can be used to alter the configuration of the recorder.
v Several chapters in this operating manual deal with the configuration, which
starts in Chapter 10 "Configuration - General".
An alteration of the configuration results in the current recording
being closed down and the new data being recorded in a separate
time frame from the “old” data. It is not possible to present the
data before reconfiguration and the data after reconfiguration as a
single entity. The instrument works with a new configuration.
8.6 Parameterization
For parameterization, some functions will not be available if no user is logged
in, or the user who is logged in does not have the access rights for these
functions.
Only the setting of individual current batch numbers is enabled in the factory
(default) setting.
v Additional information can be found in Chapter 9 "Parameterization".
90
Page 91

8.7 Service
8 Device Manager
The “Service” functions will also not be available if no user is logged in, or the
user who is logged in does not possess access rights for these functions.
Config. ->
factory settings
Restore factory
settings
Debug window Only a service engineer from the instrument manufacturer may use this
The current configuration can be saved within the device as the new factory
setting.
The factory setting, e.g. created by “Set->curr. settings as default”, is called
up and the instrument is reset.
function.
91
Page 92

8 Device Manager
92
Page 93

No user
logged in
“User”
logged in
9 Parameterization
The functions in the Parameterization menu vary, depending on whether a user
is logged in or not.
User
“Master”
logged in
93
Page 94

9 Parameterization
9.1 Fine calibration
Using “Fine calibration”, an adjustment (correction) of the internal analog
measurements can be activated. The adjustment is carried out using a linear equation.
Example Systematic errors, such as those caused by an unsuitable probe mounting, have
occurred in a plant. A probe provides measurements that cover a temperature range
from 200 to 300°C. It has been installed in a tunnel oven so unfavorably as to always
indicate 10°C less than the temperature of the charge. The incorrect measurement
can be corrected through fine calibration.
Parameterization Fine calibration Analog input 1 Actual start val. : 200°C
Parameterization Fine calibration Analog input 1 Target start val. : 210°C
Parameterization Fine calibration Analog input 1 Actual end val. : 300°C
Parameterization Fine calibration Analog input 1 Target end val. : 310°C
9.2 Counters/integrators
With the aid of this function, the present counter and integrator states can be
altered (for instance, to 0 or any start value). The alteration is documented in
the event list whereby the old and the new values are specified. It is effective
only once.
9.3 Date and time
Using this function, the current date and current time are set for the recorder.
Additional functions for configuring date and time functions (e.g. daylight
saving time) can be found in the menu Configuration
v Chapter 24 "Configuration - Date and Time"
Date and time.
94
Page 95

9.4 Batches/plants
Batch number 1
Irrespective of the number of batches (plants) used, this function is available
for configuring the start numbers of up to three batch numbers. The batch
numbers can be switched into display when recording batches in the batch
report. At the end of a batch, the value is incremented by one.
Example:
Batch
numbers
9 Parameterization
Current batch
for Plant 1
Batch numbers are assigned to a currently present batch in the menu
Configuration
v Chapter 23 "Configuration – Batches/Plants"
Batches/plants.
95
Page 96

9 Parameterization
96
Page 97

10 Configuration - General
Device Manager
The menu Device manager Configuration can only be called up if a user is
logged in who is authorized to perform the configuration.
With the aid of the setup program, the user rights can be altered
and transferred to the paperless recorder via the interface or
CF card.
h Select the submenu by rotating the control knob.
h Activate the submenu by pressing the control knob.
For clarity, the description of the individual submenus has been divided among
the following chapters.
97
Page 98

10 Configuration - General
98
Page 99
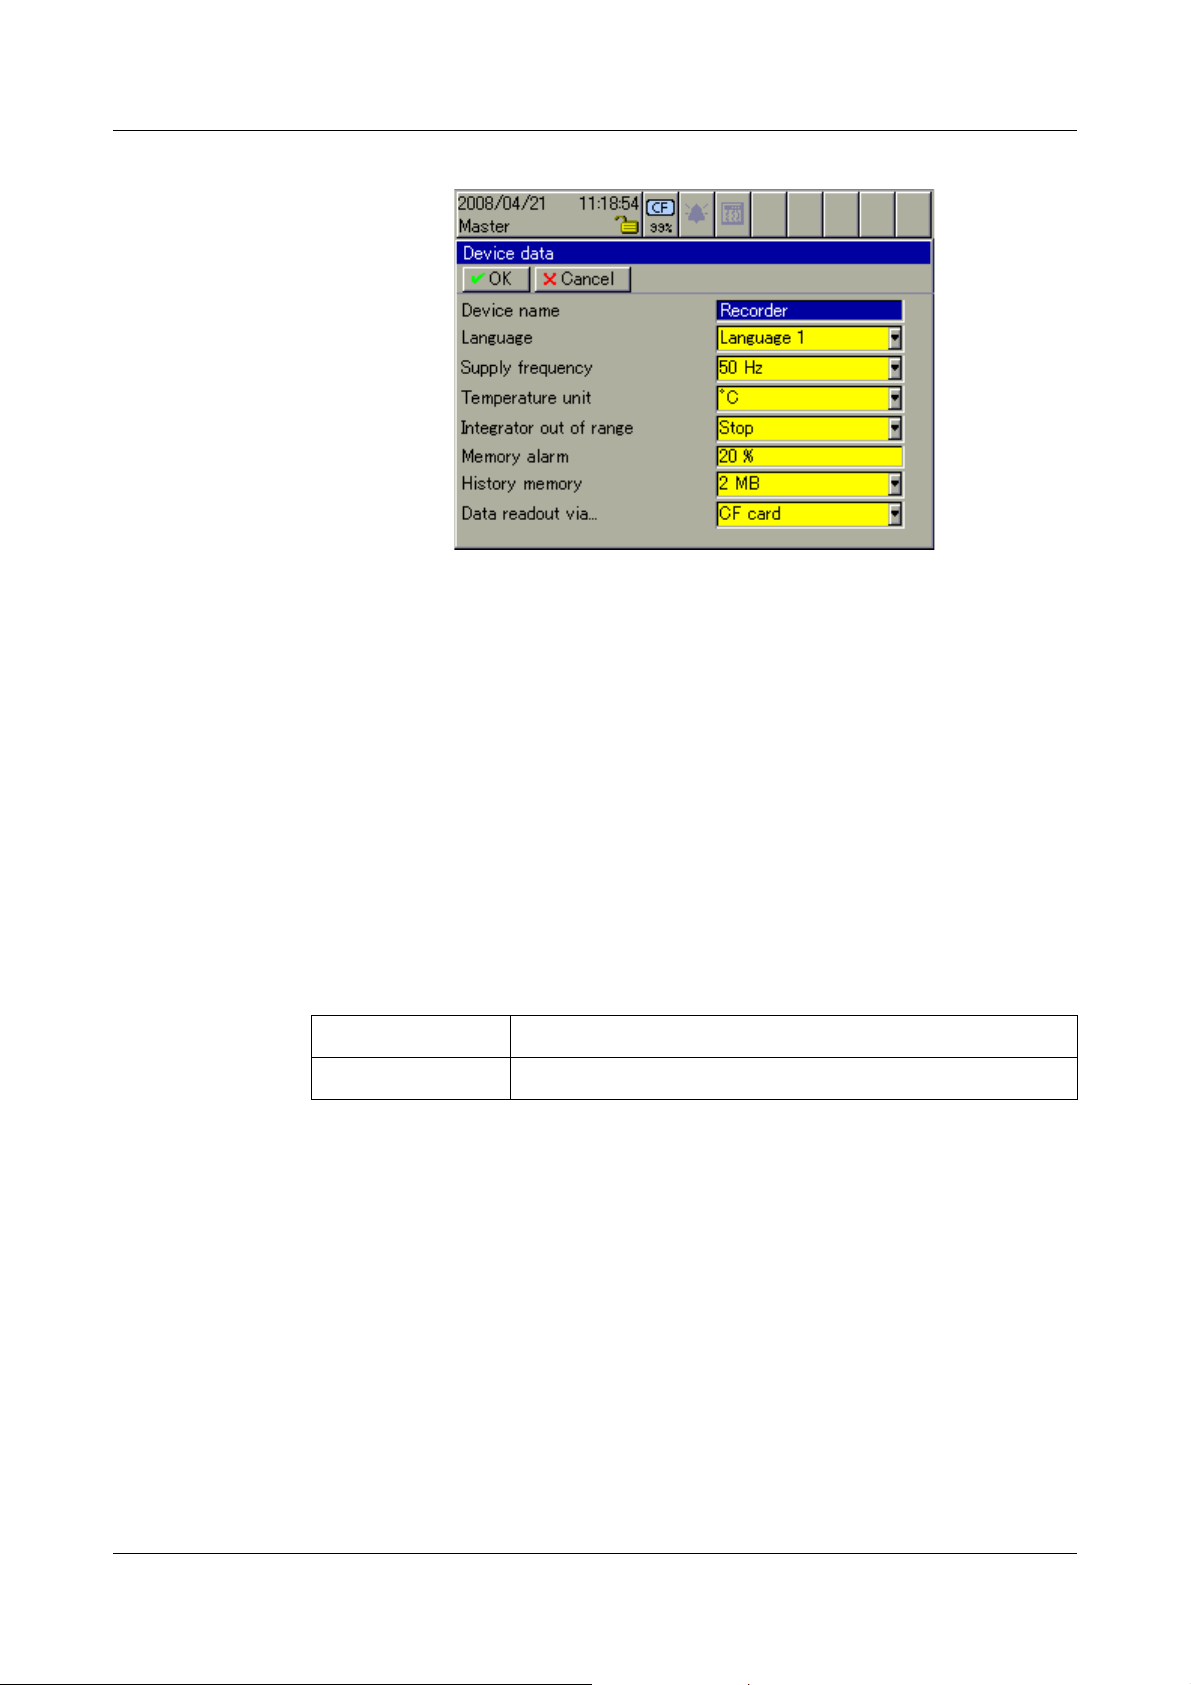
Overview
11 Configuration - Device Data
Device
(instrument)
name
Language First choose between the two instrument languages. All texts (fixed and
Supply
frequency
Te mpe ra tu re
unit
Integrator with
Out of Range
Memory alarm
(warning)
The device name (up to 15 characters) is used for the identification of the
paperless recorder in the instrument (Device info menu), in the setup program
or in the PCA Communications software PCC.
variable ones) can be altered through the setup program. Individual texts in
any language can be implemented in this way.
Set the frequency of the supply voltage used.
Set the temperature unit of your choice. When configuring the analog
channels, the measurement range limits are shown in the chosen unit.
The response of the integrator (totalizer) channels is set here if the value of the
input signal for an integrator is invalid.
Stop Integration is stopped.
Invalid Integration is set to invalid (“---------”).
The memory alarm (warning) is triggered when the available measurement
data memory has fallen below the configured value. With regard to the
memory alarms, a distinction is made between
- “readout via CF card”,
- “readout via interface” and
- “internal memory”.
If the memory alarms are set, there is a danger of a data loss. The
data must be read out of the recorder without delay.
99
Page 100

11 Configuration - Device Data
History
(data) memory
Data readout
via ...
Here you can determine the size of the History memory. The memory is used
to show stored measurement data that are outside the present curve view.
The History presentation is started through the History function in the header.
v Chapter 5 "Memory Presentation (History)"
The memory readout type of your choice is selected here. The parameter only
affects the header, and when there is no CF card in the slot.
Interface
This shows the available memory for reading out data
via one of the interfaces (RS232/RS485, setup interface
or Ethernet). The data readout can, forinstance, be
implemented via the PCA
Communications software PCC.
CF card
This shows the available memory for reading out data
via the CF memory card.
If the symbol is shown in red, a memory alarm for the corresponding type of
readout is present.
If the CF card is inserted, the available memory of the CF card is displayed.
The parameter “Read data via ... (Display CF capacity)” is irrelevant at this
point.
The minimum size of available storage space (in %) is determined
through the parameter Configuration
alarm. If less memory space is available than has been set, there
will be an entry in the event list.
Device data Memory
100
 Loading...