

Page 1
SmartSensor Advance
USER GUIDE
Page 2

SmartSensor
Advance
USER GUIDE
www.wavetronix.com 78 East 1700 South Provo, Utah 84606 801.734.7200
Page 3

© 2014 Wavetronix LLC. All Rights Reserved.
Wavetronix, SmartSensor, Click, Command, and all associated product names and logos are trademarks of Wavetronix LLC. All other
products or brand names as they appear are trademarks or registered trademarks of their respective holders.
Protected by US Patent Nos. 6,556,916; 6,693,557; 7,426,450; 7,427,930; 7,573,400; 7,889,097; 7,889,098; 7,924,170; 7,991,542;
8,248,272; 8,665,113; Canadian Patent Nos. 2461411; 2434756; 2512689; and European Patent Nos. 1435036; 1438702; 1611458. Other
US and international patents pending.
e Company shall not be liable for any errors contained herein or for any damages arising out of or related to this document or the
information contained therein, even if the Company has been advised of the possibility of such damages.
is document is intended for informational and instructional purposes only. e Company reserves the right to make changes in the
specications and other information contained in this document without prior notication.
FCC Part 15 Compliance: e Wavetronix SmartSensor sensors comply with Part 15 of the Federal Communications Commission
(FCC) rules which state that operation is subject to the following two conditions: (1) this device may not cause harmful interference,
and (2) this device must accept any interference received, including interference that may cause undesirable operation. FCC compliance statements for applicable optional modules are to be found in the module specications. Unauthorized changes or modications
not expressly approved by the party responsible for compliance with the FCC rules could void the user’s authority to operate this
equipment.
Disclaimer: e advertised detection accuracy of the Wavetronix SmartSensor sensors is based on both external and internal testing,
as outlined in each product’s specication document. Although our sensors are very accurate by industry standards, like all other sensor manufacturers we cannot guarantee perfection or assure that no errors will ever occur in any particular applications of our technology. erefore, beyond the express Limited Warranty that accompanies each sensor sold by the company, we oer no additional
representations, warranties, guarantees or remedies to our customers. It is recommended that purchasers and integrators evaluate the
accuracy of each sensor to determine the acceptable margin of error for each application within their particular system(s).
WX-500-0052
10/2012
Page 4

Contents
Introduction 5
SmartSensor Advance Package 6 • Selecting a Detection
Method 6 • Selecting a Mounting Location 7
Part I Installing the SmartSensor Advance
Chapter 1 Installing the SmartSensor Advance 15
Selecting the Mounting Height 15 • Mounting the Sensor 16
• Aligning the Sensor 19 • Applying Silicon Dielectric Compound 24 • Connecting the SmartSensor 6-conductor Cable
24 • Grounding the Sensor 25
Chapter 2 Connecting Power and Surge Protection 27
Mounting the Backplate 28 • Connecting AC Power 28 • Providing System Surge Protection 32 • Terminating the 6-conductor Cables 34 • Contact Closure Connections 36
Part II Using SmartSensor Manager Advance
Chapter 3 Installing SmartSensor ManagerAdvance 39
Installing SSMA 39
Chapter 4 Communication 43
Serial Connection 44 • Internet Connection 45 • Virtual
Connection 46 • Multi-drop Network 49 • Address Book 50 •
Viewing Connection Information 51 • Uploading the Sensor’s
Embedded Soware 54
Page 5

Chapter 5 Sensor Settings 57
General Tab 57 • Communication Tab 59
Chapter 6 Sensor Configuration 61
1. Installation Details 62 • 2. Automatic Radar Conguration
64 • 3. Manual Radar Adjustment 65
Chapter 7 Channels-Alerts-Zones 71
Channels 72 • Alerts 84 • Zones 84
Chapter 8 Verify Channels-Alerts-Zones 91
Right Sidebar 92 • Roadway Display 98 • Le Sidebar 106
Chapter 9 Setup Output Communications 109
Primary Push Manager 110 • Secondary Push Manager 112
Chapter 10 Templates 115
Creating a Channel Template 116 • Importing a Channel Template 116 • Copying/Pasting Channels, Alerts and Zones 118
Chapter 11 Tools 119
Backup/Restore Tool 120 • Beam Alignment Tool 123 • Serial
Terminal 124 • Rack Card Tools 125
Chapter 12 Programming Contact Closures 129
Click 112/114 Contact Closure Cards 129 • Click 172/174
Contact Closure Cards 130 • Click 104 Contact Closure Module 133
Appendix 137
Appendix A – Cable Connector Denitions 137 • Appendix
B – Cable Lengths 139 • Appendix C – Direct Serial Connections 142 • Appendix D – Target Roll Angles for Alignment
143 • Appendix E – Command Line Arguments 145
Page 6

Introduction
In this chapter
SmartSensor Advance Package
Selecting a Detection Method
Selecting a Mounting Location
e Wavetronix SmartSensor Advance™ and Wavetronix SmartSensor Advance Extended
Range detect and continuously monitor the progression of moving trac out to a maximum range of 600 . (182.9 m) and 900 . (274.3 m) respectively.
Both trac sensors are designed for use on the approaches to signalized intersections. ey
are used to alert the trac controller of a vehicle’s arrival based upon the incoming range,
speed, and estimated time-of-arrival of each detected vehicle for applications such as highspeed dilemma zone protection and queue reduction. In addition, SmartSensor Advance
Extended Range allows you to prioritize dilemma zone protection based upon the discovery range of trucks and passenger cars.
SmartSensor Advance and SmartSensor Advance Extended Range monitor vehicle trac
ow through the use of a 10.525 GHz (X band) operating radio frequency. Both sensors
utilize Digital Wave Radar™ technology to provide a reliable Frequency Modulated Continuous Wave. SmartSensor Advance Extended Range uses a new form of frequency modulation to achieve its extended reach.
e SmartSensor Advance User Guide is divided into two parts. Part one provides a step-by-
step process for installing the SmartSensor Advance and the SmartSensor Advance Extended Range, including mounting and alignment guidelines. Part two provides instructions for
installing and using the SmartSensor Manager Advance soware, including instructions for
both automatic and manual sensor congurations. Any questions about the information in
this guide should be directed to Wavetronix or your distributor.
Page 7

6 INTRODUCTION SMARTSENSOR ADVANCE USER GUIDE
Caution
Do not attempt to service or repair this unit. This unit does not contain any components and/or parts serviceable in the field. Any attempt to open this unit, except
as expressly written and directed by Wavetronix, will void the customer warranty.
Wavetronix is not liable for any bodily harm or damage caused if service is attempted
or if the back cover of the SmartSensor unit is opened. Refer all service questions to
Wavetronix or an authorized distributor.
SmartSensor Advance Package
A typical SmartSensor Advance package will commonly include:
10.525 GHz SmartSensor Advance radar trac sensor
SmartSensor mounting kit
SmartSensor 6-conductor cable
SmartSensor Advance preassembled backplate
SmartSensor Manager Advance (SSMA) soware
SmartSensor Advance User Guide
SmartSensor Advance Quick-reference Guides
Check the packing slip for actual contents. If any of these items are missing, note the serial
number located on the back of the sensor and contact your distributor.
Selecting a Detection Method
Consult the Wavetronix guidelines for integration of SmartSensor Advance into your trac
control system. For dilemma zone protection applications, integration guidelines can be
found on the Wavetronix website and Wavetronix application notes. Contact your dealer or
a Wavetronix Technical Services representative if the application-specic documentation
does not fully answer your system integration and conguration questions.
Some examples of trac control applications include:
Dilemma zone protection using green extension
Truck signal priority using green extension
Dilemma zone protection using green extension with an Advanced Warning Sign
(AWS)
Trac signal performance measures
Queue clearance
Ecient green extension
Queue management
Page 8

INTRODUCTION SMARTSENSOR ADVANCE USER GUIDE 7
Note
For queue management the SmartSensor Advance Extended Range is recommended
because it allows you to see a greater range and also provides a view of the stop
bar. The SmartSensor Advance Extended Range is also recommended for wrong-way
detection applications. Contact Wavetronix Technical Services for more information.
If your application is dilemma zone protection and/or truck signal priority, SafeArrival™
technology is recommended because it provides signicant safety and eciency advantages when compared with traditional point-based protection. Conguring SafeArrival
technology for dilemma zone protection is as simple as selecting the arrival times, ranges
and speeds that are unsafe and warrant protection. Conguration SafeArrival technology
for truck signal priority requires the additional conguration of the truck discovery range
threshold available with SmartSensor Advance Extended Range.
For green extension, arrival times between 2.5 and 5.5 seconds, ranges from 100 to 500 .
(30.5 to 152.4 m) and speeds above 35 mph (56 kph) are generally considered unsafe for
passenger vehicles. For truck signal priority, arrival times between 2.5 and 7.5 seconds,
ranges from 100 to 900 . (30.5 to 274.3 m) and speeds above 35 mph (56 kph) are generally
considered unsafe for trucks, buses and other large vehicles.
However, engineering judgment needs to be used in selecting these parameters. For example, 2.5 to 5.5 second arrival times are nominal values based upon general 10% and 90%
stopping probabilities. Your agency may suggest protection of slightly dierent arrival times
for a particular type of high-speed approach.
It may be helpful to consult your agency’s guidelines to verify which trac conditions warrant protection at your intersections. Location of point-detection zones, passage time and
design speed can oen be used to discover the arrival times and ranges that warrant protection. In addition, the minimum speed that would warrant installation of a dilemma zone
protection system may be used as a guideline for the lowest speed to be protected.
If you elect not to use SafeArrival technology, you can also congure SmartSensor Advance
to match your agency’s loop-based dilemma zone protection guidelines. Before doing so, it
is recommended that you explore the benets provided by SafeArrival technology in detail.
Selecting a Mounting Location
Consider the following guidelines when selecting a mounting location:
Detection coverage – Position the sensor so that it will be able to reach all the speci-
ed advanced detection zones. Also consider that the sensor will track vehicles as they
enter and exit desired detection zones. Accordingly, the sensor will oen work better if
Page 9
8 INTRODUCTION SMARTSENSOR ADVANCE USER GUIDE
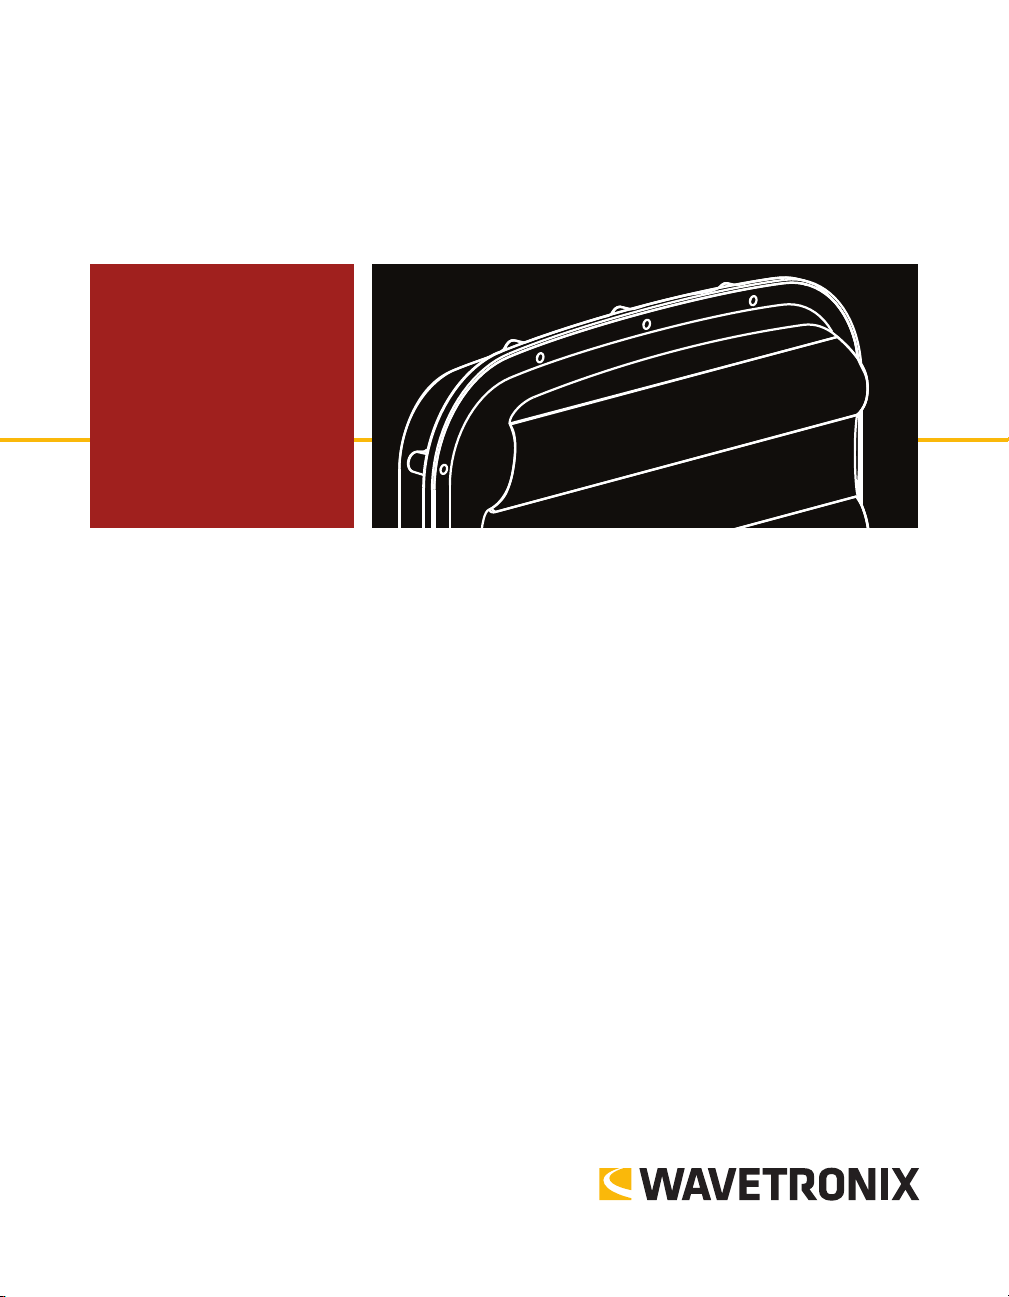
➋
you position detection coverage to track vehicles for several feet before they reach the
rst zone. e closest detection zone provided by SmartSensor Advance and Smart-
Sensor Advance Extended Range is 50 . (15.2 m) from the location of the sensor. e
farthest detection zone provided by SmartSensor Advance Extended Range is 900 .
(274.3 m). e farthest detection zone provided by SmartSensor Advance is 600 .
(182.9 m). e sensor is usually used to detect incoming trac, but it can detect in-
coming or outgoing trac, and it lters out the opposite direction trac. With Smart-
Sensor Advance Extended Range, incoming large vehicles are typically discovered by
about 750 . (228.6 m) and small vehicles are typically discovered about 600 (182.9
m) from the sensor. With SmartSensor Advance, most incoming large vehicles are dis-
covered by about 500 . (152.4 m) and most small vehicles are discovered about 400
(121.9) from the sensor.
➌
➍
➊
Figure I.1 – Mounting Locations
Line-of-sight – Position the sensor so that it will have line-of-sight to the entire detec-
tion area of interest. Avoid structural occlusion including trees, signs and other road-
side structures.
Closest roadside – If you install the sensor on the side of the road (instead of over-
head), select the location closest to the lanes of interest. is will prevent departing
trac from occluding approaching detections.
Through-Movement Detection – If only through-movement detection is desired, po-
sition the sensor to avoid detection of turn-only lanes. Consider using speed lters to
remove the impact of turning vehicles.
Mounting Height – Mounting the sensor as high as possible is recommended to reduce
same lane occlusion. A maximum of 40 . (12.2 m) and minimum of 17 . (5.2 m) is
recommended. If the sensor is higher than 30 . (9.1 m), the oset should be less than
50 . (15.2 m) to increase accuracy.
Page 10

INTRODUCTION SMARTSENSOR ADVANCE USER GUIDE 9
Mounting Oset – Mounting the sensor closer to the lanes of interest will usually in-
crease detection accuracies. A maximum oset of 50 . (152.4 m) is recommended, but
the sensor will still reliably track vehicles at further osets. Mounting with a smaller
oset will generally increase line-of-sight.
Cable Length – Make sure that you have sucient homerun and sensor cabling. With
the newer models, cable runs as long as 1500 . (457.2 m) are achievable using 24 VDC
operation and RS-485 communications. Older models supported up to 600 . (182.9
m). Consult Appendix B for more information.
Suspended Electrical Cables –e sensor is designed to work in the presence of
suspended power lines and other electrical cabling, however these cables should be
mounted at least ten feet away from the front of the sensor.
Neighboring Structures and Parallel Walls – For best performance, it is preferred that
the sensor be mounted without signs or other at surfaces mounted directly behind it.
is will help reduce multiple reection paths from a single vehicle.
e SmartSensor Advance should be mounted using one of the following options (see Figure I.1):
1 On a vertical pole – e preferred mounting location for the SmartSensor Advance or
SmartSensor Advance Extended Range is oen a vertical pole near the stop bar. Vertical poles are typically installed on the roadside of the approach near the stop bar to
support a mast arm, span wire or luminaire. ese poles oen extend as high as 30 .
(9.1 m) or more, allowing the sensor to be mounted high enough to reduce occlusion.
is mounting location is typically very safe for installation.
2 On a luminaire – is mounting location will oen reduce the oset and increase the
mounting height (a maximum of 40 . (12.2 m) is recommended). Make sure the luminaire can support the load of the sensor. is mounting location is typically very safe
for installation.
3 The backside of the opposing mast arm – By mounting on the backside of the mast
arm, opposite the signal heads for the opposing direction of travel, the sensor can be
placed near the lanes of interest. e minimum mounting height is 17 . (5.2 m), but
higher mounting is recommended to minimize occlusion. When appropriate, a vertical
extension can be used; the extension should have the ability to freely rotate the sensor
for alignment. e sensor should be mounted as far out on the mast arm as possible to
avoid potential occlusion issues with stopped vehicles in a le-turn pocket.
4 The front side of the mast arm – e sensor can be installed on the mast arm with
the signals for the approach of interest. SmartSensor Advance Extended Range is recommended at this mounting location, because typically 100 feet or more of the sensor’s range is used to cross the width of the intersection. For SmartSensor Advance
Extended Range, the eective maximum range of the sensor is still as high as 800 feet
from the stop bar at this mounting location. is mounting location can be helpful if
the minimum green time is so short that vehicles in the queue clearance zone do not
start moving before the minimum green timer expires.
e SmartSensor Advance or SmartSensor Advance Extended Range can also be mounted
at the back of the dilemma zone on an existing luminaire or custom pole if the luminaire
Page 11

10 INTRODUCTION SMARTSENSOR ADVANCE USER GUIDE
already exists, power is available and a wireless communication link can be used to avoid
trenching. Wavetronix has integrated wireless solutions readily available for this type of
installation.
Page 12

Page 13

Page 14

Part 1
Installing the SmartSensor
Advance
Chapter 1 – Installing the SmartSensor Advance
Chapter 2 – Connecting Power and Surge Protection
Page 15

Page 16

Installing the SmartSensor Advance 1
In this chapter
Selecting the Mounting Height
Attaching the Mount Bracket to the Pole
Attaching the Sensor to the Mount Bracket
Aligning the Sensor to the Roadway
Applying Silicon Dielectric Compound
Connecting the SmartSensor Cable to the Sensor
1
Installing the SmartSensor Advance is quick and easy. Once installed, SmartSensor Advance requires little or no on-site maintenance. is chapter describes the installation process, including how to attach the sensor to the pole and how to correctly align the sensor.
Warning
Caution should be used when installing any sensor on or around active roadways.
Serious injury can result when installation is performed using methods that are not
in accordance with authorized local safety policy and procedures. Always maintain an
appropriate awareness of the trac conditions and safety procedures as they relate
to specific locations and installations.
Selecting the Mounting Height
Select a mounting location within the recommended range of osets from the center of the
Page 17

16 CHAPTER 1 INSTALLING THE SMARTSENSOR ADVANCE
lanes of interest. Use Table 1.1 to determine the mounting height based on the oset. Osets
of less than 50 . (15.2 m) on either side of the center of the desired lanes are recommended.
Height (ft / m)
17 / 5.2 20 / 6.1 25 / 7.6 30 / 9.1 35 / 10.7 40 / 12.2
0 / 0 40 / 12.2 45 / 13.7 55 / 16.8 60 / 18.3 70 / 21.3 75 / 22.9
5 / 1.5 45 / 13.7 45 / 13.7 60 / 18.3 65 / 19.8 70 / 21.3 80 / 24.4
10 / 3 50 / 15.2 50 / 15.2 60 / 18.3 65 / 19.8 75 / 22.9 80 / 24.4
15 / 4.6 50 / 15.2 55 / 16.8 65 / 19.8 70 / 21.3 75 / 22.9 80 / 24.4
20 / 6.1 55 / 16.8 55 / 16.8 65 / 19.8 75 / 22.9 80 / 24.4 90 / 27.4
25 / 7.6 60 / 18.3 65 / 19.8 65 / 19.8 75 / 22.9 80 / 24.4 90 / 27.4
30 / 9.1 65 / 19.8 70 / 21.3 75 / 22.9 80 / 24.4 85 / 25.9 95 / 28.9
Oset (ft / m)
35 / 10.7 70 / 21.3 75 / 22.9 85 / 25.9 85 / 25.9 95 / 28.9 95 / 28.9
40 / 12.2 80 / 24.4 90 / 2 7.4 90 / 27.4 95 / 28.9 95 / 28.9 100 / 30.4
45 / 13.7 95 / 28.9 100 / 30.4 100 / 30.4 100 / 30.4 100 / 30.4 105 / 32
50 / 15.2 100 / 30.4 100 / 30.4 105 / 32 110 / 33.5 115 / 35 120 / 36.6
Table 1.1 – Target Distance (ft / m)
e minimum recommended mounting height is 17 . (5.2 m) and the maximum recommended mounting height is 40 . (12.2 m). Higher than 30-. (9.1-m) mounting heights
are acceptable if the sensor is within 50 . (15.2 m) of the road. Depending on the site and
type of trac, some vehicles may be momentarily occluded by other vehicles. Vehicle-based
occlusion favors detection of large vehicles, which may be acceptable for dilemma zone
protection applications. It may be necessary to increase the height of the sensor to reduce
occlusion, or use controller passage time to bridge the gap caused by occlusion.
Mounting the Sensor
e standard sensor mount has three axes of rotation: straps around pole, vertical swivel
points and horizontal swivel points. During the mounting process, keep the bolt nuts on the
mount loose. Your sensor mount’s degrees of freedom should be adjustable until you have
completed your alignment.
Attaching the Mount Bracket to the Pole
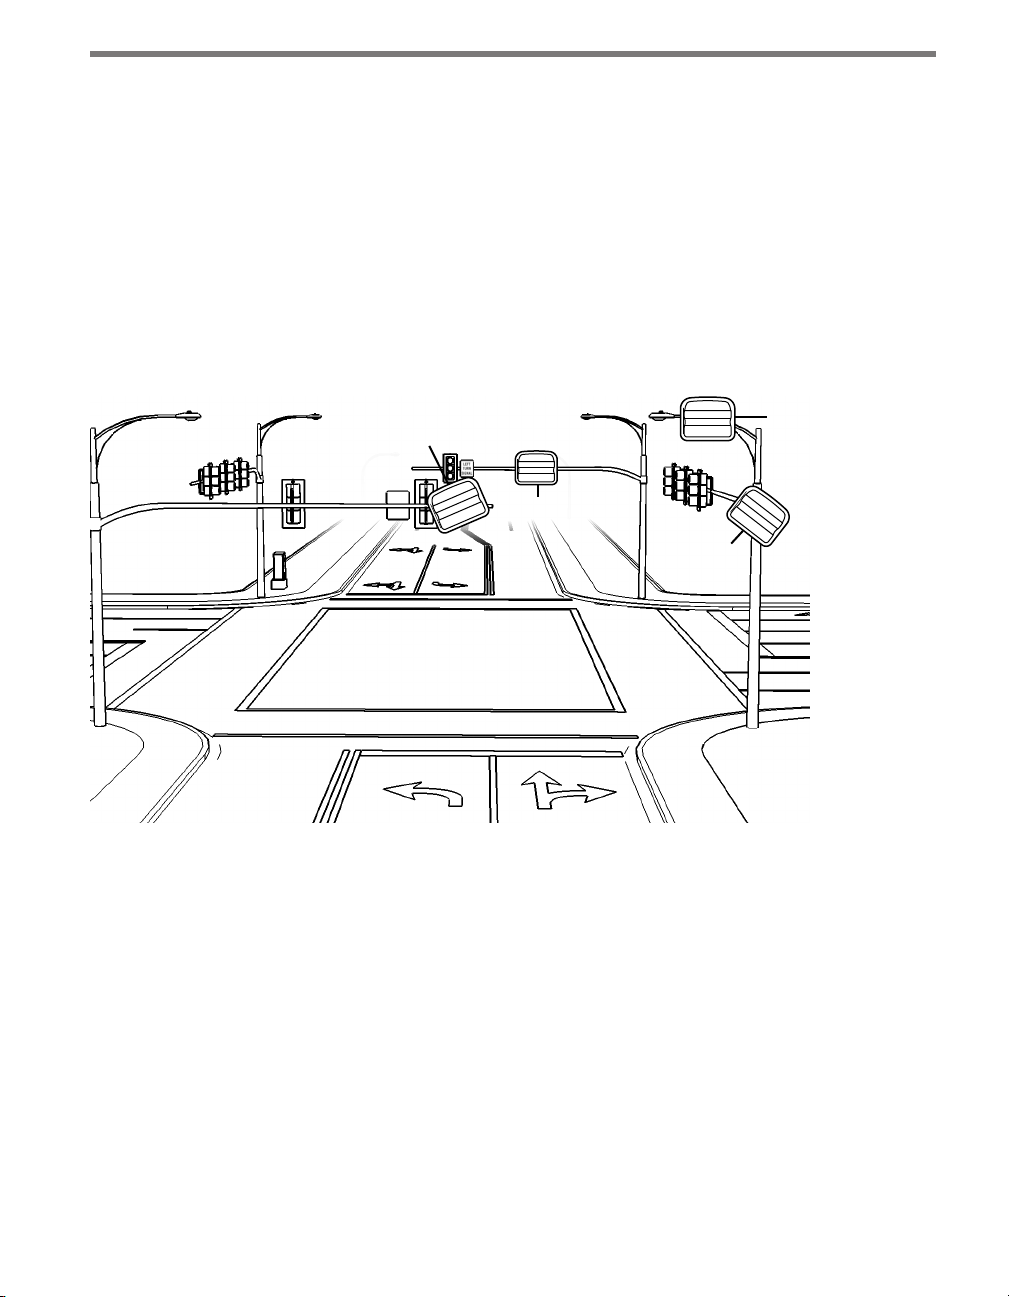
e sensor is mounted to the pole using a mount bracket (see Figure 1.1).
Page 18
CHAPTER 1 INSTALLING THE SMARTSENSOR ADVANCE 17
Main Shaft
Mount Head
Figure 1.1 – Mount Bracket
Before attaching the mount bracket to the pole, rst make sure that your cables are long
enough to support the sensor height and the distance from the sensor to the cabinet.
Follow the steps below to correctly attach the mount to the pole (see Figure 1.2):
1 Insert the stainless steel straps through the slots in the mount bracket.
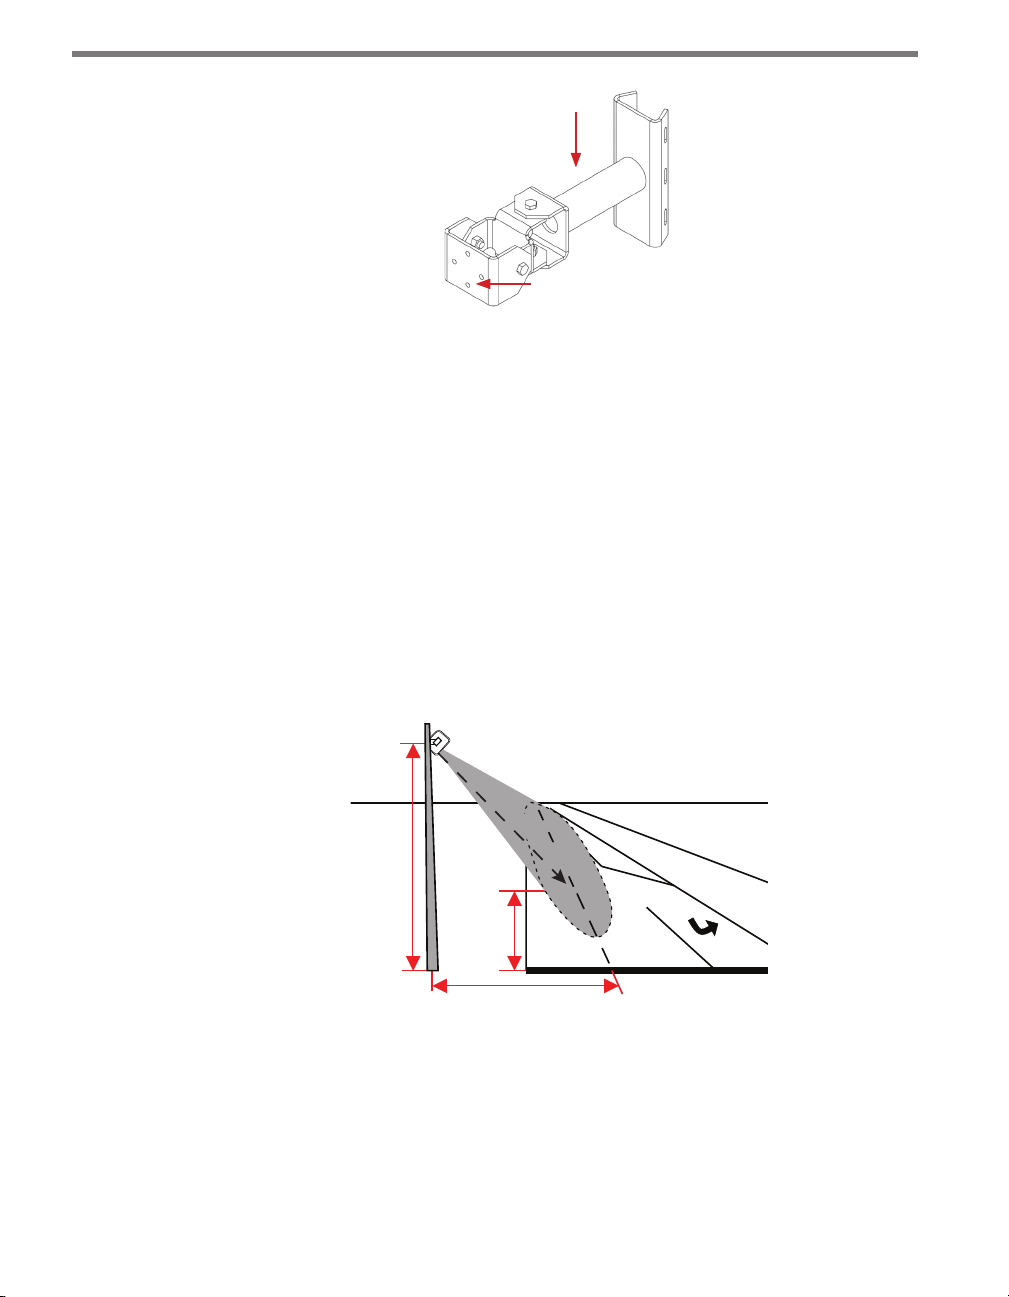
2 Position the mount so that it facilitates visual line-of-sight from the sensor to the tar-
get. You will need to have sucient headroom behind the sensor to position your eye
behind the viewnder alignment tool (the next section will go into detail about the
viewnder alignment tool).
For a roadside installation (on a vertical pole) the mount's main sha can be positioned
slightly ahead of perpendicular to the roadway; you can then look from the side of
the pole. For an overhead installation (on a mast arm) the mount's main sha can be
positioned slightly above horizontal; you can then look over the pole (see Figure 1.2).
Line-of-sight to target
Height
Target
Distance
Oset (perpendicular)
Figure 1.2 – Pointing the Sensor
3 Tighten the strap screws (see Figure 1.3).
X
Page 19
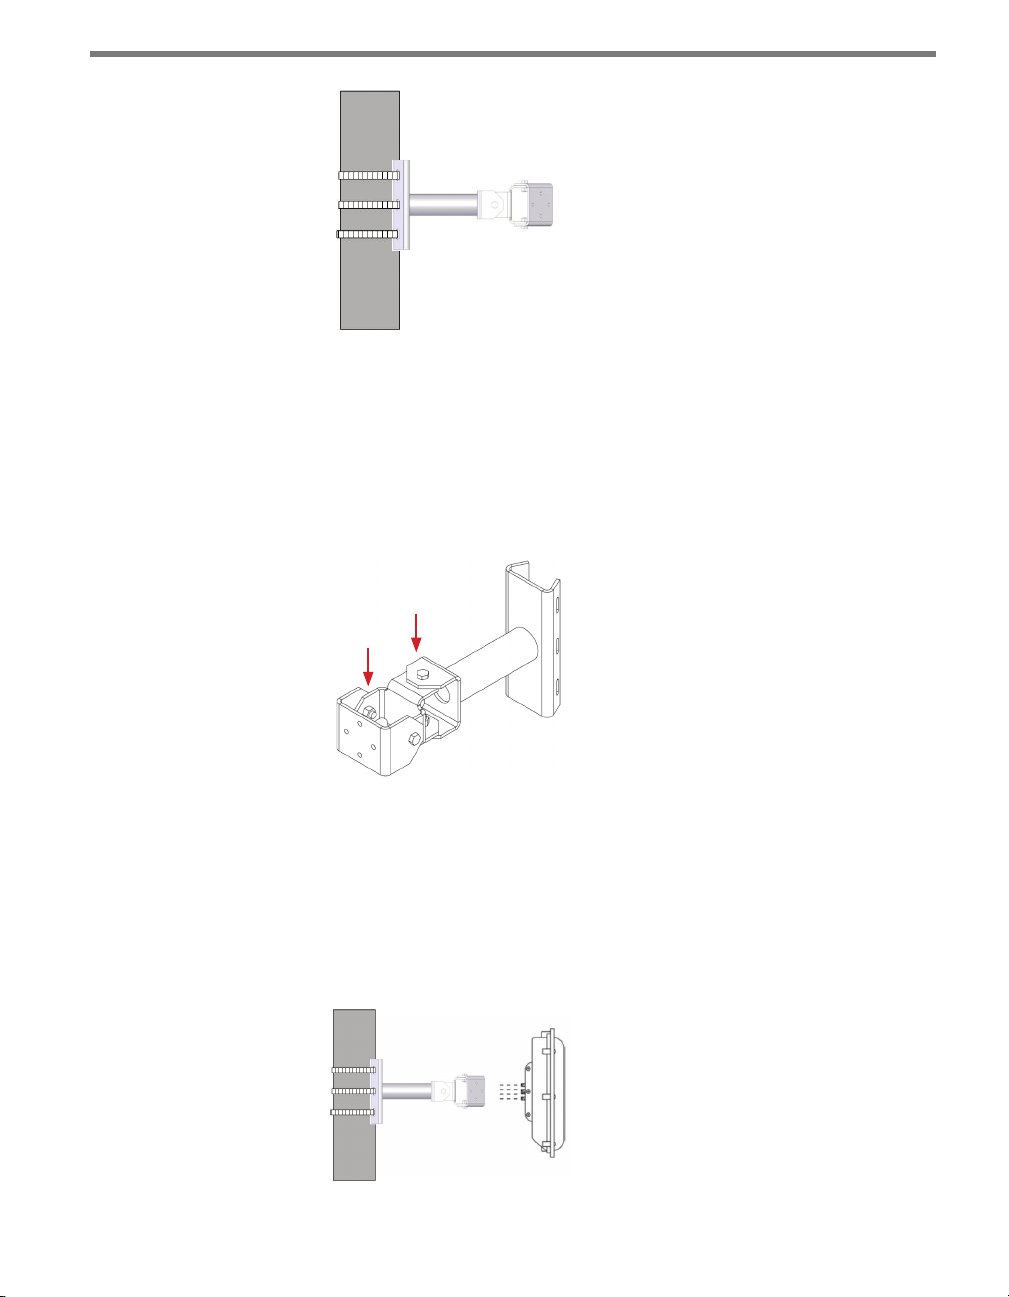
18 CHAPTER 1 INSTALLING THE SMARTSENSOR ADVANCE
Figure 1.3 – Attaching the Mount Bracket to the Pole
4 Using the swivel joints (see Figure 1.4), pan and tilt the mount so that the mount head
points roughly to target distance in the center of the lanes of interest. (e viewnder
will be used later to help you achieve a more precise alignment.)
If the sensor is on a vertical pole, rst use swivel joint 1 to pan, then use swivel joint 2
to tilt. If the sensor is on a horizontal pole, rst use swivel joint 1 to tilt then use swivel
joint 2 to pan.
1
2
Figure 1.4 – Swivel Joints
Attaching the Sensor to the Mount Bracket
1 Align the bolts on the sensor’s backplate with the holes in the mount bracket. e 8-pin
connector on the sensor should be pointing towards the ground.
2 Place the lock washers onto the bolts aer the bolts are in the mount bracket holes.
3 read on the nuts and tighten (see Figure 1.5).
Figure 1.5 – Attaching the Sensor to the Mount Bracket
Page 20
CHAPTER 1 INSTALLING THE SMARTSENSOR ADVANCE 19
Aligning the Sensor
In most applications, the goal is to position the beam’s elliptical footprint along the roadway.
is is done by pointing the hot spot of the sensor’s beam (middle of the sensor) at a target
location, then rolling the sensor so that the beam’s footprint lines up with the road. Aer
the basic alignment achieved during the mounting process, the viewnder is used to rene
the alignment.
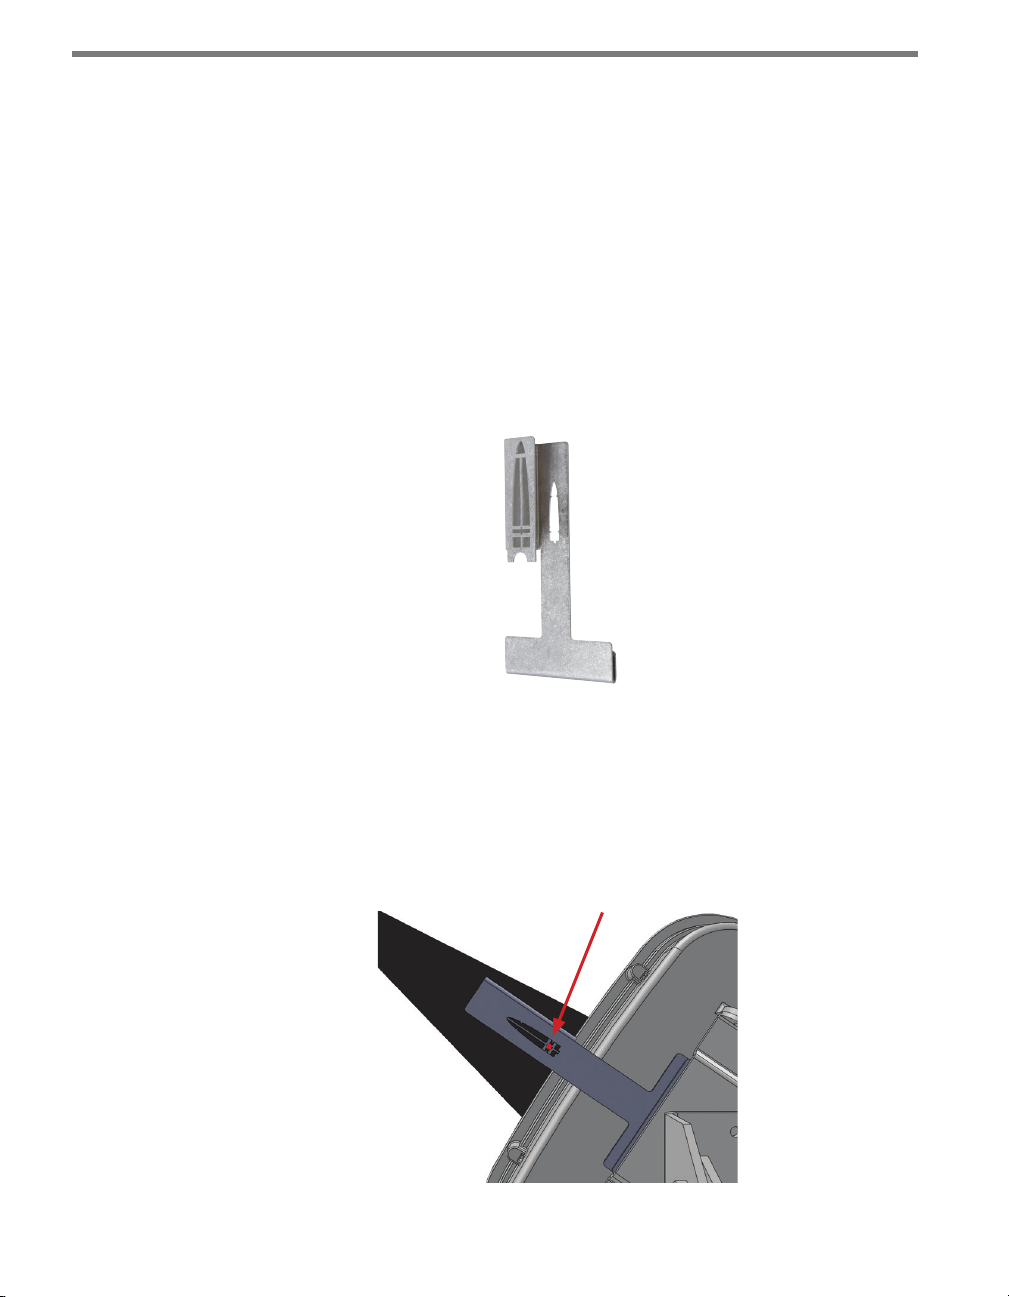
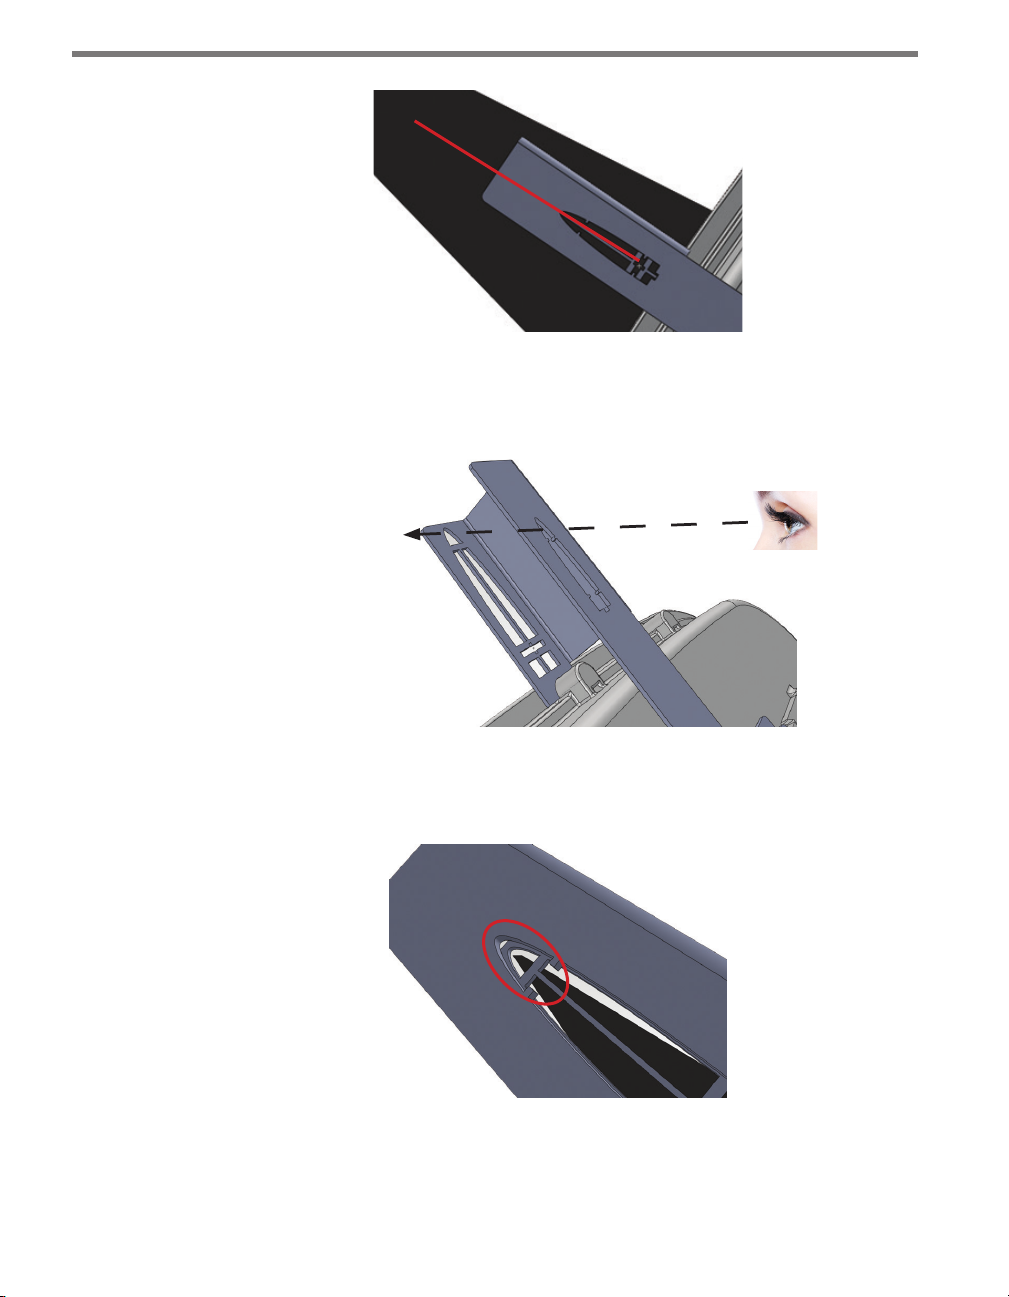
About the Viewfinder
e viewnder is a tool that helps you point the sensor at the target location and align the
sensor with the roadway (see Figure 1.6). It is designed with sighting features and visual
cues to facilitate proper alignment (these features and cues will be introduced from the
vantage point of an installer in a bucket truck).
Figure 1.6 – Viewfinder
e viewnder has two main sighting features:
1 Target crossbars (top and bottom)
2 e long, narrow alignment bar
When the sensor is properly pointed at the target, the target will line up between the two
notches in the target crossbars, as shown in Figure 1.7.
Figure 1.7 – Target
Page 21
20 CHAPTER 1 INSTALLING THE SMARTSENSOR ADVANCE
When the sensor is properly aligned with the roadway, the long, narrow alignment bar will
line up with the center of the lanes of interest (see Figure 1.8).
Figure 1.8 – Long, Narrow Bar Lines Up with Center of Lanes of Interest
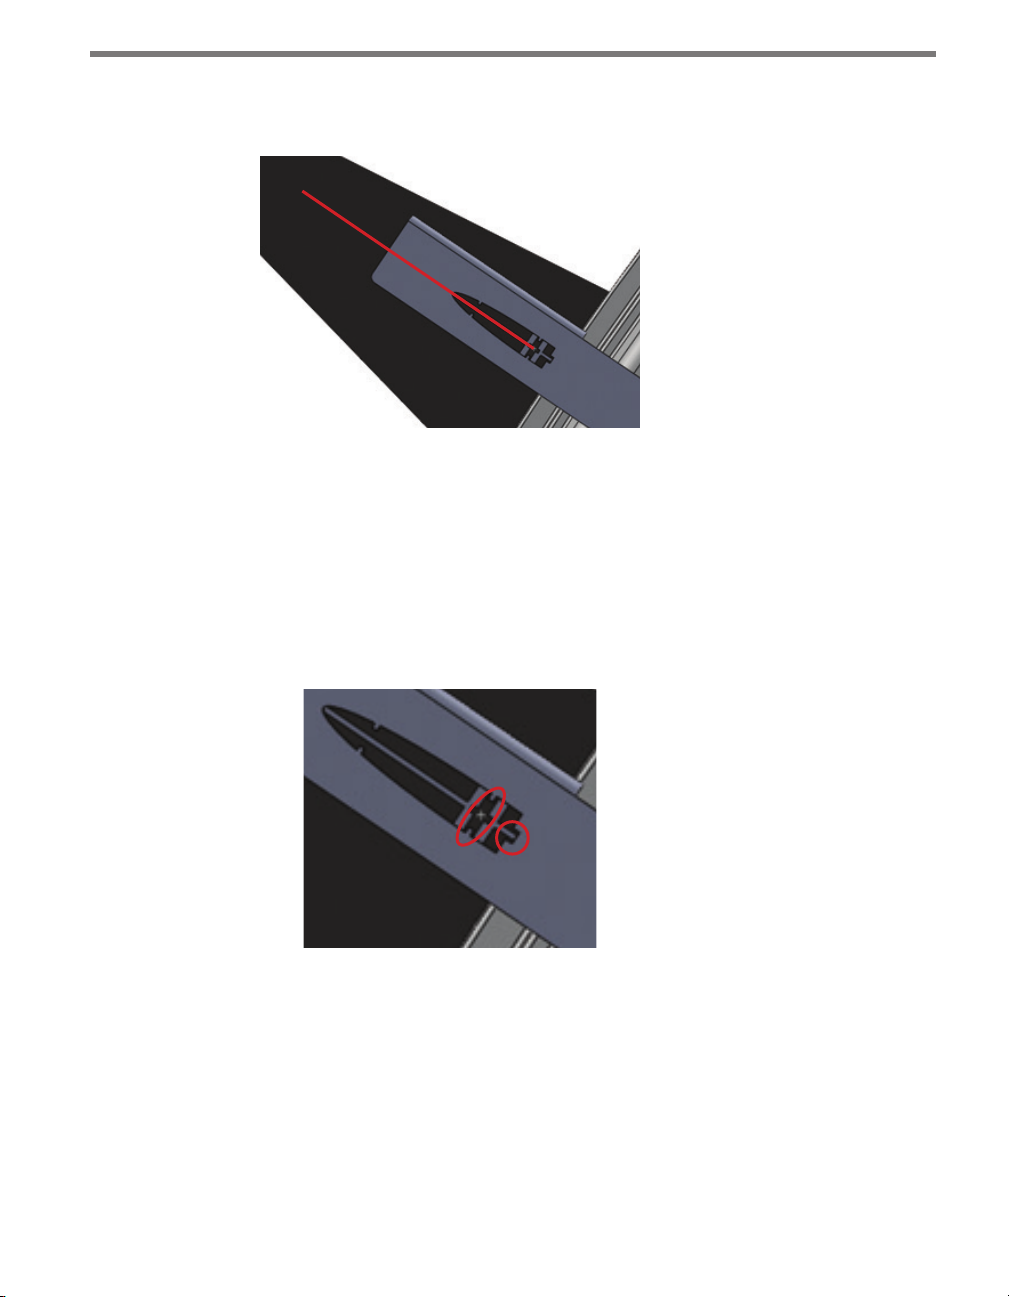
In addition to having two main sighting features, the viewnder is used from two dierent
viewpoints:
Viewpoint 1 – Position your eye squarely behind the sensor. It is used to point the sen-
sor at the target and to align the sensor to the roadway.
e viewnder has visual cues to help you achieve viewpoint 1: the two bottom side
tabs will line up between the target crossbars, and the bottom section of the long, nar-
row alignment bar will line up within the large notch (see Figure 1.9).
Figure 1.9 – Viewpoint 1
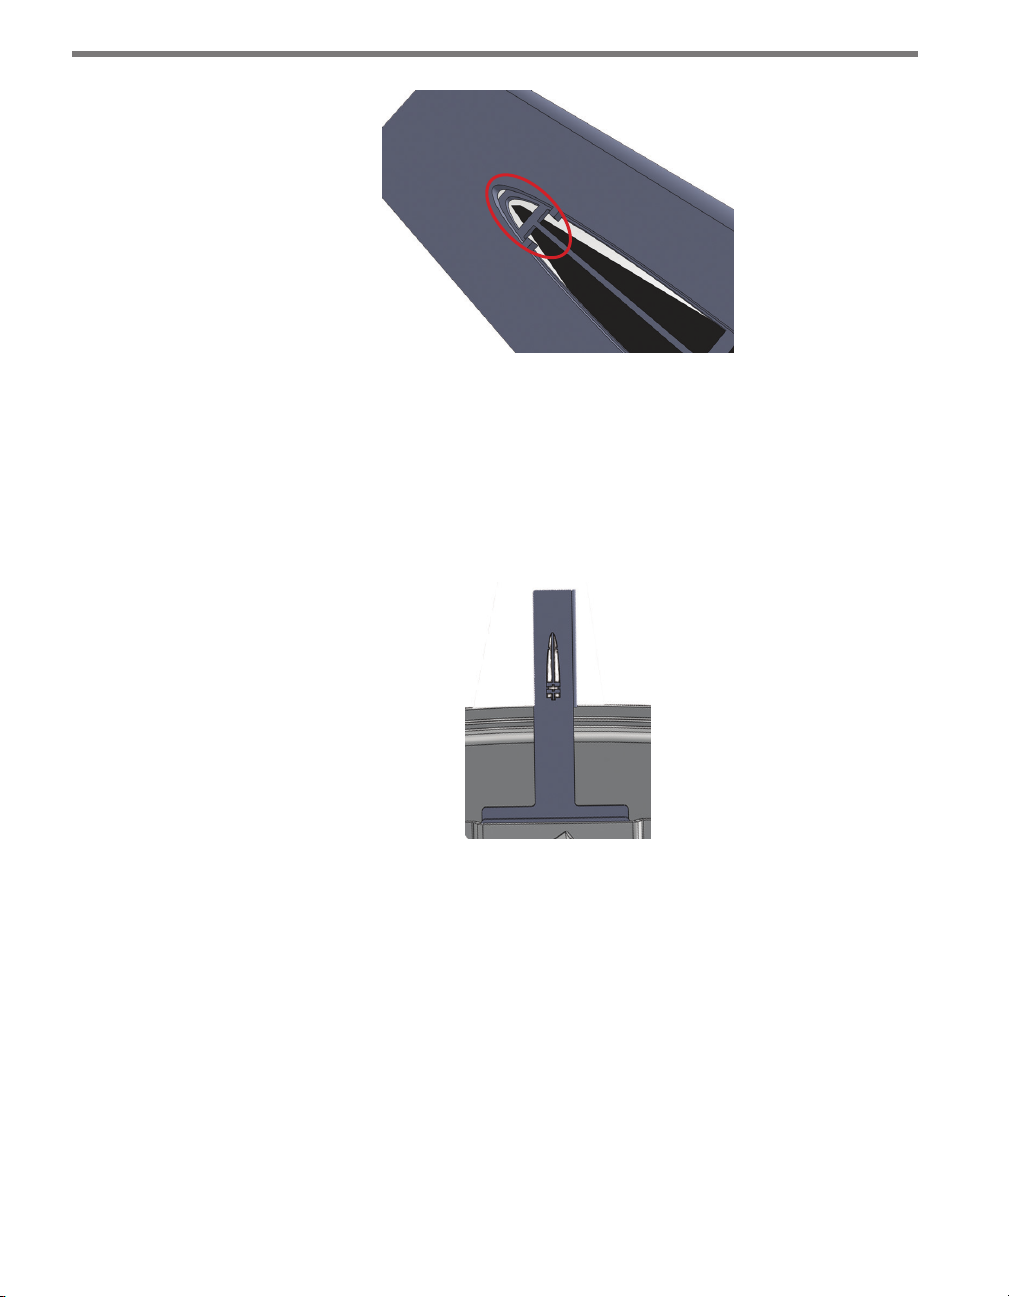
Viewpoint 2 – is viewpoint is used to verify alignment down the center of the lanes
of interest. It allows you to view the upstream detection area of the sensor.
Viewpoint 2 is achieved by moving your eye down and in toward the viewnder so that
the archway framed by the crossbar and the archway framed by the tabs are concentric
and the two top tabs match up with the top crossbar (see Figure #).
Page 22
CHAPTER 1 INSTALLING THE SMARTSENSOR ADVANCE 21
Figure 1.10 – Viewpoint 2
Using the Viewfinder
With the sensor pointed roughly at the target location, follow these steps to rene the alignment:
1 Attach the viewnder by centering the arched notch over the top-middle of the sensor
and inserting it securely into position (see Figure 1.11).
Figure 1.11 – Attach Viewfinder
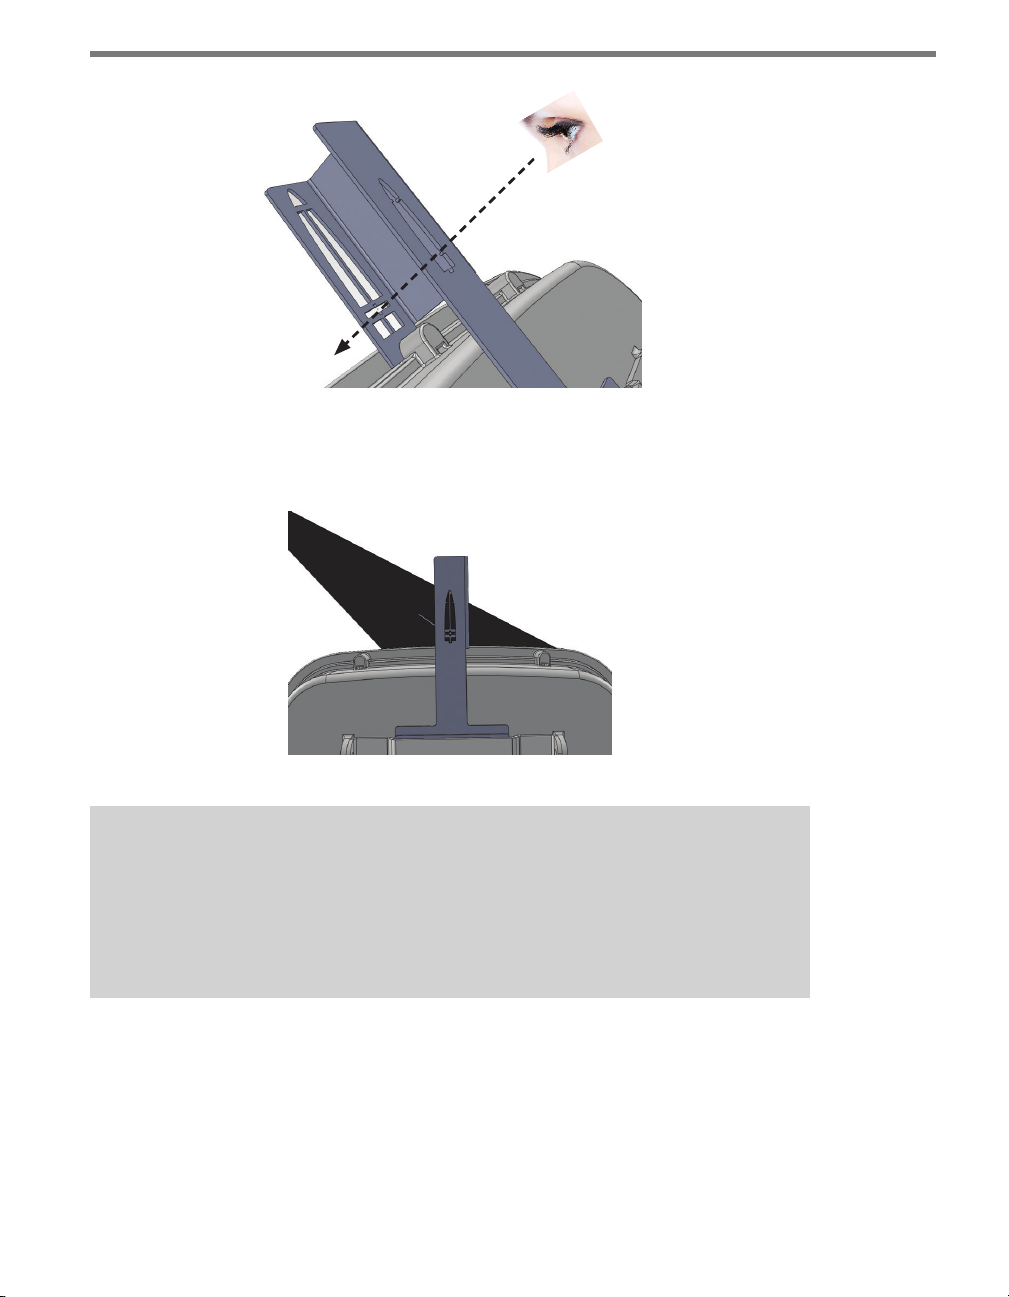
2 With your eyes about one foot from the viewnder, look directly through the target
crossbars (viewpoint 1). Tilt the sensor until the space between the target crossbars is
at the level of the target location (see Figure 1.12).
Page 23
22 CHAPTER 1 INSTALLING THE SMARTSENSOR ADVANCE
To target
location
Figure 1.12 – Viewpoint 1
3 Pan the sensor until the target location is centered between the notches in the target
crossbars. e target location should now be centered in the target sights.
Figure 1.13 – Target Location Centered in Target Sights
Note
For a better view, close one eye and move closer to the viewfinder.
If there is not enough headroom to look through the viewfinder, you can use a digital
camera directly behind the viewfinder window for visual verification.
4 Roll the sensor until the long narrow bar is parallel with the center of the lanes of inter-
est on the roadway. Vehicle paths should be parallel to the long narrow bar (see Figure
1.14).
Page 24
CHAPTER 1 INSTALLING THE SMARTSENSOR ADVANCE 23
Figure 1.14 – Vehicle Paths Parallel to Long, Narrow Bar
5 Use viewpoint 2 to verify your alignment. Do this by moving your head down so that
you can see the top crossbar and the archway (see Figure 1.15).
To top of
detection area
Figure 1.15 – Viewpoint 2
Make sure the archways overlap and the top tabs line up with the top crossbar (see
Figure 1.16).
Figure 1.16 – Overlapping Archways
Vehicle paths should still be parallel to the long, narrow bar. If everything lines up,
move on to step 6. If not, your alignment is o and you need to repeat steps 2–4.
Page 25
24 CHAPTER 1 INSTALLING THE SMARTSENSOR ADVANCE
6 Tighten down the pan and tilt bolts, then tighten down the four bolts on the backplate.
If you are using the sensor on a curved road, you can aim the sensor so that it bisects the
curve of the road and still hits your nearest and farthest ranges of interest. If the sensor is
mounted near the outside edge of the curved road, you may be able to bisect the curve with
little or no roll. If the road curves dramatically, you may need to reduce the down tilt of the
sensor so that the beam fans out more at the far ranges.
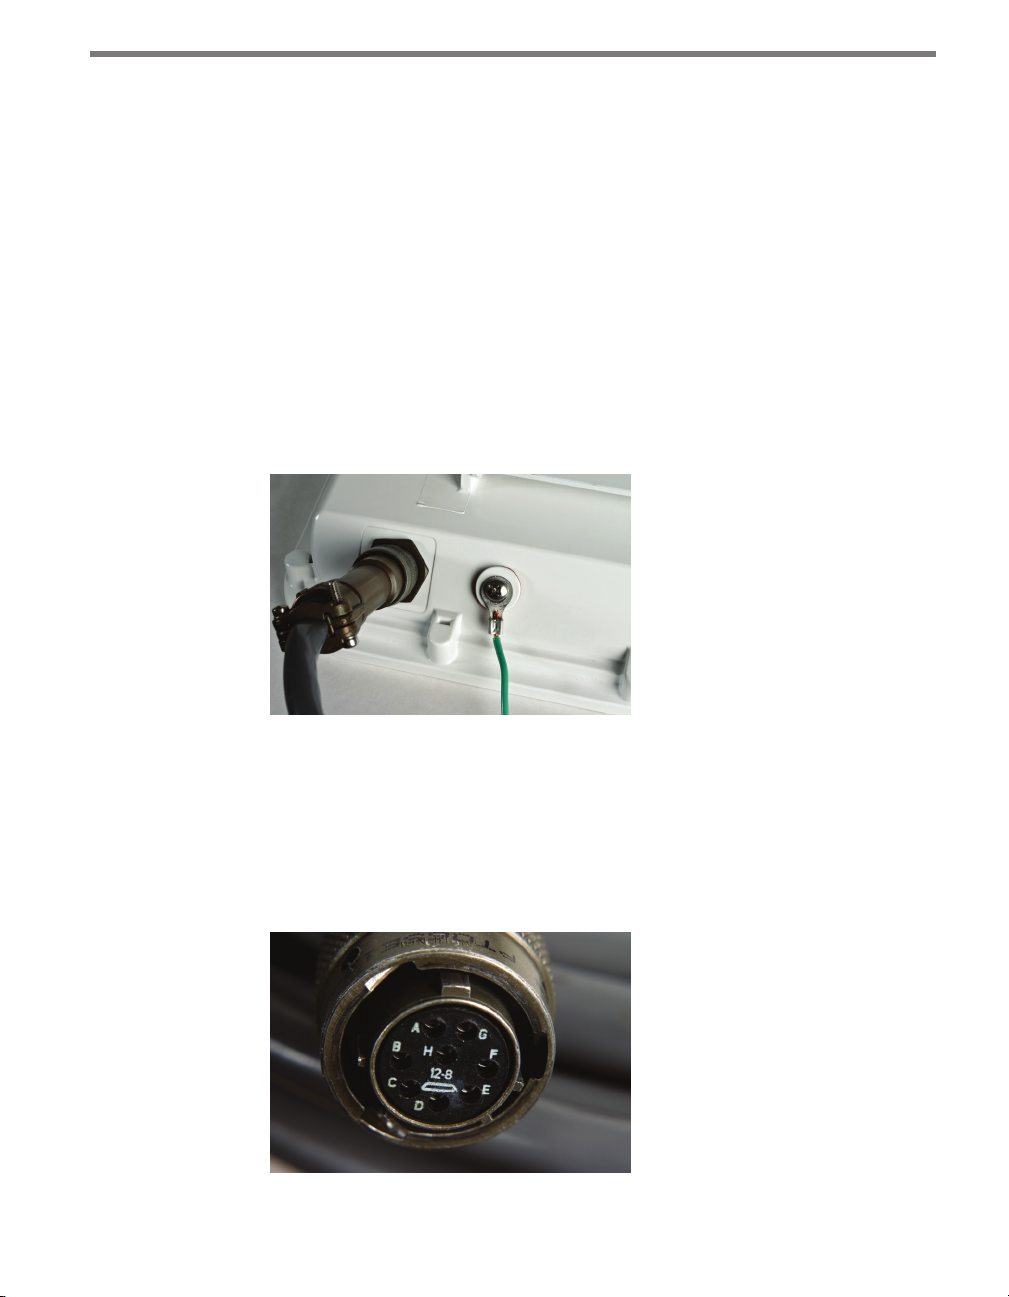
Applying Silicon Dielectric Compound
1 Tear the tab o the tube of silicon dielectric compound.
2 Squeeze about 25% of the silicon into the connector at the base of the SmartSensor
Advance (see Figure 1.17).
3 Wipe o any excess compound.
Figure 1.17 – Connector Receptacle (left) and Grounding Lug (right)
Connecting the SmartSensor 6-conductor Cable
e next step is to plug the SmartSensor 6-conductor cable into the connector. e sensor
connector is keyed to ensure proper connection (see Figure 1.18); simply twist the plug end
of the connector clockwise until you hear it click into place.
Figure 1.18 – Sensor 6-conductor Cable Connector
Page 26
CHAPTER 1 INSTALLING THE SMARTSENSOR ADVANCE 25
To avoid undue movement from the wind, strap the 6-conductor cable to the pole or run it
through a conduit, but leave a small amount of slack at the top of the cable to reduce cable
strain. Route the cable from the sensor location back to the main trac cabinet.
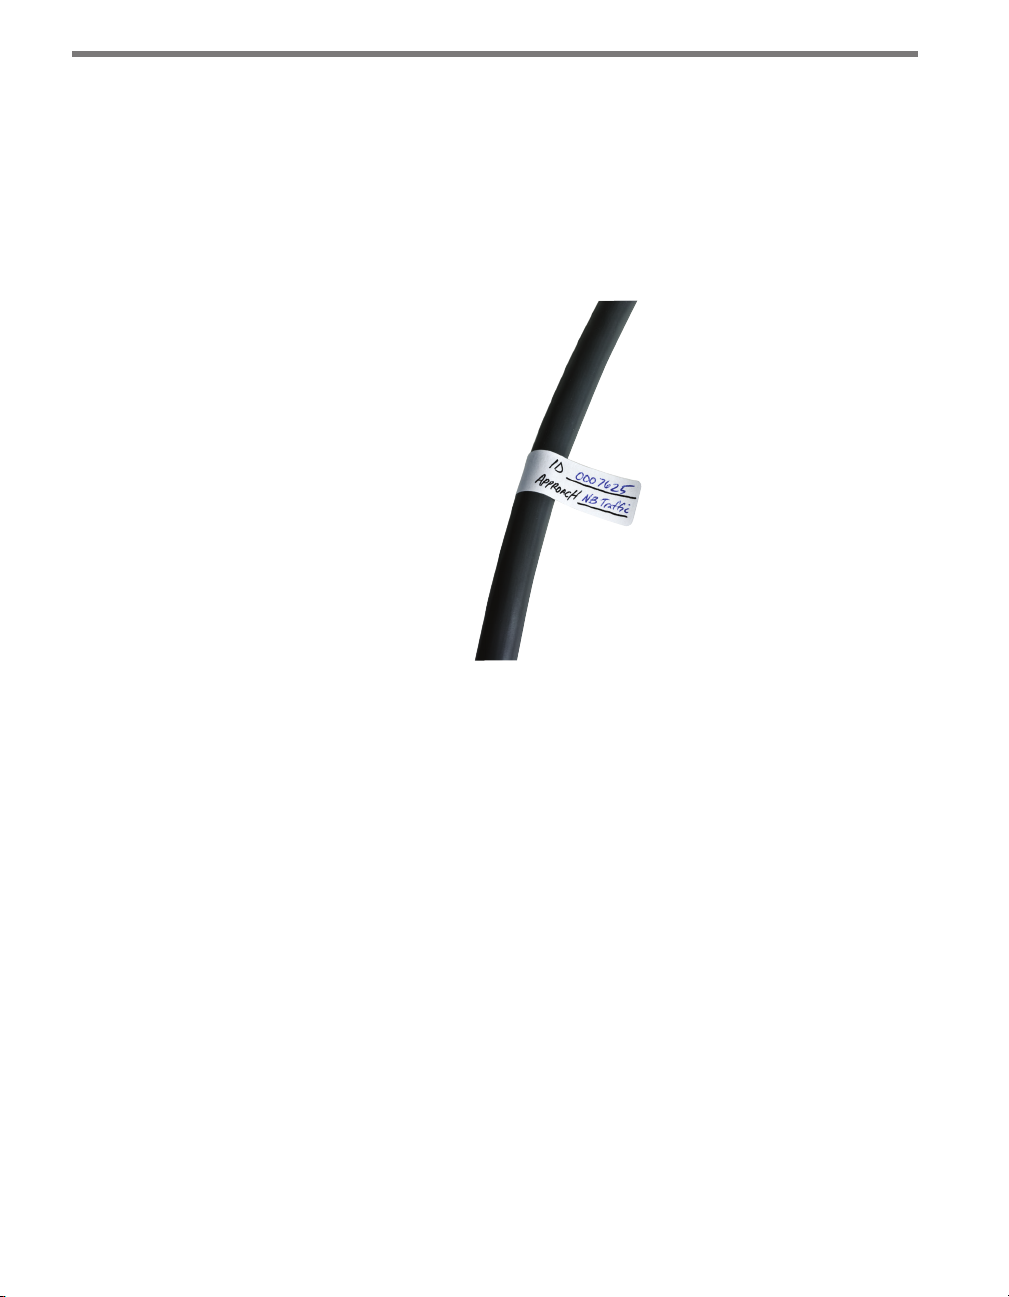
To set up your network in an orderly fashion, it is recommended that labeling be used
on the service end of each SmartSensor 6-conductor cable. A convenient way to label the
cables is to mark the last seven digits of the serial number on each sensor and the direction
of trac monitored (see Figure 1.19).
Figure 1.19 – Service End Labeling
Grounding the Sensor
e SmartSensor Advance must now be grounded:
1 Connect a grounding wire to the grounding lug on the bottom of the sensor (see Figure
1.17).
2 Connect the other end of the grounding wire to the earth ground for the pole that the
sensor is mounted on. Do not attempt to run the grounding wire back to the main
trac cabinet.
Page 27

Page 28

Connecting Power and
Surge Protection 2
In this chapter
Mounting the Backplate
Connecting AC Power
Providing System Surge Protection
Terminating the SmartSensor 6-conductor Cable
Contact Closure Connections
2
Aer installation, each SmartSensor Advance will need to be integrated into the main trafc cabinet for power and surge protection. is chapter contains information on how to
provide power and surge protection to the intersection preassembled backplate located in
the main trac cabinet.
e intersection preassembled backplate is 11 in. (28 cm) wide and 11.5 in. (29.2 cm) high.
Also available to use are the intersection preassembled 19-inch rack for server racks and the
intersection segmented preassembled backplate for easier installation in trac cabinets. All
wiring on the rack and backplates is done using stranded wires with wire ferrules for screw
terminal connections (see Figure 2.1).
Page 29
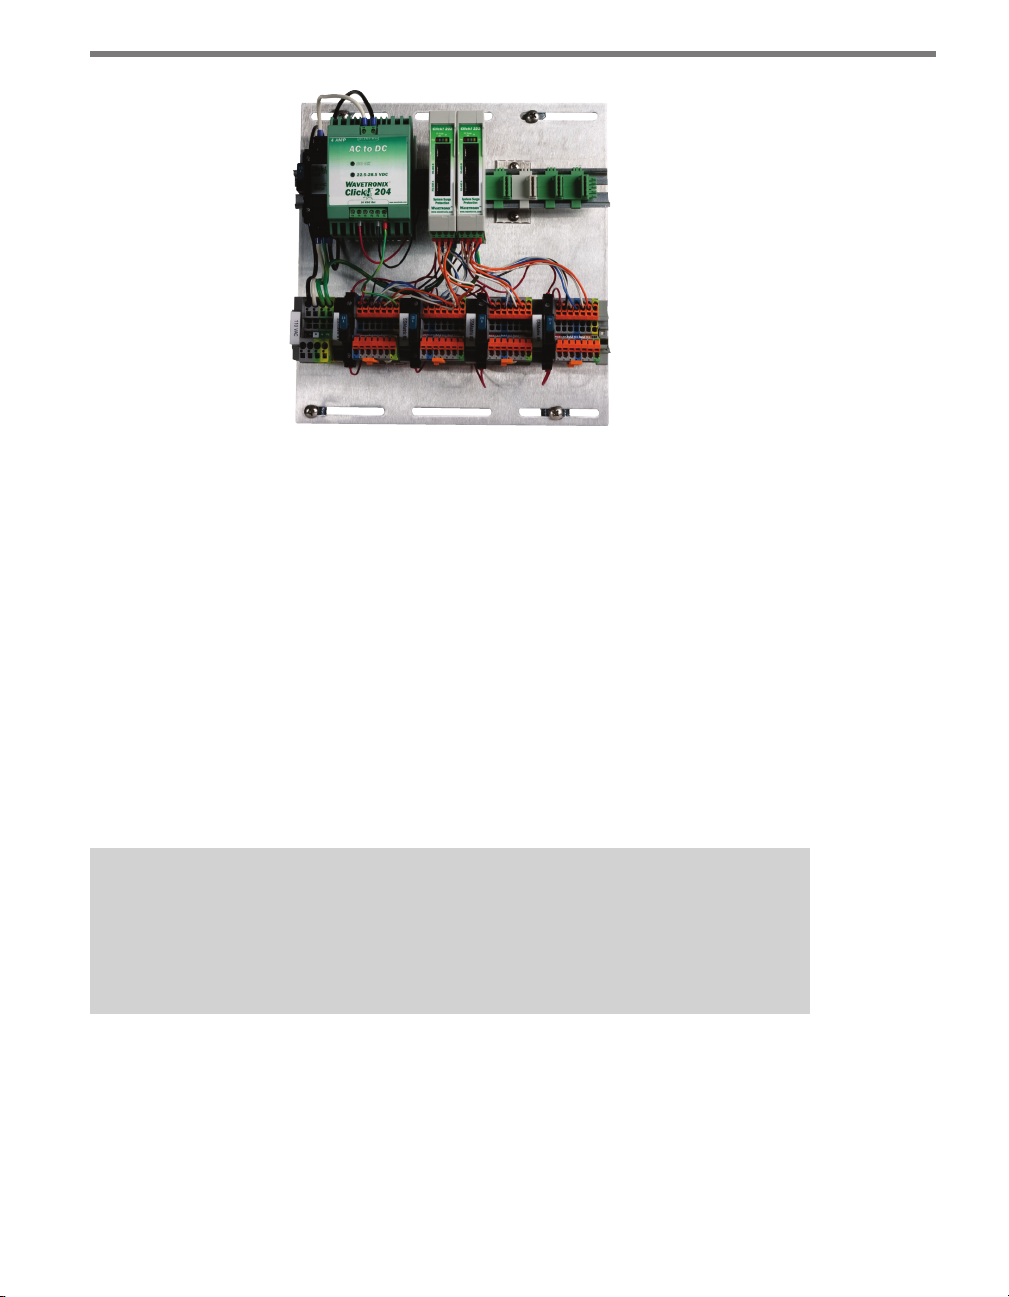
28 CHAPTER 2 CONNECTING POWER AND SURGE PROTECTION
Figure 2.1 – Intersection Preassembled Backplate
Please refer to the Click quick-reference guides for more comprehensive product instructions. Chapter 12 contains information on how Click products make the sensor compatible
with all standard control cabinets.
A pinout diagram showing the sensor cable’s pin-out and appropriate connection points
can be found in Appendix A of this document.
Mounting the Backplate
Use the following steps to mount the backplate in the trac cabinet:
1 Locate the area planned for mounting the backplate. e backplate can usually be
mounted on the side panel of a NEMA-style cabinet.
2 Attach the backplate with the U-channel mounting screws.
Note
If you have a 330 series (170/2070 style cabinet) with a 19-inch EIA rack, please con-
tact Wavetronix Technical Services for assistance. Wavetronix can provide modified
backplates that attach to a 19-inch rack.
Connecting AC Power
Since SmartSensor Advance operates on 10–28 VDC, the intersection preassembled backplates provide an AC power conversion option. e backplate includes an AC to DC power
converter, power surge and circuit breaker.
Page 30
CHAPTER 2 CONNECTING POWER AND SURGE PROTECTION 29
Warning
Make sure power to AC mains is disconnected while wiring the AC input. If your installation does not require AC power, you will need to use surplus DC power inside
he trac cabinet. In this case, Wavetronix recommends you use the Click 221 (8 AC
surge protector) to protect the backplate and SmartSensor Advance units from DC
surges.
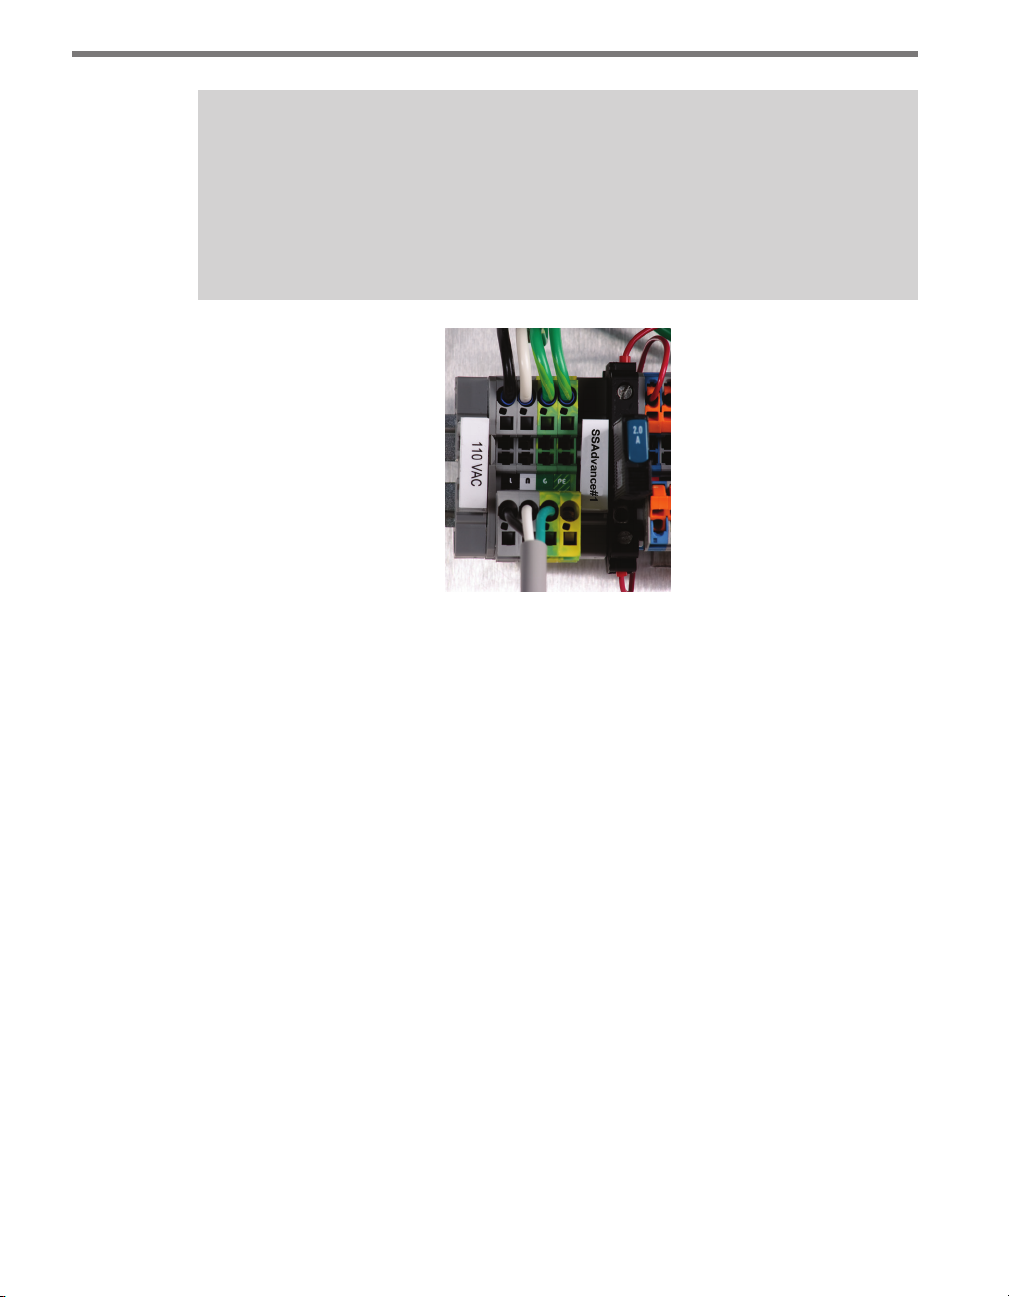
Figure 2.2 – Connecting AC Power to the Preassembled Backplate
Use the following steps to connect power to the AC terminal block on the bottom DIN rail
(see Figure 2.2):
1 Connect a neutral wire (usually a white wire) to the bottom side of the terminal block
labeled “N” for neutral.
2 Connect a ground wire (usually a green wire) to the bottom of the terminal block la-
beled “G” for ground. (see the Wiring Protective Earth Ground section below).
3 Connect a line wire (usually a black wire) to the bottom of the terminal block labeled
“L” for line.
4 Turn on AC mains power.
5 Press the circuit breaker switch on the le side of the top DIN rail to switch power to
the backplate. e switch is on if the button is below the level of the device housing; the
switch is o if the button is raised above the surface of the housing.
6 Verify that DC power is properly regulated by making sure the DC OK LEDs are il-
luminated on the Click 201/202/204.
Page 31

30 CHAPTER 2 CONNECTING POWER AND SURGE PROTECTION
Caution
An authorized electrical technician should install the intersection preassembled
backplate. Persons other than authorized and approved electrical technicians should
NOT attempt to connect the backplate to a power supply and/or trac control cabi-
net, as there is a serious risk of electrical shock through unsafe handling of the power
source. Extreme caution should be used when connecting the backplate to an active
power supply.
e AC power conversion section of the backplate will come pre-wired as shown in Figure
2.3. e three main components of the AC power conversion section include:
Click 201/202/204 AC to DC converter – A Click 201 provides 1 A of power and is ca-
pable of powering a single sensor; a Click 202 provides 2 A and can power two sensors;
a Click 204 provides 4 A and can power four sensors.
Click 210 circuit breaker – Interrupts power during overload conditions and provides
a convenient way to turn power on and o for the entire system.
Click 230 AC surge protector – Helps protect equipment from current surges on the
power lines.
Figure 2.3 – AC Power Conversion
Wiring Protective Earth Ground
All connections are surge protected when the protective earth ground is wired to the PE
terminal block on the backplate. Normally, the backplate should be mounted to the chassis
of the cabinet to provide a ground path. It is strongly recommended that you provide a low
impedance protective earth connection.
Page 32

CHAPTER 2 CONNECTING POWER AND SURGE PROTECTION 31
Follow the steps below to provide a low impedance protective earth connection:
1 Connect one end of a protective earth ground wire to the bottom of the PE terminal
block. A 10 AWG stranded wire is recommended for protective earth ground connections and is also the largest that will t in the terminal block.
2 Connect the other end of the protective earth ground wire to a protective earth screw
terminal within the main trac cabinet.
Controlling DC Power Distribution
e Click 210 circuit breakers provide a convenient way to turn power on or o for each
sensor independently (see Figure 2.4). To enable or disable DC power to the backplate,
press the main circuit breaker (le side of upper DIN rail); to enable or disable DC power
to an individual sensor, press the individual circuit breaker (le side of each sensor’s set of
terminal blocks).
Push this button to
turn power on or o.
Figure 2.4 – DC Power Distribution
Note
The switch is ON when the switch button is level with the device housing; the switch
is OFF when the switch button is raised above the housing.
e four-approach preassembled backplate has 24 VDC power wired from the output of
the AC to DC convertor into a 5-position screw terminal on the le side of the T-bus (see
Figure 2.5). e green T-bus conducts DC power and RS-485 communications from the le
to the right side of the modules; the gray T-bus conducts only DC power from the le to the
right side of the modules.
Page 33

32 CHAPTER 2 CONNECTING POWER AND SURGE PROTECTION
Power
+24 VDC
( )
-DC
+RS-485
-RS-485
GND
red wire
( )
black wire
RS-485
Figure 2.5 – T-bus Pinout Diagram
Providing System Surge Protection
e Click 222 system surge protector is designed to prevent electrical surges conducted
along underground cables from damaging the cabinet equipment (see Figure 2.6).
Figure 2.6 – Click 222 Faceplate
Note
The SmartSensor Advance has built-in surge protection and so there is no need to
use a pole-mount box for surge protection on the sensor side of the cable. However,
it is strongly recommended that the sensor be connected to a surge protection device
in the main trac cabinet. If you choose not to use surge protection in your main
trac cabinet, please contact Wavetronix Technical Services for assistance.
When a Click 222 is present, the power and RS-485 serial connections on the T-bus and
faceplate are protected from surges on the incoming SmartSensor 6-conductor cables.
e Click 222 faceplate has four activity indicator LEDs:
PWR – Indicates that the device has power.
Page 34

CHAPTER 2 CONNECTING POWER AND SURGE PROTECTION 33
DC Surge OK – Indicates that DC surge protection is operational.
TD – Indicates when data is transmitted over the T-bus or over the control bridge. is
LED does not indicate data transmitted on the A or B ports.
RD – Indicates when data is received over the T-bus or over the control bridge. is
LED does not indicate data received on the A or B ports.
Note
If the DC Surge OK LED is not on when the Click 222 is powered, call Wavetronix Technical Services for assistance.
e Click 222 provides the following three independent serial connections:
Top jack – control bridge
Middle jack – dedicated communications for sensor 2 detection calls
Bottom jack – dedicated communications for sensor 1 detection calls
e control bridge enables a multi-drop shared communication bus between all sensors
connected to the backplate. is allows control of all Advance sensors, rack cards and other
connected Click devices. e remaining two serial connection ports provide communications to only one sensor each, as outlined above.
On a four-sensor preassembled backplate (see Figure 2.7):
e sensor wired into the lemost terminal blocks will be connected to ports A and C
on the Click 222 on the le. Port A is for detection calls and port C is connected to the
control bridge.
e sensor wired to the second set of terminal blocks will be wired to ports B and D
on the Click 222 on the le. Port B is for detection calls and port D is connected to the
control bridge.
e sensor wired to the third set of terminal block from the le will be wired to ports
A and C on the Click 222 on the right.
e sensor wired to the rightmost terminal block will be wired to ports B and D on the
Click 222 on the right.
Page 35

34 CHAPTER 2 CONNECTING POWER AND SURGE PROTECTION
Port A & Port C Port B & Port D Port A & Port C Port B & Port D
x
OUT
S
SAdvance #1
IN
x
x
x
x
x
x
PWR
GND
485+
485-
485+
485-
x
x
x
x
x
x
x
x
x
x
x
x
OUT
SSAdvance #2
DRN
x
x
PWR
IN
x
x
GND
485+
485-
485+
485-
x
x
x
x
x
x
x
x
DRN
x
x
x
x
x
x
OUT
SSAdvance #3
PWR
IN
x
x
GND
485+
485-
485+
485-
x
x
x
x
x
x
x
x
x
SSAdvance #4
DRN
x
x
x
OUT
PWR
GND
485+
IN
x
x
x
x
x
x
x
x
DRN
485-
485+
485-
x
x
x
x
x
Figure 2.7 – Click 222 Ports A, B, C and D
Terminating the 6-conductor Cables
e SmartSensor Advance will receive power once each SmartSensor 6-conductor cable is
correctly landed into the plug-in terminals on the backplate (see Figure 2.8 and Table 2.1).
Each 6-conductor cable has one DC power wire pair, two RS-485 communication pairs and
a drain wire. e service end of the cable connects to plug-in terminals on the backplate
(see Figure 2.8).
Figure 2.8 – Color Label on Plug-in Terminals
Page 36

CHAPTER 2 CONNECTING POWER AND SURGE PROTECTION 35
Note
Do not strip the service end of the cable until after it has been routed through conduit. The cable should be one continuous run without any splices.
Use the steps below to land the sensor cables:
1 Aer routing your SmartSensor 6-conductor cable into the cabinet, carefully strip back
the cable jacket and shielding on the service end of the cable.
2 Open the insulation displacement connectors on the plug by inserting a small screw-
driver into each square slot and rocking it back.
3 Insert the wire leads into the bottom side of the plug-in terminal according to the color
code shown in Table 2.1 and Figure 2.8. Make sure the wires are completely inserted
in the terminal.
4 Close the insulation displacement connector by reinserting the screwdriver into the
square slot and rocking it forward. e plug-in terminals will automatically complete
the electrical connection. ere is no need to manually strip the insulation on the end
of each wire.
ere are two measures in place to ensure that the plugs are always returned to their correct
terminal block sections.
First, for visual conrmation, one part of the plug is blue (see Figure 2.8) and must be
visually matched up to a blue terminal block. e location of the blue piece rotates in
the dierent plugs and terminal block sections: in the rst, the rst block is blue, in the
second, the second is blue, etc.
Second, the plugs are keyed (see the blue piece in Figure 2.8) so they will only t into
their correct terminal block sections.
Wire Color Signal
Red (PWR) DC+
Black (GND) DC-
White with Blue stripe (485+) Control bridge 485+ (port1)
Blue (485-) Control bridge 485 - (port 1)
White with Orange stripe (485+) Data bus 485+ (port 2)
Orange (485-) Data bus 485- (port 2)
Bare metal (DRN) Drain
Table 2.1 – Cable Wiring Color Code
Page 37

36 CHAPTER 2 CONNECTING POWER AND SURGE PROTECTION
Contact Closure Connections
e SmartSensor Advance now supports both the Click 112/114 and Click 172/174 cards.
SmartSensor Advance Extended Range only supports Click 112/114. Use the data bus ports
(A or B) on the Click 222 to connect to the contact closure cards. In some cases, several
contact closure cards can be daisy-chained together. However, if you are using the Click
172/174 cards, the chain should not be connected until each card has been independently
programmed (see Figure 2.9).
Figure 2.9 – Connecting Contact Closure Modules
Note
Wait to connect contact closure communications until after the sensor is pro-
grammed using the configuration software.
See Chapter 12 for more information on contact closure communications.
Page 38

Part II
Using SmartSensor Manager
Advance
Chapter 3 – Installing SmartSensor Manager Advance
Chapter 4 – Communication
Chapter 5 – Sensor Settings
Chapter 6 – Sensor Configuration
Chapter 7 – Channels-Alerts-Zones
Chapter 8 – Verify Channels-Alerts-Zones
Chapter 9 – Setup Output Communications
Chapter 10 – Templates
Chapter 11 – Tools
Chapter 12 – Programming Contact Closure Cards
Page 39

Page 40

Installing SmartSensor Manager
Advance 3
In this chapter
Installing SSMA
3
Aer the SmartSensor Advance is installed, use SmartSensor Manager Advance (SSMA)
to congure the sensor to the roadway and change sensor settings. SmartSensor Manager
Advance is soware that enables users to congure and interact with the SmartSensor Advance (SS200).
is part of the user guide is designed to illustrate SSMA functionality and describes the
basic steps and procedures needed to correctly congure the SmartSensor Advance.
Installing SSMA
e SSMA soware can be run on a Windows® PC with an operating system of Windows
XP or newer. It can also be run on a handheld computer running Windows Mobile. e
SSM Advance v3.0 Setup.exe le contains the Advance setup le.
Note
You must have administrator rights to run the setup program.
Page 41

40 CHAPTER 3 INSTALLING SMARTSENSOR MANAGER ADVANCE
Note
Microsoft .NET Framework version 3.5 or higher needs to be installed on your com-
puter before installing SSMHD. You can get the .NET Framework from the Microsoft
website.
Follow these steps to install SSMA on a PC:
1 To download the install le, go to the Wavetronix website at www.wavetronix.com.
2 Click the Support link near the top of the page. is will bring up a page with icons
from the three dierent Wavetronix product lines.
3 Click the SmartSensor icon. is will bring up drop-down menus allowing you to se-
lect a product by name or part number.
4 Select SmartSensor Advance and a list of links will appear.
5 Select the SmartSensor Manager Advance link (under Soware) to download the
SSMA install le.
6 Once you’ve downloaded the le, double-click on it. is will execute a setup program
that will copy all the necessary les to the hard drive and place icons in the Start menu
and on the desktop of the PC or laptop (see Figure 3.1).
Figure 3.1 – SSMA Setup Wizard
7 Select an installation location. e default location provided is normally “C:\Program
Files\Wavetronix.” Click Browse to choose another location (see Figure 3.2).
Page 42

CHAPTER 3 INSTALLING SMARTSENSOR MANAGER ADVANCE 41
Figure 3.2 – Location Installation
8 Click the Install Now button.
9 Aer SSMA is installed, you can create shortcuts to the SSMA soware on the desktop
and in the start menu using the corresponding checkboxes (see Figure 3.3). If no shortcuts are desired, uncheck the corresponding boxes.
Figure 3.3 – Shortcut Options
10 Click in the View release notes when nished checkbox to view the SSMA v3 release
notes. e release notes contain additional information about the current version of
the SSMA soware. A PDF reader program (i.e. Adobe Acrobat Reader) is required to
view the release notes.
11 Click Finish to complete the setup process.
Installing SSMA on a Handheld Computer
SSMA can be installed and will function on a handheld computer. Use these steps to install
SSMA on a handheld computer running Windows Mobile:
1 Ensure the handheld computer is connected to the PC and synced.
2 Click on the SSM Advance v3 Setup.exe le to run the setup program on the host
computer. e SSMA Setup Wizard will automatically check the host computer to see
if Microso ActiveSync (Windows XP and older) or Windows Mobile Device Center
(Windows Vista) is installed. ese are programs that are used to communicate with a
handheld device. If one of these programs is found, the option of installing SSMA to a
Page 43

42 CHAPTER 3 INSTALLING SMARTSENSOR MANAGER ADVANCE
Pocket PC device will become available.
3 Click the Pocket PC checkbox and then the Next>> button to install SSMA on a con-
nected Pocket PC device (see Figure 3.4). If both the Computer and Pocket PC boxes
are checked, the setup program will rst install the SSMA soware to the computer.
Figure 3.4 – Pocket PC Installation Program
4 Click Continue>> to start the Pocket PC installation process (see Figure 3.5). e
setup program runs the Add/Remove Programs application for Windows handheld
devices. If a Pocket PC device is connected to the computer, Add/Remove Programs
will immediately begin installing SSMA on the Pocket PC device. If a Pocket PC device
is not connected to the computer, SSMA will be downloaded the next time a Pocket PC
device is connected to the computer.
Figure 3.5 – Adding SSMA to a Pocket PC
5 Click OK once the download is complete.
Page 44

Communication 4
In this chapter
Serial Connection
Internet Connection
Virtual Connection
Multi-drop Network
Address Book
Viewing Connection Information
Uploading the Sensor’s Embedded Software
4
Once the sensors are installed, use the SSMA soware to change settings, view data and
congure the sensors to the roadway.
Launch SSMA by either clicking on the icon that was placed on your desktop or clicking
the icon found in the Start menu. e SSMA main screen shown in Figure 4.1 will appear.
If you are using SSMA on a laptop computer, you can use the panel in the lower le of the
main screen to change the size of the user interface on your computer. Click any of the three
squares to increase or decrease the size of the user interface.
Page 45

44 CHAPTER 4 COMMUNICATION
Figure 4.1 – SSMA Main Screen
e rst step is to make a connection to the sensor. e following three types of connections
can be made:
Serial connection – Made using RS-485 communication.
Internet connection – Made using an IP address and Serial-to-Ethernet adapter.
Virtual connection – Made for convenience in learning and demonstrating SSMA
functionality.
Communication settings are stored in the system registry each time a connection is established. Aer the rst connection is made to the SmartSensor Advance, the SSMA soware
will save the connection settings that were used. Click the lightning bolt icon on the right
side of the communication job area to make a connection using the most-recently-used
parameters stored in the registry.
Serial Connection
1 Click on Communication to access the Communication window (see Figure 4.2).
2 Select the Serial tab.
3 Set Port and Speed to the desired settings. e SSMA soware defaults to 9600 baud;
this baud rate is recommended and most likely will not need to be changed. Click the
Advanced… button for additional serial settings.
4 Click the Connect button.
Page 46

CHAPTER 4 COMMUNICATION 45
Figure 4.2 – Serial Connection (left) and Advanced Settings (right)
e Advanced Settings screen contains the following elds:
Timeout (ms) – Allows you to set an additional amount of time (in milliseconds) that
SSMA will wait for a response when communicating with the sensor.
Buer (bytes) – Contains the number of bytes used by SSMA to store data received
from the sensor.
Parity – is should always be set to None.
Stop Bits – is should always be set to 1.
Data Bits – is should always be set to 8.
Note
When a connection is made using the Isolated Sensor tab instead of the Multi-drop
Network tab, the software will connect to the first sensor it finds. If you have multi-
ple sensors and want to be able to connect to each one, use the Multi-drop Network
tab (see Multi-drop Network section below).
Internet Connection
1 Click on Communication.
2 Select the Internet tab (see Figure 4.3).
3 Enter the IP address of the Serial-to-Ethernet adapter to which the sensor of interest is
connected, or the domain name associated with the sensor in the Address eld. e IP
address is four octets, each ranging from 0-255, separated by dots (“.”). An URL address
can also be entered into this eld (i.e. sensor.earlink.com).
4 Enter the port number assigned to the Ethernet-to-Serial adapter in the Port eld. is
will be an integer value in the range of 0-65536. If you are using a Click 301 device,
the default port number will be 10001. Click the Advanced… button for additional
Page 47

46 CHAPTER 4 COMMUNICATION
Internet settings.
5 Click the Connect button.
Figure 4.3 – Internet Connection (left) and Advanced Settings (right)
e Advanced Settings screen contains the following elds:
Timeout (ms) – Allows you to set an additional amount of time (in milliseconds) that
SSMA will wait for a response when communicating with the sensor.
Buer (bytes) – Contains the number of bytes used by SSMA to store data received
from the sensor.
Virtual Connection
A virtual connection allows you to use the SSMA soware without being connected to an
actual sensor. Making a virtual connection can be useful for the following reasons:
To view a saved sensor setup le.
To play back previously logged trac.
To demonstrate functionality for dierent applications.
To create channel templates.
To review how the soware works.
To make a virtual connection:
1 Click the Communication button.
2 Select the Virtual tab (see Figure 4.4).
3 Select a virtual sensor le by clicking the magnifying glass icon. Click the Options…
button to select a tracker log le.
4 Click the Connect button.
Page 48

CHAPTER 4 COMMUNICATION 47
Figure 4.4 – Virtual Connection and Additional Options Screen
Virtual Sensor File
Since a virtual connection is not made to an actual sensor, a virtual sensor le (.vsf ) is used
to save the conguration settings much like an actual sensor’s Flash memory. If you are
making a virtual connection for the rst time, you will need to create a virtual sensor le by
clicking on the magnifying glass icon and entering a le name.
When you create a new virtual sensor, you will need to complete two steps. First, you need
to open the new le (see Figure 4.5).
Figure 4.5 – Open New File
Second, you will need to decide whether the new sensor is to be a virtual SmartSensor Advance Extended Range device of a virtual SmartSensor Advance device (see Figure 4.6). If
you would like the virtual sensor to emulate SmartSensor Advance Extended Range, answer
Yes to the second prompt. If you would like the virtual sensor to emulate SmartSensor Advance answer No to the second prompt.
Figure 4.6 – Type of Virtual Sensor
Page 49

48 CHAPTER 4 COMMUNICATION
Note
When you are connected using a virtual sensor file, changes that would normally be
saved to a sensor’s Flash memory will automatically be saved to the virtual sensor
file.
Backing up a virtual sensor le will change the le to a sensor setup le (.ssc) that can be
restored to an actual sensor. To convert a sensor setup le to a virtual sensor le, make a virtual connection and then use the Restore Sensor Setup tool in the Tools menu. To convert a
virtual sensor le to a sensor setup le, use the Back-up Sensor Setup tool.
Note
If you want to configure channels, alerts and zones for a future installation, you can
connect using a virtual connection, create a virtual sensor file and then back up the
configuration settings that you created. After the file is successfully backed up, the
virtual sensor file will change to a sensor setup file and can be restored to any sensor
in the field.
Selecting a Tracker Log File
A tracker log le is used to play back recorded trac. To select a tracker log le, click the
Options… button, click on the magnifying glass icon and select the tracker log le from a
list of existing les. If a tracker log le doesn’t exist, the SSMA soware will create a generic
looping trac pattern (see the Setup Channels-Alerts-Zones screen for instructions on how
to create a tracker log le).
Note
If a successful connection uses the sensor’s Com port that was being used to push
data, the data push will be suspended during the duration of the connection.
When a connection is made to the SmartSensor Advance, the main menu will appear and
all conguration options will become available (see Figure 4.7).
Page 50

CHAPTER 4 COMMUNICATION 49
Figure 4.7 – SSMA Main Menu (Connected)
If you have problems connecting:
1 Make sure that all power and communication wiring is correct.
2 Check the port settings (baud rate, port ID).
Connection failure can occur for various reasons; if a failure occurs repeatedly, call Wavetronix Technical Support at 801-764-0277 for assistance.
Multi-drop Network
e SSMA soware automatically discovers the multi-drop ID of sensors over the selected
port (normally you will auto-discover addresses over port 1).
Figure 4.8 – Multi-drop Network
Click the Automatically detect sensors radio button and then click the Connect button.
e Auto-Discovery window will appear with a list of each detected sensor and its device
ID, location and description (see Figure 4.9).
Page 51

50 CHAPTER 4 COMMUNICATION
Figure 4.9 – Auto-Discovery Window
e device IDs are based on the last four digits of the sensor’s serial number. If the sensor
IDs conict, they can be changed in the auto-discovery window by clicking on the desired
row. e Change sensor ID window will appear allowing you to change the sensor ID.
Address Book
e address book allows you to save device connection settings for future use. Click the
Address Book button located at the bottom of the Communication page to add new connection settings to the address book (see Figure 4.10).
Filters Address Books by serial
or Internet connection
Edits the
selected device
Adds a device to
the Address Book
Deletes a device
from an Address
Book
Deletes an
Address Book
Imports an
Address Book
Exports an
Address
Book
Figure 4.10 – Address Book and Address Book Filter
e following elds are recorded in the address book:
Device (e.g. SS200)
Serial Number (e.g. SS200 U100000570)
Device ID (e.g. 0570)
Connection (e.g. Internet, 10.234.6.76, 2103 or Serial,COM4,115200 bps)
Description (e.g. Springville, US-37 & Main, EB)
e description eld is 100 characters wide and can contain information such as the city,
intersection street names, approach indicator (eastbound/westbound/northbound/south-
Page 52

CHAPTER 4 COMMUNICATION 51
bound) all within a single eld. If the descriptions are entered in a uniform fashion this can
help when using the sort function to nd items in the list.
Warning
The address book file is a question mark delimited file. Do not enter question marks
into the address book fields or you will have problems loading the file.
Navigating and Customizing the Address Book
e following is true about navigating the address book list:
You can move up/down through the row list entries by clicking on a row in the list and
dragging the cursor up or down. (is action takes the place of a vertical scroll bar so
that you can view more than the rst 13 items in the address book.)
You can move le-right through the list entry columns by clicking on a row in the list
and dragging the cursor le for right. (is action takes the place of a horizontal scroll
bar so that you can view all the information in each column.)
e following is true about the columns in the address book:
You can sort columns alphanumerically by clicking on the column header.
You can show/hide columns by right clicking on the column headers and then selecting
the appropriate option.
You can widen/narrow columns using the arrow on the right-side of each column
header.
You can re-arrange columns by clicking in the middle of the corresponding column
header and dragging it to the le or right beyond the next column.
Note
As an alternative to using an address book, you can also organize the information
pertaining to your network of sensors with an external program or service and then
use the external program or service to launch SSMA. See Appendix E for more information.
Viewing Connection Information
Once connected, you can view additional information about the connection you have established by clicking on the moving arrows icon on the top-right of the main menu page or
on the bottom-right of the Communication screen (see Figure 4.11).
Page 53

52 CHAPTER 4 COMMUNICATION
Figure 4.11 – Connection Info Screen
Below is a list of the information available on the Connection Info screen:
Status – Shows that you are connected.
Device – Shows the Subnet and sensor ID.
Type – Shows the type of connection and baud rate.
Duration – Shows how long you have been connected.
Failures – Shows the amount of failures during the connection, the percentage rate of
failure and a link to the Communication Error Log.
Check Hardware
Aer you have connected to a sensor, you can check its hardware type by right-clicking
below the Tools menu option and selecting Sensor Versions (see Figure 4.12).
Figure 4.12 – Check Sensor Version
e two current hardware types are SmartSensor Advance and SmartSensor Advance Extended Range.
Page 54

CHAPTER 4 COMMUNICATION 53
Figure 4.13 – Sensor Versions Window for Advance (left) and Advance Extended Range (right)
Once connected, the hardware type can also be determined from the title bar. If the sensor
is and Extended Range sensor, it will say "(Ext. Range)" in the title bar of SSMA.
Communication Error Log
e error log contains all errors stored in the sensor’s memory buer. If you are having
trouble connecting, using the error log may be helpful in the troubleshooting process. If you
continue having trouble, save the error log le and contact Wavetronix Technical Services.
Note
You will need to save the error log file or it will be overwritten.
Click the View Error Log link to view the communications error log (see Figure 4.14). e
error log can also be accessed by clicking on the Error Log icon at the bottom of the Communication screen.
Figure 4.14 – Error Log
Page 55

54 CHAPTER 4 COMMUNICATION
Uploading the Sensor’s Embedded Software
Aer clicking the Connect button, the Version Control screen may appear notifying you
that the sensor’s embedded soware and the rmware embedded in the SSMA soware are
not the same version (see Figure 4.15). To view more soware version information, rightclick on the SSMA main menu page and select from the options that appear.
Figure 4.15 – Sensor’s Embedded Software Upgrade (left) and Details Table (right)
Click the Details button to view the rmware versions of both the SSMA soware and the
sensor.
Once the Version Control screen appears, you can do one of the following:
1 Upgrade the sensor’s embedded soware by clicking the INSTALL UPGRADE button.
2 Click the close button and continue the conguration process.
3 Find the version of SSMA soware that is compatible with the sensor’s embedded so-
ware.
Note
Clicking the close button and continuing configuration without upgrading may cause
problems with functionality.
Install the rmware upgrade if the SSMA rmware version date is more recent than the
sensor’s embedded soware version date. If the sensor’s rmware date is more recent than
the SSMA rmware version date, a warning will appear notifying the user that the sensor
rmware could be downgraded (see Figure 4.16).
Page 56

CHAPTER 4 COMMUNICATION 55
Figure 4.16 – Sensor Firmware Downgrade
e most recent version of SSMA can be obtained from the Wavetronix website (www.
wavetronix.com) under the Support tab.
Converting Detection Zones from Previous Software Versions
Previous versions of the SSMA soware supported 8 zones. SSMA version 2.0 and later supports 128 zones (8 channels, 4 alerts per channel and 4 zones per alert).
During the rmware upgrade process, SSMA will determine if the sensor is running any
previous versions. If this is the case, the SSMA soware will display a message asking you
to convert the conguration. If you choose to convert the conguration, the SSMA soware
will create a new conguration out of the previous existing conguration; if you choose
NOT to convert, a default conguration will be created.
Note
You can use command line arguments to perform a batch upgrade of sensors. See
Appendix E for information about command line arguments.
Page 57

Page 58

Sensor Settings 5
In this chapter
General Tab
Communication Tab
5
Click the Sensor Settings link on the main menu to change and save settings on the sensor.
e Sensor Settings window contains General and Communication tabs (see Figure 5.1).
Figure 5.1 – Sensor Settings Screen
General Tab
e General tab contains the following elds (see Figure 5.2):
Page 59

58 CHAPTER 5 SENSOR SETTINGS
Serial Number – Contains the sensor serial number and can only be edited if you are
in the Advanced Sensor Setup mode (conatct Wavetronix Technical Services for more
information).
Sensor ID – Allows you to enter a multi-drop address for the sensor. e ID default
is the last four digits of the sensor serial number. e sensor ID can be changed, but
no two sensors should have the same ID; the ID must be unique for all sensors on a
multi-drop bus.
Description – Allows you to enter a description for each sensor (i.e. its function, ap-
plication or intended use). Limited to 32 characters.
Location – Allows you to enter the location of the sensor or the approach. Limited to
32 characters.
RF Channel – Displays which radio frequency channel (or non-interference channel)
the device is transmitting on. Using multiple SmartSensor Advance devices in close
proximity will require each one to be set to a dierent RF channel. Similarly, using
multiple SmartSensor Advance Extended Range devices in close proximity will require
each one to be set to a dierent RF channel. However, a SmartSensor Advance device
will not interfere with a SmartSensor Advance Extended Range device, even if they
are on the same RF channel. is is because the hardware used to transmit the Digital
Wave Radar signal is congured dierently on the dierent devices.
Figure 5.2 – General Tab
Note
It is recommended that the sensor's detection sensitivity be reconfigured after
changing from one RF channel to another.
Page 60

CHAPTER 5 SENSOR SETTINGS 59
Note
The RF Channel drop-down list allows you to select whether the PGA starts at a value
of 7 or remains fixed during the auto-configuration process.
Units – Allows you to display either English (mph/feet) or metric (kph/meters) units.
Source – In normal use, the source is always the radar Antenna. However, in some
cases, other sources may be used for demonstrations or evaluations. When the source
is switched to Diagnostic, the antenna is no longer used. Instead, a predetermined sequence of trac will appear. is setting will always return to Antenna aer rebooting
the sensor.
Communication Tab
e Communication tab is used to specify baud rate and response delay for the sensor’s
RS-485 ports (see Figure 5.3).
Figure 5.3 – Communication Tab
e Communication tab contains the following settings:
Baud Rate – is section allows you to set the baud rate for ports 1 and 2. e green
arrow indicates the communication link (Port) on which SSMA is connected. e default value is 9600 bps.
Page 61

60 CHAPTER 5 SENSOR SETTINGS
Note
If you are using a Click communication device, the baud rate for the sensor and the
Click device must be the same. Port 2 is designated as the data bus and is normally
left at 9600 bps in order to match the default setting on a Click 112/114 card. If you
change this baud rate on the sensor, you will also need to change it on the rack card.
Response Delay – is is used to congure how long the sensor will wait before re-
sponding to a message received. is is useful for some communications devices that
are unable to quickly change transmission direction. e default value is 4 milliseconds
for ports 1 and 2.
Remove Multi-drop Prefix – You will only need to turn this switch ON if you are using
a device that does NOT support the use of a multi-drop prex (i.e. Click 100).
Page 62

Sensor Configuration 6
In this chapter
1. Installation Details
2. Automatic Radar Configuration
3. Manual Radar Adjustment
6
e Sensor Conguration screen contains installation details, an automatic conguration
feature and manual conguration tools (see Figure 6.1).
Figure 6.1 – Sensor Configuration Screen
Click the lighting bolt icon on the bottom right corner of the screen to save the current conguration to the sensor’s ash memory. e sensor’s ash memory is non-volatile memory.
Page 63

62 CHAPTER 6 SENSOR CONFIGURATION
1. Installation Details
e Installation Details screen allows you to position the sensor relative to the stop bar and
determine the direction of trac to be monitored (see Figure 6.2).
Direction of trac
Stop bar
SmartSensor
Advance
Figure 6.2 – Installation Details Screen
Changes
direction of
trac
Changes
location of
stop bar
Changes
position of
sensor
Height of
sensor
e roadway part of the screen is used to illustrate the sensor’s position relative to the stop
bar; the controls on the right side of the screen allow you to specify the direction of trac
to be monitored and the sensor’s position. e distance units are displayed in the bottomright corner of the screen.
e OK button saves the settings to the sensor; the Undo button restores the settings to the
screen’s initial values; and the Cancel button closes the screen without saving changes to
the sensor.
Changing the Trac Direction
e SmartSensor Advance can be congured to detect trac moving towards or away from
the sensor, but will not detect stationary vehicles.
e arrow displayed on the roadway represents the direction of trac ow being detected
by the sensor. Click the Tra c button to change the monitored trac direction. e direction of the arrow displayed on the button shows the direction that will be selected if the
button is clicked, and always points in the opposite direction as the arrow on the roadway.
Positioning the Stop Bar
e ability to move the stop bar up and down the display adds exibility in representing the
relative location of the sensor to the stop bar and the direction of trac ow. e location
of the stop bar is always represented as a distance of zero (the sensor range is relative to the
stop bar).
Position the stop bar by clicking on the stop bar or its label and dragging it anywhere on the
Page 64

CHAPTER 6 SENSOR CONFIGURATION 63
roadway, or by clicking the Stop Bar up/down arrows.
Positioning the Sensor
Position the sensor by clicking on the sensor or its label and dragging it anywhere on the
roadway, or by clicking the Sensor arrow buttons.
e top number, shown in the sensor position display (next to the blue triangle), represents
the sensor’s position to the right or le of the center of the lanes being monitored (Cartesian
x coordinate); the bottom number represents the sensor’s position in front of or behind the
stop bar (Cartesian y coordinate), together forming a Cartesian coordinate pair (x, y). e
sensor’s height is specied by setting the Height value and reects the sensor’s mounting
height above the roadway (Cartesian z coordinate).
e resulting (x, y, z) coordinates describe the sensor’s position relative to the roadway and
are used to translate the sensor’s native range measurements to range measurements that
are relative to the roadway’s frame of reference. e sensor position is also used in the Beam
Alignment tool (see Tools).
Note
The sensor’s range is updated whenever the stop bar is moved.
Resetting Zones After Sensor Relocation
When the sensor location is changed, existing zones may no longer be within the sensor’s
detection range and the message below will appear (see Figure 6.3):
Figure 6.3 – Sensor Location Changed
It is always recommended to rst position the sensor and then congure detection zones.
However, if the sensor location is modied aer zone conguration, you can do one of the
following:
1 Manually check all detection zones and modify zones as needed (recommended). All
zones will still be available and their location relative to the sensor will be preserved.
If le uncorrected, the zones may no longer perform the desired detection function.
2 Reload only the channel conguration from a backup le created from the existing
conguration (the out-of-range zones will be deleted and the desired detection functions may be compromised).
Page 65

64 CHAPTER 6 SENSOR CONFIGURATION
3 Reload the individual channel template les used in the current conguration (the
out-of-range zones will be deleted and the desired detection functions may be com-
promised).
2. Automatic Radar Configuration
Click the Automatic Radar Conguration button and the Automatic Radar Conguration
screen will appear (see Figure 6.4).
Figure 6.4 – Automatic Radar Configuration Screen for Advance (left)
and Advance Extended Range (right)
Note
The ranges displayed in the Automatic Radar Configuration window will depend upon
whether you have SmartSensor Advance or SmartSensor Advance Extended Range.
The scale on the right side of the road view indicates the ranges.
Click the Play button to begin the auto-conguration process. e playing time will be shown
in the top-le corner of the screen. Aer approximately three minutes, trackers (sensor detections) will begin to appear on the roadway and the process will change to Step 2 Adjusting
resholds. e Pause button pauses the auto-conguration process; the Stop button will
terminate auto-conguration. e Close button closes the screen and returns to the Sensor
Conguration job menu. If the conguration process is running, it will continue to run aer
closing. To terminate the automatic radar conguration process, press the Stop button.
e semi-transparent message window can be toggled on/o by clicking the Show>> and
<<Hide labels. e roadway range scale can be toggled on/o by clicking the feet label.
e following is a list of tracker display data that can be viewed by clicking the Range ()
display bar at the base of the roadway:
Page 66

CHAPTER 6 SENSOR CONFIGURATION 65
Range – Shows the distance from the stop bar.
Speed – Shows the speed.
Estimated Time of Arrival – Shows the estimated time it will take to arrive at the stop
bar.
Tracker ID – Shows the ID number for each tracker.
Blank – (no tracker data shown)
Disabled – (no tracker shown)
3. Manual Radar Adjustment
e Manual Radar Adjustment screen is used to ne-tune the results of the automatic radar
conguration process (see Figure 6.5).
Figure 6.5 – Manual Radar Adjustment Screen for Advance (left)
and Advance Extended Range (right)
Note
The ranges displayed in the Manual Radar Adjustment window will depend upon
whether you have SmartSensor Advance or SmartSensor Advance Extended Range.
The scale on the right side of the road view indicates the ranges. The SmartSensor
Advance has 5-ft increments up to 600 ft, and the SmartSensor Advance Extended
Range has 7.5-ft increments up to 900 ft.
You will notice in the button tray at the bottom of the window (see Figure 6.5) there is a
Reboot button (green power button icon). When you press this button it will tell you that
the reboot may take up to 20 seconds (see Figure 6.6).
Page 67

66 CHAPTER 6 SENSOR CONFIGURATION
Figure 6.6 – Reboot
If you were in the process of manually editing detection thresholds, it will ask you if you
would like to save these changes to the sensor’s ash before rebooting (see Figure 6.7). If you
do not save these changes they will be discarded.
Figure 6.7 – Save Changes
During the reboot time, the power button will turn red (see Figure 6.8), but once the sensor
has rebooted it will go back to green again.
Figure 6.8 – Red Button During Reboot
Editing Sensitivity
If missed detections are consistently noticed, the sensor’s sensitivity can be adjusted. Decreasing the detection threshold levels in areas where trackers begin to disappear will reduce
the number of missed detections. To increase the sensor’s sensitivity, decrease the detection
threshold levels; to decrease the sensor’s sensitivity, increase the detection threshold levels.
Page 68
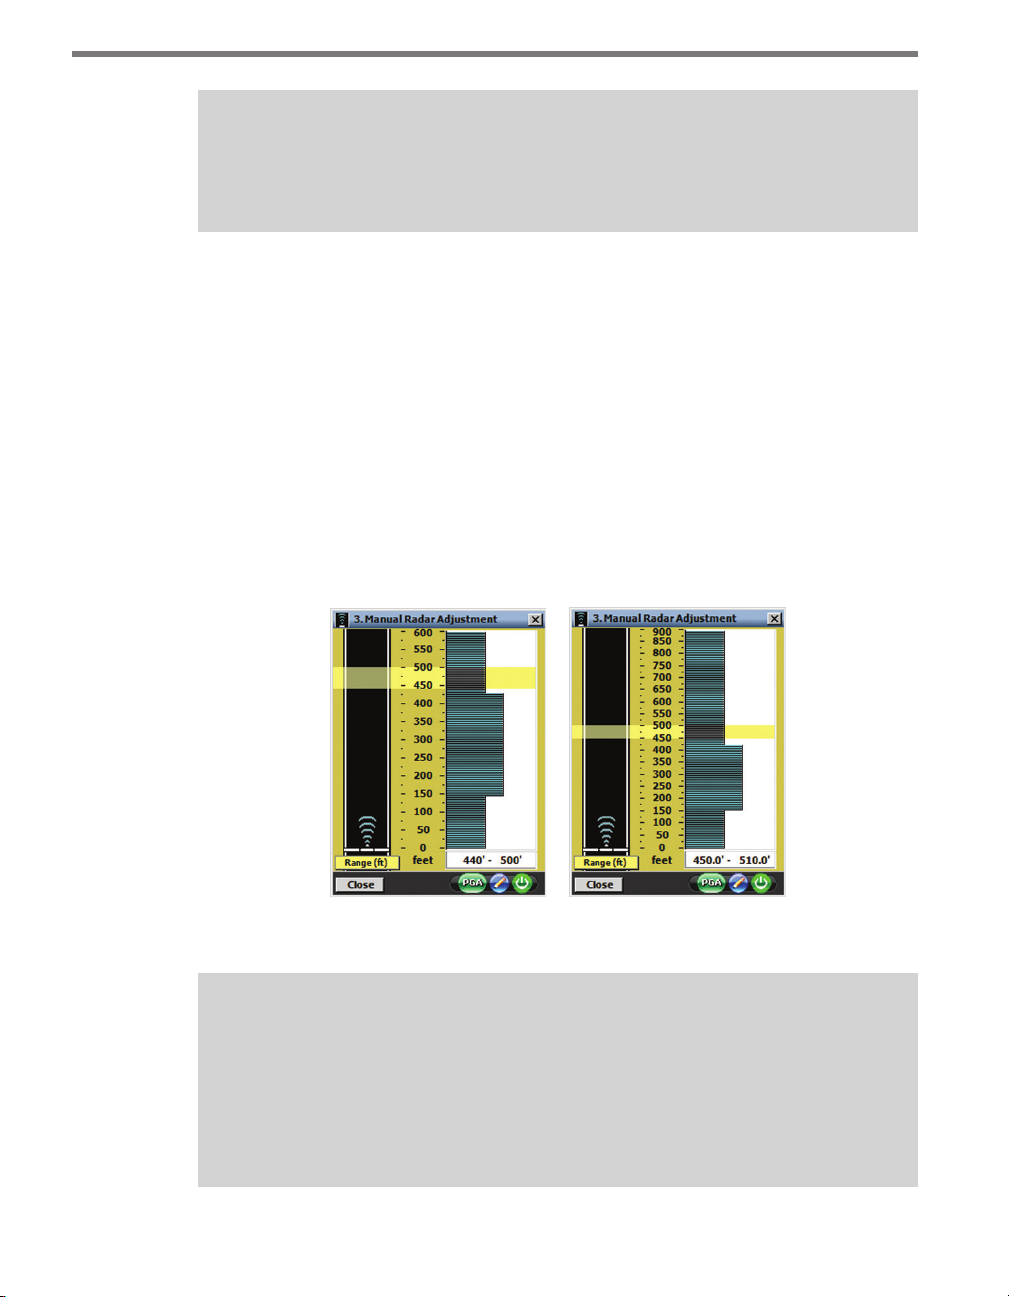
CHAPTER 6 SENSOR CONFIGURATION 67
Note
Do not reduce the thresholds so low that “phantom detections,” or false detections in
the absence of trac, begin to appear.
If phantom detections are consistently visible, increase the sensor’s detection thresholds in
these areas. Phantom detections can occur if large objects in the sensor’s eld of view move
faster than 1 mph (2 kph). If the thresholds are too low, the sensor can pick up trees swaying
in strong winds or fast-moving pedestrians.
Double detections from vehicles such as double-bed trailers are not considered false detections. It is oen benecial for the sensor to signal an actuated trac controller based on
both detections. In cases of double detections, the thresholds will not need to be increased.
Follow the steps below to adjust the sensitivity:
1 Determine the ranges for which detections need to be adjusted.
2 Click and drag to select the section of the histogram (range bins) that needs to be ad-
justed (see Figure 6.9).
Figure 6.9 – Editing Ranges for Advance (left)
and Advance Extended Range (right)
Note
The ranges displayed in the manual radar configuration view will depend upon
whether you have SmartSensor Advance or SmartSensor Advance Extended Range.
The scale between the road view and the threshold histogram bars indicates the
ranges. With SmartSensor Advance each threshold is every 5 feet. With SmartSensor Advance Extended Range each threshold is every 7.5 feet.
Page 69

68 CHAPTER 6 SENSOR CONFIGURATION
3 Click the Edit button and the Edit Sensitivity resholds screen will appear (see Figure
6.10). e following three editing modes are available for modifying sensitivity values:
e +/- mode adds or subtracts the specied number to the existing sensitivity lev-
els.
e % mode sets the sensitivity level to be the specied percent of the existing value.
e Va lue mode sets the sensitivity level to be the specied value.
Figure 6.10 – Edit Sensitivity Thresholds Screen for Advance (left)
and Advance Extended Range (right)
4 Click and drag again to select the exact range bins to adjust.
5 Make the sensitivity level adjustments.
6 Aer adjusting the sensitivity, click the Enter button to apply the adjustment.
7 Click the OK button to accept the modications and close the Edit Sensitivity window;
click the Undo button to return all modied sensitivity levels to their initial values; or
click the Cancel button to undo all changes made.
8 Re-evaluate the detections.
If any changes were made during the Sensor Conguration process, a pop-up window will
appear prompting the user to save the changes to the sensor’s FLASH memory. Changes
that were not written to FLASH will be lost the next time the sensor reboots. e process of
saving to FLASH memory takes approximately ve seconds.
Selecting a Tracker Display Mode
e following is a list of tracker display data that can be changed by clicking the display bar
at the base of the roadway:
Range
Speed
ETA
ID
Blank
Disabled
Page 70

CHAPTER 6 SENSOR CONFIGURATION 69
Changing the PGA
e Programmable Gain Amplier (PGA) allows you to change the radar sensitivity for the
entire approach (see Figure 6.11).
Figure 6.11 – Editing the PGA
Note
Consult with Wavetronix Technical Services before changing the PGA setting.
Page 71

Page 72

Channels-Alerts-Zones 7
In this chapter
Channels
Alerts
Zones
7
e Channels-Alerts-Zones (CAZ) screen allows you to set up and verify channels, alerts
and zones; set up output communications; and import/create a template (see Figure 7.1).
Figure 7.1 – Channels-Alerts-Zones Screen
is chapter will explain the dierent types of channels and how they are mapped to alerts
and zones.
e CAZ Setup screen provides conguration access to all CAZ elements.
Page 73

72 CHAPTER 7 CHANNELS-ALERTS-ZONES
Channels
e channel is the highest-level detection unit. e user-dened channel name, used to
distinguish one channel from another, can consist of eight ASCII characters. e channel
number (1–8) is used to associate sensor channels with Click contact closure channels.
e Typ e drop-down list allows you change the channel type from the default type. For
SmartSensor Advance Extended Range, the default channel type is Priority for channels
1–3 and Simple for channels 4–8. For SmartSensor Advance, the default type is Simple for
all channels. SmartSensor Advance does not have Priority channels, but both sensors have
three additional types of channels: Normal, Latched and Pulse (see Figure 7.2).
Figure 7.2 – Channel Configuration
e channel conguration is read from the sensor the rst time that the CAZ job is selected.
Due to the amount of information represented in the conguration, the retrieval may take
ve seconds or more, depending on the speed and quality of the connection.
Note
The channel output from a sensor is usually tied to a channel input in a controller.
Click the Enabled checkbox and all channel features will become available. When a channel
is enabled, the channel portion of the setup screen and its associated tab is colored gold;
when a channel is disabled, the channel section is gray.
Simple Channel
A simple channel consists of one dedicated zone, which is a lower-level detection unit. e
simple channel provides an easy and quick way to set up the zone (see Figure 7.3).
Page 74

CHAPTER 7 CHANNELS-ALERTS-ZONES 73
Channel 1
Zone 1
Figure 7.3 – Simple Channel Hierarchy
To create a simple channel, select Simple from the Type drop-down menu and the following screen will appear (see Figure 7.4):
Figure 7.4 – Simple Channel for Advance (left) and Advance Extended Range (right)
A simple channel allows you to congure the most basic zone settings. You can change the
size of the zone by either clicking and dragging the zone arrows anywhere along the roadway or by using the up/down arrows in the Range (feet): eld.
You can set the Speed and ETA settings by rst clicking the Speed/ETA checkbox and then
setting the parameters using the up/down arrows. Click OK to save the changes you make
to each channel.
Note
Make sure that the Speed/ETA checkboxes are checked before you click OK. If the
checkboxes are not checked, those settings will NOT be enabled.
e SmartSensor Advance is most commonly used with advance detection at signalized
Page 75

74 CHAPTER 7 CHANNELS-ALERTS-ZONES
intersections. A very powerful method of advance detection uses two simple channels: Advance and QReduce.
e Advance channel provides green extension at high-speeds for safety and eciency.
e QReduce channel provides green extension at low-speeds when the initial queue is
dissipating.
Follow the steps below to congure the Advance channel:
1 Click on Channels-Alerts-Zones on the main menu.
2 Click the Setup Channels-Alerts-Zones button.
3 Enable a channel by checking the Enabled checkbox.
4 Select Simple from the Type drop down list.
5 Adjust the size of the zone by either using the Range (feet): up/down arrows or by
manually grabbing the zone’s blue arrows and dragging them anywhere on the roadway.
6 Click the Speed and ETA checkboxes to activate the Speed and ETA parameters.
7 Set the speeds from 35 mph on low end to 100 mph on high end.
8 Name the channel “Advance” and click OK to save the channel settings.
Follow the steps below to congure the QReduce channel:
1 Click the second tab on the top of the Setup Channels-Alerts-Zones screen.
2 Enable the channel by clicking the Enabled checkbox.
3 Select Simple from the Type drop-down list.
4 Adjust the size of the zone to 100 to 150 feet from the stop bar.
5 Click the Speed checkbox to activate this lter and select speeds from 1 to 35 mph.
6 Name the channel “QReduce” and click OK to save the channel settings.
e OK, Undo and Cancel buttons pertain to ALL changes made in the CAZ Setup job and
not to individual channels, alerts or zones. e OK button saves the settings to the sensor;
the Undo button restores the settings to the screen’s initial values; and the Cancel button
closes the screen without saving any changes.
Priority Channel
A priority channel consists of three zones, each with a complementary role (see Figure
7.5). When any one of the three zones is active, the channel output is active (equivalent to a
Boolean OR of the three zone outputs).
Page 76

CHAPTER 7 CHANNELS-ALERTS-ZONES 75
Channel 1
Level 1
Level 2
Queue
Clearance
Figure 7.5 – Priority Channel Zones
e rst two zones work in tandem to allow you to provide dierent levels of dilemma zone
protection based upon the discovery range of each vehicle. Vehicles discovered upstream
of the discovery range threshold are classied as level one priority and are given the highest level of protection. Vehicles discovered downstream of the discovery range threshold
are classied as level two priority and are given a reduced but adequate level of protection.
Note
Priority channels are only available with SmartSensor Advance Extended Range. The
extended range of the sensor is best matched to:
• Distinguish between large vehicles (trucks and buses) and small vehicles (passenger cars).
• Provide dilemma zone protection for large vehicles. Trucks have been shown to
have dilemma zones a far back as 7.5 seconds. For example, an ETA of 7.5 seconds at 65 mph is equivalent to 715 ft. (217.9 m). This is beyond the range of
SmartSensor Advance, but not SmartSensor Advance Extended Range.
By default the discovery range threshold is set at 750 feet. If necessary, adjust the discovery
range threshold so that most large vehicles are discovered beyond this threshold and most
small vehicles are discovered aer it.
Page 77

76 CHAPTER 7 CHANNELS-ALERTS-ZONES
Figure 7.6 – Setup Channels-Alerts-Zones Screen for Priority Channel
e level-one zone will activate the channel output when a level-one priority vehicle meets
the specied criteria. By default the ETAs protected are between 2.5 and 7.5 seconds because trucks and other large vehicles have been found to have a larger dilemma zone.
e level-two zone will activate the channel output when a level-two priority meets the
specied criteria. By default the ETAs protected are between 2.5 and 5.5 seconds because
passenger cars and other light-duty vehicles have been found to have a smaller dilemma
zone.
e third zone is a queue-clearance zone. is zone activates the channel output when the
initial queue of trac is dissipating at low speeds. It is recommended that all three zones be
used in combination with 1.0 seconds of passage time in the controller.
For the queue clearance zone, a 1.0 passage time is added to the maximum time headway
between two vehicles occupying the zone at the same time to determine the maximum allowable time headway. When the zone is 50-feet wide and the vehicles are 20-feet long, the
maximum time headway between two vehicles occupying the zone at the same time at 30
mph is approximately 1.6 seconds. Aer adding 1.0 seconds of passage time, maximum allowable headway for 30 mph vehicles becomes 2.6 seconds. Slower vehicles will experience
a large maximum allowable headway, which is useful during the startup period of queue
dissipation in order to avoid gap out.
If you need to increase the maximum allowable headway you can increase the size of the
queue clearance zone, or the passage time. Normally it is recommended to keep the passage
time small and increase the size of the queue clearance zone. is is because the size of the
queue clearance zone will not matter when the ow speeds are above 35 mph, and because
you want to keep the passage time trim when trying to nd a safe gap in high-speed trac.
Page 78

CHAPTER 7 CHANNELS-ALERTS-ZONES 77
Figure 7.7 – Providing Dilemma Zone Protection
By providing zones for level-one priority dilemma zone protection, level-two dilemma zone
protection and queue clearance, a priority channel provides exceptional detection from
start-of-green to end-of-green.
Note
There may be a number of uses of the discovery range feature for other applications
than truck priority. For example, you could require that a vehicle be discovered at a
certain range (using the discovery range threshold) and that it travels to a downstream zone several hundred feet away before it activates a channel output. This is
a way to know that we have tracked a specific vehicle over an extended range. This is
better than simple using the channel delay because it isolates a single vehicle.
Pulse Channel
A pulse channel consists of one dedicated zone. When a tracked detection enters the zone,
the channel will pulse on once and then return to the o state. e on time and the minimum o time of the pulse are predetermined. If two detections enter the zone at exactly the
same time, then the associated pulses will be sent sequentially with the minimum o time
separating them.
Note
The duration of the on time and o time in each pulse is controlled by the output
frequency setting in SSMA. By default the output frequency setting is 130 ms. Since
standard trac controllers sample at 10Hz, a 130 ms on time and o time should be
of sucient length to faithfully transfer all pulses generated by the sensor.
Page 79

78 CHAPTER 7 CHANNELS-ALERTS-ZONES
Pulse channels dier from other channel types because they are designed to provide vehicle
arrival information rather than dilemma zone protection or queue reduction information.
is vehicle arrival information can be logged by trac controllers or forwarded to trac
management databases in order to evaluate signal timing parameters such as coordination
oset.
Note
At installations with multiple lanes, a single tracker will sometimes monitor multiple
vehicles traveling in close proximity. While this type of merging will not significantly
impact the time-of-arrival information communicated by the pulses, it can cause the
total number of pulses to dier from the volume of vehicles.
Figure 7.8 shows the setup screen for a pulse channel. Short zones at about 350 to 400 feet
are oen used with pulse channels. ese zones can be as short as 10 feet.
Figure 7.8 – Setup Channels-Alerts-Zones Screen for Pulse Channel
Note
With pulse channels, speed filtering is available, but not typically used. If speed filtering is used, a tracked detection will create a pulse only if it meets the speed criteria
while it is within the ranges of the zone.
When verifying pulse channels, the right sidebar can be used to total the number of pulses.
Pulse totals will restart at zero every time you return to the verify screen. Pulse totals are
also reset for all channels every time that you hit the reset button.
In the example shown in Figure 7.9 tracker 24 has already been tallied into the pulse total.
Tracker 25 will be added to the total once it reaches the point detection zone.
Page 80

CHAPTER 7 CHANNELS-ALERTS-ZONES 79
Figure 7.9 – Tracker Logging with Pulse Channel
It is possible to set up all 8 channels as pulse channels. is could be done to determine at
which range the best arrival information is collected. As an example, Figure 7.10 shows a
pulse channel every 50 feet starting at 150 feet.
Figure 7.10 – All 8 Channels as Pulse Channels
Note
Chapter 8 of this user guide provides information on how you can log arrival timestamps and pulse totals to a log file.
Normal Channel
Normal channels consist of (see Figure 7.11):
8 channels
4 alerts per channel (32 total)
4 zones per alert (128 total)
Page 81

80 CHAPTER 7 CHANNELS-ALERTS-ZONES
Channel 1
Alert 1
Zone
Alert 2
Zone
Alert 3
Zone
Alert 4
Zone
Zone
2
1
Zone
2
1
Zone
2
1
Zone
2
1
Zone
Zone
4
3
Zone
Zone
4
3
Zone 3Zone
4
Zone
Zone
3
4
Figure 7.11 – Normal Channel Hierarchy
e CAZ Setup screen below shows a tabbed view of each detection channel and its associated alerts and zones (see Figure 7.12). e eight tabs at the top of the screen represent
the sensor’s eight channels, with the selected tab showing the channel number and channel
name; the middle portion of the screen contains alert conguration parameters; and the
lower portion of the screen contains zone conguration parameters.
Channels
Alerts
Zones
Figure 7.12 – Setup Channels-Alerts-Zones Screen
e OK, Undo and Cancel buttons pertain to ALL changes made in the CAZ Setup job and
not to individual channels, alerts or zones. e OK button saves the settings to the sensor;
the Undo button restores the settings to the screen’s initial values; and the Cancel button
closes the screen without saving any changes.
Page 82

CHAPTER 7 CHANNELS-ALERTS-ZONES 81
Normal channels consist of four alerts, each containing four zones. A normal channel’s
output is a logical combination of the channel’s alert, zone, delay and extend settings (see
Delay and Extend sections under Latched Channels). e normal channel’s output becomes
active when the associated alert and zone logic, the channel delay or the channel extend are
satised.
Each enabled normal channel must have at least one enabled alert. If you attempt to save an
invalid channel conguration, the following message is displayed (see Figure 7.13).
Figure 7.13 – Invalid Channel Configuration
Latched Channel
Latched channels consist of two alerts (ON and OFF), each containing up to four zones (see
Figure 7.14). A latched channel, by denition, has exactly two enabled alerts that cannot be
disabled.
Channel 1
ON
Alert
Zone 1Zone
2
OFF
Alert
Zone 1Zone
2
Zone
3
Zone
3
Zone
4
Zone
4
Figure 7.14 – Latched Channel Hierarchy
Latched channels dier from normal channels in that the channel output remains in a given
state until a contradictory alert is exclusively activated, or a maximum latch time has expired (see Figure 7.15).
Page 83

82 CHAPTER 7 CHANNELS-ALERTS-ZONES
Channel
output
ON
Alert
OFF
Alert
Figure 7.15 – Latched Channels
Latched
For example, a channel’s output will become activated when an ON alert is triggered and
will latch (stay active) even when the ON alert is no longer triggered. Subsequently, if an
OFF alert is triggered, the channel output will be deactivated as soon as all other timing
conditions are satised (e.g. the minimum ON time, channel extend).
Note
When changing a normal channel to a latched channel, alerts 1 and 2 will be used as
the ON and OFF alerts, respectively (alerts 3 and 4 will be disabled).
Delay
e channel delay is used to ignore alert outputs that are shorter than the specied delay
time (see Figure 7.16). Latched channels do not activate outputs until the delay requirements have been met (only a channel’s alert and zone logic are applied during the delay
period).
Delay
Channel
output
Alert
Figure 7.16 – Channel Delay
Extend
e extend feature is used to continue a channel output aer the required conditions have
been met (see Figure 7.17). For example, if a vehicle enters a zone and activates the channel
output, that channel would remain ON for a specied extend time aer the vehicle leaves
the zone.
Page 84

CHAPTER 7 CHANNELS-ALERTS-ZONES 83
Channel
output
Alert
Figure 7.17 – Channel Extend
Extend
Max (s)
e channel Maximum Latch Timer is used to turn a latched channel o aer it has existed
continuously in a latched state for a specied period of time. e latch timer, labeled Max
(s), is available only when using latched channels and can be enabled/disabled by checking/
unchecking the checkbox next to the Max (s) label.
If enabled, the latch timer species how long a latched channel may operate continuously
in the latched state. In a case where the OFF condition was not detected, the latch timer can
be used to prevent a latched channel from remaining indenitely (and unintentionally) in
the ON state.
e latch timer can also be used to generate a latched output of specied duration. is
timed output can be achieved by dening the OFF alert to have a conguration that is not
likely (essentially impossible) to be activated.
Note
A latched channel may have its output activated indefinitely (even if the latch timer
is enabled), if the ON alert is never turned o or if it is repeatedly turned o and on
before the latch timer expires.
A latched channel with an impossible OFF alert could be used to drive an over-speed beacon or any other type of ancillary signal that is based on the activating of the ON alert and
whose indication has a xed duration.
Note
The extend period occurs after the latched condition is terminated. This means that
the output will remain activated, after the latch timer expires, for an additional period of time (as specified by the extend setting).
Page 85

84 CHAPTER 7 CHANNELS-ALERTS-ZONES
Alerts
e alert is the mid-level detection unit and is used to dene the corresponding channel’s
output (see Figure 7.18).
Figure 7.18 – Alert Configuration
Enabling an Alert
When an alert is enabled, the alert section of the setup screen turns white; when an alert
is disabled, the alert section turns dark gray. A normal channel contains alerts 1 through 4
and a latched channel contains an ON alert and OFF alert that cannot be disabled.
Each enabled alert must have at least one enabled zone. If you attempt to save an invalid
alert conguration, a prompt will appear asking you to activate one zone for each enabled
alert.
Logic (OR/AND)
An alert’s logic setting species the Boolean logic operation to be applied to the alert’s zone
outputs. e available options are OR and AND. If OR logic is selected, the alert will turn
ON if one or more zones have active outputs; if AND logic is selected, the alert will turn ON
only if ALL enabled zones have active outputs.
Inverted Zones
In order to provide more exibility, an alert can invert a given zone’s output BEFORE applying the alert’s specied logic operator on the zone outputs.
For example, if an alert has only one enabled zone (zone1), and that zone’s output is OFF
(did not nd a qualied detection in the zone), then the alert’s output will be OFF. However,
if the alert were congured to invert the zone’s output, then when the zone’s output is OFF,
the alert’s output will be ON.
Zones
e zone is the lowest-level detection unit. A zone’s output is used to dene the corresponding alert’s output.
Page 86

CHAPTER 7 CHANNELS-ALERTS-ZONES 85
Click here
to open the
range editor
Figure 7.19 – Zone Configuration
Below is a description of each parameter in the zone section of the CAZ Setup screen (see
Figure 7.19).
Range (ft)
A zone is enabled when its range is dened. When a zone is enabled, the zone section of
the setup screen turns yellow; when a zone is disabled, the zone section turns light gray. A
detection must be within a zone’s range limits in order to activate that zone’s output. All
zone ranges in a given alert are congured in a single screen and may not overlap in range.
Click in the zone range display next to the range label to open the zone range editor (see
Figure 7.20).
Figure 7.20 – Zone Range Editor
To add (enable) a zone, drag the desired zone icon from the zone well to the roadway; to remove (disable) a zone, drag it from the roadway to the zone well (or anywhere o the roadway). If a zone is moved to an invalid location, it will be returned to its previous location.
To change the range of a zone, drag the blue triangle markers up or down the roadway or
click the up/down arrows on either side of the screen (see Figure 7.21). e zone can be
placed anywhere on the roadway by clicking anywhere inside the zone and dragging it. e
minimum range is 50 . (15.2 m) from the sensor and the maximum range is 600 . (152.4
m) from the sensor.
Page 87

86 CHAPTER 7 CHANNELS-ALERTS-ZONES
Figure 7.21 – Adjusting Zones for Advance (left) and Advance Extended Range (right)
Speed (mph) and ETA (s)
In addition to range, zone detections can also be ltered by speed and by the estimated time
of arrival to the stop bar. Click anywhere in the Speed or ETA area and the Edit Basic Filters
screen will appear (see Figure 7.22).
Figure 7.22 – Edit Basic Filters Screen
Edit the min and max values in the speed lter to set the range of qualied speeds. e minimum speed value is 1 mph (2 kph) and the maximum speed value is 100 mph (161 kph).
On the previous window, check the box to the le of the Speed label to enable the speed
lter (only speeds within the range will activate zone outputs); uncheck the box to disable
the speed lter (all speeds will activate zone outputs).
Edit the min and max values in the ETA lter to set the range of qualied ETAs. e minimum ETA value is 0.1 seconds and the maximum ETA value is 25.4 seconds. If you try
to raise the max ETA value above 25.4, the lter will be set to INF, which will accept any
vehicle with an estimated time of arrival greater than the minimum.
On the previous window, check the box to the le of the ETA label to enable the ETA lter
(only ETAs within the range will activate zone outputs); uncheck the box to disable the ETA
lter (all ETAs will activate zone outputs).
Qualified Count
A qualied detection is a detection in a zone that meets the specied range, speed and ETA
lters. e SmartSensor Advance provides two very powerful detection qualication lters:
Page 88

CHAPTER 7 CHANNELS-ALERTS-ZONES 87
Qualied Count and Dynamic Density™. ese lters are mutually exclusive (only one may
be active at a time).
e qualied count lter is used to limit a zone’s outputs to times when there are a certain
number of qualied detections in the zone at one time.
Click in the Qualied Count range and the Edit Qualied Count lter will appear. Edit the
min and max values to set the qualied count range (see Figure 7.23). Only qualied detections within the set range will activate zone outputs. e minimum qualied count value is
1 and the maximum qualied count value is 25.
Figure 7.23 – Qualified Count Filter
Click the radio button to the le of the Qualied Count label to enable the qualied count
lter.
Dynamic Density
Dynamic Density is a type of vehicle platoon detection that activates a zone’s output when
the number of qualied detections within a zone equals or exceeds a density requirement.
e following equations explain the density requirement formula, called the Dynamic Density Count Requirement (DDCR).
First, trac density is dened as the number of vehicles within a zone, divided by the area
of the zone (see Figure 7.24).
Density =
Figure 7.24 – Required Density Equation
Number of Vehicles in a Zone
Zone Size (ft.) x Lane Tuning Factor
To maintain a given level of eciency, the required density increases as speeds decrease;
similarly, the required density decreases as speeds increase. erefore, to achieve a Required
Flow Rate, the density of trac will dynamically change with the speed of the vehicles as
shown in Figure 7.25.
Density =
Figure 7.25 – Flow Rate Equation
Required Flow Rate
Speed
In addition, the Required Flow Rate is equal to the ideal ow rate multiplied by the required
% Utilization. Since ideal ow rate is inversely proportional to the ideal time Headway between vehicles, this can be written as show in Figure 7.26.
Page 89

88 CHAPTER 7 CHANNELS-ALERTS-ZONES
Required
Flow Rate
Figure 7.26 – Equation for Dynamic Density Vehicle Count Threshold
=
Flow Rate
Ideal
%Utilization
x
%Utilization
=
Time Headway
Consequently, the Dynamic Density Count Requirement (DDCR) calculated by the Dynamic Density lter is computed as shown in Figure 7.27.
Dynamic Density
Count Requirement
(DDCR)
Figure 7.27 – Dynamic Density Count Requirement Equation
= Round
%Utilization x Lane Tuning Factor x Zone Size
Time Headway x Instantaneous Mean Speed in Zone
If the number of qualied detections is equal to or greater than the DDCR, then the Dynamic Density requirement has been satised and the zone output will be activated.
Table 7.1 below reviews the components of the Dynamic Density lter. e number of qualied detections and their average speed is detected by the sensor. en based upon values
of Zone Size, % Utilization, Tuning Factor, and headway parameters entered by the user, the
DDCR will be calculated and the zone output determined.
Component Description
Detected by the Sensor
Qualified Count The number of vehicles that meet a
zone’s range, speed and ETA filters.
Speed The average speed of all qualified detec-
tions in the specified zone, as calculated
by the sensor (ft per second).
Entered by the User
Table 7.1 – Description of Dynamic Density Equation
Zone Size The length of the specified zone (ft.).
%Utilization Specified by the user (%).
Tuning Factor Specified by the user.
Headway Specified by the user (seconds per ve-
hicle).
Click in the display area beneath the Dynamic Density label to edit the Dynamic Density
lter (see Figure 7.28).
Page 90
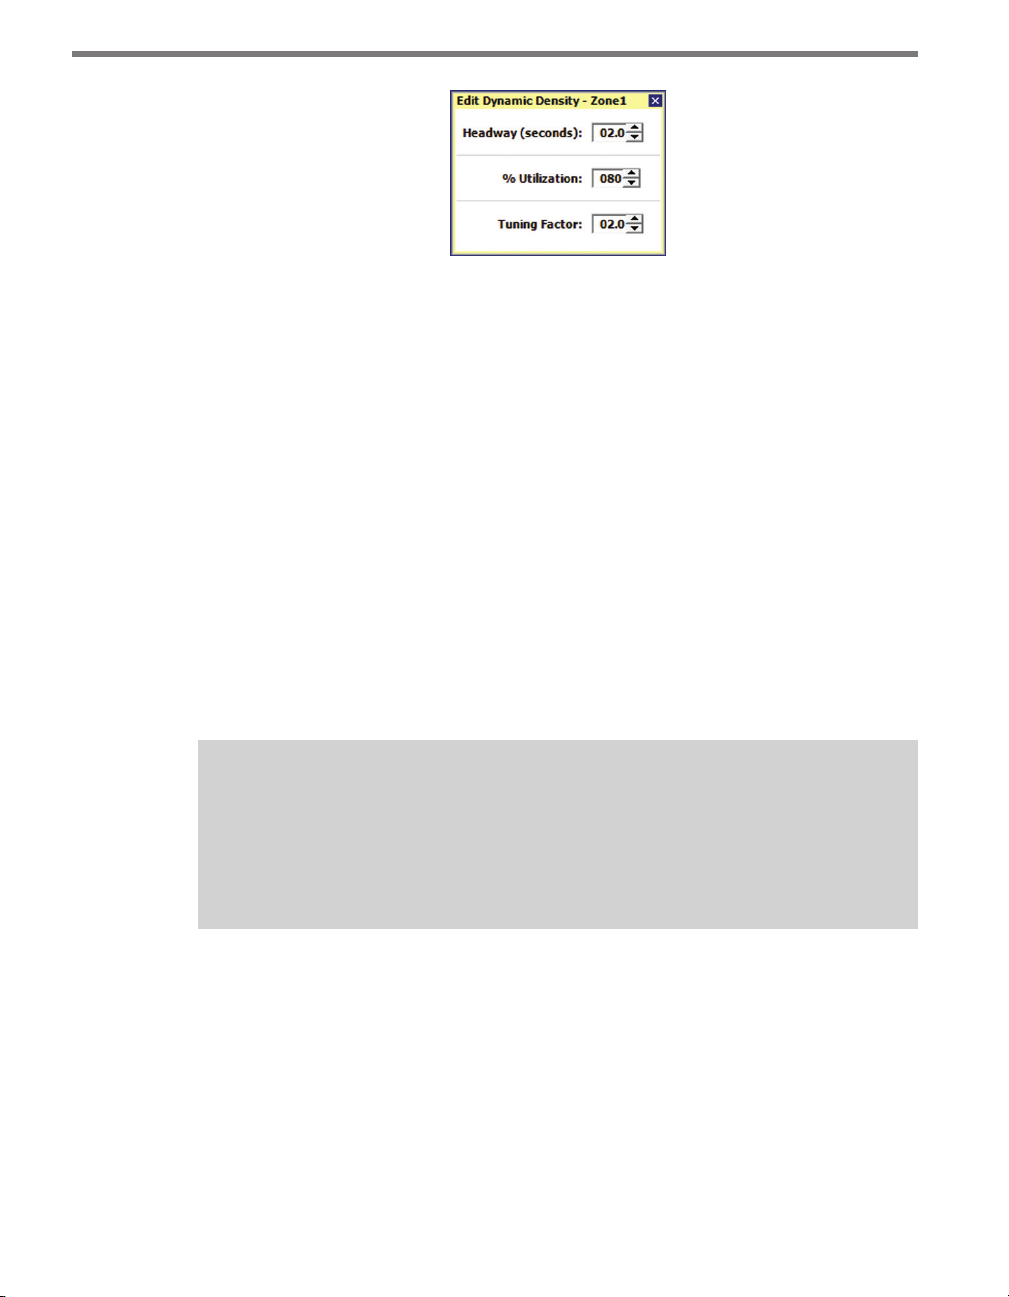
CHAPTER 7 CHANNELS-ALERTS-ZONES 89
Figure 7.28 – Dynamic Density Filter
Dynamic Density allows the SS200 to generate outputs based on trac eciency. e three
lter elements (Headway, % Utilization, and Tuning Factor) are combined with the size of
the zone and the average speed of qualied detections to create a detection density threshold that changes with the uctuations in detected trac.
Headway refers to the time separation of the front edge of two consecutive vehicles traveling in a given lane. e headway metric is inversely proportional to the ow rate of a given
lane and is widely used as a measure of how eciently trac is owing in a given lane.
A typical headway value for heavily traveled lanes is two seconds, which corresponds to a
ow rate of 1800 vehicles per hour. In the Dynamic Density settings, the minimum headway value is 0.1 seconds and the maximum headway value is 10.0 seconds.
% Utilization refers to the ratio of observed ow rate to ideal ow rate. It is a measure used
to describe trac eciency in terms of the ideal eciency. In the Dynamic Density settings, the minimum utilization value is one percent and the maximum utilization value is
100 percent.
Note
Consider a case where a lane is operating at the lower bounds of acceptable eciency
when only 75 percent of it’s ideal flow rate was realized. If the ideal flow rate were
1800 vehicles per hour, then the lane is being used adequately at a flow rate of 0.75 *
1800 vehicles/hour = 1350 vehicles/hour (or a headway of 2.67 seconds).
e Tuning Factor is a general-purpose scale factor used to adjust observed results to represent actual road conditions. e tuning factor resides in the numerator of the Dynamic
Density equation. e initial recommendation for the tuning factor value is to set it equal
to the number of lanes being observed by the sensor. e minimum tuning value is 0.1 and
the maximum tuning value is 10.0.
Page 91

Page 92

Verify Channels-Alerts-Zones 8
In this chapter
Right Sidebar
Roadway Display
Left Sidebar
8
e Verify Channels-Alerts-Zones screen contains both conguration and detection information (see Figure 8.1).
Figure 8.1 – Verify CAZ Screen for Advance (left) and Advance Extended Range (right)
Page 93

92 CHAPTER 8 VERIFY CHANNELS-ALERTS-ZONES
Note
When verifying channels, alerts and zones, you can use the range scale to help identify
whether you have SmartSensor Advance or SmartSensor Advance Extended Range.
is chapter will explain the dierent views and capabilities of the Verify Channels–Alerts–
Zones screen. e main sections of the screen (the right sidebar, the le sidebar and the
roadway display) will allow you to verify that the SmartSensor Advance is functioning corre ctly.
Note
Simple channels are shown on the right side bar with the letter “S” next to the channel LED; latched channels are shown with the letter “L.”
Right Sidebar
e right sidebar is designed to show detections and summarize conguration settings for
all channels, alerts and zones (see Figure 8.2). A channel must be enabled in order to be
included in the list of individual channels that can be veried.
Figure 8.2 – Right Sidebar
e right sidebar also allows you to select which CAZ element is highlighted in the roadway
and displays the corresponding outputs of each congured CAZ element (see Table 8.1).
Page 94

CHAPTER 8 VERIFY CHANNELS-ALERTS-ZONES 93
Outputs ON Color OFF Color Disabled Color
Channel Red
Alert Red
Zone 1 Green
Zone 2 Blue
Zone 3 Yellow
Zone 4 Red
Table 8.1 – Right Sidebar Output Colors
Gray Blank
Click and hold the right sidebar display button to access the display mode list (see Figure 8.3).
Figure 8.3 – Right Sidebar Display Mode List
Hidden
e hidden view hides the right sidebar and is used to simplify the overall appearance of
the verication screen.
(All) Channels
e (All Channels) view shows an LED for each of the SmartSensor Advance’s eight channel outputs. e channel outputs are transmitted to a contact closure device, which in turn
generates an appropriate signal on the corresponding contact closure output channels.
e channel LED is colored red when a given channel’s output is activated. e channel
LEDs also show the eects of the channel’s delay and extend settings.
To identify which detections are aecting the channel’s output, click on the channel output
you want to identify (see Figure 8.4). If a detection meets the selected channel’s alert and
zone lter settings, the tracker will be highlighted light blue.
Page 95

94 CHAPTER 8 VERIFY CHANNELS-ALERTS-ZONES
Figure 8.4 – All Channels Mode
Tip
Click and hold on a channel LED to open the individual channel summary screen. The
channel summary screen shows the channel type, delay and extend settings and all
enabled alerts for that channel.
Individual Channel
e individual channel view allows you to see the CAZ elements dened for a given channel
(see Figure 8.5).
Figure 8.5 – Individual Channel View (Simple Channel) for Advance (left)
and Priority Channel for Advance Extended Range (right)
Page 96

CHAPTER 8 VERIFY CHANNELS-ALERTS-ZONES 95
Note
In Figure 8.5 the dashed, gray line near the top of the zone is used to indicate the
location of the discovery range threshold for this priority channel. Vehicles first discovered before the discovery range threshold will be highlighted when viewing at the
Level 1 alert and will also have a priority level of one when shown on the roadway.
Vehicles first discovered after the discovery range threshold will be highlighted when
viewing at the Level 2 alert and will also have a priority level of two when shown on
the roadway.
Simple channels (annotated with an S) show only the channel output in the right-side bar,
and priority channels (annotated with a P) go one layer deeper to the alert level. Because a
priority channel only has one zone for each alert, only the alert level is shown. e normal
channel (annotated with an N) and latched channel (L) go further down to the zone level
(see Figure 8.6).
Figure 8.6 – Individual Channel View (Normal Channel)
A zone output is activated when its detection qualication lters are satised; an alert output is activated when the associated zone outputs fulll the alert’s logic lter; and a channel
output is activated when the associated alert outputs (and related delay and extend settings)
fulll the channel’s requirements.
Note
Only channel outputs are reported to contact closure devices. While they are reported
to SSMA, zone and alert outputs are not directly associated with any contact closure
outputs.
e channel name is displayed above the channel LED. Latched channels display an L next
Page 97

96 CHAPTER 8 VERIFY CHANNELS-ALERTS-ZONES
to the channel LED (see Figure 8.7). A channel’s delay, extend and max timer settings are
shown next to the D:, E: and M: labels under the channel LED. An alert identier is displayed above each alert LED; the alert logic indicator (OR/AND) is located beneath each
alert LED. Only one alert can be expanded at a time.
Figure 8.7 – Individual Channel View (Latched Channel)
A zone label (Z1, Z2, Z3, Z4) is displayed to the right of each zone LED. If an alert has an
inverted zone, a logical NOT marker (solid black line) is displayed above the associated
zone label.
Tip
Click and hold on the alert LED to view the Alert Summary screen. The top of the Alert
Summary screen shows the channel that the alert belongs to. The rest of the screen
shows the logic applied to the alert, which zones are enabled and which zones are
inverted (if any).
Click and hold on the Zone LED to view the Zone Summary screen. The top of the
Zone Summary screen shows the channel and alert that the zone belongs to; the rest
of the screen shows the zone’s Range, Speed, ETA and Qualified Count settings for
the selected zone.
Channel LED
e channel LED is colored red whenever a channel’s output requirements are met (see the
Display Mode section). When a channel is selected, trackers are highlighted in light blue
if they meet any of the selected channel’s zone lters (see Figure 8.8). is form of tracker
highlighting helps you know which detections are aecting the channel’s output.
Page 98

CHAPTER 8 VERIFY CHANNELS-ALERTS-ZONES 97
Figure 8.8 – Channel LED
Alert LED
e alert LED is colored red when an alert’s output requirements are met (see Figure 8.9). If
an alert is selected, the corresponding zones will appear on the roadway, each with a unique
color.
Figure 8.9 – Alert LED
Zone LED
Each of the four available zones show a dierent color. is color mapping between zone
rectangles, trackers and zone LEDs shows how trackers aect zone outputs (see Table 8.2).
Zone Color
1 Green
2 Blue
3 Yellow
4 Red
Table 8.2 – Zone Colors
Page 99

98 CHAPTER 8 VERIFY CHANNELS-ALERTS-ZONES
When an alert is selected, the alert’s enabled zones are displayed on the roadway. e other
enabled zones in the corresponding alert are shown as gray rectangles (see Figure 8.10).
When a zone’s detection qualication requirements are met (or NOT met, if the zone output is being inverted), the corresponding zone LED is colored its corresponding zone color.
Figure 8.10 – Zone Highlighting
Note
Tracker highlight behavior is determined by the selected roadway display mode.
Roadway Display
e roadway display is used to show trackers and their relationship with detection zones
(see Figure 8.11).
Figure 8.11 – Roadway Display
e area between the sensor icon and the top part of the roadway display represents the
Page 100

CHAPTER 8 VERIFY CHANNELS-ALERTS-ZONES 99
sensor’s maximum detection range. e sensor icon is always displayed at the bottom of the
roadway and points towards the top of the screen. Sensor detections (trackers) are displayed
on the roadway in relation to their distance from the stop bar.
e CAZ selection display is located on the top of the roadway and contains the currently
selected channel, alert and zone (see Figure 8.12).
CAZ
selection
display
Figure 8.12 – Name and Range Labels
Note
Clicking on the CAZ selection display opens the CAZ Setup screen, with the tab for
the current channel selected.
e stop bar icon represents placement of the sensor relative to the approach’s stop bar. A
stop bar label showing the relative location of the stop bar will be displayed whenever the
stop bar is not on the screen.
Click on an alert or zone in the right sidebar to display the corresponding zone(s) in the
roadway. Clicking inside a zone rectangle will turn on the name and range labels for the
selected zone; click anywhere outside of the zone to turn range labels o.
Various types of detection-related data can be displayed on the tracker on the roadway. e
roadway display button is used to select the type of information displayed on the trackers.
Note
Trackers are always colored gray unless a highlight is being applied.
 Loading...