

Page 1
Command DataView
USER QUICK-REFERENCE GUIDE
Install and open DataView
1
1 Install the DataView soware then access the login page by opening a Web browser and navigating to
“http://<hostname or IP Address of DataView>/DataView/.”
2 Once on the login page, enter your username and password (default “administrator” and “password”)
then click Login.
Add/Import stations
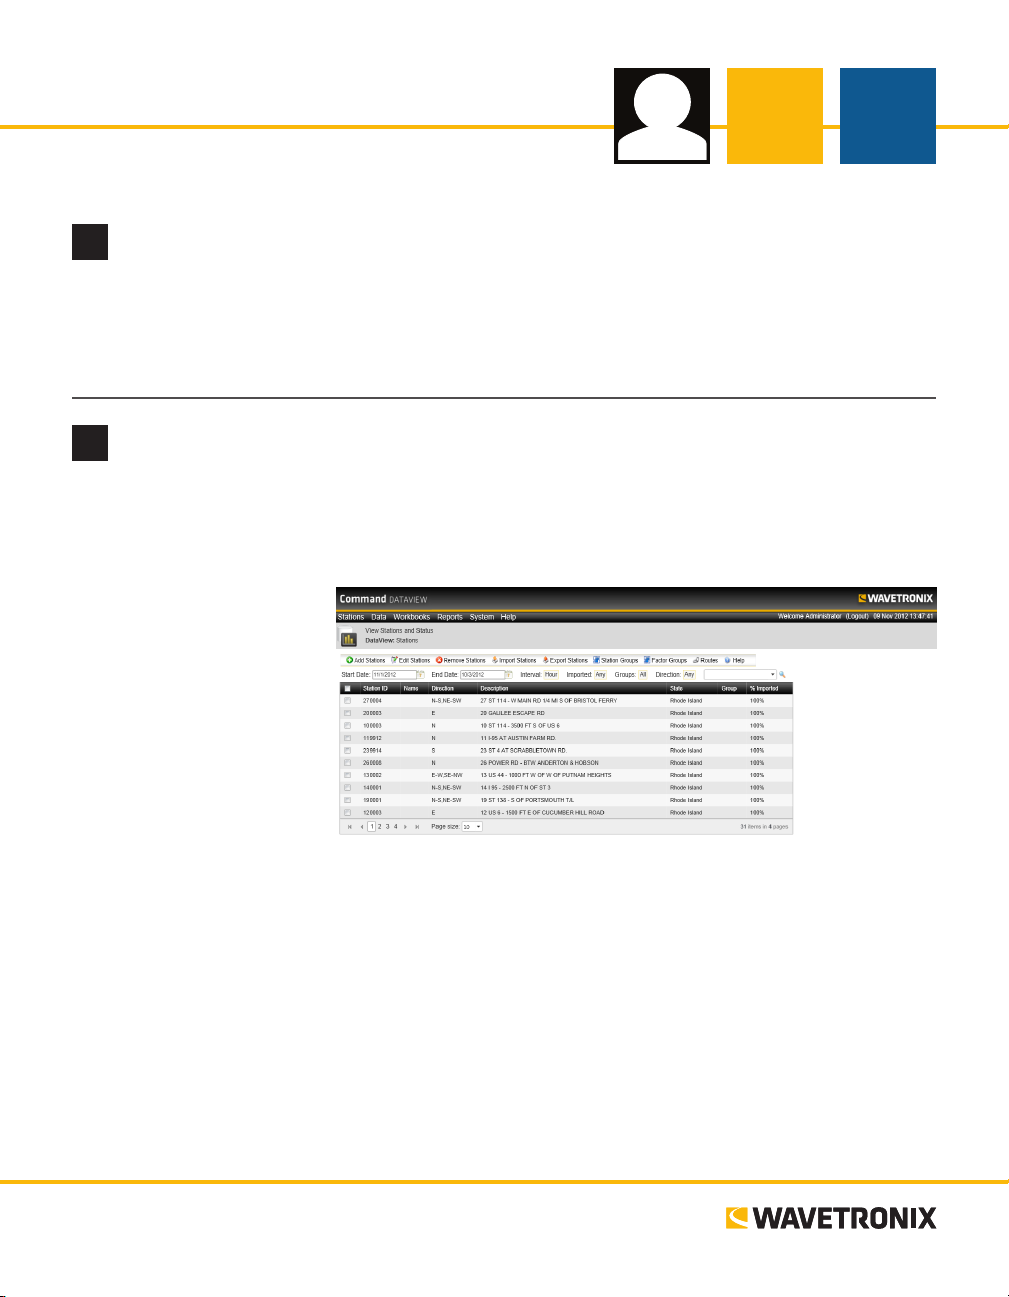
2
Aer logging in, the Stations page will open displaying a list of all current stations. Follow the steps below to
add stations to DataView:
1 Click on Add Station in the toolbar. e Add/Edit Stations page will open.
2 Enter the Station ID
and any other station
information (most elds
are optional). e value
control will be either a
text box or a drop-down
list. Click on the property
title for more information
on that property and its
acceptable values.
3 Click Save to save the sta-
tion information, adding
the station to the list on
the Stations page.
DataView allows you to import a station through existing station les. Supported les include TMG, CSV
and the standard DataView le format. To import a new station, follow the steps below:
1 Click Import Stations in the toolbar of the Stations page. You will be on the Upload File tab.
2 Click Select and choose a le from the local machine.
3 Click Upload when the le has been selected. If the uploaded le is supported, it will appear in the list
below.
4 Use the Stations tab to import stations from uploaded les. Select the desired station(s) from the list on
this tab and click Import Selected.
www.wavetronix.com
www.wavetronix.com
801.734.7200
801.734.7200
Page 2

Import data
3
Next, you need to import data
les from the local machine
or from a Command Collector into the stations. Supported le types are TMG, CSV
and DataView. To import
data les, click on Data in the
menu bar and follow the steps
below:
1 Open the File tab and select a le on the local machine using the Select button.
2 Click Upload. e uploaded le will be displayed in the list below.
3 Select one or more les to be imported from the list using the checkboxes on the le.
4 Click Import Data. DataView will attempt to assign the data in the datale to an existing station using
the station ID listed within the le. In cases where no appropriate station can be found, that data record
will not be imported.
To import data from a Collector, click on Data in the menu bar and follow the steps below:
1 To register Collector, select Collector Settings from the toolbar, then enter the hostname/IP address of
a Collector service in the text box and click Add.
2 Open the Collector tab then select one or more stations from the list using the checkboxes on the le.
3 Select a time range to import using the two Date Range controls for a start and end time.
4 Choose an aggregation level—either 5-, 15- or 60-minute bins.
5 Click Import Selected to import data for the selected stations only, or click Import All to import data
for all stations.
Create a workbook
4
A workbook is a subset of data from one or more stations over a given time period that can be viewed and
modied. To create a workbook, open the Workbooks page by clicking on Workbooks in the menu bar,
then open the Create Workbook tab. Enter all of the information about the workbook—Workbook Name,
Description, Start Date, End Date, Aggregation and Stations to Include—then click Create Workbook.
Page 3

Run data filters
5
Data lters allow you to scan
the imported data associated
with the workbook and ag
data that meets given lter
criteria.
1 On the Workbooks page,
open the Workbooks tab.
2 Click Open next to the
desired workbook, then
click Run Filters.
3 Select a start and end date
and determine the lter
mode (automatically edit
data or ag data).
4 In the Select Stations box, put a check next to the stations for which the lter is to be run.
5 In the Select & Congure Filters box, put a check next to the lters you would like to run. Click on the
next to a lter to expand the user-congurable properties associated with it.
6 Click Run Selected Filters.
A pop-up window will automatically update when the lters are complete and display the total number of
data records that were agged.
Edit data
6
To edit data for a station, follow the steps below:
1 On the Workbooks page, open the Workbooks
tab.
2 Click Open next to the desired workbook,
then click Edit. e edit data page will display
list with the time, volume, speed, and occupancy of trac for the station currently
being edited one day at a time. e day can be
selected through the calendar control or the
Previous Day and Next Day links.
3 Change the values in the text boxes as desired
to set the thresholds for volume, speed and
occupancy. Data that has been agged will display a ag icon, and data that has been edited
will display and edit icon.
4 Click Compare With Station/Historical Data to compare the current data with data from another day or
another station. e comparable data can overwrite the current value by clicking on the appropriate link.
Page 4

Publish data
7
To publish data from a workbook to a published
data source, follow the steps below:
1 Click on Workbooks in the menu bar, open
the Workbooks tab and click on the Publish
link next to the desired workbook.
2 Once on the Publish page, select a published-
data repository from the drop-down list.
3 Choose whether to publish all data or a subset of data (specied by date or station) by clicking on the
corresponding button.
4 Click Publish when the settings are complete.
View published data by clicking on System in the menu bar then opening the Published Data tab.
Run a report
8
DataView allows you to create data reports based on data from either a workbook or a published data
source. To run a report, follow the steps below:
1 Click on Reports in the menu bar and open the Reports tab.
2 Once on the Reports page, select From Workbook or From Published Data; a drop-down list will ap-
pear listing all the available workbooks or published data repositories. Choose a source.
3 Select which stations to include—either All or Manual Select.
4 Using the Time Range controls, set the range for which data from the workbook or published data
source will be processed.
5 Select a template for the
report and set any userdened properties, then
click Run Report.
6 e report request will
appear in the Reports
table as either Processing or Complete. When
complete, the table will
update and you can click
on the link, opening
the report in a separate
window.
Once the report is loaded, it can be exported by selecting the report type and clicking Export. Reports can
be exported to a number of dierent formats, including PDF, Rich Text and Excel.
© 2014 Wavetronix LLC. All rights reserved. Protected by US Pat. Nos. 6,556,916; 6,693,557; 7,426,450; 7,427,930; 7,573,400; 7,889,097; 7,889,098; 7,924,170; 7,991,542; 8,248,272;
8,665,113; and Cdn. Pat. Nos. 2,461,411; 2,434,756; 2,512,689; and Euro. Pat. Nos. 1435036; 1438702; 1611458. Other US and international patents pending. Wavetronix, Smar tSensor, Click,
Command and all associated logos are trademarks of Wavetronix LLC. All other product or brand names as they appear are trademarks or registered trademarks of their respective holders. Product specifications are subject to change without notice. This material is provided for informational purposes only; Wavetronix assumes no liability related to its use.
WX-500-0202
 Loading...