

Page 1
Command Collector
USER QUICK-REFERENCE GUIDE
Install and open Collector
1
1 Install the Collector soware and then access the login page by opening a Web browser and navigating
to “http://<hostname or IP Address of Collector>/Collector/.”
2 Once on the login page, enter your username and password (default “administrator” and “password”)
then click Login.
Add a sensor
2
e Sensors page appears upon logging
in. First, you need to add sensors to
Collector:
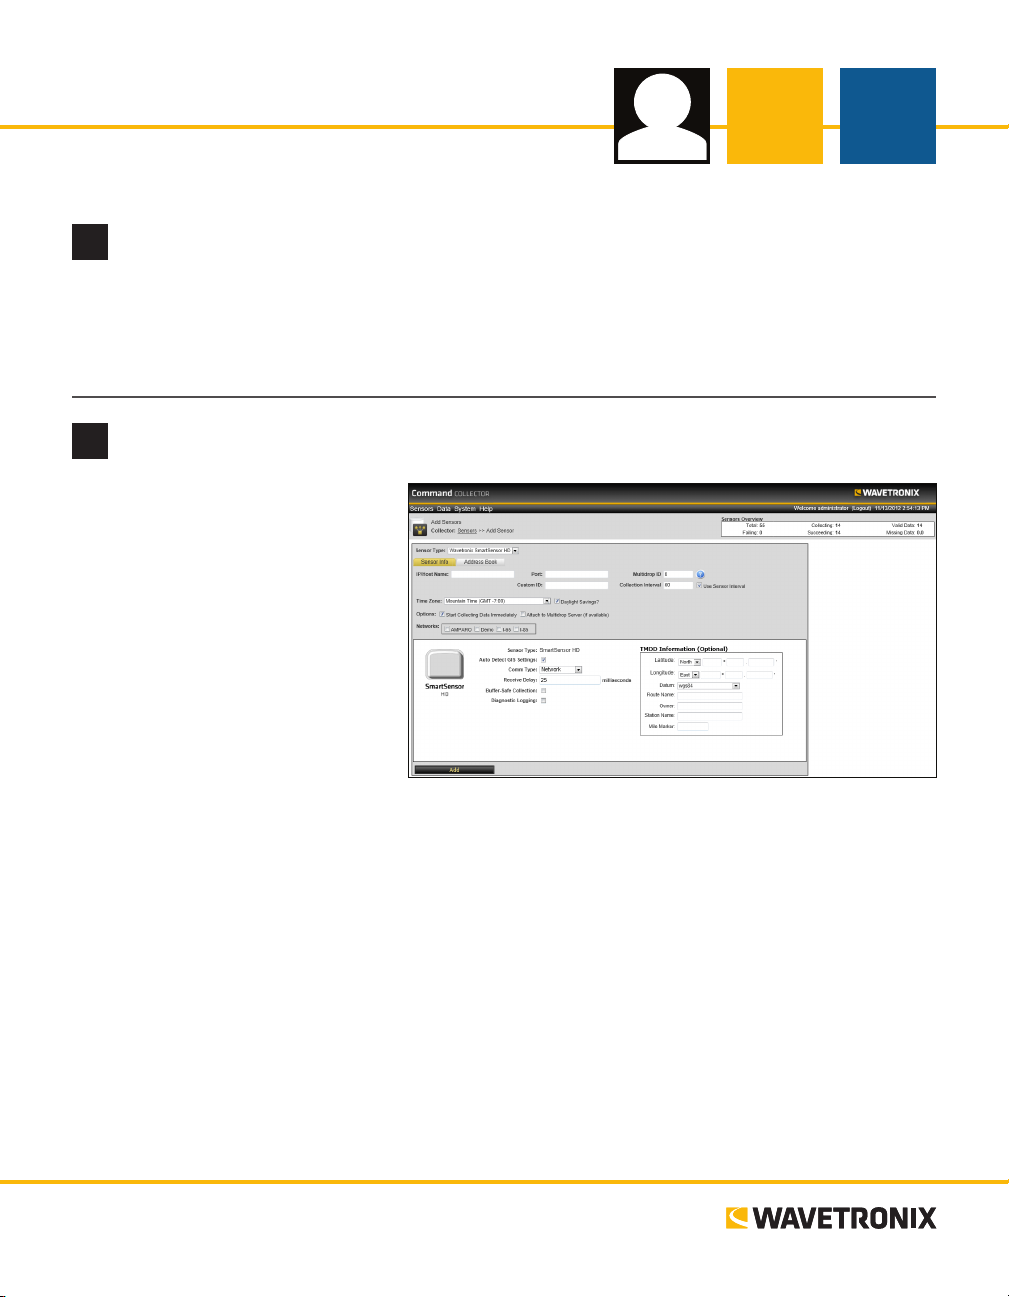
1 Click on Add Sensors on the main
Sensors page, opening the Add
Sensor page.
2 Select the sensor type from the
drop-down list.
3 Enter the following information:
˽ e IP/host name used to connect
to the sensor
˽ e port number used to connect
to the sensor
˽ e multi-drop ID used by this sensor (may be optional, depending on device)
˽ e custom ID used to identify the sensor (optional)
˽ e collection interval that determines how oen Collector connects to the sensor and collects data (in
seconds)
4 Select the appropriate time zone.
5 Put a check next to applicable Options and Networks.
6 In the white box, enter any custom properties for the sensor type.
7 Click the Add button.
e sensor will now be added to the list on the main Sensors page. Open this page by selecting Sensors from
the menu bar. Click on a sensor name for details, including sensor conguration and lane assignments.
www.wavetronix.com
www.wavetronix.com
801.734.7200
801.734.7200
Page 2
Start/Stop collection
3
For data collection, click on Sensors in the menu bar then follow the
steps below:
1 Put a check next to the sensors for which you would like data to be
collected.
2 Select Collection from the Sensors toolbar then click the Start Col-
lection button.
3 Click the Stop Collection button to stop data collection for all selected sensors.
e Status icon will be empty if collection is stopped, green/yellow/red if collection has started.
Note. is step is not necessary if you checked the Start Collecting Data Immediately check box when
adding the sensor. In that case, collection has already started.
Change sensor information
4
If necessary, sensor information can be
changed on the Sensor Cong page. is
page can be accessed by clicking on the name
of the desired sensor. ere are four tabs with
congurable information. Two of these tabs,
Sensor Cong and Lanes/Approaches, are
used to change sensor information:
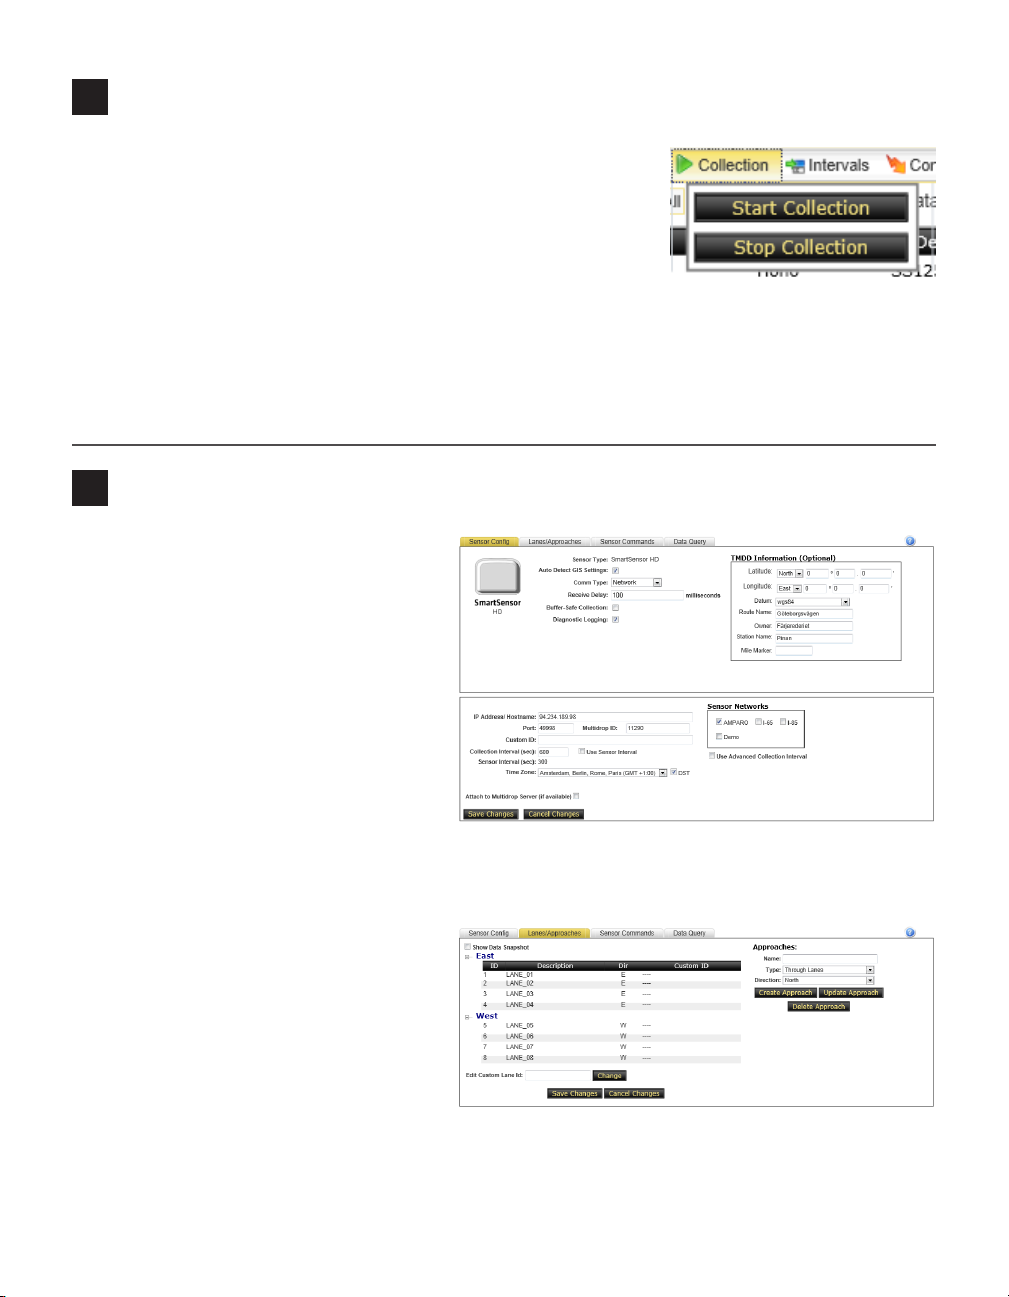
1 Sensor Cong – is tab contains all
basic conguration information. e box
on the top half of the page contains the
custom conguration control. is in-
formation will help identify each sensor,
as Collector can support any number of
dierent data collection devices. e box on the bottom half of the page contains the standard Collec-
tor sensor information as discussed in step 2 on the previous page. Any changes can be save by clicking
Save Changes.
2 Lanes/Approaches – is tab allows
you to view lanes and congure ap-
proaches (abstract groupings of lanes)
for the sensor. In the Approaches box
you can create or update an approach by
providing the name, type, and direction.
Lanes can then be moved from approach
to approach by clicking on a lane and
dragging it to the desired approach. Any
changes can be made by clicking Save Changes.
Page 3

Run sensor commands
5
Sensor commands allow you to send specic commands
directly to the sensor. Commands run on a set interval,
but you also have the option of viewing results without
waiting for an automatic update by selecting Commands
from the Sensors toolbar. ere are three basic commands to run:
˽ Update Configuration – Collector retrieves current
sensor conguration.
˽ Synchronize Sensor Time – Collector will attempt to
synchronize the sensor time with the current server
time.
˽ Collect Data – Collector will collect data from the
sensor.
To run any of these commands, put a check next to the
desired sensors on the main Sensors page then click on
Commands in the Sensors toolbar and click the appropriate button for the command you would like to run.
Commands may also be accessed on the Sensor Cong page (as discussed in step 4 on the previous page)
under the Commands tab. is tab also contains an option for a custom command. Device-specic commands will be listed for each sensor.
Run data query
6
e Data Query tab on the Sensor Cong page provides various options for data querying. Once on the
Sensor Cong page (opened by clicking on a sensor name from the main Sensors page), follow the steps
below:
1 Click on the Data Query tab.
2 Set the Start and End Times, and use the calendars to
select the Start and End Dates.
3 Select how to group the data—by lane, approach or sen-
sor—and what interval to use—the sensor’s interval, 5
minutes, 15 minutes, 1 hour or a custom interval.
4 If desired, remove approach data from the query by
unchecking the approach name in the Approaches box.
5 Select an option from the Show Sensor By drop-down list—sensor information can be displayed in
the query result using IP/Port, Location or Custom ID. en, select whether you would like to use the
timestamp from the beginning or the end of the interval.
6 Select the output format(s) from the available options then click Run Data Query.
7 e results of the query can be opened in a new window by clicking on the links at the bottom of the
page.
Page 4

Run a report
7
Command Collector allows you to create a report containing data from one or more sensor. To run a report,
follow the steps below:
1 Click on Data in the menu bar and open the Reports tab.
2 In the Select Sensors box, check the sensor(s) you would like
included in the report.
3 If desired, select a template from the Re po rt Tem pl ate drop-
down list.
4 From the Output drop-down list, select the desired output
report type.
5 Set the Start and End Times, and use the calendars to select the
Start and End Dates.
6 From the Interval and Form drop-down lists, select what interval to use—the sensor’s interval, 5 min-
utes, 15 minutes, 1 hour or a custom interval—and how to group the data—by lane, approach or sensor.
Select whether you would like to use the timestamp from the beginning or the end of the interval.
7 If you would like the results of the report to be sent in an email, enter a valid email address.
8 Click Create Report. e Requested Reports table will contain a link to the new report.
9 Report settings can be saved as a template by using the Template Options menu. ese report tem-
plates can be automated using the Export tab (see below).
To run an automatic report, follow the steps below:
1 Click on Data in the menu bar and open the Export tab.
2 In the Automated TMDD Export box, select the type
of automated report: TMDD Conguration Export,
TMDD Data Export, or Automated Custom Export.
3 In the Automated Custom Export Box, select a report
template (created on the Reports tab).
4 Assign a schedule using either the Basic or Advanced
tab in the Schedule box, then click Add.
5 Select Sequential or Overwrite as the le operation.
6 If you would like the report results to be sent in an email, enter a valid email address.
7 Click Create Export Schedule. Once a schedule is created, it will appear in the Current Automated
Export box.
© 2014 Wavetronix LLC. All rights reserved. Protected by US Pat. Nos. 6,556,916; 6,693,557; 7,426,450; 7,427,930; 7,573,400; 7,889,097; 7,889,098; 7,924,170; 7,991,542; 8,248,272;
8,665,113; and Cdn. Pat. Nos. 2,461,411; 2,434,756; 2,512,689; and Euro. Pat. Nos. 1435036; 1438702; 1611458. Other US and international patents pending. Wavetronix, Smar tSensor, Click,
Command and all associated logos are trademarks of Wavetronix LLC. All other product or brand names as they appear are trademarks or registered trademarks of their respective holders. Product specifications are subject to change without notice. This material is provided for informational purposes only; Wavetronix assumes no liability related to its use.
WX-500-0199
 Loading...