

Page 1

SmartSensor HD
USER GUIDE
Page 2

SmartSensor HD
USER GUIDE
www.wavetronix.com 78 East 1700 South Provo, Utah 84606 801.734.7200
Page 3

© 2014 Wavetronix LLC. All Rights Reserved.
Wavetronix, SmartSensor, Click, Command, and all associated product names and logos are trademarks of Wavetronix LLC. All other
products or brand names as they appear are trademarks or registered trademarks of their respective holders.
Protected by US Patent Nos. 6,556,916; 6,693,557; 7,426,450; 7,427,930; 7,573,400; 7,889,097; 7,889,098; 7,924,170; 7,991,542;
8,248,272; 8,665,113; Canadian Patent Nos. 2461411; 2434756; 2512689; and European Patent Nos. 1435036; 1438702; 1611458. Other
US and international patents pending.
e Company shall not be liable for any errors contained herein or for any damages arising out of or related to this document or the
information contained therein, even if the Company has been advised of the possibility of such damages.
is document is intended for informational and instructional purposes only. e Company reserves the right to make changes in the
specications and other information contained in this document without prior notication.
FCC Part 15 Compliance: e Wavetronix SmartSensor sensors comply with Part 15 of the Federal Communications Commission (FCC)
rules which state that operation is subject to the following two conditions: (1) this device may not cause harmful interference, and (2) this
device must accept any interference received, including interference that may cause undesirable operation. FCC compliance statements
for applicable optional modules are to be found in the module specications. Unauthorized changes or modications not expressly approved by the party responsible for compliance with the FCC rules could void the user’s authority to operate this equipment.
Hereby, Wavetronix LLC, declares that the FMCW Trac Radar (SmartSensor HD, model number 101-0415) is in accordance with
the 2004/108/EC EMC Directive.
e device has been designed and manufactured to the following standards:
• IEC/EN 60950-1:2006, A11:2009, A1:2010, A12:2011 - Electronic equipment safety requirements.
• EN 300 440-2 - Electromagnetic compatibility and Radio spectrum Matters (ERM); Short range devices; Radio equipment to be
used in the 1 GHz to 40 GHz frequency range; Part 2: Harmonized EN under article 3.2 of the R&TTE Directive.
• EN 301 489-3 - Immunity to RF interference. Compliance with transmission limitations under 1GHz and conducted
trans¬mission over power lines, ESD.
e equipment named above has been tested and found to comply with the relevant sections of the above referenced specications.
e unit complies with all essential requirements of the Directives. is equipment has been evaluated at 2000m.
IP Protection: IP66
For installation into restricted access location.
All interconnecting cables shall be suitable for outdoor use.
Disclaimer: e advertised detection accuracy of the Wavetronix SmartSensor sensors is based on both external and internal testing,
as outlined in each product’s specication document. Although our sensors are very accurate by industry standards, like all other sensor manufacturers we cannot guarantee perfection or assure that no errors will ever occur in any particular applications of our technology. erefore, beyond the express Limited Warranty that accompanies each sensor sold by the company, we oer no additional
representations, warranties, guarantees or remedies to our customers. It is recommended that purchasers and integrators evaluate the
accuracy of each sensor to determine the acceptable margin of error for each application within their particular system(s).
WX-500-0051
5/2014
Page 4

Contents
Introduction 5
SmartSensor HD Package 5 • Selecting a Mounting Location 6
Part I Installing the SmartSensor HD
Chapter 1 Installing the SmartSensor HD 11
Selecting the Mounting Height 12 • Attaching the Mount
Bracket to the Pole 14 • Attaching the Sensor to the Mount
Bracket 14 • Aligning the Sensor to the Roadway 15 • Applying
Silicon Dielectric Compound 16 • Connecting the Cable 17
Chapter 2 Connecting Power and Surge 19
Connecting Lightning Surge Protection 20 • Wiring to Earth
Ground 23 • Installing the Power Plant 24 • Connecting the
Power Plant to Your Installation 28 • Wiring Communication 29
Part II Using SmartSensor Manager HD
Chapter 3 Installing SmartSensor Manager HD 33
Installing SSMHD 33
Chapter 4 Communication 37
Serial Connection 38 • Internet Connection 39 • Virtual Connection 40 • Viewing Connection Information 41 • Installation
Type 43 • Communication Screen Icons 43 • Uploading the
Sensor’s Embedded Soware 45
Page 5

Chapter 5 Settings 47
General Tab 47 • Ports Tab 48 • Outputs Tab 49
Chapter 6 Lanes 53
Conguration 54 • Verication 62
Chapter 7 Data 65
Denitions 66 • Storage 70 • Download 72 • Push 74
Chapter 8 Tools 77
Backup–Restore 78 • License 79 • Power 80
Appendix 81
Appendix A - 10-pin Connector 81 • Appendix B - 26-pin
Connector 82 • Appendix C - Cable Lengths 83 • Appendix
D - Direct Serial Connections 85 • Appendix E - Signaling
Delays 86
Page 6

Introduction
In this chapter
SmartSensor HD Package
Selecting a Mounting Location
1
e Wavetronix SmartSensor HD trac sensor utilizes the latest technology to collect and
deliver trac statistics. e SmartSensor HD collects information through the use of a
24.125 GHz (K band) operating radio frequency and is capable of measuring trac volume and classication, average speed, individual vehicle speed, lane occupancy and presence. e SmartSensor HD uses what is classied as frequency modulated continuous wave
(FMCW) radar; it detects and reports trac conditions simultaneously over as many as 22
lanes of trac.
Once SmartSensor HD is installed, the conguration process is quick and easy. Aer installation, this unit will require little or no on-site maintenance and can be remotely recongured for optimal performance. is user guide outlines the step-by-step process of
installing and conguring the SmartSensor HD. Any questions about the information in
this guide should be directed to Wavetronix or your distributor.
SmartSensor HD Package
A standard SmartSensor HD package contains the following items:
SmartSensor HD SS125 detector with installed backplate
SmartSensor HD quick-reference guides
Page 7

6 INTRODUCTION SMARTSENSOR HD USER GUIDE
e following items are not included but are necessary for installation:
Sensor mount
Sensor cable
Additional products may be purchased through your distributor. e following optional
items are not included unless specically ordered (check packing list for actual inventory):
Contact closure adapter such as the Click 100, 104, 110, or 112/114.
Click 200 surge protector
Click 201/202 AC to DC converter
Click 210 circuit breaker
Click 230 AC surge protector
SmartSensor HD User Guide (doesn’t have to be purchased, but does have to be re-
quested from Wavetronix)
Selecting a Mounting Location
Consider the following guidelines when selecting a mounting location:
Lane Coverage – Sensor mounting locations should be selected so that all monitored
lanes are within 6 to 250 . (1.8 to 76.2 m) of the sensor and run parallel with each
other. Multiple sensors should be considered if more than 10 lanes need to be simultaneously monitored. If lanes do not need to be simultaneously monitored, up to 22 lanes
can be congured for collection by a single sensor.
Parallel Lanes – When the sensor is used to collect both mainline and ramp data, the
pole position should be selected so that the on and o ramp lanes run parallel with
the mainline. If lanes are not parallel, installation of multiple SmartSensor HD units
should be considered.
Sensors on the Same Pole – When multiple sensors are mounted on the same pole,
they will not be subject to interference if they are congured to operate using dierent
RF channels and are separated vertically by a few feet. e higher sensor would typically be used for the lanes farther from the pole in order to minimize occlusion.
Sensors on Opposing Poles – SmartSensor HD units facing each other on opposing
poles should operate on dierent RF channels and be separated by a 70-. (21.3-m)
lateral oset, if possible.
Line of Sight – e SmartSensor HD is designed to work accurately in the presence of
barriers, but in general if there is an alternate mounting location that would avoid any
type of structural occlusion, this is preferred. Avoid occlusion by trees, signs, and other
roadside structures.
Neighboring Structures and Parallel Walls – To eliminate the risk of performance
degradation, the sensor locations should have a 30-. (9.1-m) lateral separation from
overhead signs, overpasses, tunnels, parallel walls, and parallel parked vehicles in order
to avoid multiple reection paths from a single vehicle. is separation removes the
objects from the antenna pattern of the sensor. In practice the sensor has been mounted
much closer to reecting objects with minimal impact in sensor performance. For ex-
Page 8
INTRODUCTION SMARTSENSOR HD USER GUIDE 7
ample, sensors mounted on gantries have successfully met customer requirements when
using a 3-foot extension arm to laterally separate the sensor from the structure. Please
talk with a Wavetronix Technical Support representative about your specic situation.
Mounting Height – e mounting height should be based upon the oset from the
lanes of interest. For each oset, the minimum, maximum, and best heights are shown
in Table 1.1, found in Chapter 1. In general, the range of recommended heights is between 9 and 50 . (2.7 to 15.2 m).
Mounting Oset – e minimum recommended oset (distance from the sensor to
the edge of the rst lane of interest) is 6 . (1.8 m).
Arterial Locations – Sensor sites on arterials or other roadway segments with regulat-
ed stop lines should be selected at midblock positions to increase accuracy by avoiding
positions at which vehicles are oen stopped in front of the sensor.
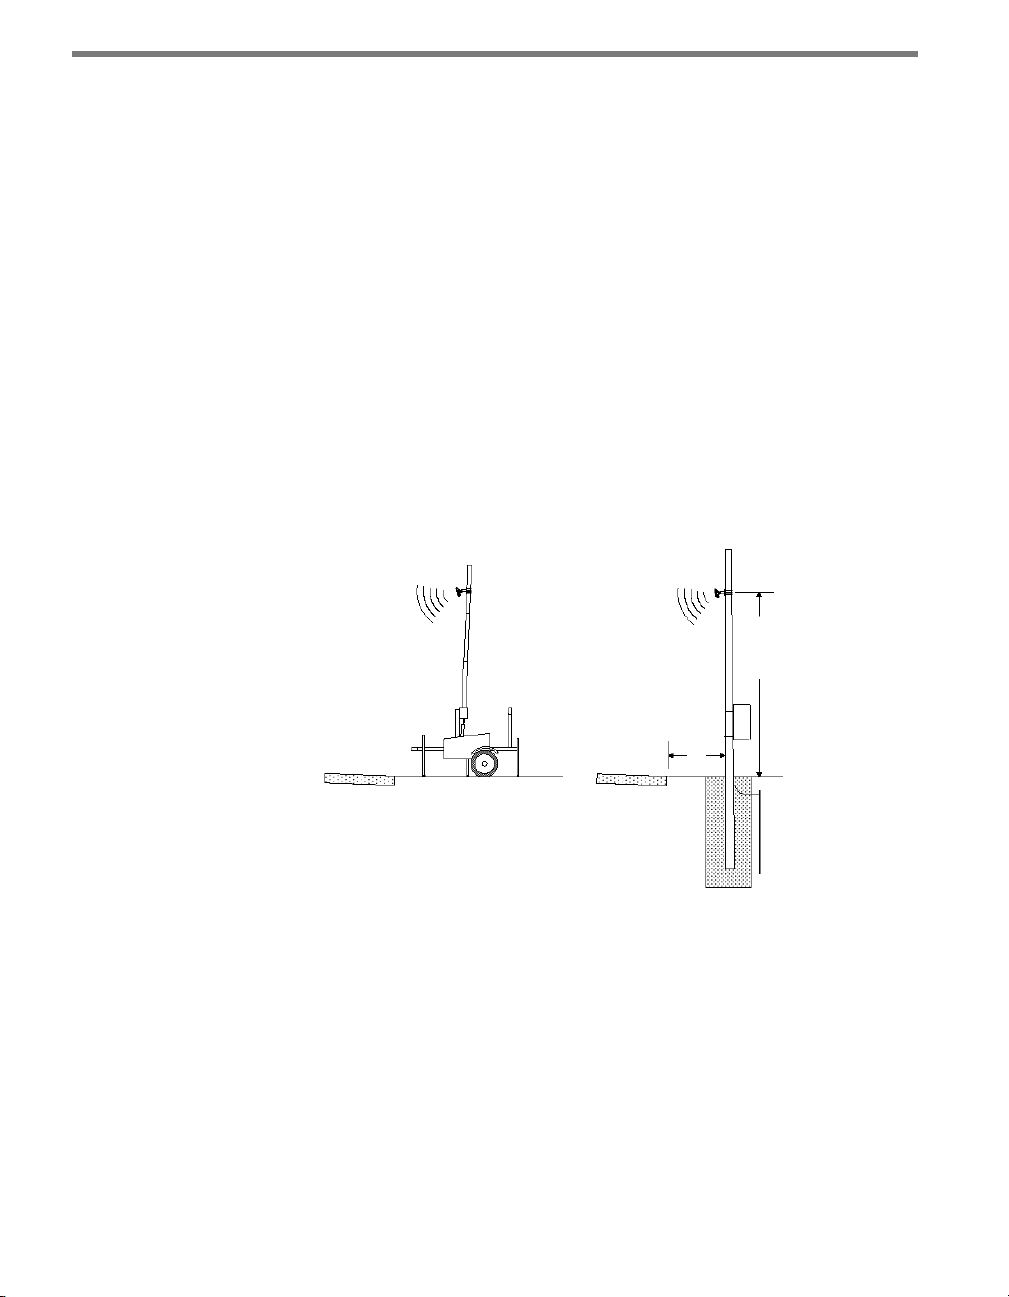
Freeway Locations – e SmartSensor HD is oen used at permanent ATR (auto-
matic trac recorder) stations. e number of stations along a single roadway and the
distance between stations should be selected to achieve adequate levels of statistical
condence. Permanent ATR stations, which are selected to cover interstate, principal
arterial, and other national and state highways, are used to establish seasonal adjustment factors for count data from temporary collection sites (see Figure I.1).
9–50 ft.
(see
mounting
guidelines)
Roadway Roadway
Figure I.1 – Portable (left) and Permanent (right) Sensor Stations
6 ft.
min
Cable Lengths – Ensure that you have sucient homerun and sensor cabling. Cables
can be as long as 600 . (182.9 m) if they’re using 24 VDC operation and RS-485 communications; for longer connections, alternate wired and wireless options should be
considered.
Signaling Delay – Aer a vehicle passes in front of the sensor there will be a slight
delay before the data for that vehicle is sent from the sensor. In a time-sensitive application—for instance, to supply a dynamic message sign with per vehicle warning
messages—it will be necessary to ensure the sensor is suciently far upstream from
the sign that the system has time to collect the data, process it, and send it to the sign
by the time the vehicles reach the problem area. For specics about signaling delay,
see Appendix E.
Page 9

Page 10

Part I
Installing the SmartSensor HD
Chapter 1 – Installing the SmartSensor HD
Chapter 2 – Connecting Power and Surge
Page 11

Page 12

Installing the SmartSensor HD 1
In this chapter
Selecting the Mounting Height
Attaching the Mount Bracket to the Pole
Attaching the Sensor to the Mount Bracket
Aligning the Sensor to the Roadway
Applying Silicon Dielectric Compound
Connecting the Cable
1
Installing the SmartSensor HD is quick and easy. Once installed, the SmartSensor HD congures automatically and requires little or no on-site maintenance.
e installation process includes attaching the mounting bracket to the pole; attaching the
sensor to the mounting bracket; aligning the sensor; applying a silicon dielectric compound
to the sensor connector; and connecting the cable to the sensor.
Warning
Do not attempt to service or repair this unit. This unit does not contain any components and/or parts serviceable in the field. Any attempt to open this unit, except as
expressly written and directed by Wavetronix, will void the customer warranty. Any
visible damage to exterior seal labels will void the warranty. Wavetronix is not liable
for any bodily harm or damage caused if unqualified persons attempt to service or
open the back cover of this unit. Refer all service questions to Wavetronix or an authorized distributor.
Page 13
12 CHAPTER 1 INSTALLING THE SMARTSENSOR HD
Caution
Use caution when installing any sensor on or around active roadways. Serious injury
can result when installation is performed using methods that are not in accordance
with authorized local safety policy and procedures. Always maintain an appropriate
awareness of the trac conditions and safety procedures as they relate to specific
locations and installations.
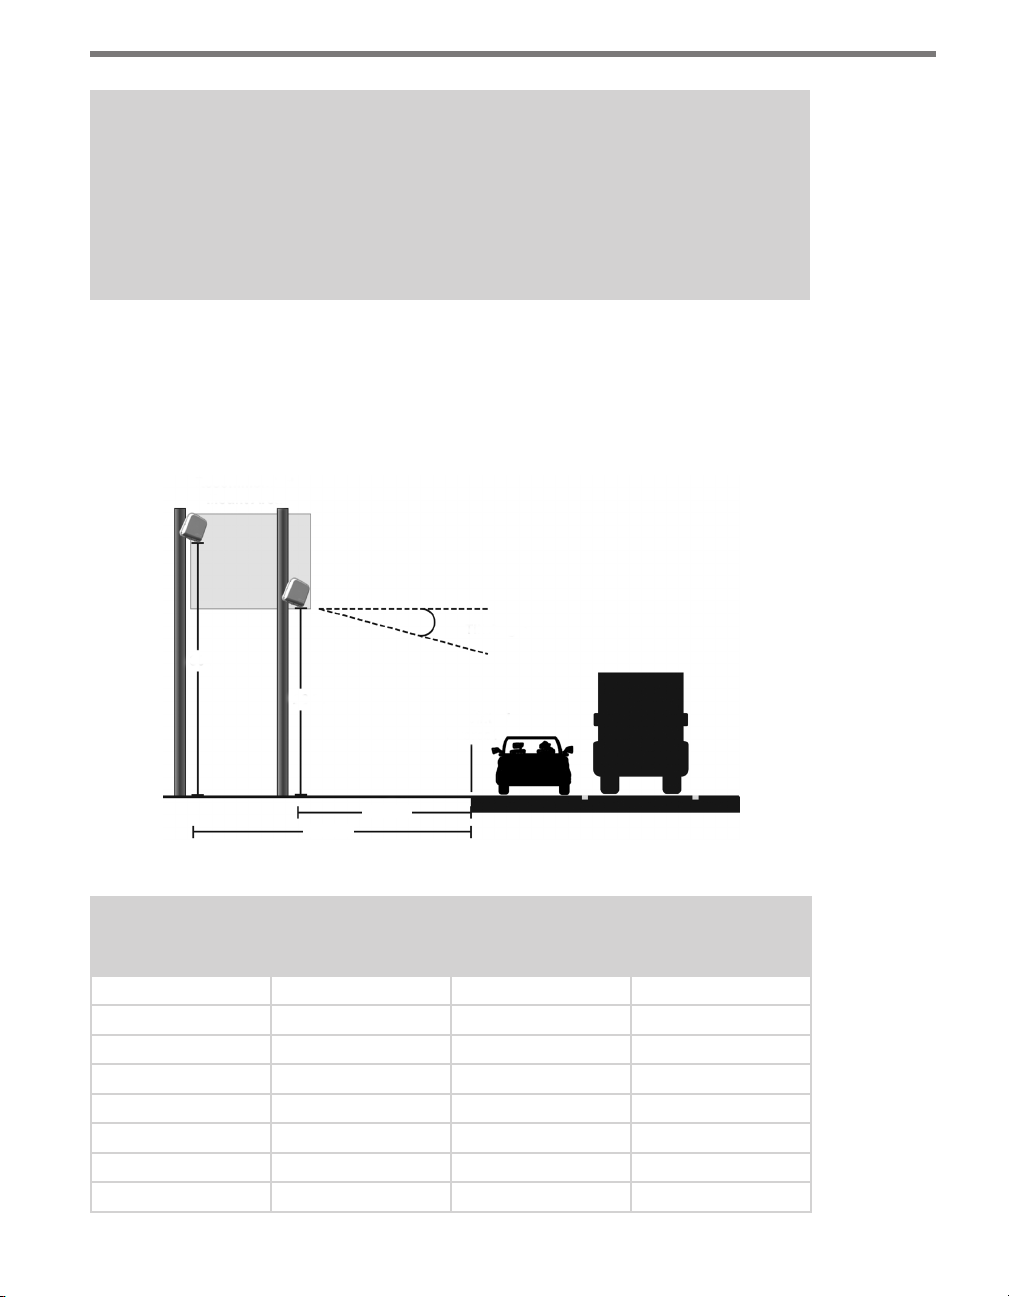
Selecting the Mounting Height
Aer selecting a mounting location within the recommended range of osets (see the introduction and Figure 1.1), use Table 1.1 to select a mounting height.
Recommended
Mount Area
Tilt Angle
30 ft.
26 ft.
25 ft.
35 ft.
Figure 1.1 – Recommended Mounting Height
Oset from first
Detection Lane (ft
/ m)
6 / 1.8 12 / 3.7 9 / 2.7 19 / 5.8*
7 / 2.1 12 / 3.7 9 / 2.7 19 / 5.8*
8 / 2.4 12 / 3.7 9 / 2.7 20 / 6.1*
9 / 2.7 12 / 3.7 9 / 2.7 21 / 6.4
10 / 3 12 / 3.7 9 / 2.7 22 / 6.7
11 / 3.4 12 / 3.7 9 / 2.7 23 / 7
12 / 3.7 13 / 4 10 / 3 24 / 7. 3
13 / 4 13 / 4 11 / 3.4 25 / 7. 6
Recommended
Mounting Height
(ft / m)
1st Point of
Interest
Minimum Mounting Height (ft / m)
Maximum Mounting Height (ft / m)
Page 14

CHAPTER 1 INSTALLING THE SMARTSENSOR HD 13
14 / 4.3 14 / 4.3 11 / 3.4 26 / 7.9
15 / 4.6 15 / 4.6 12 / 3.7 26 / 7.9
16 / 4.9 15 / 4.6 12 / 3.7 27 / 8.2
17 / 5.2 16 / 4.9 13 / 4 28 / 8.5
18 / 5.5 17 / 5.2 14 / 4.3 29 / 8.8
19 / 5.8 17 / 5.2 14 / 4.3 30 / 9.1
20 / 6.1 18 / 5.5 15 / 4.6 30 / 9.1
21 / 6.4 19 / 5.8 15 / 4.6 31 / 9.4
22 / 6.7 20 / 6.1 16 / 4.9 31 / 9.4
23 / 7 22 / 6.7 16 / 4.9 32 / 9.8
24 / 7. 3 24 / 7.3 16 / 4.9 33 / 1 0.1
25 / 7.6 26 / 7. 9 17 / 5.2 33 / 10.1
26 / 7.9 26 / 7. 9 17 / 5.2 34 / 1 0.4
27 / 8.2 27 / 8.2 18 / 5.5 35 / 10.7
28 / 8.5 27 / 8.2 18 / 5.5 35 / 10.7
29 / 8.8 27 / 8.2 18 / 5.5 36 / 11
30 / 9.1 29 / 8.8 19 / 5.8 37 / 11.3
31 / 9.4 29 / 8.8 19 / 5.8 37 / 11.3
32 / 9.8 29 / 8.8 19 / 5.8 38 / 11.6
Recommended Oset
33 / 10.1 30 / 9.1 19 / 5.8 39 / 11.9
34 / 10.4 30 / 9.1 19 / 5.8 39 / 11.9
35 / 10.7 30 / 9.1 20 / 6.1 40 / 12.2
36 / 11 30 / 9.1 20 / 6.1 41 / 12.5
37 / 11.3 31 / 9.4 20 / 6.1 41 / 12.5
38 / 11.6 31 / 9.4 21 / 6.4 42 / 12.8
39 / 11.9 33 / 10.1 21 / 6.4 43 / 13.1
40 / 12.2 33 / 10.1 22 / 6.7 43 / 13.1
41 / 12.5 34 / 10.4 22 / 6.7 44 / 13.4
42 / 12.8 34 / 10.4 22 / 6.7 44 / 1 3.4
43 / 13.1 35 / 10.7 22 / 6.7 45 / 13.7
44 / 13.4 35 / 10.7 23 / 7 46 / 14
45 / 13.7 36 / 11 23 / 7 46 / 14
46 / 14 36 / 11 23 / 7 47 / 14.3
47 / 14.3 36 / 11 24 / 7. 3 48 / 14.6
48 / 14.6 38 / 11.6 24 / 7. 3 48 / 14.6
49 / 14.9 38 / 11.6 24 / 7.3 49 / 14.9
50–230 / 15.2–70.1 39 / 11.9 25 / 7. 6 Must be < oset
Table 1.1 – Mounting Height Guidelines in Feet / Meters
Page 15
14 CHAPTER 1 INSTALLING THE SMARTSENSOR HD
Attaching the Mount Bracket to the Pole
Before attaching the mount bracket to the pole, rst make sure that your cables are long
enough to reach the sensor and to stretch across the distance from the sensor to the cabinet.
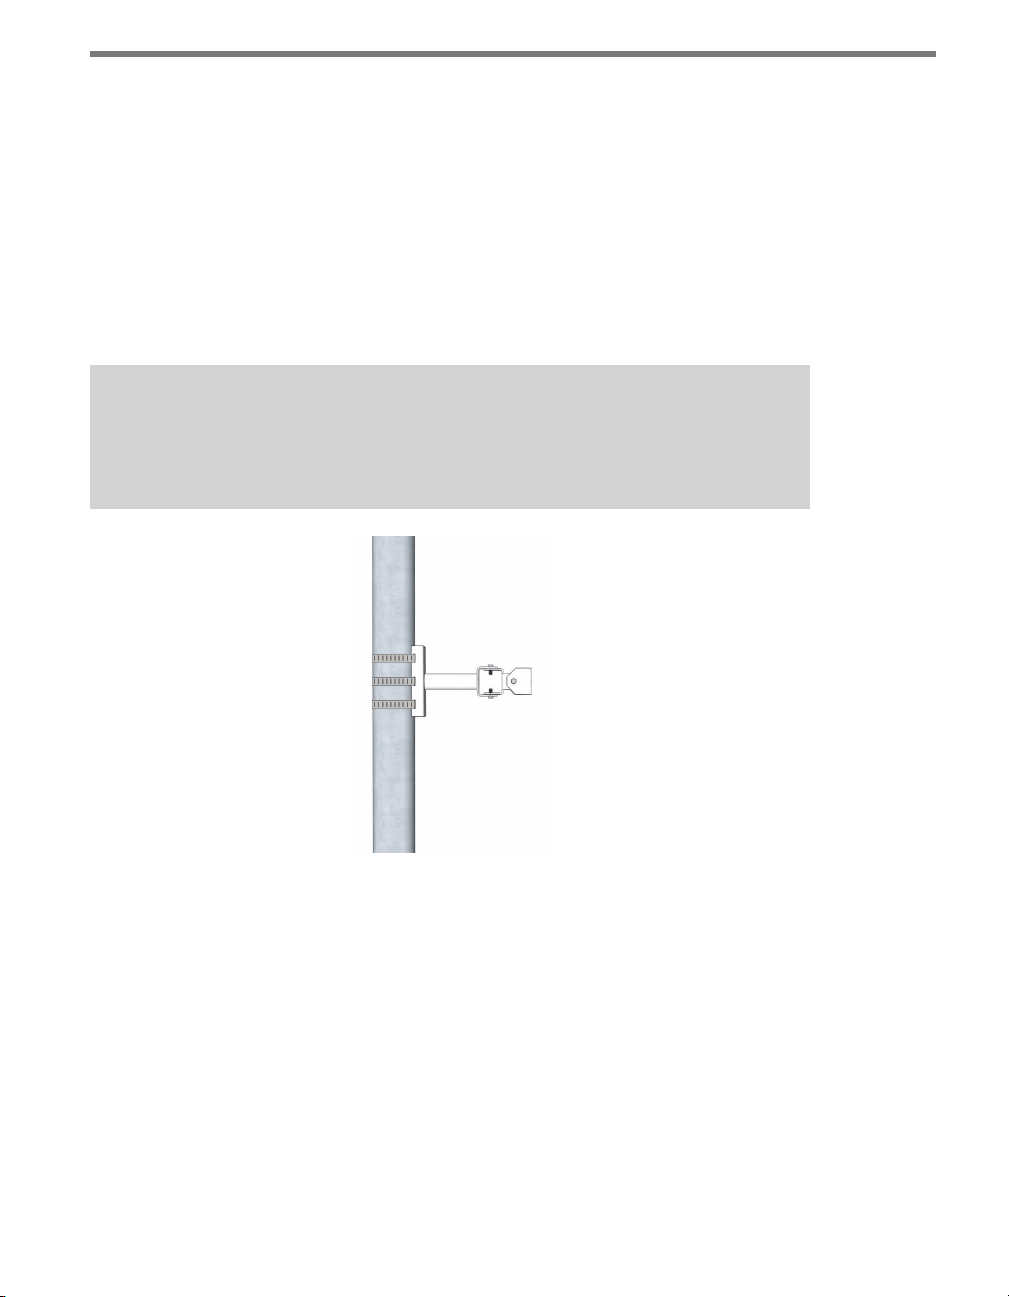
Follow the steps below to correctly attach the mount to the pole (see Figure 1.2):
1 Insert the stainless steel straps through the slots in the mount bracket.
2 Position the mount bracket on the pole so that the head of the mount is pointing to-
wards the middle of the lanes of interest.
3 Tighten the strap screws.
Note
The sensor will need to be adjusted later, to fine-tune the alignment, so be sure to
keep the straps adjustable.
Figure 1.2 – Attaching the Mount Bracket to the Pole
Attaching the Sensor to the Mount Bracket
Use the following steps to securely fasten the sensor to the mount bracket:
1 Align the bolts on the sensor’s backplate with the holes in the mount bracket. e con-
nector at the bottom of the unit should be pointing towards the ground.
2 Place the lock washers onto the bolts aer the bolts are in the mount bracket holes.
3 read on the nuts and tighten (see Figure 1.3).
Page 16
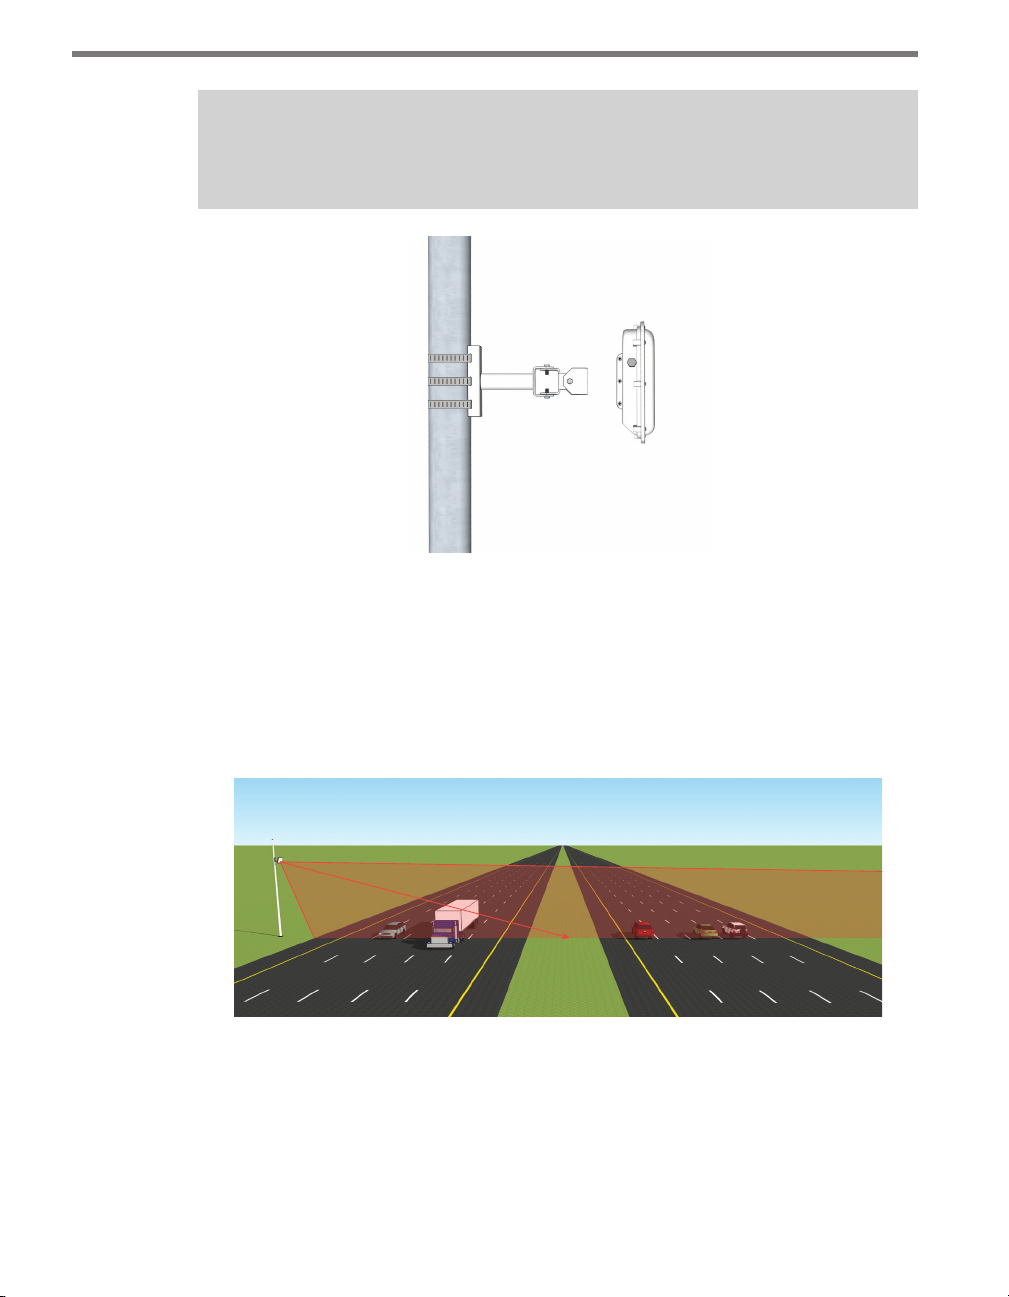
CHAPTER 1 INSTALLING THE SMARTSENSOR HD 15
Note
Do not over-tighten the fasteners.
Figure 1.3 – Attaching the Sensor to the Mount Bracket
Aligning the Sensor to the Roadway
Use the following steps to correctly mount and align the SmartSensor HD:
1 Tilt the sensor down so that the front is aimed at the center of the detection area (see
Figure 1.4).
Figure 1.4 – Up-and-down Positioning
2 Adjust the side-to-side angle so that it is as close to perpendicular to the ow of trac
as possible (see Figure 1.5).
Page 17
16 CHAPTER 1 INSTALLING THE SMARTSENSOR HD
Note
The side-to-side alignment will eventually be fine-tuned for better accuracy using
SmartSensor Manager HD (SSMHD). That step will be addressed in Chapter 6, after
SSMHD has been installed.
Side-to-side alignment should
be perpendicular
Figure 1.5 – Side-to-side Positioning
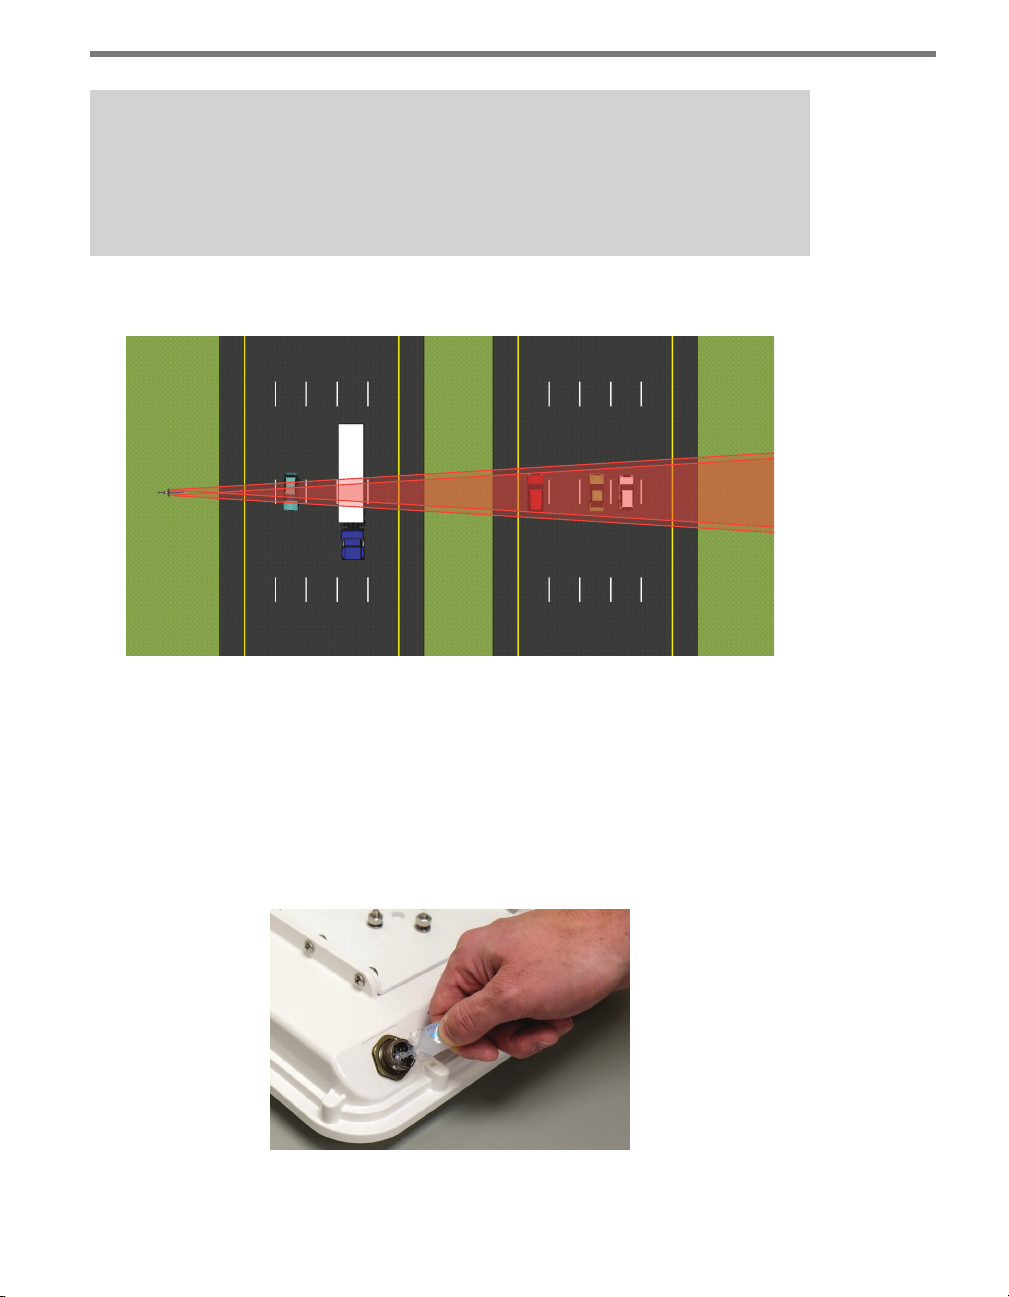
Applying Silicon Dielectric Compound
Use the following steps to correctly apply the silicon dielectric compound:
1 Tear the tab o of the tube of silicon dielectric compound.
2 Squeeze about 25% of the silicon into the connector at the base of the SmartSensor HD
(see Figure 1.6). Be sure to wipe o any excess compound.
Figure 1.6 – Applying Silicon Dielectric Compound
Page 18
CHAPTER 1 INSTALLING THE SMARTSENSOR HD 17
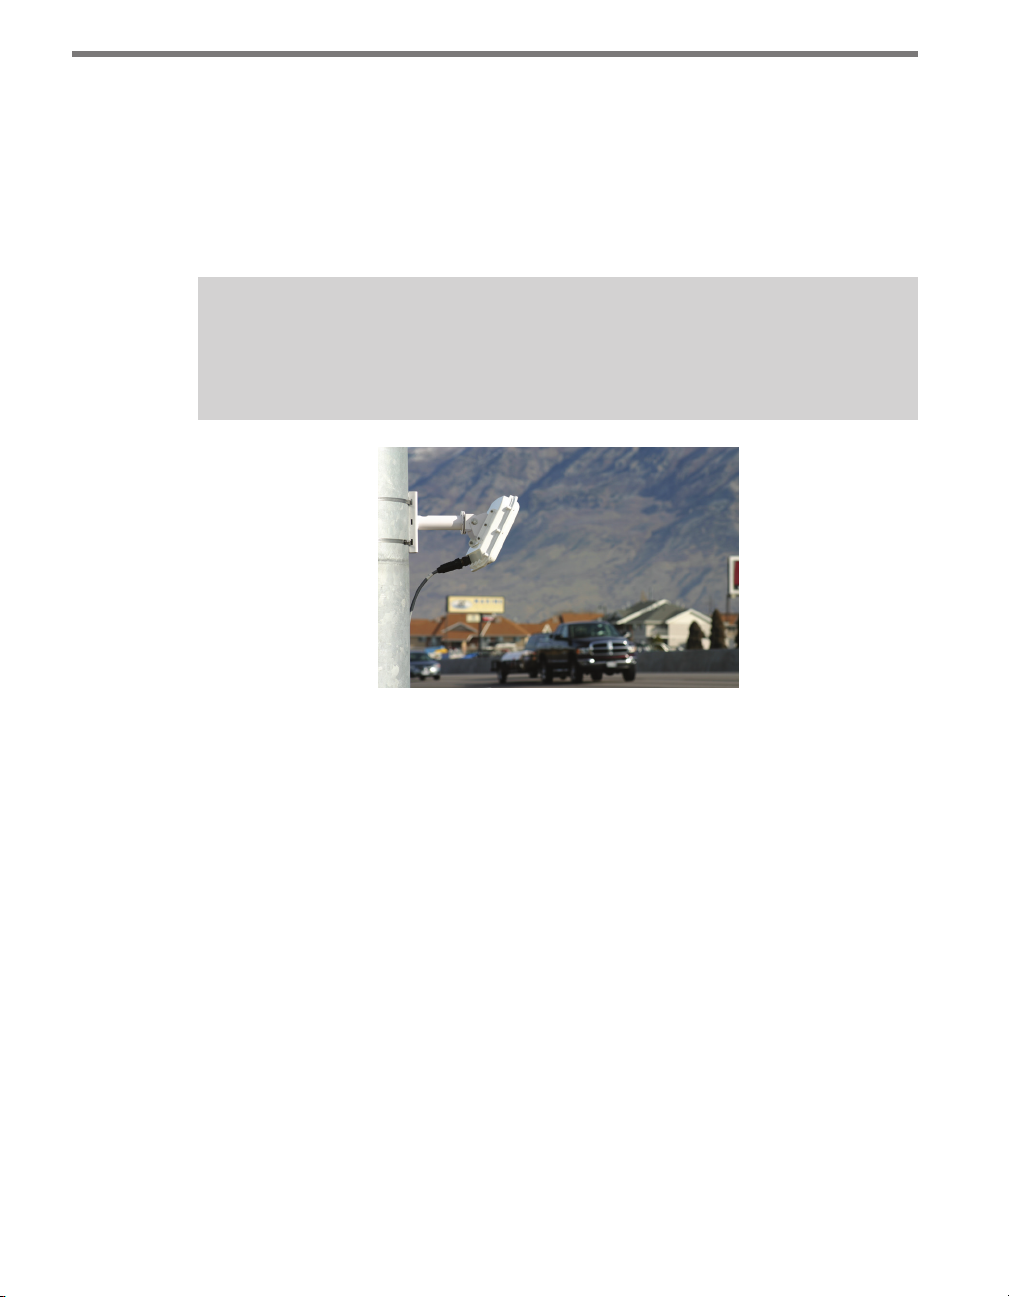
Connecting the Cable
e sensor connector is keyed to ensure proper connection; once you have plugged the
cable connector into the sensor connector, simply twist the cable connector clockwise until
you hear it click into place. To avoid undue movement from the wind, strap the cable to the
pole or run it through a conduit, but leave a small amount of slack at the top of the cable to
reduce cable strain (see Figure 1.7).
Note
If you run the cable through the pole, do not drill through the sensor mount, as the
sensor and sensor mount may need to be adjusted in the future.
Figure 1.7 – Sensor Connector
e service end of the cable has a +DC and GND for a power supply of 12 to 24 VDC. Two
communication ports (either RS-232 or RS-485) are available to connect the SmartSensor
HD to a modem or other communication device. Typically, one RS-485 and one RS-232
port are available.
Page 19

Page 20

Connecting Power and Surge 2
In this chapter
Connecting Lightning Surge Protection
Wiring to Earth Ground
Installing the Power Plant
Connecting the Power Plant to Your Installation
Wiring Communication
2
Once the sensor is installed, it will need to be wired for power and surge protection. Wavetronix Click products allow you to quickly and easily include power and surge protection
in your sensor application. Please refer to the Click quick-reference guides for more comprehensive product instructions.
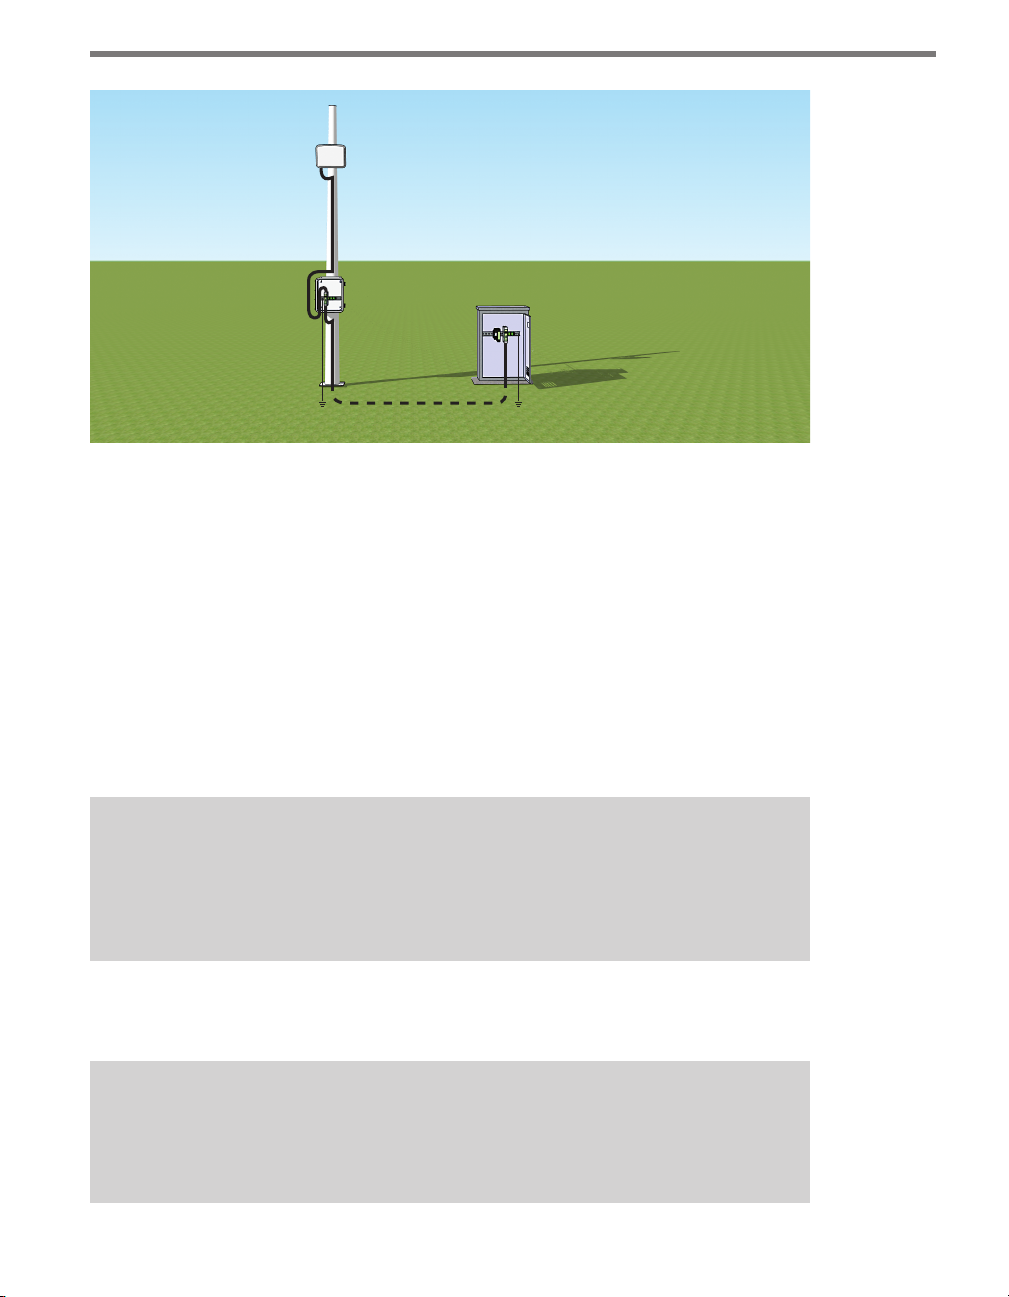
ere are several ways your sensor might be set up:
A two-part installation, with components in two areas: rst, a pole by the road holds
your sensor plus a pole-mount box with a surge protector inside. Second, a main trac
cabinet holds power and communications devices. e cabinet and pole are connected
via a homerun cable that runs underground.
Note
This chapter assumes the box and cabinet are connected by an underground cable
run, but in certain circumstances they might not be.
Page 21

20 CHAPTER 2 CONNECTING POWER AND SURGE
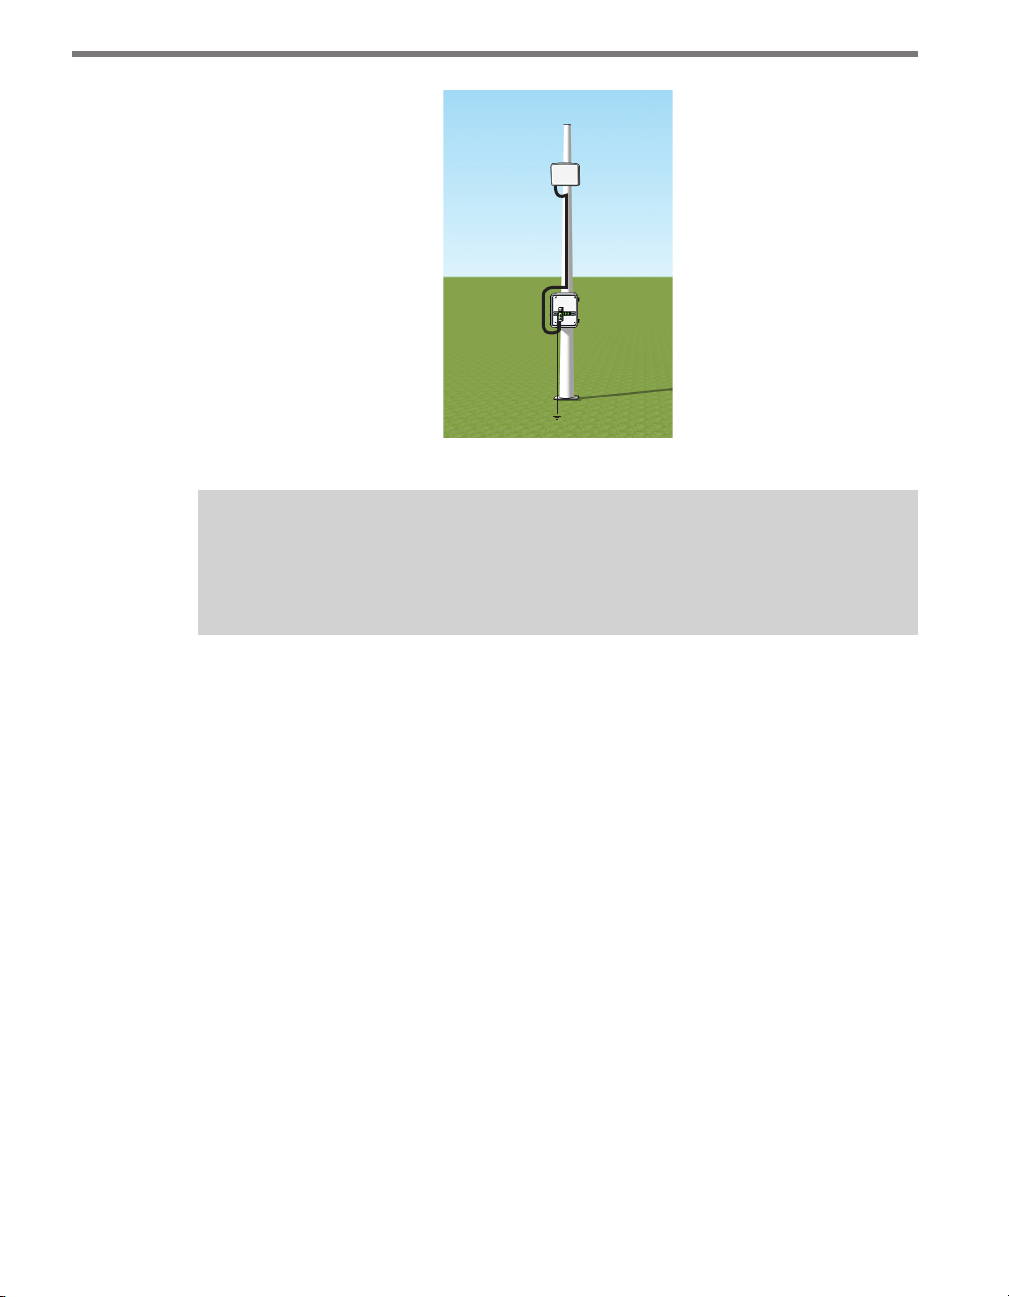
A single-part installation, with all components on the same pole. is pole holds your
sensor. Power and communications devices (most likely wireless) are in a pole-mount
box or there is a trac cabinet at the base of the pole; either way there is no underground cable run. Power comes from the pole itself or from a battery and/or solar
panels at the pole.
How you set up the devices in this chapter will vary depending on which of these installations you are using.
Connecting Lightning Surge Protection
e sensor should be connected to at least one surge protection device. e Click 200 and
equivalent devices are designed to prevent electrical surges along cables from damaging the
sensor and/or the cabinet. It is also a convenient spot to terminate the cable coming from
your sensor, as it has terminals for all the wires.
Note
If you choose not to use surge protection in your installation, please contact Wavetronix Technical Services for assistance.
If you are using the one-part installation option—no underground cable run—put a Click 200
in the pole-mount box/trac cabinet (whichever is being employed) as a termination point
for the cable from the sensor, and as a way to protect the box/cabinet. When there is no underground cable run, it is safest practice, as well as Wavetronix standard procedure, to connect
the cable from the sensor in the UNPROTECTED side of the Click 200.
1 Install a Click 200 in the pole-mount cabinet/trac cabinet by snapping it onto the
DIN rail. Your power and communications devices will most likely also be on this DIN
rail; make sure the Click 200 is connected to them via wires or the shared communication bus (connecting power will be covered later in this chapter; for how to connect to
communications devices, see the Click 100–400 Series User Guide).
2 Wire the cable from the sensor to the UNPROTECTED side of the Click 200.
Page 22
CHAPTER 2 CONNECTING POWER AND SURGE 21
Smart
Sensor
Figure 2.1 – Using a Single Click 200
Note
The dierent cables available and how to wire them into the Click 200 will be covered
later in this section.
If you are using the two-part installation option, you’ll have an underground cable run as
part of your installation, connecting the power and comms devices in the main trac cabinet to the pole-mount box and sensor. When there is an underground cable run, it is safest
practice, as well as Wavetronix standard procedure, to use two Click 200s, one on each end
of the cable: one in the main trac cabinet and the other in the pole-mount cabinet. Both
ends of the cable should be connected to the UNPROTECTED side of their Click 200s. is
is important because the underground cable run will be susceptible to surges caused by
lightning striking the ground near it.
If this run is shorter than 600 . (182.9 m), you can use a Wavetronix cable; see Appendix
D for more on cable lengths.
1 Install one Click 200 device in a pole-mount cabinet on the same pole as the sensor
being protected. Install it by snapping it onto the DIN rail.
2 Connect the cable from the sensor to the PROTECTED side of this Click 200. is
cable should be kept as short as possible.
3 Install another Click 200 in the main trac cabinet. You will likely have power and com-
munications devices in this cabinet; make sure the Click 200 is connected to them via wires
or the shared communication bus (connecting power will be covered later in this chapter;
for how to connect to communication devices, see the Click 100–400 Series User Guide).
4 Connect the pole-mount box and the main trac cabinet by running a cable from the
UNPROTECTED side of the Click 200 in the pole-mount box to the UNPROTECTED
side of the Click 200 in the main trac cabinet.
Page 23
22 CHAPTER 2 CONNECTING POWER AND SURGE
Smart
Sensor
Pole-
mount
box
Figure 2.2 – Underground Cable Run
Main trac cabinet
120
VAC
Earth groundEarth ground
Wiring the Click 200
ere are two cables that may be used with your sensor, the 8-conductor cable and the
9-conductor cable. Which one you use is based largely on the connector on your SmartSensor HD—that is, the connector where the cable will be plugged into the sensor.
ere are two dierent connectors that may be found on a SmartSensor HD:
e 10-pin connector is used with the SmartSensor HD. It currently only comes in-
stalled on the 8-conductor cable.
e 26-pin connector is used with SmartSensor HD Legacy and retrotted HDs. It can
be installed on the 8-conductor cable or the old 9-conductor cable.
Note
There may be compatibility issues if you use a 8-conductor/26-pin connector cable
with a SmartSensor HD that was manufactured in or before 2008. Contact Wavetronix Technical Services for details and assistance.
e wiring for these two cables is almost identical; the dierences are pointed out on the
following page.
Note
If you have an underground cable run that stretches more than 600 ft (182.9 m), you will
likely need to use a dierent cable; in that case the colors won't match the figure below.
Page 24
CHAPTER 2 CONNECTING POWER AND SURGE 23
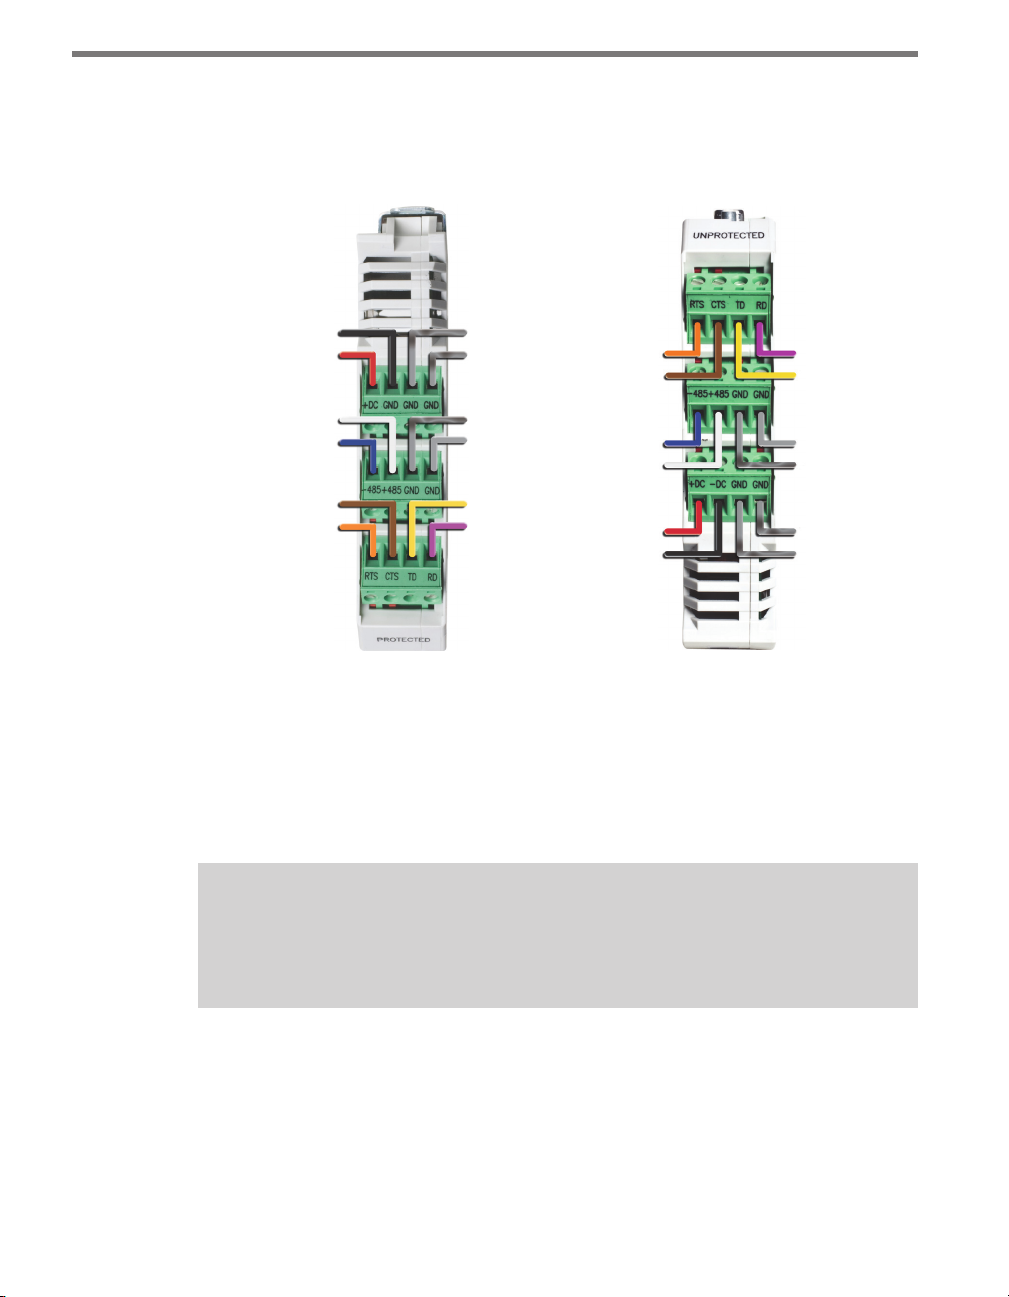
e Click 200 contains three terminal connectors on both the top and the bottom of the
module (see Figure 2.3). e terminal connectors are removable and are red-keyed, allowing each connector to plug into only one specic jack. is both simplies the wiring
process and reduces the possibility of wiring errors.
GND/-DC (Black)
+DC (Red)
+485 (White)
-485 (Blue)
CTS (Brown)
RTS (Orange)
Figure 2.3 – Click 200 Terminal Connections (protected and unprotected sides)
Power Drain
RS-232 Drain
RS-485 Drain
Ground (Gray)
TD (Yellow)
RD (Purple)
RTS (Orange)
CTS (Brown)
-485 (Blue)
+485 (White)
+DC (Red)
-DC (Black)
RD (Purple)
TD (Yellow)
Ground (Gray)
RS-485 Drain
RS-232 Drain
Power Drain
If you have an 8-conductor cable, it will have the following wiring dierences:
ere is no gray ground wire.
Instead of three drains, there is only one. is drain can be connected into any of the
screw terminals marked GND.
e white +485 wire will have a blue stripe.
Note
See Appendices A and B for cable pinout diagrams for the two dierent connectors
found on SmartSensor HDs.
Wiring to Earth Ground
All Click 200 devices should be mounted on a DIN rail that is connected to earth ground
either through an earth-grounded chassis or a 16 AWG or larger grounding wire attached
to a 7-. (2.1-m) grounding rod. Follow the steps below to correctly wire to earth ground:
Page 25
24 CHAPTER 2 CONNECTING POWER AND SURGE
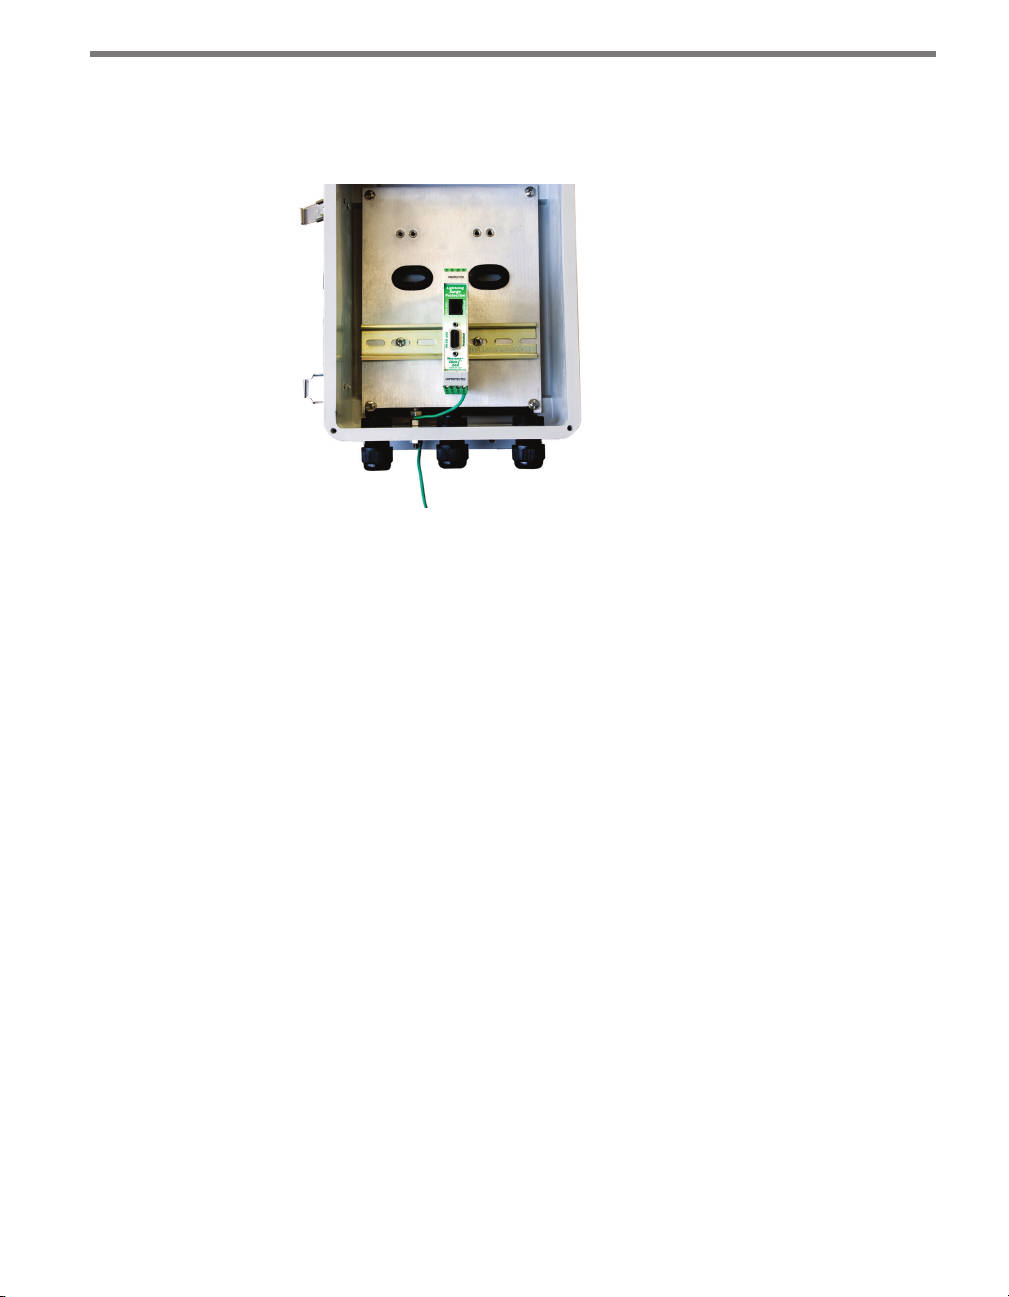
1 Connect the grounding wire from either the DIN rail or a GND screw terminal on the UN-
PROTECTED side of the Click 200 to the lug bolt on the inside of the pole-mount cabinet.
2 Connect another grounding wire from the exterior lug bolt to earth ground (see Figure 2.4).
Figure 2.4 – Earth Ground Connections
Installing the Power Plant
Provide power to your installation using the Click power plant. is set of modules includes
the following:
Click 201/202 AC to DC converter
Click 210 circuit breaker and switch
Click 230 AC surge module
A Click 201 provides 1 A of power and is capable of powering a single sensor, while a Click
202 provides 2 A and can power two sensors. (ere is also a Click 204 which provides 4 A
of power, but that will usually not be necessary in an installation such as the one outlined
below.) e Click 230 helps limit current surges on the power lines; the Click 210 interrupts
power during overload conditions and provides a convenient way to turn power on and o.
e power plant will either be in a pole-mount box or in a main trac cabinet. If it’s in a
trac cabinet, the power will be sent to the pole via an underground cable run. How to install the power plant and then wire to a Click 200 will be covered in the rest of this section.
It should be noted that if you have ordered a Wavetronix preassembled cabinet, all of this
wiring and installation will already be done.
Page 26

CHAPTER 2 CONNECTING POWER AND SURGE 25
Note
An authorized electrical technician should perform installation and operation of this
unit. Persons other than authorized and approved electrical technicians should NOT
attempt to connect this unit to a power supply and/or trac control cabinet, as there
is a serious risk of electrical shock through unsafe handling of the power source. Extreme caution should be used when connecting this unit to an active power supply.
Wiring in AC
e rst step is to get AC power into the enclosure. (Sometimes the power source is actually
DC; to see Wavetronix’s selection of DC power modules, see the Click 100–400 Series User
Guide.) If you’re using a main trac cabinet, wire from its power source; if you’re using a
pole-mount box, the power lines or cable can be brought in through the conduit on the
bottom-le.
Note
Make sure power to AC mains is disconnected while wiring AC input.
Wiring the Click 210
e rst device in the power plant, as seen in Figure 2.5, is the Click 210. is is a compact
circuit breaker DIN rail device designed to interrupt an electric current under overload
conditions. e breaker is trip-free and can be easily reset aer a current interruption by
pushing the reset button.
Page 27
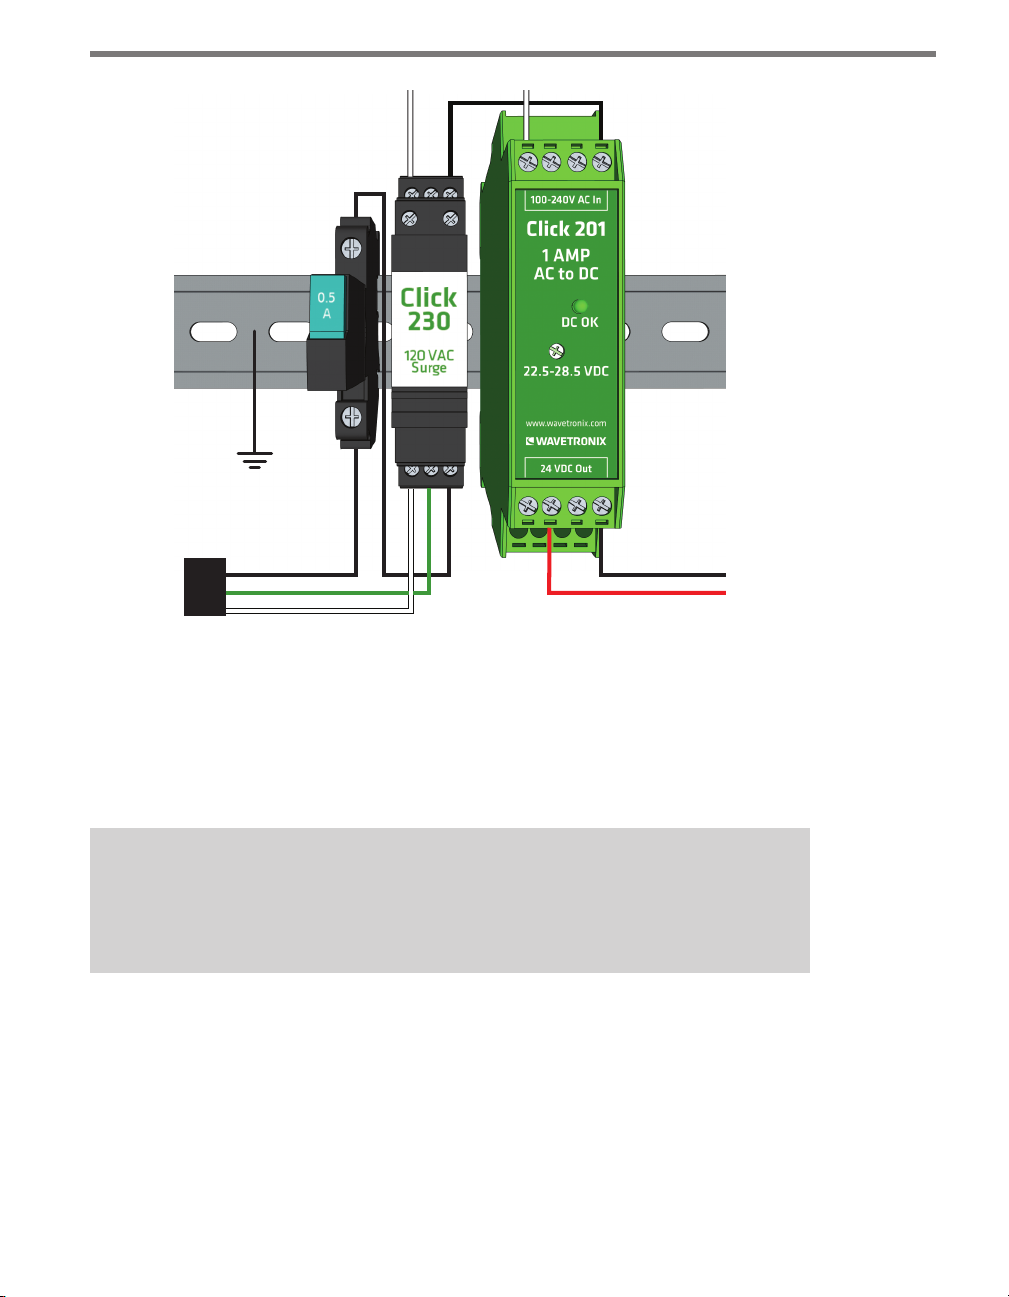
26 CHAPTER 2 CONNECTING POWER AND SURGE
Earth
Ground
Black (Line)
Green (Ground)
White (Neutral)
Figure 2.5 – AC Surge Protection
Black (Ground)
Red (+24VDC)
To add a Click 210 circuit breaker and switch (see the le side of Figure 2.5):
1 Mount the Click 210 onto the DIN rail.
2 Connect the line conductor (usually black) from the AC terminal block or cord in to
either side of the module.
3 Wire out of the other side.
Note
For ease in troubleshooting, it is recommended that you follow the wire color scheme
outlined in this chapter.
Wiring the Click 230
e next device in the power plant is the Click 230, which is the AC surge protector (see
Figure 2.5). To install:
1 Mount the Click 230 onto the DIN rail next to the Click 210.
2 Connect the line conductor (black) from the Click 210 to terminal 5 on the IN side of
the Click 230.
Page 28

CHAPTER 2 CONNECTING POWER AND SURGE 27
3 Connect the neutral (usually white) wire from the AC terminal block or cord to the
terminal marked 1 on the Click 230.
4 Connect the ground wire from the AC terminal block or cord to the terminal marked
3 on the Click 230.
5 Connect an outgoing and protected line wire to the terminal marked 2 on the Click
230. e line wire should be black.
6 Connect an outgoing and protected neutral wire to the terminal marked 6 on the Click
230. e neutral wire should be white.
e terminal blocks 3 and 4 are directly bonded via the metal mounting foot of the base
element to the DIN rail. ere is no need for any additional grounding between terminals
3 and 4 and the DIN rail.
Wiring the Click 201/202
e nal device in the power plant should be either a Click 201 or 202 (as shown in Figure
2.5). ese are AC to DC converters, also occasionally called the power supplies. As noted
above, the dierence between the two is that the Click 201 outputs 1 A and the Click 202
outputs 2 A (the Click 204 outputs 4 A but will probably not be needed for an HD installation). Choose which device suits your installation best, then follow the steps below to install
it (see Figure 2.6):
1 Mount the Click 201/202 onto the DIN rail next to the Click 230.
2 Connect the line (black) wire from the Click 230 into the L screw terminal on the top
of the Click 201/202.
3 Connect the neutral (white) wire from the Click 230 to the N screw terminal to the top
of the Click 201/202.
Figure 2.6 – Wiring AC Power into the Click 201/202
Note
The NC screw terminal is not connected internally. Connecting a wire to a no connect
(NC) terminal simply gives it a convenient termination point.
Page 29

28 CHAPTER 2 CONNECTING POWER AND SURGE
To wire the newly converted DC power out of the Click 201/202:
1 Connect a +DC conductor (usually a red wire) to the + screw terminal on the bottom
of the Click 201/202 (see Figure 2.7).
2 Connect a -DC conductor (usually a black wire) to either of the – screw terminals on
the bottom of the Click 201/202.
Figure 2.7 – Wiring DC Power Out of the Click 201/202
Note
Do not wire into the screw terminal marked DC OK; it provides only 20 mA and should
be used only for monitoring the power supply.
e screw terminal connectors on the top and bottom of the module are removable to simplify wiring and are red-keyed, allowing the connector to plug into only one correct jack.
Connecting the Power Plant to Your Installation
Now the power plant is complete and you have reliable, safe DC power. e next step is to
get that power to the rest of the installation.
If the power plant is in a pole-mount box, this involves getting that power onto the T-bus; from
there it will power any communication devices that may be on it. It will also power the Click 200,
which will send the necessary 10–30 VDC, along with communications, to the sensor.
If the power plant is in a main trac cabinet, this also will involve getting DC from the
power plant on the T-bus; from there it will power any communication devices on that bus.
It will also power the Click 200, which will send that power, along with communications,
along the homerun cable to the Click 200 in the pole-mount box. at Click 200 will put
the power (and communications) onto the T-bus, powering any communication devices
that may be on it. It will also send the necessary 10–30 VDC, along with communications,
to the sensor.
Page 30

CHAPTER 2 CONNECTING POWER AND SURGE 29
To put power on the T-bus, you will rst need to connect a 5-screw terminal block to the
end of the T-bus, then follow the steps below to wire DC to it:
1 Connect +DC (red) from the Click 201/202 to the top screw terminal on the 5-screw
terminal block.
2 Connect –DC (black) to the second screw terminal.
+24V DC
-DC
+485
-485
GND
(red wire)
(black wire)
Figure 2.8 – Connecting Power Directly to the T-bus
Green
Gray
Note
Green T-bus connectors conduct power and communication on the DIN rail backplate;
gray T-bus connectors only conduct power and are used to distribute power without
connecting communication.
You can also wire DC to the Click 200 itself; it will then put that power on the T-bus. If you’d
like to do that, follow these steps:
1 Connect +DC (red) from the Click 201/202 to the +DC screw terminal.
2 Connect -DC (black) to a GND screw terminal.
GND
+DC
Figure 2.9 – Wiring DC Power into the Click 200
Wiring Communication
e last thing to do is decide how to communicate with the sensor. How you do this will
vary based on your installation. If your sensor is connected to a Click 200 in a pole-mount
Page 31

30 CHAPTER 2 CONNECTING POWER AND SURGE
box, and you want to access that sensor from a main trac cabinet or from the trac operations center, you will need some kind of communication between the two spots: either with
the homerun cable, which can carry both RS-232 and RS-485 communications, or by using
a Wavetronix Click communication device.
Wavetronix has a variety of wired and wireless communication devices, such as the Click
301 serial to Ethernet converter, which lets you communicate with the sensor via Ethernet,
or the Click 400, which is a 900 MHz radio that communicates wirelessly with other radios.
See the Click Catalog, Click Series User Guide, or ITS Designer Training Guide for more
information.
e Click 200 has several ports for other methods of communication. e faceplate has a
DB-9 port you could connect to for RS-232 communication. ere are also several RS-485
connections:
T-bus backplane: puts RS-485 on the T-bus. Because the Click 200 is connected to the
sensor, this T-bus connection means the sensor, the Click 200, and any other device on
the T-bus all communicate with each other.
RJ-11 connector on the faceplate for connecting to contact closure devices, if desired.
Note
The Click 200 does not convert RS-232 communication to RS-485. It simply provides
surge protection for these two independent connections.
Page 32

Part II
Using SmartSensor Manager HD
Chapter 3 – Installing SmartSensor Manager HD
Chapter 4 – Communication
Chapter 5 – Settings
Chapter 6 – Lanes
Chapter 7 – Data
Chapter 8 – Tools
Page 33

Page 34

Installing SmartSensor Manager HD 3
In this chapter
Installing SSMHD
3
Aer the SmartSensor HD is installed, use SmartSensor Manager HD (SSMHD) to congure the sensor to the roadway and change sensor settings. SmartSensor Manager HD is
soware that enables users to congure and interact with the SmartSensor HD.
Installing SSMHD
SSMHD can be installed on a Windows® PC. Everything needed to install SSMHD to a PC
is contained in the SSMHD Setup.exe le.
Note
You must have administrator rights to run the setup program.
Note
Microsoft .NET Framework version 3.5 or higher needs to be installed on your computer before installing SSMHD. You can get the .NET Framework from the Microsoft
website.
Page 35

34 CHAPTER 3 INSTALLING SMARTSENSOR MANAGER HD
Follow these steps to install SSMHD on a PC:
1 To download the install le, go to the Wavetronix website at www.wavetronix.com.
2 Click the Support link near the top of the page. is will bring up a page allowing you
to select by product line or by document category.
3 Click SmartSensor in the Start by drop-down list.
4 Select SmartSensor HD and a list of links will appear.
5 Select the SmartSensor Manager HD link (at the top) to download the SSMHD install
le.
6 Once you’ve downloaded the le, double-click on it. Opening it executes a setup pro-
gram that will copy all the necessary les to your hard drive and place icons in the Start
menu and on the desktop of the PC or laptop (see Figure 3.1).
Figure 3.1 – SSMHD Setup Wizard
7 Select an installation location. e default location provided is normally “C:\Program
Files\Wavetronix.” Click Browse to choose another location (see Figure 3.2).
Figure 3.2 – Location to Be Installed
8 Click the Install Now button.
9 Aer SSMHD is installed, you can create shortcuts to the SSMHD soware on the
desktop and in the start menu using the corresponding checkboxes (see Figure 3.3). If
no shortcuts are desired, uncheck the corresponding boxes.
Page 36

CHAPTER 3 INSTALLING SMARTSENSOR MANAGER HD 35
Figure 3.3 – Shortcut Options
10 Click the View release notes when nished checkbox to view the SSMHD release
notes. e release notes contain additional information about the current version of
the SSMHD soware. A PDF reader program (i.e. Adobe Acrobat Reader) is required
to view the release notes.
11 Click Finish to complete the setup process.
Note
SSMHD is designed to display text with Normal Size display resolution (96 dpi). If
your test is too big and does not display properly, you can edit the Advanced Display
property settings on your PC to reduce the display resolution from 120 dpi down to
96 dpi.
Page 37

Page 38

Communication 4
In this chapter
Serial Connection
Internet Connection
Virtual Connection
Viewing Connection Information
Installation Type
Communication Screen Icons
Uploading the Sensor's Embedded Software
4
Use the SSMHD soware to change settings, view data and congure the sensor to the
roadway.
First, physically connect your computer or handheld computer to the sensor. Next, launch
SSMHD by either clicking on the icon that was placed on your desktop or clicking the icon
found in the Start menu. e SSMHD main screen shown in Figure 4.1 will appear.
e green globe in the lower le corner allows you to select the language for SSMHD. To
change the language, click on the image and select the desired language from the dropdown list.
e control to the right of the globe image allows you to change the size of the window.
ere are three options; click on a box to change the window to the corresponding size.
Page 39

38 CHAPTER 4 COMMUNICATION
Figure 4.1 – SSMHD Main Screen
To interact with and congure the sensor in SmartSensor Manager HD, connect to the sensor through one of the following three types of connections:
Serial connection – Made using RS-232 or RS-485 communication.
Internet connection – Made using an IP address and a serial to Ethernet converter.
Virtual connection – Can be made for convenience in learning and demonstrating
SSMHD functionality.
Serial Connection
1 Click on the Serial icon
2 Set Port and Speed to the desired settings. It is recommended that the speed be set to
9600 bps.
3 Click the Connect button.
(see Figure 4.2).
Figure 4.2 – Serial Connection
Page 40

CHAPTER 4 COMMUNICATION 39
Advanced Settings
Below is a list of some advanced settings also available on this screen:
Flow Control – Is usually only used if you are connecting through a RS-232 device that
requires hardware handshaking.
Timeout – Allows you to set an additional amount of time (in milliseconds) that
SSMHD will wait for a response when communicating with the sensor.
Note
When connecting directly from a computer running SmartSensor Manager HD to a
SmartSensor HD unit (with no modem in between), you should not attempt to connect unless the Flow Control setting is set to None. Otherwise you may not be able
to successfully connect.
Internet Connection
e SmartSensor HD can be connected to the Internet, allowing access to the sensor from
anywhere with Internet access. Below is a list of a couple ways to connect the SmartSensor
HD to the Internet:
Serial to Ethernet Converter – e SmartSensor HD can be connected to a local area
network (LAN) by using a serial to Ethernet converter. As an option, the SmartSensor
HD can be shipped with a Click 301 serial to Ethernet converter that is Internet addressable, which makes it possible to connect to the sensor from anywhere the adapter’s address is accessible.
Internet Service Providers – Cellular providers of wireless Internet services maintain
networks in most metropolitan areas in the United States and coverage continues to
expand. e SmartSensor HD can be equipped with an optional external modems—for
example, CDMA, GMS or GPRS—and assigned an Internet address on these networks.
Use the steps below to connect to the SmartSensor HD using an Internet connection:
1 Click on the Internet icon (see Figure 4.3)
2 Enter the IP address or URL of the sensor of interest in the Network Address eld. e IP
address consists of four numbers ranging from 0–255 separated by dots. Enter the IP address assigned to either the CDMA modem or the Click 301 serial to Ethernet converter.
3 Enter the port number assigned to the CDMA modem or the Click 301 serial to Eth-
ernet converter in the Port eld. is will be an integer value in the range of 0–65536.
e Click 301 port number automatically defaults to 10001.
4 Click the Connect button to connect to the sensor.
Page 41

40 CHAPTER 4 COMMUNICATION
Figure 4.3 – Internet Connection
e Timeout eld allows you to set an additional amount of time (in milliseconds) that
SSMHD will use when communicating with the sensor.
Virtual Connection
A virtual connection allows you to use the SSMHD soware without being connected to an
actual sensor. Making a virtual connection can be useful for the following reasons:
To view a saved sensor setup le.
To demonstrate functionality for dierent applications.
To review how the soware works.
Use the following steps to make a virtual connection:
1 Click the Virtual button (see Figure 4.4).
2 Select or create a virtual sensor le (.sim) by clicking the magnifying glass icon.
3 Click the Connect button.
Page 42

CHAPTER 4 COMMUNICATION 41
Figure 4.4 – Virtual Connection
Additional Settings
e Trac Properties section contains the following settings:
Style – is section allows you to set random or patterned trac for the simulator.
Flow – Allows you to set the trac volume for the simulated trac.
Average Speed – Allows you to set the average trac speed for the simulated trac.
Virtual Sensor File
Since a virtual connection is not made to an actual sensor, a virtual sensor le (.sim) is
used to save the conguration settings much like an actual sensor’s ash memory. If you are
making a virtual connection for the rst time, you will need to create a virtual sensor le by
clicking on the magnifying glass icon and entering a le name.
Note
When you are connected using a virtual sensor file, changes that would normally be
saved to a sensor's flash memory will automatically be saved to the virtual sensor file.
Backing up a virtual sensor le will change the le to a sensor setup le (.ssc) that can be
restored to an actual sensor. To convert a sensor setup le to a virtual sensor le, make a virtual connection and then use the Restore Sensor Setup tool in the Too ls menu. To convert
a virtual sensor le to a sensor setup le, use the Back-up Sensor Setup tool.
Viewing Connection Information
Once a connection is made to the SmartSensor HD, the main menu will appear and all
Page 43

42 CHAPTER 4 COMMUNICATION
conguration options will become available (see Figure 4.5).
Figure 4.5 – SSMHD Main Screen (connected)
Once connected, you can view additional information about the connection you have established by clicking on the moving arrows on the top le of the main screen (see Figure 4.6).
Figure 4.6 – Connection Info Screen
Below is a list of the information available on the Connection Info screen:
Status – Shows that you are connected.
Device – Shows the subnet and sensor ID.
Speed – Shows the baud rate.
Duration – Shows how long you have been connected.
Troubleshooting Connections
If you have problems connecting, use the following steps to nd the problem:
Page 44

CHAPTER 4 COMMUNICATION 43
1 Make sure that all power and communication wiring is correct.
2 Check the port settings (baud rate, port ID).
3 Make sure that the sensor ID is correct.
Connection failure can occur for various reasons; if a failure occurs repeatedly, call Wavetronix Technical Services at 801-764-0277 for assistance.
Installation Type
Once the communication parameters are selected, choose the installation type to be used
for the connection.
Connecting to an Isolated Sensor
is protocol option is recommended when only one sensor exists on the remote end of the
connection (see Figure 4.7).
Figure 4.7 – Isolated Sensor
Connecting to a Sensor in a Multi-drop Network
Connecting to a sensor in a multi-drop network is recommended when more than one
sensor exists on the remote end of a connection. To connect to a sensor on a multi-drop
network, select Multi-drop Network from the drop-down list and enter the multi-drop
sensor ID of the sensor you are connecting to (see Figure 4.8).
Figure 4.8 – Multi-drop Network
If you do not know the sensor ID, click on the sensor and magnifying glass at the end of the
Sensor ID eld to do a search for all sensors on the serial bus.
Communication Screen Icons
At the bottom of the serial and Internet connection screens there is a white bar with icons.
is section will explain the purpose of those icons.
Page 45

44 CHAPTER 4 COMMUNICATION
Address Book
e Address Book allows you to save device connection settings for future use. Click the
book icon located at the bottom of the screen to add new connection settings to the Address
Book (see Figure 4.9).
Filters Address Books
Deletes an Address Book
Imports an Address Book
Exports an Address Book
Edits the Selected Device
Deletes the Selected Device
Adds Device to Address Book
Figure 4.9 – Address Book
Password
e key icon allows you to create a password for SSMHD. Passwords are associated with the
sensor in order to keep the connection and conguration secure. Aer clicking the icon,
enter the desired password and click OK. is password will now have to be entered each
time you attempt to make a connection (see Figure 4.10).
Figure 4.10 – Enter Password Window
If you forget the sensor password, use the Click Here link and a new window will open
providing information about how to get a new password.
Communication Error Log
e error log contains all errors stored in the sensor’s memory buer. If you are having
Page 46

CHAPTER 4 COMMUNICATION 45
trouble connecting, using the error log may be helpful in the troubleshooting process. If you
continue having trouble, save the error log le and contact Wavetronix Technical Services.
Note
The error log is cleared every time you close SSMHD, so if you need to save the file, do
so before shutting the program down.
Click the View Error Log link to view the communications error log (see Figure 4.11). e error
log can also be accessed by clicking on the error log icon at the bottom of the connection screen.
Figure 4.11 – Communication Error Log
Uploading the Sensor’s Embedded Software
Aer clicking the Connect button, the soware will check to see if your soware version
matches the version of the sensor’s embedded soware. If a discrepancy is detected, the Version Control screen may appear asking you to install rmware upgrades (see Figure 4.12).
If you think you have reached this screen in error, clicking the Recheck button will have
the soware retry and ensure that there has not been a communication issue. Clicking the
Details button will display the current sensor and soware information. Click the Install
Upgrade button to upgrade the soware.
Figure 4.12 – Version Control (left) and Software Upgrade Details (right)
Page 47

46 CHAPTER 4 COMMUNICATION
Note
Clicking the Close button and continuing configuration may cause problems with
functionality.
e gure below shows how the rmware numbers are interpreted (see Figure 4.13). e
month number is written in hexadecimal, meaning the months of October, November and
December will be written as A, B and C respectively.
Month
(July)
Year
(2007)
Figure 4.13 – Install Upgrade Numbers
Day
(5th)
If the row marked Digital is highlighted in red, the rmware upgrade may need to be installed. Compare the sensor number with the SSMHD number in the digital row of the
details table. If the SSMHD rmware version date is more recent than the sensor rmware
version date, the rmware upgrade will need to be installed; if the sensor’s rmware date is
more recent than the SSMHD rmware version date, a warning will appear notifying you
that the sensor rmware could be downgraded (see Figure 4.14).
Figure 4.14 – Downgrading the Sensor
If the downgrade message appears, it simply means that the sensor rmware is newer
than the version of SSMHD that was used to connect to the sensor. e newest version of
SSMHD can be updated by downloading the soware from www.wavetronix.com.
Click the INSTALL UPGRADE button to install the rmware embedded in SSMHD onto
the SmartSensor HD. e Recheck button will query the sensor to see if the rmware bundled in SSMHD is dierent from the version running on the sensor.
Page 48

Settings 5
In this chapter
General Tab
Ports Tab
Outputs Tab
5
Click the Settings link on the main menu to change and save settings on the sensor. e
Settings window contains the General, Ports and Outputs tabs.
General Tab
e General tab contains the following elds (see Figure 5.1):
Figure 5.1 – General Tab
Page 49

48 CHAPTER 5 SETTINGS
Serial Number – Contains the sensor serial number and cannot be edited.
Subnet/ID – Allows you to enter the subnet and ID. A subnet can be used to create
groupings of sensors. e subnet default is 000 and the ID default is the last ve digits
of the sensor serial number. e ID can be changed, but no two sensors should have the
same ID. e ID must be unique for all sensors on a multi-drop bus.
Description – Allows you to enter a description for each sensor. Limited to 32 characters.
Location – Allows you to enter the location of the sensor. Limited to 32 characters.
Orientation – Allows you to enter the direction the sensor is pointing. is eld is
purely for informational purposes and has no eect on performance or the sensor’s
physical mounting.
Units – Allows you to display either English (mph/feet) or metric (kph/meters) units.
Date & Time – To sync the sensor date and time with the computer, click the Sync to
this computer checkbox. e sensor itself stores time in Coordinated Universal Time
(UTC), formerly known as Greenwich Mean Time (GMT), and does not account for
daylight saving time. SSMHD uses the local setting of the computer it is running on to
display the date and time in local units.
Example
If someone in Pacific Standard Time (PST) connect to a sensor and synchronizes the
time, then when someone in Mountain Standard Time (MST) connects to the same
sensor the time will be correctly displayed as MST. If the settings on either PC adjusts
for daylight savings, then this adjustment will also be correctly displayed.
Ports Tab
e Ports tab contains the following settings (see Figure 5.2):
Figure 5.2 – Ports Tab
Page 50

CHAPTER 5 SETTINGS 49
Green highlight – is indicates the communication link (port) on which SSMHD is
connected.
RS-485 – Allows you to set the baud rate for RS-485 communication. e Response
Delay setting is used to congure how long the sensor will wait before responding to
a message received. is is useful for some communications devices that are unable to
quickly change transmission direction. e default value is 10 milliseconds.
e Termination checkbox allows you to electronically turn RS-485 communication
bus termination on or o. Only the end devices on a RS-485 bus should be terminated.
In general, the termination can be le unchecked until a multi-drop bus becomes overloaded.
RS-232 – Allows you to set the baud rate for RS-232 communication. e Response
Delay setting works the same as the RS-485 section.
e HW Handshaking checkbox should be selected if you are connecting your sensor to
an RS-232 device (such as some modems). ese devices sometimes require ow control
handshaking because they cannot keep up with the data rates of higher-performance
devices like personal computers and SmartSensor HD. SmartSensor Manager HD and
SmartSensor HD have built-in support for RS-232 ow control hardware handshaking;
this support allows the SmartSensor HD and SmartSensor Manager HD to work with
these slower modem connections. Table 5.1 gives a brief description of each RS-232 line.
Line Description
TX Transmit data line
RX Data receive line
RTS Request to send flow control hardware handshaking line
CTS Clear to send flow control hardware handshaking line
Table 5.1 – RS-232 Lines
In order to use hardware handshaking, the sensor’s RTS and CTS signals must be properly
connected. If the Flow Control option under the Serial connection screen is set to Hard-
ware, you will not be able to connect if the sensor’s HW handshaking setting has been
previously turned o. e reason you cannot connect is that the sensor’s RTS line is not
asserted; as that line is connected to the computer’s CTS line, the computer will not forward
data messages it is given by SmartSensor Manager HD. To successfully connect, simply
change the Flow Control setting to None.
Outputs Tab
e Outputs tab contains the following settings (see Figure 5.4):
Page 51

50 CHAPTER 5 SETTINGS
Source – Allows you to determine what information is reported. ere are two options:
Antenna reports data as detected by the antenna in the sensor, and Diagnotic creates
detection events for testing and training purposes.
Note
If the sensor is in Diagnostic or Replay mode, it will not detect live trac.
Figure 5.3 – Outputs Tab
RF Channel – Displays which radio frequency channel the sensor is transmitting on.
Using multiple sensors in close proximity will require each sensor to be set to a dierent RF channel (see the introduction for more information about mounting sensors in
close proximity).
Loop Emulation – is section allows you to set loop size and spacing to allow Smart-
Sensor HD to emulate dual loops. e settings changed on this screen will apply to all
congured lanes. ese settings are read by a Click contact closure device and used so
that the contact closures can be properly timed to emulate a given loop size and spacing. e loop size is also used by the sensor in the occupancy calculation. For example,
larger loop sizes will result in higher occupancy numbers in the interval data. However,
adjusting these parameters will not modify the reported vehicle length or speed (see
Chapter 6 of this user guide to accomplish these tasks).
Legacy Protocols – e SS105 protocol must be selected when being used with Click
communication and contact closure devices (it is not necessary if you are only using
Click surge and power devices). is does not turn o native SSHD protocol.
e RTMS (X3): ID checkbox allows you to turn RTMS protocol emulation on or o;
only a subset of RTMS data reporting commands are emulated. is does not turn o
native SSHD protocol. e RTMS ID eld will only be editable if the RTMS Protocol
checkbox is selected.
Page 52

CHAPTER 5 SETTINGS 51
Note
If you are using a SmartSensor HD in an RTMS-based system, there are two ways
to collect data from the sensor. If your system is set up to poll the sensor, the RTMS
protocol must be turned on so the sensor can respond to RTMS commands. If your
system is simply listening for data pushes from the sensor, the RTMS protocol does
not need to be turned on. See Chapter 7 for more information on data push.
Page 53

Page 54

Lanes 6
In this chapter
Configuration
Verification
6
Click the Lanes link on the main menu to align and congure the sensor, and to verify
functionality (see Figure 6.1).
Configuration – Allows you to automatically congure the sensor, manually adjust the
lanes (if needed) and edit and save the conguration.
Verification – Allows you to verify that the sensor is detecting accurately and to mod-
ify individual lane performance.
Page 55

54 CHAPTER 6 LANES
Figure 6.1 – Lanes Screen
Configuration
e Conguration screen can be used to automatically or manually congure the roadway,
manipulate lanes, and control how you see the information onscreen. To reach the screen,
click the Conguration button.
Sensor Alignment
e sensor should be properly aligned before beginning lane conguration, so SSMHD includes
an alignment feature that gives visual conrmation when the perpendicular alignment of a sensor is correct (see Figure 6.2). SSMHD gives you three dierent ways to check sensor alignment:
the arrow coming out of the sensor; the color on the detected vehicles; and in the sidebar.
Once you open the Conguration screen, you should see alignment arrows. If there are no
alignment arrows, click on the magnifying glass icon and then select Show Alignment.
Figure 6.2 – Sensor Alignment
Adjust the sensor according to the arrow displayed in the Conguration window. A green
Page 56

CHAPTER 6 LANES 55
arrow means the sensor is correctly positioned for optimal performance; a yellow or red
arrow means the sensor is NOT correctly aligned with the roadway.
Note
In order for the sensor alignment tool to function properly, trac must be flowing
freely. Also, if the sensor is not already aligned close to perpendicular to the flow of
trac, the sensor alignment tool will display a question mark indicating that the
sensor is too far out of alignment for the tool to function properly. Realign the sensor
manually and then fine-tune the alignment with the tool. After each adjustment of
the sensor, several vehicles must pass before the alignment tool's output is valid.
It may be dicult to align the sensor if there are non-parallel lanes of trac. In this case,
mark the non-parallel lanes as Inactive or Excluded in the lane conguration screen, and
the sensor alignment tool will ignore vehicles traveling in these lanes.
Note
In cases where trac lanes are not exactly parallel, the percentage of vehicles with
reported speeds may decrease in the lanes that are skewed.
Auto-Configuration
One of the advantages of the SmartSensor HD is the fast and simple lane auto-conguration function, where the sensor automatically congures the roadway and sets up the lanes
based on passing trac.
Follow the steps below to automatically congure the SmartSensor HD (see Figure 6.3):
1 Once the Conguration window appears, click the Tools icon and select Clear Edit
Area.
2 Click the Tools icon again and then click Restart Auto Cfg.
Page 57

56 CHAPTER 6 LANES
Tools Menu
Figure 6.3 – Buttons Used in Automatic Lane Configuration
Note
You may need to click on the magnifying glass icon and select Show Auto Lanes for
the automatically discovered lanes to appear.
Sidebar
Tools Icon
Depending on where the sensor is mounted and on the amount of trac, the conguration
process could take a few minutes. Once the SmartSensor HD has detected vehicles and
created the appropriate lanes, click OK and a window will appear asking you to save the
changes to the conguration. Click Yes and the conguration will be saved.
Follow the steps below if only a portion of the automatically dened lanes are desired:
1 Click anywhere in the Conguration screen.
2 Check the Hide Auto-Lanes box and the automatically congured lanes will disappear.
3 Click on the desired automatic lane in the sidebar (when the sidebar is set to 1) and the
Automatic Lane window will appear (see Figure 6.4). is window allows you to select
the lanes you want to appear in the roadway. To have all lanes appear in the roadway,
click the Copy Sidebar button; to have individual lanes appear in the roadway, click the
Copy Lane button. You can also copy the entire sidebar and then delete the unwanted
lanes by clicking on them and selecting Delete.
Page 58

CHAPTER 6 LANES 57
Figure 6.4 – Automatic Lane Window
Manual Configuration
e Conguration screen can also be used to manually congure and adjust lanes (see
Figure 6.5). e following functions and tools are available on the Conguration screen.
Shoulder
Roadway
Vehicle Display
Tools
Figure 6.5 – Configuration Screen
Magnifying
Glass
Sidebar
Sidebar Button
Sidebars
e sidebar buttons on either side of the Conguration screen control the sidebar display.
Click and hold the button to see a list of the following dierent display modes (see Figure
6.6):
Page 59

58 CHAPTER 6 LANES
Figure 6.6 – Lane Configuration Sidebar Options
Auto Cfg – Shows the lanes that are automatically congured by the sensor.
Saved Cfg – Shows the lanes that are saved on the sensor.
Scale – Shows the distance from the SmartSensor HD to each lane.
Centers – Shows the relative occurrence of events. Larger arrows indicate a greater
number of vehicles at a given range.
Tracks – Shows a track for each detected vehicle; a line is drawn at the center of each
vehicle that passes. is sidebar is very useful for manually adding lanes. Click on the
tracks sidebar to clear all tracks and start again.
Vehicle Display
e Vehicle Display button opens a menu that allows you to congure how vehicles are drawn and what information is displayed on them.
In range mode, vehicles are drawn at the correct range regardless of lane denitions. In lane
mode, only vehicles detected in congured lanes will be displayed.
SSMHD is able to display the detected speed, length, length-based class (see Denitions in
Chapter 7) or no information for each vehicle (see Figure 6.7). To choose to show no information for the vehicle, click again on the option that is currently checked to deselect all options.
Figure 6.7 – Vehicle Display Options
Tools
e Tools button opens a menu that allows you to automatically congure the sensor, save and load congurations to les and reboot the sensor (see Figure 6.8). Saving or
Page 60

CHAPTER 6 LANES 59
loading the conguration only saves or loads lane conguration information (see the Tools
section on the main menu to save all sensor conguration parameters).
Figure 6.8 – Tools Options
Magnifying Glass
e Magnifying Glass button opens a menu that allows you to show or hide automatically congured lanes, lane names, vehicle direction, and sensor alignment; you can also
view a compass (see Figure 6.9). Many of these options can also be turned on or o simply
by clicking on them in the edit area.
Figure 6.9 – Show/Hide Lanes
Note
The orientation of the compass is based on the orientation chosen under Settings
(see Chapter 5). Changes to the orientation there will result in the compass in the
Configuration screen changing to match; conversely, changing the orientation of the
compass on the Configuration screen (done by clicking on it) will change the orientation setting under Settings. The orientation does not aect the alignment or operation of the sensor and is simply for your information.
Page 61

60 CHAPTER 6 LANES
Shoulder Area
Click in the shoulder and the Shoulder Area window will appear, allowing you to add or
exclude the shoulder you just clicked on (see Figure 6.10). is is useful when aligning the
sensor when there are non-parallel lanes in its eld of view. Alternatively, it can also stop
events from being generated in any non-lane areas. In the Verication screen, and when the
sensor is reporting data, any vehicles in non-lane dened areas will not be shown regardless
of whether the area is excluded or not. Click in an excluded area and the Excluded Area
window will appear, allowing you to include the area again.
Figure 6.10 – Edit Area Window
Lane Window
Click anywhere on a lane and the Lane window will appear, allowing you to change the
name, direction and activity of a lane (see Figure 6.11). SSMHD uses “LANE_xx” as the default lane name where “xx” is the number of the lane in range, beginning with “LANE_01.”
When a new lane is added, all lanes with the default lane name format will automatically be
renamed to indicate their increasing number in range. If this is not desired, the lane names
can be changed in any way; lane names are case and symbol sensitive and are limited to
eight characters.
Note
If you rename a lane with a new lane number, the software won't let you leave the
name in the form of LANE_XX. One easy way to get around this is to lowercase the
word "LANE." For example, to change the lane currently numbered as 1 to number 6,
change the name from LANE_01 to Lane_06.
For RTMS and Z4 data push types, the mapping of the lanes may be changed using the notation #xx (e.g. #08), where 08 is a lane number between 1 and 99. In this case, ALL lanes in
the conguration must be assigned a lane number using the #xx notation in order for the
new lane mapping to take eect.
Page 62

CHAPTER 6 LANES 61
Figure 6.11 – Lane Adjustment Window
e direction button allows you to set the direction for the lane—Le, Right or Bidirectional. e direction chosen determines what data is shown: if Right is the set direction for a
lane, only trac going to the right will be detected; and if Le is the set direction for a lane,
only trac going to the le will be detected (when Direction Protection is on). If the lane is
set to Bidirectional, data will be reported for trac going both directions. is is useful for
lanes that change direction depending on the time of day. Selecting Bidirectional is essentially the same as turning o Direction Protection for that lane (see the Lane Adjustments
section in Chapter 6 for more information on Direction Protection).
Note
All detected vehicles are shown on the Lane Configuration screen, regardless of direction.
Click the Exclude button to exclude a lane (the lane will turn red once it has been excluded) or click the Delete button to delete a lane. Excluded lanes will not be congured and
SSMHD will stop showing events in those particular lanes. Click the excluded lane and click
the Include Area button to include the lane.
e Lane window also allows you to set a lane as active or inactive. Inactive lanes are useful
when a lane has been correctly congured and tuned, but data reporting for the lane is not
desired. By making the lane inactive instead of deleting it, the lane may be turned on at any
time and will retain the proper conguration and tuning.
Saving the Configuration
Follow the steps below to save the conguration to a le:
1 Click on the Tools button on the bottom right of the Conguration screen.
2 Select Save to File.
Undoing Manual Changes
To undo changes you have made to the conguration, click on the Tools button in the Conguration screen and select Undo Last Edit from the choices displayed. To undo all changes
made to the conguration, click the Too ls button and then select Clear Edit Area.
Page 63

62 CHAPTER 6 LANES
Verification
To verify that the lanes were congured properly, close the Conguration screen and select
Verication from the Lanes menu.
e Verication screen allows you to monitor lane detection accuracy and to adjust the lane
properties for better detection.
Sidebars
Click and hold the sidebar buttons on either side of the Lane Verication window
to view the following options (see Figure 6.12):
Presence – Displays buttons to the side of each lane that will light up while the vehicle
is being detected.
Volume – Displays the number of events in each lane.
Speed – Shows the average speed of each individual lane.
Classes 1–8 – Show count for each length-based class, which can be created using the
Class Denitions feature. e number of class bins that appear in this window will be
the same number of class bins that were created (see Denitions in Chapter 7).
Figure 6.12 – Lane Verification Sidebars with Four Classes
Vehicle Display
e Vehicle Display button in the Verication window opens a menu that allows
you to view associated speed, length, length-based class or no additional data. To switch
the display, click on the Vehicle Display button and choose which method to display (see
Figure 6.13).
Figure 6.13 – Vehicle Display Window
Page 64

CHAPTER 6 LANES 63
Play/Pause/Stop Buttons
e Play, Pause and Stop buttons allow you to control the data display. When
Pause is selected, vehicles traveling on the screen will not be included in the presence, vol-
ume, speed or class sidebars. Click the Play button to add new vehicles to the running totals
for all sidebars; click the Stop button to reset all volume, speed and class numbers to zero.
Lane Adjustment
Lane performance can be adjusted by clicking anywhere inside a lane and using the Lane
Adjustment tool (see Figure 6.14). e drop-down list allows you to adjust lane volume, detection, speed, length, extension time or direction protection. To return to default settings,
select Set Defaults from the drop-down list and click the OK button. Each lane adjustment
is independent of other lanes; setting one lane back to defaults using the Set Defaults op-
tion will not aect the other lanes.
Figure 6.14 – Lane Adjustment Window
Volume – is setting should be adjusted rst when a problem with count accuracy is ob-
served. e default is 100%. is setting adjusts the aggressiveness of trac radar-specic
algorithms and is not an arbitrary scale factor. By increasing the percentage by 10% to
15%, you are likely to begin to increase the number of detection, and by decreasing the
percentage by 10% to 15%, you are likely to begin to decrease the number of detections.
Small adjustments of only 1% or 2% may actually have no impact on the detection performance. Practical values for this setting are typically between 20% and 190%. If the volume lane adjustment is below 20%, many detections in that lane will probably be missed;
if it is set greater than 190%, many false detections will probably occur.
Detection – Raises or lowers the threshold for detecting vehicles. e sensor auto-
matically determines where the threshold will be placed, and then adds in this tuning
parameter. Entering a larger number will result in fewer detections; entering a small
number will result in more detections. e default is 0 dB.
Note
Changing the detection tuning parameter can drastically eect vehicle detection.
Page 65

64 CHAPTER 6 LANES
Speed – Raises or lowers the speed calculated for all vehicles in each lane. e sensor
calculates the speed, and then multiplies the speed by this factor. e default is 100%.
Length – Increases or decreases the length for all vehicles in each lane. e sensor
calculates the length and then adds the length factor. e default is 0 (feet or meters
depending on sensor units used). Since the occupancy metric that is reported in the
interval data is calculated using length, a change in the length tuning parameter will
also change the occupancy that is reported. See page 69 for the equation that is used to
calculate occupancy and for a more detailed explanation.
Extension Time – Changes the extension time, which the sensor uses to prevent ve-
hicles with trailers from being broken into multiple detections. A longer extension time
will prevent this, but can lead to multiple vehicles being merged into a single detection.
e sensor automatically determines the extension time and then multiplies by this
factor. e default value is 100%.
Note
There must be a minimum of 5.5 ft (1.68 m) between vehicles in order for them to be
detected as separate vehicles. This separation requirement may increase as vehicle
speeds increase.
Direction Protection – Allows you to turn Direction Protection on or o. When Di-
rection Protection is on (default), data will be shown only for vehicles that are going
in the direction set for that lane. For example, if a lane is set for trac moving north,
any trac in that lane that may be moving south will be ignored. However, if the sensor determines that most vehicles are going a direction dierent from the one that was
congured (e.g. during hurricane evacuation), the sensor will begin reporting vehicles
going all directions. Turning o Direction Protection allows SSMHD to always report
data from vehicles going both directions.
Note
If a lane has been configured to be bidirectional, Direction Protection will be disabled.
Page 66

Data 7
In this chapter
Definitions
Storage
Download
Push
7
Click the Data link to set bin denitions; store and download data; dene approaches; and
push data (see Figure 7.1).
Page 67

66 CHAPTER 7 DATA
Figure 7.1 – Data Screen
Definitions
e Denitions screen allows you to set the interval length, set class and speed bins, and
group lanes together using approaches. Click the Denitions button in the Data screen to
access the Denitions window (see Figure 7.2).
Figure 7.2 – Definitions
ere are up to 8 class bins, 15 speed bins and 2 direction bins; all or none of these bins may
be simultaneously congured and the number of congured bins will impact the storage
capacity, as well as data download time. e term “bins” refers to classications of vehicles
based on their length, speed or direction. Once bins are set, data can be collected for these
groupings of vehicles; for instance, the sensor can count for you how many passing vehicles
are driving between 90 and 100 mph.
Adding more bins causes data records to be larger, meaning that your sensor’s onboard
Page 68

CHAPTER 7 DATA 67
memory lls up faster and must be downloaded from more oen. See the Storage section of
this chapter for more information on how to gure out how many days’ worth of memory
your sensor has based on its current settings.
Interval
Interval data refers to the data collected about all the vehicles that pass the sensor in a set
amount of time. is interval of time should be carefully chosen because the length of it
aects how long the sensor can store data onboard. A shorter interval means the sensor
records data more oen, which means that the sensor’s onboard memory lls up faster. A
longer interval means you can leave the sensor alone for longer periods of time. Ultimately
the interval size should be selected to meet the requirements of your application. For example, in real-time applications, onboard storage capacity may not be a concern at all and
the data may need to be aggregated over short periods of time (20 seconds) to reduce reporting latency. To set the interval, click anywhere inside the Interval eld and use the up/
down arrows to change the interval (see Figure 7.2). See the Storage section in this chapter
for more information.
Once you download the interval data, you will have the following information for each lane
or approach:
Name – Displays the name of each lane or approach. To change the name, go to the
Lane Conguration screen or the Approaches screen.
Volume – Shows the number of vehicles detected during the interval.
Occupancy – Gives the percentage of time during the interval that the detection zone
was occupied.
Occupancy is calculated by summing the durations of all vehicles in the interval and dividing that quantity by the length of the interval. For example, if the interval length is ve
minutes and 100 vehicles pass the sensor during the interval with a duration of 0.09 seconds
each (sum of the durations is 9 seconds), then the occupancy for that interval would be
calculated by dividing 9 seconds by 300 seconds, which is 3%.
Rather than using the uncalibrated detection duration, or the time that a vehicle is in the radar beam, in the occupancy calculation, a more accurate occupancy measurement is made
by rst calculating the vehicle length and then converting that to a duration by adding the
simulated loop size and dividing by the speed. Occupancy based on vehicle length is more
accurate than occupancy based on uncalibrated detection duration because the vehicle
length calculation removes the eect of the antenna beam widening as it gets farther from
the sensor. e occupancy calculation is shown in the following equation:
Calibrated Duration
1
Interval Size
*
All Vehicles in
the Interval
Vehicle Length + Loop Size
∑
Vehicle Speed
Page 69

68 CHAPTER 7 DATA
Note
A change to the length tuning parameter for a given lane will aect the occupancy for
that lane since vehicle length is used in the occupancy calculation.
Speed – Indicates the average lane speed during the interval. A negative number will be
reported for speed in the following cases: (1) e lane was congured to the le or right
and Direction Protection was on, but trac was traveling against the congured direction,
indicating that the direction of the lane has switched. is is useful in hurricane evacuation
scenarios. (2) e lane was congured to the le or right and Direction Protection was
o, but more vehicles were detected traveling against the congured direction than were
detected traveling with the congured direction for the given data interval.
Unlike per vehicle data, lanes that are congured as bidirectional will always report
positive average speeds in the interval data.
85% – Shows the 85th percentile speed. Eighty-ve percent of the vehicles in the inter-
val were going this speed or slower.
Headway – Displays the average time separation between vehicles detected during the
interval, measured from front bumper to the front bumper of the following car.
Gap – Shows the average time separation between vehicles detected in the interval,
measured from the back bumper of the rst car to the front bumper of the second.
Classes – Refers to length-, speed-, and direction-based bins (see the Speed and Class
sections later in this chapter). ese columns show the number of cars from each
length, speed and direction class that were detected during the interval.
Speed
Speed bins allow you to see how many vehicles are traveling within specied speed ranges.
You can have up to 15 speed bins. Click the button in the Speed window to set up your
speed bins (see Figure 7.3).
Figure 7.3 – Speed Bins
Here, you are assigning a minimum and maximum speed value for each bin. For example,
the maximum speed value for bin 2 is 26 mph. If a vehicle is traveling 25 mph, then that
Page 70

CHAPTER 7 DATA 69
vehicle will be placed in bin 2. If a vehicle is traveling 27 mph, then that vehicle will be
placed in bin 3.
You can change the speeds by clicking on a bin and using the +/- buttons to either increase
or decrease the value.
Class
e class bins allow you to classify vehicles by ranges of lengths. If you’re not sure what
lengths to use, consult your own agency’s guidelines. If your agency has no set classication
scheme, you can look to the measurements in Table 7.2 as an example; the tables show a
scheme called Scheme F, developed by the Maine DOT.
6 Classification Bins
Lengths Scheme F
4 Classification Bins
Lengths Scheme F
0–10 1
10–19 2, 3
19–35 4, 5, 6
35–256 7-13
0–10 1
10–19 2
19–24 3
24–54 4, 5, 6, 7
54–109 8, 9, 10
109–256 11, 12, 13
Table 7.1 – Scheme F Length Classifications
Approaches
Approaches are groupings of lanes used in data collection. Using approaches allows you to
collect per vehicle–based statistics that you could not otherwise get, such as the 85th percentile speed for all northbound lanes, and to store these statistics onboard the sensor. Be
aware that adding approaches will increase the size of your data reports, which will aect
the number of these reports your sensor can store in its onboard memory. See the Storage
section of this chapter for more information.
Click the button in the Approaches window to group lanes together in four dierent
approaches (see Figure 7.4).
Page 71

70 CHAPTER 7 DATA
Figure 7.4 – Approaches
Approaches are used in interval data and will contain the same type of information that
each lane would. An advantage to using approaches rather than post-processing individual
lane data is that approaches gather aggregate data. An example of when this would be useful
is in determining speed limits. Using approaches, the sensor could nd the 85th percentile
speed for all cars in all lanes going one direction, rather than nding it for each lane.
When lanes of diering directions are used, the absolute value of the speed is used to calculate all speed elds. Also, the Right and Wrong direction bins will contain the total number
of vehicles traveling with the user-dened direction of the corresponding lanes in the Right
bin, and all others in the Wrong bin (see the Direction section below).
To create an approach, select the desired lanes and click the button. Each approach can
be named to coincide with the purpose of the approach.
Direction
e direction bins are congured as Right and Wrong. is refers to whether vehicles in a
given lane are traveling in the direction the lane is congured (to change lane direction, use
the lane window in the Conguration screen). is is most useful in the case of reversible
lanes, where trac goes dierent directions in a lane depending on the time of day. In this
case, for part of the day the vehicles would be counted in the Right bin; during the other
part of the day, the vehicles would be counted in the Wrong bin.
To enable direction bins, check the Direction checkbox.
If volume = 0, speed = 0
If during an interval, the volume is zero (meaning no cars were detected), SSMHD will report the average speed of the last interval. If you would like the intervals that are reporting
zero volume to report speeds as zero, simply check the If volume = 0, speed = 0 checkbox.
Page 72

CHAPTER 7 DATA 71
Note
When NOT using If volume = 0, speed = 0 feature, then if the volume in the interval
is zero, and the occupancy is less than 20%, the speed in the interval will be the speed
of the previous interval. If the volume in the interval is zero, and the occupancy is
more than 20%, the speed in the interval will be zero.
Storage
e Storage window allows you to turn on/o data storage; see a storage timeline, the storage level and the amount of storage space remaining; and clear all storage on the sensor (see
Figure 7.5).
Figure 7.5 – Storage
Use the On/O switch to turn the sensor’s data storage feature on or o. If you check the
Stop when FULL checkbox, the sensor will stop storing data once the storage capacity is
reached, and consequently all new data will not be saved to memory.
e status section shows the date and time that the rst and last interval data packet was
stored and how much storage is remaining by both a status bar and a percentage. e Total
and Remaining elds show how long the sensor has been storing data and how long the sensor will continue to store data before reaching maximum capacity. e capacity is tracked
in months, days, hours, minutes and seconds and is based upon the current sensor conguration. e total number of intervals stored is dependent upon the number of congured
lanes, approaches and bin data types.
If data is stored with a dierent number of lanes, approaches or bin data types from the
current sensor conguration, the Tot a l eld will be incorrect. In this case, the green status
bar is a better indicator of storage capacity. Additionally, using a virtual connection will also
cause the information in this screen to be incorrect.
Page 73

72 CHAPTER 7 DATA
Note
Some of the settings discussed in this chapter can aect the storage capacity of
your sensor. Changing such data collection settings as the length of the interval for
collecting interval data and the number of bins and approaches configured will aect
how many reports your sensor can store onboard (see Table 7.2 for examples). Always
check back to the Storage screen after you have changed all other settings to get the
most accurate information on how often your sensor will need to have information
downloaded from it.
Interval Lanes &
Approaches
20 sec 4 4 0 17 days
20 sec 12 4 0 6 days
20 sec 12 4 10 3 days
15 min 4 4 0 25 months 29 days
15 min 12 4 0 9 months 26 days
15 min 12 4 10 5 months 3 days
1 hour 4 4 0 103 months 29 days
1 hour 12 4 0 39 months 15 days
1 hour 12 4 10 20 months 13 days
Table 7.2 – Examples of Onboard Storage Time Based upon Configuration
Class Bins Speed Bins Onboard Storage
Capacity
Aer clicking the eraser icon, you will be prompted to conrm the delete. Once data storage
is deleted, it is not recoverable. Before deleting the data, it is recommended that you use the
Download tool to store a copy of the data on a PC or laptop.
Download
e Download screen allows you to specify the time period for which stored data will be
retrieved and the location where it will be saved to a le (see Figure 7.6).
Page 74
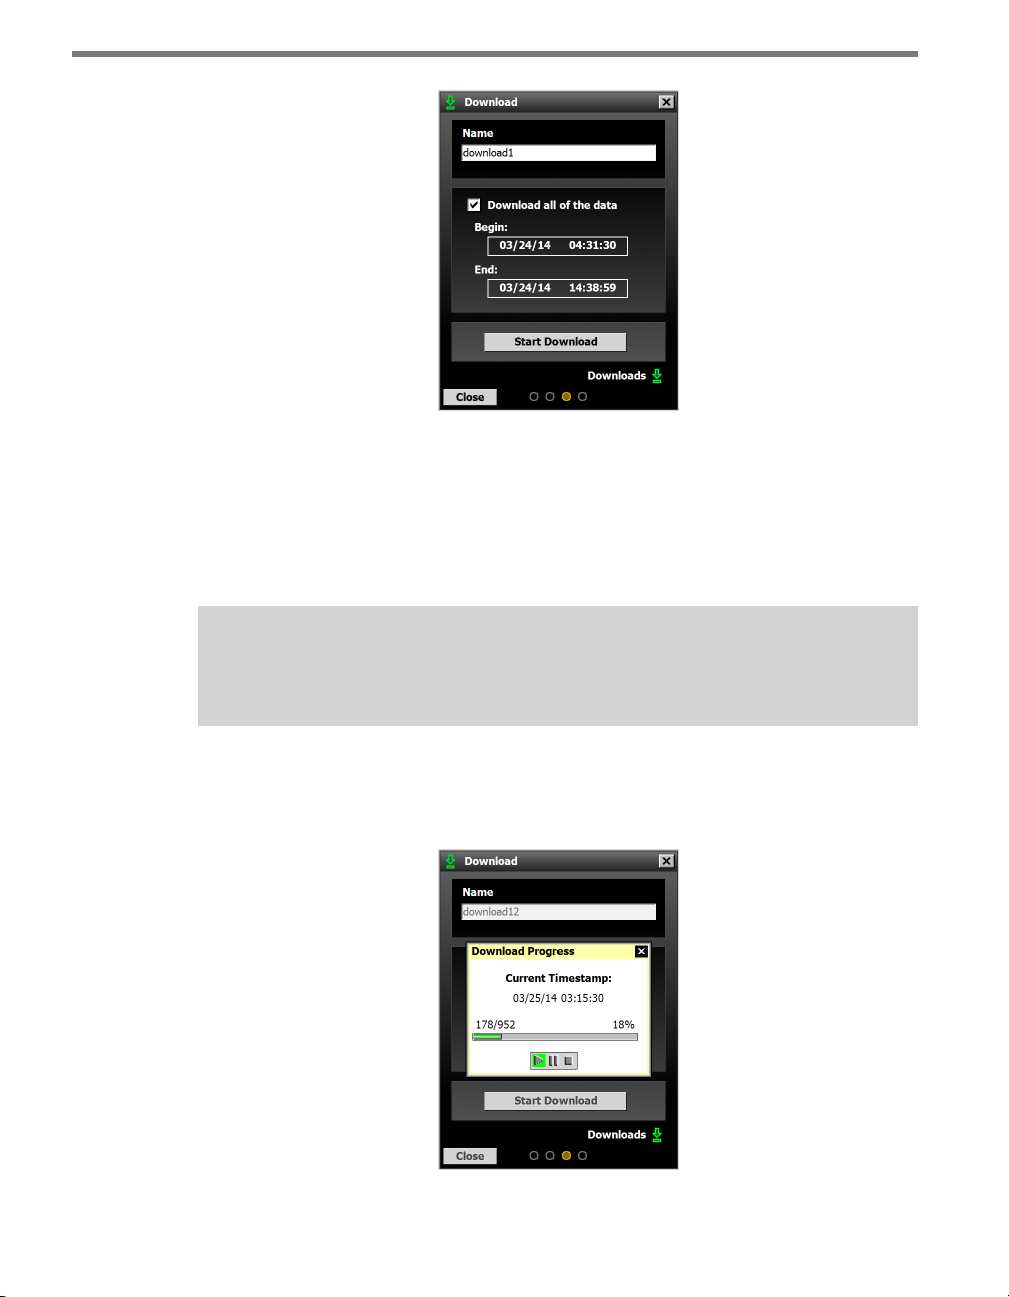
CHAPTER 7 DATA 73
Figure 7.6 – Download
Enter a le name in the Name eld. To download all data on the SmartSensor HD, click the
Download all of the data checkbox.
Click anywhere in the Begin and End elds to select the beginning and ending dates/times of
the download. SSMHD also keeps a record of the last interval downloaded from each sensor.
Note
Downloading all the data may take several hours.
Once you click the Download button, a Download Progress window will appear. You can
stop or pause the download at any time by using the buttons on the bottom of the window
(see Figure 7.7).
Figure 7.7 – Download Progress
Page 75

74 CHAPTER 7 DATA
Once SmartSensor Manager HD is nished downloading data from the sensor, a window
will appear showing information about the download (see Figure 7.8).
Figure 7.8 – Download Complete
You can view and export the data into the following three dierent le formats:
Comma Delimited ASCII text le
Microso Excel le
Traditional Wavetronix format (see Figure 7.9)
Figure 7.9 – Data Format
Wavetronix Command products can also retrieve interval data directly into an SQL database.
Push
Use the data push function to set your sensor to periodically push data to your computer
without waiting for a request from SSMHD. Click the Push button on the Data window to
access the Push window (see Figure 7.10).
When data push is required for use with a Click device, it is automatically congured by the
Click device during its autobaud process. If data push is required for any other use, it must
be manually congured.
Page 76

CHAPTER 7 DATA 75
Figure 7.10 – Data Push
To enable data push, select the Event, Interval or Presence tab, then select which method
of communication and format you are using and turn the function on by checking the En-
abled checkbox.
Port
is allows you to select the SmartSensor HD communications port through which the
data will be pushed. If the sensor is pushing data on a half-duplex communication port, the
sensor may not respond to commands due to collisions on the communications bus.
Note
SmartSensor HD's native RS-232 and RS-485 ports are both half duplex.
Format
e following formats are available for all three data types:
HD Format – is outputs the data in the native SS125 format (see the SmartSensor HD
Released Communications Protocols document for information on this format).
SS105 Simple Format – is outputs the data in the SSHD SS105 emulation format
without a multi-drop header (see the SmartSensor HD Released Communications Pro-
tocols document for information on this format).
SS105 Multidrop Format – is outputs the data in the SSHD SS105 emulation format
with a multi-drop header (see the SmartSensor HD Released Communications Protocols
document for information on this format).
For Event Data, there are ve additional format options. All of them output the data in Z4
format. Z4 is a Wavetronix-specic protocol that allows sensors to talk to other Wavetronix
Page 77

76 CHAPTER 7 DATA
devices, such as Click contact closure devices. e specic formats are as follows:
Z4 2-Loop – With this format, speed and duration are measured using the loop size
and space determined on the Loop Emulation page.
Z4 1-Loop – With this single-loop format, only duration can be determined.
Z4 2-Loop Pulsed – With this format, the outputs will be held active for 125 ms for
each vehicle detected, so only speed will be measured.
Z4 1-Loop Pulsed – is format is simply a presence detector (no speed or duration
information).
Z4 1-Loop Speed – is single-loop format has a set vehicle length of 15 feet, so the
focus is on speed.
For Interval Data, there are two additional formats:
HD (legacy) – is format emulates the interval data from older versions of the Smart-
Sensor HD; it is similar to the current format but lacks speed bins and direction bins
and has fewer length-based classes.
RTMS Format – is format is only available in the Interval Data push conguration
and will output the data in the SSHD RTMS emulation format (see the SmartSensor
HD Released Communications Protocols document for information on this format).
For Presence Data, there is one additional format:
Z4 Presence – is outputs data in the Z4 format.
Destination
is is the address the sensor will push data to and is only valid for HD and Z4 formats.
For HD format, it is the 8-bit subnet / 16-bit ID, and for Z4 format it is a 24-bit address.
Any value up to 255/65535 for SS125 format or 16777215 for Z4 format is valid, but make
sure that this destination address is unique for the communications bus in use. Checking
Broadcast will push the data to the broadcast address (000/65535 for SS125 and 16777215
for Z4). e HD communications protocol reserves subnet/ID 000/00000 for soware applications. e subnet/ID should be set to 000/00000 if the SmartSensor HD is pushing data
to a custom soware application.
8
Page 78

Tools 8
In this chapter
Backup-Restore
License
Power
9
e Tools section allows you to backup sensor data, view the sensor's licensed features, and
reboot the sensor (see Figure 8.1).
Figure 9.1 – Tools
Page 79

78 CHAPTER 7 DATA
Backup–Restore
Access Backup/Restore by clicking the Backup/Restore button on the Tools screen (see
Figure 8.2).
Figure 9.2 – Backup/Restore
Back-up File
e backup function allows you to backup the sensor settings you have changed. To create a
backup, click on the magnifying glass icon in the Backup File section. Choose a destination,
type in a lename, and hit OK, then click the Back-up Sensor Setup button.
Note
The backup will appear as an .ssc file. While this file can be opened as a text file by
using a program such as Notepad, do not edit the file, as it will change the settings
you backed up.
Restore File
e restore function allows you to restore a set of sensor settings you have backed up. To
restore, click on the magnifying glass icon in the Restore File section. Select the backup le
you wish to restore, hit OK, and then click the Restore Sensor Setup button.
Page 80

CHAPTER 8 TOOLS 79
Warning
Restoring sensor settings will cause you to lose the settings you currently have, unless they are backed up.
To restore the sensor to factory default settings, click the Restore Factory Setup button.
License
e Licensed Features window contains all of the current conguration features that are
inherent to the sensor:
Figure 9.3 – Licensed Features
Serial Number – Shows the serial number of the sensor.
License Date – Shows the date the sensor was licensed.
Features – Lists features inherent to the sensor and shows the status that has been
licensed for each feature.
Note
For more information on each feature, see the earlier chapters in this book.
License File – In the future this eld will be used to upgrade licensed features, but for
now it can be ignored.
Page 81

80 CHAPTER 8 TOOLS
Power
e Power screen shows you the last time the sensor was powered up and powered down,
and when the sensor was last rebooted (see Figure 8.4).
Figure 9.4 – Power
To reboot the sensor, click the Reboot button.
Page 82

Appendix
In this chapter
Appendix A - 10-pin Connector
Many newer SmartSensor HD installations have a 10-pin connector for attaching the cable;
this connector is used exclusively with the 8-conductor cable. is cable is composed of
eight conductors plus a drain wire, all surrounded by a shield. See Figure A.1 for a diagram
of the 8-conductor cable’s 10-pin socket assignment. e codes listed in the diagram are to
be used to solder wires into the back of the plug where the letters represent the individual
solder cups.
Appendix A - 10-pin Connector
Appendix B - 26-pin Connector
Appendix C - Cable Lengths
Appendix D - Direct Serial Connections
Appendix E - Signaling Delays
Page 83

82 APPENDIX SMARTSENSOR HD USER GUIDE
K=11
connector)
A=1
-DC
Black
E=6
-485
Blue
J=9
232 CTS
Brown
B
NC
C=9
232 RTS
Orange
D=5
Drain/
shield
H=7
+DC
Red
G=10
232 TX
Yellow
Blue/White
Figure A.1 – 10-pin Plug Connector Socket Assignment (seen from the solder cup side of the
232 RX
Violet
F=12
+485
Appendix B - 26-pin Connector
Certain SmartSensor HDs, including the HD legacy, the retrotted HD, and the limited
lane and feature versions, have a 26-pin connector. You can order this connector on two
dierent cables:
e 8-conductor cable, which is the same cable mentioned above; it can be ordered
with either the 10-pin connector or the 26-pin connector.
e 9-conductor cable. is cable is composed of three groups of wires, each contain-
ing color-coded wires and a drain wire surrounded by a shield.
See Figure B.1 for a diagram of the 9-conductor cable’s 26-pin socket assignment. e codes
listed in the diagram are to be used to solder wires into the back of the plug where the letters
represent the individual solder cups.
Page 84

APPENDIX SMARTSENSOR HD USER GUIDE 83
A=1
N=13
232 CTS
Brown
M=12
232 TD
Yellow
L=11
232 RD
Violet
P=14
232 RTS
Orange
K=10
232 GND
Gray
a=24
NC
Z=23
NC
R=15
NC
Y=22
NC
+DC
Red
S=16
NC
b=25
NC
c=26
NC
X=21
NC
J=9
NC
T=17
NC
H=8
-485
Blue
B=2
-DC
Black
W=20
NC
U=18
NC
V=19
NC
G=7
485 GND
& Drain
C=3
NC
D=4
NC
E=5
NC
F=6
+485
White
Figure B.1 – 9-conductor cable Plug Connector Socket Assignment (seen from the solder cup
side of the connector)
e 8-conductor cable is nearly identical. e dierences are as follows:
e +485 conductor in the cable (assigned to pin F above) is striped white and blue,
instead of the plain white found in the 9-conductor cable.
ere's no gray ground cable, meaning nothing is assigned to pin K.
Instead of three drains, one for each wire bundle, the 8-conductor cable has a single
drain wire, but that drain wire does not terminate into any of the pins.
Appendix C - Cable Lengths
e following recommendations allow you to provide reliable power to the SmartSensor
HD.
Page 85

84 APPENDIX SMARTSENSOR HD USER GUIDE
Note
These instructions apply to both the 8-conductor cable and the 9-conductor cable.
e 9-conductor/8-conductor cables’ DC (red and black) wires are a 20 AWG wire pair.
e other wires in the cable are 22 AWG and are used for communication, as detailed in the
earlier appendices.
Cable Gauge 24 Volts 12 Volts
20 AWG 600 ft. (182.9 m) 110 ft. (33.5 m)
Additional 22 AWG Add 400 ft. (121.9 m) Add 75 ft. (22.9 m)
22 AWG 400 ft. (121.9 m) 75 ft. (22.9 m)
Additional 22 AWG Add 400 ft. (121.9 m) Add 75 ft. (22.9 m)
14 AWG 2500 ft. (762 m) 450 ft. (137.2 m)
12 AWG 3900 ft. (1188.7 m) 700 ft. (213.4 m)
10 AWG 6000 ft. (1828.8 m) 1050 ft. (320 m)
8 AWG 9900 ft. (3017.5 m) 1750 ft. (533.4 m)
6 AWG 14,000 ft. (4267.2 m) 2500 ft. (762 m)
Table C.1 – Maximum Cable Length for Power
If the cable length is longer than 600 . (182.9 m) when operating at 24 VDC, it is possible
to increase the maximum cable length by wiring a pair of lines normally used for RS-232
communications with the red and black wires.
In many cases, if the cable length is 200 . (61 m) or greater you cannot reliably use RS-232
communications. To add 400 . (121.9 m) and achieve a maximum cable length of 1000
. (304.8 m), connect the orange wire (normally RTS) to the red wire and the brown wire
(normally CTS) to the black wire.
If your cable run is longer than 1000 . (304.8 m), it is possible to sacrice additional communication pairs to increase the maximum cable length for power. However, you may desire to communicate to the sensor over two independent channels, in which case you will
need to consider an alternate cable for power. e AWG for wire pairs that achieve a 2000
. (609.6 m) maximum cable length or greater at 12 and 24 VDC are listed in Table A.1.
To achieve reliable wired communications, the selected baud rate must be compatible with
the length of the cable run. Table C.2 below shows the cable length recommendations for
wired communications:
Page 86

APPENDIX SMARTSENSOR HD USER GUIDE 85
Baud Rate (bps) RS-232 RS-485
115200 40 ft. (12.2 m) 300 ft. (91.4 m)
57600 60 ft. (18.3 m) 600 ft. (182.9 m)
38400 100 ft. (30.5 m) 800 ft. (243.8)
19200 140 ft. (42.7 m) 1000 ft. (304.8 m)
9600 200 ft. (61 m) 2000 ft. (609.6 m)
Table C.2 – Maximum Cable Length for Wired Communications
To provide two independent communication channels with a homerun cable length over
200 . (61 m), convert the RS-232 data into RS-485 using a Click 304 in a pole-mount
cabinet mounted next to the sensor. In this case, the homerun connection establishes one
RS-485 channel over the normal white/blue wire pair and another RS-485 channel over the
yellow/violet wire pair. An additional Click 304 is needed to convert the data sent over the
yellow/violet wire pair back to RS-232 before connecting to surge protection.
If you elect to use an alternate cable for power, you may also want to select an alternate cable
for RS-485 communications. For example, the Belden 3105A (Paired – EIA Industrial RS485 PLTC/CM) is a good alternate for the RS-485.
ere are many reliable options available for wiring power and communication connections (see Table C.3).
Length Cable Comm. Channel 1 Comm. Channel 2
0–200 ft. (0–61 m) 9-conductor or 8-con-
ductor Cable
200–1000 ft.
(61–304.8 m)
1000–1400 ft.
(304.8–426.7 m)
1400–2000 ft.
(426.7–609.6 m)
Table C.3 – Cable Length Options
9-conductor or 8-conductor Cable
9-conductor or 8-conductor Cable
Alternate power and
communications cable
Native RS-485 Native RS-232
Native RS-485 Click conversion of
RS-232 to RS-485
Native RS-485 N/A
Native RS-485 Click conversion of
RS-485 to RS-232
Appendix D - Direct Serial Connections
For most applications, the service end of the 9-conductor or 8-conductor cable terminates
in a surge protection device. However, during demonstrations, troubleshooting and certain
other situations, it is sometimes convenient to bypass surge protection and connect directly
to a personal computer or communications device such as a modem.
e sensor is congured as an RS-232 DTE device. To connect the 9-conductor or 8-conductor cable’s RS-232 wires directly to another DTE device (such as a PC), you can use a standard
Page 87

86 APPENDIX SMARTSENSOR HD USER GUIDE
9-pin D connector and a null modem cable. To connect directly to a DCE device (such as a
modem), you will need a straight-through cable. Figure D.1 illustrates both of these cases.
Connector
Null Modem Cable
Power
Wires
OR
RS-485
Wires
Straight-through Cable
Figure D.1 – Direct Serial Connections
DTE Device (PC)
DCE Device (Modem)
Note
If you do not have the right type of RS-232 physical connection you will not be able
to connect using the SmartSensor Manager software. Since null modem cables and
straight-through cables look similar, you may want to label them. Alternatively, you
may want to use a null modem adapter instead of a null modem cable. If you do,
you can turn your straight-through cable into a null modem cable by attaching the
adapter on one end.
If you wish to connect the 9-conductor cable’s RS-485 wires directly to a PC or modem, this
will require that these devices natively support RS-485 communications. Oen, modern
personal computers do not support RS-485 communications and support USB communications instead. If your computer only supports USB communications, you may want to use
a USB converter to make a direct connection.
Appendix E - Signaling Delays
Signaling delays vary depending on what equipment is used. ese delays may aect decisions about where to install the sensor in relation to other equipment in cases where timeliness in communication is necessary. e following is information about SmartSensor HD
signaling delays.
Page 88

APPENDIX SMARTSENSOR HD USER GUIDE 87
Total signaling delay from front of vehicle = sensor delay + communications delay + contact
closure delay, where:
Sensor delay = 1 second + (vehicle length in )/(vehicle speed in fps)
Communications delay = ((10/8) * 34 bytes) / (baud rate in bps)
Contact closure delay for Click 512 = essentially zero
Contact closure delay for Click 172/174 = detected duration + (eective virtual loop
length in )/(detected vehicle speed in fps)
Page 89

www.wavetronix.com
 Loading...