

Page 1
REVISION 1.1 JAN 2001
1996 WAVECOM INSTRUMENTS PTY LTD
Product Developed by
Wavecom Instruments Pty Ltd
45 Charles St Norwood S.A.
Ph 08 8331 8892
Fax 08 8331 3648
E-mail: admin@wavecom.com.au
www.wavecom.com.au
Page 2

INDEX
File:
Connection Options
Graph options
Directory options
Logger:
Connect
Disconnect
Setting
logger
Date Time
About
DownLoad:
Present Values
Sags & Swells
Analysis:
Sags & Swells
Contents
Log
Log
Help
2
Page 3
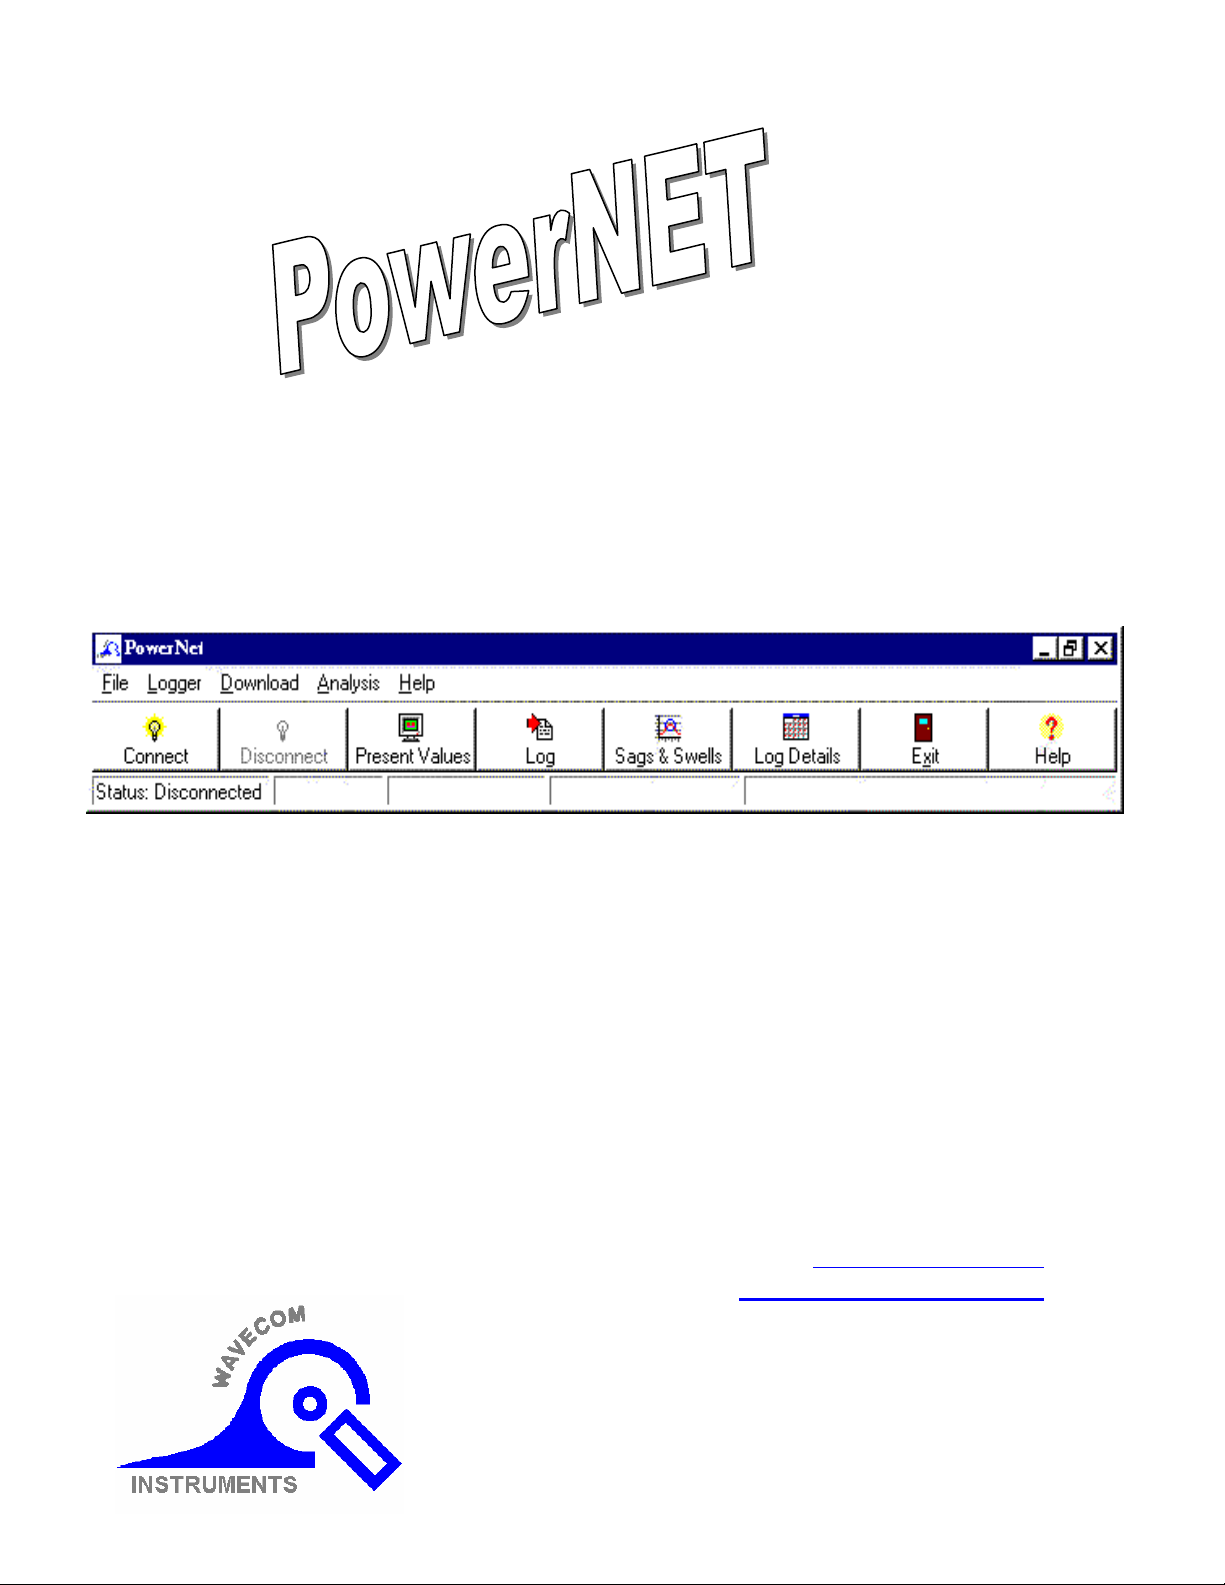
Power Net Main Menu
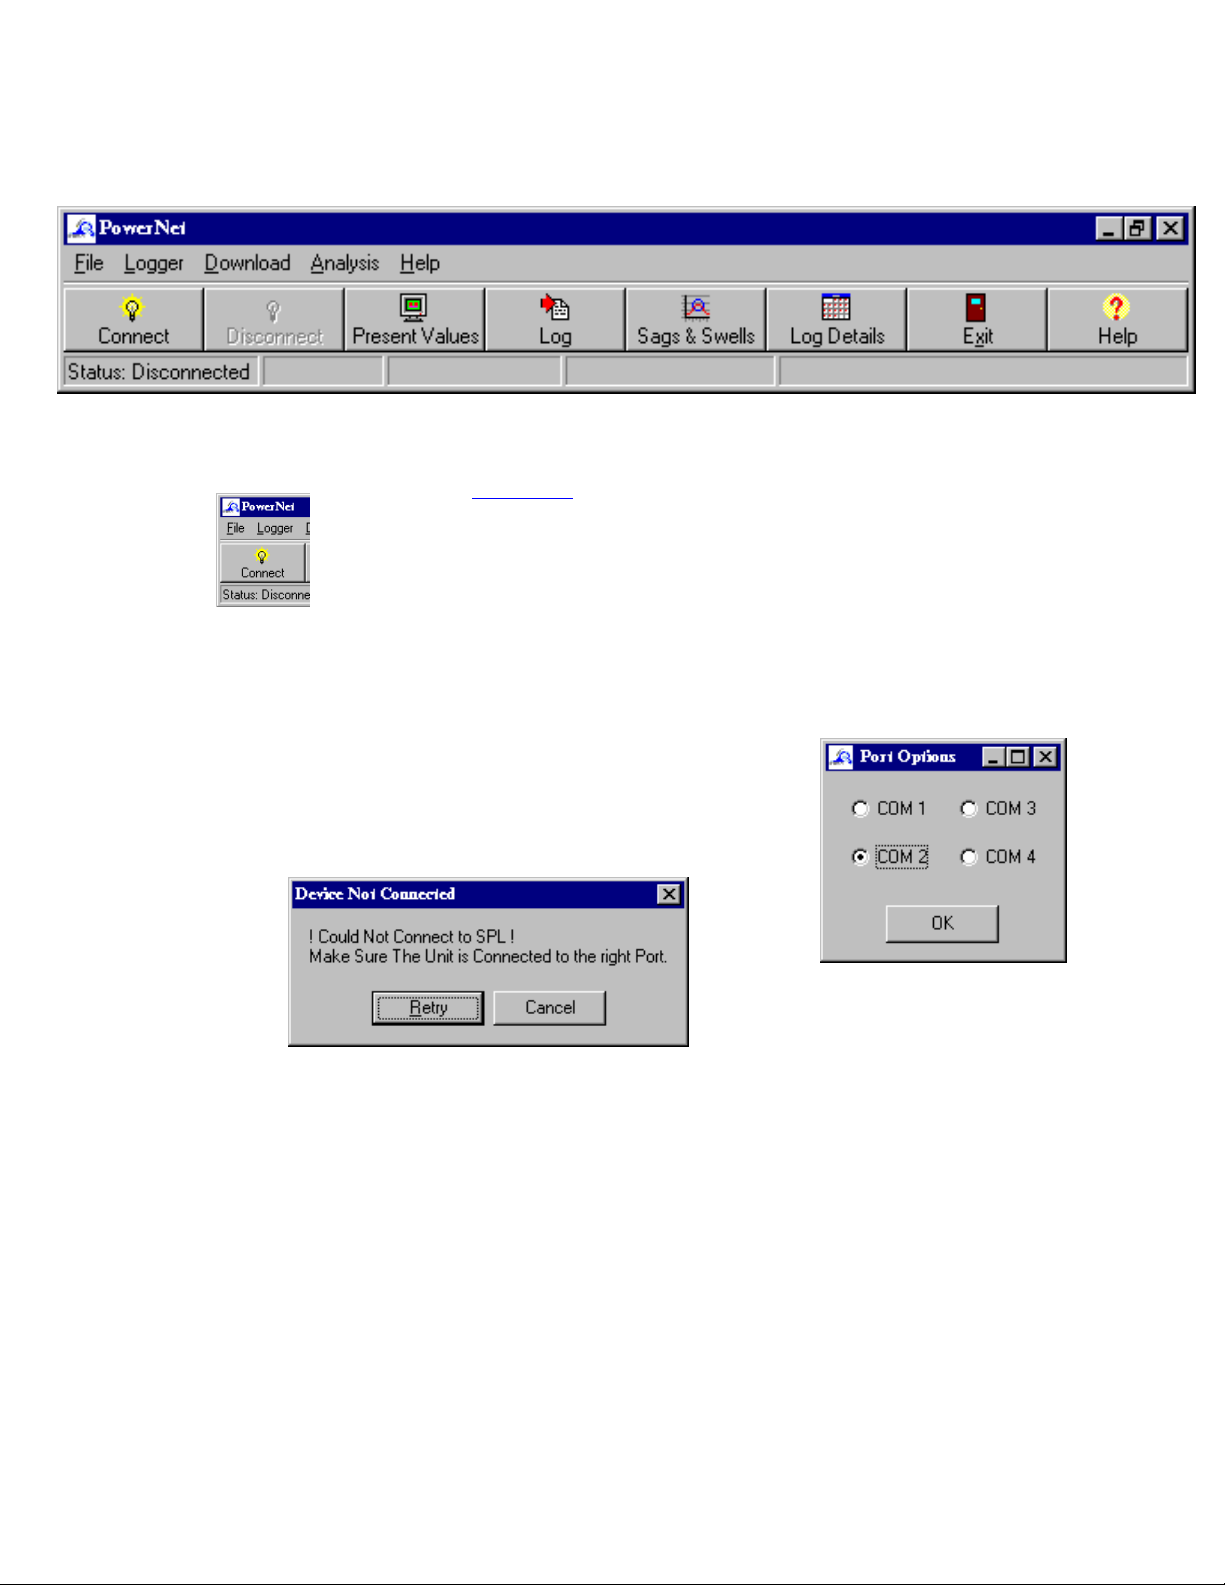
1 Set port setting by selecting one of the four comm ports. This port
setting will vary from PC to PC once set the settings will remember
next time program is used.
2 The computer will automatically take the SPL to its fastest baud rate, this will depend
on the PC, Max speed 36800. Min 9600 baud
3 (if faster baud rates have be achieved previously press disconnect then re –
connect. Sometimes the optimum speed is not all ways
achieved first time.
I f port settings incorrect or PC unable to find SPL the following
error appears.
Note: The SPL will not log data in its internal memory while attached and operating with
a PC.
On line logging can only be made with a PC connected to the SPL and stored to a file on
the PC, these time are logged depending on frequency of updateing in the Present value
menu.
Connecting
the SPL
3
Page 4
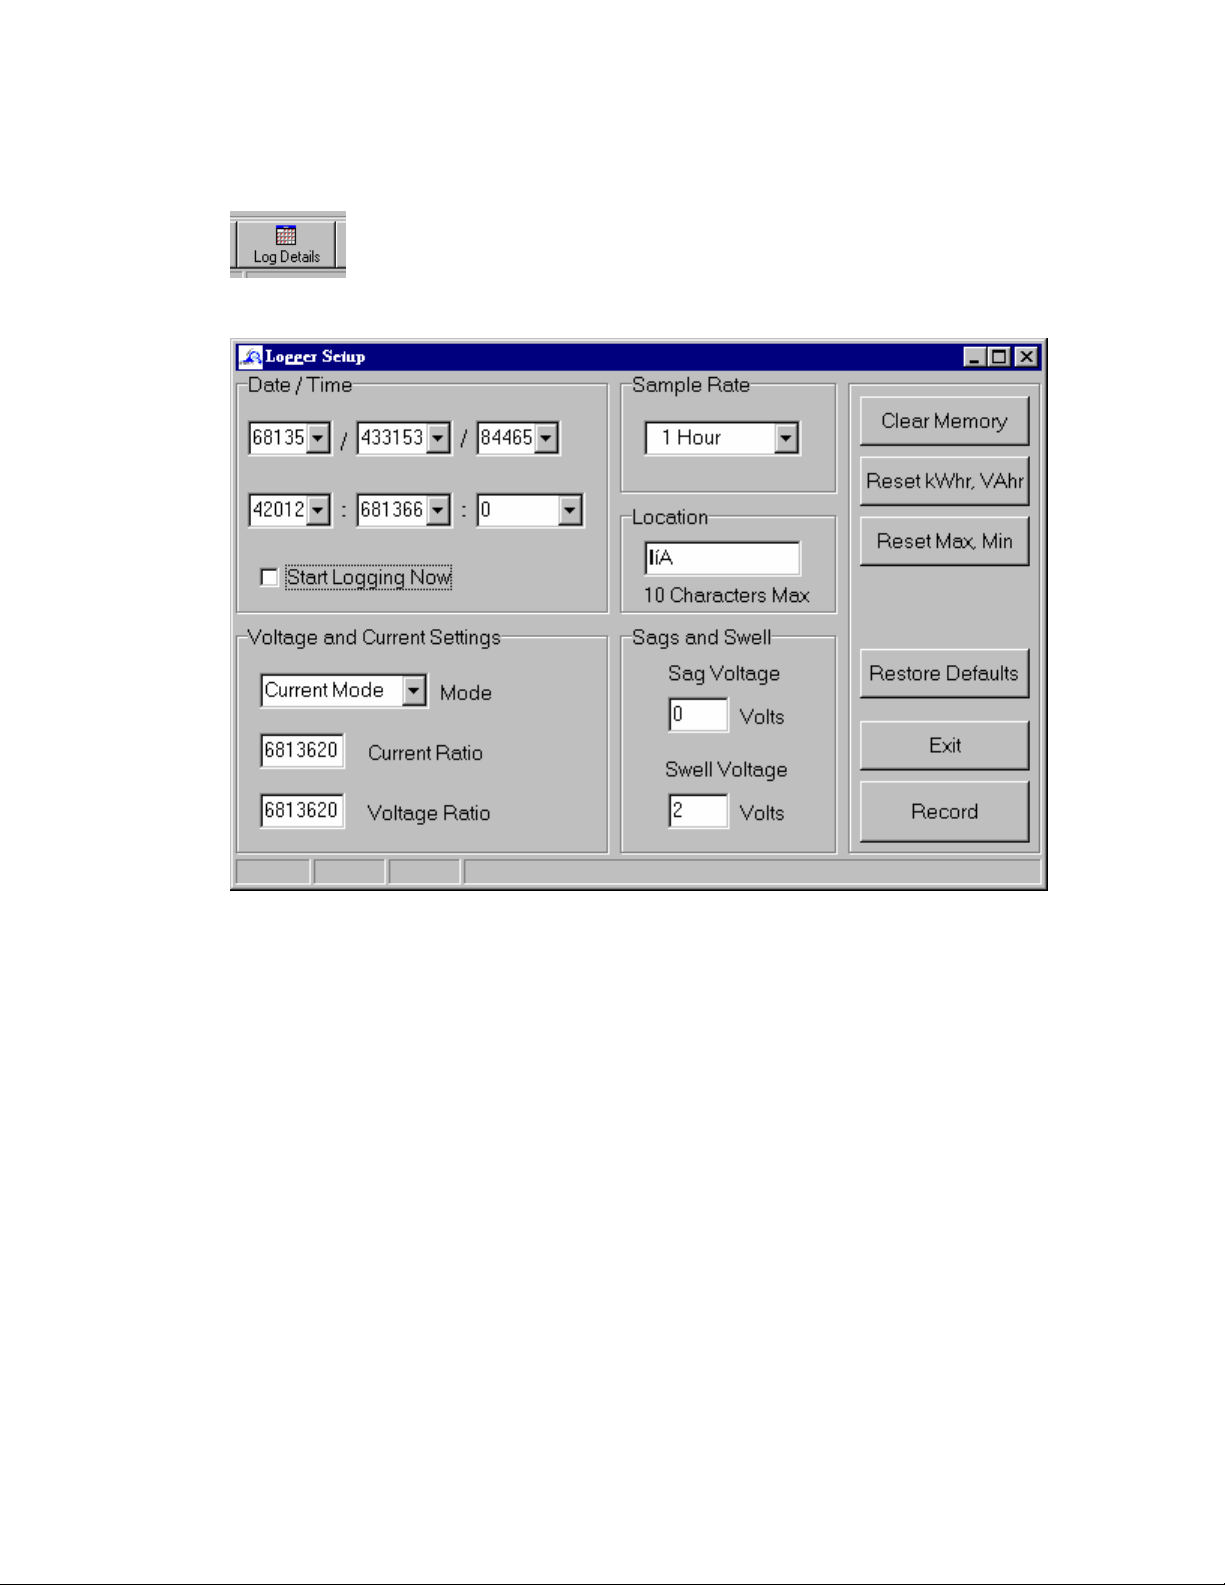
Setting The SPL
Date / Time
This field enables the user to set the date and time in the SPL for a future logging period.
This logging period is only if the operator wishes to record from a specific time. The SPL
will log data continuously at the set intervals set by the sample rate as a default.
Sample rate:
The sample rate is the rate the data is stored at. The SPL samples the Voltage and
current at a continuos rate of approx 11Khz per channel then averages the voltage and
current over the time interval set by the data collecting storage rate “sample rate”.
Location
The location is a max of 8 characters. This is for setting the location to identify where the
reading was taken.
The Location can be altered in the SPL if it is moved from one location to another
between data downloads. It creates a new header so the the data can be identified
when down loaded for separation to a different file if required for post analysis.
4
Page 5

Voltage and Current Settings
Current mode enable the user to select the multiplier range of the SPL the factory set
values are selected in from the drop down menu. However any value multiplier not in
the drop down menu can be set. E.G. 17
This will multiply the current ratio selected by the current ratio box by 17.
Voltage ratio enable the user to multiply the voltage by a value if the voltage supply is
ratio-metric to the supply/ feeder supply. I.E. 110KV vt ratio 100/1.
Sags / Swell
This menu enables the user to set the values they determine the level of a sag or swell
to occur in the voltage setting. When the set value of as sag is exceeded ie level set
to200v and the voltage dips to 199 for one full cycle the SPL will record the time and
duration =number of cycles of the event.
The same happen for a swell if the Swell value is set to 250V and the Voltage reaches
251V on a cycle an event is recorded.
A total of sags and swells is displayed in the sag swell menu screen of the SPL.
Memory Clear
Resets the memory of all the recorded data in the SPL
NOTE if the data is important to you and you have not saved it to a file DO NOT Press
THIS BUTTON.
Reset KWHR
This button resets the total of the KWHR readings made since the last time it was
cleared.
Reset Max Min
Reset MAX Min this resets the displayed Max & Min values in the SPL menus i.e.
voltage, current,
Restore Default
This button resets the SPL to the factory default settings.
Location = Norwood
Voltage = V x1
Current = A x1
Memory = 0% full
All Min / Max reset to 0
Sag Limit =225V
Swell Limit = 255V
Events 00 L 0 H 0 Cycls
Start Log Delay = 00 00 0000 00:00
Average Period 60 minute
EXIT
Closes this Menu program taking the user back to the previous screen
5
Page 6

RECORD
When the user has set all the values they wish to change in the SPL the record button
will send the changes to the SPL provided the unit is on and connected.
6
Page 7
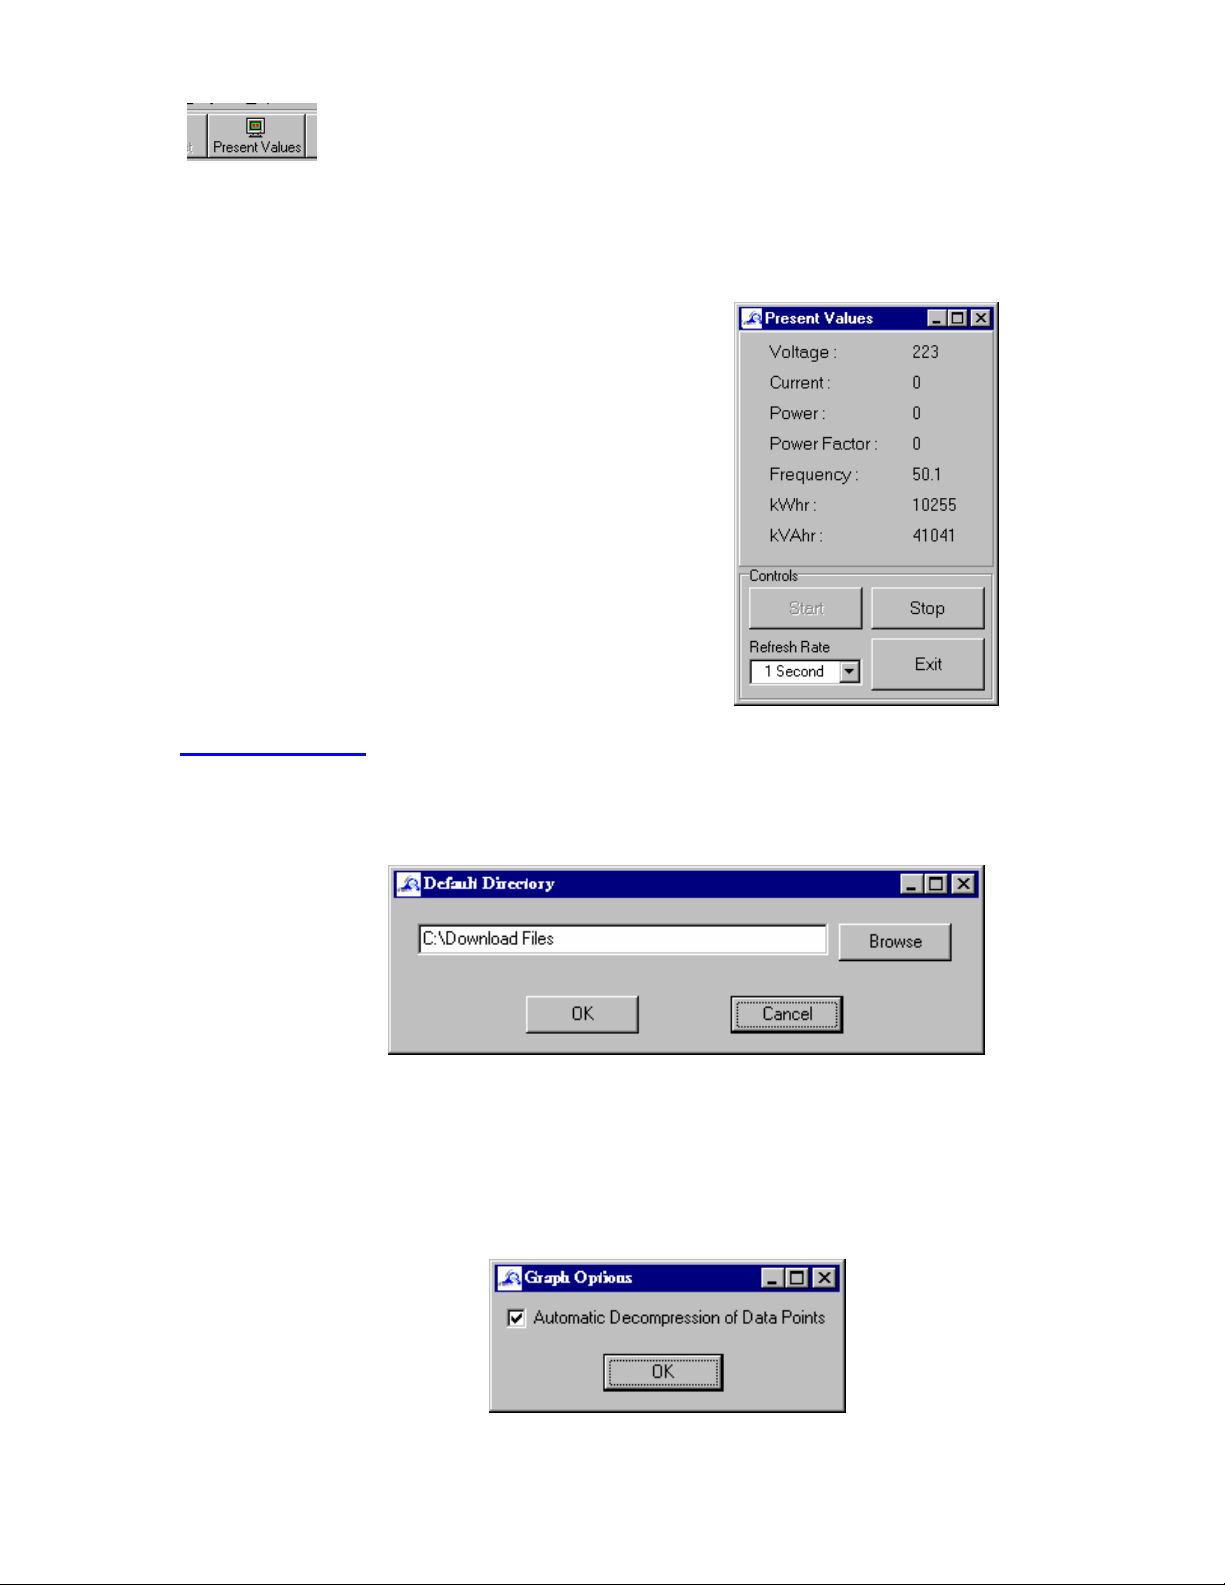
Present Values
This menu box displays the live values of the SPL when connected. This is updated at
the set refresh rate in the controls menu. The start button enable the live values. The
Stop buttons disables the live update. The EXIT closes the box and takes the user back
to the previous menu.
Directory Options
Default directory
This provides a default directory file path for storing files. This saves looking for long file
paths if file need to be stored on network systems.
Graph options
If selected a compressed image is displayed on the screen, this is particularly useful
when the data files are large and a faster refreshing of the graph is required. The
detailed data point are shown when graph is zoomed in. All data is stored in the file this
compression is for display purposes only. When Graph is zoomed all data point are
displayed for the selected area.
7
Page 8

LOG TABLE
The Log table holds all the data from the SPL, Storing the data column format allowing
for easy sorting and graphing.
Sags And Swell Table
This table displays the
download information of
the recorded voltage
sags and swells. The
date and time of the
event the voltage level
and how long the event
lasted. In mS (Milli
seconds)
8
Page 9

Data Display Graphing.
The down loaded data can be displayed when the Graph button is selected the operator
is then prompted to select the file stored.
The data down loaded from the SPL displayed in the download table will be displayed
when the graph button is pressed. If the data compression is selected in the main menu
the graph displayed is representative display of the data. If detailed data is required the
user can zoom in by holding the mouse button and then dragging the mouse over the
area to zoom in to . To un-zoom hold the left mouse button down and drag from
right to left and then release the button and the display will go to the default graph.
The program automatically Scales the Current and voltage scale on the graph when zoomed.
These values are displayed on the left and right of the graph. Re-set zoom but also returns the
screen to default.
Cursor
The cursor function provides the user with on screen values as the cursor is dragged along. The
measured values are displayed in the display box. The cursor can be left to display at any point
along the graph by double clicking on the spot where user desires to leave cursor.
To reactivate the cursor the user must click on the cursor button. Simply click on the cursor bar
with left mouse button and resume dragging it to new desired position.
The active cursor display shows the value of the voltage, current, date and time to the second.
9
Page 10

Time per page/Graph
The time per page drop down box allows the user to divide the recording into preset time
intervals. These time intervals can then be scrolled through by using the next button or the
previous button to scroll back.
The Time intervals are 1hr, 1 day, 3days 1 week,
Test notes Voltage at cursor point
Current At cursor point
When Zoomed the current and voltage scales are scaled automatically. As the zooming increases
the more detailed data points appear. These data points will show the sag and swell indicators if
there is data .
The Zoomed graph can also further display cursor details by using the cursor control as
previously detailed.
Page numbers if the data is divided into timed charts the program will divide the data into the
appropriate pages. This value also gives the user an indication of how many pages the data
could be printed on for detailed hard copies.
Specific notes are displayed from the user entering information in the notes box which appears
immediately after download is complete.
10
Page 11

Max & Mins
This functions allows the user to quickly select max & mins for the whole down load or the per
24hour period starting from midnight.
Using the Date & time facility the user can divide the data even further if required to select a
custom period.
11
 Loading...