

Page 1

OPERATOR MANUAL
WMB-3230
WMB-5230
Doc. P/N: WSP-009-008
Version: V1.3
Issue Date: April 2014
Page 2

Document Revision History
Revision Date Reason for Change Version
27 February 2013 WMB-X230 Operator Manual First Revision v1.0
28 April 2013 Changes for WMB-X230 v1.1 software release v1.1
12 June 2013 Updated Key Pulse Information v1.1a
11 December 2013 Updates for WMB-X230 software v1.2 v1.2
16 April 2014 Updates for WMB-X230 software v1.3 v1.3
Disclaimer
WASSP LTD. RESERVES THE RIGHT TO CHANGE THIS MANUAL WITHOUT NOTICE. ALTHOUGH WASSP LTD.
HAS MADE EVERY EFFORT TO ENSURE THE INFORMATION IN THIS MANUAL WAS CORRECT AT PUBLICATION
TIME, WASSP LTD. DOES NOT ASSUME AND HEREBY DISCLAIMS ANY LEGAL LIABILITY OR RESPONSIBILITY
TO ANY PARTY FOR ANY DIRECT, INDIRECT, SPECIAL OR CONSEQUENTIAL LOSS, DAMAGE OR DISRUPTION
CAUSED BY ERRORS OR OMISSIONS, WHETHER SUCH ERRORS OR OMISSIONS RESULT FROM NEGLIGENCE,
ACCIDENT OR ANY OTHER CAUSE.
General Notices
WASSP LTD. RESERVES THE RIGHT TO CHANGE THE CONTENTS OF THIS MANUAL AND ANY SYSTEM
SPECIFICATIONS WITHOUT NOTICE. CONTACT WASSP LTD. REGARDING COPYING OR REPRODUCING THIS
MANUAL.
Copyright and Condentiality Notice
THIS DOCUMENT IS COPYRIGHT WASSP LTD 2014. CIRCULATION OF THIS DOCUMENT IS STRICTLY
PROHIBITED WITHOUT THE WRITTEN PERMISSION OF WASSP LTD.
Doc. P/N: WSP-009-008
Version: V1.3
Issue Date: April 2014
ii
www.wassp.com
Page 3
Operator Manual
Related Documents
Document P/Number Title
WSP-009-009 WMB-X230 Installation Manual
Warnings, Cautions, and Notes
Warnings, cautions, and notes are indicated by the following icons throughout this manual:
A WARNING indicates that if the
instruction is not heeded, the action
may result in loss of life or serious
injury.
A CAUTION indicates that if the
instruction is not heeded, the action
may result in equipment damage or
software malfunction.
A Note indicates a tip or additional information that could be
helpful while performing a procedure.
Safety Notices
THE INSTALLER OF THE EQUIPMENT IS SOLELY RESPONSIBLE FOR THE CORRECT INSTALLATION OF THE
EQUIPMENT. WASSP LTD ASSUMES NO RESPONSIBILITY FOR ANY DAMAGE ASSOCIATED WITH INCORRECT
INSTALLATION.
Electrical Safety
► Fire, electrical shock, or equipment damage may occur if the BTxR becomes wet.
► The equipment is rated for operation at:
• BTxR
• WASSP Processor
► Make sure that the power is switched OFF at the main supply (e.g. switchboard) before beginning the installa-
tion. Fire or electrical shock may occur if the power is left ON.
► Do not open equipment covers unless you are totally familiar with the system’s electrical circuits.
► Make sure all safety precautions for electrical equipment are taken when operating or servicing the equip-
ment. These to be carried out in accordance with local or national regulatory body safety regulations.
► Make sure that the transducer cannot become loosened or insecure due to the vessel’s vibration.
24 V DC
6 - 30 V DC
Doc. P/N: WSP-009-008
Version: V1.3
Issue Date: April 2014
www.wassp.com
iii
Page 4

Contents
1. Introduction
1.1 Purpose of this Operator Manual ................................................................................................................................... 1
1.2 Introducing the WASSP Sonar System.......................................................................................................................... 1
1.3 Main Features ........................................................................................................................................................................ 1
1.4 System Overview ................................................................................................................................................................. 3
1.5 Application Startup ............................................................................................................................................................. 4
1.6 Splash Screen and Navigator Warning ......................................................................................................................... 4
1.7 Monitor Resolution ............................................................................................................................................................. 4
2. Main Menu
2.1 Overview ................................................................................................................................................................................. 5
2.2 Info Panel ................................................................................................................................................................................ 6
2.3 Device Connection Indicators ......................................................................................................................................... 6
2.4 Mode Button .......................................................................................................................................................................... 6
2.5 Gain Control ........................................................................................................................................................................... 7
2.6 Range Control ....................................................................................................................................................................... 7
2.7 Layout Selection ................................................................................................................................................................... 7
2.8 Power Level Control ............................................................................................................................................................ 7
2.9 Snapshots Button ................................................................................................................................................................ 8
2.10 Mapping Options ................................................................................................................................................................. 8
2.11 Utility Panel Button ............................................................................................................................................................. 8
2.12 Close Button .......................................................................................................................................................................... 8
3. Acoustic Display Modes
3.1 Sonar Display ......................................................................................................................................................................... 9
3.1.1 Conguration ...................................................................................................................................................... 9
3.2 Single / Triple Beam Display ...........................................................................................................................................11
3.2.1 Conguration ....................................................................................................................................................11
3.2.2 Display Oset (Shifting) ................................................................................................................................. 13
3.3 Sidescan Display .................................................................................................................................................................14
3.3.1 Conguration ....................................................................................................................................................15
3.3.2 Zooming ..............................................................................................................................................................15
3.4 Fish Options .........................................................................................................................................................................16
3.4.1 Fish Display Options ........................................................................................................................................16
3.4.2 Fish Threshold ...................................................................................................................................................16
3.4.3 Fish Histogram ..................................................................................................................................................16
3.4.4 Detection Mode ................................................................................................................................................ 17
4. Chart Display Modes
iv
www.wassp.com
Doc. P/N: WSP-009-008
Version: V1.3
Issue Date: April 2014
Page 5

Operator Manual
4.1 2D Display .............................................................................................................................................................................17
4.1.1 Conguration ....................................................................................................................................................18
4.2 3D Display .............................................................................................................................................................................29
4.2.1 Conguration ....................................................................................................................................................30
5. Layout Selection
6. Utility Panel
6.1 Overview ............................................................................................................................................................................... 32
6.2 Data Recorder ......................................................................................................................................................................33
6.3 Advanced Options .............................................................................................................................................................34
6.4 Rescan .................................................................................................................................................................................... 35
6.5 Depth / Speed Window ...................................................................................................................................................35
6.6 Network Window ...............................................................................................................................................................35
6.7 Raw Signal Data ..................................................................................................................................................................37
6.7.1 IQ Raw Data Tab ................................................................................................................................................ 37
6.7.2 Sensor Data Tab ................................................................................................................................................ 39
6.8 IQ Bars ....................................................................................................................................................................................39
6.9 Database Manager ............................................................................................................................................................40
6.9.1 Adding a new database .................................................................................................................................41
6.9.2 Database Management .................................................................................................................................42
6.9.3 Database File Path ...........................................................................................................................................42
6.9.4 Demo .................................................................................................................................................................... 42
6.9.5 Show Bookmarks ..............................................................................................................................................42
6.10 Hue .......................................................................................................................................................................................... 43
6.11 Day/Night Mode ................................................................................................................................................................. 43
7. System Conguration
7.1 System Tab ............................................................................................................................................................................44
7.1.1 Units ...................................................................................................................................................................... 44
7.1.2 Language ............................................................................................................................................................44
7.1.3 Conguration Manager .................................................................................................................................44
7.1.4 System ..................................................................................................................................................................45
7.2 Ship Setup Tab ....................................................................................................................................................................46
7.2.1 General ................................................................................................................................................................. 46
7.2.2 Osets ..................................................................................................................................................................46
7.2.3 Sound Speed......................................................................................................................................................46
7.2.4 Sensor ................................................................................................................................................................... 47
7.2.5 Power ....................................................................................................................................................................47
7.3 Tides Tab ................................................................................................................................................................................49
Doc. P/N: WSP-009-008
Version: V1.3
Issue Date: April 2014
www.wassp.com
v
Page 6

7.4 Chart Tab ...............................................................................................................................................................................50
7.4.1 Cartography .......................................................................................................................................................50
7.4.2 Overlays ............................................................................................................................................................... 50
7.4.3 Bathymetry ......................................................................................................................................................... 51
7.5 Layout Tab ............................................................................................................................................................................52
7.6 Snapshots Tab .....................................................................................................................................................................53
8. Operating Procedures
9. Frequently Asked Questions (FAQs)
9.1 The system is transmitting too slowly, how can I speed it up? ......................................................................... 57
9.2 Why does the range not change on the display when I move the Range Dial? .........................................57
9.3 Why is no seaoor prole generated on the charting displays after the system initially starts transmit-
ting? ........................................................................................................................................................................................ 57
9.4 Why do gaps appear between the swath footprints on the charting displays? ......................................... 57
9.5 The system has stopped transmitting without operator intervention. Why? .............................................58
9.6 When I click the MODE button, or run a replay (demo) le I get no picture on the display. Why?.......58
9.7 When I press the MODE button, the button goes red and a number on it counts up, but there is no activ-
ity on the WASSP display. How do I x this? .............................................................................................................58
9.8 What does the error message that appears when I run WASSP mean? Is my WASSP system faulty? .58
9.9 Why is there a ring displayed just above the seaoor? What causes these ‘ring’ marks? How can I get rid
of them? ................................................................................................................................................................................60
9.10 What is this constant signal on the sonar/sh nder display? ..........................................................................61
9.11 Why is my WASSP System not tracking the Seaoor? ...........................................................................................62
9.12 Why doesn’t the seaoor line up when I go over it again? ................................................................................. 62
9.13 Why does the seaoor move if the system is motion compensated? ............................................................63
9.14 The MODE button animates as if pinging but nothing happens. What is wrong? .....................................64
9.15 Why is the Key Pulse from my secondary sounder not triggering the WASSP system? ........................... 64
10. Troubleshooting
vi
www.wassp.com
Doc. P/N: WSP-009-008
Version: V1.3
Issue Date: April 2014
Page 7

Operator Manual
Introduction
1. Introduction
1.1 Purpose of this Operator Manual
This Operator Manual contains instructions and information on the operation of the software package
supplied with your WMB-X230 (i.e. WMB-3230 or WMB-5230) system. Installation and Commissioning
procedures are contained within the Installation Manual, also supplied alongside this manual.
Please refer to the Installation Manual for instructions on transducer and BTxR installation, sensor
connection, system configuration and setup, and commissioning steps required to get your WASSP
system up and running.
1.2 Introducing the WASSP Sonar System
The WMB-X230 is a multi-beam sonar system that uses a wide-angle sonar transducer to profile
the water column and seafloor to a high resolution. It is this unique combination of multi-beam
sonar and processing power which provides you with unparalleled information about the underwater
environment. It gives you a wide 120° port-starboard swath of the water column and seafloor, allowing
you to find and position reefs and wrecks, fish schools, seafloor hardness changes, and foreign objects
in the water column or on the seafloor. From the 120° swath, the system processes 112 dynamic
beams, with each beam containing detections from the water column and seafloor.
The information is presented in a user-friendly, mouse controlled, Windows-based operating system.
The intuitive graphical user interface displays both acoustic views and charting views for complete
knowledge of the world beneath with the ability to view both real-time and previously recorded maps
from any part of the globe in 2D and 3D. Depth and backscatter colours can be dynamically changed
while viewing. The system can output data to plotting software packages. For optimal performance,
roll, heave, pitch, heading and position inputs are all required.
The WMB-X230 can be applied to a variety of fishing methods, as well as search and rescue, customs,
and police applications.
1.3 Main Features
The WMB-X230 has the following main features:
► Improved performance.
The use of separate transmit and receive arrays has enabled WASSP to optimise both transmit
performance and receive sensitivity, giving improved performance over traditional sonar and
sounders.
► High detail picture of marine environment.
The transmit beam spreads over a 120° port-starboard swath and covers 4° fore-aft while the receive
beam covers 10° fore-aft, displaying a highly detailed picture of the marine environment.
► Real-time map generation.
Generate new maps in real-time from bottom detections.
► Beam stabilisation.
Beam stabilisation compensates for the movement of the vessel, providing accurate seafloor
profiles and fish school locations.
► Variable beam width.
Unique to the WMB-X230 the single beam view can not only be stabilised, but the beam width
can be varied from 5° to 40°.
► Triple beam view.
With variable width and angle, the port, centre, and starboard beams display together to help
build your understanding of the sea environment.
► Navionics chart overlay.
The charting displays can draw a vector Navionics hydrographic chart overlaid on the WASSP seafloor
data. The displayed chart features can be turned on or o as required. Maps are available from
Doc. P/N: WSP-009-008
Version: V1.3
Issue Date: April 2014
www.wassp.com
1
Page 8

Navionics to cover almost every part of the world.
► Bottom lock.
Bottom lock provides a traditional bottom lock mode where the changes in bottom depth are
ignored and the bottom is drawn flat. Fish and other echoes are shown relative to the flat bottom
image, enabling better discrimination between bottom fish and the seafloor.
► Computer based profile storage.
A computer-based system means the WMB-X230 can generate and store very detailed seafloor
profiles.
► Map resolution based on depth.
Your WASSP system dynamically changes the resolution of the stored maps to suit the depth of the
seafloor. Shallow seafloor data is stored at resolutions as high as 250mm to give the maximum detail
available, while deep seafloors have their resolution restricted to 4m to avoid saving spurious fine
detail.
► Database management.
The WASSP system uses one or more databases for storing and displaying WASSP data including the
depth, backscatter and water column information. Additional databases can be created at any time
and incoming data can be assigned to any database. Unnecessarily large databases can be downsized to save recording space.
► Digital signal processing (DSP).
Using DSP technology, the WMB-X230 can provide an indication of changes in seafloor hardness,
ideal for scalloping, crayfishing, and trawling where you want to understand and locate small
changes on the seafloor.
► 160 kHz operating frequency (WMB-3230).
Operating at a frequency of 160 kHz provides high seafloor definition at depths down to 200m.
► 80 kHz operating frequency (WMB-5230).
This frequency provides performance down to 500m with a slight reduction in the shallow water
< 60m performance.
► Depth and seafloor coverage.
Seafloor coverage is determined by the beamwidth in use: For a 90 degree beamwidth, the
seafloor coverage will be approximately twice the water depth. For example, 100m depth gives
200m seafloor coverage with 112 beams - every ping. For a 120 degree beamwidth, the seafloor
coverage is 3.4 x depth. For example 200m depth gives approximately 680m seafloor coverage.
► Unique power management system (14 power levels).
14 power levels provide optimal performance over a wide range of seafloor types and water
depths.
► More accurate seafloor - faster.
Profiles 90 times faster than conventional single beam echo sounders, leading to reduced costs
and improved accuracy.
► Future proof technology.
The computer based operating system and BTxR firmware are both upgradeable as new software
features are developed.
2
www.wassp.com
Doc. P/N: WSP-009-008
Version: V1.3
Issue Date: April 2014
Page 9
Operator Manual
29.01.13
4
23.11.11 ADDED USB
JW
SR
WMB-X230
WMB-X230
1
Introduction
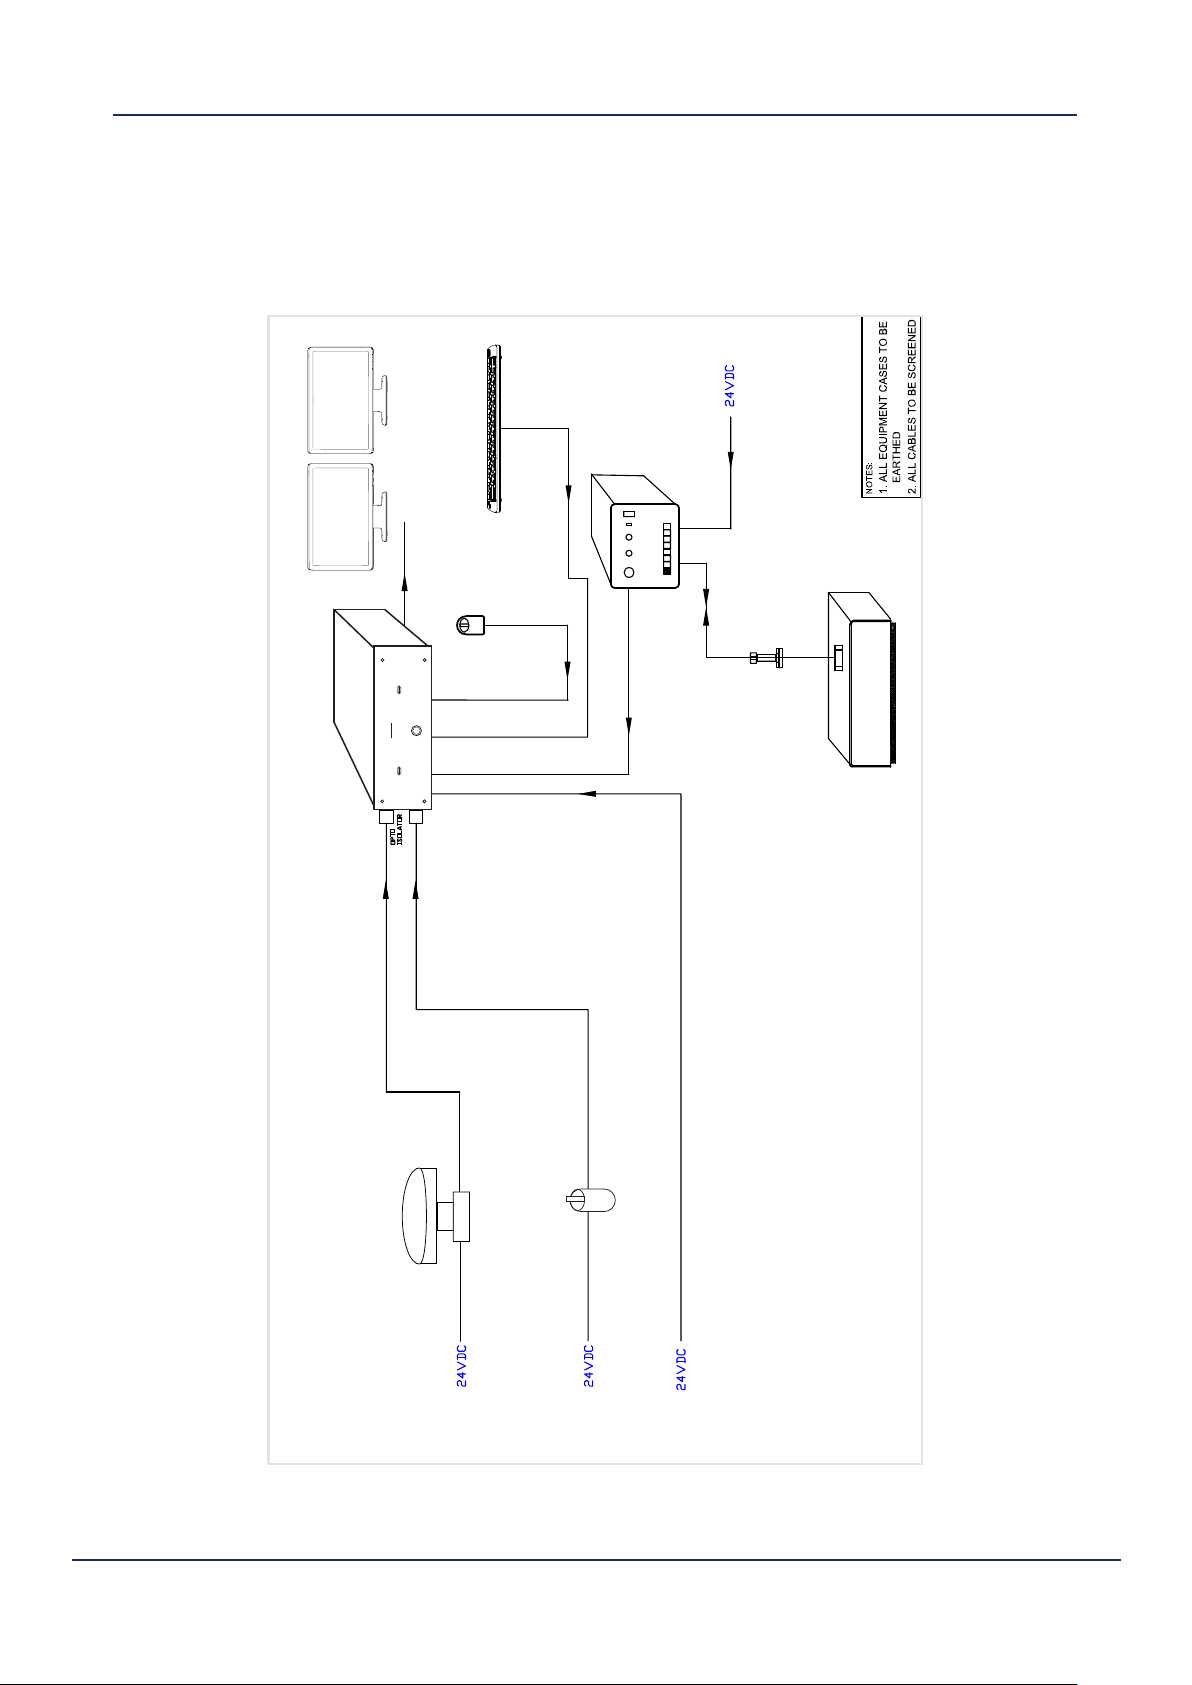
1.4 System Overview
A complete WASSP system is made up of a variety of hardware which all combine to provide the
WASSP software package with all the information required to generate a seafloor profile with water
column information. Figure 1 below shows an overview of a complete WASSP system.
Keyboard
Power Cable
Monitors (x2 Owner Supply)
BTXR
Mouse
Gland Hull
Transducer Cable
WASSP Processor
wassp
GPS
GPS
Position, Time;
RS232/NMEA0183
USB
USB
Pitch, Roll, Heave;
RS232/NMEA0183
Ethernet (CAT5)
Crossover Cable
Power Cable
Motion Sensor
Transducer
Transducer Hull
Doc. P/N: WSP-009-008
Version: V1.3
Issue Date: April 2014
Figure 1. Overview of a complete WASSP system
www.wassp.com
3
Page 10
Before proceeding with the contents of this Operator Manual, the
user should ensure that the Installation Manual has been read,
and that the commissioning steps contained within it have been
followed through and completed.
The software package supplied with your WASSP system is your gateway to the world beneath. Modern
computer processing capabilities have provided a means for interpreting the tremendous amount of
data collected by the WASSP system, and it is through this gateway that we are able to see this data in
an arrangement which is easy to understand and use.
Note: You will require a USB WASSP dongle to operate the software.
You have been supplied one with your system. Ensure it is plugged
into one of the USB ports on the WASSP Processor before continuing.
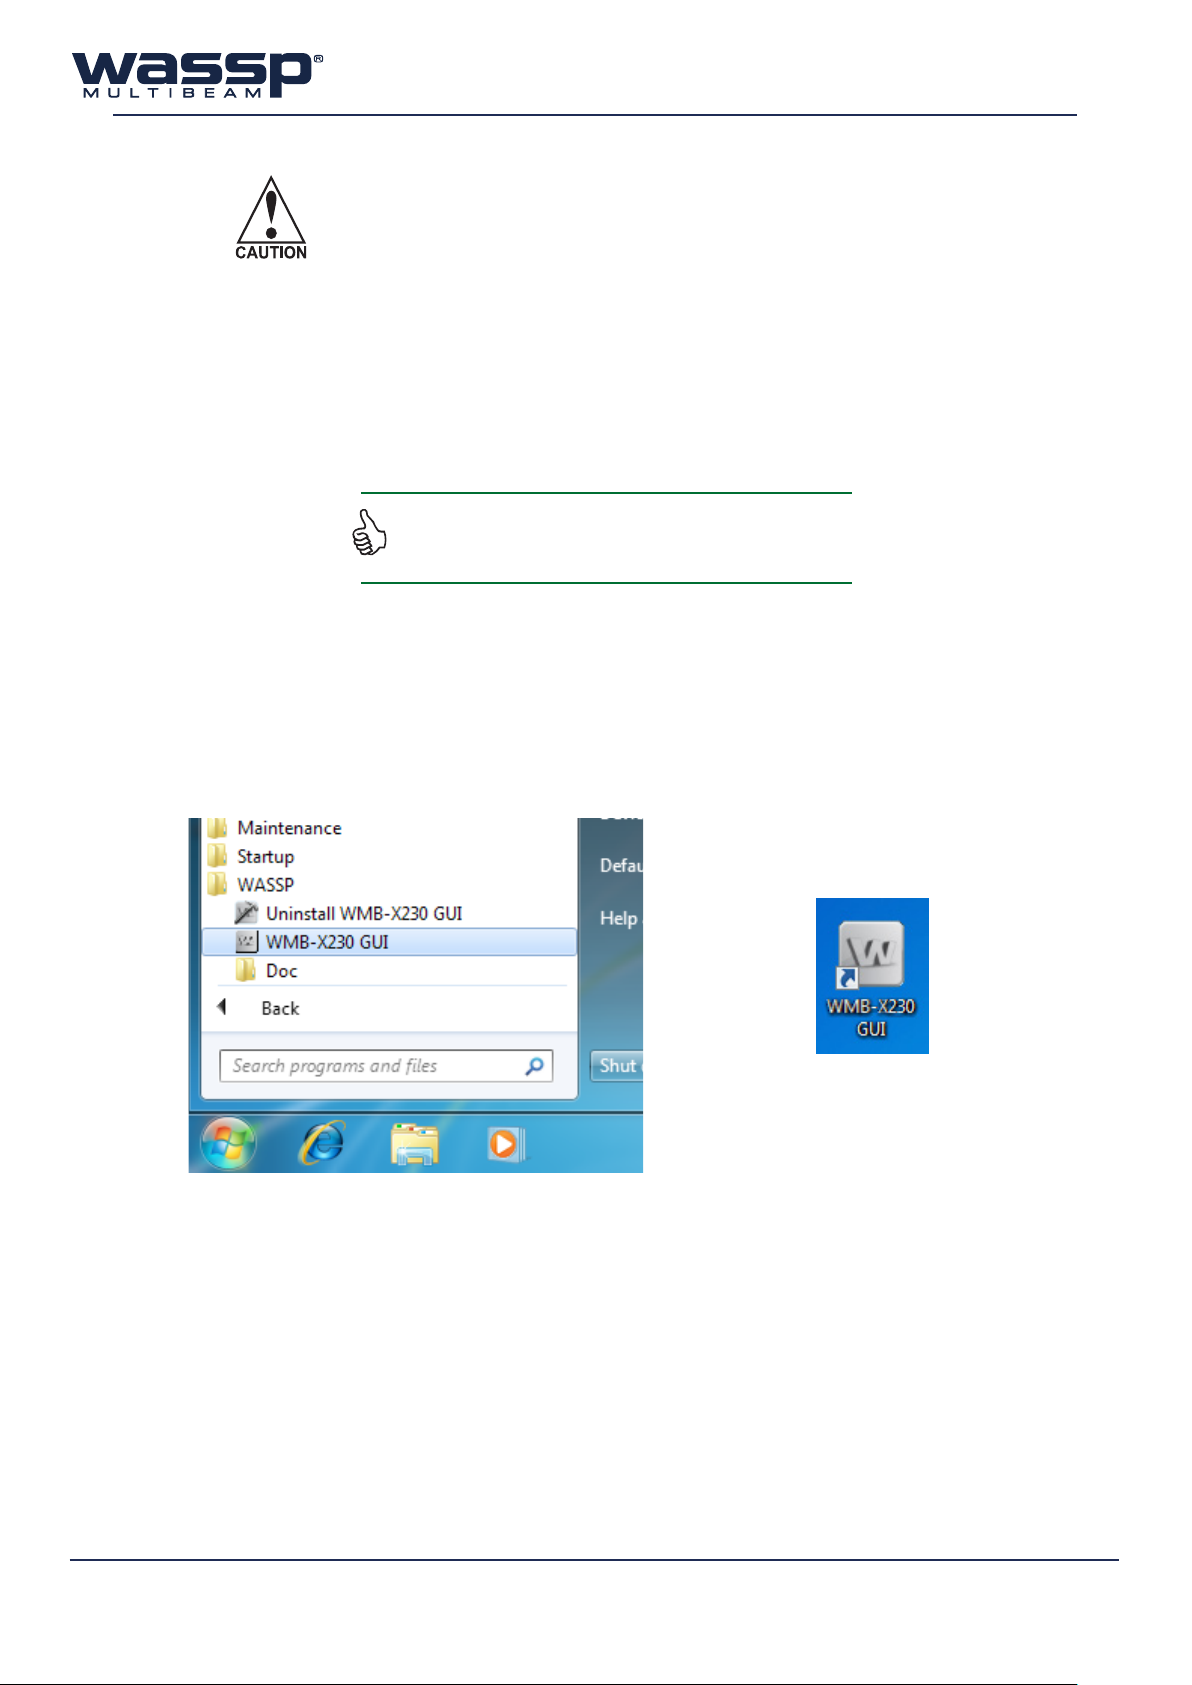
1.5 Application Startup
Your WASSP Processor will automatically run the WMB-X230 software as it is powered up. Alternatively,
the software can be run from the Windows Start Menu (Start > All Programs > WASSP) or Desktop.
Figure 3. Desktop Icon
Figure 2. Start Menu Icon
1.6 Splash Screen and Navigator Warning
The splash screen that appears on the application start-up contains a warning to the user. Please read
this warning and take note of what it says.
1.7 Monitor Resolution
The resolution of the monitor you have chosen to use with your WASSP Processor will be automatically
detected and the appropriate display configuration applied.
See “7.1.4 System” on page 46 for more details.
Doc. P/N: WSP-009-008
Version: V1.3
Issue Date: April 2014
4
www.wassp.com
Page 11
Operator Manual
Main Menu
2. Main Menu
The Main Menu is a panel with several buttons, dials and indicators, and is used to control the majority
of the operations of your WASSP system. The following pages contain an overview of what each
control does, with references to further sections in this manual with more detail.
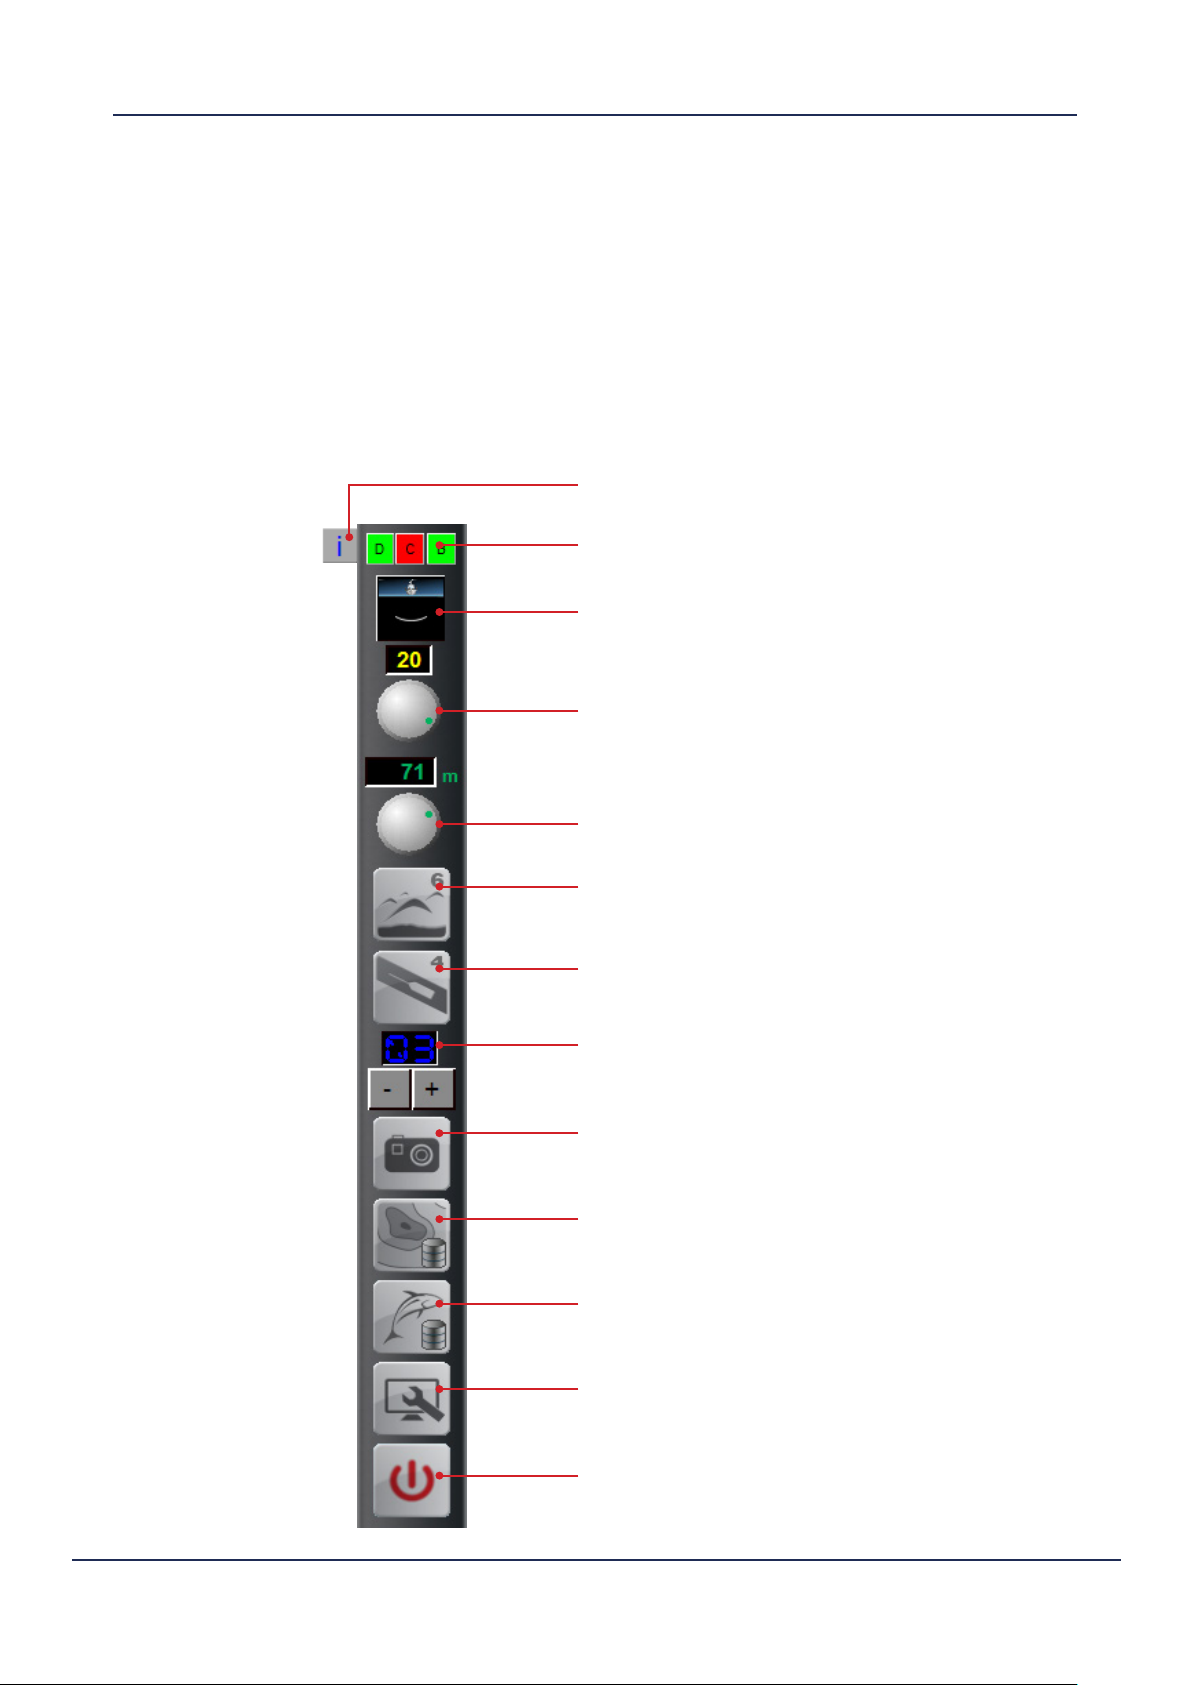
2.1 Overview
Each of the buttons or controls on the Main Menu are talked about in some detail over the following
section. Buttons requiring a more detailed explanation have their own chapter.
Info Panel
See page 6
Device Connection Indicators
See page 6
MODE button
See page 6
Gain Control
See page 7
Range Control
See page 7
Acoustic Layout Selection
See page 7
Chart Layout Selection
See page 7
Power Level Selection
See page 7
Snapshot button
See page 8
Map Recording Button
See “Mapping Options” on page 8.
Doc. P/N: WSP-009-008
Version: V1.3
Issue Date: April 2014
Watercolumn Recording Button
See “Mapping Options” on page 8.
Utility Panel
See page 8
Close button
See page 8
www.wassp.com
5
Page 12

2.2 Info Panel
Clicking the button will reveal the information panel. This panel displays error messages and
information important for the user to know.
Hide: Hides the information panel. Click the button again to expand.
Save: Saves the text in the information panel to file.
2.3 Device Connection Indicators
At the top of the Main Menu are three device connection indicators. The indicators are RED when the
WASSP program is unable to read or detect the device, and GREEN when devices are connected and/
or readable.
► Dongle
This is the user dongle supplied with your system. This should always be plugged into
your WASSP Processor.
► Navionics Chart
If you have connected a Navionics chart to use with your WASSP system, this indicator
will be green (see page 62 of the Installation Manual for further information).
► BTxR (Transceiver)
When the BTxR is ON and connected, this indicator will be green.
2.4 Mode Button
This button is used to control the BTxR, and has four modes:
Standby Mode
Transmit Mode During transmission, the button animates with each
The MODE button is BLACK during start up. The button
turns YELLOW for about 3 seconds while the BTxR selfcalibrates and then turns BLUE, indicating the BTxR has
just calibrated and is ready to go.
A RED counting button indicates a communications
failure. This means that a ping was requested but no data
was received. A new ping is sent at least every 5 seconds.
A communications failure can happen if the BTxR power
is interrupted.
pulse that the BTxR transmits.
Cal
Start up
Cal
Transition
(Self Calibration)
Cal
After 3 sec
6
Demo Mode A BLACK button with DEMO displayed indicates the
system started without a valid dongle.
In this mode, only Replay Files can be viewed.
www.wassp.com
Doc. P/N: WSP-009-008
Version: V1.3
Issue Date: April 2014
Page 13

2.5 Gain Control
2.6 Range Control
Operator Manual
Main Menu
The Gain Control adjusts the display gain of the received information.
Manually adjust by either clicking and then using the scroll wheel on the mouse,
or be using the mouse pointer to drag the knob clockwise to increase and
counter-clockwise to decrease.
Adjusts the depth range of the receiver.
The numeric display is YELLOW for manual and GREEN for automatic adjustment.
Default is green (automatic mode).
Manually adjust by either clicking and then using the scroll wheel on the mouse or
by using the mouse to drag the knob clockwise to increase and counter-clockwise
to decrease. Double clicking on the number causes the control to switch from
manual to automatic and vice versa. Automatic mode is recommended.
2.7 Layout Selection
Acoustic Layout
Select
Chart Layout
Select
These buttons cycle through preset display layout
arrangements. Each of the Sonar displays and Chart
displays can be configured in dierent arrangements,
and those arrangements can be cycled through.
Left-click to cycle forwards through the layouts, or
right-click to cycle backwards.
See section “7.5 Layout Tab” on page 54 for information
on configuring the preset layouts.
2.8 Power Level Control
The transmit power level selector / indicator operates in the manual and auto modes. Initially use auto power by
signal (BLUE) until you are familiar with the operation of the unit.
Manual Mode
Auto Mode
There are 14 transmit power levels that can be selected.
Click the increment (+) or decrement (–) buttons to
adjust between 01 to 14.
Double-clicking the LED indicator selects the auto mode,
indicated by the LEDs changing to GREEN or BLUE.
GREEN automatically selects the power based on the
current depth. BLUE automatically selects the power
based on the signal level.
Doc. P/N: WSP-009-008
Version: V1.3
Issue Date: April 2014
Consult the Power Tab of the Ship Setup Options if you
wish to change the Automatic Power settings. See “7.2.5
Power” on page 49 for more details.
www.wassp.com
7
Page 14
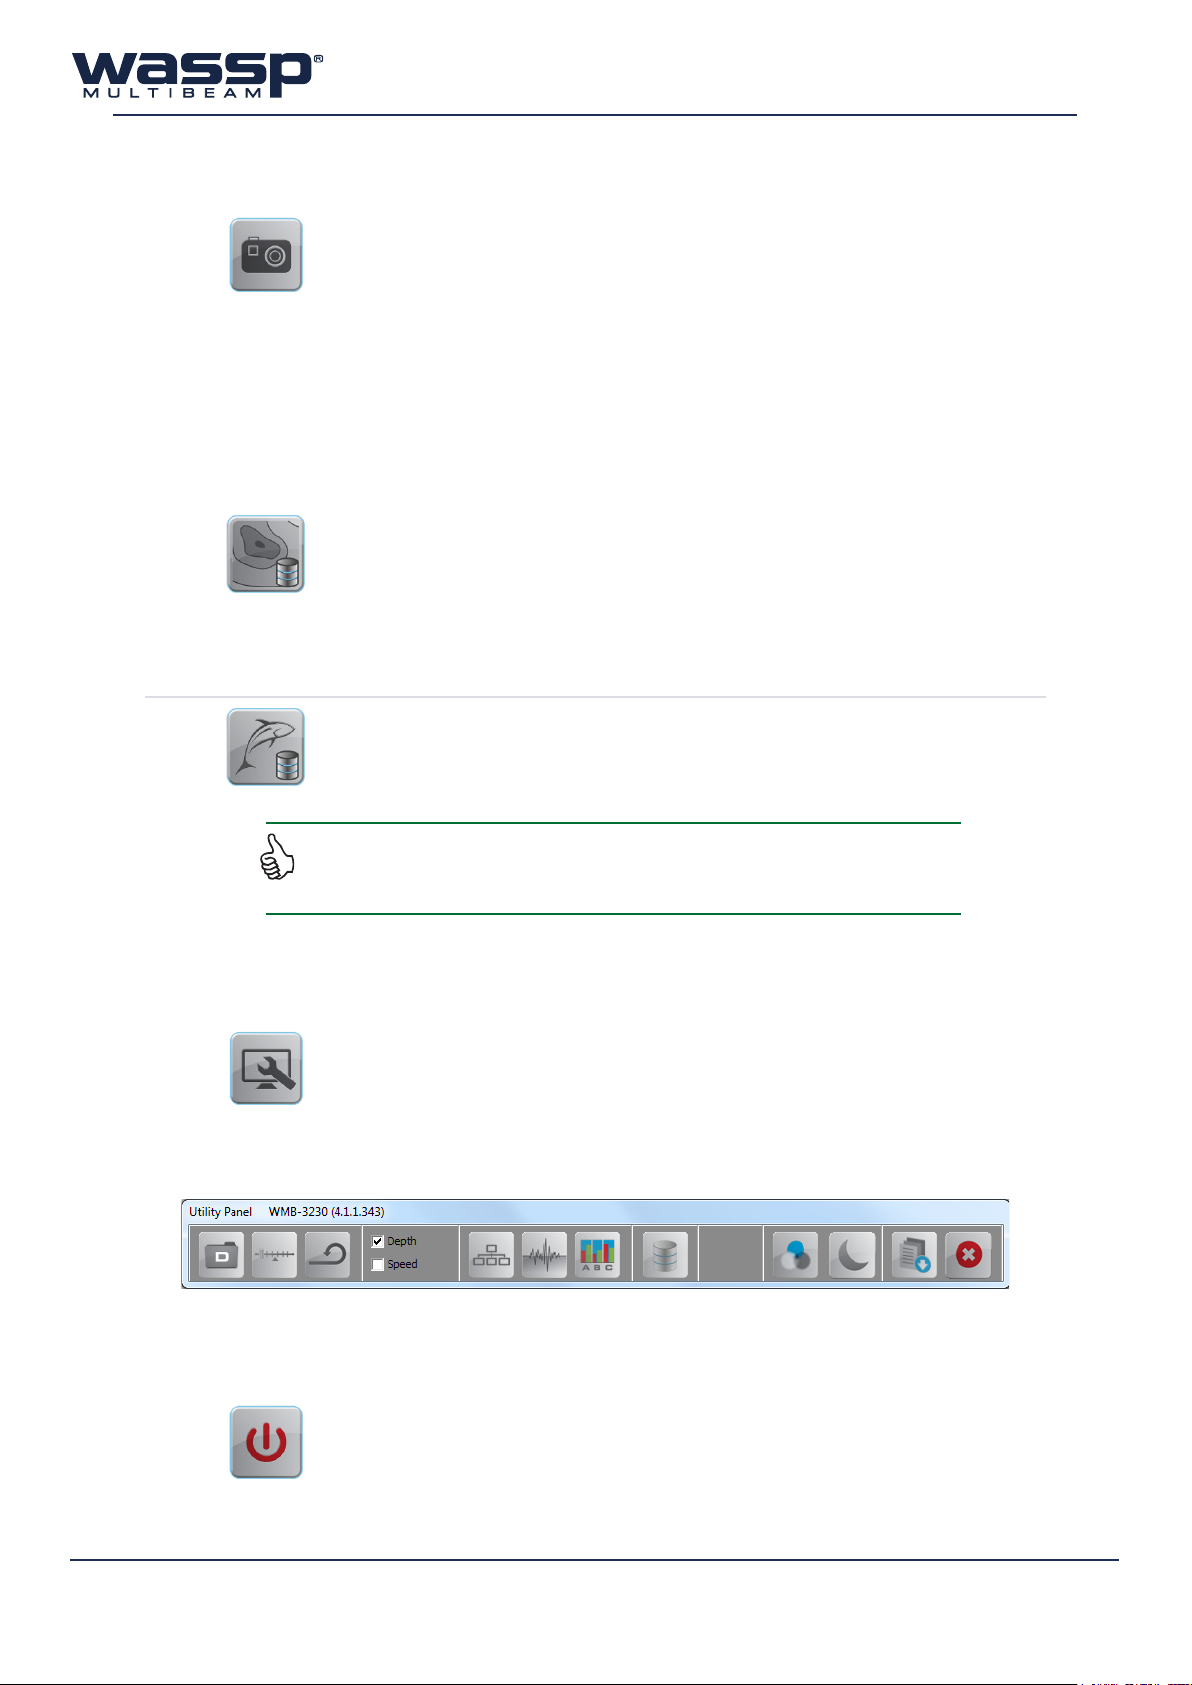
2.9 Snapshots Button
Clicking this button creates a snapshot of ≈1000 pings of a selected area.
See “7.6 Snapshots Tab” on page 55 for detailed procedures on how to play
snapshot files.
2.10 Mapping Options
Used for interfacing seafloor and water column data to chart displays (see “4. Chart Display Modes” on page
18) and external viewers. This is useful for users who are recording to a database, but want to stop recording
temporarily, as the interfacing is an easy toggle ON / OFF. Both WASSP seafloor data and watercolumn targets
can be toggled.
These options only aect database recording for the Charting display, and will not stop raw data recording.
This button toggles seafloor detection recording for the Chart displays. When
enabled, the seafloor data as detected by the pinging transducer will be saved
to the current recording database.
When disabled, the charting display will not record the seafloor data detected
by the WASSP sonar.
See “6.9 Database Manager” on page 41 for more information on recording
databases.
This button toggles 3D fish marks recording for the Chart displays. When enabled,
3D fish mark information from the pinging transducer will be recorded for use on
the charting display. When disabled, 3D fish marks will not be recorded for use
on the charting displays.
You may nd that operating in conditions that restrict good seaoor return (such as deep water)
doesn’t allow water column detections such as sh to be passed through to the charting displays.
You will nd an override for this (to pass ALL detections) under section “7.1.4 System” on page 46.
2.11 Utility Panel Button
This button brings up the Utility Panel, which is a quick-access panel for frequently
used options and displays.
The Utility Panel is also the place for modifying ship settings and configurations,
under the System tab.
This panel is covered in much more detail in section “6. Utility Panel” on page
33.
2.12 Close Button
Clicking this button exits the WMB-X230 program.
8
After clicking Close, you must then click OK for the program to shut down fully.
See “8. Operating Procedures” on page 56 for detailed procedures.
www.wassp.com
Doc. P/N: WSP-009-008
Version: V1.3
Issue Date: April 2014
Page 15
Operator Manual
Acoustic Display Modes
3. Acoustic Display Modes
The WMB-X230 graphical user interface has three acoustic display modes and two chart display
modes. These display modes all show acquired data in dierent ways, with various settings available
for adjusting each type of display.
Each of these display modes can be viewed in multiple dierent layout configurations. For information
on configuring dierent display layouts, see section “5. Layout Selection” on page 32.
► Each acoustic display can be zoomed by using the mouse wheel - just click on the display and
scroll up or down to zoom in or out.
► The zoom on each acoustic display can be reset by double-clicking on the window.
The following display modes make up the acoustic feature of the WASSP software.
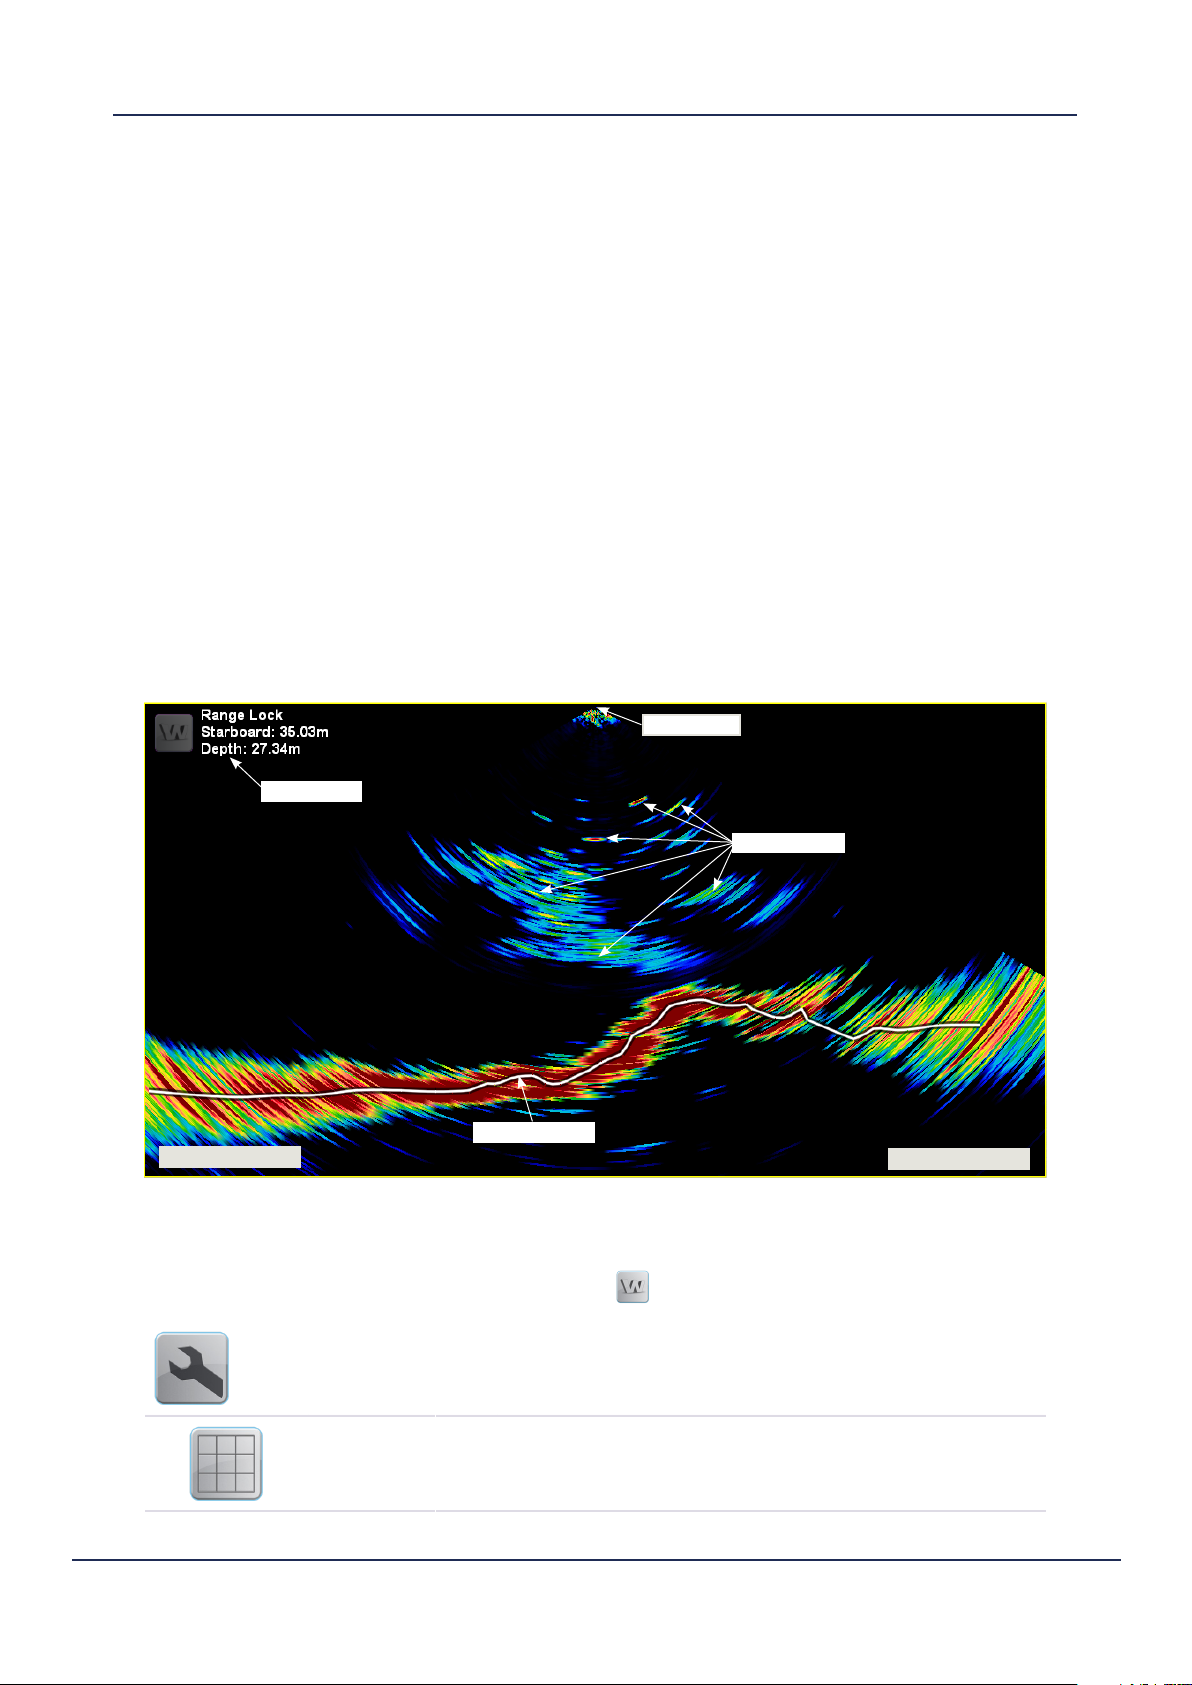
3.1 Sonar Display
The sonar display shows the water column and seafloor profile below the transducer. This represents
a sonar view of the water column and seafloor as seen from behind the vessel. See Figure 4.
A 120° wide by 4° long swath or footprint is covered. The system generates 112 beams over the 120°
footprint to provide a high-resolution sonar view. The swath or footprint is used to develop seafloor
profiles and gives a seafloor coverage of twice the depth (e.g. 100 m depth gives 200 m seafloor
coverage).
Transducer
Text Box
Fish Echoes
Seafloor Line
Port Side
Figure 4. The Sonar Display showing a few fish schools and individual fish.
Starboard Side
3.1.1 Conguration
The Sonar Display can be configured by clicking the in the top left corner of the display window.
Doc. P/N: WSP-009-008
Version: V1.3
Issue Date: April 2014
OptiOns
Grid
This button opens up the Options for the Sonar Display.
Overlays a grid on top of the sonar view, to enable the user to
quickly judge distances to targets.
Grid size selectable from 5 depth units to 100 depth units.
www.wassp.com
9
Page 16
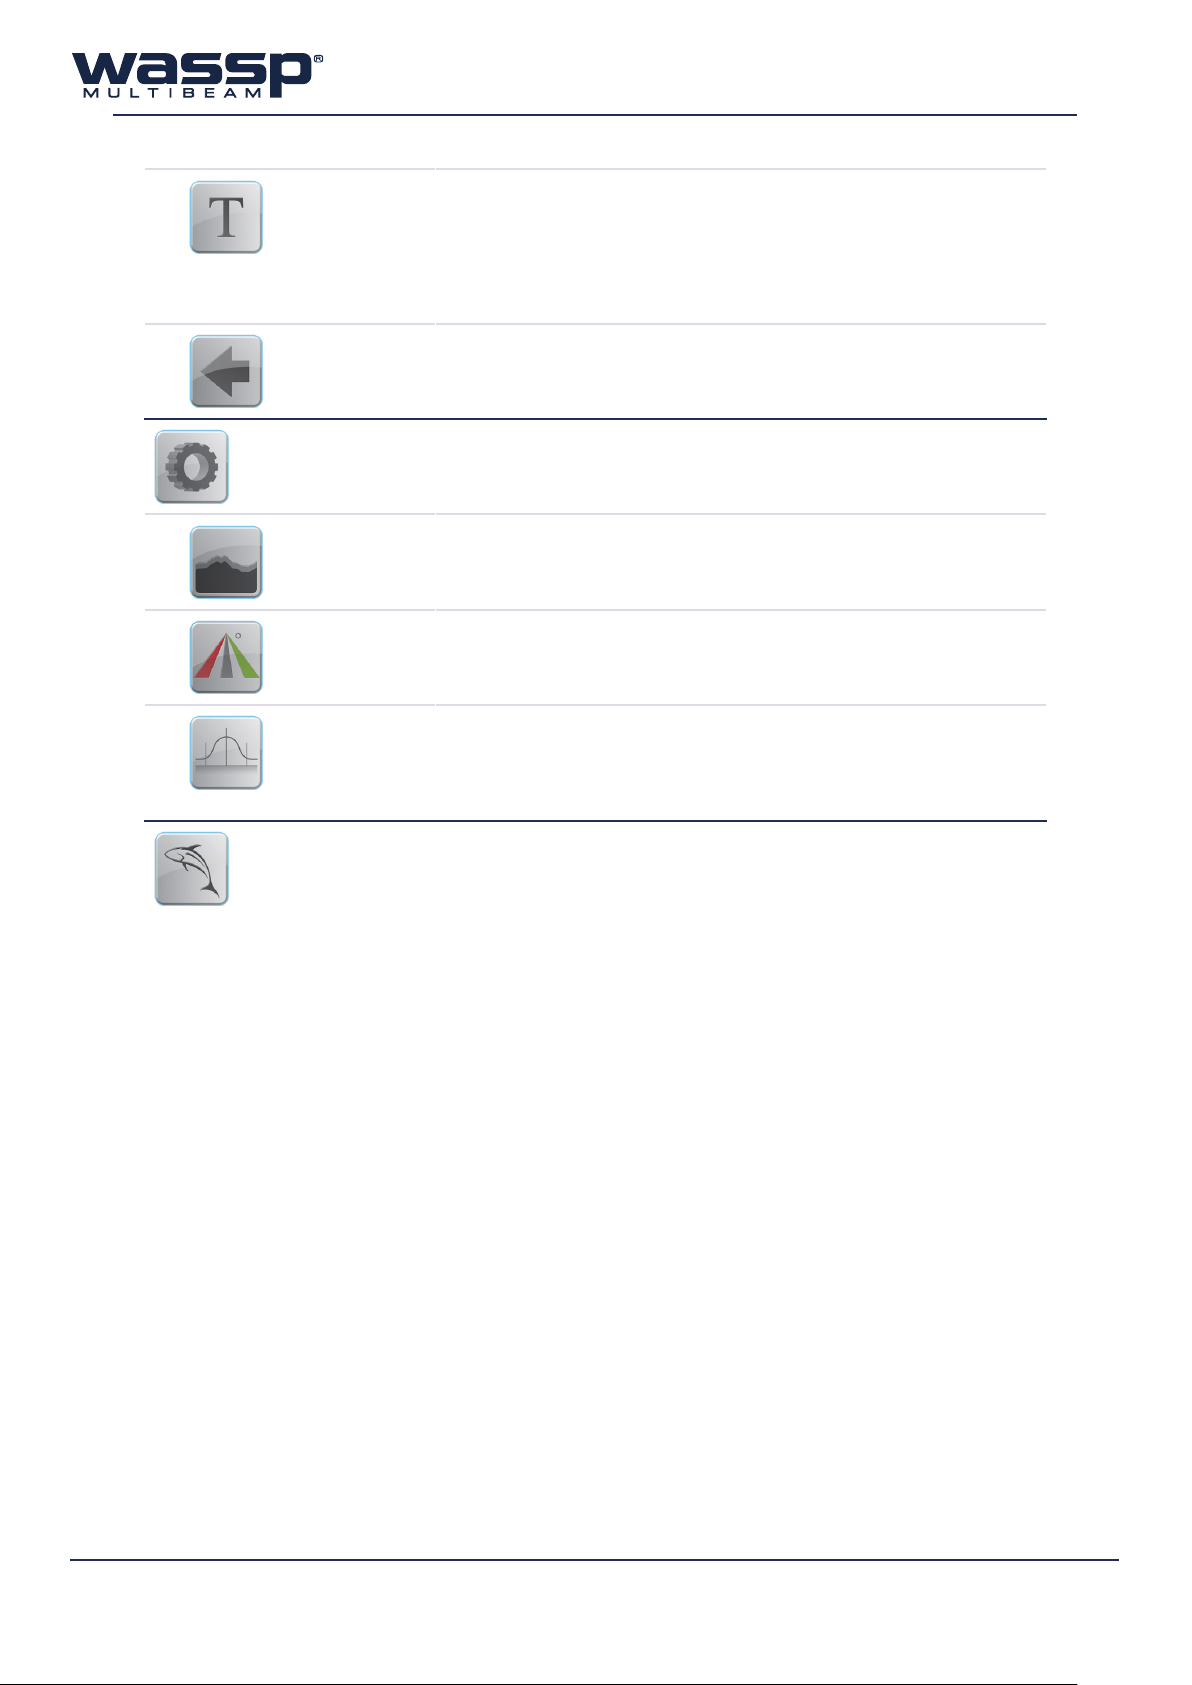
text BOx
Back
Provides the option of a Text Box to appear in the top left-hand
corner of the sonar display. The text box provides X and Y axis
information on the location of the cursor within the window.
You can the place the cursor on a target and know the X and Y
distances to the target.
Click to display Text Box options.
Takes the user back one menu level.
cOnfiG
seaflOOr line
triple Beam
Overlay
nOrmalise
fish OptiOns
Settings for the Sonar Display which can be toggled are found
under this menu.
This button toggles the software-generated line of the profile of
the seafloor. The line is white, and is drawn as an overlay on the
sonar display.
Click this button to overlay the current Triple Beam configuration
onto the sonar display. The position (angle) and width of each beam
will be clearly visible. A RED mask for the port beam, grey mask for
the centre beam, and GREEN mask for the starboard beam.
Enable this to normalise the colours on the sonar display for
intensity based on power level, spreading and absorption loss.
Increasing the power will thus decrease the gain by a factor that
should mean the same fish echoes will be the same colour at any
power level.
This button opens the Fish Options window.
See “3.4 Fish Options” on page 16 for more details.
10
Advantages
à Shows an instant snapshot of the area inside the 120° x 4° swath.
à Shows seafloor profile and fish distribution under the vessel at the
same time.
à The best tool for judging power level and side lobe suppression levels.
à Shows full resolution of sonar data collected and could allow an
operator to pick up seafloor features too small to appear on the
charting displays.
Disadvantages
Ä No history. Information from previous snapshots is not shown.
www.wassp.com
Doc. P/N: WSP-009-008
Version: V1.3
Issue Date: April 2014
Page 17
Operator Manual
Acoustic Display Modes
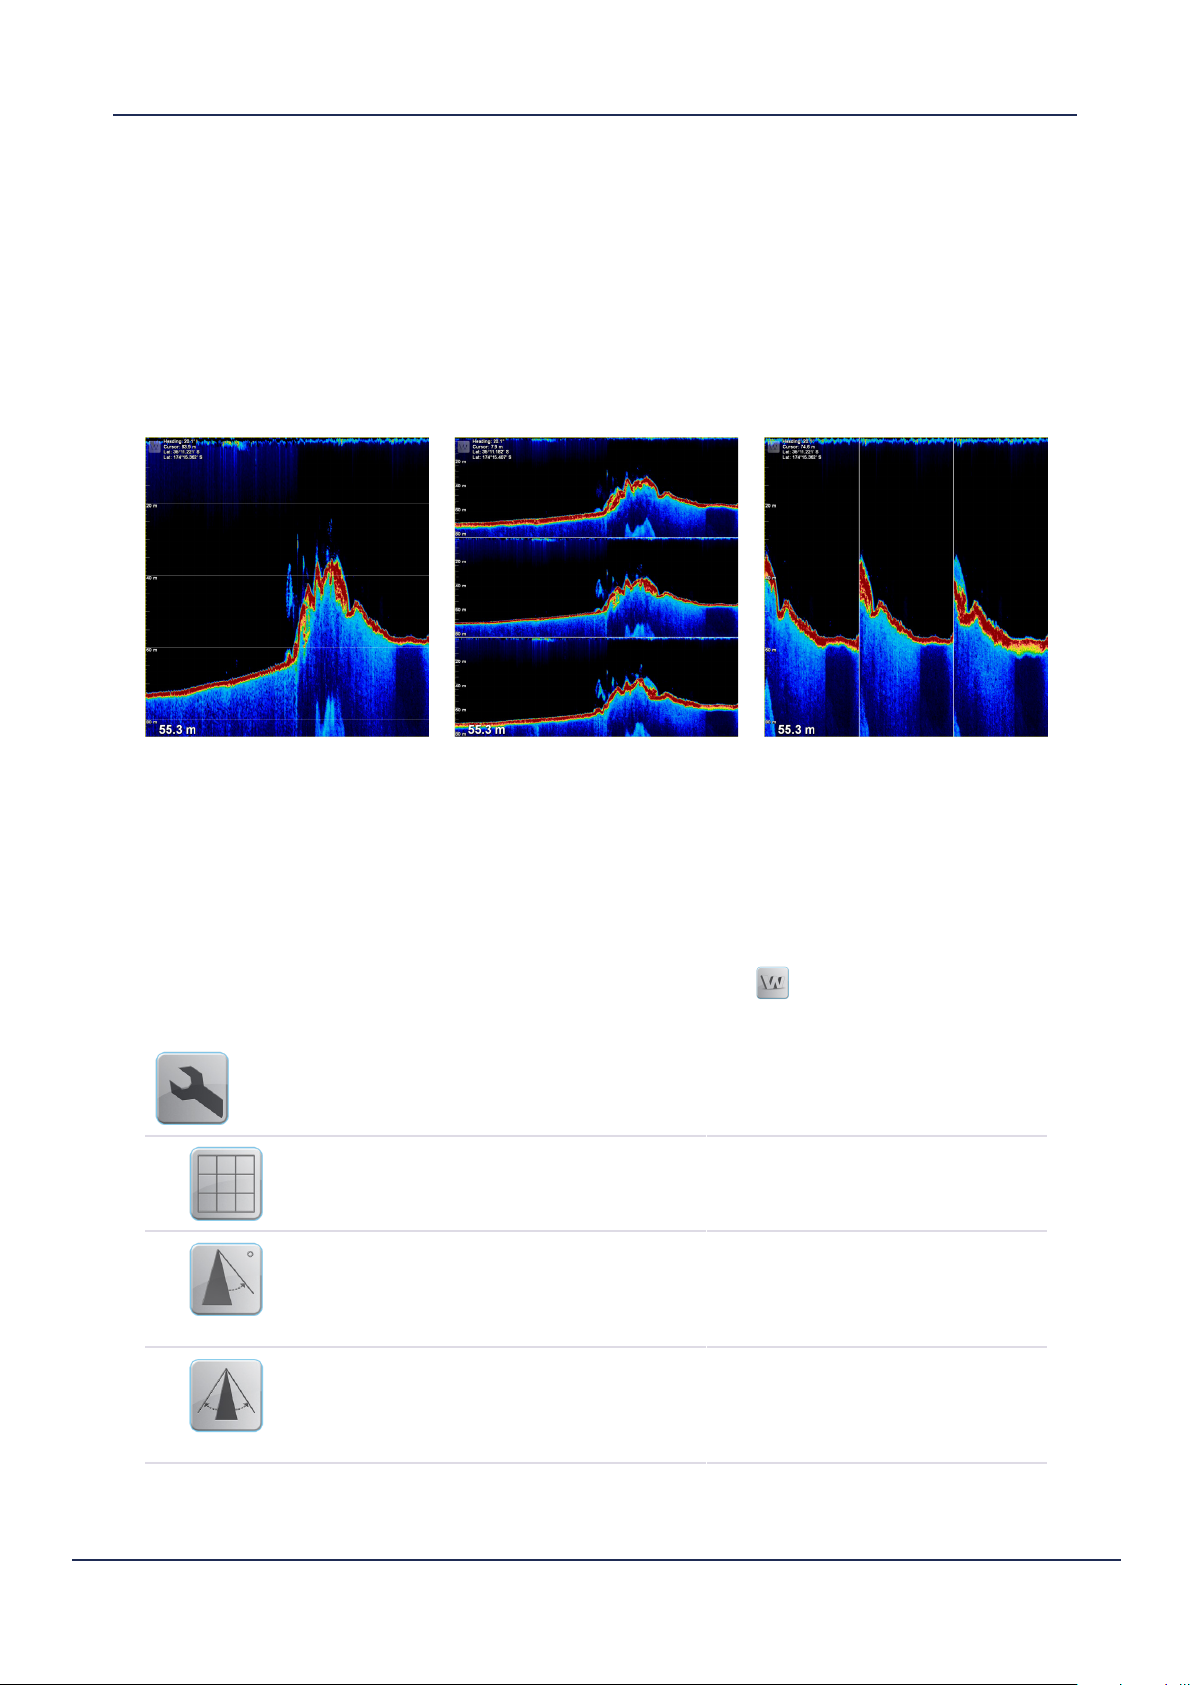
3.2 Single / Triple Beam Display
The Single / Triple Beam Display shows seafloor and water column information in a similar fashion
to the traditional fish-finder display. Signal returns are drawn vertically in slices, with new information
appearing on the right of the display, and old information dropping o the left side.
In Single Beam mode, only the middle beam is used to draw the information from the seafloor.
In Triple Beam mode, additional port and starboard beams are used to draw information from selectable
areas of the water column through configuration of the beam width and beam angle. See Figure 5.
Port Beam
Middle Beam
Port
Beam
Middle
Beam
Starboard
Beam
Starboard Beam
Single Beam (Middle Beam) Triple Beam (Horizontal)
Figure 5. Single / Triple Beam Display Layouts
Triple Beam (Vertical)
3.2.1 Conguration
The Single / Triple Beam Display can be configured by clicking the in the top left corner of the
display window.
OptiOns
Grid
Beam anGle
Beam Width
This button opens up the Options for the Single / Triple Beam
Display.
Overlays a grid on top of the Single / Triple Beam display, to enable
the user to quickly judge distances to targets.
Grid size selectable from 5 depth units to 100 depth units.
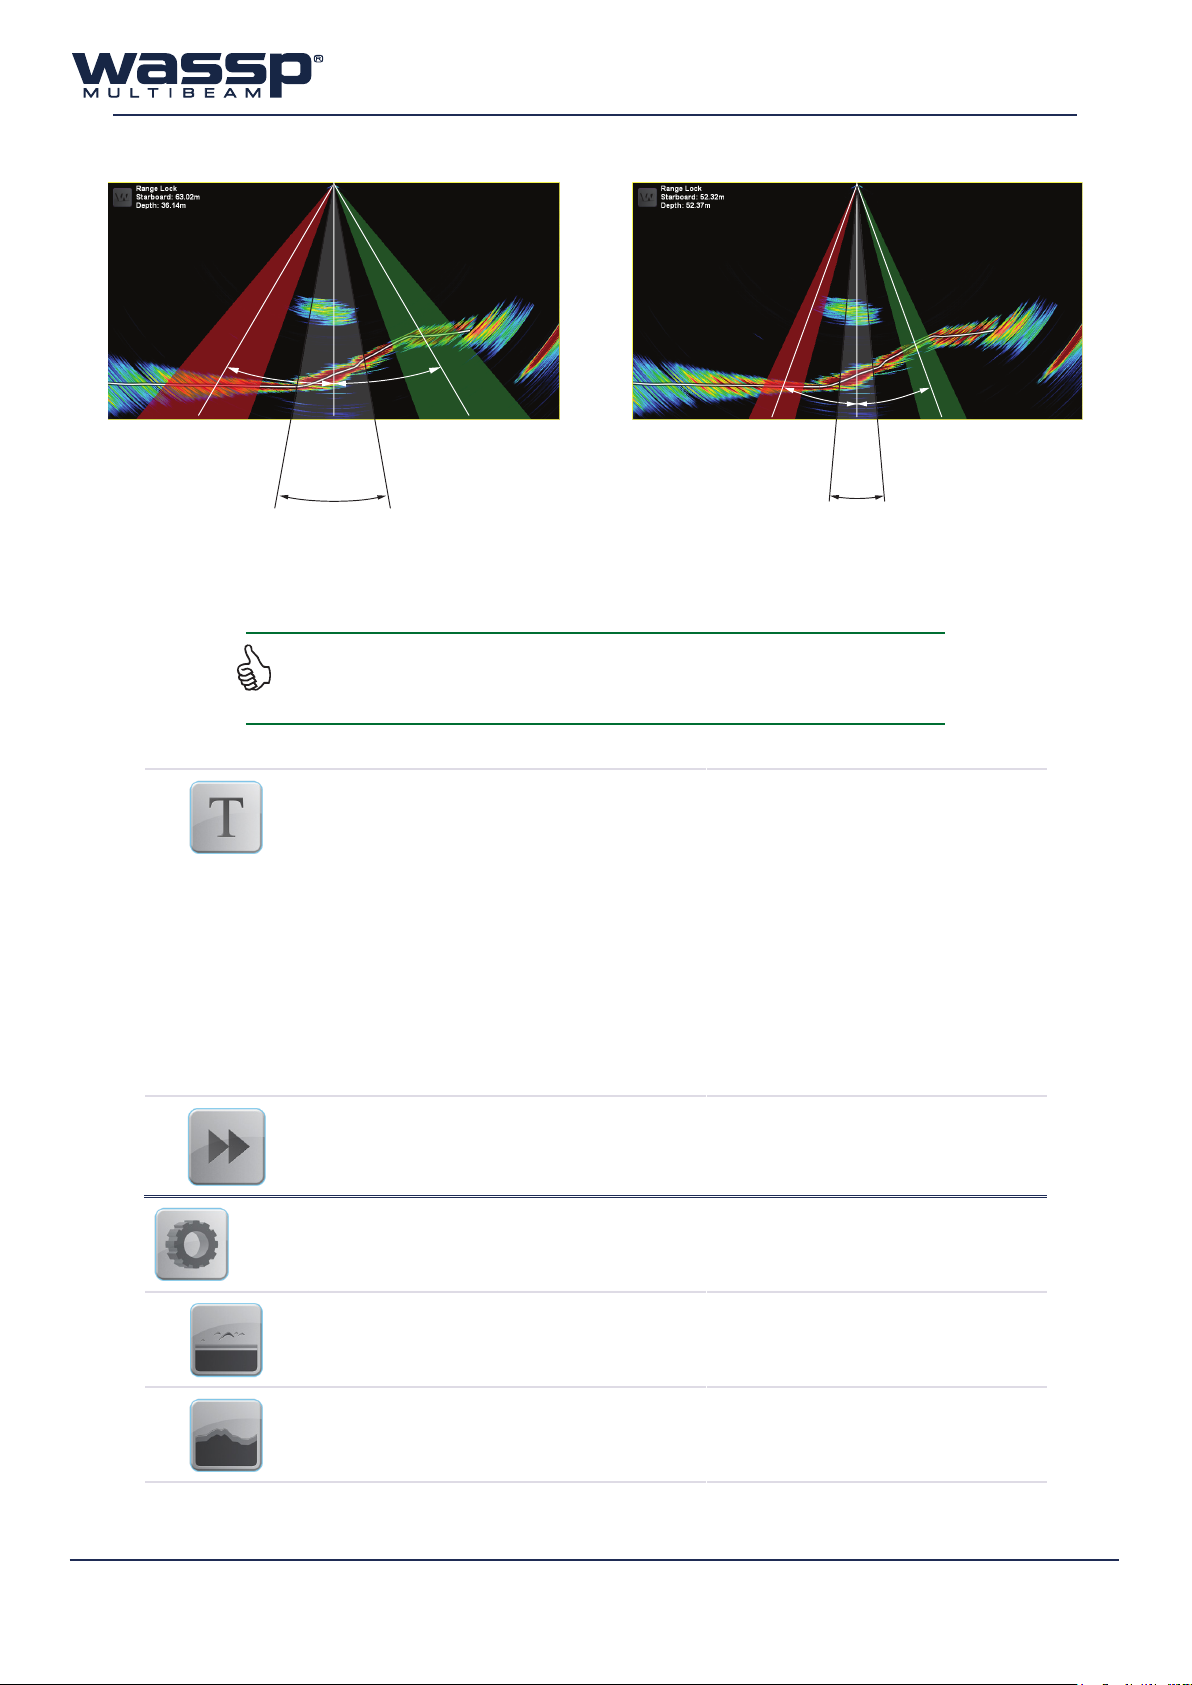
This adjusts the angle which the centres of the port and starboard
beams are set from the middle beam. Larger angles move
the beams further from the middle beam, and smaller angles
move the port and starboard beams closer to the middle beam.
The beam angle can be set to 5, 10, 15, 20, 30, or 40°.
This adjusts the width of the three individual beams used for the
Single / Triple Beam Display, and can be set to 5, 10, 15, 20, 30,
or 40° widths. Selecting a 10° beam width with a 20° triple beam
angle will therefore give a 50° swath for the Triple Beam view. See
Figure 6.
Doc. P/N: WSP-009-008
Version: V1.3
Issue Date: April 2014
www.wassp.com
11
Page 18
Triple
Beam Angle
Set to 30°
Example 1
Example 2
Triple
Beam Angle
Set to 20°
Port Beam Starboard Beam
Middle
Beam
Beam Width
Set to 20º
Figure 6. Beam Angle and Beam Width examples
Note: While adjusting Beam Angle and Beam Width, it is suggested to set the Acoustic Layout to display
both the Sonar and Triple Beam displays simultaneously, and to enable the Triple Beam overlay on the
Sonar Display so that changes to the beam properties can be seen while changing settings.
text BOx
advance
Port Beam
Beam Width
Set to 10º
Middle
Beam
Starboard Beam
Provides the option of a Text Box to appear in the top left-hand
corner of the Single / Triple Beam Display.
Several options are available for display:
► Depth: Overlays the current depth on the display.
► Status: beam properties, current cursor window and zoom
status.
► Roll: current vessel roll.
► Heading: current vessel heading.
► Cursor: depth at the cursor location.
► GPS History: latitude / longitude at cursor.
► Tide Oset: current depth adjustment due to the tides.
Changes the pixel width and consequently the rate (from 1 to 5)
at which the Single / Triple Beam information scrolls across the
display. Click to display options and select the rate.
12
cOnfiG
BOttOm lOck
seaflOOr line
www.wassp.com
Settings for the Single / Triple Beam Display which can be toggled
are found under this menu.
This enables a traditional bottom lock mode where the changes in
bottom depth are ignored and the bottom is drawn flat. Fish and
other echoes are shown relative to this flat bottom image enabling
better discrimination between bottom fish and the seafloor.
This button toggles the software-generated line of the estimated
profile of the seafloor. The line is white, and is drawn as an overlay
on the Single / Triple Beam Display.
Doc. P/N: WSP-009-008
Version: V1.3
Issue Date: April 2014
Page 19
Operator Manual
Acoustic Display Modes
smOOthinG
nOrmalise
seaflOOr trackinG
triple Beam
fish OptiOns
Selecting this option enables the smoothing option for the Single
/ Triple Beam display.
Enable this to normalise the colours on the sonar display for
intensity based on power level, spreading and absorption loss.
Increasing the power will thus decrease the gain by a factor that
should mean fish echoes from the same fish will be the same
colour at any power level.
This is the method used by the program to constantly display the
seafloor during scanning operations regardless of the changes
in seafloor depth. This is indicated by the word (Tracking) being
tagged to the end of the words Manual Zoom in the Text Box
when the text box Status option is enabled.
Seafloor Tracking must be enabled in the Config sub-menu and the
Range Control dial set to automatic (GREEN). If Seafloor Tracking
is disabled in the config sub-menu, the word (Tracking) disappears
from the Text Box. If the Range Control setting is in manual mode
(YELLOW) and the seafloor then drops below the range setting, the
seafloor will stop being tracked (and lost from the screen).
This button enables the Triple Beam display. Triple Beam orientation
can be changed between Horizontal and Vertical in the System
Tab of the System Configuration Utility (see “7.1.4 System” on page
46).
This button opens the Fish Options window.
See “3.4 Fish Options” on page 16 for more details.
3.2.2 Display Oset (Shifting)
Zooming the Single / Triple Beam Display, by default, is centred toward the transducer location (0 m
depth), but the focus of the display can be changed by using a display oset.
With the Bottom Lock mode disabled, left-click on the Single / Triple Beam Display window and keep
holding down the left mouse button. By scrolling the mouse wheel, the zoom centre on the Single /
Triple Beam Display can be shifted from 0 metres depth (centred on the transducer), to deeper down
the water column.
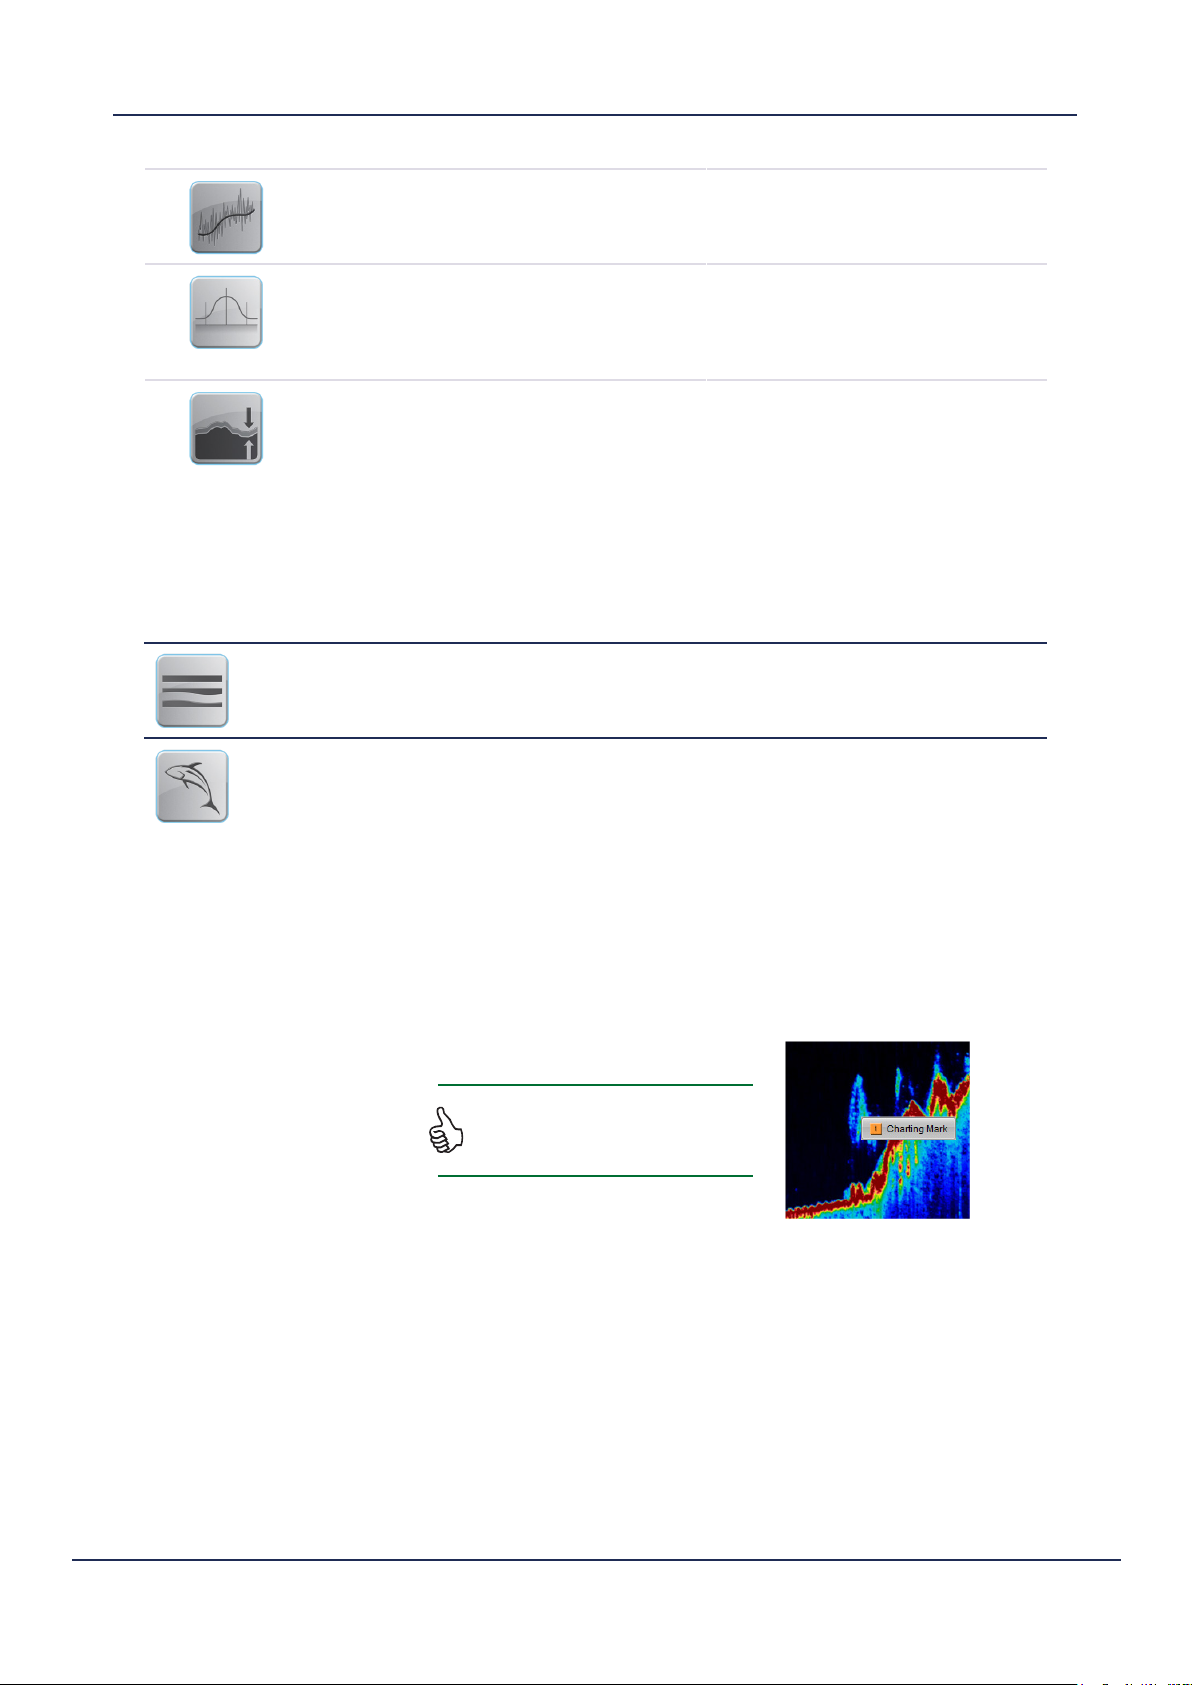
Note: Right-click at a point on the Single /
Triple Beam display to send a mark to the
Charting display at the cursor location.
Advantages
à Shows past information.
à Width and colours of seafloor return can be used to help determine
bottom types.
à Adjustable beam width allows optimisation for full coverage or high
resolution to see small detail changes.
à Display redraws dynamically when range, gain, or zoom change.
Disadvantages
Ä Harder to relate the location of features seen to the vessel’s position.
Ä Does not show all information seen by the sonar view.
Doc. P/N: WSP-009-008
Version: V1.3
Issue Date: April 2014
www.wassp.com
13
Page 20
3.3 Sidescan Display
The sidescan display is another display type for viewing information generated from sonar data
received by the system. The display is drawn on the screen as a waterfall – the newest information
appears at the top of the screen, while the oldest falls o the bottom of the screen. This is similar to
the way the Single / Triple Beam Display operates, except that in their case, the new data appears on
the right and the old data disappears o the left of the display.
The left side of the Sidescan Display shows the signals received from the port side while the right
shows signals received from the starboard side. By default, the sidescan view starts at the centre of
the vessel and works its way out to port and starboard.
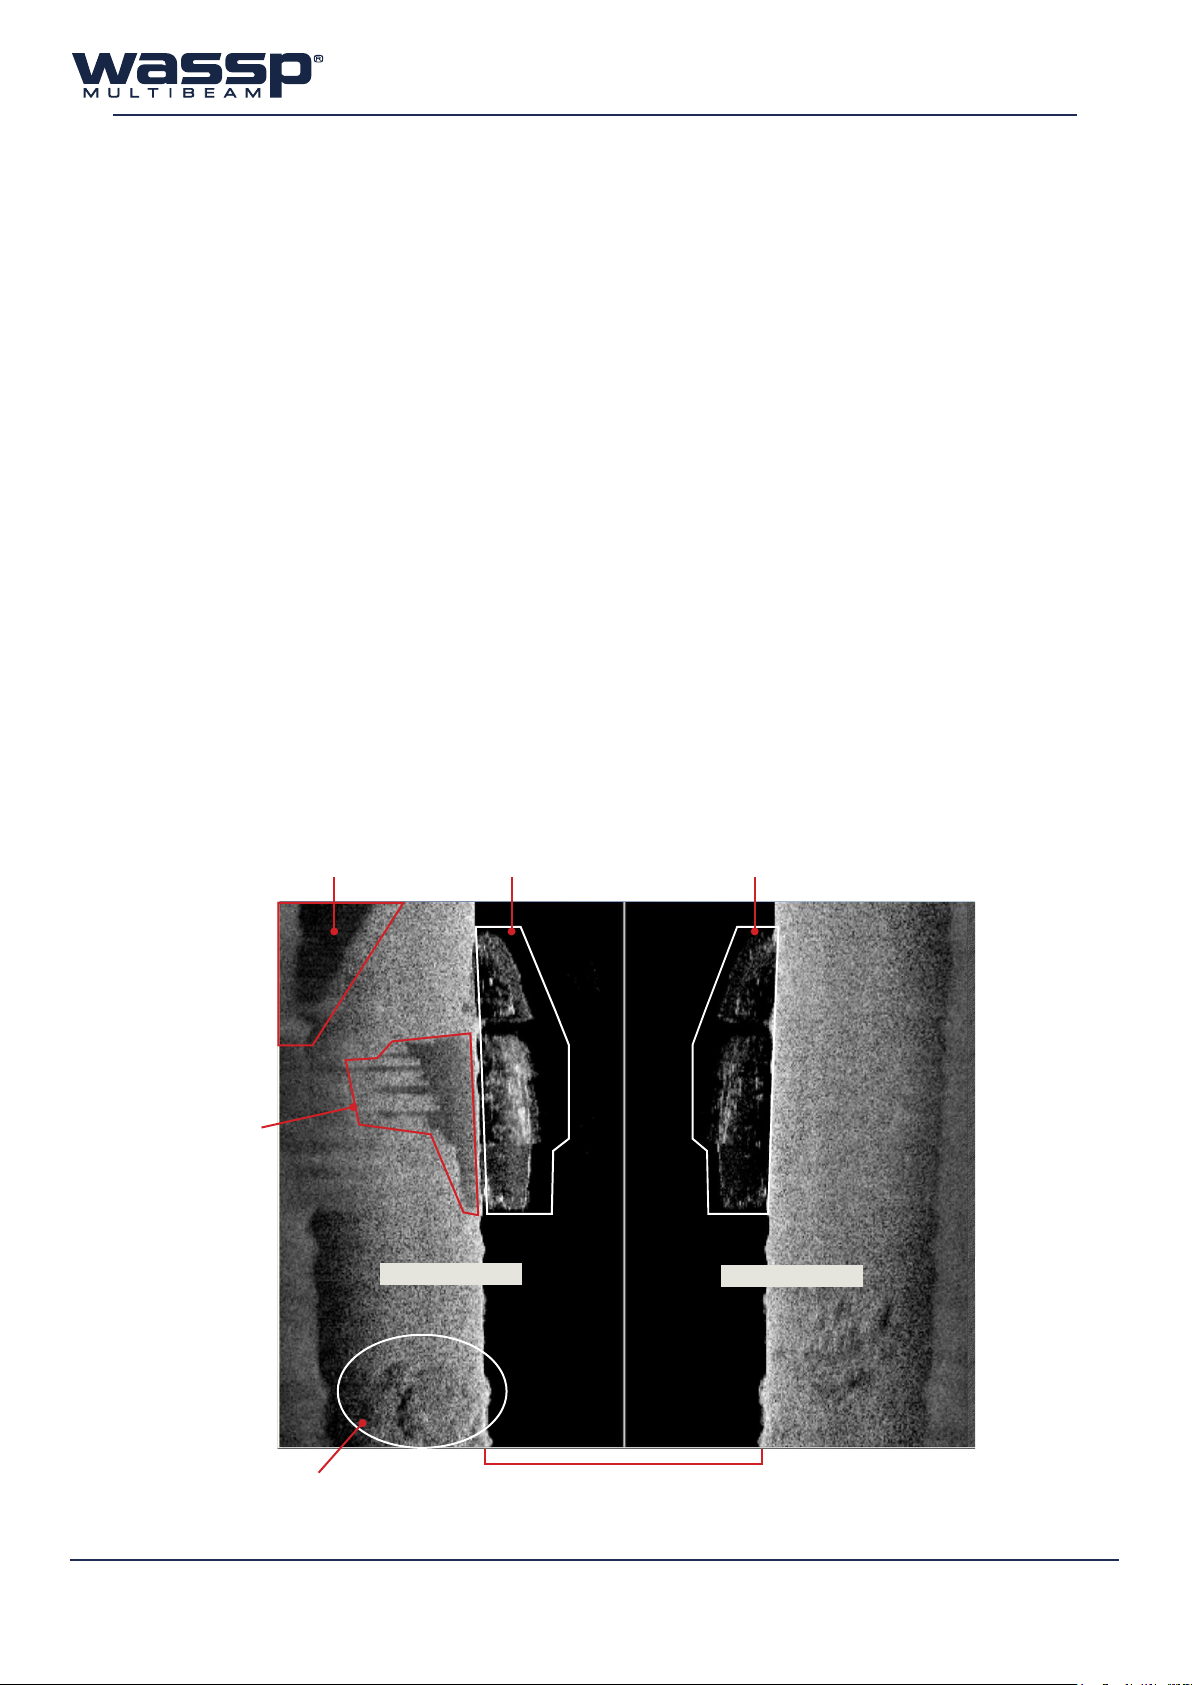
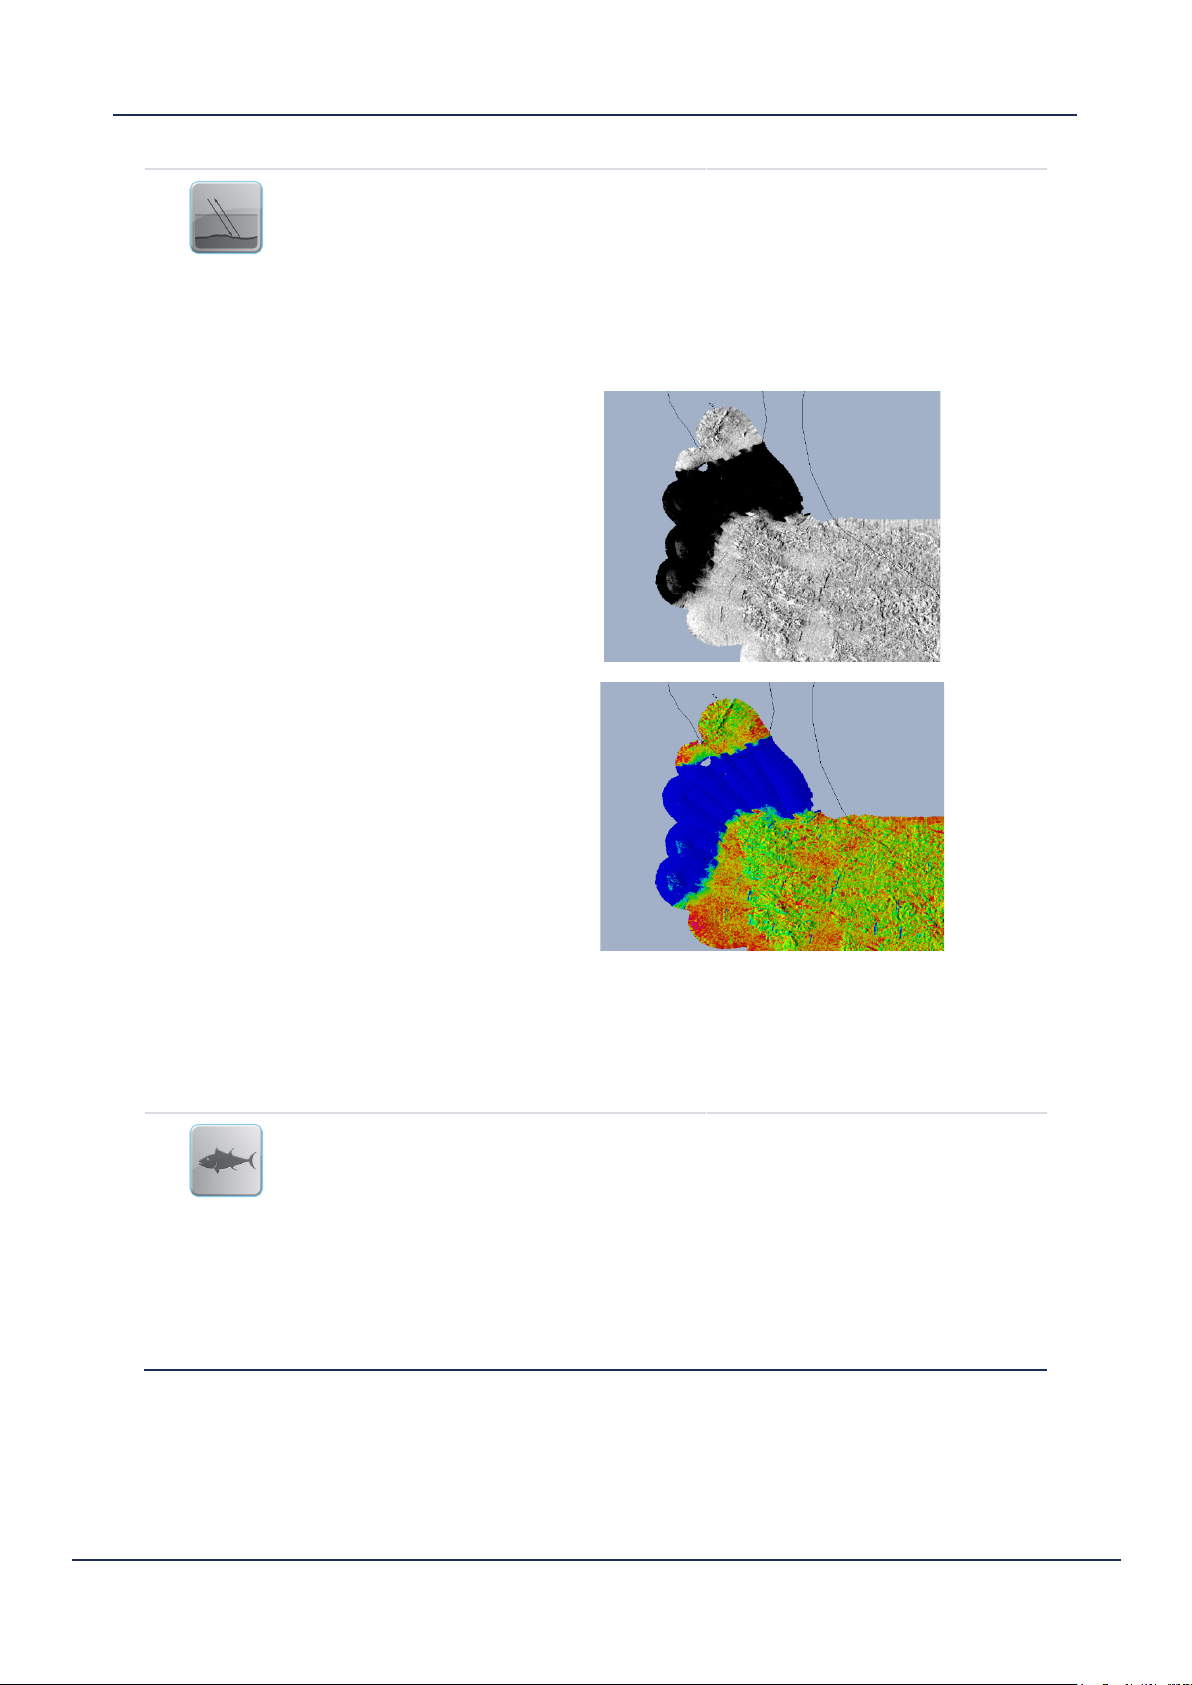
As the sidescan image moves further out along the seafloor, the picture shows features on the seafloor.
Objects such as rocks appear as bright white marks followed by a shadow. Harder ground gives strong
returns (lighter on the grey scale), while a patch of mud or kelp causes a dark patch/shadow to appear.
The primary advantage of the sidescan view over the other views is in locating and identifying objects
on the seafloor o to each side of the vessel. Some structures such as a shipwreck may appear like a
large fish school on the sonar view and thus not appear as an object on the other acoustic or chart
displays. Figure 7 shows how a wreck sitting on the seafloor can be distinguished as a clearly shaped
structure by using the Sidescan Display, allowing the user to interpret the sonar information from a
dierent viewpoint.
Due to the nature of the origin of the data, any signals of significant strength register as a faint mirror
on the opposite side of the display.
Shadow
of wreck
Area of soft ground Indication of ship wreck Reflection of ship wreck
Port Side
Starboard Side
14
Rocky area
Water column
Figure 7. Sidescan Display
www.wassp.com
Doc. P/N: WSP-009-008
Version: V1.3
Issue Date: April 2014
Page 21
Operator Manual
Acoustic Display Modes
3.3.1 Conguration
The Sidescan Display can be configured by clicking the in the top left corner of the display
window.
text BOx
Gain
Provides the option of a Text Box to appear in the top left-hand
corner of the Single / Triple Beam Display.
On: Enables the text box overlay.
Gain: Current sidescan gain setting.
Cursor: Current cursor displacement.
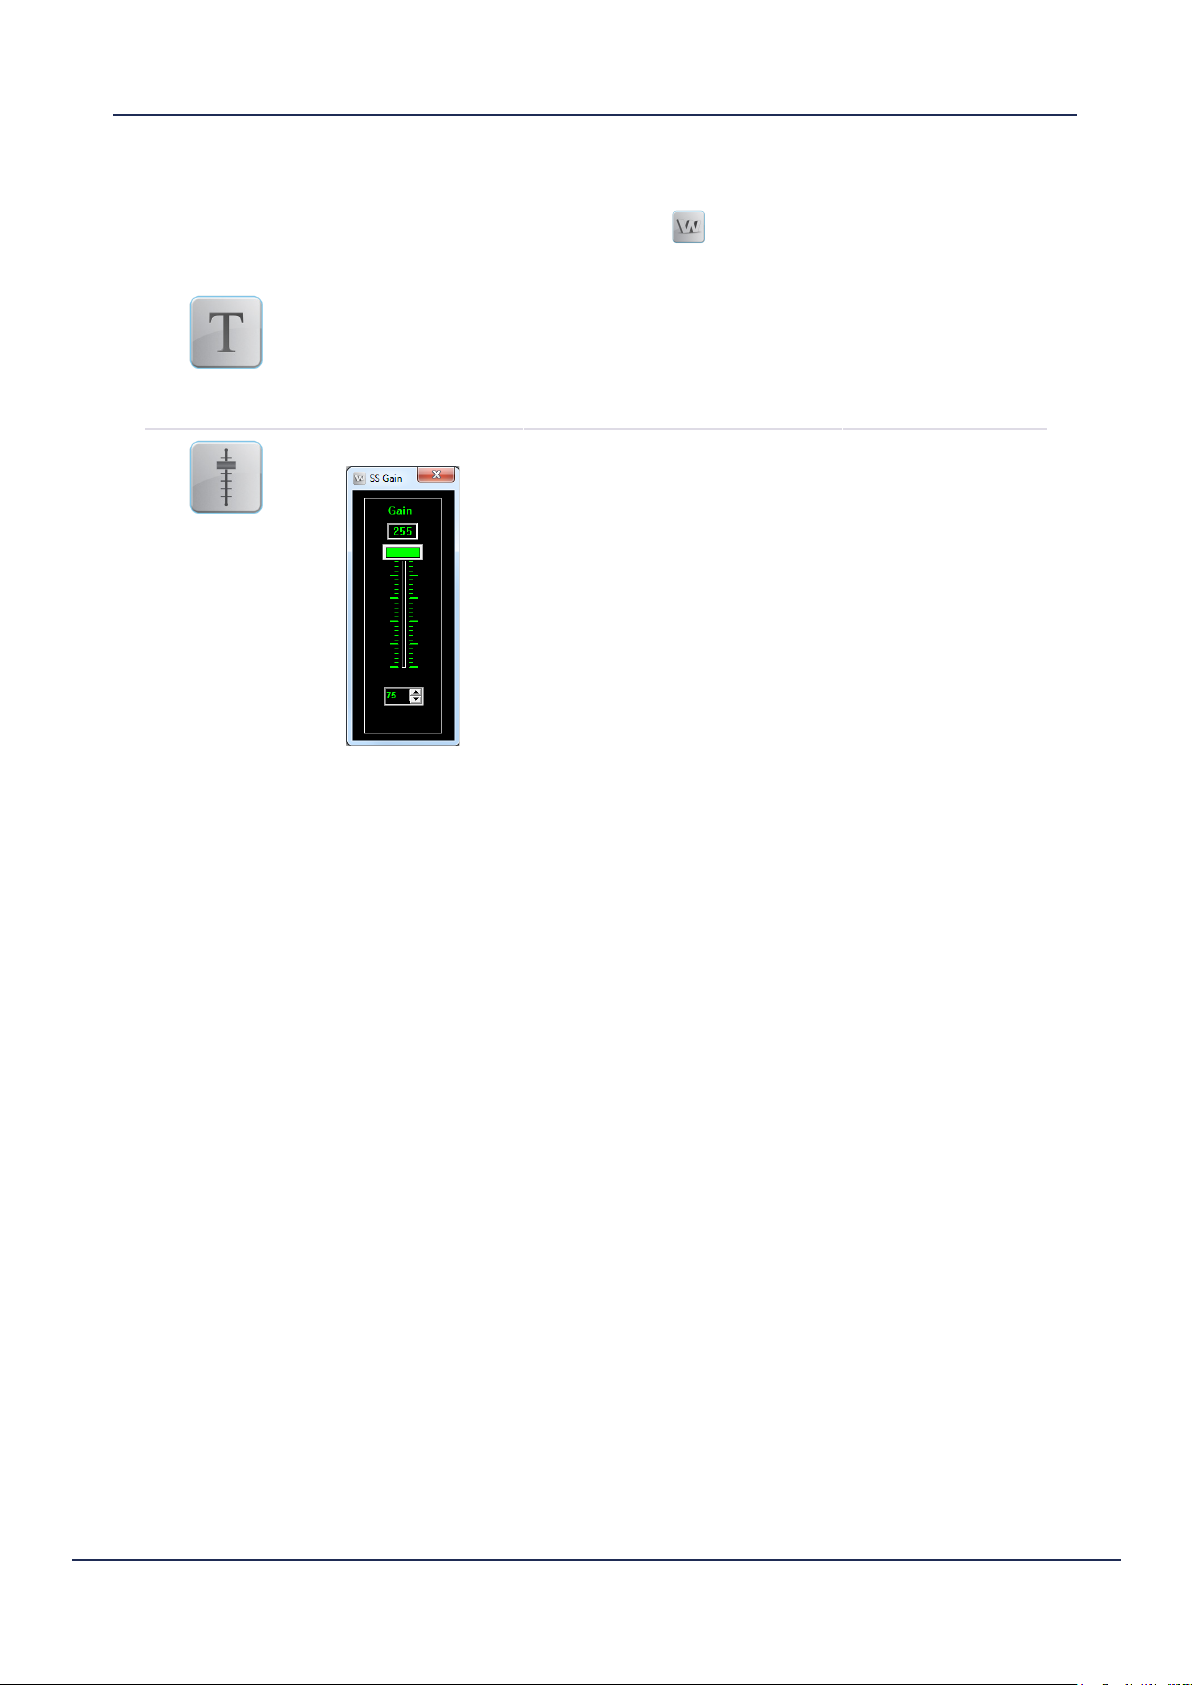
When you click the Gain button the Sidescan Options box appears
and enables you to adjust the gain factor for the Sidescan Display.
The slider allows you to increase or decrease the brightness scale
of the Sidescan Display.
The number in the white box is the Sidescan Gain Threshold
Limit. Adjusting this value will eectively change the contrast of
this display.
3.3.2 Zooming
The Sidescan Display can be zoomed in or out independently of other screens. Click in the Sidescan
Display and roll the scroll wheel to zoom in or out. To return to the default zoom level, double-click
in the Sidescan Display window.
Advantages
à Shows a detailed picture of the seafloor, allowing you to locate and
identify objects on the seafloor o to each side of the vessel.
à Can detect small objects or changes in the seafloor texture or density.
Disadvantages
Ä Position of display content is not georeferenced.
Ä Doesn’t compensate for the slope of the seafloor.
Doc. P/N: WSP-009-008
Version: V1.3
Issue Date: April 2014
www.wassp.com
15
Page 22
3.4 Fish Options
The Fish Options window contains preferences for watercolumn target detection. The user is able to
select any depth range and threshold for target detections, and view a detection histogram with an
adjustable 30 minute history. The settings contained in this window aect both the 2D and 3D fish
shown on the charting displays (NB: the 2D fish will ignore the history setting).
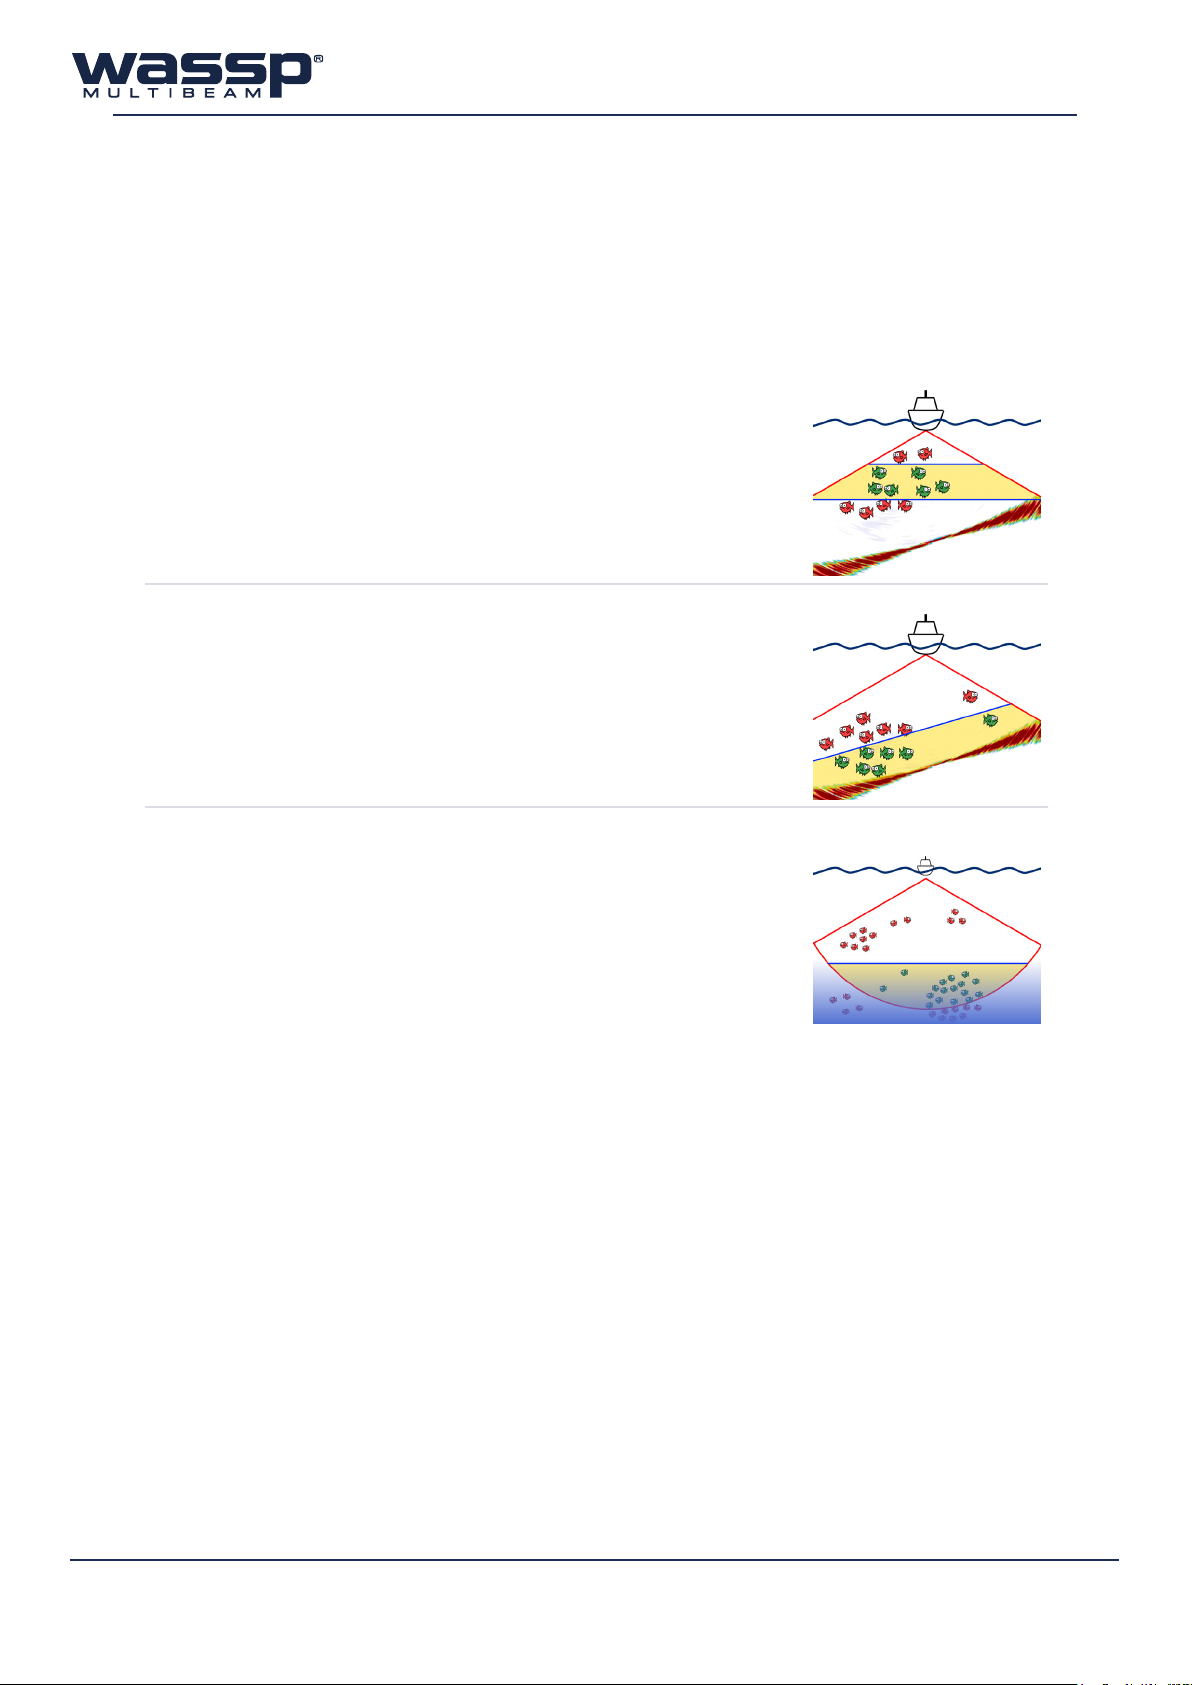
3.4.1 Fish Display Options
► Between Depths: The user can set a depth range for watercolumn
detections. The WASSP program will ignore detections outside of
this range.
► From Seafloor: If the user is only interested in near-bottom targets,
the From Seafloor option will only use detections that are located
a certain distance above the seafloor, ignoring the rest of the water
column. If Bottom Lock is enabled (see “Bottom Lock” on page
12), the Single / Triple Beam display will show a green line where
the detections start.
► From Range: If the user has set detections to “All Targets in Ping”
(see “System” on page 46), then the “From Seafloor” setting
becomes “From Range”. In this case, users are generally working in
deep water without a discernable seafloor. The detection range will
be from the last signal acquired up the water column. The depth of
the last signal will depend on the setting of the range dial.
3.4.2 Fish Threshold
Generally speaking, large fish return a stronger signal than small fish. The Fish Threshold control
dial allows you to tune the “Fish Detection” for your vessel. The control has a range of 1 to 30. It is
recommended that this threshold is set high enough that only the desired targets are ‘detected’. This
control also aects the fish shown on the charting displays as well as the Fish Histogram.
3.4.3 Fish Histogram
The histogram shows a gain-adjusted colour table to help reference the Fish Threshold to normalised
signals on the Sonar and Single / Triple Beam displays. The Fish Threshold setting is visible as a white
line on the colour table. By adjusting the Fish Threshold and referring to the histogram, you will find
an optimum level for your vessel’s installation.
Doc. P/N: WSP-009-008
Version: V1.3
Issue Date: April 2014
16
www.wassp.com
Page 23
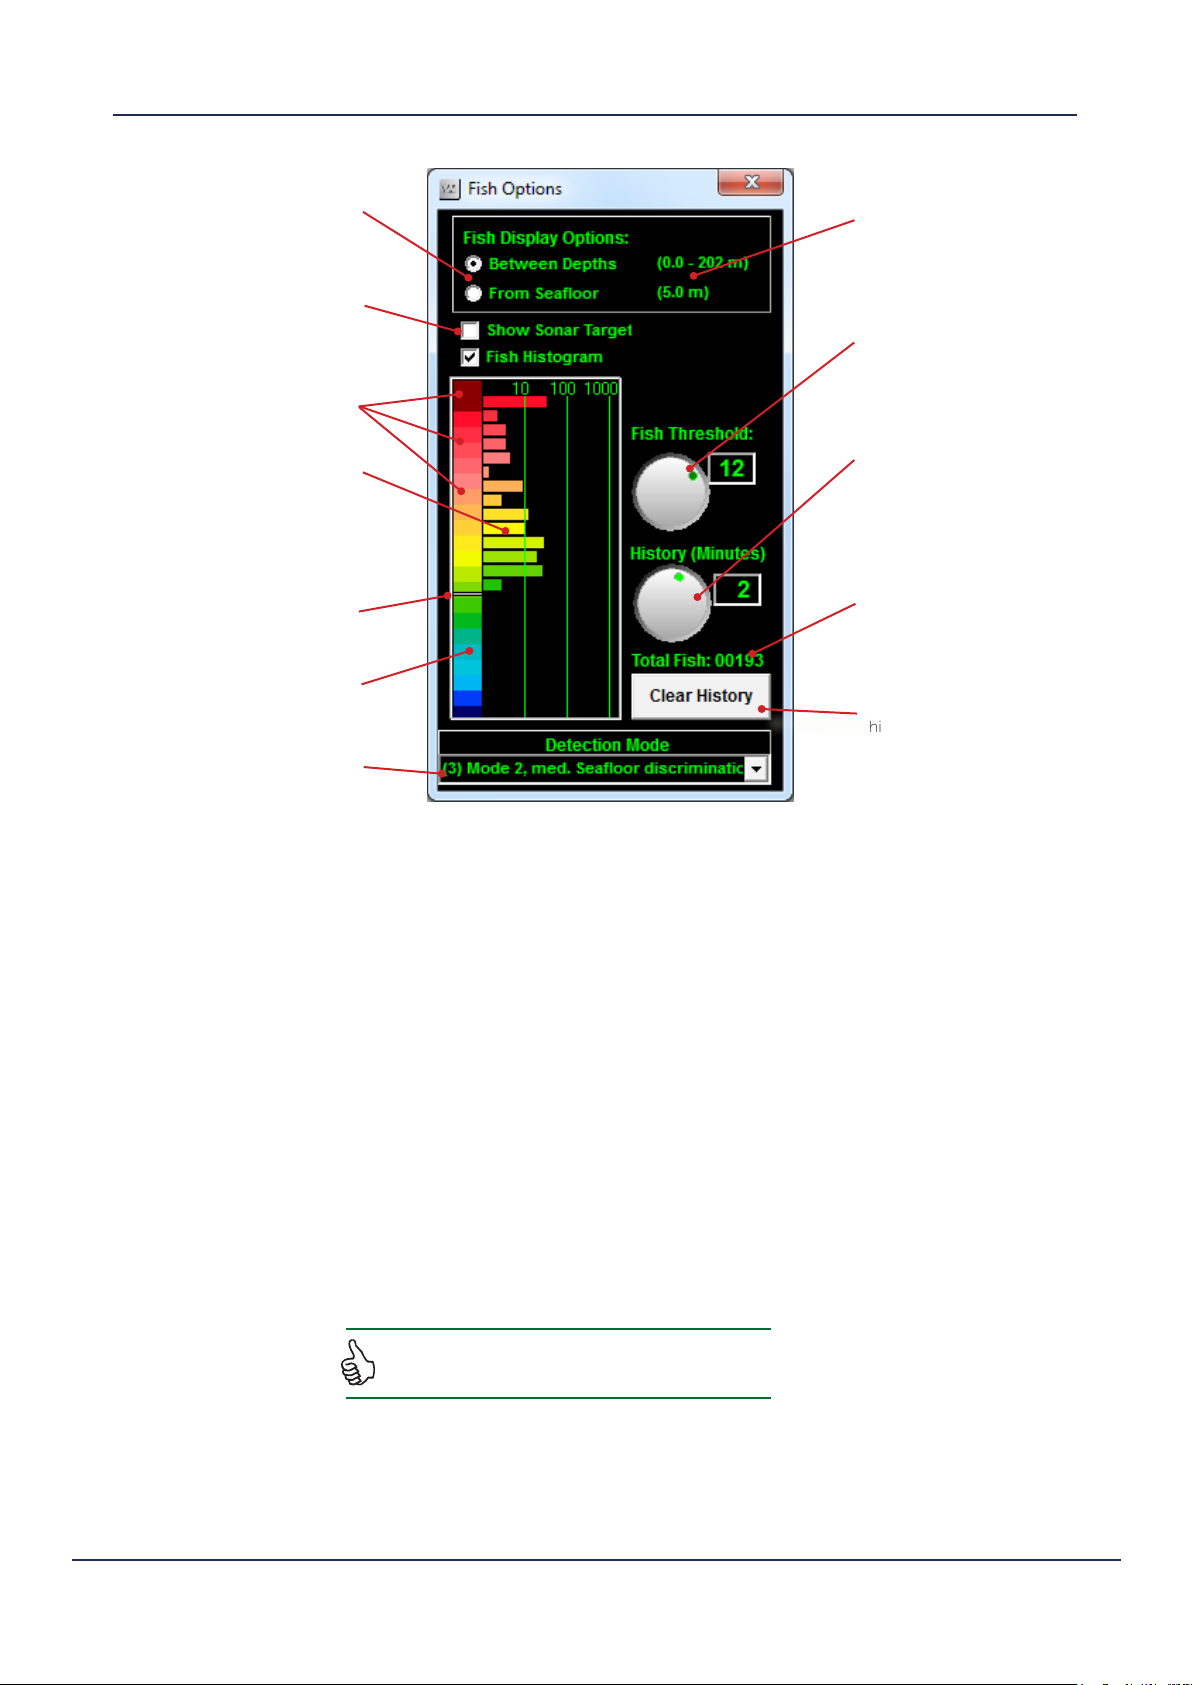
When the Between
Depths or From Seafloor
selections are clicked,
the Fish Histogram will
Hide to allow the ranges
to be changed if desired.
Show Sonar Targets will
show detected targets in
real-time on the Sonar
display
These Colours vary with
the Gain Control dial
This Bar shows that
around 10 Targets at this
amplitude have been
detected in the last time
period (2 minutes).
Operator Manual
Acoustic Display Modes
Current Detection
Depth settings
Fish Threshold dial,
adjust this to change
the lowest intensity
of sonar echoes to
use for fish targets
History dial, history
range is 30 seconds
to 30 minutes. The
current settings is 2
minutes
This line shows the current
Target Threshold
No Targets will be shown
on the Histogram if they
are below the Target
Threshold
Detection Mode selection.
Presets are either Mode
1 or Mode 2, with varying
descrimination settings
Total target count
within history time
Clears all target
histogram information
Figure 8. Watercolumn Target (Fish) Options Window, showing Histogram
3.4.4 Detection Mode
WMB-X230 oers two modes for fish detection (Mode 1 and Mode 2). Both modes detect fish, but
vary slightly in their approach.
Seafloor discrimination settings will adjust how detections occur on outer beams. When discrimination
is set to none, the detection algorithm will try to detect targets as close to the seafloor as possible,
but may incorrectly identify part of the seafloor return as targets. When discrimination is set high, the
detection algorithm will try to ignore targets close to the seafloor in case they are part of the seafloor
return. Medium discrimination is a balance between the two.
Doc. P/N: WSP-009-008
Version: V1.3
Issue Date: April 2014
Note: Use the ‘Show Sonar Targets’ checkbox to see what is
being detected as targets in real-time on the Sonar display.
www.wassp.com
17
Page 24

4. Chart Display Modes
► Each charting display can be zoomed by using the mouse wheel - just click on the display and
scroll up or down to zoom in or out.
► The zoom on each acoustic display can be reset by double-clicking on the window.
The following display modes make up the charting feature of the WASSP software:
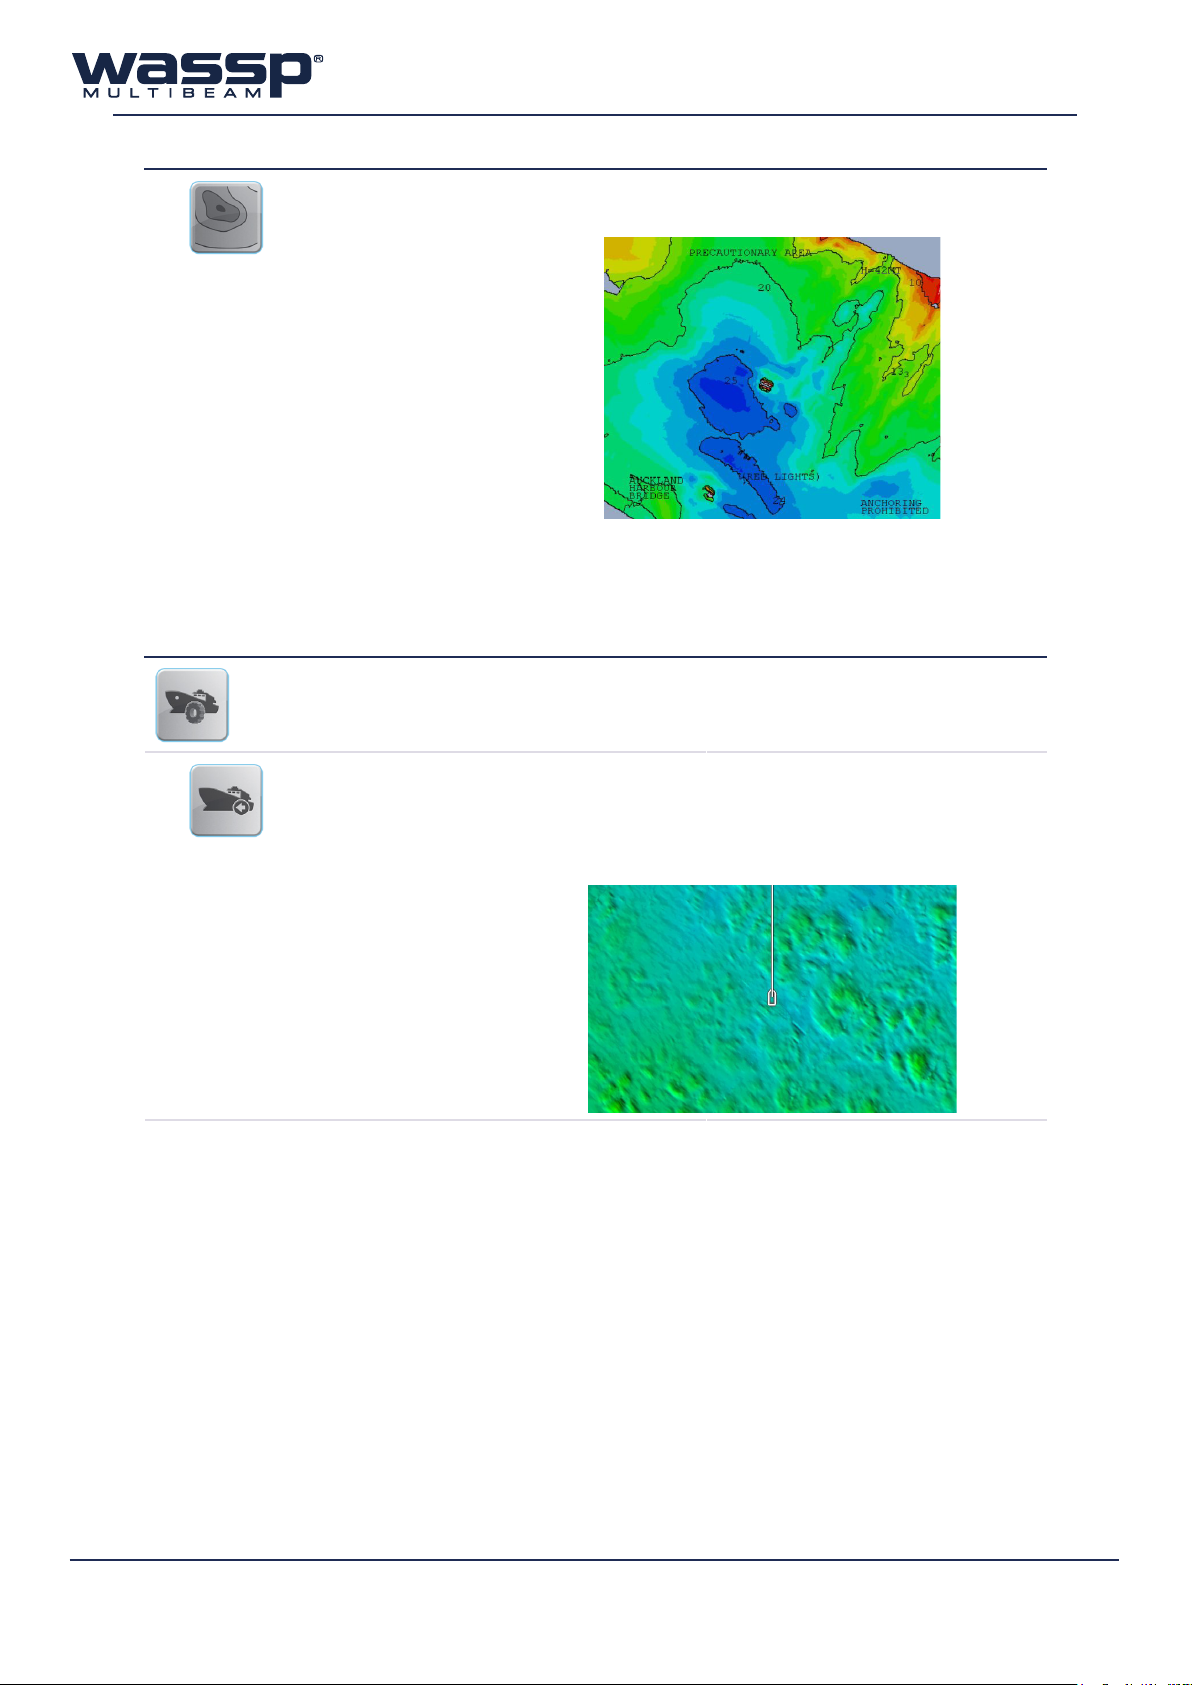
4.1 2D Display
The 2D Display shows a bird’s-eye panning view of the chart and WASSP seafloor data. This is the main
chart display and is used for moving around the globe and zooming in/out.
The interface to the chart display uses the functions of a standard mouse or touch screen.
► Left Mouse Button: Select menu, interface with map (click and drag to pan around).
► Mouse Wheel: Zoom In/Out
Menu Button
See “Configuration” on page 19
Uncharted area
Heading line
See “Chart Tab” on
page 52
COG line
See “Show COG”
on page 26
Bookmark
See “Add Bookmark”
on page 27
North indicator
See “North Up” and
“Heading Up” on page 25
Cursor
Text Box values are
dependant on the
cursor location
Measure line
See “Profile Options”
on page 28
Text box
See “Text Box”
on page 28
Vessel
See
“Vessel”
on page
24
Current Grid display resolution
See “Database Manager” on page 41
Mark
See “Marks” on page 26
Figure 9. Charting 2D Display
Uncharted area
Fish School
See “Fish Options” on page 10
Scale indicator
See “Show Scale on 2D” on page 52
18
www.wassp.com
Doc. P/N: WSP-009-008
Version: V1.3
Issue Date: April 2014
Page 25

Operator Manual
Chart Display Modes
4.1.1 Conguration
The 2D Display can be configured by clicking the in the top left corner of the display window.
layers
liGhtinG/cOlOur
This menu contains the settings that influence how the bottom
data is drawn
cOlOur taB
The Colour Tab shown allows you to set the depth limits over
which the colour range will apply when viewing seafloor data.
The maximum colour depth is set to 800m by default. This can
be modified under “Cartography” on the Chart tab (see page
52).
There are two angled arrow buttons (
► The top one sets the Red colour depth.
► The bottom one sets the Blue colour depth.
, ):
Both buttons can be clicked on with the left mouse button and
then dragged up/down.
When the mouse button is released, the colours will change on
the main window.
The other four up/down arrow buttons can be used to fine-tune
the colour range.
Colours only eect the display of seafloor data if in Colour
Depth mode.
The Auto Colour check box will automatically assign a colour
range, centred around the current depth.
While Auto Colour is enabled, it is not possible to manually
change the upper or lower colour settings. Instead, the range
value can be modified using the up/down arrows beneath the
Auto Colour check box.
Doc. P/N: WSP-009-008
Version: V1.3
Issue Date: April 2014
www.wassp.com
19
Page 26
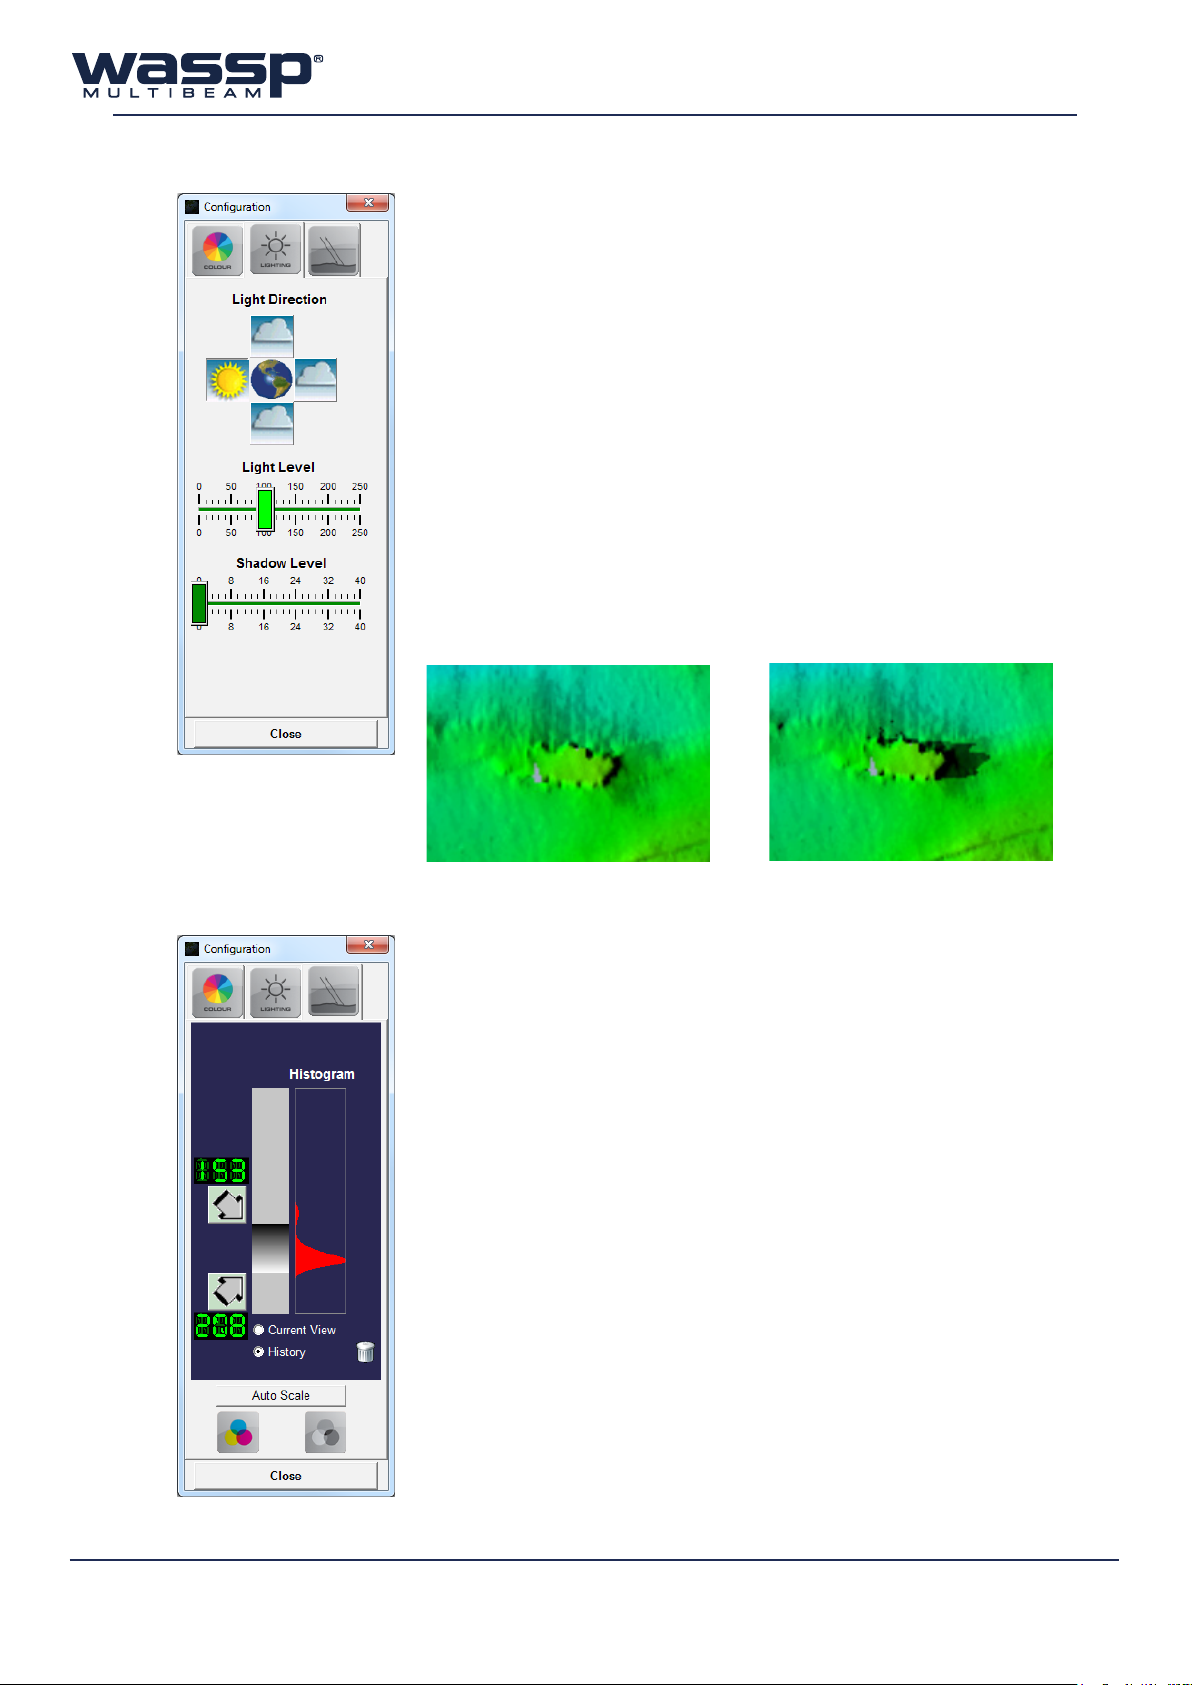
liGhtinG taB
The Lighting Tab shown here contains various settings for how
lighting operates in the chart displays.
The Light Direction setting allows you to set the direction from
which the rendered light is coming from when viewing seafloor data.
There are four choices: North, South, East or West.
Left click on one of the four buttons around the globe image to
change the lighting direction.
The Light Level slider can be left clicked with the mouse and dragged
left or right to adjust the intensity of the lighting. When the left mouse
button is released, the seafloor data shown will be updated with the
new lighting level.
The Shadow Level slider can be used in a similar way to the Light
Level slider to adjust the length of shadows cast by objects on the
seafloor. The darkness of the shadow is adjusted by the Light Level
slider.
Shadow Level set to zero (0), and it
is dicult to tell the significance of
this wreck.
Shadow Level set to eight (8) makes
this wreck cast a shadow. The length
of the shadow reflects how big the
wreck is.
hardness taB
The Hardness (Backscatter) Tab shown here allows you to set the
backscatter colour range.
Correct setting of these controls will greatly assist in viewing seafloor
changes.
To change the gain values for Soft/Steep bottom (top arrow) or Hard/
Flat bottom (bottom arrow), left click on one of the arrows and hold,
then drag up/down to change the values.
The Histogram can display either the backscatter range visible in
the current display (Current View), or from data collected over time
(History). The History data can be cleared by clicking the Trash icon.
The display range can be automatcially adjusted to fit around the
histogram by selecting “Auto Scale”.
Colour or black and white (grey) backscatter can be selected by
clicking on the Colour or Grey buttons at the bottom of the window.
20
Click on Close to exit the Configuration window.
www.wassp.com
Doc. P/N: WSP-009-008
Version: V1.3
Issue Date: April 2014
Page 27
Operator Manual
Chart Display Modes
cOlOur depth
Colour by depth allows the user to show the seafloor data
coloured between the selected values on the configuration
windows.
By changing this range of colours you can more easily
visualise detail of the area you are viewing.
Any area which is outside the selected colour range will
show up as grey.
Doc. P/N: WSP-009-008
Version: V1.3
Issue Date: April 2014
www.wassp.com
21
Page 28

mOnOchrOme
depth
Monochrome depth is used to display the seafloor using
only one colour.
This colour can be changed from the System Config (System
Page).
The seafloor image will still be lit from the selected lighting
direction.
This mode is useful if using 3D water column to help
distinguish between the 3D water column marks and the
seafloor.
22
www.wassp.com
Doc. P/N: WSP-009-008
Version: V1.3
Issue Date: April 2014
Page 29
Operator Manual
Chart Display Modes
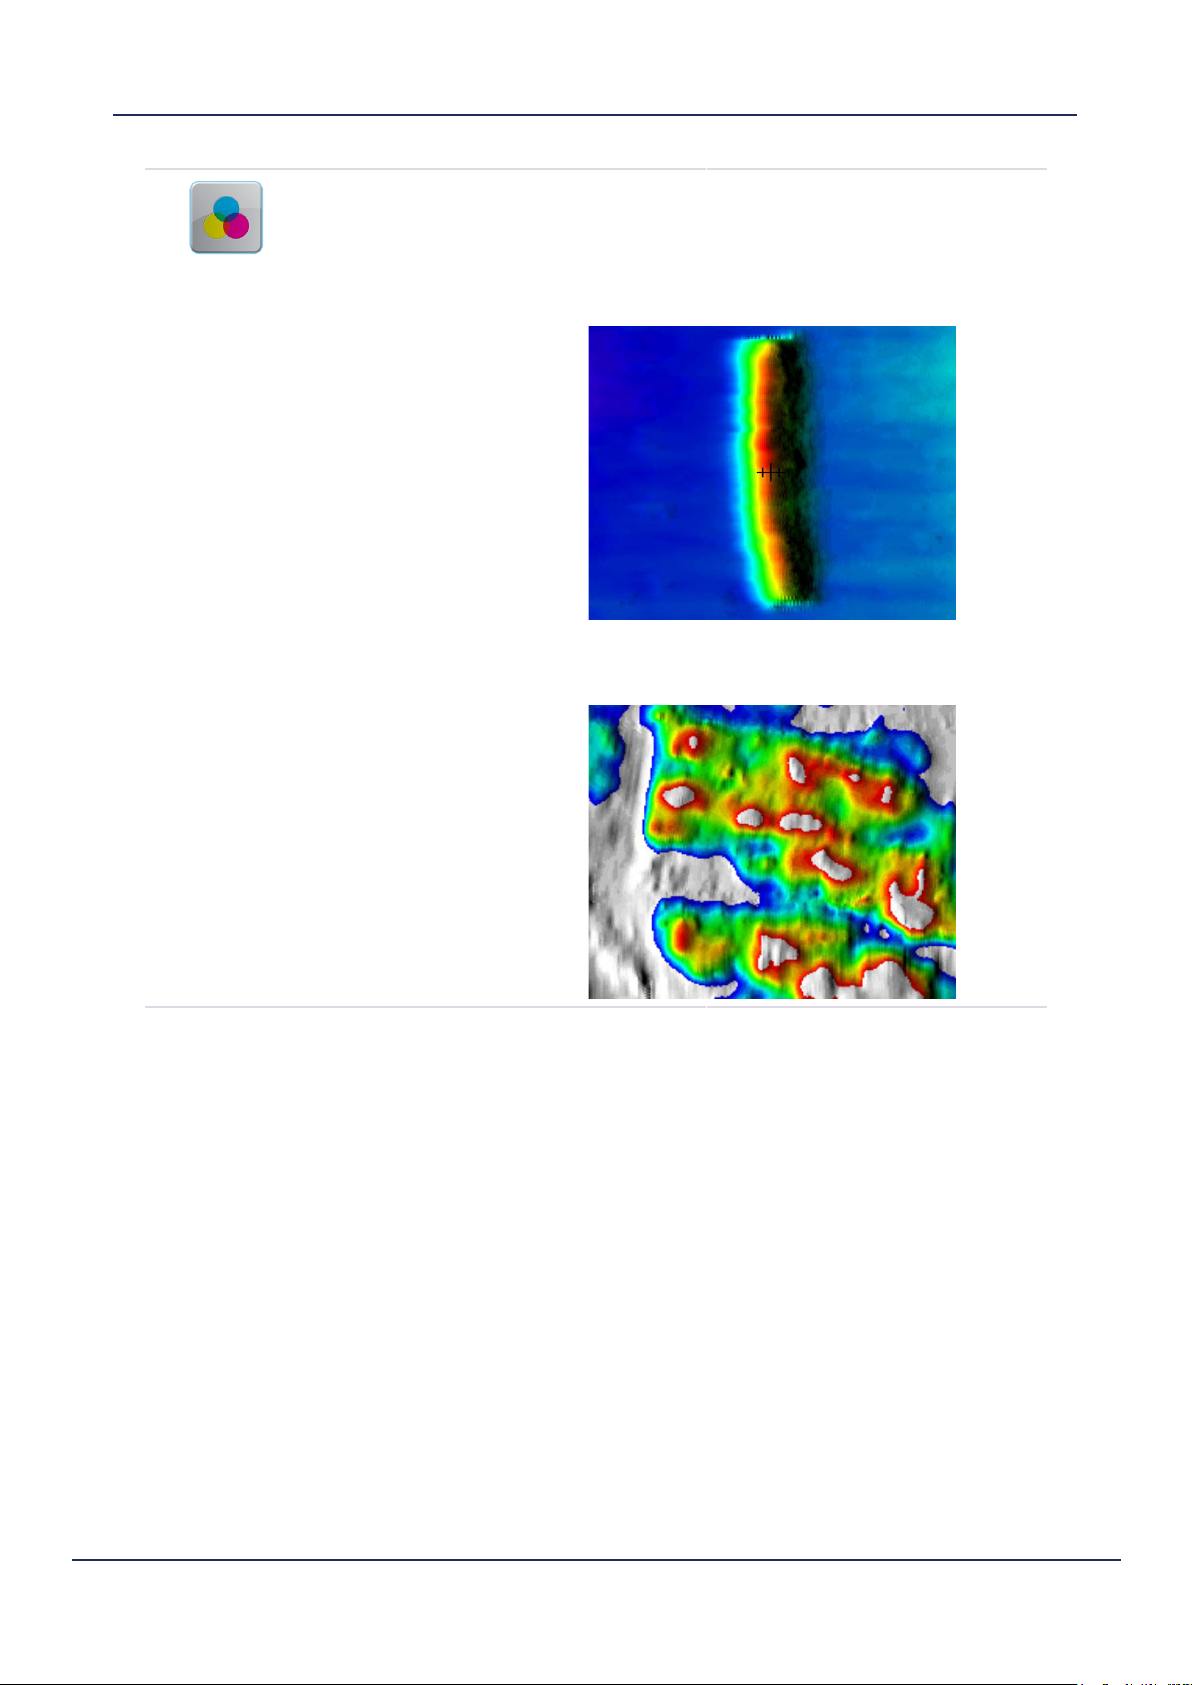
Backscatter
Show backscatter is used to display the backscatter/
hardness information.
The backscatter information can be displayed in grey-scale
or colour-scale. See “Hardness Tab” on page 20 for
configuration.
Changes in hardness will be drawn as dierent intensity/
colour.
shOW 2d fish
This mode is very useful for finding the changes in seafloor
even when the seafloor is very flat. This gives the user a
good indication of where the rocky/hard areas and the soft/
muddy areas are.
Show 2D Fish will overlay the detected water column marks
on the 2D display.
These marks are coloured by intensity, so red marks are
strong echoes and blue marks are weak echoes.
To get the best from the water column data, the WASSP
GUI fish overlay settings should be correctly set. It is
recommended that the Fish Threshold in WASSP is set to
at least 4 depending on how noisy the sonar display is. See
“Fish Options” on page 16 for more information.
Doc. P/N: WSP-009-008
Version: V1.3
Issue Date: April 2014
www.wassp.com
23
Page 30
cOntOur lines
This mode draws the seafloor by colour and traces the
contours of the seafloor at the specified interval.
This interval is setup in the Chart Tab of the System
Configuration Utility under Bathymetry heading. See “7.4
Chart Tab” on page 52 for more information.
vessel
centre On vessel
This menu contains settings pertaining to how the vessel is
displayed on the chart windows.
When this button is enabled, the chart will stay centred on
the vessel position.
To disable this mode, click on the icon again or pan the
display.
24
www.wassp.com
Doc. P/N: WSP-009-008
Version: V1.3
Issue Date: April 2014
Page 31
Operator Manual
Chart Display Modes
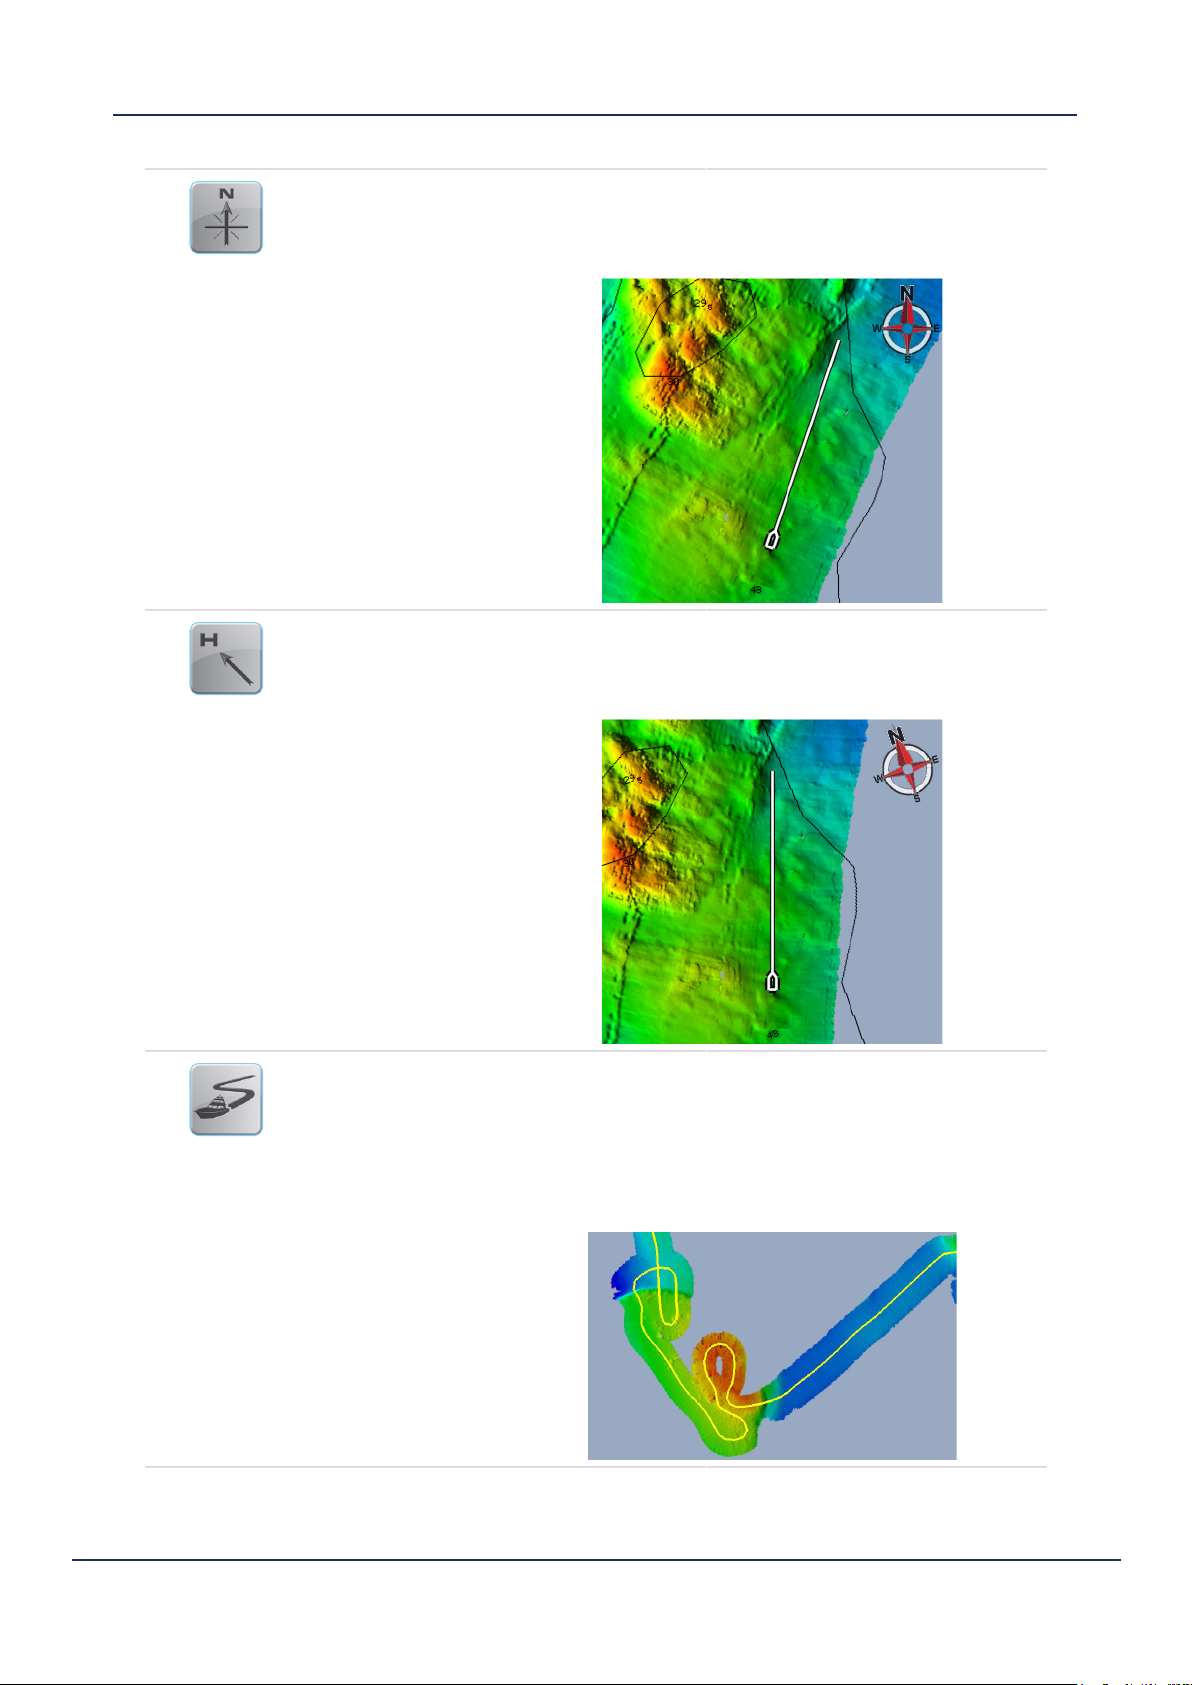
nOrth up
headinG up
When this button is enabled, the map will always be drawn
with North pointing directly up the screen.
The vessel will rotate to show the current heading.
When this button is enabled, the map rotates around the
vessel.
The vessel icon will always point directly up the screen.
Doc. P/N: WSP-009-008
Version: V1.3
Issue Date: April 2014
shOW vessel track
When this button is enabled, the vessel track will be displayed
over the seafloor map and chart.
This track will continue to update based on user settings
found in the Chart Tab of the System Configuration Utility
under the Vessel Track heading. See “7.4 Chart Tab” on page
52 for more information.
www.wassp.com
25
Page 32
shOW cOG
When this button is enabled, the Course Over Ground of the vessel
will be overlayed on the 2D display in yellow.
The COG is calculated from the GPS position.
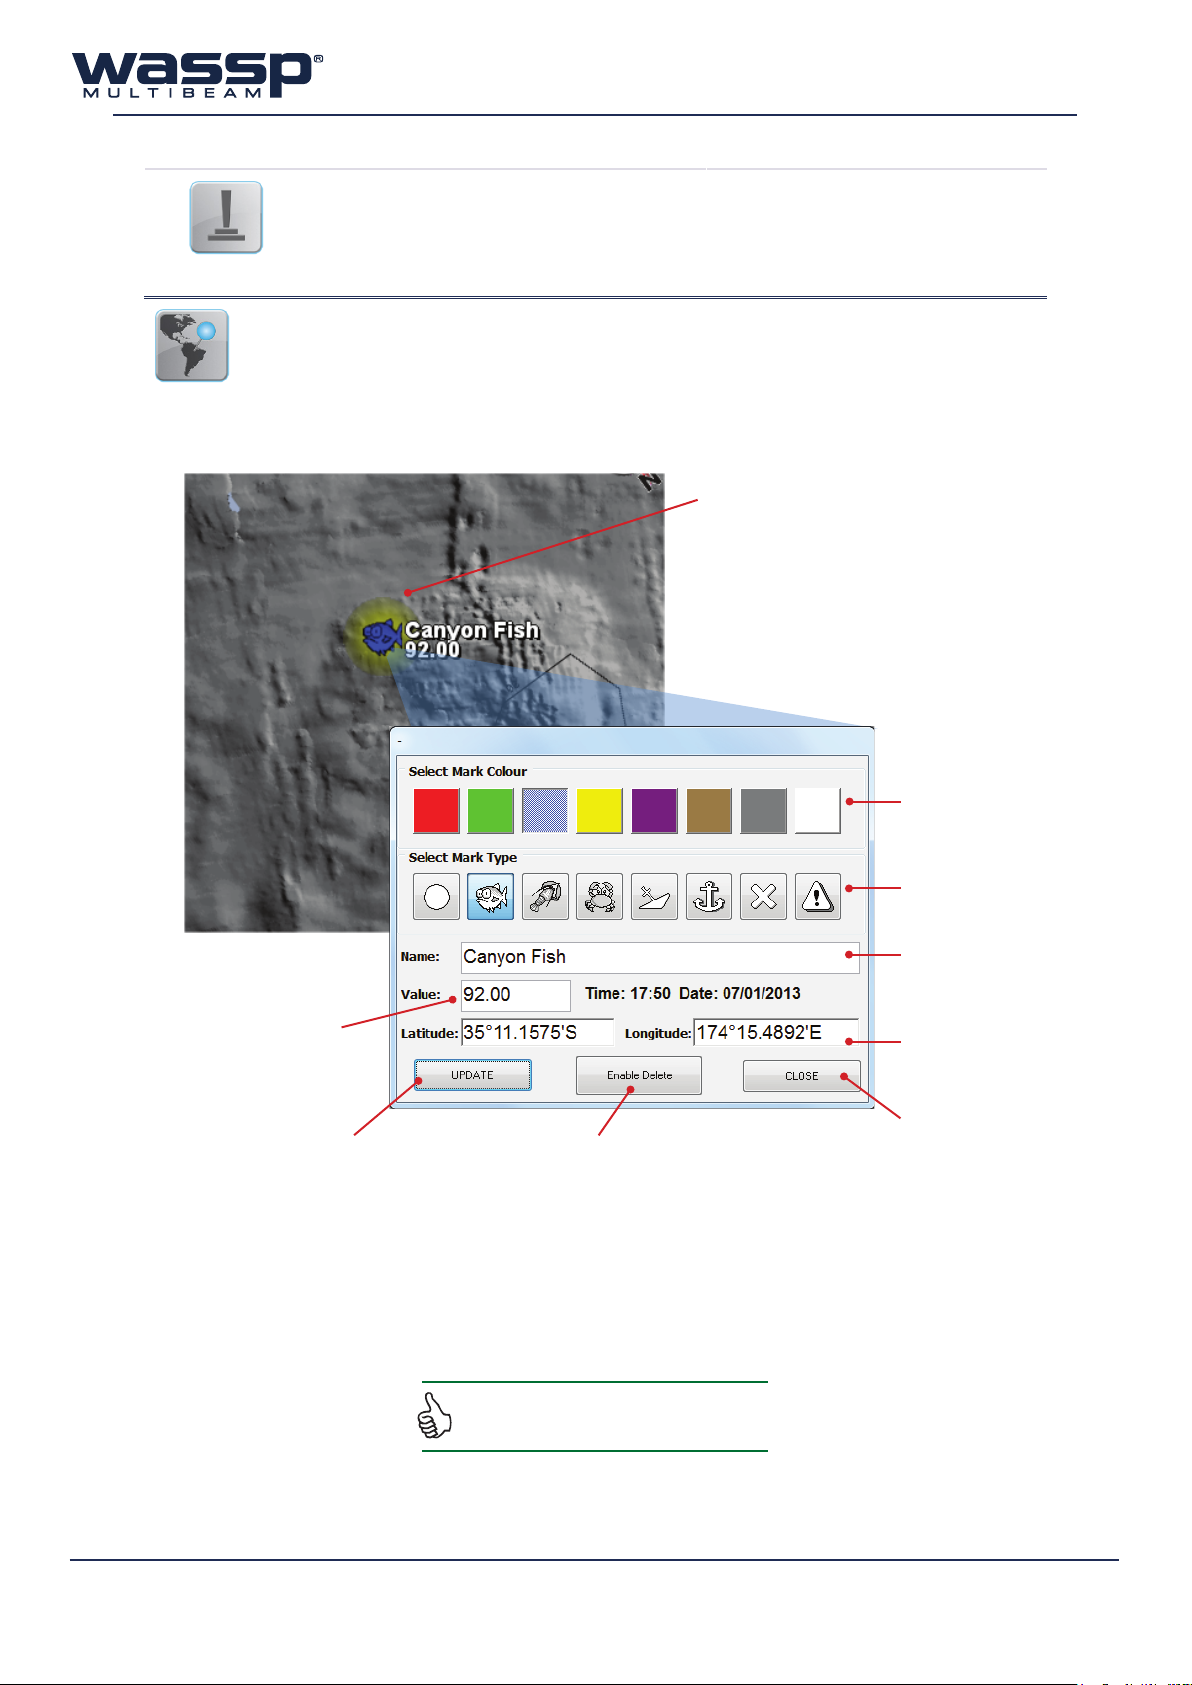
marks
Marks are used to place a user marker at a location of interest.
The mark will have a yellow circle when it
is highlighted. Left clicking will bring up the
Mark Setup window. Configuring the mark
is optional.
Press to select
Mark Colour
Press to select
Mark Type
Enter a number
Press to Close AND Activate
changes made to the Mark
Press this to enable deleting the mark.
Press UPDATE to complete the process.
Figure 10. Mark Setup form
Note: If the charting displays aren’t updating
the ship’s position, make sure your GPS is ON.
Enter Mark Name
Mark Position can
be changed
Press to Close
without saving
changes.
26
www.wassp.com
Doc. P/N: WSP-009-008
Version: V1.3
Issue Date: April 2014
Page 33

Operator Manual
Chart Display Modes
mark at vessel
mark at cursOr
mark at lat/lOnG
add BOOkmark
When this button is clicked a mark will be placed at the
current vessel position.
This mark will be identical to the last mark added. To change
the mark settings, simply left click on the mark you wish to
change.
When this button is clicked a mark will show under the mouse
cursor. The next time the left mouse button is clicked, this
mark will be placed at the mouse cursor position.
This mark will be identical to the last mark added. To change
the mark settings simply left click on the mark you wish to
change.
When this button is clicked the Mark Setup form will appear.
Enter mark information including the mark position and
press Add to add a new mark at the entered latitude and
longitude. As with all marks, the colour, shape, name and
value can be modified as desired.
When this button is clicked a bookmark will be placed at
the cursor position when the operator next presses the left
mouse button. The Bookmarks Menu can be found inside
the Database Menu on the System Configuration Utility
panel. See “6.9 Database Manager” on page 41.
What is a bookmark?
A bookmark is similar to a marked screen position. It is designed for saving the area you can
currently see. If you GOTO a bookmark:
► The current view changes focus to centre on the bookmark’s position.
► The Zoom level changes to the zoom level at time of bookmark creation.
► The Current Viewing database changes to the database being shown at the time the
bookmark was created.
Left clicking on a Bookmark brings up the Bookmarks window, and this enables moving to
another bookmark, changing the name of any of the bookmarks, and shows the position
and date of creation of each bookmark. The icon for a bookmark cannot be changed, unlike
a mark.
Left click on one of the
marks in the list to select it.
Press to update the name of
the selected bookmark to
the text entered.
Doc. P/N: WSP-009-008
Version: V1.3
Issue Date: April 2014
Press this button to
Close this window and
to GOTO the selected
bookmark.
Pressing this button deletes the
bookmark permanently.
www.wassp.com
Press to
Close
27
Page 34
mark enaBle
text BOx
prOfile OptiOns
When this button is enabled all marks will be shown on top
of the map/chart. When disabled, all marks will be hidden
from the chart display.
This allows the user to see the seafloor detail which the
mark may obscure.
These options eect what is shown in the Text Box overlay
on the main window.
► Depth At Cursor: Shows the depth value at the mouse
cursor.
► Bearing From Vessel: The angle from the centre of the
vessel to the mouse cursor.
► Distance From Vessel: Distance from centre of the
vessel to the mouse cursor.
► Latitude, Longitude: Shows the latitude and longitude
at the mouse cursor position.
► Speed over Ground: Shows the vessel’s speed relative
to the seafloor (calculated from GPS position).
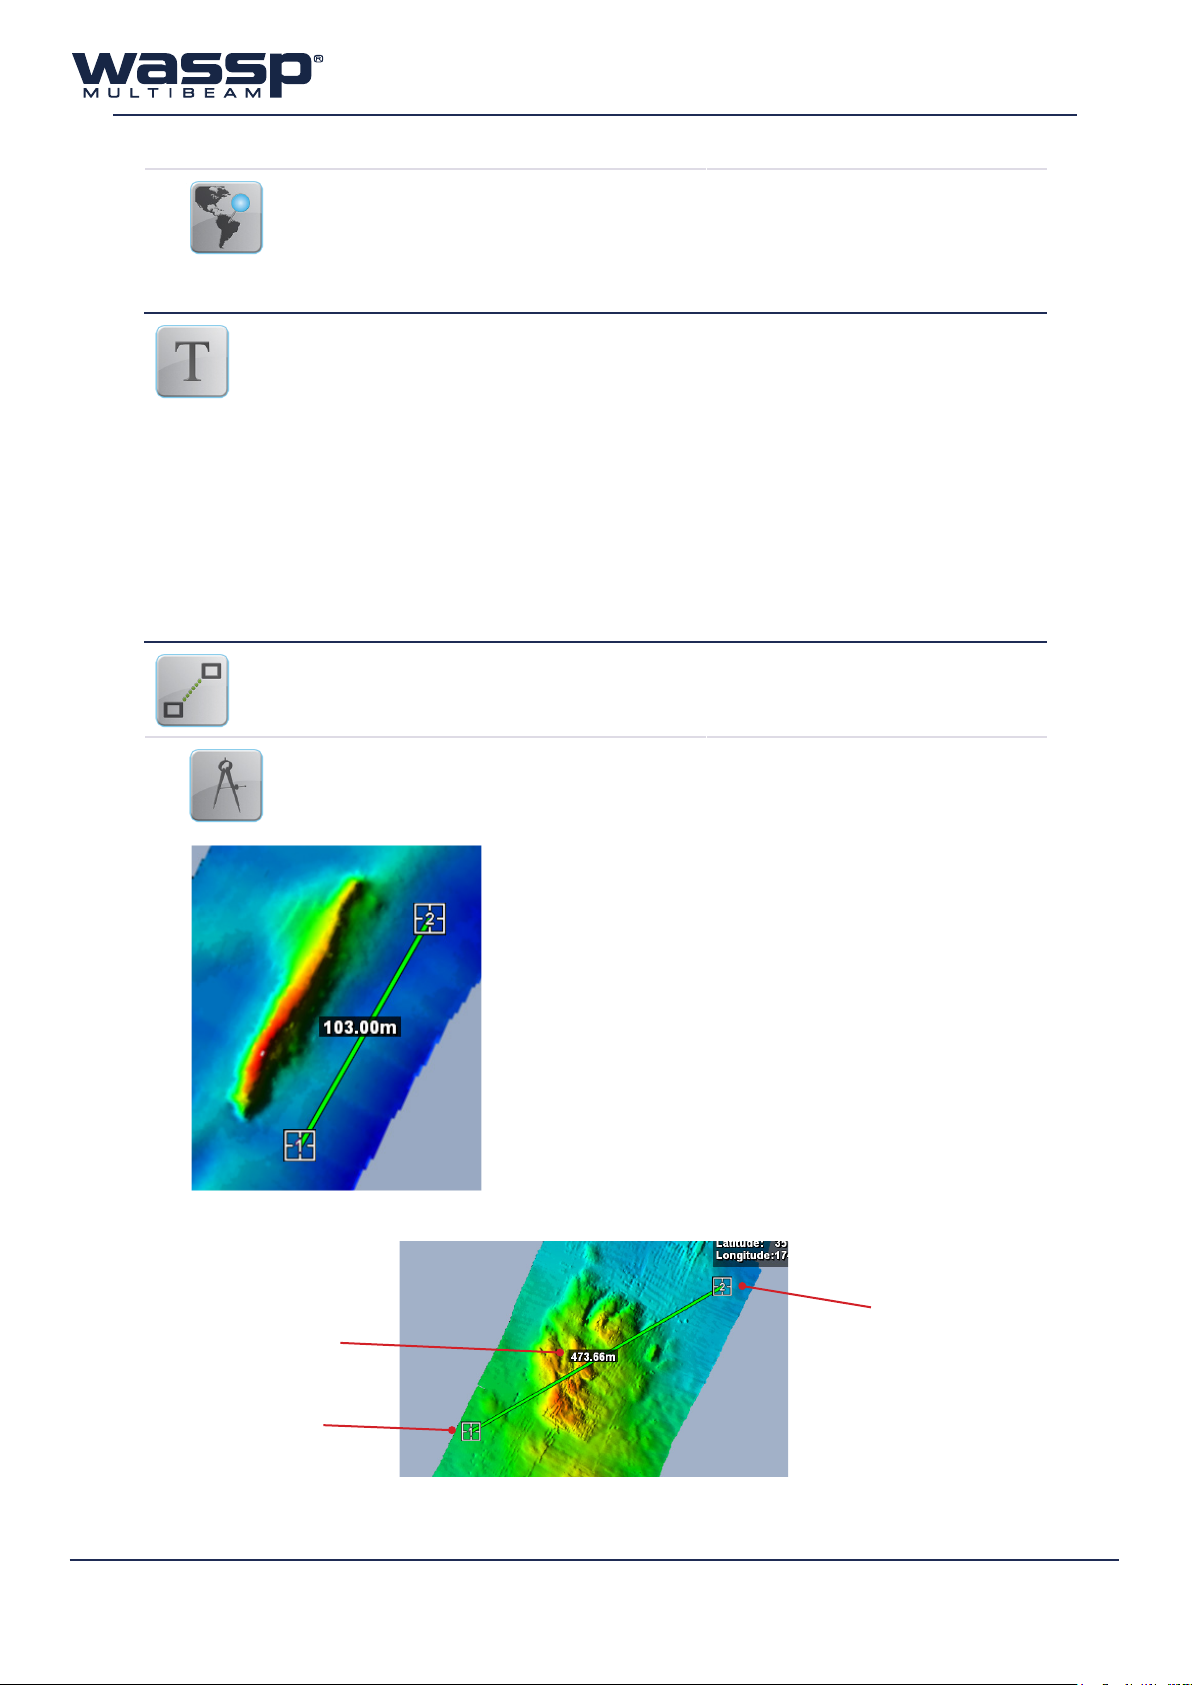
These tools can be used to measure the distance between
two points on the chart display. The seafloor profile between
these two points can be viewed in the Profile Window.
add measure
Distance between the
two measure points
When the Add Measure button is clicked and highlighted,
the next two left mouse clicks will add two measure markers
on the main window.
After placing marker #1 the distance between both markers
will be displayed on the line between them.
When placing marker #2 the line will then be anchored in
place.
At this point, both markers can be re-located by clicking and
dragging each marker to a new location.
The purpose of each marker is to provide a measuring tool
between two points on the map as well as providing a crosssection of the seafloor depths between the two marks in the
profile window.
Click the Add Measure button again to remove the current
markers.
Measure Point #2
28
Measure Point #1
Figure 11. Add Measure Tool
www.wassp.com
Doc. P/N: WSP-009-008
Version: V1.3
Issue Date: April 2014
Page 35
Operator Manual
Chart Display Modes
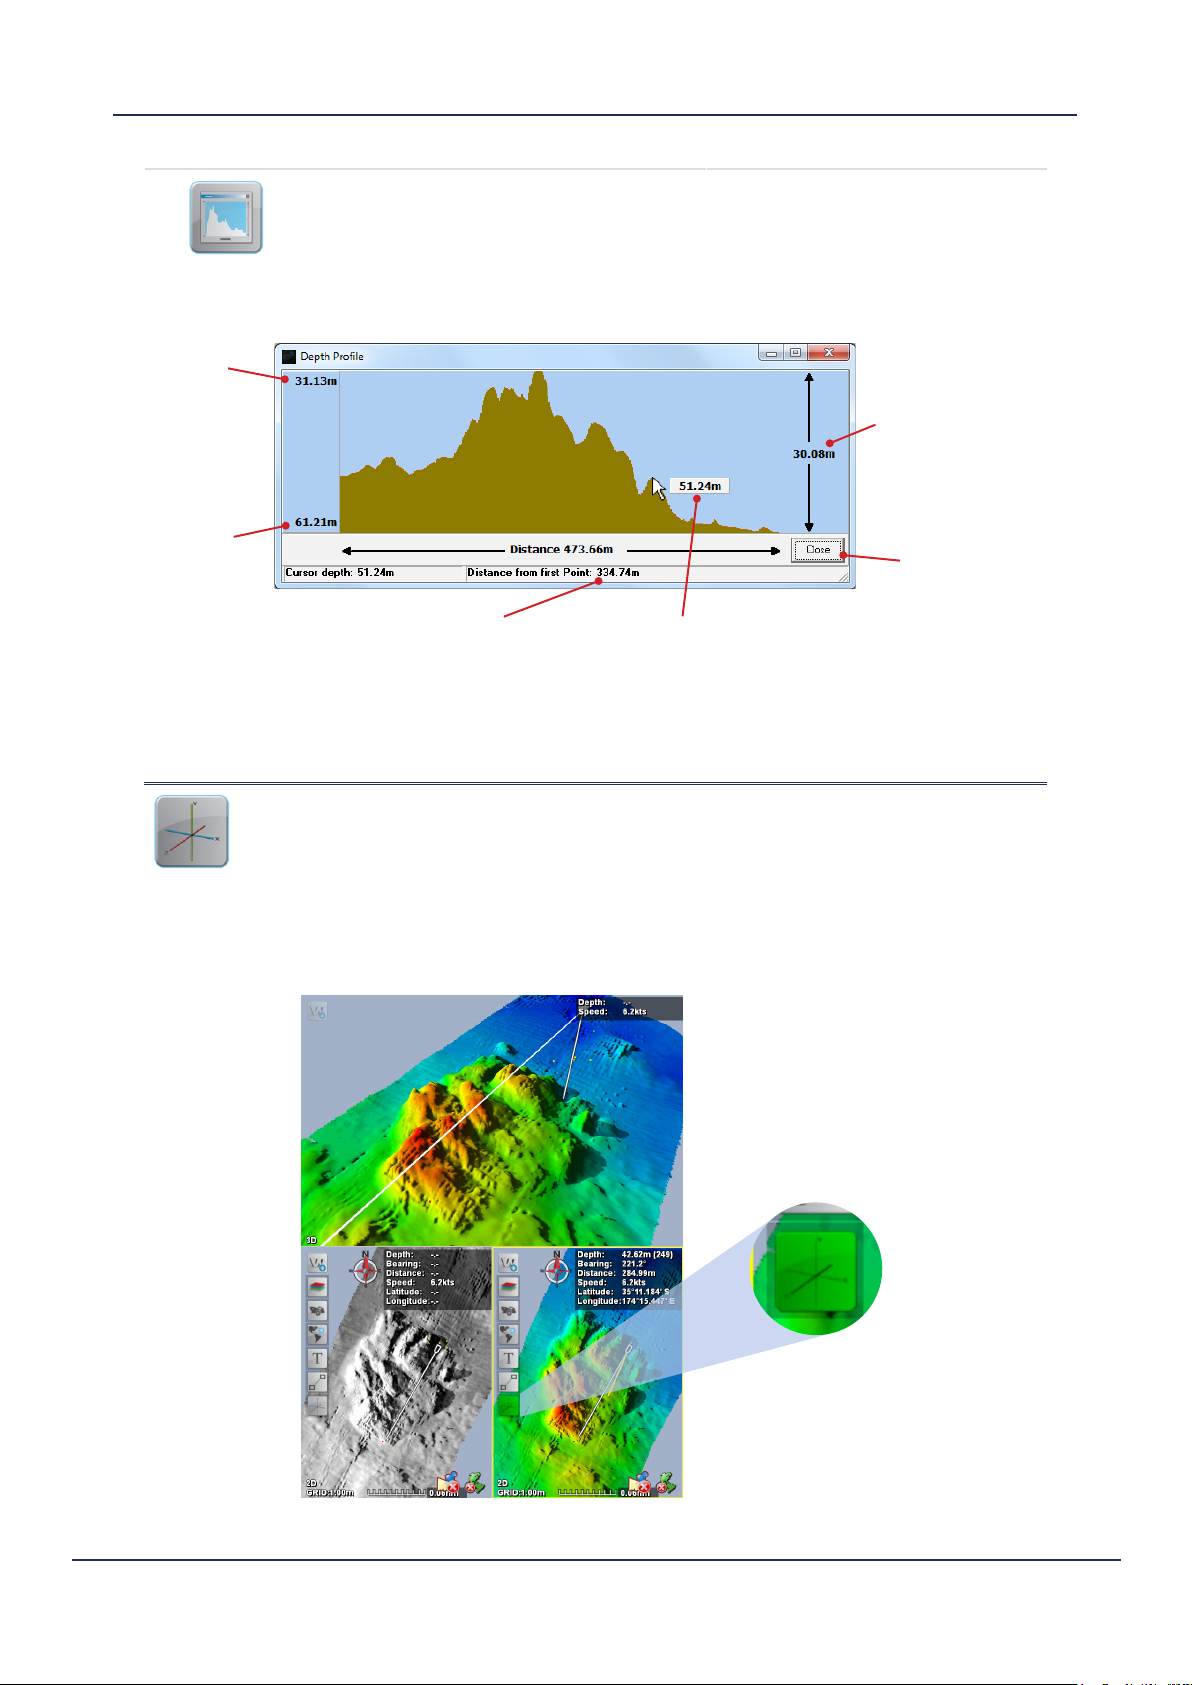
Shallowest profile
reading
Deepest
profile reading
Show Profile
Window
Distance along profile from
measure point #1 to cursor
When this button is enabled, the Profile Window is displayed.
The Profile Window will show a profile of the detected seafloor
between the two points determined by the ‘Add Measure’ tool.
The mouse pointer can be used to determine the depths at points
along the profile
Depth dierence
between the shallowest
and deepest points on
the profile
Close the Profile
Window
Cursor showing depth
reading on the profile
Figure 12. Profile Window
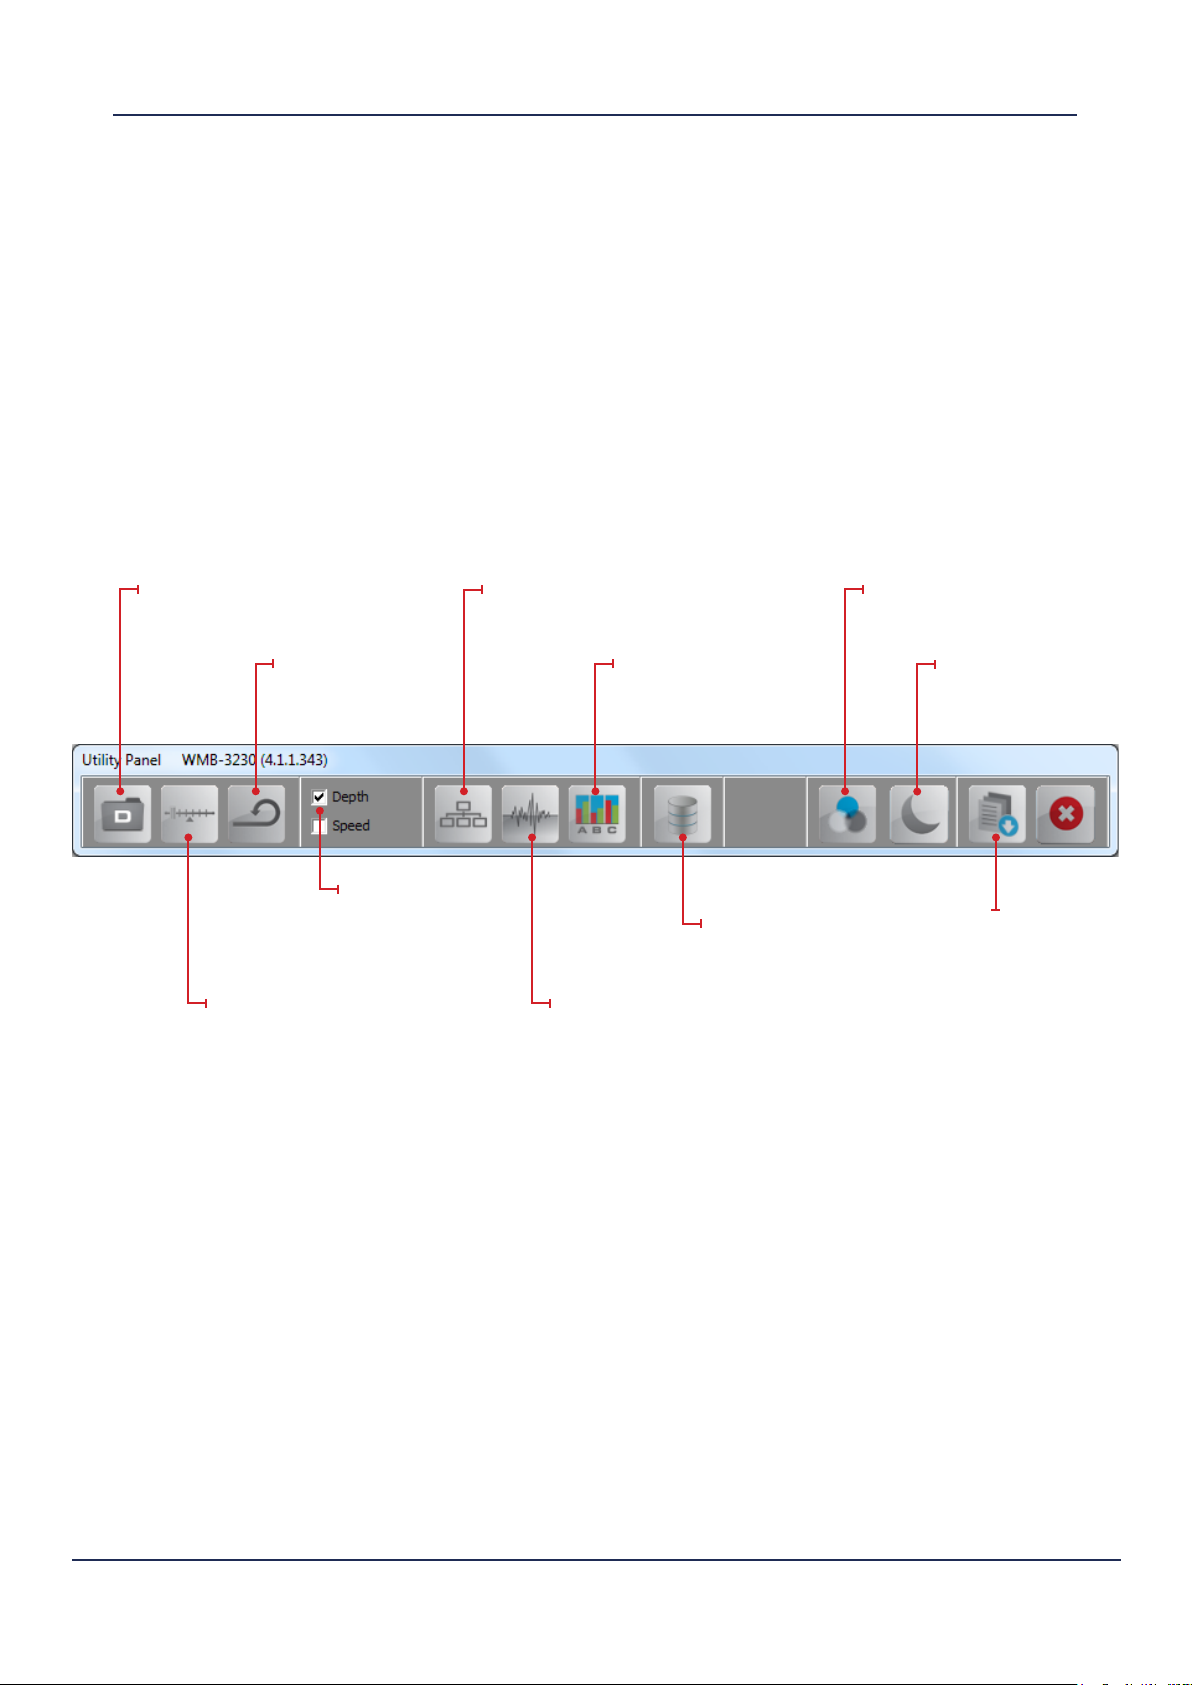
3d master
Enabling this button will set the active 2D display to be the
master of the 3D display. This means that the 3D display
will be drawn dependant on how the 2D display is setup
(including the draw distance and map resolution of the 2D
display).
i.e. If the 2D display is showing colour depth, the 3D display
will show colour depth. See the example in Figure 13.
3D Master Enabled the 3D display above
is linked to this 2D
display.
Doc. P/N: WSP-009-008
Version: V1.3
Issue Date: April 2014
Figure 13. 3D Master
www.wassp.com
29
Page 36

4.2 3D Display
The 3D display renders the seafloor data in 3-dimensional space. This display also provides an ability
to change the vertical scale (1x, 2x, 4x), to rotate the view from any angle, and can draw watercolumn
data such as fish.
Either of the 2D displays can be set to be the ‘master’ of the 3D display - this means that the 3D display
is configured in the same way as its 2D master. See “3D Master” on page 29 for more details.
The interface to the 3D display uses the functions of a standard mouse or touch screen.
► Left Mouse Button: Select menu, click-and-drag rotating, interface with display.
► Mouse Wheel: Zoom In/Out.
► Right Mouse Button: Move display up/down.
► Double Left-Click: Return to default display orientation
Menu Button
See “Configuration” on page 31.
Heading line
See “Overlays”
on page 52.
Fish Schools
See “Fish Options”
on page 16
Shadows
See “Lighting Tab” on
page 20.
Text box
See “Text Box”
on page 31.
Uncharted area
Vessel
See “Options”
on page 31.
Swath Overlay
See “Show Swath” on page 31.
30
Figure 14. 3D Display Example
www.wassp.com
Doc. P/N: WSP-009-008
Version: V1.3
Issue Date: April 2014
Page 37

Operator Manual
Chart Display Modes
4.2.1 Conguration
The 3D Display can be configured by clicking the in the top left corner of the display window.
text BOx
vertical scale
1x
2x
4x
OptiOns
These options eect what is shown in the Text Box overlay on the
main window.
► Depth At Cursor: Shows the depth value at the mouse
cursor.
► Speed over Ground: Shows the vessel’s speed relative to
the seafloor (calculated from GPS position).
These options allow the vertical scale of the 3D display to be
changed while the horizontal scale remains unchanged - this
accentuates seafloor features.
This scale has a vertical:horizontal display ratio of 1:1, so the 3D
display and all contained features are drawn just as they would
appear under the water.
This scale has a vertical:horizontal display ratio of 2:1, so the 3D
display and all contained features are drawn twice as high as they
would appear under the water.
This scale has a vertical:horizontal display ratio of 4:1, so the 3D
display and all contained features are drawn four times as high as
they would appear under the water.
This menu contains options for controlling what is shown on the
3D display, and how it is displayed.
shOW sWath
nOrth up
headinG up
free rOtate
seaflOOr line
The Show Swath button toggles the swath overlay on and o
beneath the current vessel position. The swath overlay can be used
to give an indication of where the sonar is currently pinging.
Enabling North Up orients the 3D display to be point North.
North Up in the 3D display can be dierent from the setting on the
2D display.
Enabling Heading Up orients the 3D display to point the same
direction as the vessel. Hence, the display will rotate with the
vessel, and the vessel will always point up/into the screen.
Heading Up in the 3D display can be dierent from the setting on
the 2D display.
Enabling Free Rotate allows the 3D display to be rotated to
whatever angle the user wants.
Enabling this button will draw a vertical line from the vessel to the
seafloor on the 3D display.
This feature is helpful in determining where the vessel is relative to
the seafloor data.
Doc. P/N: WSP-009-008
Version: V1.3
Issue Date: April 2014
www.wassp.com
31
Page 38

centre On ship
With Centre on Ship enabled, the chart displays will stay centred
on the vessel as new position information is received.
To disable this mode, click on the icon again or pan the 2D display.
3d fish
Enabling 3D fish will overlay the detected watercolumn targets on
the 3D display.
These marks are coloured by intensity, so red marks are strong
echoes and blue marks are weak echoes.
The fish marks are stored on the WASSP Processor’s hard-drive.
There is a finite number of fish marks which can be stored. Once
this maximum has been reached for a geographical area, the oldest
fish marks are removed.
If the “Show Depth at Cursor” option is enabled on the Chart tab
(see page page 53), moving the cursor over a 3D fish mark will
show the depth of that mark.
See “Fish Options” on page 16 for more details.
5. Layout Selection
The WMB-X230 graphical user interface allows the user to arrange displays in many dierent ways.
The Main Menu houses two buttons for changing the display layouts:
acOustic layOut ButtOn
This button will cycle through the Acoustic display layouts.
chart layOut ButtOn
This button will cycle through the Chart display layouts.
Layouts can be customised in the Layout Tab of the System Configuration (see “Layout Tab” on page
54 for more information).
32
www.wassp.com
Doc. P/N: WSP-009-008
Version: V1.3
Issue Date: April 2014
Page 39
Operator Manual
Utility Panel
6. Utility Panel
The Utility Panel is a quick-access panel for a lot of the functions contained within the WASSP GUI.
The panel can be accessed from the Main Menu, and once enabled, it will remain ‘on top’ of other
displays until it is closed.
6.1 Overview
Each of the functions that the Utility Panel contains is talked about in more detail over the following
section. Refer to the links below:
Data Recorder
See page 34.
Advanced Options
See page 35.
Rescan
See page 36.
Depth/Speed
Window
See page 36.
Network Window
See page 36.
IQ Bars
See page 40.
Database Manager
See page 41.
Raw Signal Data
See page 38.
Figure 15. Utility Panel Overview
Hue
See page 44.
Day/Night Mode
See page 44.
System
Configuration
See “System
Configuration” on
page 45.
Doc. P/N: WSP-009-008
Version: V1.3
Issue Date: April 2014
www.wassp.com
33
Page 40

6.2 Data Recorder
Clicking the Data Recorder button opens the Data Recorder control panel. This allows
raw data from the BTxR to be recorded and replayed.
Recorded data files contain:
► Raw Sensor Data
► Sensor Serial
Information
from enabled
Transfer Task
ports (whether
the transducer is
pinging or not)
► Current Ship Setup
settings
All of this data is time
stamped.
XYZ Data Recording
Controls
Slider Bar
Ping information
Options
See below.
Figure 16. Data Recorder Window
Note: The size of raw data les
is very large and recording raw
data les is not recommended
for inexperienced operators.
Recording data les allows you
to look at acquired soundings
data at any time.
Rewind to Start of the File Select File to Play
Pause Playback of Current
File
Play Current File Close Replay Controls
Record (Displays a Save As
dialogue box)
The Slider Bar below the buttons allows for quickly jumping through a replay file to a particular point.
The lower section of the data recorder window shows information about the last ping and displays
this information whether replaying a file, recording acquired data, or acquiring data without recording.
OptiOns:
► Use File Ship Settings
Selecting this check box applies the original ship’s settings to the file
being replayed. Not selecting this check box applies the current settings of the program running on your WASSP Processor to the replay
file.
NOTE: Once the check box is selected, files opened after the check
box is selected use the new settings.
► Loop Files
Selecting this check box allows single files in a selected folder to
loop, or all the data files in a folder to run continuously one after the
other in a loop.
Note: When replaying a demo
le, the MODE button must be
on STBY. If left in the TRANSMIT
mode, the SELECT FILE TO
PLAY button on the Replay
Controls box is not active.
xyZ data recOrdinG (save ascii data)
If you want to output the sonar data to XYZ format, check this box. A Save As dialogue will pop up for you to
select the location and name of the data you want to save.
The XYZ ASCII output is an easy to read corrected version of the bathymetry data computed by the WASSP
system. This form can be read by GIS packages. The data created is as processed by WASSP so includes any
tide value selected in WASSP. Up to 112 points are created per ping and are written sequentially to the file:
ptNumber, latitude, longitude, depth, date, time - in comma delimited form.
34
www.wassp.com
Doc. P/N: WSP-009-008
Version: V1.3
Issue Date: April 2014
Page 41
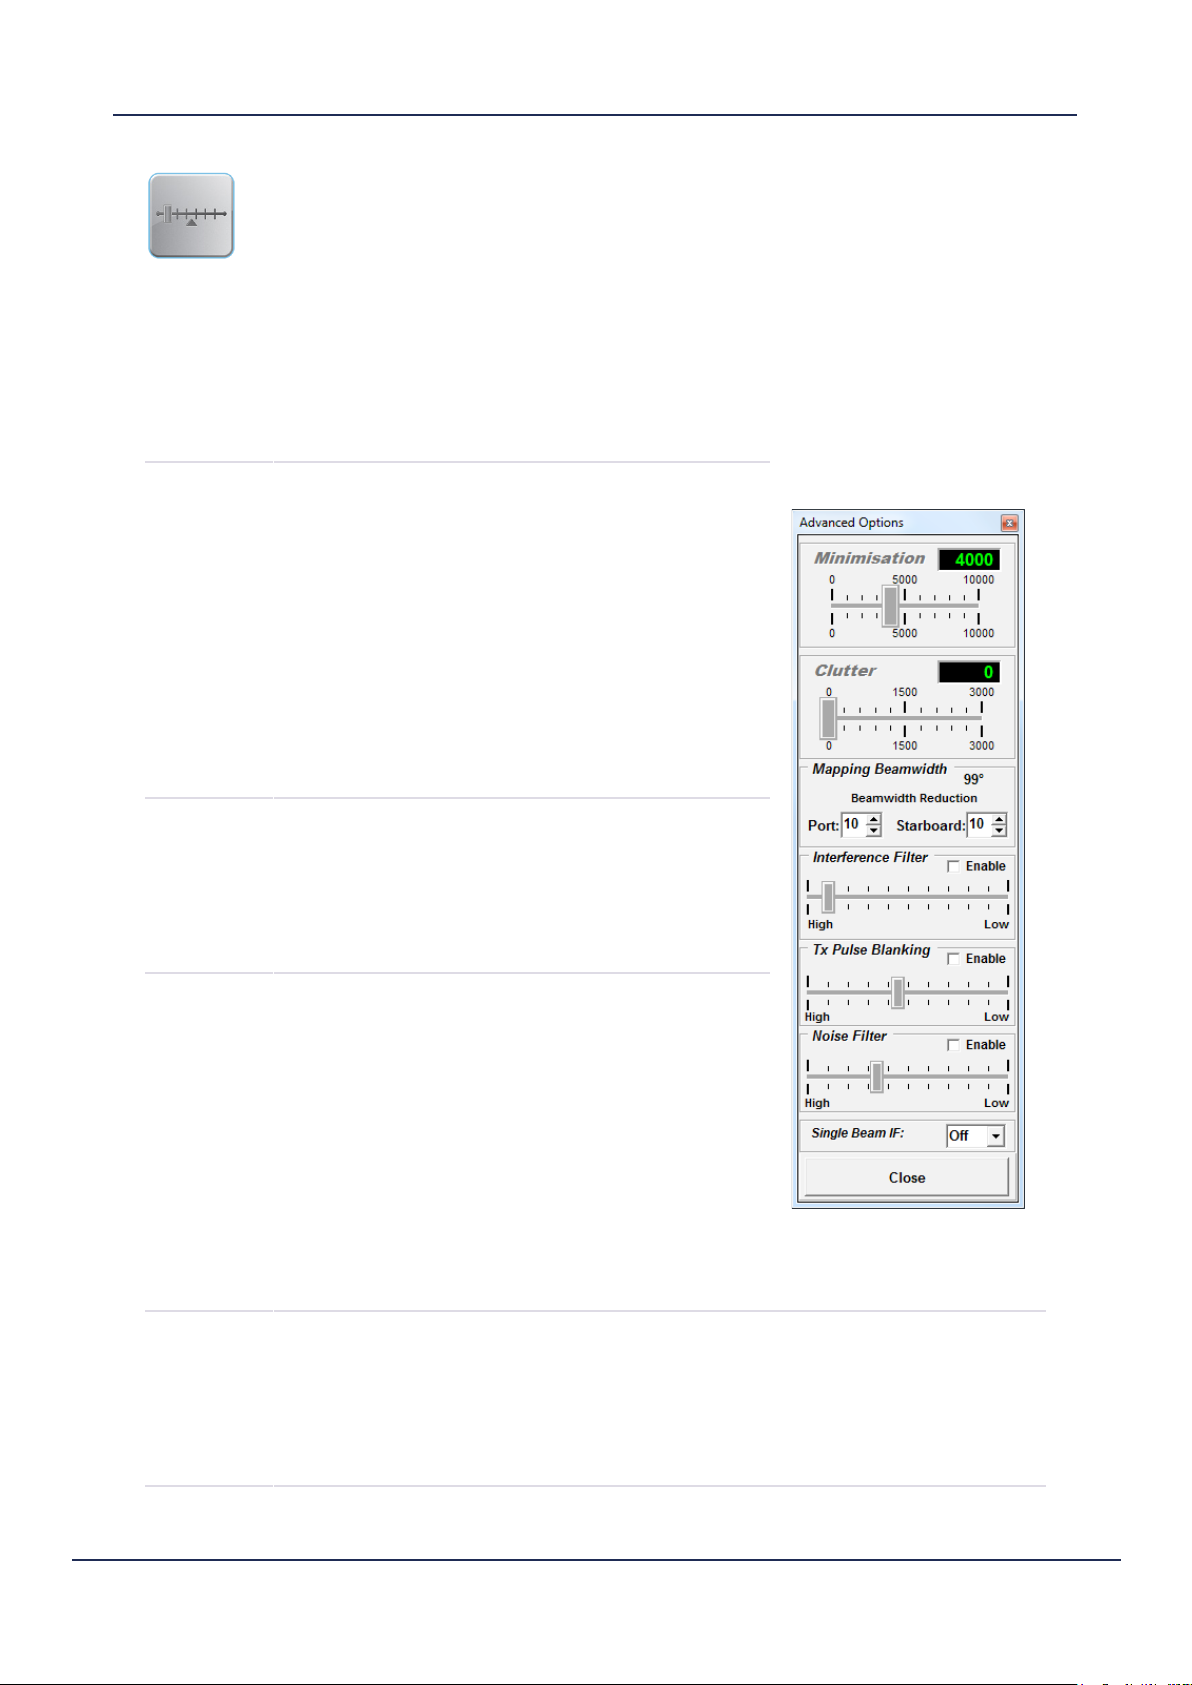
6.3 Advanced Options
Clicking this button to open the Advanced Options. Configure these functions to best
suit your requirements.
The suggested values for the Advanced Options are:
► Minimisation: 4000 (or 800 if using auto power by signal).
► Clutter: 0-500.
► Mapping Beamwidth: 0,0 (Full 120 degree beam width).
► Interference Filter: Enabled (High) if another sounder is transmitting.
► Noise Filter Disabled (only enable if interference issues present).
Operator Manual
Utility Panel
minimisatiOn
clutter
BeamWidth
reductiOn
Minimisation describes the filtering process used
to remove sidelobe signals. Sidelobe generated
signals show up as a ring on the sonar view where
the transmission pulse first strikes the seafloor, or as
a mirror of features on either port or starboard.
Sidelobe generated features can confuse the sonar
picture making it hard to interpret. However, too
much minimisation can also distort the sonar image.
Refer to section “8.2.3 Sea Trial - Commissioning
Step 10: Side Lobe Levels” on page 49 of the
WMB-X230 Installation Manual for more information
on selecting correct minimisation settings for your
installation.
Clutter describes the filtering process used to
remove all signals below a threshold level from the
sonar and fish finder displays. The control sets the
threshold for the minimum signal level that will be
displayed on these displays. This control is dynamic
and does not aect any other aspect of the system
including the contour fish detection!
Mapping Beamwidth sets how far apart seafloor
detection points are calculated. Port = 0 and
Starboard = 0 means detections are processed for
120º of the 120º swath. Port = 10 and Starboard =
10 means detections are processed for 100º of the
120º swath.
interference
filter
Doc. P/N: WSP-009-008
Version: V1.3
Issue Date: April 2014
The default value for Mapping Beamwidth is 10
beams from port and starboard. Set this value to 0
for both Port and Starboard to get the maximum
seafloor mapping width. Sound speed errors and
significant ship motion will make mapping correctly
with these outer beams more dicult.
The Interference Filter enables a reduction in interference caused by other
ultrasonic sub-sea acoustic devices such as sounders. It also provides some noise
filtering. It is recommended that the interference filter be left selected (Enabled) if
you have another sounder or sonar on your vessel that operates at the same time
as the WMB-X230. Best results are achieved if all other sounders are turned o. Set
the Interference Filter Level to High when encountering strong interference, and
Low when interference is weak.
www.wassp.com
35
Page 42

tx pulse
BlankinG
nOise filter
sinGle Beam if
This will remove noise which is constant across the sonar display, such as transmit
pulses from other acoustic sounder equipment. Works just with the sonar display
and single beam display.
It is best to start the slider from the right hand side and move to the left until you
see less interfering pulses on the sonar display.
This filter will also remove bottom detections which intersect with interfering
pulses.
This Filter is used to remove low level electronic white noise from influencing the
sonar. Unlike Clutter this setting eects all processing and changing this value will
not update all previous fish finder history.
The Noise Filter is designed to helping clean up the Sonar and Fish Finder Views and
to prevent low level noise amplifying up with TVG and standard Gain to confuse the
sonar and fish finder displays.
This is a filter just for the single beam display. It will remove interfering pulses from
the sonar data.
NOTE: this will leave holes where these pulses occurred.
LOW = remove large pulses
MED = remove large & medium pulses
HIGH = remove large, medium and small pulses
6.4 Rescan
The Rescan button rescans for Navionics chart cards and WASSP dongles.
If you want to change the WASSP dongle or Navionics chart while the program is running,
remove the dongle or chart and insert a new one, then click the Rescan button. The program rescans
the dongle and should read the new one you have inserted. See “9. Navionics Chart Card Information”
on page 62 of the Installation Manual for more information on registering Navionics chart cards.
6.5 Depth / Speed Window
You can enable an informative overlay which displays the
current depth and/or the current vessel speed by enabling
either of the Depth / Speed checkboxes.
This window can be moved to any convenient location on the screen by
clicking and dragging the frame with the mouse. To close the depth/speed
window, click on the “X” close box.
6.6 Network Window
Clicking the Network Window button on the Utility Panel displays the WASSP Network
Status window showing an overview of the data input into the WMB-X230 system.
tcp status
There are two TCP port network connections that need to be made for the WMB-X230 to work, these
are Transfer Task and Navigator. NMEA sentences also need to be incoming for WASSP to operate
correctly. See the Installation Manual for details.
Doc. P/N: WSP-009-008
Version: V1.3
Issue Date: April 2014
36
www.wassp.com
Page 43
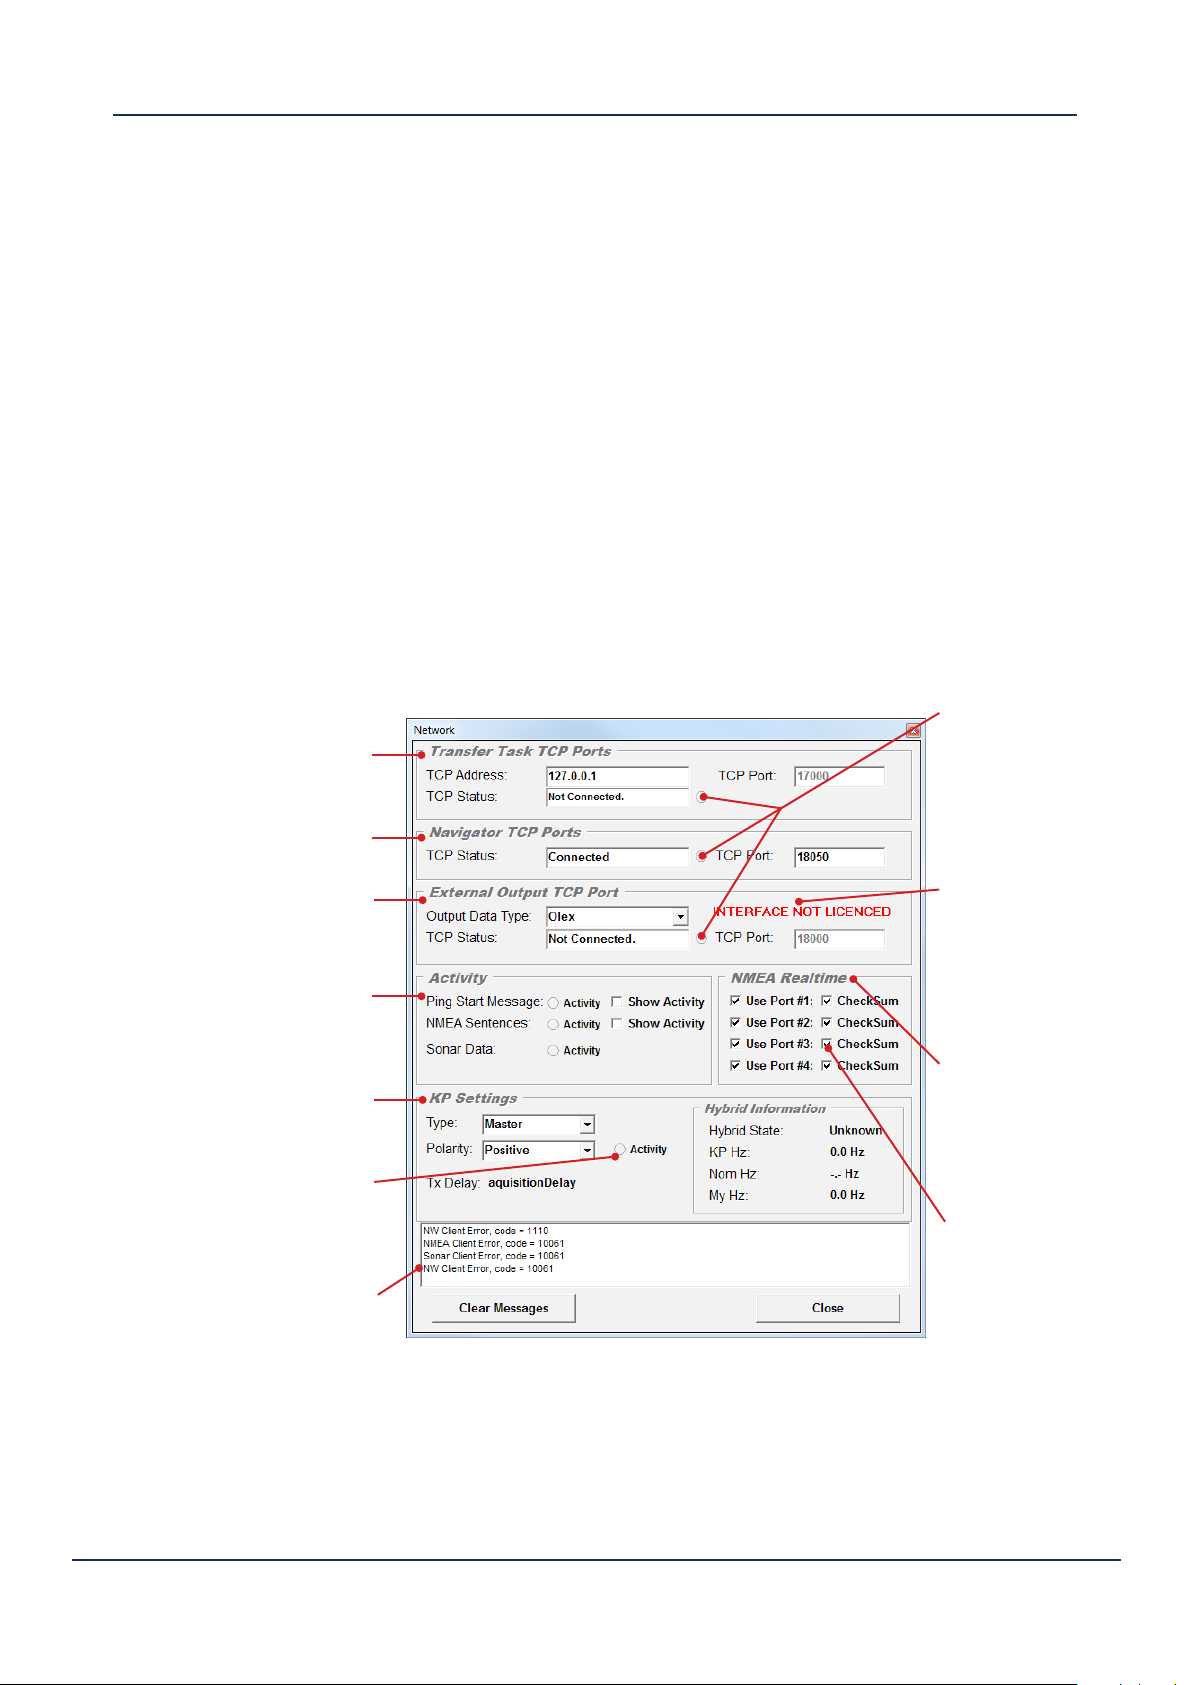
While in the Demo mode, the system does not need network connections to operate correctly as
data files are played back through the program.
kp (key pulse) settinGs
The key pulse functions are presented as an option to improve WASSP performance when operating
alongside other sonar systems. WASSP will always output a Key Pulse through the ping gate when it
transmits.
To make use of this functionality, the KP connections on the front plate must be in use. See “4.2.2.3
Key Pulse Connection” on page 19 of the Installation Manual for connection details. To determine
if the Key Pulse is being detected by the BTxR, refer to “6.7.1.1 Key Pulse Graph” on page 39.
► Master Mode: Use this if there is no key pulse from other sounders.
► Slave Mode: Use this to only ping when another sounder (with key pulse wired into input of
BTxR) pings. If the sounder is o, WASSP will eventually time out, and only sync to this device
once key pulses are detected again).
► Rx Blanking: Use this setting to allow WASSP to ping at its native rate, but to blank out any data
received during the key pulse interval received at the BTxR key pulse input. Removing data can
cause issues with tracking, but maintains the maximum ping rate on both systems.
► Hybrid Mode: This mode automatically detects the key pulse device ping rate to optimise
the choice between Rx Blanking (above) and Slave Mode (above). This option finds a balance
between the least interference and best ping rate.
Transfer Task TCP Ports:
Shows the status and activity of the
connection to the transfer task program.
Navigator TCP Port:
Shows the status and activity of the
connection to the Chart Display.
External Output TCP Port:
Shows the external output connection
status to another program using the
WASSP data, e.g. Olex.
Activity Indicators:
The activity indicators glow GREEN
when there is activity on a port.
Keying Pulse Settings:
See “KP (Key Pulse) Settings” above
for more information.
Keying Pulse Activity:
The Activity LED will light up if a key
pulse state change is detected during
WASSP data acquisition time. It will
not blink on every incoming pulse.
Diagnostics Window:
Allows an operator to view NMEA
data received by the WASSP system.
Click Show Activity under the Activity
heading to see these messages.
Operator Manual
Utility Panel
Activity Indicators:
These indicators will
light up GREEN if
there is activity on the
TCP port. If a send
call fails, the indicator
will turn RED for 5
seconds.
Interface Not
Licenced:
This message will
appear if your WASSP
dongle doesn’t have
the required licence
permissions for a
particular output.
NMEA Realtime:
Enables data on port
to be used by WASSP.
If unchecked data will
only be logged to file
if recording.
CheckSum:
Allows rejection of
corrupted NMEA
data if ticked. It is
recommended that
these are always
ticked.
Doc. P/N: WSP-009-008
Version: V1.3
Issue Date: April 2014
Figure 17. Network Status Window
www.wassp.com
37
Page 44

6.7 Raw Signal Data
This button opens the Raw Info form which is used for diagnostic purposes to analyse
individual receiver channel signals and to look at the attitude information being used
by WASSP. This tool is used predominantly during commissioning and troubleshooting
(see section “8.1.3 Commissioning Step 3: Channel Signal Function” on page 41 of the Installation
Manual for the relevant commissioning procedure).
6.7.1 IQ Raw Data Tab
The user has the ability to zoom in on an area of the display by clicking and dragging across the
display. The zoom can be reset by double-clicking on the display, or by clicking ‘Auto Zoom’.
Water
Column
Channel Select
(A-Z)
Pause the
display
Reset the
zoom
Strong
Seafloor return
Unpause the
display
Enable the Key
Pulse Graph
Vertical (Y)
scale slider
Targets in
Water Column
38
Weaker
Seafloor return
Depth Cursor information
overlay
Figure 18. IQ Raw Data Signal Examples
www.wassp.com
Doc. P/N: WSP-009-008
Version: V1.3
Issue Date: April 2014
Page 45

Operator Manual
Utility Panel
6.7.1.1 Key Pulse Graph
The Key Pulse Graph shows the state of the input key pulse according to how the WASSP system has
interpreted it. The WASSP detects changes between input states, and draws those on the graph at the
point of the ping time where the state change is detected.
When enabled, the KP Graph replaces the “I” data stream on the IQ Raw Data tab, and is the same
regardless of the selected channel.
Ensure the input key pulse from the secondary sounder has
been correctly installed according to the pin conguration on
page 19 of the WMB-X230 Installation Manual.
Note: The KP Graph is not an oscilloscope. It will not show the raw KP voltage.
The graph is only indicative of key pulse state changes detected during the WASSP
data acquisition time, and may not draw pulses less than 0.3ms in width. The polarity
drawn on the graph may not correspond to the input polarity.
Figure 19 shows an example
where the WASSP is operating in
Slave Mode. The first key pulse
visible has triggered the WASSP
system to ping and collect data.
During the data collection, a
second key pulse was detected,
but this did not trigger another
ping, as the WASSP system was
still acquiring data. The WASSP
system will wait until the next
key pulse after data acquisition
for the current ping has finished
before pinging again.
Figure 20 shows an example of
the WASSP system operating in
Master Mode or Rx Blanking
Mode. Here, the WASSP system
is pinging at its native rate,
ignoring the input key pulse. The
WASSP ping is not synchronised
with the input key pulse.
Tick “KP Graph” to
enable the display
Detected key pulse /
state change
WASSP Data Acquisition Time
Figure 19. Synchronised Key Pulse Input
(Slave Mode)
Doc. P/N: WSP-009-008
Version: V1.3
Issue Date: April 2014
WASSP Data Acquisition Time
Figure 20. Unsynchronised Key Pulse Input
(Master / Rx Blanking Mode)
www.wassp.com
39
Page 46

6.7.2 Sensor Data Tab
The Sensor Data tab shows current sensor data used by WASSP. The latest 10 seconds of Roll, Pitch
and Heave information of the vessel are drawn on the scrolling graph. Vessel Heading, Speed over
Ground and the current UTC Time and Date are also represented on this display.
If vital sensor information is missing, the Status will read RED, and will show what sensor is required.
Cursor
information
overlay
Pause the
display
Pitch
signal
Figure 21. Raw Info - Sensor Data Tab
6.8 IQ Bars
This display shows the IQ and magnitude of the received signal on each channel.
Refer to section “8.1.2 Commissioning Step 2: Channel Gain” on page 39 of the
Installation Manual for further information.
Roll
signal
Heave
signal
Vertical (Y)
Scale
40
Figure 22. IQ Bars display
www.wassp.com
Doc. P/N: WSP-009-008
Version: V1.3
Issue Date: April 2014
Page 47

Operator Manual
Utility Panel
6.9 Database Manager
The charting display stores and displays the WASSP information in databases. Each
database can store information from any geographic area or areas. The areas do not
have to be co-located or continuous but can cover dierent parts of the globe if desired.
The Database File Path must be set to the directory in which the databases are created. Additional
databases can be created by clicking on the “New” button.
The databases allow the operator to store WASSP information from one or more visits to an area. This
allows changes between the visits to be easily compared. A database may however be overwritten by
selecting it for writing on a subsequent visit.
The Database Manager provides an ability to select both a “Viewing” and a “Recording” database.
The information displayed on the chart display is always taken from the “Viewing” database. Incoming
data from the WASSP is always written to the “Recording” database. To view incoming seafloor data
as the WASSP collects it (normal operation), set the Viewing database to the same as the Recording
database. By selecting a dierent database for “Viewing” than “Recording”, the operator is able to look
at the information previously recorded while still saving to the recording database.
Grid Resolution
selection
Currently Selected
Viewing Database
(Green)
Disk Space indicator for
Database hard drive
Browse to select
Database File Path
Opens the
Bookmarks
window
Enable/Disable
Demo Database
Create New
Database
window
Currently Selected
Recording Database
(Yellow)
Create New
Database
Manage
Databases
Doc. P/N: WSP-009-008
Version: V1.3
Issue Date: April 2014
Figure 23. Database Manager Window
www.wassp.com
41
Page 48
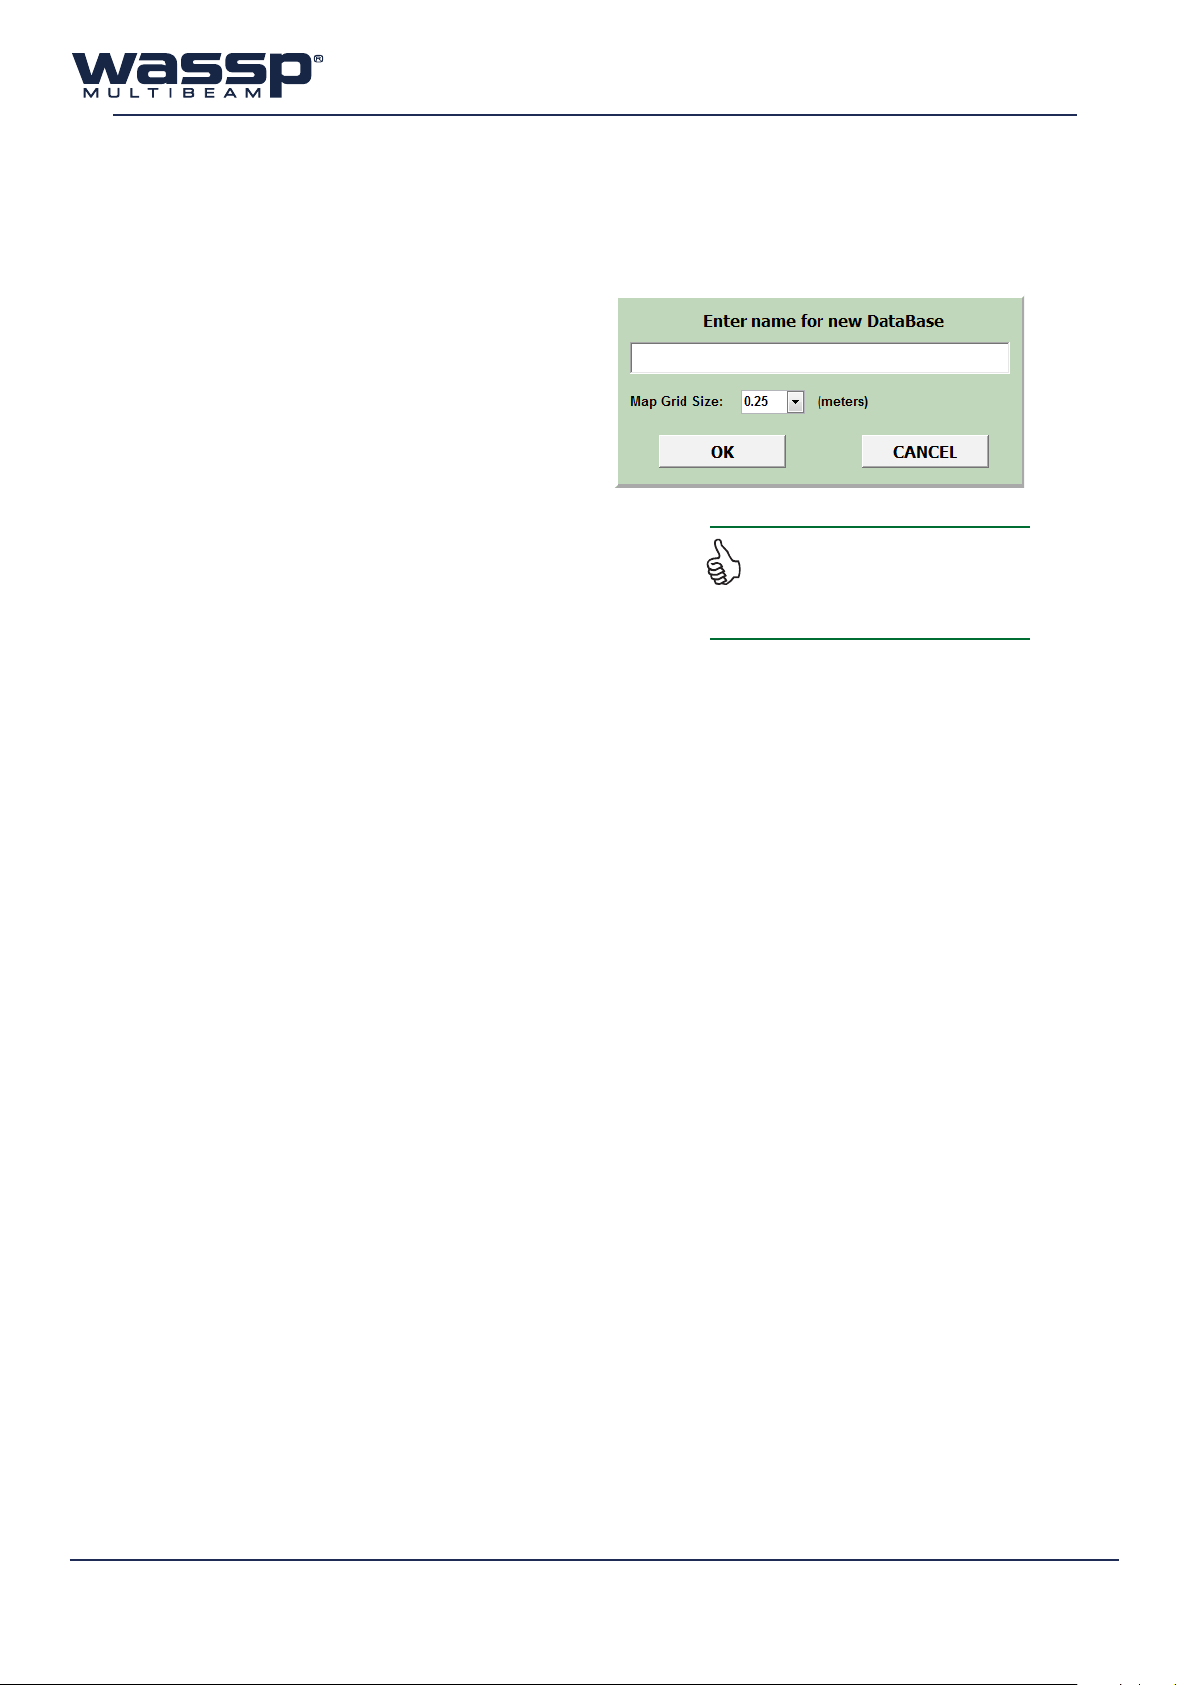
When the WASSP Navigator is first installed a Database called “Default” will be generated. This is
automatically setup ready for storing WASSP information.
6.9.1 Adding a new database
To add a new database, click on the “NEW” button
at the bottom right of the Database Manager
window. The following prompt will appear.
Enter a name for the database, select a Map Grid
Size (see below), then click “OK” to create the new
database.
The new database will show up on both the
Viewing and Recording side of the Database
Manager window. The database files are sorted by
name so the database may not show up at the bottom of the
list. If you plan to record to the new database, make sure it is
selected as the active Recording database.
map Grid siZe:
This is used to set the resolution of the seafloor maps. The
smaller the grid size, the greater the resolution and accuracy of the seafloor data.
► 0.25 m (applicable for the first 40m) is the highest resolution, and the best option for accurate
seafloor mapping.
► 0.5 m (applicable for the first 100m) is a good compromise between saving hard-drive space and
recording semi-accurate seafloor data.
► 1.0 m (applicable for the first 250m) is the least accurate selection for mapping seafloor data, but
is the most economic selection in terms of saving hard drive space. This is the recommended
setting for fishing purposes, as 3D fish marks are unaected by the choice of database grid size.
Because the database will be created as a
new folder on the WASSP Processor, it is
best to use plain text and numbers as some
characters cannot be used.
Beyond the above applicable depths, the next map grid size will be used to store seafloor data. This
eliminates unnecessary precision at larger depths.
42
www.wassp.com
Doc. P/N: WSP-009-008
Version: V1.3
Issue Date: April 2014
Page 49

Operator Manual
Utility Panel
6.9.2 Database Management
Database Management allows you to export recorded databases to an external storage location such
as a USB drive, and convert higher resolution databases to a lower resolution. This allows you to free
up hard drive space.
dataBase expOrt
► Click on the “Manage” button on the bottom right of
the Database Manager window.
► Select the database you want to export.
► Click “Save Database to Disk” and select the location
where you want the database to be saved.
► Click ‘OK’
dataBase reductiOn
A database on the WASSP Processor can be reduced in
size by converting it from a high resolution to a medium
resolution database. When this is done the grid size is
changed from 0.25 to 0.5 metres.
Before reducing the database, carry out the database
export as above, as all high resolution data will be lost
during the reduction process.
► Click on the “Manage” button on the bottom right
of the Database Manager window.
► Select the database you want to export. The Map
Grid Size of each database is shown in the window.
The space saved by carrying out the database
reduction is indicated below the database list.
► Click the “Convert to 0.5m Gridding” button to
carry out the conversion.
► Close the Database Tools window.
6.9.3 Database File Path
Databases will be generated in C:\WMBData\BathMaps by default. This can be changed by clicking
on the button. Any location on any hard drive can be used and the location can be changed
whenever necessary.
Be aware that if you change the database le path
while recording to a database, that database will
no longer be visible and data loss can occur.
6.9.4 Demo
As part of a standard WMB-X230 installation there is a small demo database which can be selected
by pressing the Demo button. When the button is green, this demo database is listed on the “Current
Viewing” side of the database list.
If the demo database is selected, the chart display will automatically go to the location of the database
for demo viewing. When the Demo button is clicked again, the chart display will return the previous
view.
The text “Demo” will be present on the main window when in demo mode.
6.9.5 Show Bookmarks
This button opens the Bookmarks List. For more information about bookmarks, see “Add Bookmark”
on page 27.
Doc. P/N: WSP-009-008
Version: V1.3
Issue Date: April 2014
www.wassp.com
43
Page 50
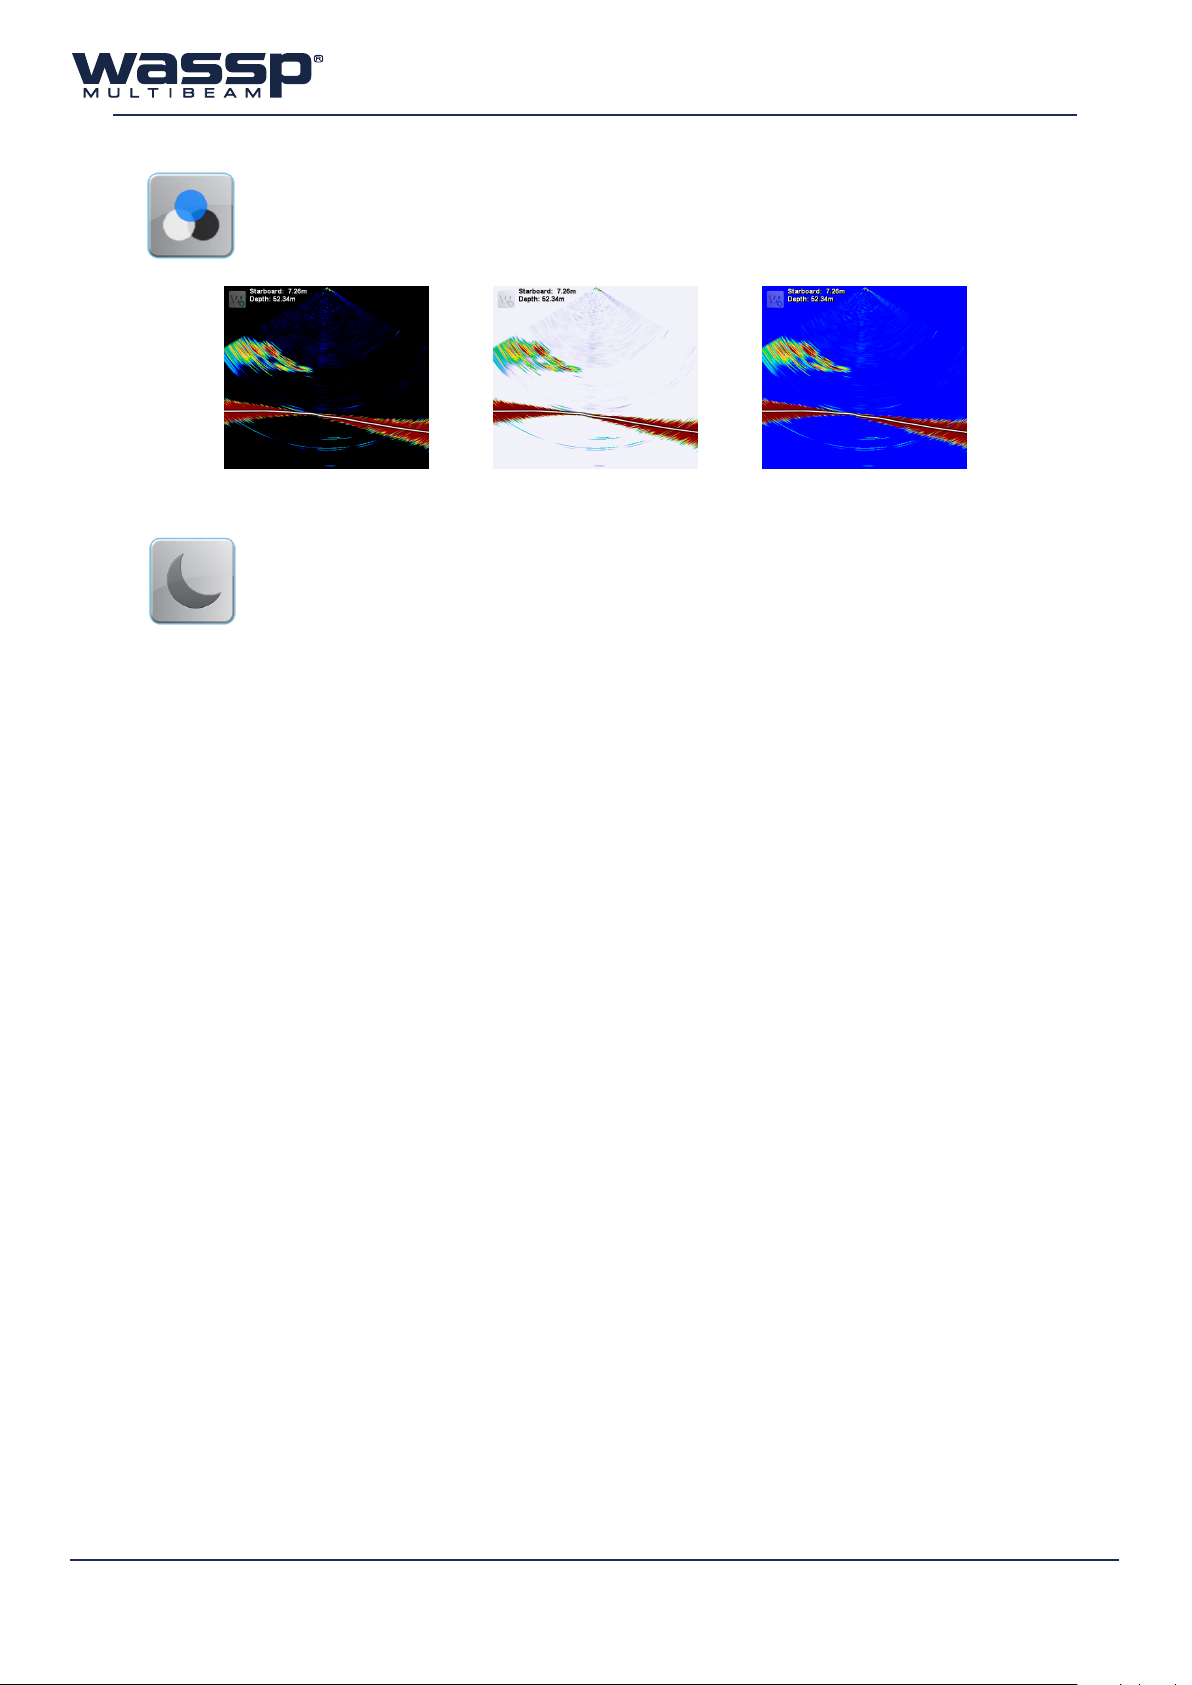
6.10 Hue
The Hue or Colour Scheme of the Sonar and Single Beam acoustic displays can be
changed by using this button. The button cycles through three (3) hue presets:
Black White Blue
6.11 Day/Night Mode
By default, the WASSP program runs in Day Mode. This means that the user interface
and all windows are shown with normal brightness as required during day time or bright
ambient light conditions.
If the WASSP program is being used during the night time or in reduced lighting conditions, the user
may find it more comfortable to use Night Mode. Night Mode darkens the entire user interface so that
the user is able to use the program in a darkened wheelhouse without having to allow time for the
eyes to adjust to a bright screen.
The Day/Night Mode icon is used to toggle Day Mode (normal operation) and Night Mode.
The brightness of the user interface while Night Mode is enabled can be set in the System Tab of the
System Configuration (see page 46). The selectable Night Mode brightness value ranges from 10%
(darkest) to 90% (brightest).
Adjusting the display brightness on the monitor you are using can also be used to reduce / increase
the screen brightness.
44
www.wassp.com
Doc. P/N: WSP-009-008
Version: V1.3
Issue Date: April 2014
Page 51

Operator Manual
System Configuration
7. System Conguration
The System Configuration button holds drop-down access to options, settings and
configurations that are required less frequently than items on the Main Menu or Utility
Panel. It consists of six (6) tabs,
7.1 System Tab
The System tab allows you to configure the following system-wide settings, as per the user’s
requirements.
7.1.1 Units
The following units are available to choose from:
► Depth: Meters, Feet and Fathoms
► Distance: Meters and Feet
► Position: Degrees, Degrees/Minutes, Degrees/Minutes/Seconds
7.1.2 Language
The language of the user interface can be changed here. Select a Language from the drop-down list
and click Apply.
7.1.3 Conguration Manager
Swapping between dierent preset configurations can be useful. This tool can be used to store and
load configuration settings used by the WASSP program.
The Configuration Manager allows an operator to save and load complete sets of configuration
settings including all of the settings previously discussed. This allows dierent configurations to be
switched between in a few seconds.
► Active Configuration:
Displays the currently active configuration. This configuration can be deleted with the ‘Delete’
button.
► My Configurations:
A list of previously saved configurations. The user can Load or Delete any configuration in the list.
The current configuration can also be restored to default settings. NB: The current configuration
will be lost unless it is saved prior to restoring defaults. Ship Setup information will be kept to
prevent the need for a new sea trial.
► New Configuration:
The user can save the current configuration by typing a name in the box and clicking ‘Create’.
The new configuration will appear in the ‘My Configurations’ list above.
List of saved configurations
The currently active
configuration
Load the selected
configuration
Delete the selected
configuration
Restore GUI Defaults
Doc. P/N: WSP-009-008
Version: V1.3
Issue Date: April 2014
Save the current configuration by
inputting a name and clicking Create
Figure 24. Configuration Manager
www.wassp.com
Press to reset the selected configuration
to default settings, including the ship setup
45
Page 52

7.1.4 System
► Snapshot Path:
This is the location where snapshot data is stored. To change
the snapshot path, click the button and browse to the new
location, then click ‘OK’.
► HD Display Mode:
For monitors set to resolutions of 1920x1080 or greater, the
user can select either Acoustic and Chart (side-by-side displays),
or Single Display (Acoustic or Chart displayed one at a time).
For displays smaller than 1920x1080, the configuration is limited
to Single Display (alternating between Acoustic and Chart
displays). See Figure 25.
► Brightness:
The level of brightness during Night Mode is adjustable via this
setting in 10% increments, between 10% and 90%. See “Day/
Night Mode” on page 44 for more information.
► Bottom Factor:
The Bottom Factor setting sets the gain level to use below
the first seafloor return on the Single/
Triple Beam display. The gain of signals
received above the seafloor line remains
unchanged. See Figure 26 for some
examples.
► Water Column Targets
Only targets above seafloor:
Targets recorded are those that are
positioned above the detected seafloor
line, and whose signal return exceeds the
current fish threshold (see “Fish Options”
on page 16). If no seafloor line is
detected, no targets will be recognised.
All Targets in Ping: Operation for passing
all water column targets through to
Bottom Factor of 100% Bottom Factor of 20%
Figure 26. Bottom Factor examples
the charting display when there is no
seafloor return. Used for deep water operation where no seafloor line is detectable and the user
wants to collect water column targets.
NB: When the Water Column Targets is set to “All Targets in Ping”, ALL DETECTIONS including
any seafloor returns with signal strength above the fish threshold will be sent to the chart display
as fish targets. See “Fish Options” on page 16 for further information on the fish threshold.
Acoustic Display Chart Display
Acoustic / Chart
(toggleable)
Figure 25. Display Mode Options
46
www.wassp.com
Doc. P/N: WSP-009-008
Version: V1.3
Issue Date: April 2014
Page 53

Operator Manual
System Configuration
► Triple Beam Layout:
The Triple Beam display can be set to a horizontal or vertical arrangement, depending on the
user’s preference.
► Backscatter:
Backscatter has been improved in WMB-X230 v1.2. To take advantage of improved backscatter
in WMB-X230 v1.2, the Backscatter setting must be changed to v1.2. Following this, a short patch
test is required in order to calibrate your system’s backscatter. See section “8.2.9.1 Backscatter
(v1.2 and later)” on page 57 of the Installation Manual.
► Enable Tooltips:
Tooltips can be enabled/disabled with this checkbox.
When enabled, positioning the cursor over buttons
on the Main Menu and the Utility Panel will reveal the
operation of that button.
► Triple Beam Scale:
By default, the data displayed on the port and starboard beams are not scaled, and thus display
Range information. If depth information is preferred, setting the Triple Beam Scale to Depth will
scale the data accordingly.
► Depth Scale for SB/TB:
The location of the depth scale overlay can be switched from the left-hand side (default) to the
right-hand side with this option.
► Gain Control:
When Gain Control is set to Global (default), the gain control dial (see “Gain Control” on page
7) controls the visual gain for the sonar and single / triple beam displays simultaneously. If
set to Active Display, the gain dial will aect only the display with the yellow border (the active
display).
Cursor
Tooltip
Figure 27. Tooltips example
Doc. P/N: WSP-009-008
Version: V1.3
Issue Date: April 2014
www.wassp.com
47
Page 54

7.2 Ship Setup Tab
7.2.1 General
General settings provide:
► Vessel Information: Vessel’s name, country and home port may optionally be entered here. This
will be recorded inside any raw data recordings.
► WASSP Hardware Settings: The Transducer Serial Number and BTxR Serial Number are filled in at
time of installation. These should not be changed by an operator. The BTxR Versions are reported
from the BTxR for diagnostic purposes.
► Device Settings: The three sensor types required for accurate profiling can be selected from
drop down lists. Select the appropriate installed sensor for each of the sensor types. The
advantages of having correctly selected sensors are that you can compensate for pitch (and
possibly heave) as well. To make corrections using the SC30’s Pitch, Roll and Heave values, select
the appropriate check boxes.
7.2.2 Osets
Osets are configured during the installation and commissioning of the WASSP system. See “8.1.1
Commissioning Step 1: Ship Measurements” on page 37 of the Installation Manual for more
information.
► Transducer Heave Compensation: This check box should be selected if the X, Y, and Z osets
have been recorded AND a motion sensor is configured. This settings enables the system to
compensate for relative heave at dierent points on the vessel generated by the vessel pitching
and rolling.
7.2.3 Sound Speed
The Sound Speed sub-tab allows you to set surface speed correction settings for fresh and sea water.
Valid values for both sea and fresh water range between 1000 and 2000 m/s.
Knowing the temperature gives a close approximation for the sound speed. In Manual mode the
Surface Sound Speed can be modified directly or calculated from temperature given a Salinity value.
Convex profile
INCREASE
sound speed value
Seafloor Profile Seafloor Profile
Figure 28. Sound Speed correction
salinity
The default value for the salinity of sea water is 35. This value should not be changed unless the
actual salinity of the surrounding water is known. If fishing in fresh water, the value should be set to 1.
Clicking on the Calculate button will re-calculate the Surface Sound Speed value based on the Salinity
and Surface Temperature values.
Concave profile
DECREASE
sound speed value
nmea temperature
If Use NMEA Temp is selected, the WASSP software will use NMEA temperature data from an external
temperature sensor. This information is shown adjacent to this option and will be reported in the
“Surface Temperature” window with any “Temperature oset” added to correct for any error in the
external temperature sensor.
Doc. P/N: WSP-009-008
Version: V1.3
Issue Date: April 2014
48
www.wassp.com
Page 55

Operator Manual
System Configuration
Wassp transducer temperature
If Use WASSP Transducer is selected, the WASSP application software will use temperature data from
this sensor. This information is shown adjacent to this option and will be reported in the “Surface
Temperature” window with any “Temperature oset” added to correct for any error in the external
temperature sensor.
7.2.4 Sensor
The Sensor tab provides a selection of motion compensation
options and corrections for sensor misalignment and time
delay. These settings should not be changed by the operator
outside of the commissioning process.
If roll correction is enabled and configured correctly and the
vessel is rolling less than 15°, the sonar picture should remain
on almost the same angle from ping to ping on reasonably flat ground. If the sonar picture rocks as
the vessel rolls, then the roll compensation setting is likely to be wrong or the motion sensor is not
being read by the WASSP system.
The settings on the Sensor sub-tab require
an understanding of the motion sensors
equipped and carrying out a series of
procedures covered in section “6. Sensors”
on page 28 of the Installation Manual.
headinG and pitch Offsets
The Heading and Pitch Osets will correct for transducer and motion sensor misalignment.
Gps time delay
All GPS positioning systems have some delay from receipt of the satellite signal to output of the
correction data. When a Furuno SC-30 is used as the source of position data, this delay is approximately
1.0 seconds and equates to an error of 5m in the location of an object on the seafloor at 10 knots. This
value should only be changed post-commissioning if the type of position sensor or its configuration
is changed.
mOtiOn delay
The motion delay value is displayed for information only and cannot be changed. The value is
determined by the type of motion sensor selected in the General Tab of the Ship Setup.
7.2.5 Power
The WMB-3230 (5230) BTxR can output 14 (16) dierent power levels, 7 in the low range and 7 (9)
in the high range. Each power level has a corresponding pulse width which is automatically applied.
The type of power control can be selected from three methods:
► Manual Power: The output power level is selected
manually using the Power Controls on the Main Menu (see
“Power Level Control” on page 7)
► Auto Power by Depth: The output power level is
determined by the current depth. The depth ranges are selectable from 14 drop-down boxes. A
Defaults button resets all fourteen power levels to a default setting. When setting power level
depth settings individually, click the Apply button after setting the levels.
► Auto Power by Signal: The output power level is set according to the maximum acoustic echo
received (normally the seafloor). The received level is set to prevent saturation of the receiver.
This option should provide the best overall system performance.
Note: There are TWO different Automatic Power modes. Automatic Power by Signal AND Automatic Power
by Depth. Automatic Power by Signal is better for seaoor mapping and seeing sh out on the sides near the
seaoor. Automatic power by Depth is useful to detect smaller sh easier at the cost of seaoor detection.
To switch between Manual and Automatic
Power, double click on the LED Power
Level indicator on the Main Menu.
Doc. P/N: WSP-009-008
Version: V1.3
Issue Date: April 2014
www.wassp.com
49
Page 56

If a power level is set out of sequence, for example level 5 is set to 40 m, level 6 is 70 m and level 7
is 60 m, then a WASSP information box appears and informs you that a specific power level is invalid
(level 6 in our example). Level 6 can then be set individually to a level below that of level 7 and above
level 5. See Figure 29.
Manual Power
Automatic Power
By Depth
Automatic Power
By Signal
Click OK and reset Power Level 6 to a level
between Power Levels 5 and 7.
If no other power levels have been changed,
clicking “Defaults” will reset the power level.
Figure 29. Ship Setup Power Tab
50
► Absorption Loss: As sound travels through water, some of the energy contained is absorbed
by the water, resulting in attenuation of the signal. The chosen value of absorption loss is set at
the time of installation, and is used when calculating backscatter. For the WMB-3230 system, a
default value of 40dB/km is used. For the WMB-5230 system, a default of 25dB/km is used. This
value should not be changed without a clear understanding of the absorption properties of the
water in the area you are working in.
www.wassp.com
Doc. P/N: WSP-009-008
Version: V1.3
Issue Date: April 2014
Page 57

Operator Manual
System Configuration
7.3 Tides Tab
The Tides window allows you to change the way the WMB-X230 uses tide information. Assuming the
Disable Tides check box is cleared, the WASSP system uses the GPS positioning information coming
through the WASSP Processor communications port to automatically select the closest tide station.
The WASSP system then calculates a tide oset value and adjusts the seafloor profile data using the
tide oset value.
Selecting the Disable Tides check box can cause the seafloor depth to vary as the tide waxes and
wanes, resulting in inconsistencies in seafloor mapping. Disable Tides should be selected if you are
working on a lake.
Enter the local time dierence in hours (from Coordinated Universal Time UTC) into the Local Time
dierence field to update the Current Time and Next Tide times to local time.
The currently selected
Tide Station
UTC Time + Local
Time Dierence
Local Time
Oset from UTC
Disabled Tides if
you are working
on a lake
tides dataBases WindOW
► Get Database: Upload a custom
.tcd database file for WASSP to use.
► Use Database: Select a database
from the database list and click this
to activate it.
Active Tide
Station’s GPS
Position
Current Vessel
GPS Position
tides infOrmatiOn WindOW
► Search: Search by name for a
Tide Station stored in the active
database. The station information is
shown below.
Doc. P/N: WSP-009-008
Version: V1.3
Issue Date: April 2014
Figure 30. Tides Tab
www.wassp.com
51
Page 58
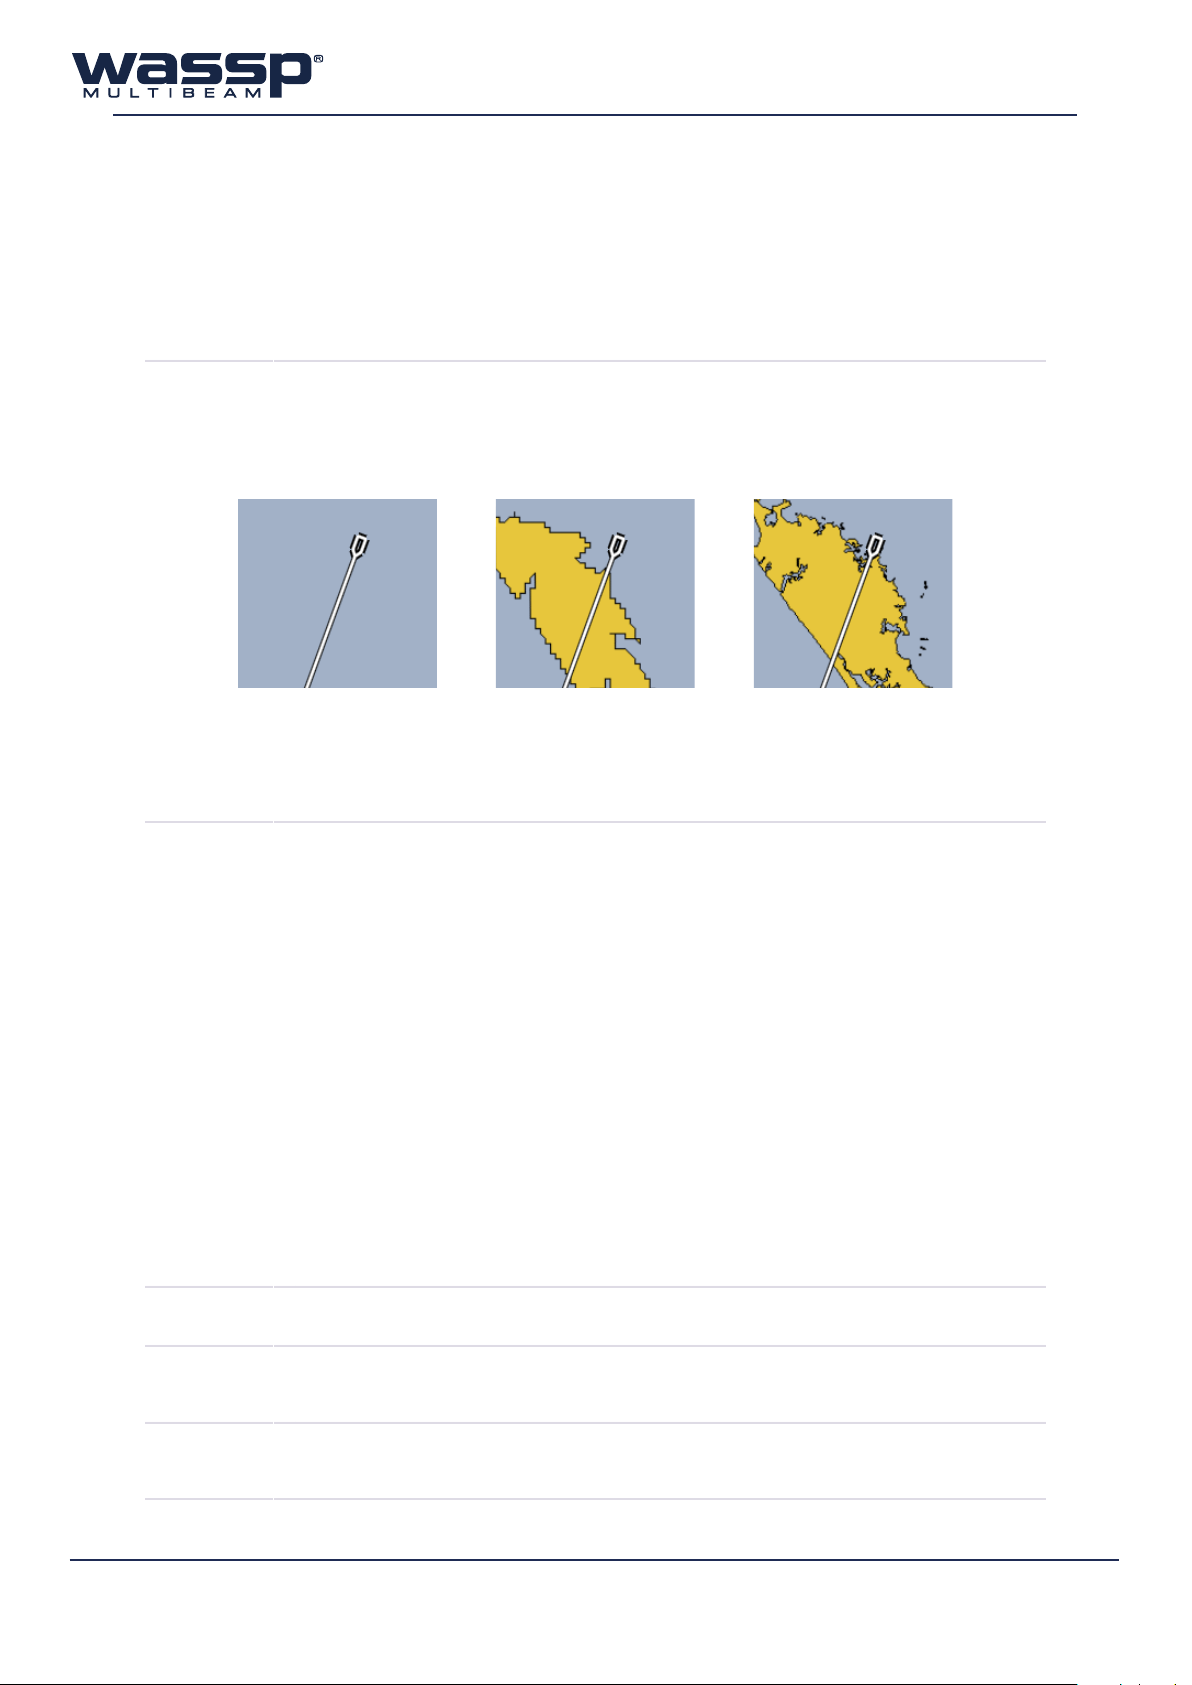
7.4 Chart Tab
The Chart Tab allows the user to configure the information that is presented on the charting displays.
This includes the ability to determine what features of the Navionics charts are enabled, how the water
column targets and vessel track are displayed, where and how depth information is displayed, and
various other settings.
7.4.1 Cartography
shOW chart
chart layers
The user can elect to have the Navionics chart overlay enabled or disabled.
Without a Navionics chart connected, a rough country-level overlay is drawn
which is replaced with the Navionics data once the card is installed and a Rescan is
performed (see “6.4 Rescan” on page 36 for more information).
Chart Disabled Chart Enabled
(no Navionics Card)
Figure 31. Chart Enabled / Disabled Examples
Chart Enabled
(with Navionics Card)
Selects the layers which will be shown on the chart overlay. Any changes made to
the active layers must be activated by clicking ‘SET’.
► Anchorage Areas: Areas where vessels can anchor and shows marinas, jetties
and wharfs.
► Cables: Overlays locations of underwater cables.
► Depth Contours: Shows the depth contour lines from the chart card.
► Depth Soundings: Shows the single depth soundings from the chart card.
► Nature Of Seabed: Indicates what the seabed is at various locations.
► Nav Aids: Shows location of navigational lights, beacons, buoys and markers.
► Port: Show port shapes such as pylons.
► Pipeline: Show location of pipelines.
► Wreck, Rocks: Locations of wrecks and rocky areas.
► Names: Shows names of harbours and locations on the chart. Will also show
warnings and information.
► Background Colour: Pale Gray (default) or Black background options.
► Maximum Colour Depth: Set the maximum colour depth (default 800m).
7.4.2 Overlays
headinG line
idth
W
shOW scale
On 2d
52
Adjusts the thickness of the heading line of the vessel on the 2D charting displays
Overlays a dynamic scale on the 2D charting displays
www.wassp.com
Doc. P/N: WSP-009-008
Version: V1.3
Issue Date: April 2014
Page 59

Operator Manual
System Configuration
shOW depth
at cursOr
shOW menu
laBels
shOW mark
laBels/values
fish 2d type
3d fish aGe
vessel track
When these options are enabled, a depth overlay will follow the cursor on the
screen so that the user can read depths where the cursor is placed. There are
separate options for both the 2D and 3D display.
The menu names /labels can be disabled. This will prevent the text from interrupting
the viewing of the chart window.
The user can enable / disable the text labels (Name and Value) that appear beside
marks. Placing the cursor over a mark will always reveal the name of that mark.
The fish overlay on the 2D charting display can be drawn in two dierent ways:
► Fish 2D Data: Fish detections are drawn on top of the seafloor image. The
colour on the overlay is dependant on the number of detections.
► Fish 3D Data: This is a flattened view of how the fish appear on the 3D display.
The colour of the fish detections is based on the intensity of return.
See “Show 2D Fish” on page 23 for information on how to enable the 2D Fish.
This controls how long 3D fish marks are displayed. Options range from 10 seconds
to 24 hours, or ALL (default). See “3D Fish” on page 32 for more information.
► Mode: The user can toggle whether tracking points are drawn when the vessel
has covered a certain distance, or when a certain amount of time has passed
since the last tracking point.
► Thickness: This changes how thick the vessel track is drawn.
► Distance / Time: Depending on the Vessel Track Mode setting, these settings
influence how far apart each tracking point is drawn.
► Colour: This changes the colour of the vessel track.
7.4.3 Bathymetry
cOntOur
interval
enaBle
liGhtinG fOr
hardness
mOnOchrOme
cOlOur
mappinG
OptiOns
It is recommended
to select Best Beam
method and to enable
the noise lter.
trackinG
OptiOns
smOOthinG
OptiOns
This option sets the interval of the contour lines drawn through the WASSP seafloor
data when Contour mode is enabled. See “Contour Lines” on page 24.
When the backscatter overlay is enabled on the 2D display, this will show lighting
changes due to slopes if enabled.
This allows the user to select the colour the seafloor will appear in monochrome
mode. The seafloor will be rendered in this colour with shading. It is useful for
when the 3D water column information is being shown.
► Best Beam:
This stops less accurate points from the outside beams overwriting the more
accurate points from the inside beams.
► Overwrite All:
All existing map points are overwritten with new points as they are received.
► Enable Noise Filter:
When enabled, this filter will reduce the noisy points which occur when the
detection line mis-tracks the seafloor.
These options apply slight changes to the seafloor tracking algorithm.
► Shallow Bias - When enabled, this option will always choose the shallowest
point from a range of points where there is tracking ambiguity.
These options apply to the construction of the seafloor mapping data into a surface.
► Low smoothing will draw more raw data but is unlikely to match up as well.
► High smoothing should reduce the eects of noise and mapping errors.
Doc. P/N: WSP-009-008
Version: V1.3
Issue Date: April 2014
www.wassp.com
53
Page 60

7.5 Layout Tab
The user interface of the WASSP program is very customisable. Seven (7) acoustic display layouts and
four (4) charting display layouts are available to customise to the user’s preference. Each preset has
been pre-configured at installation to provide a range of options for the user; however, modifying the
presets to the user’s preference is both easy and encouraged. The Acoustic and Chart displays can
each be configured to present dierent displays in a variety of arrangements:
Single Display Vertical Split Horizontal Split
1
3-Way Split
2
tO cOnfiGure the display layOuts:
Select the preset you want to configure.
1
Select what display layout you want. The available options can be cycled through by clicking
2
the selected layout button until the desired layout is displayed in the middle.
Now that layout you selected in Step 1 (Sonar 1-7 or Chart 1-4) is stored as part of the
configuration, and can be activated by cycling through the Acoustic or Chart Layout
buttons on the Main Menu. See “2.7 Layout Selection” on page 7 for more information.
Move on to the next preset if you so wish to configure another layout (Step 1).
3
54
Layout arrangements can be restored to the default
settings by clicking the ‘Restore Defaults’ button in
the bottom right-hand corner of the window.
www.wassp.com
Doc. P/N: WSP-009-008
Version: V1.3
Issue Date: April 2014
Page 61

Operator Manual
System Configuration
7.6 Snapshots Tab
The Snapshots Tab allows reviewing and renaming of snapshots taken with the Snapshot button
located on the Main Menu (see page 8).
The Snapshot button records the last ~1000 pings duration of the current seafloor and water column
scanning session or demo file. The snapshot is stored in the WASSP Processor and can then be
renamed and displayed in the Single / Triple Beam and Sidescan displays at a later time under the
Snapshots Tab.
Note - Sonar data is not saved and the Sonar display will be blank when viewing a snapshot.
The snapshot does not replay like a demo file. When selected and loaded into the program it remains
static. All menu options are still available and each display can still be independently zoomed in or out.
lOad
snapshOt
delete
s
napshOt
update
Clicking the Load Snapshot button loads the selected snapshot file and displays it
on the WASSP user interface.
If a snapshot is no longer required, or is out-of-date, it can be deleted by highlighting
it and then clicking the Delete Snapshot button.
The Update button saves any changes made to the name of a snapshot. Select the
snapshot name you want to change in the Current Snapshots box, then edit the
name under the Current Snapshot Details box and click Update.
Doc. P/N: WSP-009-008
Version: V1.3
Issue Date: April 2014
www.wassp.com
55
Page 62
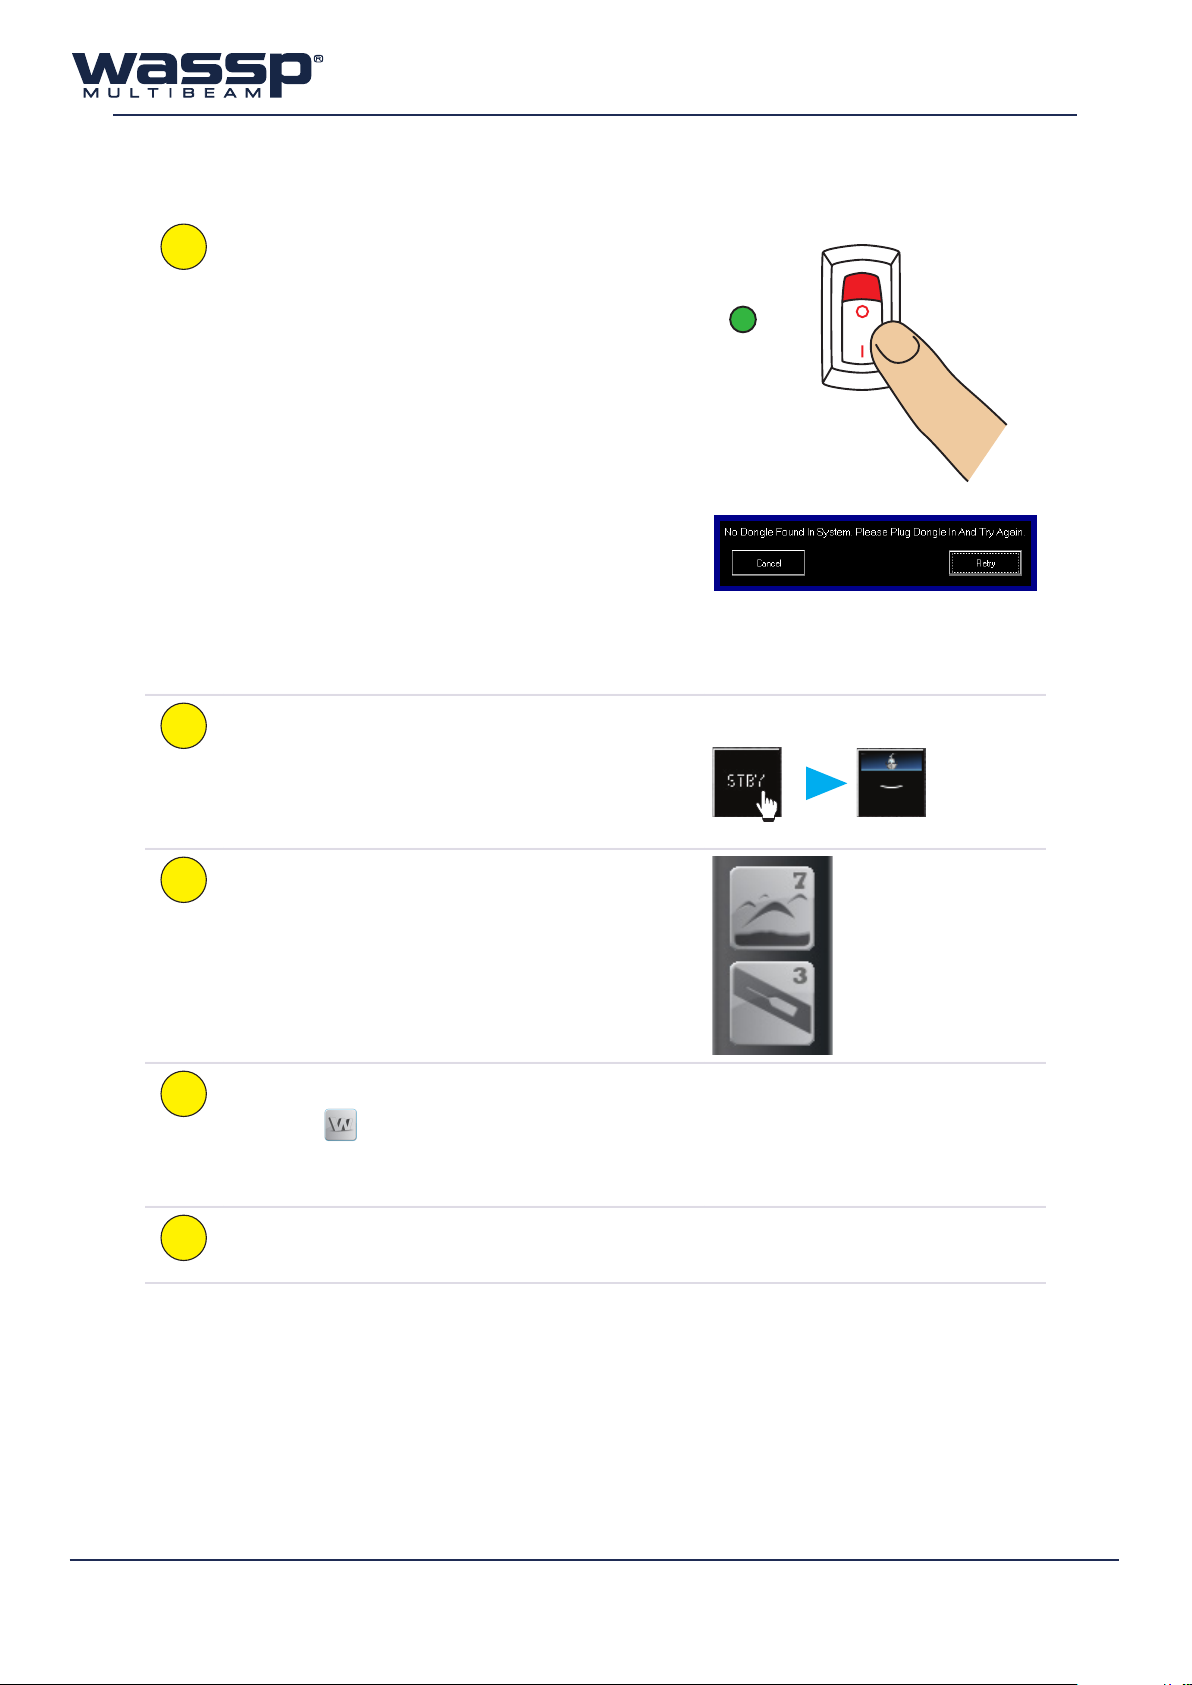
8. Operating Procedures
ST
Turn on The power:
1
Press the POWER button on the BTxR.
The BTxR starts up and the LED glows RED.
Turn on the WASSP Processor.
In standard installations, the WASSP program starts
up automatically. The BTxR LED will turn GREEN
once the program has initialised.
If no dongle is found, a Dongle Error message
appears on the screen.
The program then performs a self-calibration (MODE
button turns YELLOW). When the button turns BLUE
it is ready to go.
Ensure a dongle has been plugged into the WASSP
Processor’s USB port and click Retry. If this doesn’t
work, remove the dongle and try plugging it in again.
TransmiT, receive:
2
Click the MODE button to switch from STBY
(standby) to the transmit mode.
When transmitting, the transmit button animates
showing a pulse being transmitted from the vessel.
choose a display mode:
3
Cycle through the display layouts to choose a display
mode you want to use. Left-click to cycle forwards,
right-click to cycle backwards.
ATUS
You can click Cancel and run a demo file
POWER
from the Utility Panel.
56
cusTomise The selecTed displays:
4
Click the icon in the top-left corner of each
display to open the menu for that display.
Select any options you require.
perform any seafloor profiling operaTions you
5
require
www.wassp.com
Doc. P/N: WSP-009-008
Version: V1.3
Issue Date: April 2014
Page 63
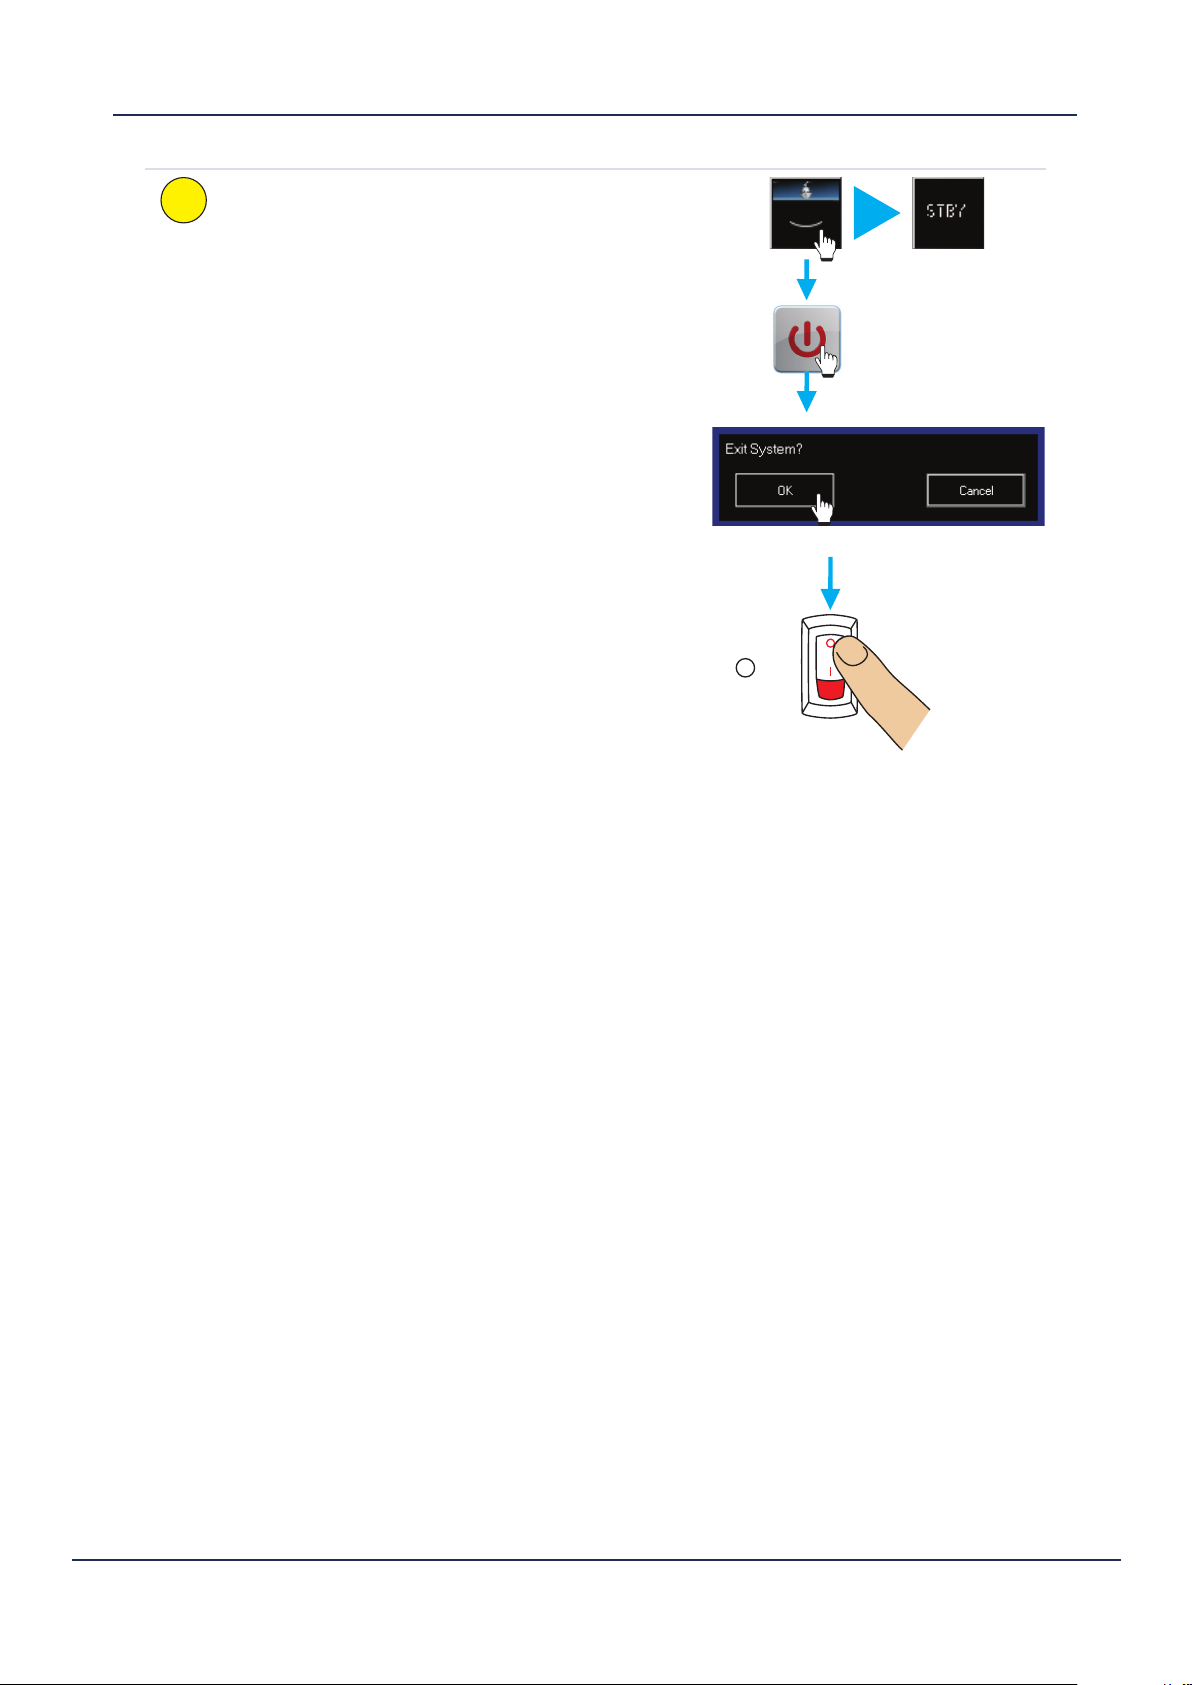
Quit the Wassp prOGram:
6
When you have completed your profiling operations:
► Click the MODE button to set the BTxR to
standby.
► Click the Exit button on the main menu.
The Exit System box appears.
► Click OK.
► All files opened by the system are closed
automatically and the program shuts down.
► Shut down the WASSP Processor following
standard Windows procedure.
► Turn the BTxR OFF using the POWER button on
the face plate.
► The WASSP system is now shut down.
Operator Manual
Operating Procedures
STATUS
POWER
Doc. P/N: WSP-009-008
Version: V1.3
Issue Date: April 2014
www.wassp.com
57
Page 64

9. Frequently Asked Questions (FAQs)
Following is a list of frequently asked questions (FAQs) covering common problems encountered
when operating the WMB-X230 system. Note the Troubleshooting section of this manual covers
most of the typical operational problems, and this section should be consulted only after reading the
Troubleshooting section. Each FAQ question is numbered and answered in the following pages.
1) “The system is transmitting too slowly, how can I speed it up?” 59
2) “Why does the range not change on the display when I move the Range Dial?” 59
3) “Why is no seaoor prole generated on the charting displays after the system initially
starts transmitting?” 59
4) “Why do gaps appear between the swath footprints on the charting displays?” 59
5) “The system has stopped transmitting without operator intervention. Why?” 60
6) “When I click the MODE button, or run a replay (demo) le I get no picture on the display.
Why?” 60
7) “When I press the MODE button, the button goes red and a number on it counts up, but
there is no activity on the WASSP display. How do I x this?” 60
8) “What does the error message that appears when I run WASSP mean? Is my WASSP system
faulty?” 60
9) “Why is there a ring displayed just above the seaoor? What causes these ‘ring’ marks?
How can I get rid of them?” 62
10) “What is this constant signal on the sonar/sh nder display?” 63
11) “Why is my WASSP System not tracking the Seaoor?” 64
12) “Why doesn’t the seaoor line up when I go over it again?” 64
13) “Why does the seaoor move if the system is motion compensated?” 65
14) “The MODE button animates as if pinging but nothing happens. What is wrong?” 66
58
www.wassp.com
Doc. P/N: WSP-009-008
Version: V1.3
Issue Date: April 2014
Page 65

Operator Manual
Frequently Asked Questions (FAQs)
9.1 The system is transmitting too slowly, how can I speed it up?
Remember that the WASSP system must acquire twice the depth of standard sounders to enable the
full seafloor profile across 120°. If the entire profile is to be captured, the ping rate will need to be at
least half that of a standard single beam sounder.
Manually adjusting the range dial will increase the ping rate significantly but will result in the loss of
seafloor information, including break up of the seafloor data on the charting 3D display after a point. If
you are only interested in the centre beam of the Triple Beam display, the range dial can be manually
reduced to just over half the current depth in metres. The optimal range is twice the current depth in
metres. The range dial should normally be set to automatic (green digital display).
Other programs running at the same time as the WASSP program consume processing power and take
processing time away from the WASSP system, slowing down the rate of transmission. For optimal
performance, ensure WASSP programs are the only applications running.
9.2 Why does the range not change on the display when I move the Range Dial?
Double-click each acoustic viewing mode (Sonar, Single / Triple Beam, Sidescan displays) to reset the
view so that automatic range control is re-enabled. The range continues to track the range dial while
in this mode. If any zooming is done with the wheel mouse then automatic range control will be
disabled again until you once again double-click on the appropriate view.
9.3 Why is no seaoor prole generated on the charting displays after the
system initially starts transmitting?
Check that the NMEA data input is being received and that the communications ports are configured
correctly. If the range for data collection is too small, the system cannot acquire the seafloor and
cannot track the range automatically. Enter the manual range mode and set the range deep enough to
acquire the seafloor before returning to the automatic range mode. Also check that seafloor mapping
is enabled (see “2.10 Mapping Options” on page 8).
9.4 Why do gaps appear between the swath footprints on the charting displays?
There are multiple possibilities here:
► The vessel may be travelling too fast to map the seafloor in this depth of water.
► The range setting could be set much larger than necessary and as a result the system is
transmitting slower than is optimal.
► The WASSP Processor is giving processing power to another operation (other than the WASSP
program) causing processing of sounding information to take longer, resulting in a slowed
transmission rate of the WASSP system.
► The GPS data has come in at irregular intervals.
► The WASSP system has stopped. See Question 9.5.
► The GPS data source may have dropped out completely, preventing the system from mapping
the seafloor data to its appropriate location. Ensure an isolation device is being used to convert
the current loop NMEA to RS-232.
► The seafloor detection may have briefly failed due to aeration or excess noise.
Doc. P/N: WSP-009-008
Version: V1.3
Issue Date: April 2014
www.wassp.com
59
Page 66

9.5 The system has stopped transmitting without operator intervention. Why?
If time is taken from the system by another application for long enough, the WASSP system may
restart transmission in a number of seconds. If the system does not restart, try stopping and then
starting the system using the MODE button on the Main Menu. If this does not work, try to restart the
WASSP program and the BTxR. The most likely cause of this is a sudden power supply spike or drop.
9.6 When I click the MODE button, or run a replay (demo) le I get no
picture on the display. Why?
The WASSP program is designed to run in 32-bit colour, with a minimum 1024x768 resolution. Check
your display settings and change if required.
9.7 When I press the MODE button, the button goes red and a number on
it counts up, but there is no activity on the WASSP display. How do I x
this?
First make the following checks of your WASSP installation:
Check that the BTxR power is ON and the LED light on the front panel has lit up either GREEN or RED.
Make sure the CAT5 network cable is connected at both the BTxR and the WASSP Processor ends
(unplug and re-plug to make sure).
Check that the Transfer Task application is running (look for the icon on the Start Bar at the bottom
of your monitor) and was running when you started WASSP. If not, restart WASSP after running the
Transfer Task application.
9.8 What does the error message that appears when I run WASSP mean? Is my WASSP system faulty?
Consult the list below for the cause/course of action if an error message is displayed in WASSP.
► Cannot Find Tide TCD File
Use the tide function to search for a valid database file.
Check file is present in directory. Reinstall if not present.
► Error Loading TVG File
Check in the Windows Control Panel under Regional and Language Options,
Regional Options, Customize, Numbers Tab, that the “Decimal Symbol” setting is set to a ‘.’ rather than a ‘,’
(comma)
Check file is present in directory. Reinstall if unable to locate.
► “Too Many Files With This Name. Aborted.”
This occurs when storing raw data using the data recorder if there are more than 1000 files of the same initial name in a directory. Change the name or directory if you wish to continue to save raw data files. NOTE:
Unless you require the raw data for some purpose it is not recommended to record raw data files – these
files are very large (≈ 2Gb/hour) and will require careful management in order to prevent the Hard disk drive
of your WASSP Processor from becoming full. A WASSP Processor with a full disk drive becomes unusable.
Try to have at least 10 GB of free drive space at all times to allow sucient room for system file management.
60
www.wassp.com
Doc. P/N: WSP-009-008
Version: V1.3
Issue Date: April 2014
Page 67

Operator Manual
Frequently Asked Questions (FAQs)
► Cannot set power levels. Power Level x invalid.
This occurs when setting the power level settings when the depth values do not increase as the power levels increase. Check that every depth selection for each sequential power level is greater than the previous.
► No Dongle Found In System. Please Plug Dongle In And Try Again.
This error can occur if the USB device has not been detected by windows or the Dongle is not connected
to the system. Remove the dongle if it is already in place and then reconnect it to the WASSP Processor after a few seconds. Press the retry button. The system will operate in replay mode without a WASSPDONGLE
but will not work in real time.
► This dongle does not support the WMB-X230 system.
This error will occur if the current WASSP dongle is not licensed to run a WMB-X230 system. Contact your
dealer to acquire an appropriate WASSP dongle.
► No License File Found On Dongle.
The most likely cause of this error is that the WASSP dongle has been modified or the contents have become corrupted. If the license file has been removed from the dongle the system will not operate.
Contact your dealer to source a new WASSPDONGLE – you will need to return your current faulty Dongle.
► License File Is Corrupted.
The licence file on the WASSPDONGLE has been modified in some way and is no longer valid. Contact your
dealer to source a new WASSPDONGLE – you will need to return your current faulty Dongle.
► No Attitude: No Pitch.
The system is configured to compensate for Pitch and there has been a gap of multiple pings where there
was no Pitch data received. Check the Motion Sensor configuration in WASSP. Also check the Serial Port
configuration in the WASSP Transfer Task and finally that the sensor itself is on and operating correctly.
► No Attitude: No Heave.
The system is configured to compensate for Heave and there has been a gap of multiple pings where there
was no Heave data received. Check the Motion Sensor configuration in WASSP. Also check the Serial Port
configuration in the WASSP Transfer Task and finally that the sensor itself is on and operating correctly.
► No Attitude: No Roll.
The system is configured to compensate for Roll and there has been a gap of multiple pings where there
was no Roll data received. Check the Motion Sensor configuration in WASSP. Also check the Serial Port configuration in the WASSP Transfer Task and finally that the sensor itself is on and operating correctly.
► TX PWR ERROR
This warning informs the operator that the Transmitter did not reach full voltage during the system start up
sequence - the most common cause for this is a low 24V power supply voltage/current. If the system appears to operate correctly after you see this message then this is not an issue. If the system does not appear
to function then the error implies that the BTxR Transmitter unit has failed - Contact your Dealer for further
assistance.
► System Initialisation Failure
This error implies that the system was not fully operational when the WASSP GUI was run. Shut down the
WASSP Processor and the BTxR and do a complete restart. If the error message continues to be shown,
refer to the troubleshooting section on Page 76, or contact your dealer for further assistance.
Doc. P/N: WSP-009-008
Version: V1.3
Issue Date: April 2014
www.wassp.com
61
Page 68

9.9 Why is there a ring displayed just above the seaoor? What causes
these ‘ring’ marks? How can I get rid of them?
This ring is a by-product of the multi-beam technology of your WASSP system. It is supposed to be there
but in practice we want to make it as dicult to see as possible. To avoid these rings confusing the seafloor
tracking algorithms or being confused as fish marks, the Minimisation feature allows these rings to be suppressed on the Sonar display. Care should be taken because hiding these rings will also make it hard to see
any signals below them such as fish on the bottom.
When a signal arrives at the receiver it creates a shadow like eect that creates a ring of much weaker
echoes - the stronger the signal, the stronger the rings. Unfortunately the signal return from the seafloor is
many orders of magnitude stronger than a fish echo and thus the shadow of weaker echoes can be comparable to fish targets.
How do I know if I have a problem
then? When running with Auto Power
By Signal (BLUE) and the power level is
above 1 then the required minimisation
should be 1500 or less. The lower this
is the more chance of seeing fish below
the ring but the more chance of the
rings being visible on the Sonar display.
If you are required to use a higher power
level then it may well be impossible to
hide them completely with Minimisation.
If you have the system working with no
sign of these rings and then they start to
appear and you have not changed the
Minimisation settings then something
has changed for the worse – keep reading.
► Too much power
This is the most common cause of problems. When there is too much acoustic energy in signals returned
from the seafloor they may distort. Distortion of the signals will cause ambiguity in resolving the position
and thus create rings of very high amplitude. Unless in very shallow water, Auto power by Signal mode will
automatically try to select the highest power level that doesn’t cause distortion. You may get the occasional
strong return causing faint rings, but this is good so that you have as much power as practical for detecting
fish.
► Gain settings
This ring will appear more or less significant as the Gain Control dial is changed (see “Gain Control” on page
7). The Normalise option will change the relative intensity.
► Shading of Receiver
Any dierence across the receiver caused by marine growth or any other irregularity across the face of the
receiver will contribute to a reduction in the discrimination of the WASSP system. This will lead to higher
intensity rings.
► Reconnection Fault
If the cable from the BTxR to the Transducer was disconnected and has been reconnected recently it is
possible the receiver is connected incorrectly. Check the colour codes of Ethernet connections.
► Calibration
It is possible that the system calibration was disrupted by another sounder. Close the WASSP GUI and re-run
to allow the system to re-calibrate.
► Electronics Failure
If one or more central channels fail in the electronics this will increase the intensity of the ring.
► Configuration
Changes made in the Technician configuration could significantly change the system performance. Restart
the WASSP GUI if you are unsure what state the system is in. The Configuration Manager has a Defaults option to load your default configuration settings if all else fails (see “Configuration Manager” on page 45).
62
www.wassp.com
Doc. P/N: WSP-009-008
Version: V1.3
Issue Date: April 2014
Page 69

Operator Manual
Frequently Asked Questions (FAQs)
9.10 What is this constant signal on the sonar/sh nder display?
There are many sources of noise, interference and general acoustic reflections which can make these
displays dicult to use. A description of the dierent types of noise and ways in which you might be
able to determine and eliminate them follows.
► Sonar/Sounder
Other sound-producing devices will produce constant blips on the WASSP sonar display which will vary in
intensity and size depending on the transmission power and angle of the system. If you wish to continue
using your other sounders you can suppress this noise using the Interference Filter option.
► Aeration
Air in the water around the transducer can cause transmitted signals to be absorbed or reflected prematurely resulting in false signal reports from the transducer.
► Biomass
Large bodies of photo plankton can float through the sea covering very large areas. This may be the source
of large areas of constant faint signal return through a region of the water column.
► Own Transmission
WASSP shows all received signals starting from half way through the transmission pulse. Thus you should
see a red or yellow ring at the top of the Sonar display. As power level and pulse width increase this signal
return will be stronger and larger.
► Keel Reflection
If the WASSP system is mounted in such a way that transmitted signals can reflect o the ship’s hull you may
find that there is a constant strong return shown on the sonar display. This may happen even if the hull is
just outside the 120degree transmission swath. If a strong signal follows the boat and is within the dimensions of the ship then this signal is probably a reflection o your own ship. This will make it hard to detect
fish at this depth but otherwise shouldn’t aect the performance of your WASSP system.
► Electrical
There are an almost infinite number of ways in which Electrical Noise can influence system performance.
The first priority is that the system be well grounded – this means a large and preferably short grounding
wire connects the BTxR to the Power supply ground. WASSP is relatively protected by noise on Power supply sources but a very noisy supply could cause trouble. More likely causes of electrical interference are if
noisy, high power machinery or wiring is run beside the transducer cable. Electrical noise is either constant,
regular or transmit power dependant.
► Water Temperature Layers
A thin faint horizontal line that is present ping after ping in the same place could be a temperature layer. The
sea is often layered with various temperature layers due to pressure and surface mixing. Often a reflection
can be created at the depth where a significant change in water temperature occurs – causing an acoustic
return.
► Prop Noise
If the turbulent water flow o the props is directed onto the transducer face this could create aeration
noise. Especially relevant for lower frequency models – it may be possible to pick up the prop noise as an
acoustic source. For this reason it pays to mount the transducer some distance from the ships props. Prop
acoustic noise will appear on the side of the Sonar display close to the prop and will look like a regular pulse
or solid signal depending on the rotation speed.
► Vibration
Shudders of vibration and vibrating mounting structures can induce significant noise. Additionally a vibration
in mounting can cause motion compensation of the system to fail. Sharp jolts and vibrations will generate
rings of high signal.
Doc. P/N: WSP-009-008
Version: V1.3
Issue Date: April 2014
www.wassp.com
63
Page 70

9.11 Why is my WASSP System not tracking the Seaoor?
Any source of noise mentioned in the answer to 9.9 and 9.10 above can cause the seafloor detection
to fail if it is bad enough. In some cases bad noise can cause the tracking to fail and it could take a
number of pings for the WASSP system to re-acquire the seafloor. In some instances noted below and
in bad cases of noise, it may not be possible to automatically resume seafloor tracking.
► Power
If too much power is being used for the depth of water you are operating in, the seafloor tracking signal
could be noisy especially if there is enough power to cause signal distortion as the tracking algorithm may
track the rings produced by this. Conversely, too low a power level may result in the signal levels from the
seafloor being below the noise floor of the system and thus they will be ignored as noise. This will tend to
cause the surface noise to be considered as a bottom detection candidate.
► Depth
The WASSP system can acquire a seafloor profile swath 3.5 times the nadir depth but this requires the acquisition depth to be at least twice that of the maximum depth on that swath. WASSP takes this into account
and when the Range Dial reads 100m the system acquires to 210m. If the acquisition depth (i.e. range dial)
is in manual mode or the system fails to track down with the seafloor then you may need to manually increase the system range to allow it to re-acquire the seafloor.
► Fish
Occasionally a very large dense school of fish can be detected as a mountain on the seafloor. This should
be easy to determine with a second pass over the area at a later time. This function also allows wrecks to
show on the contour display as these are often similar in density to fish schools.
► GPS Position
If there is no position input, the WASSP system will not output depth data and will cease to map the seafloor.
► Minimisation
The seafloor tracking is aected by the Minimisation level; ensure this is set appropriately as described in the
Installation Manual on page 49.
9.12 Why doesn’t the seaoor line up when I go over it again?
There are several factors which can cause this to show on your WASSP display however remember that
if the vessel is operating in a high sea state, your motion sensor may not be able to fully compensate
for the vessel’s movement:
► GPS Time Lag
The standard Furuno SC-50 and SC-30 Heading sensors have a 1.2 second delay on GPS data. Ensure that
any GPS delay is entered into the Sensor Tab of the Ship Setup as this will cause large errors in depth (see
“Sensor” on page 49).
► Motion Compensation
To make good use of motion compensation we must ensure that the WASSP transducer and any motion
sensors are securely mounted and do not move at all. The dynamic and static accuracy of the motion sensor eectively determines the dierences you can expect when you pass over the same area again.
► Sea State
Motion Compensation is a complex process and makes some assumptions – the bigger the sea state and
the smaller the boat the less reliable the seafloor data will be as there is more reliance on the accuracy of
measurements and the input from the motion sensors.
► Cornering
Motion compensation is costly to do to the nth degree. Most low end motion sensors have poor performance on corners due to the centripetal acceleration forces caused by the turn aecting the delicate
balance of the sensor. Thus, seafloor detections collected while the boat is turning are likely to be of lesser
quality than those collected in a straight line.
64
www.wassp.com
Doc. P/N: WSP-009-008
Version: V1.3
Issue Date: April 2014
Page 71

Operator Manual
Frequently Asked Questions (FAQs)
► Water Temperature
The water temperature and salinity aect the sound speed and thus the angle at which the sound moves
through the water column. This causes the seafloor to curve up or down as noted on page 48. If the seafloor exhibits a curve up or down on the edges, adjust the sound speed. Note: The surface water temperature will probably change during the course of a day.
► Tide Correction
Tide correction is essential for matching up overlapping swaths. If you have disabled the Tide correction
(see “Tides Tab” on page 51), the swaths will rarely line up on your WASSP displays. Ensure that the ZDA
sentence is being collected and sent to the WASSP Processor so it can determine the UTC time and use the
correct tide compensation value.
► Transducer Osets
The transducer, GPS and draft osets need to be input into the WASSP ship setup configuration so that the
motion-induced errors in the seafloor can be correctly compensated for.
► Roll Oset
If there is a fixed oset in the mounting of the transducer or Motion Sensor you will need to conduct a
patch test to determine this error. Without this, the roll correction will not work correctly.
9.13 Why does the seaoor move if the system is motion compensated?
The acoustic views are only compensated for vessel roll to save on processing time and to avoid
creating artefacts in the data. If the Sonar display is rotating with the vessel, then the roll correction is
not working. Remember too that if the vessel is operating in a high sea state, your motion sensor may
not be able to fully compensate for the vessel’s movement.
► Check roll information is being received
Open the Sensor Data Tab of the Raw Info window and check that a roll signal is being read by the WASSP
system (see “Sensor Data Tab” on page 40 for more information). You should see an orange line on this
display if the roll information is being processed.
► Check that the device that you receive roll information from is on and that all your serial cables
are still connected to your WASSP Processor.
► Check that the correct sensors are selected in the Ship Setup, this configuration could have been
inadvertently changed.
► Check that the Roll Configuration settings have not been changed.
If the transducer has been re-installed, the Swap Array setting could have changed in which case you will
need to invert the Swap Roll setting. If the roll oset is incorrect, a slight roll of the display will occur. If the
Swap Roll setting is incorrect you will see a doubling of the actual vessel roll (i.e. the roll received when Roll
Correct is disabled).
► Finally if the seafloor is not uniformly flat you could see rapid changes in the sonar display with
each ping as the ship moves across the seafloor. As there is no heave or pitch compensation on
this display it will often move up and down and if the seafloor changes angle it will also appear
to roll a bit. If you are unsure, check that the seafloor remains flat on a flat piece of seafloor and
remember that a vertical shift is expected if there is vessel roll, pitch and or heave. These artefacts
should be mostly removed when you look at the charting displays which is corrected for the
measured attitude elements.
Doc. P/N: WSP-009-008
Version: V1.3
Issue Date: April 2014
www.wassp.com
65
Page 72

9.14 The MODE button animates as if pinging but nothing happens. What is wrong?
The charting displays will not update without enabling the GPS information, seafloor profile information
and mapping. Check your GPS is on. This can be validated by checking the Network window or
Transfer Task diagnostics displays. If the seafloor line is not being traced on the Sonar display or the
Mapping has been disabled, then new data will not be added to the charting database.
Increase the gain, and range. Can you see noise on the Sonar display? If not, reset the power to
the BTxR, and reset the WASSP Processor and retry. If this problem persists and there are no error
messages, contact your dealer. If you are getting an error message or messages, look at the relevant
information for the error message in the error section of this FAQ (page 60).
Ensure that the Transducer has not been disconnected from the BTxR - both the receiver cables and
the transmit cables need to be connected in order for the WASSP system to operate. If problems
persist after a full system shutdown and power up then contact your dealer.
9.15 Why is the Key Pulse from my secondary sounder not triggering the WASSP system?
► Ensure you have wired the input correctly, and that the input signal is suitable (see “4.2.2.3 Key
Pulse Connection” on page 19 of the Installation Manual).
► Be mindful that the KP Activity LED on the Network Window is not an accurate representation of
the input signal, and merely indicates KP state changes within WASSP’s data acquisition time in
each ping. This activity LED may not light up at all if the Master system pings slower than WASSP,
even though WASSP may ping in sync (when in slave mode).
► Currently there is a known issue that keying pulses with pulse widths smaller than ~0.1ms may
not trigger the system correctly. It is recommended that you run the WASSP system as Master,
and set the secondary sounder as the Slave.
66
www.wassp.com
Doc. P/N: WSP-009-008
Version: V1.3
Issue Date: April 2014
Page 73

Operator Manual
Troubleshooting
10. Troubleshooting
If the WASSP program provides no data when you transmit, check the following:
► Ensure that all cables and connections have been installed correctly. For example, TCP/IP cables,
GPS, NMEA sensor, BTxR cables and so on (see “2.1 WASSP System Interconnections” on page
5 of the Installation Manual).
► Software installation and settings. See Checking Software Installation procedures below.
► NMEA data sentences. See Step 5 of the Checking Software Installation procedures below.
Confirm that the Device Connection Indicator for
1
the Dongle and BTxR are both green.
If the Dongle indicator is red, plug in the WASSP
Dongle and Rescan (see page 36).
If the BTxR indicator is red, ensure the BTxR is
powered ON and connected to the correct network
port of the WASSP Processor via the supplied
ethernet cable (see “APPENDIX A - Specific WASSP
Processor Information” on page 64 of the
Installation Manual).
Confirm the Transfer Task symbol is present in the
2
Windows Task Bar.
If not in the Task Bar, run the Transfer Task. Click
Start > All Programs > WASSP > Transfer Task.
Open the Transfer Task then the NMEA tab.
3
Check that the COM ports are correctly configured
to receive the incoming NMEA data. If the Activity
LEDs are RED, there is a problem. Check that only
COM 1-4 are selected for the NMEA ports.
Restart the WASSP program.
4
If the system is correctly configured and the BTxR
is ON, the MODE button turns YELLOW almost
immediately while performing a self calibration, and
turns BLUE approximately 3 seconds later.
Switch to the charting view and confirm that the
5
vessel icon shows the vessel in the correct position.
Doc. P/N: WSP-009-008
Version: V1.3
Issue Date: April 2014
www.wassp.com
67
Page 74
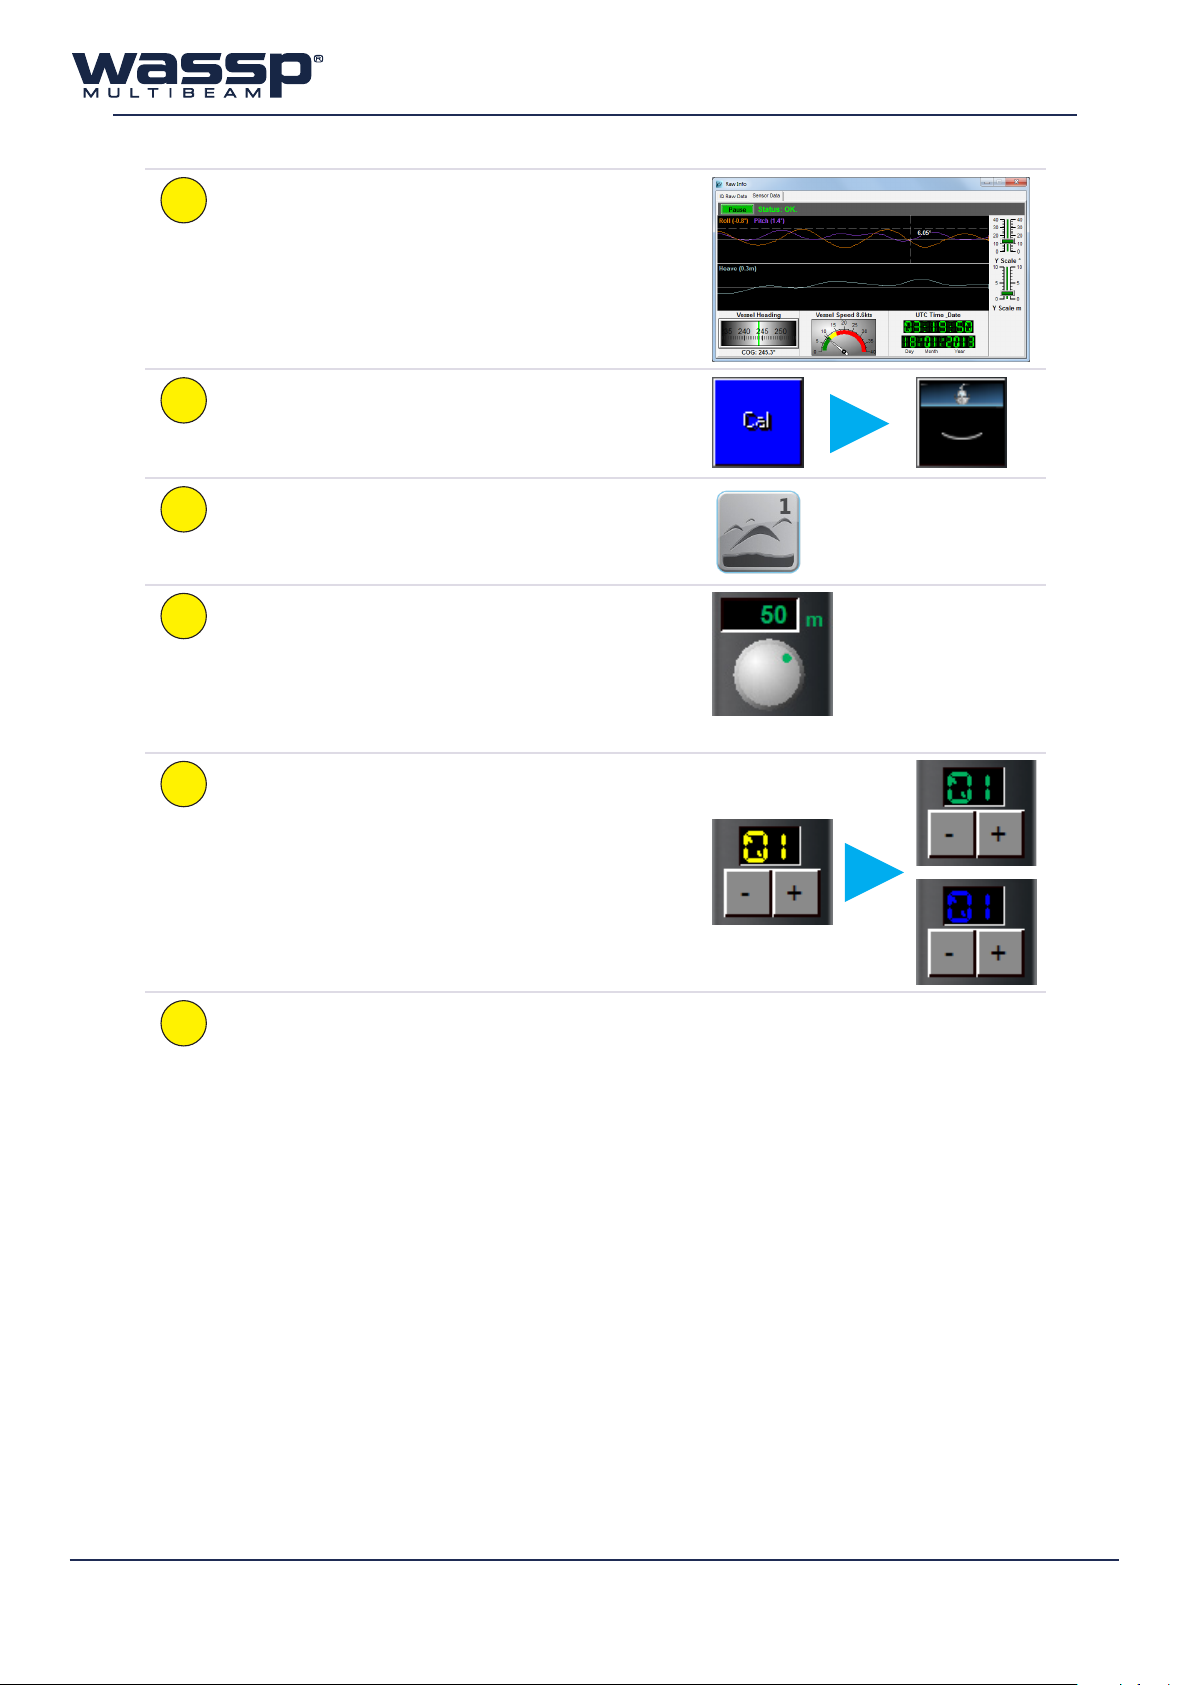
6
7
8
9
10
Open the Raw Info display from the Utility Panel,
then the Sensor Data tab.
Confirm that the Roll, Pitch, Heave and Heading
readings are all active and correct.
Click the MODE button to start pinging.
Confirm that the icon animates while pinging,
showing a pulse moving down from the vessel.
Switch to the Sonar display.
The Range Control might have locked on to an
incorrect depth. Adjust the Range Control dial so
that the returned signal from the seafloor can be
seen on the Sonar display.
Double-click on the range indicator to switch
between automatic range and manual range.
On the Main Menu, set the Power Level to
Automatic.
Double-click on the power level indicator to
switch between automatic power and manual
power.
Cycle through each of the layouts for both the
11
Acoustic and Charting views, and confirm that they
all display and draw correctly.
68
www.wassp.com
Doc. P/N: WSP-009-008
Version: V1.3
Issue Date: April 2014
Page 75

Operator Manual
THIS PAGE HAS BEEN LEFT INTENTIONALLY BLANK.
Doc. P/N: WSP-009-008
Version: V1.3
Issue Date: April 2014
www.wassp.com
69
Page 76

WMB-X230 Technical Specifications
Dimensions
BTxR: Height: 180 mm
Width: 221.5 mm
Length: 535 mm
160kHz
(WMB-3230)
Transducer:
Height: 94 ± 2 mm
Width: 164 ± 2 mm
Length: 327 ± 2 mm
80kHz
(WMB-5230)
Transducer:
Height: 130 ± 3 mm
Width: 336 ± 2 mm
Length: 527 ± 2 mm
WASSP Processor
Serial Ports: 4 - Motion / Position Sensors
Ethernet Ports: 2 - BTxR / Secondary Network
Displays: 1 or 2 - Owner supplied
Minimum Resolution: 1024x768
Recommended Resolution: 1920x1080
Inputs: USB Keyboard + Mouse / Trackball
Storage: SSD + HDD (System Dependent)
BTxR
Output power: 14 power settings from 40 W to 1.5 kW.
Ping rate: Automatic, determined by depth.
Frequency: 160 kHz (WMB-3230)
80kHz (WMB-5230)
Beam width: 112 beams at 1.07º over 120º port/
starboard swath, Transmit 4º fore/aft,
Receive 10º fore/aft.
Maximum depth:
Display
Display Range: 5 - 400m (WMB-3230)
5 - 800m (WMB-5230)
Display Modes: Sonar view
Single / Triple beam view
Sidescan view
2D Charting view
3D Charting view
Display Layouts: For both Acoustic and Charting:
Single screen
Vertical split screen
Horizontal split screen
3-screen
Advance speed: Slow – fast (5 speeds).
Interface
Inputs: TSS1, PSXN, PASHR, HDT, HDG,
Outputs: Olex
Recording: Realtime bathymetry mapping
Power Supply
BTxR:
WASSP Processor:
Environmental
Temperature:
Relative humidity:
Vibration:
Weight
BTxR: 10 kg
Transducer:
WMB-3230:
WMB-5230:
Processor: 5.7 kg
Equipment List
Standard:
Transducer:
BTxR
WASSP
Processor
Glands:
Options: See “APPENDIX B - Part Numbers”
VTG, RMC, GGA, GGL, ZDA, PFECGpatt, PFEC-Gphve.
Key Pulse
Sodena
MaxSea
Key Pulse
Raw Data
XYZ (ASCII)
24 V DC, 100 W.
6 - 30 V DC, ship’s supply.
0 to 40 ºC.
5 to 95% non condensing.
IEC 60945, protected equipment.
12 kg incl. 10m cable
39 kg incl. 20m cable
See “APPENDIX B - Part Numbers”
on page 67 of the Installation
Manual for a full list.
Mounting options for through hull or
pole mounted.
Options for alloy, steel or plastic.
on page 67 of the Installation
Manual for a full list.
Doc. P/N: WSP-009-008
Version: V1.3
Issue Date: April 2014
WASSP Ltd.
65 Gaunt Street
Westhaven
Auckland 1010
New ZealaNd
PO Box 5849
Auckland 1141
Specications subject to change without notice.
Phone: +64 9 373 5595
Fax: +64 9 379 5655
Email: wassp@wassp.com
WASSP Ltd. reserves the right to change this manual
without notice.
The information in this manual may not, in whole or in part, be
copied, reproduced, photocopied, translated, or reduced to
any electronic medium or machine readable form without the
prior written consent of WASSP Ltd.
COPYRIGHT © 2014 WASSP LTD.
www.wassp.com
ALL RIGHTS RESERVED.
 Loading...