

Page 1

WASSP CDX OPERATORS MANUAL
QUICKSTART GUIDE
Page 2

WASSP CDX OPERATORS MANUAL
WASSP CDX is control, visualisation, data management and data processing application for
use with the WASSP DRX ‘Black Box’ multibeam transceiver.
This manual provides the basic information to operate WASSP CDX.
CDX OPERATORS MANUALCDX OPERATORS MANUAL
CONTENTS
1 System Configuration ���������������������������������������������������������������������������������������������������������������5
1.1. System Overview 5
1.2. Installation 6
2 Application Overview �������������������������������������������������������������������������������������������������������������� 8
2.1. Quick Access Bar 9
DOCUMENT REVISION HISTORY
REVISION DATE REASON FOR CHANGE VERSION
March 2016 Compilation 1.0
April 2016 Update Tides 1.1
April 2016 Typos corrected 1.2
July 2016 Updates for V2 2.0
September 2016 Addition of 6.0 Tools and Utilities 3.0
November 2016 Update Appenndix PC Specs 3.1
January 2017 Feature updates for CDX V3 3.2
RELATED DOCUMENTS
» WASSP CDX Operators Manual – For the latest version of this manual go to wassp.com
» WASSP DRX Installation Manual – For the latest version of this manual go to
wassp.com
» WASSP DRX Utilities Operators Manual – Manual describing utility applications shipped
with WASSP DRX.
Further documentation, FAQs, updated specifications and WASSP CDX Operators manual
can be found at wassp.com
General Notices
3 System Set Up ������������������������������������������������������������������������������������������������������������������������� 10
3.1. Device setup 10
3.1.1. Wireless Server 11
3.2. DRX Processing Configuration 15
3.2.1. DRX Information 15
3.2.2. Sound Velocity 16
3.2.3. IMS Control 17
3.2.4. Filter Setup 18
3.2.5. Tides 24
3.3. UI Preferences 27
3.3.1. Languages 28
3.3.2. Depth 28
3.3.3. Speed 28
3.3.4. Position 29
3.3.5. Temperature 29
3.3.6. Long Distance 29
3.3.7. Short Distance 29
WASSP Ltd. reserves the right to change the contents of this manual and any system
specifications without notice.
Contact WASSP Ltd. regarding copying or reproducing this manual.
Support information
If you require maintenance or repair, contact your local dealer. You can also contact WASSP
Ltd. using the following address: http://wassp.com/contact-us/
If you need information about WASSP products, visit wassp.com.
On the website you will also find a list of WASSP dealers and distributors.
Warnings, Cautions, and Notes
Warnings, cautions, and notes are indicated by the following icons throughout this manual:
CAUTION indicates that if the instruction is not heeded, the action may result
in equipment damage or software corruption.
NOTE indicates a TIP or additional information that could be helpful while
performing a procedure.
3.3.8. Night Mode 29
3.3.9. Multi Display 30
3.3.10. Zoom Control 30
3.3.11. Nav Bar 30
3.4. Layout 31
4 Display Panel Settings ����������������������������������������������������������������������������������������������������������� 32
4.1. Sonar 32
4.1.1. Sonar Configuration Options 33
4.1.2. Sonar CSM 36
4.2. Sounder 37
4.2.1. Sounder Configuration Options 38
4.2.2. Sounder CSM 43
4.3. Chart 44
4.3.1. Charting Cartography 45
4.3.2. Chart Configuration Options 45
4.3.3. 2D Chart CSM 53
Page 2 of 66 Page 3 of 66Doc: CDX Operators Manual
wassp.com wassp.com
Version: 3.2 January 2017
Doc: CDX Operators Manual
Version: 3.2 January 2017
Page 3

CDX OPERATORS MANUALCDX OPERATORS MANUAL
4.3.4. 3D Chart CSM 54
4.3.5. Database 55
5 Tools ������������������������������������������������������������������������������������������������������������������������������������������ 59
5.1. Marks 59
5.2. Profile Tool 60
6 Tools and Utilities ������������������������������������������������������������������������������������������������������������������� 62
6.1. Data Manager 62
6.1.1. Data Manager Record 62
6.2. Data Manager Replay 64
7 Appendix ���������������������������������������������������������������������������������������������������������������������������������� 65
FIGURES
Figure 1. DRX Recommended System 5
Figure 2. Application Overview 8
Figure 3. Seafloor inaccuracies due to incorrect sound velocity 16
Figure 4. Sonar Gain and Dynamic Range Control & Clutter 34
1 SYSTEM CONFIGURATION
1�1� SYSTEM OVERVIEW
Details on WASSP system configuration can be seen in the DRX Installation Manual, with
a typical configuration shown below.
Satellite
Compass
GPS / Heading
USER PC
WASSP CDX
Data Manager
IMU
Roll / Pitch /
Heave
Figure 5. Sounder Gain and Dynamic Range Control & Clutter 39
Figure 6. Simplified Wireless Configuration 65
GLOSSARY
Term Description
CSM Content Sensitive Menu.
DHCP Dynamic Host Configuration Protocol, for automatically providing IP addresses.
DRX
GbE Gigabit Ethernet.
IMU Inertial Motion Unit/Motion Sensor, typically for roll, pitch and heave.
LAN Local Area Network.
Pan Refers to horizontal and vertical scrolling of the Display panel.
RTK GPS Real Time Kinematic GPS, used for high quality positioning.
Zoom Refers to changing the scale of the Display panel.
‘Black Box’ smart transceiver that interfaces to devices and sensors to make up the
WASSP sounder system.
WASSP
Transducer
Figure 1. DRX Recommended System
DC Power
9-32V DC
WASSP CDX is connected to DRX over gigabit Ethernet. The Ethernet link is used for all
communication between WASSP CDX running on PC or other devices and the DRX.
This link is used for control of the DRX and for the DRX to supply data for visualisation,
management and post processing to WASSP CDX.
DRX also serves DRX SETUP WEBPAGES for DRX configuration. This is described in the
DRX Installation manual.
The Ethernet connection can be connected either directly using crossover cable or auto
crossover (DRX supports auto MDI/MDI-X) OR via a network switch if supporting multiple
clients or running the DRX on vessel LAN (local area network).
If there is a DHCP server on the LAN the DRX will be assigned an appropriate IP address
by the DHCP server. If there is no DHCP server, the DRX will fall through to Zeroconfiguration assignment in block 169.254.0.0/16. Any connected device will need to
be assigned an appropriate IP address on the same subnet as the DRX, either via DHCP
server, Zero-configuration or fixed IP.
Page 4 of 66 Page 5 of 66Doc: CDX Operators Manual
wassp.com wassp.com
Version: 3.2 January 2017
The Data Manager application bundled with the WASSP CDX Install Package is used
for recording DRX data, exporting to various formats and data playback to supported
applications including WASSP CDX.
Doc: CDX Operators Manual
Version: 3.2 January 2017
Page 4

1�2� INSTALLATION
WASSP CDX can be installed on any device that meets the minimum spec described in
“Appendix A - PC” on page 65.
1. From WINDOWS START run WASSP CDX SETUP
CDX OPERATORS MANUALCDX OPERATORS MANUAL
Select FINISH
Select NEXT
Select INSTALL
2. You may now run the WASSP CDX Application.
WASSP CDX installer will also install various utilities including:
Page 6 of 66 Page 7 of 66Doc: CDX Operators Manual
wassp.com wassp.com
Version: 3.2 January 2017
» Data Manager; For data record, export and playback
» Patch Test; For automated Patch Test to calculate roll oset
» Location Server; For own-vessel navigation data in wireless mode
» Find My DRX; For identifying DRXs on the network
Doc: CDX Operators Manual
Version: 3.2 January 2017
Page 5

CDX OPERATORS MANUALCDX OPERATORS MANUAL
2 APPLICATION OVERVIEW
1
1A
1B
1C
4
2
4
5
6
INFORMATION
DISPLAY
CONTROL
TOOLS
TOOL BARS
NOTE: CDX will expose functionality that is available to the user. All
functionality described in the manual may not be available depending on DRX
model and feature licensing.
Disabled controls indicate that the data may be enabled through upgrade or
feature licensing.
Optional Display Panel information overlay enabled from
CSMs. Information Display Panels can be selected and
dragged to any position within the Display Panel.
Optional Display Panel control overlay enabled from CSMs.
Optional general data display tools enabled from CSMs.
Figure 2. Application Overview
1
2
HOME BAR
DISPLAY
PANELS
3
Provides configuration options for the Display
Panels, Layout, Tools, System Setup and User
Preferences. The HOME bar is accessed
through the HOME button.
1A: Quick Access Bar:
See “2.1. Quick Access Bar” on page 9.
1B: Display Panel Setup:
See “4 Display Panel Settings” on page 32.
1C: Configuration of CDX (UI PREFERENCES), DRX (DRX
PROCESSING) and system setup (DEVICE SETUP). See “3
System Set Up” on page 10.
Display panels are associated with specific data types for
visualisation and control. Typical examples are Charting for
bathymetric display and Sonar for multibeam swath data.
Display panels available will depend on data available to
CDX. Display panels are configured in LAYOUTS, 1A
5 6
2�1� QUICK ACCESS BAR
The QUICK ACCESS BAR is used to access top level options.
DAY / NIGHT button. Used for display brightness
configured in layout, 1A. See “3.3.8. Night Mode”
on page 29 for full control.
LAYOUTS button see “3.4. Layout” on page 31
for Display Panel selection.
TRANSMIT button. DRX control to transmit. Ping
rate will be determined by selected range.
CONTEXT
3
Page 8 of 66 Page 9 of 66Doc: CDX Operators Manual
SENSITIVE
MENU (CSM)
Set up and configuration of the specific Display Panels
accessed through right-click on any panel.
wassp.com wassp.com
Version: 3.2 January 2017
Doc: CDX Operators Manual
Version: 3.2 January 2017
Page 6

CDX OPERATORS MANUALCDX OPERATORS MANUAL
3 SYSTEM SET UP
3�1� DEVICE SETUP
For full details on network configuration see DRX Installation Manual.
1. After installing the WASSP CDX on your PC, start the DRX and run WASSP CDX.
2. WASSP CDX will automatically select the DRX as long as the network has been
correctly configured.
3. To manually select the DRX you wish
to connect to:
From the HOME bar, under
CONFIGURATION select DEVICE
SETUP.
NOTE: Other WASSP data servers such as Data Manager can also be
selected as a DRX Server.
For information on recording and playing back data files see “6 Tools and Utilities” on
page 62.
3�1�1� Wireless Server
WASSP CDX can be configured to be used in a wireless configuration for remote
mapping being transmitted from a TENDER to the PRIMARY vessel. The mapping data
from the TENDER will be transmitted to the PRIMARY vessel Real Time as well as o-line
when the TENDER goes out of wireless range for a period of time.
A typical wireless configuration can be seen in “Appendix B - Simplified Wireless
Configuration” on page 65.
Setting up CDX for wireless connectivity consists of:
» Setting up the TENDER vessel
» Configuring PRIMARY vessel for receiving own vessel navigation data
» Setting up the PRIMARY vessel
4. The DEVICE SETUP page displays the
current (or previous) connection.
Press the CHANGE button and
a drop-down list of available
connections will be displayed.
5. Select your desired connection.
Setting up the ‘Tender’ vessel
1. Open %APPDATA%/WASSP/G3/UI file location.
2. Create a text file and name it wirelessip
3. In the TENDER wirelessip text file enter the IP address of the PRIMARY WASSP CDX
installation.
4. Open WASSP CDX on the Tender
computer.
From the HOME bar, under
CONFIGURATION select DEVICE
SETUP.
5. Under WIRELESS SERVER enable
WIRELESS.
6. The connection indicator will display the following depending on the current status
of the connection:
» GREEN: Connected
» AMBER: Connection is being changed
» RED: No Connection
Page 10 of 66 Page 11 of 66Doc: CDX Operators Manual
wassp.com wassp.com
Version: 3.2 January 2017
Doc: CDX Operators Manual
Version: 3.2 January 2017
Page 7

CDX OPERATORS MANUALCDX OPERATORS MANUAL
6. Set MODE to TENDER.
Configuring the ‘Primary’ Vessel for receiving own vessel navigation data
The LOCATION SERVER enables WASSP CDX to display own vessel position and heading.
1. From WINDOWS START
launch LOCATION SERVER.
3. Set the BAUDRATE.
4. Select START SERVER to start
the server.
2. Set COMPORTSTR to the
comport that is used for the
Primary’s heading and location
port.
Setting up the ‘Primary’ vessel
1. Open %APPDATA%/WASSP/G3/UI file location.
2. Create a text file and name it wirelessip
3. In the PRIMARY wirelessip text file enter the IP address of the TENDER WASSP CDX
installation.
Page 12 of 66 Page 13 of 66Doc: CDX Operators Manual
wassp.com wassp.com
Version: 3.2 January 2017
Doc: CDX Operators Manual
Version: 3.2 January 2017
Page 8

CDX OPERATORS MANUALCDX OPERATORS MANUAL
4. Open WASSP CDX on the Primary
computer.
From the HOME BAR, under
CONFIGURATION select DEVICE
SETUP.
5. Under WIRELESS SERVER enable
WIRELESS.
6. Set MODE to PRIMARY.
3�2� DRX PROCESSING CONFIGURATION
3�2�1� DRX Information
The DRX PROCESSING menu is used for monitoring DRX status and configuring DRX
specific processing and control options.
From the HOME bar, under
CONFIGURATION select DRX
PROCESSING.
7. In the LOCATION SERVER section
the running location server will be
automatically selected.
If there is more than one location
server on the network, the CHANGE
button allows selection of the
appropriate Location Server.
DRX information displays general status
information. This information is specific
to the DRX or data server that CDX is
connected to.
Page 14 of 66 Page 15 of 66Doc: CDX Operators Manual
wassp.com wassp.com
Version: 3.2 January 2017
Doc: CDX Operators Manual
Version: 3.2 January 2017
Page 9

CDX OPERATORS MANUALCDX OPERATORS MANUAL
Sound Velocity
set too low
Sound Velocity
set too high
Actual Sea Floor
3�2�2� Sound Velocity
Sound velocity input is required to compensate for range inaccuracies caused by sound
speed variations. These changes can occur both seasonally and with geographical areas
especially in coastal areas where sound velocity will be impacted by both temperature
and water salinity dierences.
Sound velocity in water is aected by both temperature and salinity and can either be
measured directly or derived from temperature and salinity. This value should be adjusted
regularly, depending on the operating environment, as it will have a direct impact on
mapping accuracy.
The sound velocity control allows for both direct and derived values. Sound velocity
compensation can be calculated using appropriate sound velocity, sound velocity profile
or temperature and salinity sensors. The more accurate the sound velocity the more
accurate the mapping.
The visual eect of incorrect sound velocity is that a flat seafloor will either curve up or
curve down. This representation will indicate soundings that are too shallow or too deep
with the aect being accentuated toward the edges of the swath.
Sound velocity measurements can be manually reckoned using the sonar display, see
“4.1. Sonar” on page 32 or the profile tool, accessed through the Chart CSM, see
“4.3.3. 2D Chart CSM” on page 53. To do this:
» Known flat sea floor should be run over
» If the sea floor appears to be curving upwards at the edges (smile), the sound
velocity value should be increased
» If the sea floor appears to be curving downwards at the edges (frown), the sound
velocity value should be decreased
MANUAL SOUND VELOCITY; used if sound
velocity is known.
MANUAL WATER SALINITY AND
TEMPERATURE; if temperature and salinity
are known, these will be used to derive
sound velocity in DRX.
MANUAL WATER SALINITY; can be used
if DRX has a temperature input and the
manual salinity will be used to derive sound
velocity.
NOTE: The default value for the salinity of sea water is 35ppt. This value
should not be changed unless the actual salinity of the surrounding water is
known. If in fresh water, the value should be set to 1.
NOTE: Temperature input into DRX may be direct from transducers with
temperature sensors built in or from external temperature sensor.
EXTERNAL SOUND SPEED SENSOR; used if an external sound speed sensor is
connected directly to the DRX. Refer to DRX installation manual for configuring sensors
connected to the DRX.
Figure 3. Seafloor inaccuracies due to incorrect sound velocity
Click on the drop down menu and select
the option you wish to tune: MANUAL
SOUND VELOCITY; MANUAL WATER
SALINITY AND TEMPERATURE; MANUAL
WATER SALINITY or EXTERNAL SOUND
SPEED SENSOR.
Page 16 of 66 Page 17 of 66Doc: CDX Operators Manual
wassp.com wassp.com
Version: 3.2 January 2017
3�2�3� IMS Control
IMS CONTROL is used for managing interfering acoustic equipment.
Manual mode allows basic control of
operating center frequency and can be
used to manually adjust frequency to avoid
acoustic equipment operating in the same
frequency band as DRX.
Doc: CDX Operators Manual
Version: 3.2 January 2017
Page 10

CDX OPERATORS MANUALCDX OPERATORS MANUAL
3�2�4� Filter Setup
DRX FILTERS allow adjustment of signal processing filters to optimise the data and display
when operating in an environment with noise, clutter and other interference impacting
the data quality.
These filters are split into ACOUSTIC DISPLAY for filters impacting sonar and sounder
displays and SEAFLOOR for filters impacting Bathymetry on charting displays.
1. From the HOME bar, under
CONFIGURATION select DRX
PROCESSING.
2. Select FILTERS.
3. ACOUSTIC DISPLAY: ECHO
AVERAGING
Applies to Sonar and Sounder data.
Purpose;
Reduction of clutter and false targets.
Rejects small targets or fast changing data
accentuating slow moving targets.
Disadvantage;
» Small targets will be lost
» Display is out of calibration for target
strength
Example; OFF
Example; LOW
Example; MEDIUM
Example; HIGH
Page 18 of 66 Page 19 of 66Doc: CDX Operators Manual
wassp.com wassp.com
Version: 3.2 January 2017
Doc: CDX Operators Manual
Version: 3.2 January 2017
Page 11

CDX OPERATORS MANUALCDX OPERATORS MANUAL
4. ACOUSTIC DISPLAY:
SNR THRESHOLD
Applies to Sonar and Sounder data. SNR
Threshold is a threshold control to remove
return signals below a specified level.
Purpose;
To clean the display of speckle by
removing data below the specified
threshold level. Allows stronger targets to
be more easily identified.
Disadvantages;
» Removes targets dependent on threshold set
» Threshold is relative to noise level so targets may be lost with increased depth
Example; -6dB
5. SEAFLOOR: NOISE FILTER
Applies to Bathymetry charting data.
Purpose;
To remove single ping tracking errors
through averaging.
Disadvantages;
» Small objects on a changeable
seafloor may be missed
» Objects during high mapping speeds
may be missed
Example; OFF
Example; +6dB
Example; +16dB
Example; +30dB
Example; ON
Page 20 of 66 Page 21 of 66Doc: CDX Operators Manual
wassp.com wassp.com
Version: 3.2 January 2017
Doc: CDX Operators Manual
Version: 3.2 January 2017
Page 12

CDX OPERATORS MANUALCDX OPERATORS MANUAL
6. SEAFLOOR: TRACKING
Applies to Bathymetry charting data.
Purpose;
To prevent seafloor tracking artifacts such
as fish schools and interfering sources
such as sounders.
Disadvantages;
» A very changeable seafloor may not
be tracked eectively
» Tracking while traveling at higher
speeds may be compromised
Example; OFF
Disadvantages;
» Good seafloor data may not be tracked
» Seafloor line on the Sonar display will be interrupted when aeration is detected
» Bathymetry will have gaps or be smoothed when aeration is identified
Example; OFF
Example; HIGH
7. SEAFLOOR: AERATION
Applies to Bathymetry charting data.
Aeration will occur due to air bubbles
across the transducer face. This will occur
due to poor transducer installation, but
also due to sea conditions, vessel speed,
vessel traveling astern etc. This can aect
the entire swath or smaller areas.
Example; LOW
Example; MEDIUM
Example; HIGH
Purpose;
To prevent aeration and other anomalies
causing discontinuity in return signal
strength from introducing poor seafloor
tracking.
Page 22 of 66 Page 23 of 66Doc: CDX Operators Manual
wassp.com wassp.com
Version: 3.2 January 2017
Doc: CDX Operators Manual
Version: 3.2 January 2017
Page 13
CDX OPERATORS MANUALCDX OPERATORS MANUAL
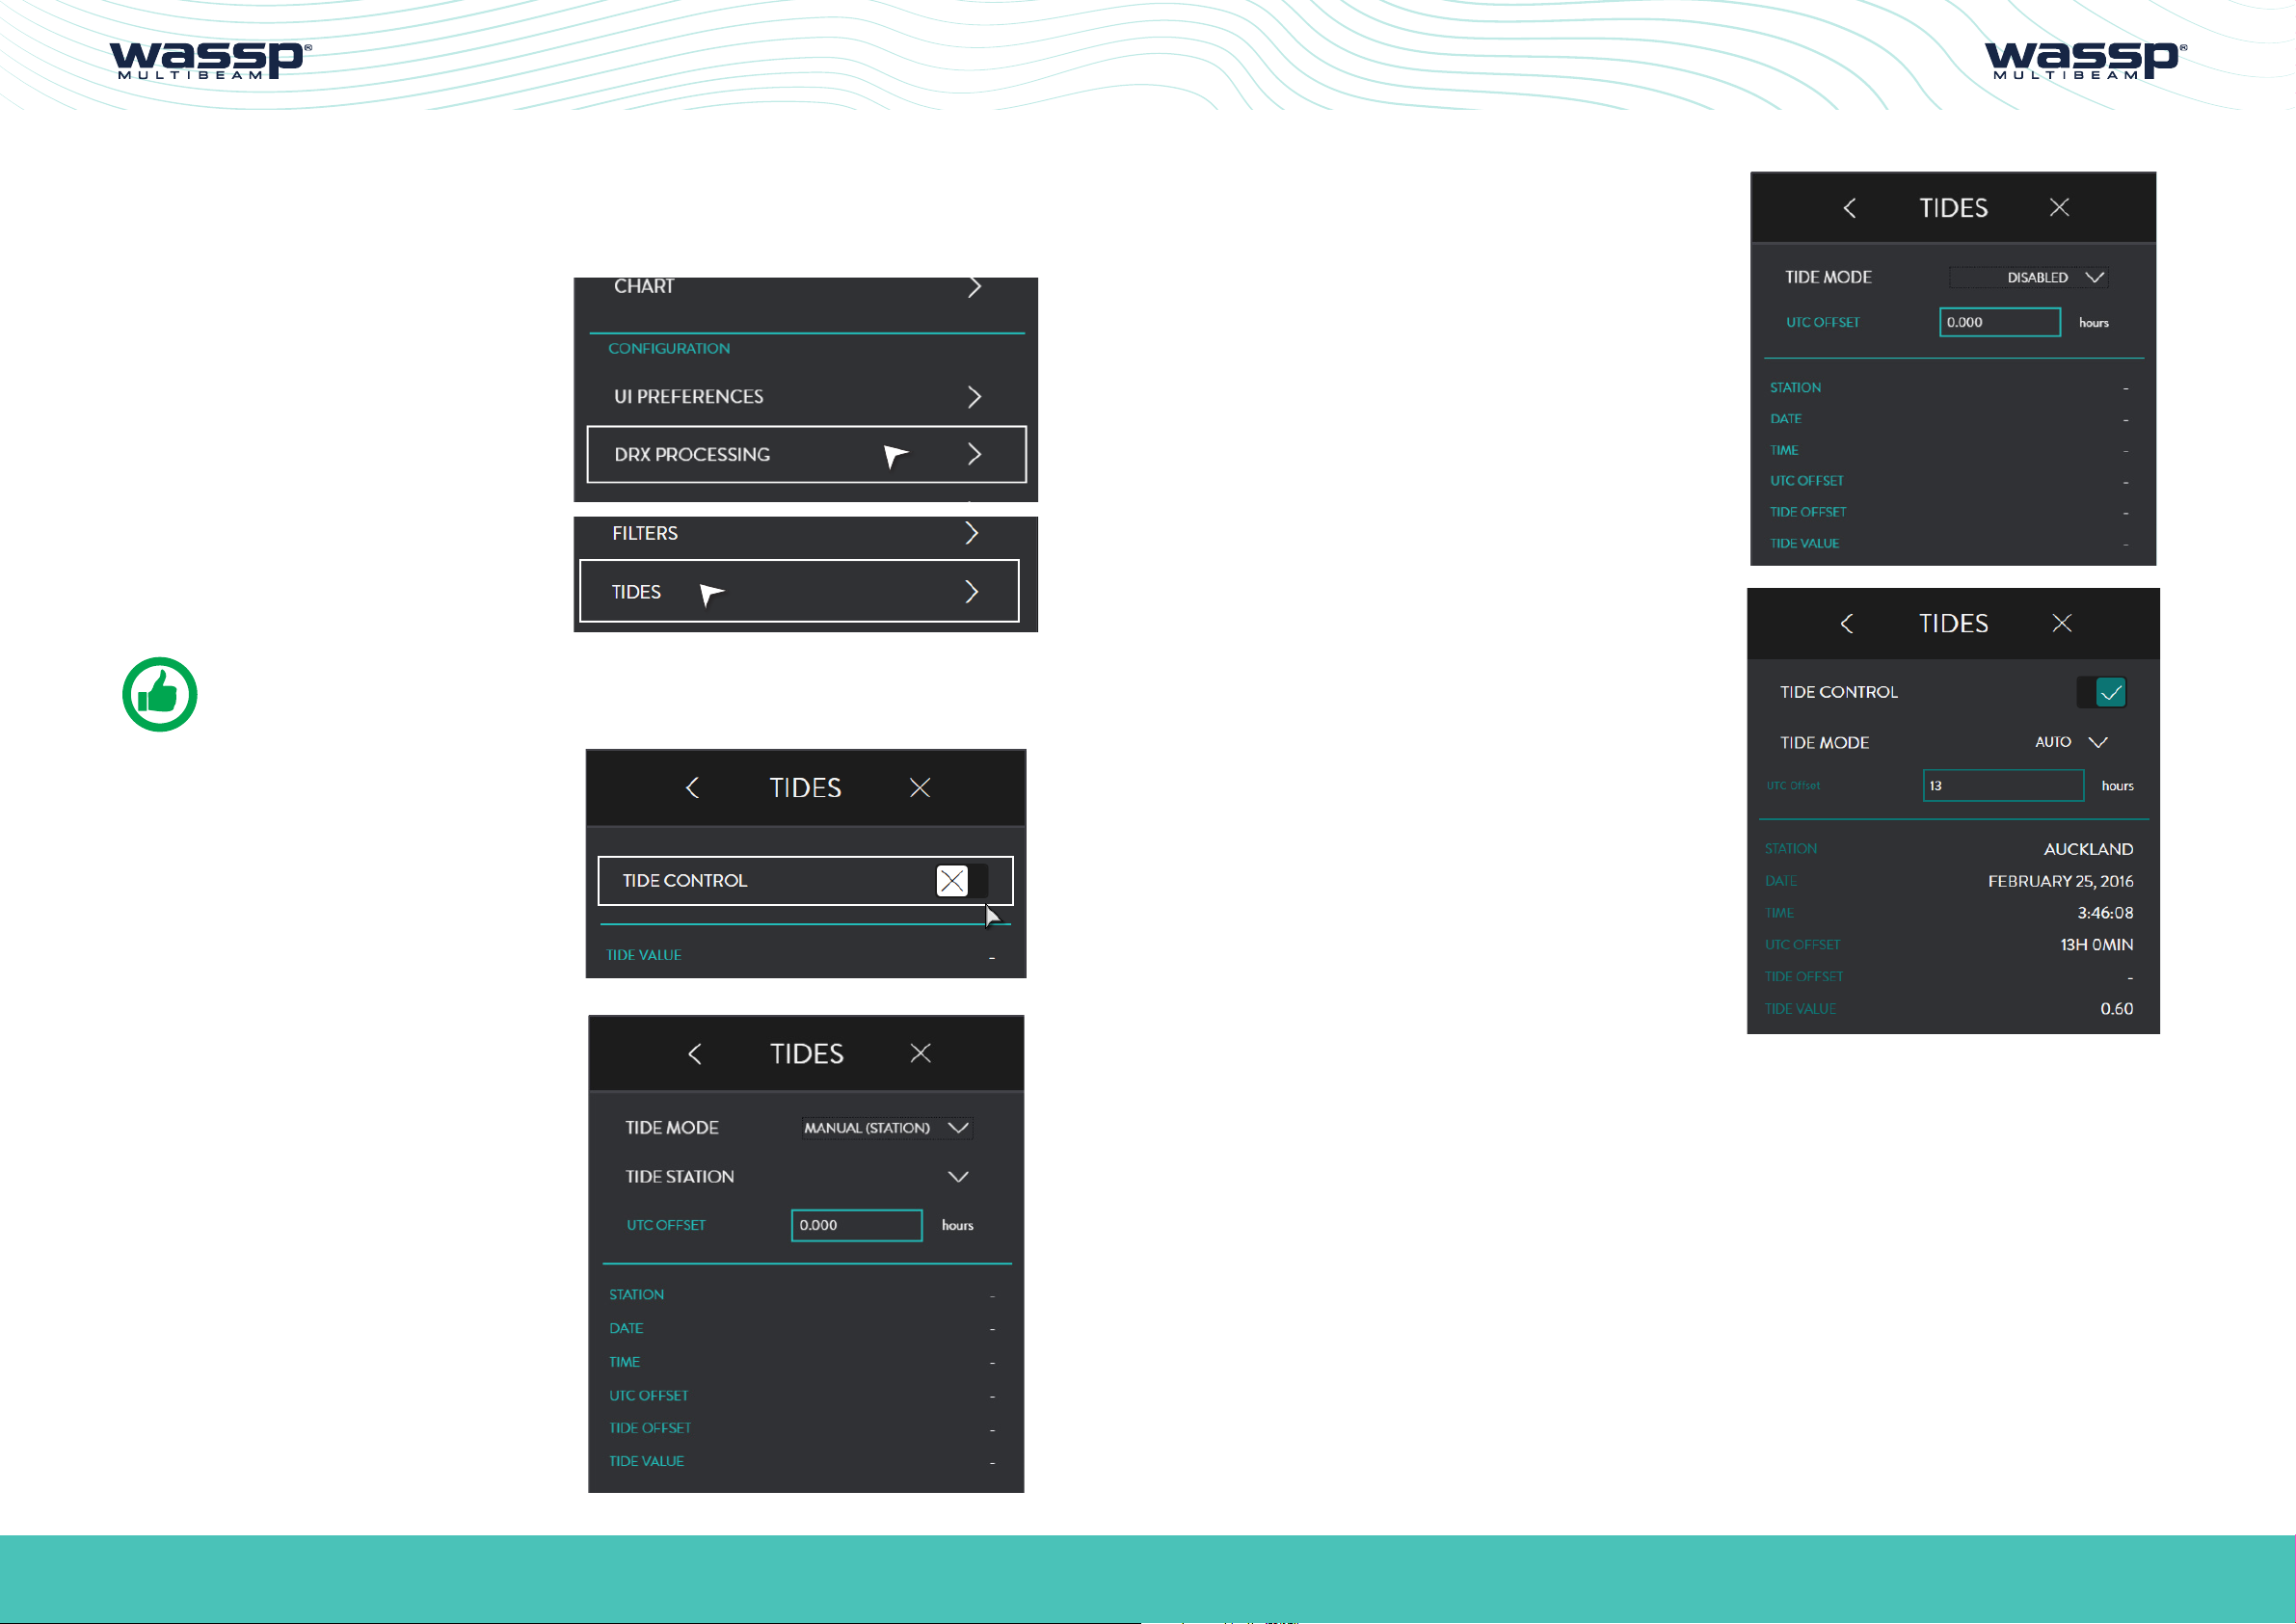
3�2�5� Tides
Tidal height oset can be configured to be applied as a depth correction in the DRX. This
will depend on the tide option set in the TIDES menu.
1. From the HOME bar, under
CONFIGURATION select DRX
PROCESSING.
2. Select TIDES
NOTE: TIDE MODE AUTO and MANUAL (STATION) require appropriate
cartography containing tidal station information.
3�2�5�3� Tide Mode Disabled
No tidal oset will be applied as a
correction to seafloor data in the DRX.
3�2�5�4� Tide Mode Auto
Tidal oset will be selected based on
local tide station using time and position
data. The value will be applied to the DRX
periodically.
When TIDE CONTROL is disabled DRX tidal
data is not updated by CDX. On initially
setting TIDE CONTROL to OFF the DRX
tide value will be set to zero.
When TIDE CONTROL is enabled CDX will
set the DRX tidal level as per the options
below.
TIDE MODE will provide you with the
following options: DISABLED, AUTO,
MANUAL (STATION) or MANUAL (OFFSET).
UTC OFFSET is used to correct UTC time
to local time. The Oset should include any
daylight savings.
UTC OFFSET should entered to apply
correct local time for the tide station.
Page 24 of 66 Page 25 of 66Doc: CDX Operators Manual
wassp.com wassp.com
Version: 3.2 January 2017
Doc: CDX Operators Manual
Version: 3.2 January 2017
Page 14

CDX OPERATORS MANUALCDX OPERATORS MANUAL
3�2�5�5� Tide Mode Manual (Station)
Tidal oset will be applied based on a
manually selected tide station. The value
will be applied to the DRX periodically.
UTC OFFSET should entered to apply
correct local time for the tide station.
3�2�5�6� Tide Mode Manual (Oset)
3�3� UI PREFERENCES
This provides WASSP CDX user preference
options.
From the HOME bar, under
CONFIGURATION select UI PREFERENCES.
This provides the following unit preference
options:
The manually set tidal oset will be applied
to the DRX.
NOTE: TIDE VALUE will give the tide value currently being applied to the
DRX.
NOTE: If UTC OFFSET for local time is incorrect, this will result in incorrect
tidal height being calculated.
Page 26 of 66 Page 27 of 66Doc: CDX Operators Manual
wassp.com wassp.com
Version: 3.2 January 2017
Doc: CDX Operators Manual
Version: 3.2 January 2017
Page 15

CDX OPERATORS MANUALCDX OPERATORS MANUAL
3�3�1� Languages
This provides language options.
Hit APPLY for the language to be applied.
3�3�2� Depth
This will provide depth options in METERS,
FATHOMS or FEET.
3�3�4� Position
This will provide position options in
DECIMAL DEGREES; DECIMAL DEGREES
(SIGNED); DEGREES, DECIMAL MINUTES
or DEGREES, MINUTES, SECONDS.
3�3�5� Temperature
This will provide temperature options in
CELSIUS or FAHRENHEIT.
3�3�6� Long Distance
This will provide distant options in
NAUTICAL MILES, KILOMETERS, METERS
or FEET.
3�3�3� Speed
This will provide speed options in KNOTS,
MILES PER HOUR, KILOMETERS PER HOUR
or METERS PER SECOND.
3�3�7� Short Distance
This will provide distant options in METERS
or FEET.
3�3�8� Night Mode
Tick the check box to enable NIGHT
MODE.
Use the slider control to adjust brightness
level.
NOTE: Switching Night Mode on and o is available from the Home Menu
Quick Access Bar.
Page 28 of 66 Page 29 of 66Doc: CDX Operators Manual
wassp.com wassp.com
Version: 3.2 January 2017
Doc: CDX Operators Manual
Version: 3.2 January 2017
Page 16

CDX OPERATORS MANUALCDX OPERATORS MANUAL
3�3�9� Multi Display
Enable this check box when using dual
displays.
Below is an example of the Layout Option
when Multidisplay is not enabled (see “3.4.
Layout” on page 31).
3�3�10� Zoom Control
Below is an example of the Layout Option
when Multidisplay is enabled (see “3.4.
Layout” on page 31).
3�4� LAYOUT
Panel layout can be configured using the LAYOUT section of the HOME bar.
From the HOME bar, select LAYOUTS.
SCREEN 1 Allows layout selection options
for a single display configuration. Layout
selection will depend on the features
enabled.
SCREEN2 Allows layout selection options
for a dual display configuration. Layout
selection will depend on the features
enabled.
Tick the check box to enable the display ZOOM control. The zoom
control tool will appear at the top right of the active panel and applies to
this active panel.
NOTE: The active Display Panel is the panel that is currently selected. To
switch active panel, click in the panel.
3�3�11� Nav Bar
The Nav Bar, when active, will appear docked to the side of the display. The Nav Bar
shows general vessel information.
PRESETS allows preconfigured layouts
available to be selected.
Page 30 of 66 Page 31 of 66Doc: CDX Operators Manual
wassp.com wassp.com
Version: 3.2 January 2017
Doc: CDX Operators Manual
Version: 3.2 January 2017
Page 17
CDX OPERATORS MANUALCDX OPERATORS MANUAL
4 DISPLAY PANEL SETTINGS
Display Panels are configured through the CSMs and/or DISPLAY SETTINGS
configuration controls.
Typically the CSMs cover the most commonly accessed items but will also allow direct
access to the HOME bar through the DISPLAY SETTINGS option on the CSM.
NOTE: All Display Panel configuration options are accessible through the
CSM and the CSM SETTINGS option.
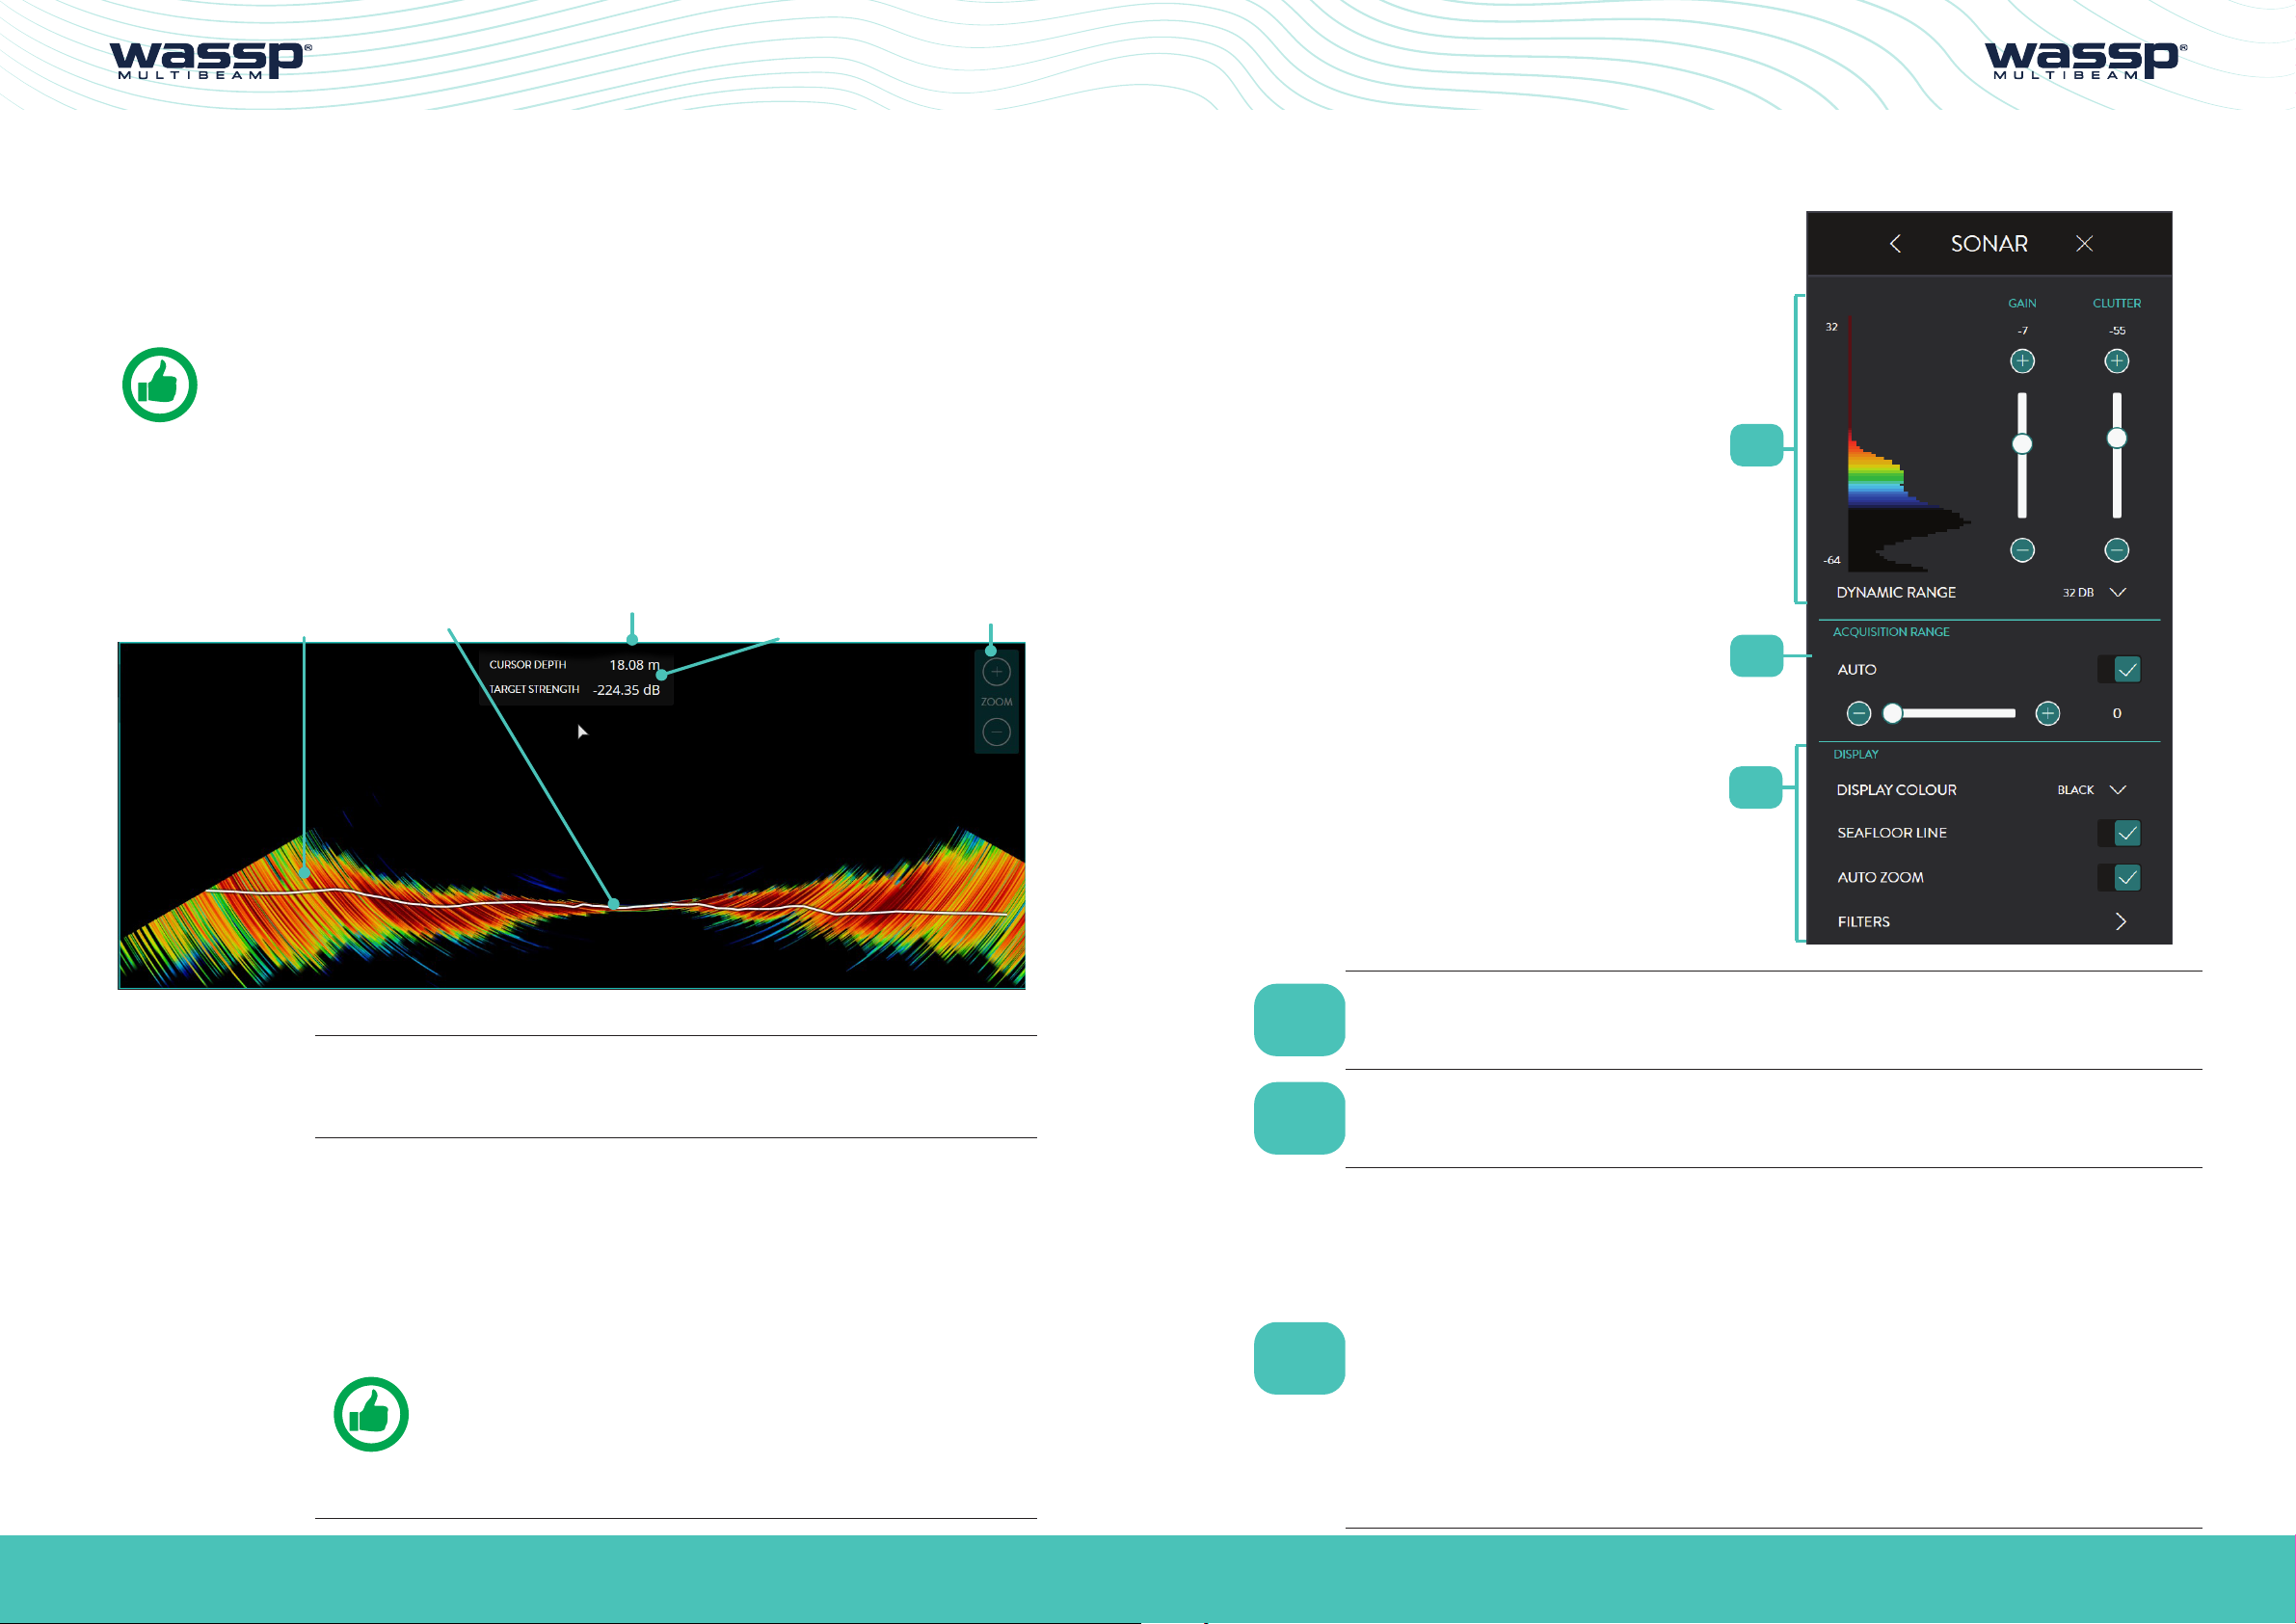
4�1� SONAR
The Sonar Display Panel shows the water column and seafloor profile below the
transducer.
Transducer PositionSeafloor LineRaw Sonar
Data
Information
display
Zoom Tool
4�1�1� Sonar Configuration Options
From the HOME bar, under DISPLAY
SETTINGS select SONAR when there is
a Sonar Display Panel. This provides the
following options:
1
2
Port Starboard
Supplies following information at the cursor:
INFORMATION
DISPLAY
ZOOM &
PAN CONTROL
» Depth
» Target Strength
The sonar panel can be zoomed in and out.
AUTO ZOOM allows the display to be auto zoomed to optimum
depth to show the seafloor and water column. AUTO ZOOM can
be enabled from the CSM. See “4.1.1.3. Display” on page 35.
Manual zoom of displayed depth and range can be controlled using
the mouse wheel or ZOOM tool. See “3.3.10. Zoom Control” on
page 30 and select the + and – controls as required.
NOTE - Touch control for zoom is available.
The Sonar panel can be panned in depth and Port/Starboard. To
pan left-click the cursor and drag.
1
2
3
GAIN
ACQUISITION
RANGE
DISPLAY
3
GAIN, CLUTTER, DYNAMIC RANGE and DISPLAY COLOUR are
used to optimise the sonar display to the user preference.
See “4.1.1.1. Gain” on page 34.
DRX control for setting ping / transmit range for the system. See
“4.1.1.2. Acquisition Range” on page 35.
Controls for display settings. See “4.1.1.3. Display” on page
35.
DISPLAY COLOUR allows colour palette selection.
SEAFLOOR LINE allows seafloor line to be overlaid on the sonar
data.
AUTO ZOOM allows the display to be auto zoomed to fit the
Display Panel or user controlled display zoom.
FILTERS allows adjustment of signal processing filters to
optimise the data and display when operating in an environment
with noise, clutter and other interference impacting the data
quality. See “3.2.4. Filter Setup” on page 18.
Page 32 of 66 Page 33 of 66Doc: CDX Operators Manual
wassp.com wassp.com
Version: 3.2 January 2017
Doc: CDX Operators Manual
Version: 3.2 January 2017
Page 18

CDX OPERATORS MANUALCDX OPERATORS MANUAL
4�1�1�1� Gain
GAIN, CLUTTER, DYNAMIC RANGE and DISPLAY COLOUR are used to optimise the
sonar display to the user preference. This is done by selecting the dynamic range to
display, the colour scale used across the displayed dynamic range, the gain level to view
within the available dynamic range and the clutter to suppress colours.
Gain Control
Display
Colour Scale
Full
Dynamic
Range
Display
Dynamic
Range
Display Clutter
Threshold
Dynamic Range
The display dynamic range can be adjusted
by selecting from the available options.
4�1�1�2� Acquisition Range
DRX control for setting ping / transmit
range. Range can be adjusted manually
using the scroll bar or automatically by
selecting AUTO RANGE. AUTO RANGE
will determine optimum range based on
seafloor depth.
4�1�1�3� Display
DISPLAY COLOUR will provide the option
to use various colour scales for the display.
Figure 4. Sonar Gain and Dynamic Range Control & Clutter
Gain
The gain level can be adjusted using the
slider bar.
The histogram display alongside this slider
indicates the spread of target strength
returns.
Clutter
Low level noise and clutter from sediments,
system noise etc can appear on the screen
as dots. These can be suppressed using the
clutter control.
Clutter control will blank out any returns
below the specified return strength on
the slider. Suppressed returns will appear
as black on the histogram and will not be
displayed in the panel.
SEAFLOOR LINE displays the seafloor line
when enabled.
AUTO ZOOM allows the display to be auto
zoomed to optimum depth to show the
seafloor and water column.
FILTERS allows adjustment of signal
processing filters to optimise the data and
display when operating in an environment
with noise, clutter and other interference
impacting the data quality.
See “3.2.4. Filter Setup” on page 18
Page 34 of 66 Page 35 of 66Doc: CDX Operators Manual
wassp.com wassp.com
Version: 3.2 January 2017
Doc: CDX Operators Manual
Version: 3.2 January 2017
Page 19

CDX OPERATORS MANUALCDX OPERATORS MANUAL
4�1�2� Sonar CSM
Accessed by right-clicking in the Sonar
Display Panel.
SEAFLOOR LINE Allows seafloor line to be overlaid on the sonar data.
AUTO ZOOM
Allows the display to be auto zoomed to fit the Display Panel or
user controlled display zoom.
4�2� SOUNDER
The Sounder Display Panel shows the traditional sounder echogram display for each of
the active beams selected.
The display may show single beam, triple beam or quint beam modes in the Display
Panel. Below shows the typical triple beam display.
Information
Display
Grid Overlay
Current
Ping Data
Exit History
Zoom Tool
CURSOR INFO Displays the Information display as an overlay on the Display Panel.
SHOW BEAMS Shows the Sounder beams overlaid on the Sonar panel. See “4.2.1.3.
Beam Setup” on page 41.
SETTINGS
This option will display the SONAR Menu. See “4.1. Sonar” on page
32.
Current Depth Echogram History Data
INFORMATION
DISPLAY
ZOOM &
PAN CONTROL
Range Scale
Supplies following information at the cursor:
» Position and depth
» Beam details
» Target Strength
The sounder panel can be zoomed in and out.
AUTO ZOOM allows the display to be auto zoomed to optimum
depth to show the seafloor and water column. AUTO ZOOM can
be enabled from the CSM. See “4.2.1.2. Display” on page 40.
Manual zoom of displayed depth and range can be controlled using
the mouse wheel or ZOOM tool. See “3.3.10. Zoom Control” on
page 30 and select the + and – controls as required.
NOTE: Touch control for zoom is available.
The Sounder panel can be panned to view history:
Page 36 of 66 Page 37 of 66Doc: CDX Operators Manual
wassp.com wassp.com
Version: 3.2 January 2017
» Left-click cursor and drag to see history in pan mode
» On pan the EXIT HISTORY control will appear
» To exit pan mode click on EXIT HISTORY
The Sounder panel can be panned in depth. To pan in depth, leftclick cursor and drag.
Doc: CDX Operators Manual
Version: 3.2 January 2017
Page 20

CDX OPERATORS MANUALCDX OPERATORS MANUAL
4�2�1� Sounder Configuration Options
From the HOME bar, select
SOUNDER when there is a
Sounder Display Panel.
This provides the following
options:
1
2
3
4
5
DISPLAY
BEAM SETUP
FILTERS
Controls for display settings. See “4.2.1.2. Display” on page
40.
DISPLAY COLOUR allows colour palette selection.
SEAFLOOR LINE allows seafloor line to be overlaid on the
sonar data.
AUTO ZOOM allows the display to be auto zoomed to fit the
Display Panel or user controlled display zoom.
GRID OVERLAY overlays a grid on the Echogram display.
ADVANCE option allows for advancing the Echogram scroll at
the required rate.
Allows independent configuration of each sounder beam. See
“4.2.1.3. Beam Setup” on page 41.
Allows adjustment of signal processing filters to optimise
the data and display when operating in an environment with
noise, clutter and other interference impacting the data
quality. See “3.2.4. Filter Setup” on page 18.
1
2
GAIN
ACQUISITION
RANGE
3
4
5
GAIN and DYNAMIC RANGE and DISPLAY COLOUR are used
to optimise the Sounder display to the user preference.
See “4.2.1.1. Gain” on page 39.
DRX control for setting ping / transmit range for the system.
See “4.1.1.2. Acquisition Range” on page 35.
4�2�1�1� Gain
GAIN, CLUTTER, DYNAMIC RANGE and DISPLAY COLOUR are used to optimise the
sounder display to the user preference. This is done by selecting the dynamic range to
display, the colour scale used across the displayed dynamic range, the gain level to view
within the available dynamic range and the clutter to suppress colours.
Gain Control
Display
Colour Scale
Full
Dynamic
Range
Display
Dynamic
Range
Display Clutter
Threshold
Page 38 of 66 Page 39 of 66Doc: CDX Operators Manual
wassp.com wassp.com
Version: 3.2 January 2017
Figure 5. Sounder Gain and Dynamic Range Control & Clutter
Doc: CDX Operators Manual
Version: 3.2 January 2017
Page 21

CDX OPERATORS MANUALCDX OPERATORS MANUAL
Gain
The gain level can be adjusted using the
slider bar.
Clutter
Clutter control will blank out any returns
below the specified return strength on
the slider. Suppressed returns will not be
displayed in the panel.
Dynamic Range
The display dynamic range can be adjusted
by selecting from the available options.
ADVANCE option allows for advancing the
Echogram scroll at the required rate.
4�2�1�3� Beam Setup
BEAM SETUP allows independent
configuration of each sounder beam.
The sounder beams are equivalent to a
set of independent single beam sounders
which can be used at any angle across the
multibeam swath. This can be depicted on
the sonar view.
4�2�1�2� Display
DISPLAY COLOUR will provide the option
to use various colour scales for the display.
SEAFLOOR LINE displays the seafloor line
when enabled.
AUTO ZOOM allows the display to be auto
zoomed to optimum depth to show the
seafloor and water column.
GRID OVERLAY overlays a grid on the
Echogram display.
The BEAM SETUP is used to display 1,
SINGLE BEAM, 3, TRIPLE BEAM, or 5
QUINT BEAM, beams in the sounder
Display Panel.
SINGLE BEAM will just display beam B3
TRIPLE BEAM will display beams B2, B3
and B4
QUINT BEAM will display beams B1, B2,
B3, B4 and B5
Individual beam configuration is carried out through the beam selection. Each beam can
be configured independently if default operations need to be changed.
Page 40 of 66 Page 41 of 66Doc: CDX Operators Manual
wassp.com wassp.com
Version: 3.2 January 2017
Doc: CDX Operators Manual
Version: 3.2 January 2017
Page 22

CDX OPERATORS MANUALCDX OPERATORS MANUAL
SCALING MODE The sounder beams’ scale
can either be set to range scale or depth
scale.
If depth scale is selected the data will
adjusted to compensate for the beam angle
to represent depth below transducer.
1. Select the beam to configure from
the BEAM NUM options.
The option to the right shows BEAM 3
selected (Beam 3 is typically the Nadir
beam).
2. For the selected beam set the angle
o of Nadir from the BEAM ANGLE
options.
4�2�2� Sounder CSM
Accessed by right-clicking in the Sounder
Display Panel.
Allows selection of an individual beam. Control is available when
BEAM NUM
SOUNDER MODE is SINGLE BEAM and allows any beam to be
selected for display.
NOTE: 0o is Nadir, P is angle Port side of
Nadir, S is Starboard side of Nadir
3. For the selected beam set the width
from the BEAM WIDTH options.
AUTO ZOOM
Allows the display to be auto zoomed to fit the Display Panel or
user controlled display zoom.
CURSOR INFO Displays the Information display as an overlay on the Display Panel.
BOTTOM LOCK mode displays the bottom as a straight line, no
matter how the bottom contour may change.
BOTTOM LOCK
Fish and other water column targets are relative to this flat bottom
line.
Places a mark at the cursor position. To modify or delete this mark,
right-click on the symbol and a sub menu will appear.
DROPMARK
Click on Edit to modify the name or colour. See “5.1. Marks” on
page 59..
SETTINGS
This option will display the SOUNDER Menu. See “4.2. Sounder” on
page 37.
NOTE: BEAM WIDTH and BEAM ANGLE o Nadir will determine seafloor
coverage of the beam.
Page 42 of 66 Page 43 of 66Doc: CDX Operators Manual
wassp.com wassp.com
Version: 3.2 January 2017
Doc: CDX Operators Manual
Version: 3.2 January 2017
Page 23

CDX OPERATORS MANUAL
4�3� CHART
The Chart display overlays Bathymetry data and optionally backscatter data, Real Time on chart
cartography layers.
Information
Measure
Display
Mapped
Bathymetry
Heading
Line
Vessel
Vessel
Track
Chart
Cartography
Colour
Tool
Zoom
Tool
4�3�1� Charting Cartography
Charting cartography supported currently includes:
» Navionics Gold/Navionics+
» Navionics Platinum
Navionics charting on SD card will be automatically detected and loaded into WASSP
CDX.
NOTE: Navionics charting needs to be registered over the internet on first
use. Registration will be automatically carried out by WASSP CDX and will
require an internet connection. Once registered no internet connection is
required.
4�3�2� Chart Configuration Options
From the HOME bar, select
CHART when there is a 2D or 3D
Display Panel. This provides the
following options:
Profile
Tool
INFORMATION
DISPLAY
ZOOM &
PAN CONTROL
Supplies following information at the cursor:
» Depth
» Position
The Chart panel can be ranged in and out.
Manual zoom of range can be controlled using the mouse wheel or
ZOOM tool, see “3.3.10. Zoom Control” on page 30. Select the +
and – controls as required.
NOTE: Touch control for zoom is available.
The 2D Chart panel can be panned to display dierent geographical
areas. To pan the chart, left-click cursor and drag.
1
2
3
4
5
6
NOTE: To re-center on the vessel use the CSM
The 3D Chart panel can be orientated; left-click the cursor and
drag.
Version: 3.2 January 2017
7
8
wassp.com
Page 45 of 66Doc: CDX Operators Manual
Page 24

CDX OPERATORS MANUALCDX OPERATORS MANUAL
1
2
3
4
CHART
DISPLAY
CHART
LAYERS
TRACK
OPTIONS
Controls for mapping options
» MAPPING: To enable or disable Bathymetry being saved to
the database and displayed on the chart
» BEST BEAM: To optimise overlapping Bathymetry selection
» COLOUR TOOL: Used to select Bathymetry colour display.
See “4.3.2.1. Colour Tool” on page 47.
Display options on the chart
» 2D CHART: Enable/disable display of the chart cartography
» 3D CHART: Enable/disable display of the chart cartography
» 3D SWATH: Enable/disable the vessel swath display
» 3D DEPTH LINE: Enable/disable the vessel depth line display
Used to enable or disable specific chart layers. See “4.3.2.2. Chart
Layers” on page 48.
Used to set up vessel track on the 2D Chart. See “4.3.2.3. Track
Options” on page 48.
4�3�2�1� Colour Tool
The COLOUR TOOL allows colour range
to be set on the Bathymetry.
With AUTO COLOURS enabled the colour
range will be assigned automatically,
centered around the current depth at the
vessel.
The colour range around depth at vessel
can be adjusted using the slider. This will
other condense or extend the colour
range for a specific depth range.
With AUTO COLOURS disabled the colour
range will be controlled by the user.
The colour range can be condensed or
extended using the slider bars to apply
between two user specified depths.
5
6
7
8
BACK
SCATTER
WATER
COLUMN
TARGETS
DATABASE
FILTERS
NOTE: Options that are disabled are only available with appropriate feature
licensing.
Used to access the Backscatter setup and configuration options
for overlay on the chart.
See “4.3.2.4. Backscatter” on page 48.
Used to access the Water Column Targets setup and
configuration options for overlay on the chart. See “4.3.2.5. Water
Column Targets” on page 51.
Used to set up the Mapping Database. See “4.3.5. Database” on
page 55.
Allows adjustment of signal processing filters to optimise the data
and display when operating in an environment with noise, clutter
and other interference impacting the data quality. See “3.2.4. Filter
Setup” on page 18.
Page 46 of 66 Page 47 of 66Doc: CDX Operators Manual
wassp.com wassp.com
Version: 3.2 January 2017
Doc: CDX Operators Manual
Version: 3.2 January 2017
Page 25

CDX OPERATORS MANUALCDX OPERATORS MANUAL
4�3�2�2� Chart Layers
By selecting CHART LAYERS, specific
charting cartography layers can be enabled
or disabled.
SHOW BACKSCATTER shows the
backscatter overlay on the chart.
Backscatter will show instead of Bathymetry
when enabled.
Backscatter overlay displays seafloor
reflectivity, represented by colour change.
4�3�2�3� Track Options
By selecting TRACK, the following options
are available:
TRACK enables or disables display of the
track on the 2D Chart display.
COLOUR allows track colour selection.
DELETE TRACK will permanently delete the
track.
4�3�2�4� Backscatter
Backscatter overlay displays seafloor surface reflectivity as the seafloor target strength
compensated for reflection angle due to slope, beam angle, and other losses.
The backscatter calibration routine needs to be run in order to compensate for system
characteristics.
NOTE: Backscatter CALIBRATE process should be run prior to using the
Backscatter overlay.
The backscatter control allows setting the
backscatter colour range.
To change the colour range drag the
minimum and maximum indicators on the
slider controls.
The histogram alongside the colour range
controls indicates the actual spread of
backscatter intensity currently displayed in
the panel.
The backscatter display can either be
shown as greyscale or colour scale using
the COLOUR TABLE selection.
Page 48 of 66 Page 49 of 66Doc: CDX Operators Manual
wassp.com wassp.com
Version: 3.2 January 2017
Doc: CDX Operators Manual
Version: 3.2 January 2017
Page 26

CDX OPERATORS MANUALCDX OPERATORS MANUAL
The display range can be automatically
adjusted to be optimal for the data by using
the SCALE COLOURS TO VIEW button. This
selects the colour range to fit the intensity
histogram.
CALIBRATE : Backscatter calibration is run to compensate for system characteristics that
may cause artefacts on the backscatter display. Specifically this compensates for the
transducer beam pattern variance from the nominal. Calibration requires:
» 10 – 50m depth
» Flat seafloor with consistent seafloor type
» Calm conditions
» At least 200m straight run
To run the Backscatter calibration:
1. Enable SHOW BACKSCATTER.
2. Line up for the calibration run and
begin the calibration run.
4�3�2�5� Water Column Targets
When enabled, target detections in the
water column will be displayed on the 2D
and 3D Chart panels.
The water column detections are coloured
and sized depending on the intensity of the
return signal. Typical water column targets
that will be depicted and overlaid on the
chart display are individual fish targets and
fish schools. However, they will also include
artefacts and, depending on the threshold
level set, may also include sediment and
turbulence.
The water column targets are stored and
can be retrieved for viewing historical data.
3. Hit the CALIBRATION button:
• A line across the swath will indicate
Calibration routine has started.
• The Backscatter data will adjust
dynamically during the calibration
run.
• A 2nd line across the swath will
indicate when the calibration data
collection has completed.
4. Once completed the Backscatter will
be adjusted to compensated levels.
5. Pressing cancel at any point during
the calibration run will stop the data
collection process and disregard the
data.
MODE toggles between BETWEEN DEPTHS
and FROM SEAFLOOR. The area of interest
can either be defined in the water column
below the surface, BETWEEN DEPTHS,
or as a zone above the seafloor, FROM
SEAFLOOR.
When BETWEEN DEPTHS is selected,
define the START DEPTH and END DEPTH
by dragging the indicators on the slider
controls. Detections outside the selected
zone will be ignored.
NOTE: Calibration status will be displayed during the calibration process.
Page 50 of 66 Page 51 of 66Doc: CDX Operators Manual
wassp.com wassp.com
Version: 3.2 January 2017
Doc: CDX Operators Manual
Version: 3.2 January 2017
Page 27

CDX OPERATORS MANUALCDX OPERATORS MANUAL
When FROM SEAFLOOR is selected, define
DEPTH ABOVE SEA LEVEL by dragging the
indicator on the slider control. Detections
above the selected distance above the
seafloor will be ignored.
SEAFLOOR GATE toggles between ABOVE
SEAFLOOR and ALL TARGETS. The area
of interest can be limited to being above
the seafloor or using ALL TARGETS for
the full ping / transmit range. This is
specifically useful when working in water
where seafloor depth is beyond the ping /
transmit range.
DISPLAY HISTORY can be selected to a
specified time or to ALL.
The specified time will determine how
much historical water column detections
data will be displayed on the Chart panels.
4�3�3� 2D Chart CSM
To access the 2D CSM, right-click on the
Display Panel:
CENTER ON
VESSEL
MODE Toggles between NU (North Up) and HU (Head Up) chart display.
COLOUR TOOL
Centers the chart on the vessel position. This mode will be disabled if
the chart is panned.
Displays the COLOUR TOOL. See “4.3.2.1. Colour Tool” on page
47.
THRESHOLD slider control allows selection
of the target strength level above which
the return signal will be deemed as a water
column target and displayed as such.
NOTE: Water column targets will only be available for display on the Chart
panels if they are within the selected zone and above the selected threshold
level at the time of acquisition.
Page 52 of 66 Page 53 of 66Doc: CDX Operators Manual
wassp.com wassp.com
Version: 3.2 January 2017
SHOW PROFILE Enables the Profile tool. See “5.2. Profile Tool” on page 60.
CURSOR INFO Displays the Information display as an overlay on the Display Panel.
Places a mark at the cursor position. To modify or delete this mark,
DROP MARK
right-click on the symbol and a sub menu will appear. See “5.1. Marks”
on page 59.
MARK VESSEL Places a mark at the vessel position.
START
MEASURE
SETTINGS
Doc: CDX Operators Manual
Version: 3.2 January 2017
Starts / Stops the Measure on the PROFILE tool. See “5.2. Profile Tool”
on page 60.
This option will display the CHART Menu. See “4.3.1. Chart
Configuration Options” on page 46.
Page 28

CDX OPERATORS MANUALCDX OPERATORS MANUAL
4�3�4� 3D Chart CSM
To access the 3D CSM, right-click on the
Display Panel:
4�3�5� Database
The Mapping Database is used for all WASSP CDX data storage.
The DATABASE is used to set up the Mapping Database. Bathymetric data from the DRX
will be saved to the database you select.
The DATABASE section can also be used for importing data such as Navigator data from
previous versions of WASSP.
To access the DATABASE menu pages:
1. From the HOME bar, under DISPLAY
SETTINGS, select CHART.
CENTER ON
VESSEL
Centers the chart on the vessel position.
Toggles between NU (North Up), HU (Head Up) and FREE ROTATE
MODE
which allows user orientation of Vessel and chart; left-click the cursor
and drag.
Scale options allow the vertical scale of the 3D display to be changed
SCALE
whilst horizontal scale remains the same. This will accentuate seafloor
features.
COLOUR
TOOL
Displays the COLOUR TOOL. See “4.3.2.1. Colour Tool” on page 47.
CURSOR INFO Displays the Information display as an overlay on the Display Panel.
RESET VIEW This will reset view to its native resolution.
SETTINGS
This option will display the CHART Menu. See “4.3. Chart” on page
44.
2. Select DATABASE.
Database management menu options will
be available.
All database management is carried out on
the selected database location.
The selected database location is used for
database creation, database selection and
Navigator database import location.
3. The selected database location can
be changed.
Select CHANGE DIRECTORY will bring up
a BROWSE FOR FOLDER window with the
currently selected location highlighted.
Selecting and saving a dierent location will
update the selected database location.
NOTE: 3D Chart control is bound to the 2D control which means that
display control on 2D will impact the 3D display.
NOTE: Cursor info only displays depth at the cursor on mapped Bathymetry.
Page 54 of 66 Page 55 of 66Doc: CDX Operators Manual
wassp.com wassp.com
Version: 3.2 January 2017
Doc: CDX Operators Manual
Version: 3.2 January 2017
Page 29

CDX OPERATORS MANUALCDX OPERATORS MANUAL
4�3�5�1� To Create a New Database
1. Under CREATE NEW DATABASE type
in a name for the database.
2. Select resolution and depth option.
The chosen resolution will impact
database size and maximum mapping
depth.
(0.3m, 0.6m, 1.2m)
3. Click CREATE. The created database
will appear in the database list. See
“4.3.5.2. To Select a Database” on
page 56.
4�3�5�3� Navigator Overlay
Navigator data from previous versions of WASSP can be imported and viewed as an
overlay on the Chart Panels.
The Navigator database can be imported by
selecting IMPORT DATABASES.
1. Select CHANGE DIRECTORY and
select the location of the original
Navigator databases to be imported.
2. Select the Navigator database to be
imported.
NOTE: There will be no mapping recorded beyond the max depth stated in
the dropdown.
4�3�5�2� To Select a Database
Bathymetric data will be recorded to the currently selected database.
1. Select a database from the list of
available databases in the list box.
Click SWITCH.
2. The current database used in the
Chart panels will appear under
CURRENT DATABASE.
3. Select IMPORT.
Once imported, the Navigator databases can be viewed as an overlay on the chart panel.
1. Select the NAVIGATOR OVERLAY,
2. The imported databases will appear
in the selection list for NAVIGATOR
OVERLAY. Select the imported
Navigator database to overlay.
NOTE: Only databases under the select Path will be shown in the database
selection list. CHANGE DIRECTORY to view databases stored in other
locations.
Page 56 of 66 Page 57 of 66Doc: CDX Operators Manual
wassp.com wassp.com
Version: 3.2 January 2017
Doc: CDX Operators Manual
Version: 3.2 January 2017
Page 30

CDX OPERATORS MANUALCDX OPERATORS MANUAL
3. Select SWITCH.
The Navigator database will now be
overlaid on the Chart Panels.
NOTE: If the Selected database location, see “4.3.5. Database” on page
55, is changed the imported navigator databases will not appear in the
selection list.
5 TOOLS
5�1� MARKS
The MARKS setting can be accessed from CSMs in Charting
and Sounder Display Panels and by right-clicking on a MARK
and selecting EDIT.
The MARK setting can be used to:
» Select MARK ICON
» Select MARK COLOUR
» Edit MARK NAME
Page 58 of 66 Page 59 of 66Doc: CDX Operators Manual
wassp.com wassp.com
Version: 3.2 January 2017
There are colour options for each mark. To change colour, click on the
colour box you require e.g. yellow:
Doc: CDX Operators Manual
Version: 3.2 January 2017
Page 31

CDX OPERATORS MANUALCDX OPERATORS MANUAL
5�2� PROFILE TOOL
The profile tool can be used to measure the distance between two points and to give a
profile of the seafloor between those two points.
To enable or disable display of the profile
tool click on PROFILE option in the
appropriate CSM.
2. Drag the START
MEASURE
Indicator to
required start
End Measure
Indicator
Profile Line
Start Measure
Indicator
position and leftclick to lock Start
position.
3. Drag the END
MEASURE
Indicator to
required finish
position and leftclick to lock End
position.
4. The measure and profile will be dynamically updated on the profile tool.
5. The START MEASURE INDICATOR and
END MEASURE Indicator can be selected
by hovering over, left-click and drag to a
new position for profiling.
PROFILE TOOL will be displayed. Mousing over the Profile Tool will display depth and
distances.
To select the measure area that will be profiled:
1. Select START MEASURE from the CSM.
6. To remove the Measure tool from the
Panel select STOP MEASURE on the CSM.
Page 60 of 66 Page 61 of 66Doc: CDX Operators Manual
wassp.com wassp.com
Version: 3.2 January 2017
Doc: CDX Operators Manual
Version: 3.2 January 2017
Page 32

CDX OPERATORS MANUALCDX OPERATORS MANUAL
6 TOOLS AND UTILITIES
6�1� DATA MANAGER
DATA MANAGER is used for recording and replaying data from the
DRX. DATA MANAGER can also be used for exporting recorded data
into dierent file formats for oine processing.
DATA MANAGER is installed with CDX but is launched as an
independent application.
6�1�1� Data Manager Record
1. Click on the RECORD
tab.
4. Select the DRX and
click OK.
5. Select the location
that you want to
store your files
to by clicking on
BROWSE under SAVE
LOCATION.
6. Click on RECORD
to start recording
and STOP to stop
recording.
7. When recording
there are some
options:
2. Connect to the DRX
that you want to
Record data from.
3. Click on the SCAN
button to view DRXs
on the network.
» ‘Include Sonar Display Data’ will record Sonar data as well as bathymetric data. This
will result in medium size files.
» ‘Include Diagnostics Data’ will record the full raw data useful for technician
analysis. However, it will result in very large files.
» REC SNIPPET will record enough full raw data for a short period of time. This data
is useful for technician analysis of issues without recording overly large files.
Page 62 of 66 Page 63 of 66Doc: CDX Operators Manual
wassp.com wassp.com
Version: 3.2 January 2017
Doc: CDX Operators Manual
Version: 3.2 January 2017
Page 33

CDX OPERATORS MANUALCDX OPERATORS MANUAL
6�2� DATA MANAGER REPLAY
1. Click on the REPLAY
tab.
2. Click on START
SERVER. This allows
Data Manager to be
available to client
applications such as
CDX.
3. Once a client
application is
successfully
connected the
connection icon will
display green.
4. A playback file can
be selected using the
OPEN FILE button.
5. PLAYBACK
CONTROLS can then
be used to control
the playback.
7 APPENDIX
APPENDIX A - PC
PC SPEC
MINIMUM RECOMMENDED
OS Windows 7, 8.1, 10 Windows 10
CPU Base Frequency 2GHz 2GHz
Cores/Threads 2/4 4/4
Memory 4GB 8GB
Graphics DirectX 11 DirectX 11
Screen Resolution 1024x768 FHD - 1920x1080
HDD/SDD 250GB SSD 2TB SSD
Network Ethernet GbE GbE
Wi-Fi 802.11ac 802.11ac
Example of WASSP supported PCs:
» Low end PCs
• Intel NUC5i3RYK
» Tablets
• ToughPad FZ-GI
• Microsoft Surface Pro 4
» Ruggedised PCs
• ADLINK MXE-5400
PC STORAGE
PC should be configured with 2 partitions; One for OS and one for mapping database.
NOTE: In Replay mode Data Manager appears as a DRX to client applications
and can be selected in DEVICE SETUP in CDX. See “3.1. Device setup” on
page 10.
Page 64 of 66 Page 65 of 66Doc: CDX Operators Manual
wassp.com wassp.com
Version: 3.2 January 2017
If data storage limits are approached there will be a user warning and data will be
disabled until disk space is freed up.
Doc: CDX Operators Manual
Version: 3.2 January 2017
Page 34

 Loading...