

Walz PHYTO-PAM-II User Manual

Printed in Germany
Phytoplankton Analyzer
PHYTO-PAM-II
and
Phyto-Win 3
Software V 3
Principles of Operation
2nd Edition: Nov 2016
PhytoPamII_2.doc
Heinz Walz GmbH, 2016
Heinz Walz GmbH Eichenring 6 91090 Effeltrich Germany
Phone +49-(0)9133/7765-0 Telefax +49-(0)9133/5395
Email info@walz.com Internet www.walz.com


MAY 2002 CONTENTS
1 Safety instructions ........................................................................ 1
1.1General safety instructions .......................................................... 1
1.2Special safety instructions ........................................................... 2
2 PHYTO-PAM-II ........................................................................... 3
2.1Compact Version ......................................................................... 5
Spherical Micro Quantum Sensor US-SQS/WB .................... 82.1.1
Stirring Device WATER-S (optional) .................................... 92.1.2
Battery Charger MINI-PAM/L ............................................ 102.1.3
3 PhytoWin Software installation and Phyto-PAM-II setup ..... 11
3.1Measure PAR Lists .................................................................... 13
4 First fluorescence measurements ............................................. 16
4.1Principle of distinguishing between different groups of
phytoplankton ............................................................................ 21
5 Saturation Pulse Analysis .......................................................... 23
5.1Measurements with Dark-Acclimated Samples ........................ 23
5.2Measurements with Illuminated Samples .................................. 24
5.3Fluorescence Ratio Parameters ................................................. 25
6 Features of PhytoWin Software ................................................ 30
6.1Elements for system operation and display of instrument status33
6.2Channels-window ...................................................................... 39
Ft, F, Fm’, Fm’-F, Y(II), Fv/Fm and Mean Value display ... 396.2.1
Zero Offset and noise N(t) ................................................... 406.2.2
6.3Algae-window ........................................................................... 42
6.4Settings-window ........................................................................ 44
6.5Slow Kinetics window .............................................................. 49
6.6Light Curve window .................................................................. 51
Edit Light Curves ................................................................. 536.6.1
Light Curve Fit-parameters .................................................. 566.6.2

CONTENTS
Comments on Light curves .................................................. 626.6.3
6.7Report Window ......................................................................... 64
6.8Reference-window deconvolution and Chlorophyll
determination calibration values ............................................... 68
How to generate Reference Spectra ..................................... 726.8.1
6.9Fluo Spec -window .................................................................... 74
6.10 Fast Kinetik - window .......................................................... 75
O-I
1
Fit window .............................................................. 776.10.1
Parameters and Output of Fo-I
1
Rise Analysis ............... 816.10.2
6.11 VIEW - MODE .................................................................... 82
6.12 Main Menu Bar .................................................................... 85
Options: ETR Parameter ................................................. 876.12.1
Al current/PAR list ......................................................... 886.12.2
6.13 Script files ............................................................................ 90
Data Management ........................................................... 916.13.1
Editing Tools ................................................................... 926.13.2
List of Script File Commands ......................................... 936.13.3
7 Technical Specifications ........................................................... 101
PHYTO-PAM-II Compact Version ................................... 1017.1.1
System Control and Data Acquisition ................................ 1027.1.2
Battery Charger MINI-PAM/L .......................................... 1037.1.3
Spherical Micro Quantum Sensor US-SQS/WB ................ 1037.1.4
Transport Box PHYTO-T .................................................. 1047.1.5
Accessory Stirring Device WATER-S ............................... 1047.1.6
8 Rechargeable battery ............................................................... 105
9 References and further reading .............................................. 106
10Index .......................................................................................... 112
11 Warranty .................................................................................. 115

MAY 2002 CONTENTS
11.1 Conditions .......................................................................... 115
11.2 Instructions ......................................................................... 116


CHAPTER 1MAY 2002 SAFETY INSTRUCTIONS
1
1 Safety instructions
1.1
General safety instructions
1. Read the safety instructions and the operating instructions
first.
2. Pay attention to all the safety warnings.
3. Keep the device away from water or high moisture areas.
4. Keep the device away from dust, sand and dirt.
5. Always ensure there is sufficient ventilation.
6. Do not put the device anywhere near sources of heat.
7. Connect the device only to the power source indicated in the
operating instructions or on the device.
8. Clean the device only according to the manufacturer’s
recommendations.
9. If the device is not in use, remove the mains plug from the
socket.
10. Ensure that no liquids or other foreign bodies can find their
way inside the device.
11. The device should only be repaired by qualified personnel.

CHAPTER 1 SAFETY INSTRUCTIONS
2
1.2 Special safety instructions
1. PHYTO-PAM-II Multiple Excitation Wavelength Phytoplankton and Photosynthesis Analyzer is a highly sensitive
research instrument which should be used only for research
purposes, as specified in this manual. Please follow the
instructions of this manual in order to avoid potential harm to
the user and damage to the instrument.
2. PHYTO-PAM-II employs high intensity LED-array light
sources which may cause damage to the eye. Avoid looking
directly into these light sources during continuous illumination
or saturation pulses.
3. Do not cover the ventilation grille rear side of the instrument.

CHAPTER 2 PHYTO-PAM-II
3
2 PHYTO-PAM-II
PHYTO-PAM-II represents the progress of established WALZ
fluorometers dedicated to aquatic research like XE-PAM, WATER-
PAM, previous PHYTO-PAM and MULTI-COLOR-PAM. Choice
of several measuring light wavelengths at variable measuring light
settings (intensity and frequency) offered by XE- and 4-wavelengths
PHYTO-PAM are combined with the high time resolution of
MULTI-COLOR-PAM. Thus enabling classical PAM analysis,
deconvolution of phytoplankton and analysis of fast induction
kinetics.
The PHYTO-PAM-II incorporates a multi-color Chip-On-Board
(COB) LED Array featuring 5 measuring light colors and 6 colors for
actinic light illumination. The 440 nm, 480 nm, 540 nm, 590 nm,
625 nm measuring light facilitates online differentiation of 4
different pigment types therefor deconvolution of green algae,
cyanobacteria, diatoms/dinoflagellates and phycoerythrin containing
organisms like cryptophytes. As in the first generation PHYTO-PAM
deconvolution bases on fluorescence excitation reference spectra.
But for the first time these spectra are not instrument specific but
universal. Due to spectral calibration of PHYTO-PAM-II instruments
reference spectra can be shared between users and instruments.
The PHYTO-PAM-II user surface is based on the proven PhytoWinsoftware featuring classical PAM analysis like the estimation of the
effective photochemical quantum yield of PS II and the
determination of photochemical and non-photochemical quenching
parameters. For extended applications a special Fast Kinetics mode
of operation is added for measuring the wavelength-dependent O-I1
fluorescence rise kinetics upon onset of pulses of strong actinic light
information. Thus enabling evaluation of the functional absorption
cross-section of PS II, σPSII, determined by light color and the

CHAPTER 2 PHYTO-PAM-II
4
pigment composition of photosynthetic organisms (Klughammer and
Schreiber, 2015)
Two versions of the PHYTO-PAM-II Phytoplankton Analyzer are
available. A PHYTO-PAM-II Compact Version with integrated
emitter-detector unit and a Modular PHYTO-PAM-II Version
featuring different emitter-detector units connectable to a Power-andControl-Unit.
Both versions of the PHYTO-PAM-II are operated by PhytoWin-3
software.
CHAPTER 2 PHYTO-PAM-II
5
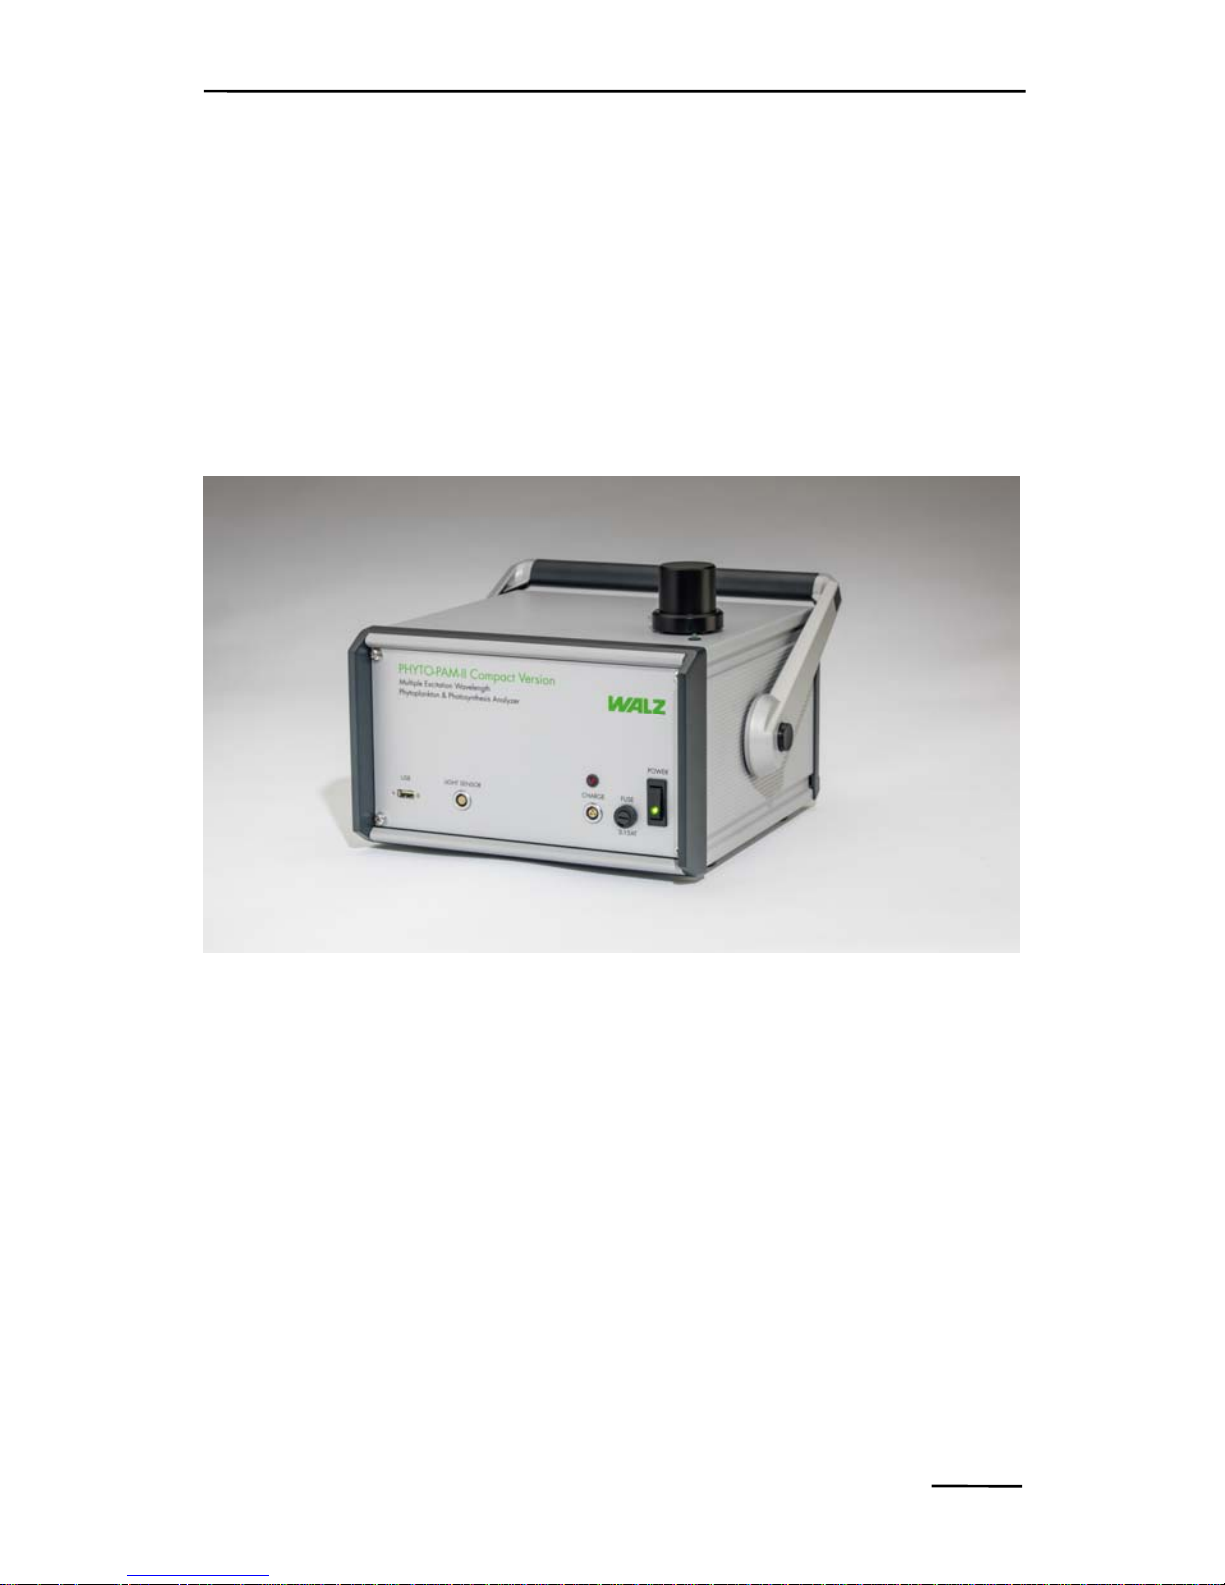
2.1 Compact Version
The PHYTO-PAM-II Compact Version is a lightweight and easily
portable instrument. The splash-proof cast aluminium housing
incorporates the control unit as well as all essentials of the emitterdetector unit: the optical unit, the measuring and actinic LED-array,
the photomultiplier-detector and the cuvette retainer.
Fig. 1: PHYTO-PAM Compact Version
Front side:
Power switch and green power indicator lamp
USB socket to connect external PC for instrument control
Charge socket, to connect Battery Charger MINI-PAM/L
(100 to 240V AC)
Fuse plug, containing 3.15 AT main fuse of internal power
circuit

CHAPTER 2 PHYTO-PAM-II
6
Light Sensor socket, to connect the Spherical Micro
Quantum Sensor (US-SQS/WB) for PAR list calibration.
Top :
Measuring Head with optical port for inserting sample
cuvette
PVC centering ring with o-ring sealing against the inner
wall of the Measuring Head, serving as a guide for the
cuvette and as an adapter for mounting the optional
Miniature Stirring Motor Water-S and the optional Spherical
Micro Quantum Sensor US-SQS/WB.
Cup-shaped perspex inset sealing against an inner o-ring of
the Measuring Head, thus protecting the opto-electronical
components from spilled water samples.
A green LED shows the status of the internal
Photomultiplier Detector. The photomultiplier
automatically is switched off at excessive light impact.
Quartz Cuvette with 15 mm outer and 13 mm inner
diameter; height 46 mm.
Darkening Hood covering the part of the Measuring Head
protruding from the housing.
Photomultiplier Detector The Photomultiplier supply
voltage is automatically switched off when it sees too much
light (red status LED on housing lights up).
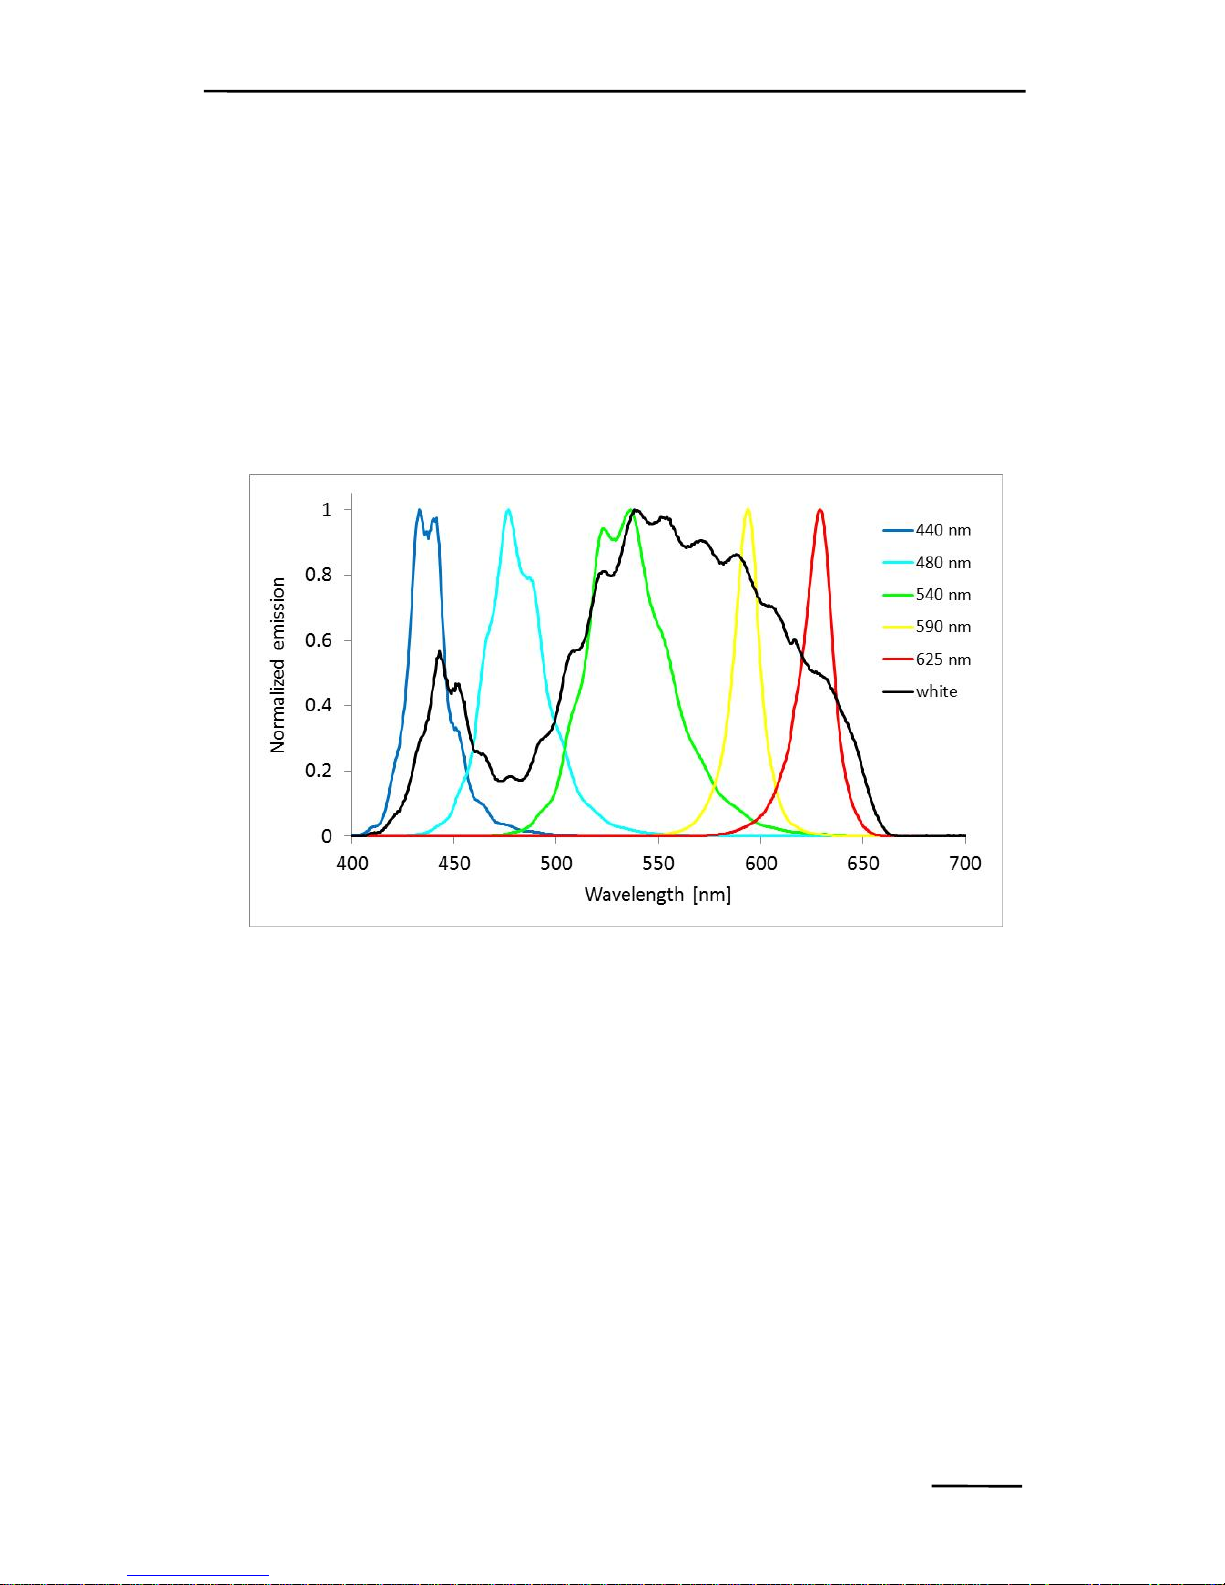
COB LED-Array The light emitting diodes (LED) are
densely arranged on a 10 x 10 mm area. PHYTO-PAM-II
provides 5 differently coloured measuring lights (440 nm,
480 nm, 540 nm, 590 nm, 625 nm), and 5 actinic light
CHAPTER 2 PHYTO-PAM-II
7
sources (440 nm, 480 nm, 540 nm, 590 nm, 625 nm); the
latter are complemented by white (440-640 nm) and far red
(735 nm) LEDs (for measuring light and actinic light spectra
see Fig. 2). To compensate for varying brightness of the
different types of light emission diodes, more LEDs are used
when the intensity of the individual LED is lower.
Fig. 2: Typical normalized emission spectra of PHYTO-PAM-II light
sources. Spectra are not corrected for spectral response of the
spectrometer.
CHAPTER 2 PHYTO-PAM-II
8
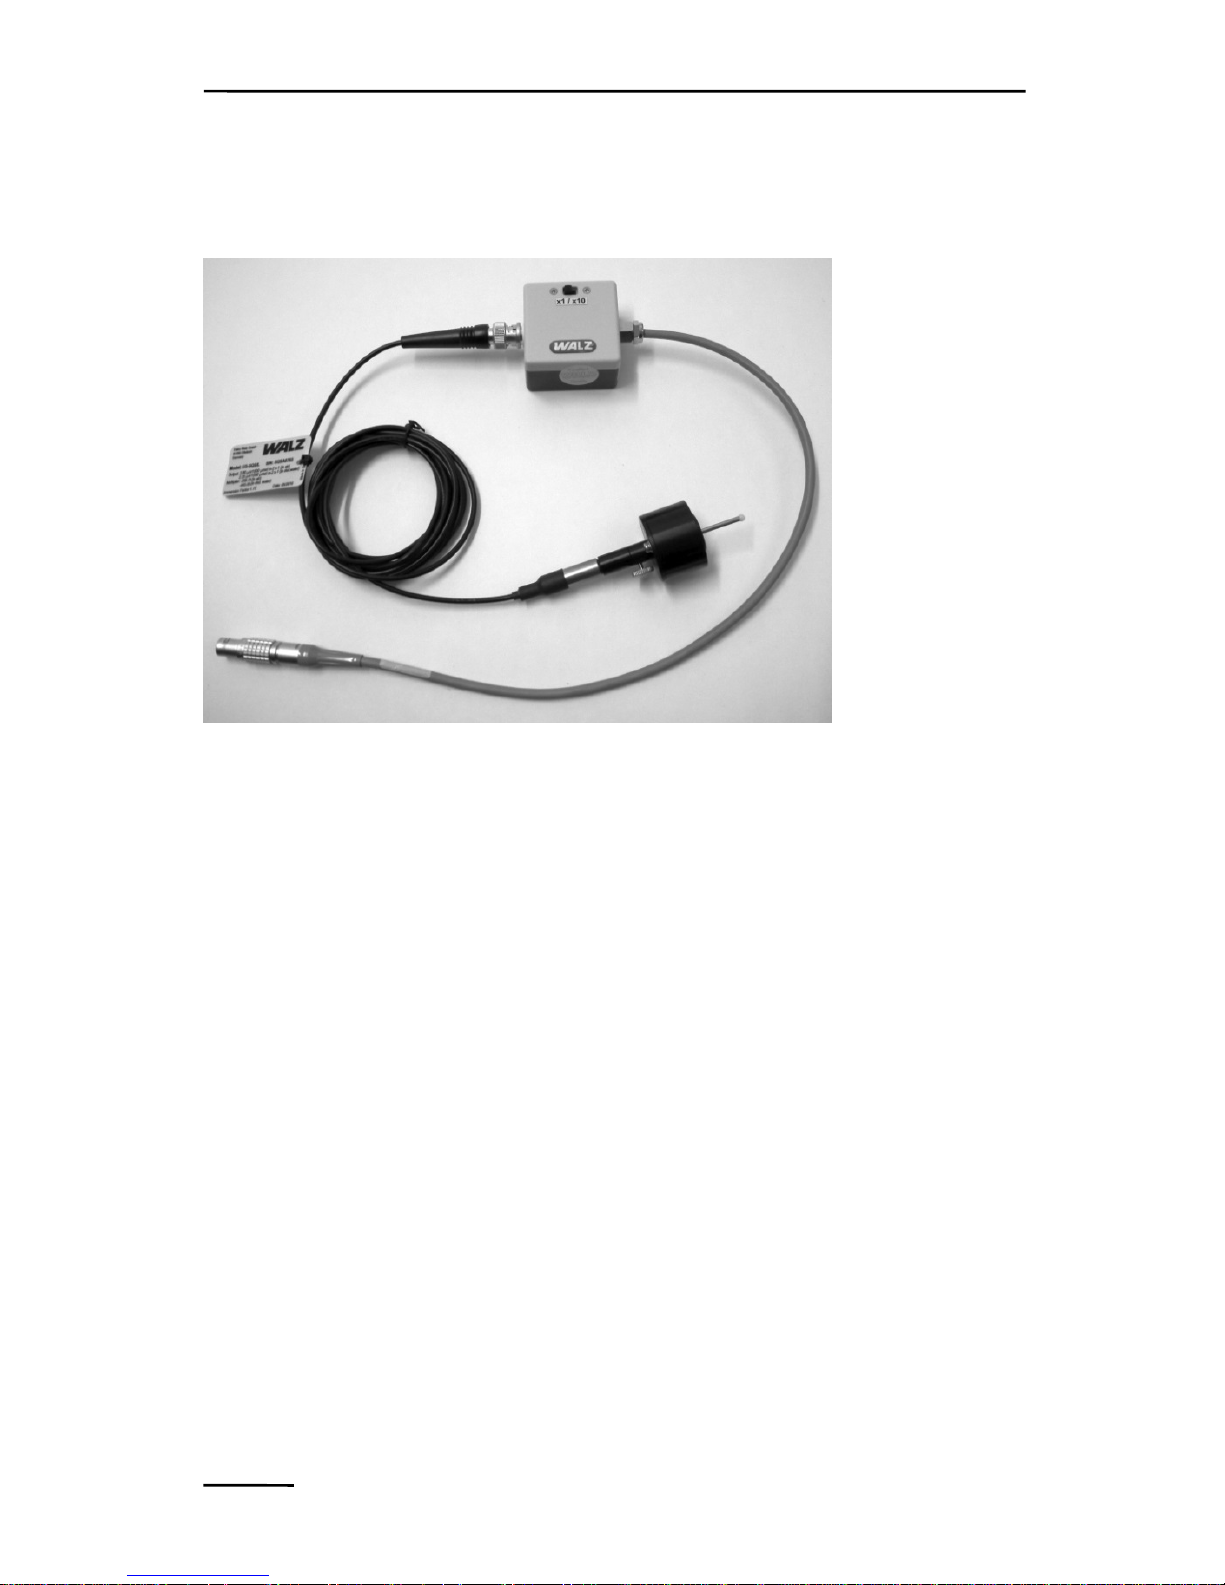
Spherical Micro Quantum Sensor US-SQS/WB 2.1.1
Fig. 3: Spherical Micro Quantum Sensor US-SQS/WB
The Spherical Micro Quantum Sensor US-SQS/WB is included in
the system package as calibration of the PAR-List is essential for
correct assessment of all PHYTO-PAM-II functions.
The US-SQS/WB device consists of a submersible spherical
quantum sensor, US-SQS/L, and a small amplifier unit which is
connected to the light sensor socket. The amplifier is tuned to yield
correct PAR readings within the automated PAR-List calibration (see
chapter
3.1) and needs to be set to 1x.
The 3.7 mm diffusing sphere of the US-SQS/WB sensor picks up
photosynthetically active radiation (PAR) with an angular response
error of less than ± 5% from -100° to 100° angle. Hence, the sensor
is ideally suited to measure light conditions in the suspension cuvette
where reflections and scattering results in randomization of light
direction. For stability of calibration, it is important to keep the
CHAPTER 2 PHYTO-PAM-II
9
diffuser clean. If needed the diffuser can be gently cleaned by using a
cotton tip applicator moistened with some ethanol.
The position of the light sensor is adjustable and will be determined
for PHYTO-PAM-II applications by a 15.3 mm spacer above the
sensor hood.
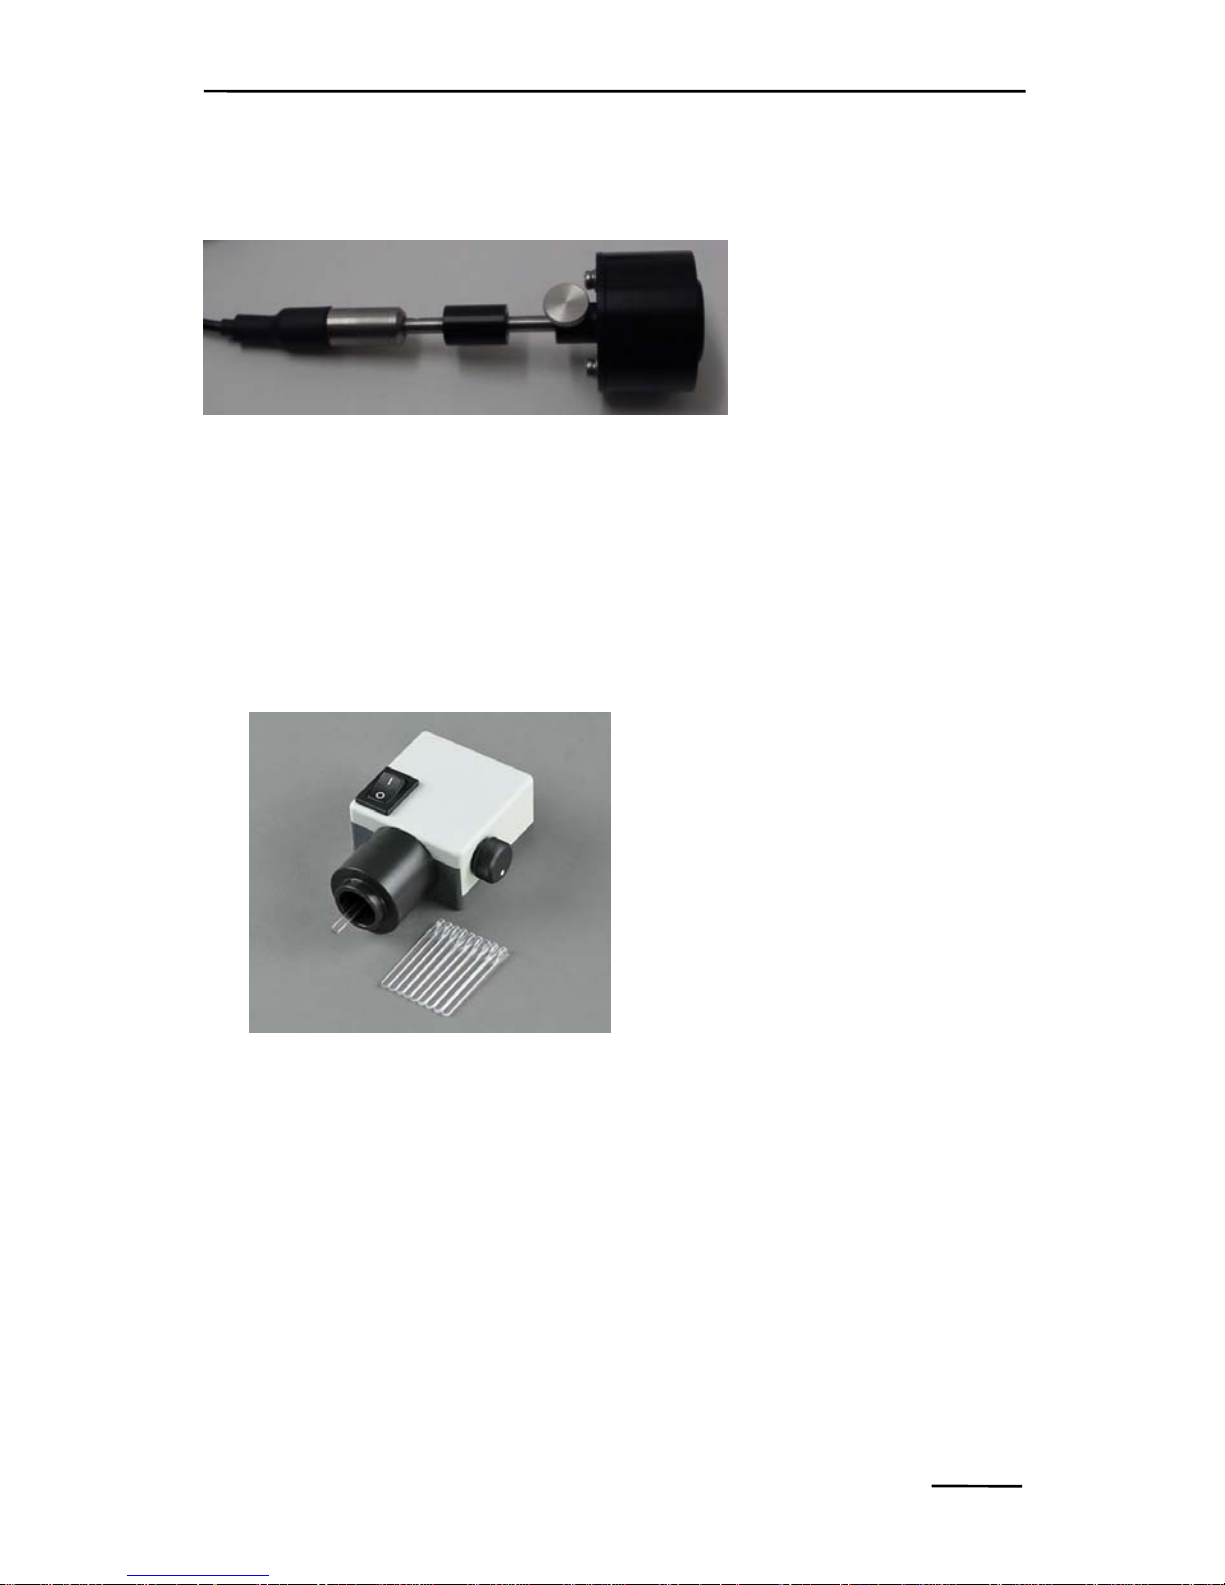
Stirring Device WATER-S (optional) 2.1.2
Fig. 4: Stirring Device WATER-S
WATER-S stirring device can be particularly useful for
measurements of rapidly settling samples.
A special adapter ring is provided for mounting the optional Stirring
Device WATER-S to the PHYTO-PAM-II Compact version.
WATER-S runs on a long life 3 V Lithium battery (size CR 123A). It
features an on/off switch and a potentiometer knob for stirring rate
adjustment. In the bottom center, a stirring paddle is mounted on the

CHAPTER 2 PHYTO-PAM-II
10
motor axis (via split brass-tube adapter). The disposable paddle can
be removed by gentle pulling. The other way around, a replacement
paddle can be mounted by pushing its cylindrical end all the way into
the holder. For replacement of the battery the housing has to be
opened by pulling the white and grey halves apart. Separation of the
two halves is facilitated by forcing gently a thin flat body into the slit
(like finger nail or thin screw driver).
It should be noted that at high photomultiplier gain the paddle of the
WATER-S will cause some increase of noise. This is due to the fact
that some measuring light is reflected from the paddle towards the
photodetector, such that the background signal is approximately
doubled and the electronic noise is correspondingly increased.
Furthermore, there is an increase of sample noise caused by the
movement of cells or cell groups.
Battery Charger MINI-PAM/L 2.1.3
The Battery Charger MINI-PAM/L is provided for recharging the
internal lead-acid battery (12V/2Ah) of PHYTO-PAM-II. It is
connected to the Charge-socket on the front panel of the Power-
and-Control-Unit. The charger, which operates at input voltages
between 100 and 240V AC, features overload protection. Battery
voltage is displayed on the Settings-window of PhytoWin Software.

CHAPTER 3 INSTALLATION
11
3 PhytoWin Software installation and
Phyto-PAM-II setup
PhytoWin-3 and manual versions can be downloaded from Walz web
page http://www.walz.com/downloads/overview.html. The
PhytoWin-3 program needs be installed on the PC going to be used
in conjunction with the PHYTO-PAM-II. At the end of the guided
installation procedure a Phyto-PAM_3 folder is created on the PC
with Data-directories of three different types of Phyto-PAM
Measuring Heads (Phyto US, Phyto ED and Phyto Compact Unit).
Into these directories all measured data will be written. Next to these
directories a script folder, the Phyto.exe file and after definition of
the used measuring head, a Phyto.cfg is located within the PhytoPAM_3 folder.
After download double click the file Setup.exe
After start of Setup.exe the Install Wizard is called up.
This wizard guides through the installation, at the end of which the
PhytoPAM-3 folder will be installed on the PC.
Links to PhytoPAM-3 Folder and to
PhytoWin-3.exe are established on the
desktop.
CHAPTER 3 INSTALLATION
12
Connect PHYTO-PAM-II to computer via USB-cable and start
PhytoWin program by clicking the PhytoWin-3 icon on the desktop.
The Start-window is displayed, showing the number of the current
PhytoWin version.
Following query appears:
to search for Com-Port and enter Measure Mode
to view and analyse data acquired by the PHYTO-PAM-II
and start the program in the viewing mode.
to quit the program.

CHAPTER 3 INSTALLATION
13
In both software operation modes (Measure
Mode and Viewing Mode) the selection of
the applied measuring head is essential, as
each measuring head features individual
parameters (e.g. relating to photomultiplier
sensitivity) that are stored in separate Data
directories. These parameters are essential
for correct storage and analysis of the measured data. After definition
of the measuring head the actual program is started with the 5channels excitation window being displayed.
NOTE:
When a computer installs the PhytoWin-3 user software first time for
a selected PHYTO-PAM-II measuring head, the internal PAR list
needs to be measured before bringing into operation. Calibrations
of the PAR-Lists and a valid .par file in the measuring head folder is
essential for correct assessment of PHYTO-PAM-II functions.
The default.par file is only for startup and not suitable for functional
operation.
The features of the PhytoWin-3 user software described in the
following sections apply to all measuring heads. Exceptions are
indicated.
3.1
Measure PAR Lists
To bring the PHYTO-PAM-II to operation first time the LED array
light parameters (PAR lists) need to be calibrated. The light list
measurements include calibration of the light sensor offset and

CHAPTER 3 INSTALLATION
14
readout of the complete LED array done in an automated calibration
procedure.
Switch on PHYTO-PAM-II and start PhytoWin-3
software. Please plug in the Spherical Micro Quantum
Sensor US-SQS/WB to the PHYTO-PAM-II light sensor
connector, the light sensor will be recognized and the
Measure PAR Lists button in the Settings Window
enabled.
At first use the light sensor might show an offset. This
offset will be eliminated during light sensor calibration
within the Measure Par Lists routine.
Fill distilled water into the quartz glass cuvette and
insert it in the PHYTO-PAM-II measuring head.
Insert the light sensor. The position of the light sensor is
critical for correct detection of PAR values. Therefor the
light sensor/darkening hood geometry is fixed by a 15.3
mm spacer and should not be altered.
Open the measure PAR routine by clicking the Measure
PAR Lists button (Settings window) and start Light
calibration process.

CHAPTER 3 INSTALLATION
15
The light sensor offset and all LED array parameters will be
calibrated. When the Measure PAR List routine is finished a
.par file will be stored within the Data-directories of the
related measuring head folder.
Disconnect light sensor. The functionality of PHYTO-
PAM-II is established.
CHAPTER 4 FIRST MEASUREMENTS
16
4 First fluorescence measurements
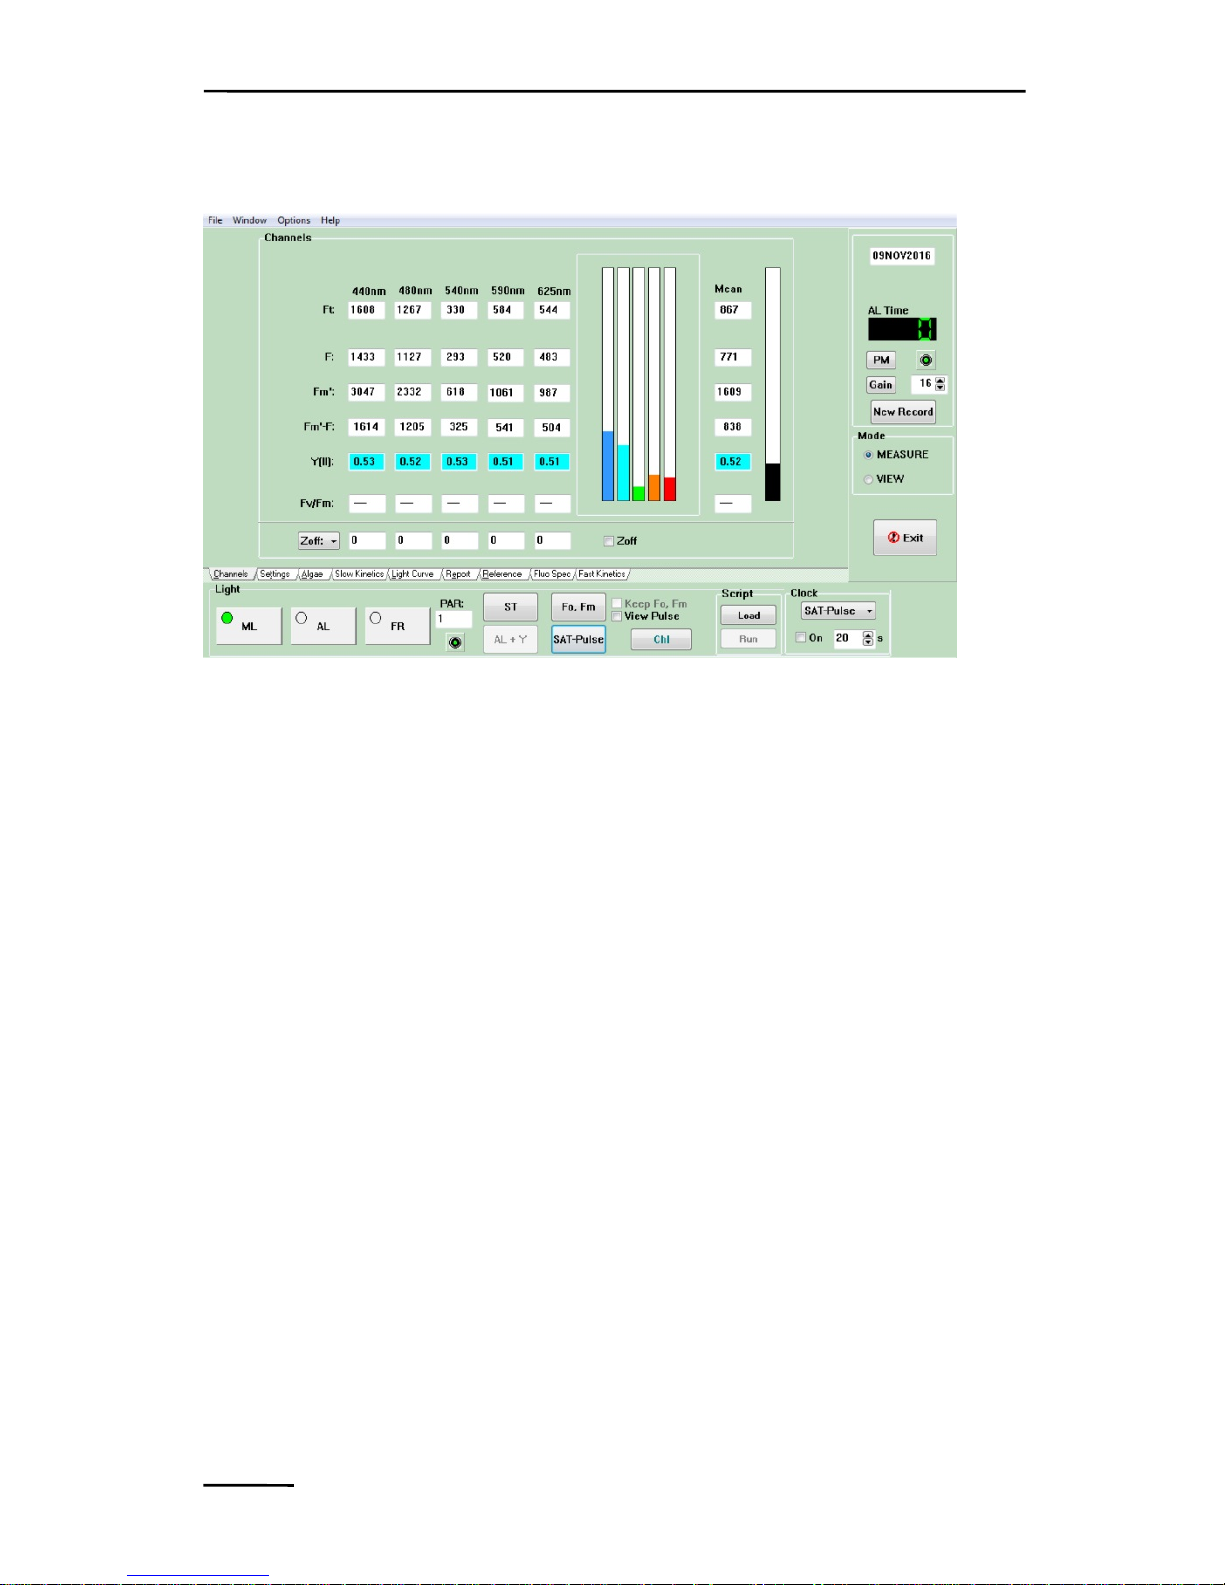
Fig. 5 Channels-Window
The 5-channels excitation mode is the standard mode of operation of
the PHYTO-PAM-II. After start of the program, on the PC monitor
screen the "Channels"-window is displayed. This shows the current
Chl fluorescence yield, Ft, measured continuously with 5 different
excitation wavelengths. In addition, also the mean value of the 5
fluorescence signals is displayed. Normally, after program start the
displayed Ft-values are close to zero, as the Gain (photomultiplier
voltage) is set to a low setting by default, in order to avoid
unintended damage. As indicated by the status of the ML-switch
(bottom, left), the measuring light is switched on upon program start.
It is applied in LED-pulses, such that its actinic effect is relatively
weak. This means that no electrons accumulate at the acceptor side
of PSII and, hence, the minimal fluorescence yield, Fo, of a darkadapted sample is assessed. When the AL-switch is activated also
the intensity of the ML-LEDs is increased. This is due to an
automatic increase of the frequency of ML-pulses during actinic
illumination. In this way, the signal/noise ratio is increased and the
fluorescence changes induced by the actinic light are assessed. At the

CHAPTER 4 FIRST MEASUREMENTS
17
same time the ML at high frequency contributes to overall actinic
intensity, which is displayed in the PAR-field in units of
µmol quanta m
-2s-1
(photosynthetically active radiation). A third type
of illumination is triggered by the "Sat-Pulse" button. But, please
avoid looking directly into the LED-array source, as this light is very
strong and may harm your eyes. This so-called "saturation pulse"
can cause complete reduction of the PSII acceptor pool and, hence,
induce an increase of fluorescence yield from its current level (Ft) to
its maximal value (Fm). Based on such measurements, the effective
quantum yield of photosynthetic energy conversion in PSII can be
determined, using the simple relationship:
Yield = (Fm-F)/Fm = Fm-Fo/Fm
For some first fluorescence measurements fill the cuvette with a
sample (which first may be pure water) and make sure that the
Photomultiplier-Detector is switched on (green indicator LED on
the right hand side of the elements of system operation bar).
Underneath the photomultiplier button is the Gain control box,
showing setting 5 of photomultiplier gain upon program start. This
gain is by far too low to show any fluorescence signal with a pure
water sample. After clicking the Gain-button the Gain-setting is
automatically increased until the channel with the largest signal
shows about 700 units (Auto-Gain function). Even pure water
samples will show a fluorescence signal, if the Gain is sufficiently
high (ca. setting 26 by Automatic Gain control). This unavoidable
"background signal" is due to stray fluorescence originating from
various system components like the LED-array, cuvette and filters.
You will find that an empty cuvette gives a much larger background
signal than a cuvette filled with pure water. The unavoidable
background signal can be digitally suppressed by the automatic

CHAPTER 4 FIRST MEASUREMENTS
18
Zero-offset function (Zoff). But, please note that it will always cause
a decrease in the signal/noise ratio.
In practice, natural surface waters often contain (besides
phytoplankton) other fluorescing substances (like humic acids) in
solution. In order to get rid of this contribution, together with the
small background signal caused by system fluorescence, it is
recommended to proceed as follows:
Make sure that the cuvette is clean, e.g. by washing with
ethanol and rinsing with water.
Make sure that the cuvette is placed correctly into the
Measuring Head. If the cuvette is not all the way down, this
will cause an increased background signal.
Fill the cuvette with ca. 4 ml of the sample to be
investigated and apply Auto-Gain to define the Gain-setting
at which the measurements will be carried out.
Prepare a filtrate of the sample using a 0.2 µm millipore
filter that will retain all phytoplankton.
Exchange the cuvette by a cuvette containing ca. 4 ml of the
filtrate and measure its fluorescence using the same Gainsetting as found appropriate for the unfiltered sample. By
giving a saturation pulse, you may convince yourself that
the signal displayed by the filtrate really is not originating
from active Chl. The Fm`-F and Yield-values will be zero or
close to zero. Please note the little indicator lamp below
the PAR-box, which lights up red as long as the signal is
unstable. All measurements, including Zoff-determination,
should be preferentially carried out after this lamp lights up
green. After Zoff-determination, the signals of the 5
channels are close to zero. Fluctuating values of up to ca. 5
units may occur due to digital noise and are of no concern.

CHAPTER 4 FIRST MEASUREMENTS
19
After Zoff-determination the filtrate is substituted by the sample and
now the proper fluorescence measurements can start, as the
fluorescence yields displayed for the 5 channels now are only due to
the phytoplankton. The most fundamental measurement is the
assessment of the quantum yield of photochemical energy
conversion in PSII by application of a saturation pulse. With an
active sample, the 5 channels will show values of maximal PSII
quantum yield (Yield under quasi-dark adapted conditions) in the
order of 0.5 - 0.8. You may have a look at the saturation pulse
kinetics (View Pulse check-box). For appropriate Yield-
determination, it is important that the maximal fluorescence yield is
reached during the saturation pulse, which is the case when a distinct
plateau is observed
Another fundamental measurement is the recording of the
fluorescence changes upon transition from darkness to continuous
light. Just switch on the actinic light (AL-button) and follow the
changes of fluorescence yield with time, Ft. You will observe that
fluorescence yield first rises to a peak level and then slowly declines
towards a steady state level. This is the famous Kautsky-effect,
which reflects the dark-light induction kinetics of photosynthesis. In
the slow kinetic window you can see the graphical displayed of the
recorded values.
When a saturation pulse is applied during actinic illumination, the
observed Yield-values are distinctly lower than after dark-adaptation.
This reflects a decrease in the efficiency of energy transformation at
PSII reaction centers due to two major factors: first, partial reaction
center closure (primary acceptor Q
A
reduced) and, second, increase
of nonradiative energy dissipation.
Chl fluorescence carries information on the effective quantum yield
of PSII under quasi-dark and light conditions. The product of
quantum yield and quantum flux density of incident

CHAPTER 4 FIRST MEASUREMENTS
20
photosynthetically active radiation (PAR) provides a relative measure
of electron transport rate (ETR). Plots of quantum yield and ETR
versus PAR (so-called light response curves) give valuable
information on the photosynthetic performance and light saturation
characteristics of a sample.
The PhytoWin-program provides a routine for automated recording
of light response curves. For a first demonstration, open the "Light
Curve"-window and click the "Start"-button. There is an
immediate Yield-determination of the sample adapted to the
Measuring Light (at the given frequency of Measuring Light pulses).
Then light intensity automatically is increased in a first step (see
increase in displayed PAR-value) that extends over a defined time
period, at the end of which Yield again is determined. Further steps
of increased light intensity follow and at the end of each the Yield is
determined, thus resulting in light response curves of Yield and of
the derived ETR. The PAR-values of the various steps, the
illumination time during each step and the total number of steps can
be defined by the user (via Edit, see
6.6.1). These "Rapid Light
Curves" provide relevant information as outlined in more detail
below (see
6.6).
The fluorescence information obtained will be automatically stored
in the Report-file which can be accessed by clicking the
corresponding "register card" (Report see
6.7). All data stored in the
Report-file can be also recalled on the Channels- and Algae-
windows for further inspection with the help of the VIEW-mode
(see
6.11). In order to continue with measurements, the user must
return to the MEASURE-mode.

CHAPTER 4 FIRST MEASUREMENTS
21
4.1 Principle of distinguishing between different
groups of phytoplankton
Well proven by the 1st generation PHYTO-PAM is the deconvolution
of different groups of phytoplankton. The reliable assessment of
fluorescence parameters using a number of different excitation
wavelengths is the basis for this distinction and characterization.
PHYTO-PAM-II features now a new spectral composition using five
excitation wavelengths that are chosen for optimal differentiation
between cyanobacteria, green algae, diatoms/dinoflagellates and
phycoerythrin-containing organisms, which differ substantially in the
absorbance spectra of their antenna pigments.
An essential prerequisite for the differentiation between various
types of phytoplankton is that the 5-channels fluorescence responses
of the pure cultures are known. The measurements of such
"Reference Excitation Spectra" are automated and, hence, quite
simple to be performed with the PHYTO-PAM-II, (see
6.7).
PHYTO-PAM-II normalizes measured reference spectra. Reference
spectra measured with PYTHO-PAM II are universal and can be
shared among users. More information about reference spectra are
given in chapter
6.8.
Based on the "Reference Spectra" the PhytoWin-program
deconvolutes the original 5-channels signals into the contributions of
the corresponding algal classes. It should be emphasized that
contrary to the unbiased fluorescence information displayed in the
"Channels"-window, the information on the "Algae"-window is
strongly biased by the information contained in the applied
References. Hence, the quality of the obtained results depends on
previous work invested by the user into the measurement of the
References. Such work will profit from background knowledge on
the likely presence of particular phytoplankton species in the

CHAPTER 4 FIRST MEASUREMENTS
22
investigated water sample. In this sense, the success of practical
applications to a considerable extent depends on close interaction
with basic research, not only using Chlorophyll fluorescence, but
also alternative methods, like microscopy, flow cytometry and
analysis by HPLC.
Deconvolution of the phytoplankton classes can be applied to data
obtained by classical PAM analysis as outlined in chapter
5.

CHAPTER 5 SATURATION PULSE ANALYSIS
23
5 Saturation Pulse Analysis
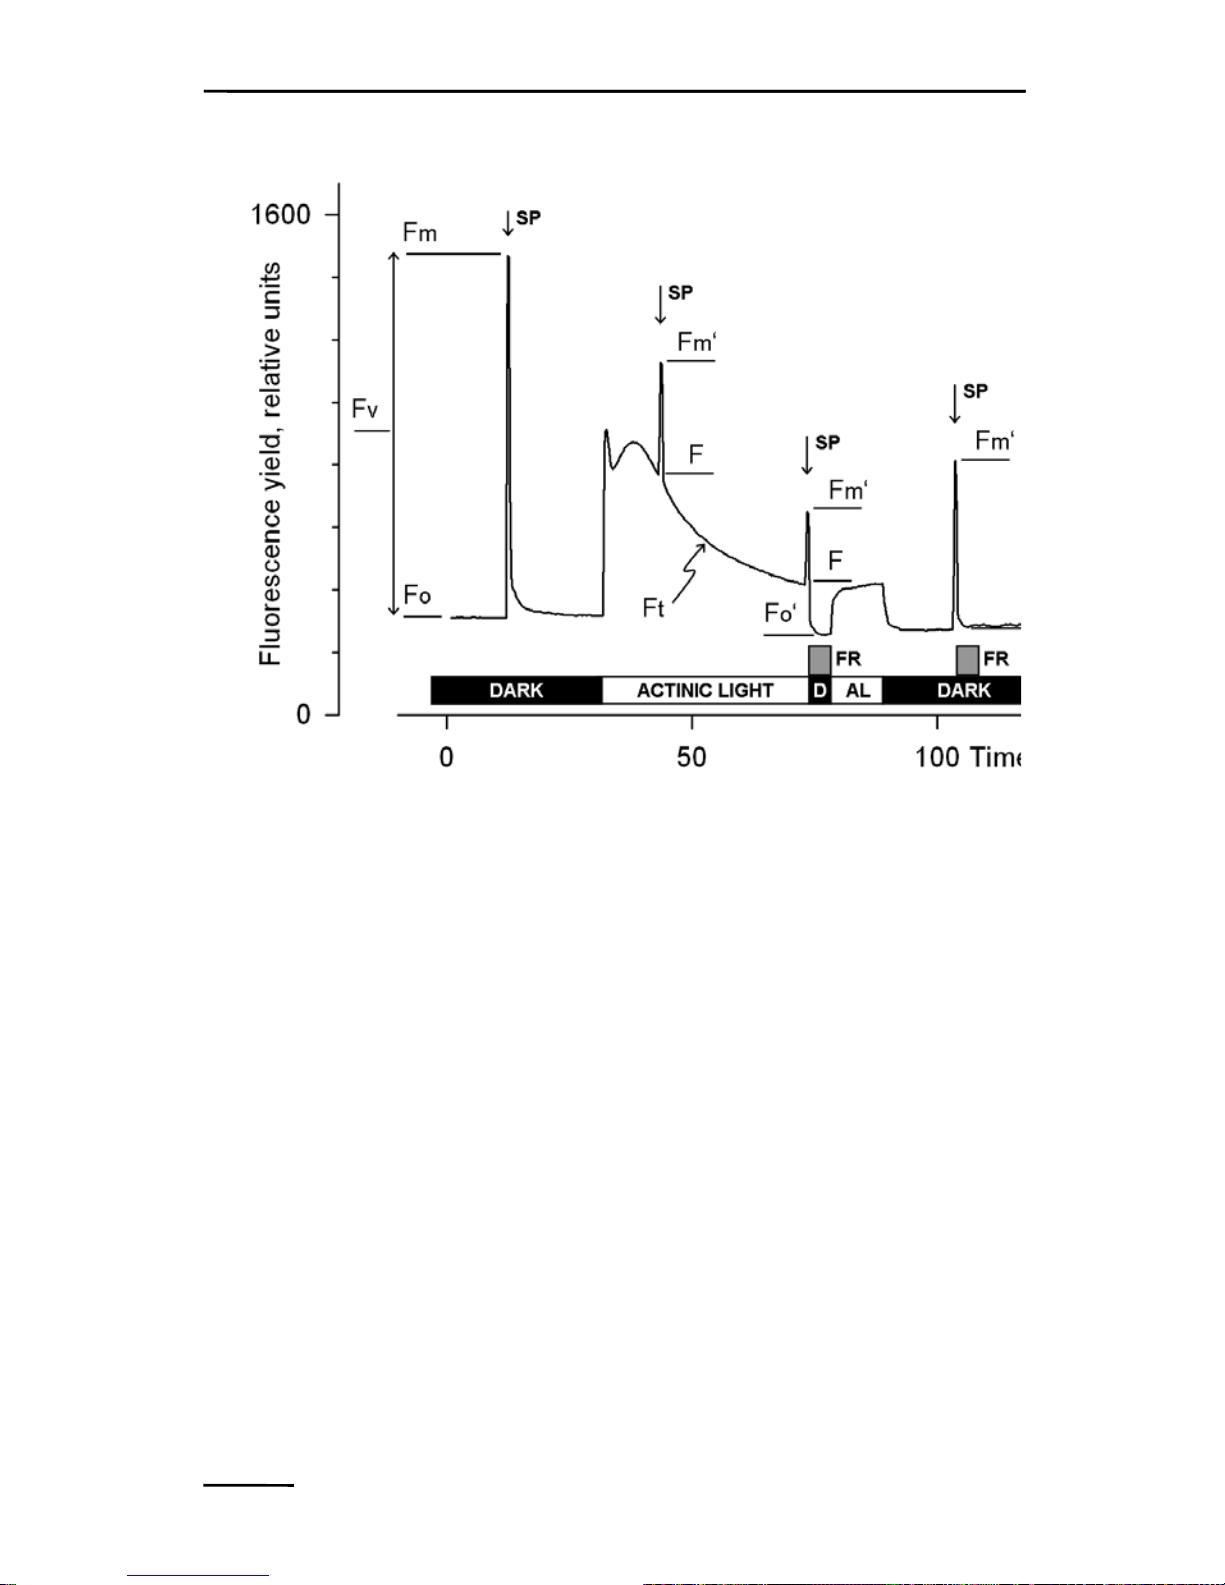
Typically, five different types of fluorescence levels are acquired by
Saturation Pulse analyses named Fo, Fm Fo’ Fm’ and F. In most
cases, the PAM fluorescence signal is proportionally related the yield
for chlorophyll fluorescence. Therefore, differences between these
five fluorescence levels reflect variations in chlorophyll fluorescence
yields.
Two of these levels (Fo and Fm) need to be determined with a darkacclimated sample. The three remaining levels (Fo’, F, and Fm’) are
repeatedly measured during subsequent sample treatments (e.g.,
exposure to actinic light; see Fig. 6).
5.1
Measurements with Dark-Acclimated Samples
Fo Minimum fluorescence level excited by very low intensity of
measuring light to keep PS II reaction centers open.
Fm Maximum fluorescence level elicited by a pulse of saturating
light (Saturation Pulse) which closes all PS II reaction
centers.
CHAPTER 5 SATURATION PULSE ANALYSIS
24
5.2 Measurements with Illuminated Samples
Fo’ Minimum fluorescence level of illuminated sample which is
lowered with respect to Fo by non-photochemical
quenching. When the measuring routine for Fo’ is active,
the Fo’ level is determined during a dark interval
following the Saturation Pulse. In the dark interval, farred light is applied to selectively drive PS I and to
quickly remove electrons accumulated in the intersystem
electron transport chain, thus reopening PS II reaction
centers (see Fig. 6, time point 75 s). Alternatively, the Fo’
Fig. 6: Measurements for Saturation Pulse Analysis. AL, Actinic
Light; D, dark; SP, Saturation Pulse; FR, Far-red illumination.
 Loading...