


PM3000ACE
User Manual
Version 6
Applies to:
PM3000ACE
(Standard)
PM3000ACE-001
(with torque and speed inputs)
PM3000ACE-002
(for full compliance IEC harmonics)
VPN 98-051/6


PM3000A U
SER MANUAL
H
EALTH AND SAFETY
H
EALTH AND SAFETY AT WORK
Electrical devices can constitute a safety hazard. It is the responsibility of the user to ensure the
compliance of the installation with any local acts or bylaws in force. Only qualified personnel should
install this equipment, after reading and understanding this users guide. These operating instructions
should be adhered to. If in any doubt, consult your supplier.
DANGER
ELECTRIC SHOCK RISK
Please note:
This equipment is supplied under warranty conditions, in force at the time of purchase from
your supplier. Contact your supplier for details. Any attempt to disassemble or modify the
unit will render any warranty agreement invalid.
The contents of this guide are believed to be accurate at the time of printing. The
manufacturers, however, reserve the right to change the content, product specification, and
performance criteria, without notice. No liability is accepted for the inappropriate, negligent,
or incorrect set-up of the instrument by the user, either by manual or automated means.

EALTH AND SAFETY
H
PM3000A U
SER MANUAL
S
AFETY PRECAUTIONS
1.
The PM3000A is constructed in compliance with the requirements of EN61010-1, Pollution
Degree 2, Installation Category II, and as such ensures the safety of the meter and the user
when normal precautions are followed.
2. The power source should be inserted in a socket with a protective ground contact.
3. The power source should be inserted before connections are made to measuring or control
circuits.
4. Do not attempt to remove outer cover without first disconnecting auxiliary and test power
supply.
5. This instrument must only be serviced by qualified personnel who understand the danger of
shock hazards.
6. When the instrument is removed from its case hazardous voltages are present.
7. The electronic circuitry of this instrument is fully floating with respect to ground. If the
instrument is opened and dangerous voltages (above 50V peak) applied to the input terminals
then all the circuitry must be considered 'Live'.
8. The signal leads must be in good condition with no damage.

PM3000A USER MANUAL TABLE OF CONTENTS
ABLE OF
T
ONTENTS
C

TABLE OF CONTENTS PM3000A USER MANUAL

PM3000A USER MANUAL TABLE OF CONTENTS
TABLE OF CONTENTS
CHAPTER 1 GENERAL DESCRIPTION PAGE
1.1 Equipment Checklist 1-1
1.2 Accessories 1-2
1.3 System Overview 1-3
CHAPTER 2 GETTING STARTED PAGE
2.1 Power On 2-1
2.2 Using the Control Keys 2-1
2.3 Connection Diagrams 2-4
CHAPTER 3 BASIC FUNCTIONS PAGE
3.1 Basic Measurement Function Keys 3-1
3.2 Set-Up Keys 3-4
3.3 Harmonic Analysis 3-9
CHAPTER 4 PROGRAM SET-UP PAGE
4.1 Programming 4-1
CHAPTER 5 THE FUNCTION MENUS PAGE
5.1 F[1] Power On Default 5-1
5.2 F[2] Bandwidth 5-1
5.3 F[3] Wiring 5-1
5.4 F[4] Efficiency 5-3
5.5 F[5] Program Switch 5-4
5.6 F[6] IEC555 Testing Mode 5-4
5.7 F[7] PWM Drives Mode 5-10
5.8 F[8] Ballast/Ultrasonic Mode 5-14
5.9 F[9] Transformer Test Mode 5-14
5.10 F[10] Calibration 5-16

TABLE OF CONTENTS PM3000A USER MANUAL
CHAPTER 6 ADVANCED CONFIGURATION
6.1 [F][P] Configuration 6-1
P
AGE
CHAPTER 7 INTEGRATOR PAGE
7.1 Integrator Measurements 7-1
7.2 Integrator Menu 7-2
CHAPTER 8 INTERFACES PAGE
8.0 Interface Menu 8-1
8.1 Printer Interface 8-1
8.2 IEEE Interface 8-3
8.3 RS232 Interface 8-3
8.4 Chart Recorder Interface 8-5
8.5 Analogue Output Interface 8-6
8.6 Auxiliary Inputs 8-8
CHAPTER 9 DATALOG PAGE
9.1 Datalog Overview 9-1
9.2 Cycle by Cycle Analysis 9-1
9.3 Datalog 9-3
CHAPTER 10 IEEE COMMUNICATION PAGE
10.1 IEEE488 Overview 10-1
10.2 Addressing 10-2
10.3 Data Sources 10-2
10.4 IEEE 488.1 Operation 10-3
10.5 Example IEEE 488.1 Program 10-14
10.6 IEEE 488.2 Operation 10-17
10.7 Program Timing 10-49
10.8 VPAS Demonstration Software 10-50

PM3000A USER MANUAL TABLE OF CONTENTS
CHAPTER 11 SPECIFICATION
11.1 Voltage 11-1
11.2 Current 11-1
11.3 Power 11-2
11.4 Apparent Power 11-2
11.5 Reactive Power 11-3
11.6 Power Factor 11-3
11.7 Crest Factor 11-3
11.8 Inrush Current 11-4
11.9 Impedance 11-4
11.10 Frequency 11-4
11.11 Harmonic Analysis 11-4
11.12 Integrator 11-4
11.13 Bandwidth 11-5
11.14 Chart Recorder Outputs 11-5
11.15 External Frequency Source 11-5
11.16 External Trigger Input 11-5
11.17 Operating Temperature and Humidity 11-5
11.18 Dielectric Strength 11-5
11.19 Power Source 11-6
11.20 Dimensions and Weight 11-6
11.21 Auxiliary Inputs 11-6
11.22 Warranty 11-7
CHAPTER 12 COMPLIANCE WITH EC DIRECTIVES
12.1 Declaration of Conformity 12-1
12.2 EMC Precautions 12-2
P
P
AGE
AGE
APPENDIX 1 INDEX TO FUNCTION KEYS
APPENDIX 2 ALPHABETICAL INDEX
APPENDIX 3 FORMULAE

TABLE OF CONTENTS PM3000A USER MANUAL

PM3000A USER MANUAL GENERAL DESCRIPTION
CHAPTER 1
ENERAL DESCRIPTION
G

GENERAL DESCRIPTION PM3000A USER MANUAL

PM3000A USER MANUAL GENERAL DESCRIPTION
1.1 EQUIPMENT CHECK LIST
The following items comprise a complete instrument:
1 off PM3000A Unit
6 off Yellow Test Leads
6 off Black Test Leads
6 off Yellow Crocodile Clips
6 off Black Crocodile Clips
1 off AC Power Lead
1 off User Manual
1 off RS232 Lead
1 off VPAS Demonstration Disk
1 off IEC1000-3 Demonstration Disk
PAGE 1-1

GENERAL DESCRIPTION PM3000A USER MANUAL
1.2 ACCESSORIES
Current Transformer 1000/100:1 (CT1000)
1000:1 Current Clamp Transformer (CL1000)
100:1 Current Clamp Transformer (CL100)
Ballast Current Transformer (Ballast CT)
Parallel Printer Cable (VPN 77-001)
VPAS (Visual Power Analysis Software) (VPAS)
IEC1000-3 Software for Windows (IEC1000-3)
PS1000 Power Switch for Inrush Current Measurements (PS1000)
1.2.1 APPLICATION NOTES
Power Measurements in Lighting Applications (APP Note 101)
IEC1000-3 Application Note (APP Note 104)
PWM Drives (APP Note 105)
PAGE 1-2

PM3000A USER MANUAL GENERAL DESCRIPTION
1.3. SYSTEM OVERVIEW
The user is referred to the block diagram on the next page.
The PM3000A has 6 isolated input channels (3 voltage - 3 current) with 12 ranges per
channel. Each channel has its own A/D converter, which samples the input and sends the
digital data back to a microprocessor using an isolation link. This technique allows the
PM3000A to have an extremely high common mode rejection, minimizing the effects
caused by high dv/dt waveforms such as those existing in motor drives etc.
The sampling is under the direct control of the processor and the analogue to digital
conversion for all channels is simultaneous (no phasing errors). The normal measurement
procedure is as follows. (Note that many of the measurements have separate routines).
All channels are sampled at a sample rate set by the microprocessor. The data is stored
in memory until 400 samples for each channel have been made. The data is then
checked for over-range or under range. If the range is correct, the frequency of the input
is calculated. If the sample rate is not right for the input frequency, the sample rate is
adjusted and 400 new samples are taken.
The digital signal processor then calculates the volts, amps and watts etc. for each
channel and then performs a Fourier analysis of the data to compute the fundamental
components of the volts and amps and any other harmonics required.
This data is then transferred to the interface processor and another set of samples is
taken. The interface processor averages and displays the results required for the front
panel display. Further to this all the results for every phase are computed, averaged, and
stored in memory. These background results are available to the IEEE, RS232 and printer
interfaces.
The user can select over 400 different measurements from this store making the
PM3000A an extremely versatile instrument.
P
AGE 1-3

GENERAL DESCRIPTION PM3000A USER MANUAL
PM3000A BLOCK SCHEMATIC
PAGE 1-4

PM3000A USER MANUAL GETTING STARTED
CHAPTER 2
ETTING STARTED
G

GETTING STARTED PM3000A MANUAL

PM3000A USER MANUAL GETTING STARTED
2.1 POWER ON
The instrument is supplied with a power lead to suit the local electricity supply. In some
cases a power plug will need to be fitted: connect brown wire to phase or live pin; blue
wire to neutral pin and green/yellow wire to ground or earth pin. On no account should
the instrument be used without the safety ground being made.
Turn the power on at the front of the instrument.
The display will briefly show 'VOLTECH INSTRUMENTS’ and the firmware version
number, followed by the default display:
0.000 V 0.000 A
Watts = +0.000 W
All the LED indicators will be lit for a short time before the default display is shown and it
is assumed at this stage that no voltage and current inputs are present.
The factory set default display is for a single-phase 2-wire connection (see section 2.3).
Watts, Volts and Amps are displayed for channel 1 (confirmed by the LED indicator below
the [CH1] key. In this display mode the keys for phases 2 and 3, [CH2] and [CH3], as well
as the calculated sum key [∑] and neutral current key [N] are invalid.
(The power on display may have been changed by a previous user. It is possible to
restore the default display by loading the standard program - see section 4.1.1)
Important Note. The PM3000A is a high bandwidth (500kHz) instrument. The standard
and 001 versions of the instrument are fitted with a low bandpass (25 kHz) filter that is
enabled as default.
Version PM3000A-002 has a 5kHz filter to meet requirements of the EN60555-2 and
EN61000-3-2 standards. For high frequency measurements disable the filter as described
in section 5.2.
2.2 USING THE CONTROL KEYS
Although a sophisticated instrument, the PM3000A is extremely easy to configure and
operate. The control keys are all front panel mounted, and are arranged in a manner to
aid intuitive operation of the equipment.
To enable the user to get ‘up and running’ as quickly as possible several of the basic
measuring functions are described below. Greater detail of their operation plus a
description of the remainder of the control keys is covered in the following chapters.
PAGE 2-1

GETTING STARTED PM3000A MANUAL
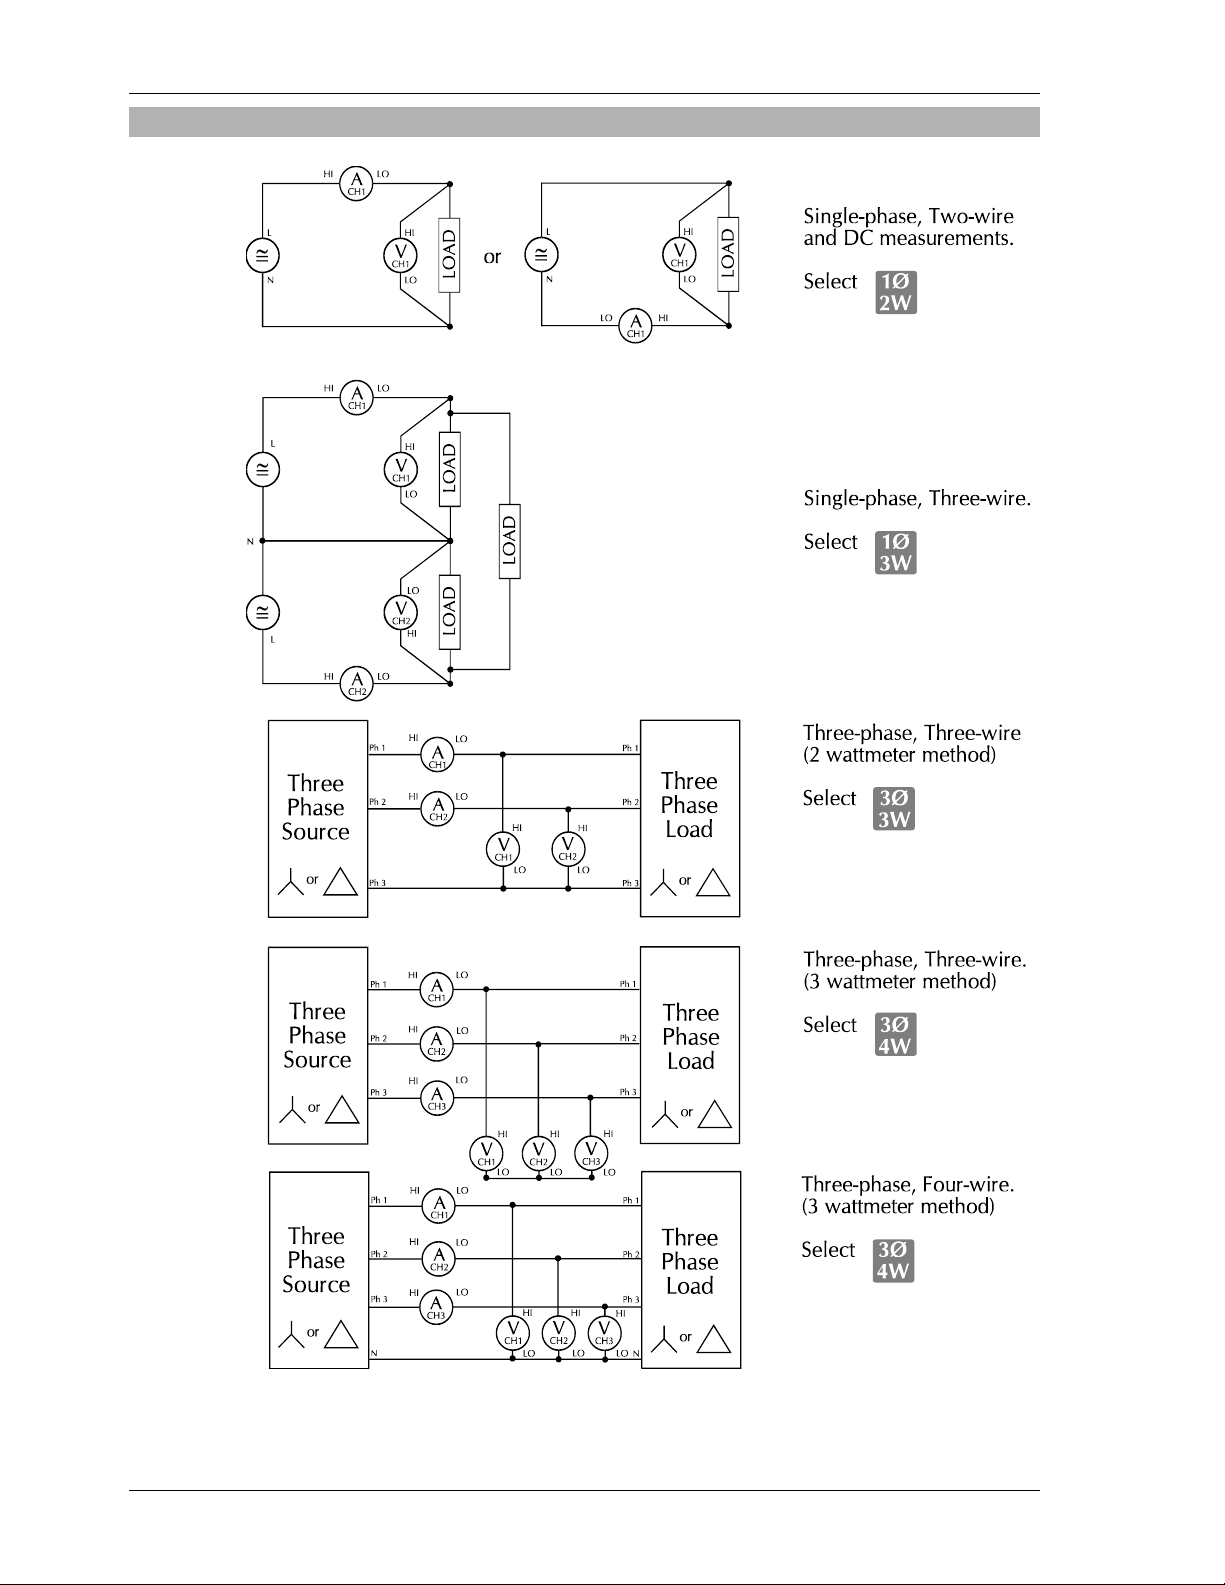
2.2.1 WIRING KEYS
Before meaningful measurements can be made the wiring mode must be selected and
appropriate connections made to the rear panel. The PM3000A is highly versatile and can
be configured to analyze almost any electrical system. This versatility is achieved
because all power inputs are ac + dc coupled and isolated from each other and ground.
The four main wiring modes are:
[1Ø2W] SINGLE PHASE, TWO WIRE.
Select for single phase loads with two-wire distribution system.
[1Ø3W] SINGLE PHASE, THREE WIRE.
Select for single phase loads with three-wire distribution system.
[3Ø3W] THREE PHASE, THREE WIRE.
Select for single-phase loads without neutral connection (two-wattmeter method).
[3Ø2W] THREE PHASE, FOUR WIRE.
Select for single-phase loads with or without neutral connection (three-wattmeter
method).
Refer to section 2.3 for the rear panel connections to be used for each wiring mode.
2.2.2 CHANNEL SELECT KEYS
These keys are used in conjunction with the wiring keys to display the measure values for
the selected phase or channel.
The function of each is as follows:
[CH1] Displays the measured values for the phase connected to channel 1
[CH2] Displays the measured values for the phase connected to channel 2
[CH3] Displays the measured values for the phase connected to channel 3
[∑] Displays the summation (total) value for multiphase systems
[N] Displays neutral currents in multiphase systems. These waveforms are
computed by summation of the instantaneous values of the individual phase
currents.
Information is only displayed if relevant to the wiring mode selected. For example, if
[1Ø2W] has been selected only the [CH1] key will display the measured parameters.
Selecting any of the other four keys will result in the message FUNCTION INVALID being
displayed.
The user is encouraged to assess the effect of selecting combinations of the Channel
Select and Wiring keys.
PAGE 2-2

PM3000A USER MANUAL GETTING STARTED
2.2.3 AUTO KEYS
The PM3000A is a fully auto-ranging instrument, and in most measurement modes the
green LED under the [AUTO] keys for volts and amps should be illuminated. Specific
ranges for voltage or current may be chosen if desired. Use the up and down arrow keys
beneath the appropriate display to select a measurement range. The green LED beneath
the [AUTO] key will be extinguished and the range chosen (volts or amps) indicated by
the red LED panel. If the voltage or current range is set too low an OVERLOAD message
will be displayed.
2.2.4 MEASUREMENT KEYS
The use of the six keys at the top left of the front panel is described below – these are
used for the most common measurements of power systems. Further details of these and
other measurement keys are covered in the following chapters.
2.2.4.1 [W] TRUE POWER
Measures the power absorbed by a load or delivered from an ac source even with
distorted waveforms. The instrument is ac + dc coupled and therefore measures the total
real power.
2.2.4.2 [VA] APPARENT POWER
Determines the apparent power absorbed by a load or delivered from a source.
2.2.4.3 [VAR] REACTIVE POWER
Computes and displays the reactive power flow due to the phase difference between the
current and voltage waveforms and due to waveform distortion.
2.2.4.4 [V] VOLTAGE
Displays the true RMS or mean values of the input voltage(s) even with distorted
waveforms.
2.2.4.5 [A] C
2.2.4.6 [PF] POWER FACTOR
URRENT
Displays the true RMS or mean values of the load current(s) even with distorted
waveforms.
Displays the true power factor of an ac load.
PAGE 2-3
GETTING STARTED PM3000A MANUAL
2.3 CONNECTION DIAGRAMS
PAGE 2-4

PM3000A USER MANUAL BASIC FUNCTIONS
CHAPTER 3
ASIC FUNCTIONS
B

BASIC FUNCTIONS PM3000A USER MANUAL
PM3000A USER MANUAL BASIC FUNCTIONS
=
×
3.1 BASIC MEASUREMENT FUNCTION KEYS
3.1.1 [W] TRUE POWER
Measures accurately the power absorbed by a load or delivered from an AC source, even
with distorted waveforms. The instrument is (AC + DC) coupled (see section 3.2.4), and
therefore measures the total real power.
Connect the PM3000A as shown in the appropriate connection diagram (see section 2.3)
and select [W]. The instrument is fully autoranging and the display will show the actual
power in watts. The polarity indicates the direction of power flow.
Real power is computed as:
T
=
1
vidt
ii
∫
0
T
rms rms
2
()
2
W
v and i represent instantaneous volts and amps
The polarity of Watts, VArs (fundamental) and PF (fundamental) are given in the table
below. The displacement angle is the angle of the current fundamental with reference to
the voltage fundamental.
0º -90º -180º -270º -360º
W + - - +
PF.f - - + +
VArs.f + + - -
For Watts: + indicates positive power flow.
- indicates negative power flow.
3.1.2 [VA] A
Determines the apparent power absorbed by a load or delivered from a source. Connect
the instrument as for power measurements and select [VA]
VA is computed as:
PPARENT POWER
3.1.3 [VAR]-REACTIVE POWER (VOLT-AMPERES)
The PM3000A computes and displays the reactive power flow due to the phase difference
between the current and voltage waveforms and due to waveform distortion.
VAr is computed as:
The polarity of the (fundamental) VArs is shown in the table in section 3.1.1. for various
angles between current and voltage.
For VArs: + indicates an inductive load
- indicates a capacitive load
VA V A
VAr VA W=−
PAGE 3-1

BASIC FUNCTIONS PM3000A USER MANUAL
3.1.4 [V] VOLTA GE
The input is (AC + DC) coupled, (see section 3.2.4) and the instrument will record the
RMS or MEAN (see section 3.2.2) value of the combined AC and DC components. Only
the voltage input leads need be connected for Vrms measurements. Vrms is computed
as:
T
and Vmean is computed as:
V
RMS i
=
T
1
1
MEAN
=
∫
T
∫
T
0
2
vdt
0
dtvV
3.1.5 [A] CURRENT
Only the current input need be connected when taking Arms measurements. Arms is
computed as:
T
and Amean is computed as:
3.1.6 [PF] P
Displays the true power factor of an AC load. Power factor is only cos
waveforms; cos
shift between the voltage and current waveforms). Power factor is computed as:
If the current waveform is distorted, the fundamental components of the voltage and
current may well be in phase, with cos
unity. The PM3000A computes the ratio W/VA, which is the true power factor even for
distorted waveforms. The polarity of the (fundamental) power factor is given in the table of
section 3.1.1 for various angles between current and voltage.
For PF: + indicates a leading current
- indicates a lagging current
NB. The polarity of the power factor can be reversed if desired (see section 6.1).
OWER FACTOR
ø is merely the displacement factor of the load (a measure of the phase
A
RMS i
=
T
1
1
A
MEAN
=
T
PF
ø = 1, but the true power factor will be less than
Watt
=
VA
×
rms rms
∫
0
T
∫
0
2
idt
idt
ø for undistorted
PAGE 3-2

PM3000A USER MANUAL BASIC FUNCTIONS
3.1.7 [VPK], [APK] PEAK VOLTAGE O R CURRENT
These keys display the repetitive peak current or voltage. The peak voltage measurement
is used to determine the working voltage of insulation or the voltage available for
rectification.
The peak current measurement can be used to set current limit or trip levels in UPS or
similar equipment.
3.1.8 [VCF], [ACF] V
Crest factor is the ratio of the magnitude of the peak value to the RMS value of a
waveform.
OLTAGE OR CURRENT CREST FACTOR
CF =
ValuePeak
ValueRMS
The crest factor of a sinewave is √2 or 1.41.
Many loads, such as rectifiers with capacitor filters, produce a distorted current waveform
where the Amps crest factor will be much larger than √2.
3.1.9 [INRUSH A] PEAK INRUSH CURRENT
The [INRUSH A] key allows the user to capture and hold the peak current of all three
current channels. This feature is typically used to display the peak inrush current as
power supplies, motors, etc., are switched-on.
The measurement is made by sampling continuously on all three current channels and
holding the highest value. The sample rate varies according to the wiring configuration.
WIRING SELECTION SAMPLE RATE
Single phase two wire 3.6µS
Single phase three wire 6.8µS
Three phase three wire 6.8µS
Three phase four wire 10.0µS
Inrush current can also be measured using the data log function (see section 9.1). This
has the advantage of allowing the user to view the captured inrush waveforms and of
making other measurements on the same data.
To measure inrush current press the [INRUSH A] key- the display will then be similar to
that shown below.
SET MANUAL RANGE
Inrush = 0.000 A
Using the up and down arrow keys beneath the red LED panel select an amps range that
is able to accommodate the expected peak inrush current. Switch on the load and the
display will show the highest current captured.
PAGE 3-3

BASIC FUNCTIONS PM3000A USER MANUAL
If the load is multi-phase, the inrush current on each phase will have been captured and
can be viewed with the [CH1], [CH2] and [CH3] CHANNEL SELECT keys.
The highest value captured will be held until the [INRUSH] key is pressed again to reset
the display or a higher value is measured. If an overload occurs the display will not clear
until the [INRUSH] key is pressed even if the overload is no longer present. Press another
Function key to return to the previous displays.
3.1.10 [IMPEDANCE]
The impedance of a load can be measured by pressing the [IMPEDANCE] key. The total
impedance will be displayed in ohms, calculated as:
VoltsRMSTotal
Z =
AmpsRMSTotal
If fundamentals have been selected, i.e. the FUND LED is on, the complex impedance
due to the fundamental volts, amps and power factor is displayed.
Z = R + jX Ohms
Only the resistive part, R, of the impedance is displayed on the single function and
multiple channel displays.
+R Indicates power flow into load
-R Indicates power flow from load
+X Indicates inductive reactance
-X Indicates capacitive reactance
3.1.11 [ENTER] TO HOLD THE DISPLAY
When not in a configuration, programming or data entry mode, the [ENTER] key may be
used to hold the value of the parameter in the lower line of the display. The values of
other parameters are also held when [ENTER] is pressed and these may be displayed by
pressing the appropriate control key.
To return to real-time display press [ENTER] again.
3.2 SET-UP KEYS
The SET UP keys control the configuration of the input circuits of the PM3000A. Since
each channel is entirely separate and isolated from each other, the set-up can be different
for each channel when independent channel wiring modes are selected. In normal 3
phase 3 wire or 3 phase 4 wire connection modes, the set-up parameters are linked
together for simplicity.
3.2.1 [FREQ SOURCE]
As part of the operation of the PM3000A the measurement functions are synchronized to
the ac supply frequency. The source of this frequency is selected by means of the [FREQ
SOURCE] key.
[INT] mode synchronizes measurement to input voltage or current over the frequency
range 5Hz to 1MHz. The user can choose between voltage or current frequency
measurement. This feature is useful in applications such as motor drives where one input
may be ‘chopped’.
PAGE 3-4

PM3000A USER MANUAL BASIC FUNCTIONS
[EXT] mode synchronizes measurement to a signal applied to a rear panel connector. It is
typically used when both voltage and current are ‘chopped’, or when frequencies as low
as 0.1Hz are required to be measured.
Options
There are four options. Use the [SELECT] key to display the required option and then
press [ENTER]:
i. >voltage<: CH1 Volts with a frequency range of DC and (5Hz -1MHz)
ii. >current<: CH1 Amps with a frequency range of DC and (5Hz -1MHz)
iii. >external<: Frequency source applied to EXTERNAL FREQUENCY input, with a
iv. >slow external<: Frequency source applied to EXTERNAL FREQUENCY input,
The maximum voltage to be applied to the EXTERNAL input is limited to 10Vrms.
Phase Reference
If voltage is selected, the phase reference source is automatically set as the Voltage
Waveform of CH1.
If current, external or slow external have been selected, the display then shows:
range of DC and 5Hz -1MHz.
with a range 0.1Hz-100Hz. Selecting this mode will give measurement times in
excess of 10 seconds for frequencies under 5Hz
PHASE REFERENCE
By pressing [SELECT] the user can switch between voltage and current as the phase
reference source for harmonic analysis. Press [ENTER] to confirm the selection. Either
the red or green LED beneath the [FREQ SOURCE] key will illuminate to indicate the
status.
3.2.2 [VOLTS AMPS] RMS OR MEAN
The PM3000A can display voltage and current in either true RMS or rectified mean
values.
RMS mode is the default and this is indicated by the corresponding LED beneath the key.
In the mean mode voltage, current and amp hours only are displayed as rectified mean
values. All other parameters are displayed as RMS. However when printing results all
values are printed as RMS.
3.2.3 [AVG] AVERAGING
The PM3000A will average a number of measurements to display a steady reading
despite fluctuations at the inputs. The results to be averaged are placed in an averaging
store of user-defined length. When a new result is added to the store the oldest result in
the store is discarded.
>Voltage<
PAGE 3-5

BASIC FUNCTIONS PM3000A USER MANUAL
In AUTO mode the instrument will average the last 16 results. If a large change occurs at
the input the averaging store is reset (all values are made zero) and only new data is
averaged. This gives a fast response to large input changes. The number of results
averaged (the ‘averaging depth’) in AUTO mode can be changed by using the
configuration keys [F],[P] 38 (see section 6.1). (For independent wiring modes, [F],[P] 58
and [F],[P] 78 set the AUTO averaging depth for CH2 and CH3 respectively.)
In FIXED mode the instrument performs averaging as before, but large changes at the
input will not reset the averaging store. This can be useful when measuring an input,
which contains large voltage spikes for example.
To make a selection, press the [AVG] key. Choose >fixed< or >auto reset< with the
[SELECT] key and press [ENTER]. If fixed averaging has been chosen the green LED
next to ‘N’ beneath the [AVG] key will illuminate. Next enter an averaging depth using the
digit keys and press [ENTER].
The averaging store can be reset by pressing the channel key for the measurement
currently selected. For example, if Watts is currently selected, pressing the [W] key resets
the averaging store. Zeros are temporarily displayed for all measurements before new
averaged values are displayed.
3.2.4 [COUPLING] INPUT COUPLING
AC + DC coupling is normally selected. The PM3000A computes results due to all
components in the input voltage and current including DC and low frequency components
in this mode.
AC coupling the instrument means that DC and low frequency components are ignored.
This is useful measuring the ripple voltage on rectifier outputs, and for calibration of
instruments that are only AC coupled.
Press the [COUPLING] key to toggle between AC + DC coupling and AC coupling only.
3.2.5 [SHUNT] SHUNT SELECTION
This key switches between internal (INT) and external (EXT) shunt selection.
INT mode is selected for direct measurement of ac and dc currents up to 30A rms and
uses signals from precision internal shunts in the PM3000A. This mode is also used with
ac current transformers.
EXT mode is used when taking current measurements with external high current shunts,
dc current transformers or other devices providing a voltage signal that is proportional to
current.
3.2.6 [SCALING]
Scale factors for the voltage and current input on all three channels can be entered. If
1000:1 current transformers are being used, for example, use a current scale factor of
1000 UP to make the PM3000A display the actual currents, watts, etc.
If a wiring configuration other than 1Ø2W is used scaling can be locked (the same scaling
on all channels) or independent. Press the [SCALING] key. Choose >locked< or
>independent< voltage scaling using the [SELECT] key and press [ENTER] to confirm the
setting. Enter a voltage scale factor (if required) using the numeric keys and press
[ENTER] to confirm the setting.
PAGE 3-6

PM3000A USER MANUAL BASIC FUNCTIONS
If you have chosen independent scale factors you are then prompted for the CH1, CH2,
and CH3 scale factors.
Next choose >locked< or >independent< current scaling, and then enter a scale factor in
the same manner if required. If a current scale factor other than 1.0 is entered, the display
then shows:
CURRENT SCALING
>up<
Pressing [SELECT] switches between >up< and >down<. Choose >up< to multiply the
measured current by the scale factor or >down< to divide the measured current by the
scale factor. Press [ENTER] to confirm the setting.
A scale factor of 100 down is equivalent to 0.01 up. If you return to this menu, the scale
factor is always displayed as the equivalent >up< scale factor.
3.2.6.1 SCALING THE EXTERNAL SHUNT
The external shunt input has a range of 0 to 2.5V peak. This corresponds to 12.5mV per
amp (2500mV = 200A). If for example a 0.1Ω external shunt is used, this will generate
100mV per Amp. The current scale factor must be set to 8.0 'down' to obtain the correct
display.
AmpmV
/100
AmpmV
/5.12
The formulae for UP and DOWN scaling are as follows:
SF
=
UP DOWN
If you return to this menu, the scale factor is always displayed as the equivalent 'up' scale
factor. If 8.0 'down' were entered, the display will show a SF of 0.125 the next time this
menu is accessed.
5.12
AmpmVActual
/
down
8
=
SF =
/ AmpmVActual
5.12
3.2.7. [DISPLAY] DISPLAY FORMAT
Using this key allows the user to specify the measurements to be shown in each part of
the display. If multi-channel measurements are being made it is possible to display
simultaneously the results for all channels plus the sum. Examples of use are provided
below.
3.2.7.1. S
INGLE FUNCTION DISPLAY
Press the [DISPLAY] key and use the [SELECT] key to show the following display:
DISPLAY FORMAT
>single<
PAGE 3-7

BASIC FUNCTIONS PM3000A USER MANUAL
Press [ENTER] to select this display mode. The display will be similar to the following:
UPPER RIGHT DISPLAY
>Arms<
Press the required function key (at the top left of the front panel) to choose the required
parameter for display. The allowed keys are [V], [A], [W], [VA], [FREQ], [PF], [Vpk] and
[Apk]. The lower line of the display will change to show the selected parameter. Press
[ENTER] to confirm, and then repeat this procedure for the upper left display.
The display will reconfigure to show the selected measured parameters on the upper line.
(The lower line may be changed simply by pressing the required function key).
3.2.7.2 MULTIPLE FUNCTION DISPLAY.
To display measure parameters for all channels first select the [3Ø4W] key, the Channel
Select key [∑] and the required function key, for example [W]. Press the [DISPLAY] key
and use the [SELECT] key until the display is as shown below:
DISPLAY FORMAT
>multiple<
Press [ENTER] to select this option and the display will be similar to:
+0.000 +0.000 +0.000
Watts = +0.000 W
The three numbers on the top row correspond to CH1, CH2 and CH3 respectively and the
bottom row shows the sum of the Watts. Other function keys may be pressed to indicate
their values but note that not all are valid for a multiple display.
3.2.7.3 FOUR FUNCTION DISPLAY.
Press the [DISPLAY] key and use the [SELECT] key until the display is as shown below:
DISPLAY FORMAT
Press [ENTER] to select this option and then choose the parameters to be displayed in a
manner similar to that for single function display. Note that not all are valid for the four
function display.
3.2.8 [CLOCK SET] DATE AND TIME
The date and time may be changed by the user. To do this, press the [CLOCK SET] key.
Use [SELECT] to switch between >accept< and >change< and then press [ENTER]. If
changing the current date and time use the digit keys to enter new values in the format
shown. Press [ENTER] after each entry and again to >accept< the revised date and time.
PAGE 3-8
>four function<

PM3000A USER MANUAL BASIC FUNCTIONS
3.3 HARMONIC ANALYSIS
The PM3000A will measure the harmonic content of the voltage and current waveforms
for all components up to the 99th harmonic. It will also analyze the current flowing in the
neutral wire of a 3 phase 4-wire system and calculate any DC components.
A specially designed mode is incorporated for testing to EN60555 and EN61000-3. Flicker
and fluctuating harmonics as well as steady state harmonics can be measured in the
IEC555 mode. (See section 5.6).
The VPAS Demo software supplied can be used to display and print harmonic barcharts
(see section 10.8).
Harmonic measurements can be made at any frequency within the bandwidth of the
instrument.
3.3.1 [V HARM] VOLTAGE HARMONIC
Press the [V HARM] key. Enter the required harmonic using the number keys followed by
[ENTER]. Use [SELECT] if you make a mistake during number entry. The chosen
harmonic amplitude is displayed.
For harmonic 0 (DC component) and harmonic 1 (fundamental) the absolute value of the
amplitude is displayed, for other harmonics (up to 99) the harmonic amplitude is displayed
as a percentage of the fundamental. To display harmonics 2 to 99 as absolute values use
[F],[P]18 (see section 6.1).
To view another harmonic press [V HARM] again and repeat the above procedure, or
press [ENTER] for the next highest order harmonic. Harmonic phase information is not
displayed in the multiple channel display.
To get a printout of all harmonics up to a pre-set limit, use the printer selection menu (see
section 8.1.). Watts harmonics can also be selected for print if both volts and current
harmonics are selected.
3.3.2 [A HARM] CURRENT HARMONIC
Press the [A HARM] key. Enter the required harmonic using the number keys followed by
[ENTER]. Use [SELECT] if you make a mistake during number entry. The chosen
harmonic amplitude is displayed.
For harmonic 0 (DC component) and harmonic 1 (fundamental) the absolute value of the
amplitude is displayed, for other harmonics (up to 99) the harmonic amplitude is displayed
as a percentage of the fundamental. To display harmonics 2 to 99 as absolute values use
[F],[P]18 (see section 6.1).
To view another harmonic press [A HARM] again and repeat the above procedure, or
press [ENTER] for the next highest order harmonic. Harmonic phase information is not
displayed in the multiple channel display.
To get a printout of all harmonics up to a pre-set limit, use the printer selection menu (see
section 8.1). Watts harmonics can also be selected for print if both volts and current
harmonics are selected.
PAGE 3-9

BASIC FUNCTIONS PM3000A USER MANUAL
(
3.3.3 [V THD] VOLTA GE HARMONIC DISTORTION MEASUREMENTS
The distortion factor of the voltage waveform can be measured by pressing the [V THD]
key. The result is obtained by the calculation:
22
−
df
RMS H
=
1
)
×
100%
REF
where REF is normally the fundamental component. It can be set to RMS (see [F],[P] 17,
section 6.1). This method is known as the ‘difference formula’.
This measurement takes into account all distortion including noise and DC offsets. This
will give very good results with waveforms having greater than 2% distortion.
An alternative method which works well with any distortion level, is to measure individual
harmonics and calculate the total harmonic distortion with the formula:
thd H H H H=++++2345
where H2 is the 2nd harmonic percentage of reference and H3 is the third harmonic
percentage of the chosen REF value.
The default for the front panel display values is the difference formula. This can be
changed to ‘harmonic series’ (THD) value by using [F],[P] 16 (see section 6.1).
2222
....
3.3.4 [A THD] CURRENT HARMONIC DISTORTION MEASUREMENTS
The distortion factor of the current waveform can be measured by pressing the [A THD]
key. The calculation method is similar to that described in section 3.3.3 above.
3.3.5 [FREQ] F
Press the [FREQ] key to display the fundamental frequency of the AC input.
This frequency is used as the basis for harmonic analysis. Frequency is derived from the
volts, amps or external source - see [FREQ SOURCE] (section 3.2.1). In 1Ø2W, 1Ø3W,
3Ø3W, and 3Ø4W wiring modes, the frequency source is channel 1. In independent CH3
wiring, the frequency source for channels 1 and 2 is CH1, and for channel 3 it is CH3. For
all other wiring modes, the frequency source is its respective channel.
REQUENCY
3.3.4 [FUND] FUNDAMENTAL VALUES
The PM3000A normally displays measurements as true RMS values. This takes into
account all harmonics, noise, offsets, etc. that can be measured within the bandwidth of
the instrument.
When the [FUND] key is pressed, results are displayed which are calculated from the
fundamental components of voltage and current only. For example, the fundamental
power factor displayed cos Ø, is the phase shift between the voltage and current
fundamentals.
PAGE 3-10

PM3000A USER MANUAL PROGRAM SET-UP
CHAPTER 4
ROGRAM SET-UP
P

PROGRAM SET-UP PM3000A USER MANUAL

PM3000A USER MANUAL PROGRAM SET-UP
4.1 PROGRAMMING
Up to five set-ups can be stored in the PM3000A's non-volatile memory. Any of the five
programs may be loaded on power up to configure the instrument automatically to a
particular set-up. All settings are stored when a set-up is saved.
The [P] button can also switch the instrument from the P[1] set-up to the P[2] set-up if the
PROGRAM SWITCH function is enabled. (See section 5.5).
To save a set-up, press the [P] key. Use the [SELECT] key to choose >save program<
and press [ENTER]. The next display shows >Program 1-5<. Press [ENTER] to continue
(or [SELECT] to quit). Then select the required program number with the digit keys and
press [ENTER]. The current configuration will be stored as the program selected in nonvolatile memory. This is powered by a lithium battery with a life of at least five years.
4.1.1 TO LOAD A STORED SETUP
Press the [P] key. Use the [SELECT] key to choose >load program< and press [ENTER].
The next display offers the choice of >standard<, >program 1 to 5< or >Quit<. Using the
[SELECT] key, choose >standard< for power-up configuration, or >program 1 to 5< for a
programmed configuration. Press the [ENTER] key to confirm the setting.
If >program 1 to 5< is selected, the next display allows choice of the program number.
Enter the number using the digit keys and press [ENTER]. The set-up will be loaded. If no
program has ever been loaded into that store or the data has been corrupted, the load will
be cancelled and the program will exit the menu.
4.1.2 TO SET THE POWER ON DEFAULT
The contents of any of the five program stores P1 - P5, or the power down setting, can be
made the power on default set-up. To do this, press the [F] key. Use the [SELECT] key to
display the following:
F[1] P. ON DEFAULT
Press [ENTER] and then use [SELECT] to display >standard<, >program 1-5< or >power
down<. Press [ENTER] to confirm the choice. If >program 1-5< is selected, then enter the
program number using the digit keys and press [ENTER] again. Until the default is
changed back to 'standard', the PM3000A will power up with the set-up stored in the
program number selected.
4.1.3 TO PRINT A PROGRAM SET-UP
The program configuration currently in use can be printed at any time. To print any other
program set-up it must first be loaded.
To print, press [P], then use the [SELECT] key to display >print program<. Press [ENTER]
and select >yes<. The configuration will then be printed.
<select> or <enter>
PAGE 4-1

PROGRAM SET-UP PM3000A USER MANUAL
************************************************************
PM3000 configuration data
operating mode 1
program switch off
1 phase 2 wire
wiring lock on
phase lock on
function selection 00000001 10000001 11110000 11111111
target power factor +1.000
pre-averaging time 5
fixed frequency 60.00
channel control 10001000 00110001 00000000
voltage range auto
current range auto
averaging 16 auto
voltage scale +1.000
current scale +1.000
harmonic control 00000100
maximum harmonic 7
printer control 00000000 10100001
integrator control 00000001
datalog control 00000001
datalog window 0
IEEE address 10
RS232 baud rate 9600
1
****************************************
There are 6 items of information marked on the printout that require further explanation.
They are:
1. Function Selection
2. Channel Control
3. Harmonic Control
4. Printer Control
5. Integrator Control
6. Datalog Control
PAGE 4-2

PM3000A USER MANUAL PROGRAM SET-UP
1. Function Selection
xxxxxxxx xxxxxxxx xxxxxxxx xxxxxxxx
bit 31 bit 0
bit 0 Watts selected
bit 1 VA selected
bit 2 VAr selected
bit 3 Vrms selected
bit 4 Arms selected
bit 5 Power factor selected
bit 6 V peak selected
bit 7 A peak selected
bit 8 V crest factor selected
bit 9 A crest factor selected
bit 10 Not used
bit 11 impedance selected
bit 12 W hours selected
bit 13 VA hours selected
bit 14 VAr hours selected
bit 15 A hours selected
bit 16 Average PF selected
bit 17 Correction VArs selected
bit 18 Efficiency selected
bit 19 Voltage harmonics selected
bit 20 Current harmonics selected
bit 21 Voltage THD selected
bit 22 Current THD selected
bit 23 Frequency selected
bit 24 Channel 1 selected
bit 25 Channel 2 selected
bit 26 Channel 3 selected
bit 27 Sum channel selected
bit 28 Neutral channel selected
bit 29 Fundamentals selected
bit 30 Watt harmonics selected
bit 31 Not used
2. Channel Control
xxxxxxxx xxxxxxxx xxxxxxxx
bit 23 bit 0
bit 0&1 Freq source: 0 = voltage
1 = current
10 = external
11 = slow external
bit 2 Slow sampling enabled
bit 3 Fast mode
bit 4 Jitter fixed
bit 5 Frequency fixed
bit 6 Voltage range fixed
bit 7 Current range fixed
bit 8 Filter on
bit 9 Not used
bit 10 Rectified mean enabled
bit 11 Fundamentals enabled
bit 12 Jitter enabled
bit 13 AC coupled
bit 14 External shunt selected
bit 15 Current phase reference
bit 16 Ballast/ultrasonic mode
bit 17 Ballast/ultrasonic mode
bit 18 Fixed sample rate
bit 19 Autozero enabled
bit 20 PWM mode
bit 21 PWM mode
bit 22 Not used
bit 23 Channel enabled
3. Harmonic Control
xxxxxxxx
bit 7 bit 0
bit 0 Harmonic reference = rms
bit 1 Harmonic display = absolute
bit 2 Even harmonics in series
bit 3 not used
bit 4 Series thd formula
bit 5 DC included in thd
bit 6 not used
bit 7 not used
PAGE 4-3

PROGRAM SET-UP PM3000A USER MANUAL
3. Printer Control
xxxxxxxx xxxxxxxx
bit 15 bit 0
bit 0 manual trigger
bit 1 external trigger
bit 2 timed trigger
bit 3 not used
bit 4 not used
bit 5 printer port = RS232
bit 6 print selection
bit 7 printer enabled
4. Integrator Control
xxxxxxxx
bit 7 bit 0
bit 0 manual trigger
bit 1 external trigger
bit 2 timed trigger
bit 3 cyclic interval
5. Datalog Control
xxxxxxxx
bit 7 bit 0
bit 0 manual trigger
bit 1 external trigger
bit 2 timed trigger
bit 3 cycle by cycle
bit 8 logic output 1
bit 9 logic output 2
bit 10 logic output 3
bit 11 logic output 4
bit 12 logic output 5
bit 13 not used
bit 14 not used
bit 15 not used
bit 4 averaged integration display
bit 5 reset accumulators after print
bit 6 not used
bit 7 integrator enabled
bit 4 not used
bit 5 not used
bit 6 not used
bit 7 not used
PAGE 4-4

PM3000A USER MANUAL THE FUNCTION MENUS
CHAPTER 5
HE FUNCTION MENUS
T

THE FUNCTION MENUS PM3000A USER MANUAL

PM3000A USER MANUAL THE FUNCTION MENUS
5.0 THE FUNCTION MENUS
The Func [F] key can be used to configure the PM3000A into special operating modes for
a wide number of application areas including:
PWM motor drives
High-frequency electronic ballasts
Testing to EN60555 parts 2 and 3 and EN61000-3
Transformer testing to IEC76-1
The function system also accesses other PM3000A configuration menus including the
calibration menu.
The function structure and operation are described below in the same numerical order in
which they appear on the PM3000A.
5.1. F[1] POWER ON DEFAULT
The contents of any of the five program stores P1 - P5, or the power down setting, can be
made the power on default set-up. To do this, press the [F] key. Use the [SELECT] key to
display the following:
F[1] P. ON DEFAULT
<select> or <enter>
Press [ENTER] and then use [SELECT] to display >standard<, >program 1-5< or >power
down<. Press [ENTER] to confirm the choice. If >program 1-5< is selected, then enter the
program number using the digit keys and press [ENTER] again. Until the default is
changed back to 'standard', the PM3000A will power up with the set-up stored in the
program number selected.
5.2. F[2] BANDWIDTH
The power-up default is >low< i.e. filter enabled:
25 kHz for 001 and standard models
5 kHz for 002 models
This option allows the user to select the full 1MHz bandwidth by selected >high<.
5.3. F[3] WIRING
Various wiring modes are available to suit the various input connections that can be made
by the user (see Connection Diagrams - Section 2.3). All the voltage and current inputs
are isolated from each other and from ground.
PAGE 5-1

THE FUNCTION MENUS PM3000A USER MANUAL
Connection to the PM3000A voltage channel inputs is via 4mm sockets on the rear panel
of the instrument. Currents up to 30A RMS may be connected directly to similar rear panel
sockets. For higher current measurement, use either a current transformer to reduce the
current presented to the PM3000A, or an external shunt to derive a voltage input suitable
for the external shunt input. Four wiring keys are provided on the front panel to allow
convenient access to these modes of operation. These and other modes may also be
accessed via the menu system as follows:
Press the [F] key and then use [SELECT] until the display is as shown below:
F[3] WIRING
<select> or <enter>
Press [ENTER] to display the Wiring Configuration options. Use the [SELECT] key to cycle
through the options and press [ENTER] to confirm the required setting. The options are
covered in more detail below.
5.3.1. 1 PHASE 2 WIRE
Select for single-phase loads on a 2-wire distribution system. Also use to measure the
output of a rectifier stage. Connect to channel 1.
5.3.2. 1 P
Select for three-wire, single-phase distribution systems. Connect to channels 1 and 2.
HASE
3 W
IRE
5.3.3. 3 PHASE 3 WIRE
Select for three phase measurements where there is no neutral connection (two wattmeter
method). The current in the [N] channel is computed by summation of the instantaneous
phase currents. In this way Arms, Amean, Apk, Acf and Amps harmonics can be displayed
for the 3rd wire. They are displayed as neutral current measurements. Total watts, volts,
etc. for CH1 and CH2 are displayed as ∑ values. Connect to channels 1 and 2.
5.3.4. 3 PHASE 4 WIRE
Select for three phase measurements with or without a neutral connection (three wattmeter
method). The current in the neutral wire is computed by summation of the instantaneous
phase currents. In this way Arms, Amean, Apk, Acf and Amps harmonics can be displayed
for the neutral wire. Total watts, volts, etc. are displayed as ∑ values.
5.3.5. CHANNEL 3 ONLY
Select for single-phase measurements on channel 3.
5.3.6. C
Select for single-phase measurements on channel 2.
HANNEL 2 ONLY
PAGE 5-2

PM3000A USER MANUAL THE FUNCTION MENUS
5.3.7. INDEPENDENT CH3
Channel 3 will operate completely independently of the other channels. For example, use
in conjunction with 3-phase, 3-wire mode for taking simultaneous input and output
measurements on 3-phase rectifier assemblies.
5.3.8. ALL INDEPENDENT
All three channels operate completely independently of each other. Each channel
operates as a completely independent power analyzer, sourcing its own frequency, and
selecting ranges and set-up functions.
5.3.9. P
When voltage measurements are made by the PM3000A, the value displayed is normally
the voltage across the Vhi and Vlo inputs. In the case of three-phase, four-wire, multiphase measurements (three watt meter), this voltage is normally the phase to neutral
volts. In other cases, the required voltage is the phase-to-phase voltage.
When wiring is set to 3∅ 4W mode, an additional menu allows the PM3000A voltage
display to be configured to display phase to phase measurement. Select 3∅4W in the
wiring menu to achieve this.
The voltage readings will be from phase to phase, computed vectorially from the phase to
neutral data.
HASE TO PHASE VOLTAGE
5.4 F[4] EFFICIENCY
The PM3000A can be configured to calculate efficiency, using a combination of power or
apparent power between any two channels, or between a 3-phase 3-wire measurement
and CH3. Press the [F] key and use [SELECT] and [ENTER] to choose F[4]
‘EFFICIENCY’ mode. The display is as follows:
Select >enabled< to give the following display:
Use [SELECT] and [ENTER] to choose the channels to calculate the efficiency from:
EFFICIENCY
>disabled<
EFFICIENCY FORMULA
>ch3/sum<
>ch3/sum<
>sum/ch3<
>ch1/ch3<
>ch2/ch3<
>ch1/ch2<
PAGE 5-3

THE FUNCTION MENUS PM3000A USER MANUAL
Then use [SELECT] and [ENTER] to choose the units for calculation from:
>Watts/Watts<
>VA/VA<
>Watts/VA<
>VA/Watts<
If required, the efficiency can then be scaled to suit the application using the digit keys
followed by [ENTER]. When the [FUND] key is pressed, the efficiency is calculated from
the fundamental values of WATTS and/or VA.
When efficiency is enabled, independent CH3 is set-up, irrespective of the previously
selected wiring mode. The efficiency units, formula, and scaling are printed when Watts
and VA are selected for printout.
5.5 F[5] PROGRAM SWITCH
The program switch facility enables two stored set-ups to be alternatively loaded with a
single key press. To use, save the first set-up in P[1] and reconfigure the instrument for
the second set-up; save this in P[2]. Press the [F] key and use [SELECT] and [ENTER] to
choose F[5] ‘PROGRAM SWITCH’ mode. Use [SELECT] and [ENTER] to switch the
option >on<.
Pressing the [P] key now switches the configuration between set-up P[1] and set-up P[2].
To restore the [P] function to normal operation, repeat the above procedure, selecting
PROGRAM SWITCH >off<.
N.B. The Program Switch does not change integrator, chart recorder or datalog functions.
5.6. F[6] IEC555 TESTING MODE
The EN60555 and EN61000-3 standards provide limits for the magnitude of harmonics
that can be generated by equipment connected to the public low voltage system. It
defines these limits for steady state harmonics and fluctuating harmonics. Voltage
fluctuations that cause flicker in lighting equipment are also limited by the standard. It
further defines the requirements of the measuring instrument and the method by which
the measurements are made.
To simplify measurements to EN60555 and EN61000-3, Voltech recommends the use of
the ‘Windows’ based PC software that is available for the PM3000A power analyzer as
listed in the accessories section of this manual (page 1-2). This software is available from
your supplier, and comes complete with its own user manual.
For steady state (fixed) harmonics, the PM3000A harmonic measurement mode normally
meets these criteria. Special operating modes are included to meet the requirements of
fluctuating harmonics and voltage fluctuation measurement. See Voltech Application Note
104 for more details.
To select this mode, press the [F] key and use [SELECT] and [ENTER] to choose F[6]
‘IEC555 TESTING’.
PAGE 5-4

PM3000A USER MANUAL THE FUNCTION MENUS
The options available are:
>Disable<
>Fixed Harmonics<
>Fluctuating Harmonics<
>Changing Voltage<
>Flickermeter<
Use the [SELECT] and [ENTER] keys to choose the desired measurement mode.
5.6.1 FIXED HARMONICS
There are various classes of EN60555 and EN61000-3-2 Limits. Each of these limits is
applicable to certain types of equipment, such as, balanced 3 phase, portable tools,
lighting, motor driven or other.
The equipment under test has met the IEC555 specification of fixed harmonics, if the
appropriate limits are not exceeded.
Selecting this mode automatically sets up the printer output for 40 current harmonics
(AH1-AH40), Watts and Power Factor. Press [DATADUMP] to print the selection to the
printer. Refer also to our EN60555/61000-3 Test Software Disk, which provides bargraphs
with IEC limits, and captured waveform display.
5.6.2 F
Fluctuating harmonics mode continuously measures the current harmonics of the
equipment under test over a set period of time.
The harmonic levels are tested against the appropriate class limits and against a second
set of limits, which are 1.5 × class limits for the set period of time.
If any harmonic exceeds the second set of limits at any time during the test period, the
unit under test has failed the test. If any harmonics exceed the first set of limits for more
than 15 seconds (10%) over any 2.5-minute interval, it has failed the test and does not
meet the IEC specifications for fluctuating harmonics.
To choose this mode of analysis, select >fluctuating harmonics< and then press [ENTER].
The display then shows:
LUCTUATING HARMONICS
IEC555 MODE
Freq = xx.xx
Select the appropriate display harmonic by pressing [A HARM], the digit keys and
[ENTER]. The harmonics can be stepped through using [SELECT].
Refer also to our EN60555/61000-3 Test Software Disk which provides a real time
bargraph of fluctuating harmonics with IEC limits, and graphs of single harmonic levels
over time.
PAGE 5-5

THE FUNCTION MENUS PM3000A USER MANUAL
5.6.3 CHANGING VOLTA G E
Flicker is defined as the fluctuating luminance of lighting equipment caused by voltage
fluctuations on the supply system to which it is connected.
Changing Voltage is a method of measuring ‘flicker’ to EN60555-3 and is suited to
measurements where the load is changing regularly.
The EN60555 Standard 555-3 stipulates limits for voltage disturbances in the supply
system that can be caused by household (and similar) electrical equipment. The limits are
defined in the graph below. This shows the magnitude of the maximum permissible
percentage voltage changes (∆U/U), with respect to the allowed number of voltage
changes per minute (R).
In addition, the total ‘accumulated memory time’ should not exceed the duration of the
observation period. Memory time is a concept defined by the standard.
The "power measurement" technique is used, in which the in-phase and quadrature
components of current are measured to define the size of the voltage disturbance.
Connect and power-up the load under test to the CH1 inputs. Selecting this option causes
the display to report the MEMORY TIME. This will accumulate in value over the
observation period, for the voltage fluctuations detected. At the end of the test period,
pressing the [DATADUMP] key will automatically cause a print-out of the total memory
time, elapsed time, and the number of occurrences for each size of voltage fluctuation
(∆U/U), from 0.1% to >3% (40 bins in all). These can then be checked according to the
graph for IEC555-3 to assess compliance. For more guidance, refer to our Application
Note 104.
5.6.4 FLICKERMETER
Flickermeter is the preferred method of measuring flicker to EN60555/61000-3-3, and is
suited to measuring flicker where the load is either changing regularly or varying
irregularly.
The IEC 868 Flickermeter simulates the Lamp-Eye-Brain Chain; the basis upon which an
acceptable level of disturbance to the supply caused by a piece of equipment was
decided.
PAGE 5-6

PM3000A USER MANUAL THE FUNCTION MENUS
The Flicker Meter produces flicker values of Pst or Pst and Plt where:-
Pst is the short term flicker severity evaluated over a short period (in minutes) and:
is the long-term flicker severity evaluated over a long period (a few hours), using
Plt
successive Pst values.
IEC set limits for Pst=1 and Plt=0.65 where a Pst > 1, or Plt > 0.65 indicates that the
equipment under test causes flicker that exceeds the acceptable level.
The PM3000A can measure flicker by the Voltage Method, which provides full compliance
testing, and by the Current Method, which is not part of the IEC 868 Flickermeter
Standard, but provides very effective pre compliance testing.
5.6.5 FULL-COMPLIANCE TESTING
Equipment Required:
AC Power Source.
Source Impedance.
PM3000A
PC
Printer.
Note 1: The AC power source must meet stability and distortion requirements of the
EN60555/61000-3-3 standards.
Note 2: Source Impedance of R=0.4Ω, X=0.25Ω must meet specification of the
standards.
The PM3000A monitors the voltage fluctuations and performs a series of filter functions
(digitally), to produce an instantaneous flicker level. This flicker level is classified into
1024 logarithmically scaled ‘Bins’ to provide a 1024 level classifier.
At the end of the observation period, the PC reads the values in the ‘Bins’ and creates a
‘Cumulative Probability Function’, representing the probability of exceeding a particular
flicker level for a given percentage of the observation time.
The PC will then calculate values of Pst and Plt from equations defined in this standard.
5.6.6 PRE-COMPLIANCE TESTING
Pre Compliance testing does not require a Source Impedance as the measurement is
made by the fluctuating current taken by the load.
Operation is the same, except that the PM3000A determines the fluctuating voltage by
calculating the instantaneous voltage drop across a Standard Source Impedance (as set
in flickermeter menu), and subtracting this calculated voltage drop from the voltage seen
by the PM3000A.
PAGE 5-7

THE FUNCTION MENUS PM3000A USER MANUAL
5.6.7 VOLTAGE DEVIATION TESTS
The Flickermeter technique provides an excellent assessment of continuous voltage
changes. However, a load that causes a single or very occasional large voltage change
will have only a small effect on the Pst/Plt measurement, yet this large voltage change will
have a disturbing effect on lamps.
Because of this, measurements of voltage deviations are made throughout the
observation period by the PM3000A, and the percentage value displayed is the largest
change in voltage seen during observation.
A steady state voltage that undergoes a voltage change (dmax), exceeding the limit dc%
for a time dt seconds (but staying within the limit dmax%), before returning to a second
steady state dc voltage level (which is less than dc%, with dt being less than 200ms), will
pass the dc, dmax, and dt voltage deviations test.
5.6.8 IEC1000-3 SOFTWARE FOR WINDOWS
This versatile software package greatly simplifies the task of making the measurements
that qualify a product under test to the specification EN61000.
The software runs on a PC and works with your Voltech PM3000A Power Analyzer and
the programmable ac source of your choice. The test equipment may be connected to the
PC using either an RS232 or IEEE488 interface.
The software allows you to quickly set up the tests to be done, and controls the ac source
and Power Analyzer to make the measurements. It then reads back the measurement
data, and presents the results in easy-to-read tables and graphs, including comparisons
with the specification limits and highlighting the Passes and Fails.
When the test is finished, all results can be archived to disk, printed or passed on to
another application, for example to be included in a document produced by a word
processor.
5.6.8.1 INSTALLATION
To enable this software to install and run correctly, please ensure that your PC and
relevant hardware conforms to the specifications outlined as follows.
PAGE 5-8

PM3000A USER MANUAL THE FUNCTION MENUS
5.6.8.2 PC REQUIREMENTS
PC: 486 DX. or higher
At least 4Mb
RAM:
Disk: 1Mb of hard disk space for program installation, plus at least 1Mb for
recording test data
(The requirements for each type of test are as follows:
Waveform capture: 1.5kb per waveform
Steady State Harmonics: 1kb per measurement
Fluctuating Harmonics: 7Mb per hour
Flicker: 5kb per 10 minutes)
Windows: Version 3.1 or higher
5.6.8.3 IEEE 488 INTERFACE CARDS SUPPORTED
All current National Instruments cards supporting 488.2 protocols
5.6.8.4 INSTALLING THE SOFTWARE TO YOUR PC
1) Insert the 3½ inch disk into drive A on your PC.
2) From the Windows Program Manager, using the mouse
- Pull down the File menu
- Click on Run
3) In the Run dialogue box, on the Command Line type
a:\setup, and click on the OK button.
4) Follow the on-screen prompts.
The default directory for the IEC1000 for Windows software is C:\IEC1000. You may
choose an alternative drive / directory, when prompted, during the installation process.
(For more information on installation, please refer to the IEC1000-3 User Manual.)
5.6.8.5 S
ETTING UP YOUR
IEEE488
INTERFACE CARD
.
Initially, refer to the user manual supplied with your IEEE488 interface card for the
recommended procedures for installation and set-up of the card in your PC. If there is any
difficulty, please refer to the IEC1000 software on-line help.
PAGE 5-9
THE FUNCTION MENUS PM3000A USER MANUAL
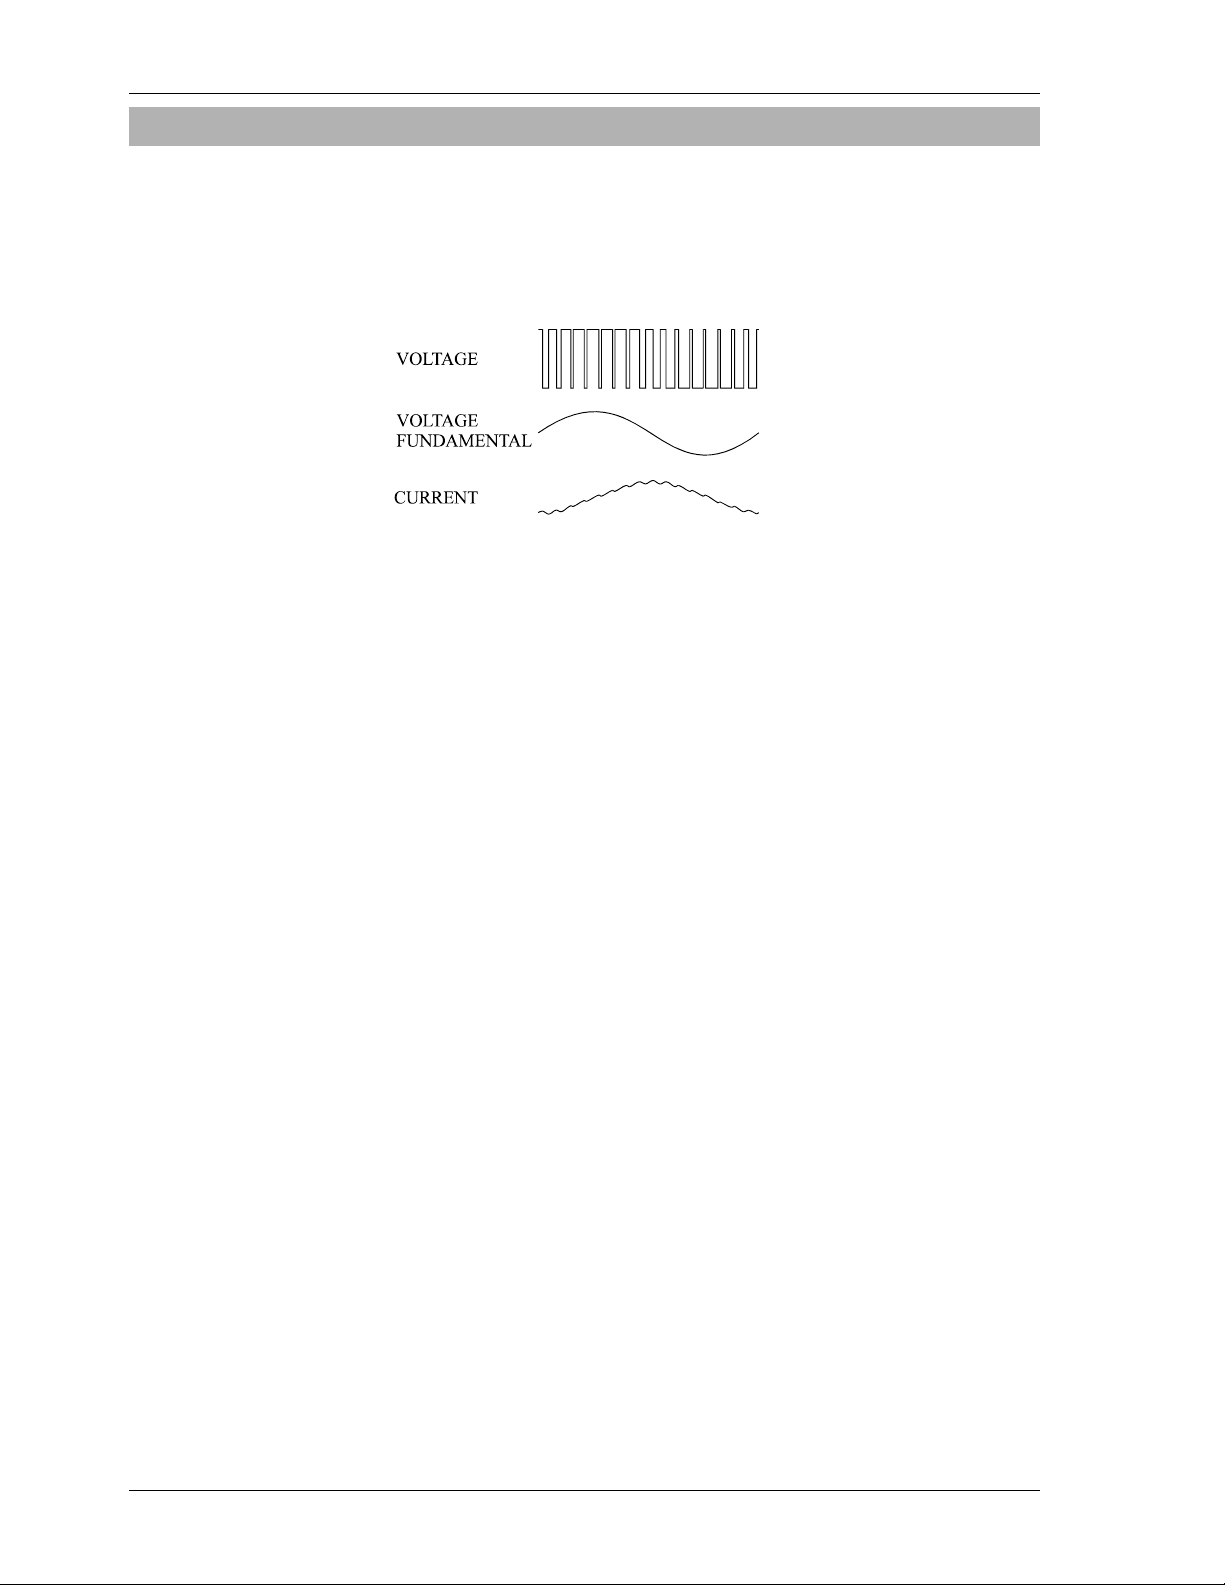
5.7 F[7] PWM DRIVE MODE
The difficulties associated with making measurements on the complex waveforms of
PWM drives are overcome with this special operating mode. It is described fully in Voltech
Application Note 105. High frequency sampling and digital filtering reject the carrier
frequency, and extract the motor frequency and harmonic components. True power and
other rms parameters are computed from the PREFILTERED data.
There is a choice of 3 filters, selected according to the frequency range of the motor:
5Hz to 1kHz (400ms display update)
0.5Hz to 50Hz (4sec update time)
0.1Hz to 40Hz (16sec update time)
Notes:
1. The low bandpass filter is normally applied to prevent anti-aliasing. This will affect the
PWM pre-filtered data values. PWM filtered values will be unaffected.
2. Output mode harmonics are blanked to give zero values above the maximum
frequency of the filter selected. For example,
Filter = 5Hz to 1kHz
Motor frequency = 30 Hz
Max. harmonic computed = 33rd (990Hz)
3. Input mode harmonics are blanked at frequencies above the limit (400/input window)
Hz.
4. For low loaded motors, it is advisable to remove the display blanking as the
fundamental can be very small compared to the total rms value. In such a case, the
display value may be forced to zero. Select [F],[P] 26 (Low value blanking).
5 It is important to check that the correct frequency has been obtained when the mode
is selected. If not, then select [FREQ SOURCE] to >current<.
6. The wiring for PWM mode is either 3Ø3W or 3Ø4W. The [N] channel provides
computed values of neutral current (Arms, AFund, Acf, Apk, Aharm and Athd).
PAGE 5-10

PM3000A USER MANUAL THE FUNCTION MENUS
−
=
To use this operating mode, select F[7] PWM DRIVES by pressing the [F] key and then
using [SELECT and [ENTER]. Four options are then available:
>disable<
>input<
>output<
>real time output<
All wiring configurations for the PWM mode that are 3Ø 3W will enable the third channel
(CH3) as independent. This allows the DC link of the drive to be measured simultaneously.
Using the DC link, efficiency (E) measurements for the drive can be derived:
5.7.1 OUTPUT MODE
1. Connect the output of the drive to the PM3000A and motor in either 3Ø3W or 3Ø4W
mode (see diagram in section 2.3).
2. Select PWM DRIVES >output< mode.
3. Select the chosen frequency band depending on the motor operating speed range,
e.g. >5Hz to 1kHz< using the [SELECT] and [ENTER] keys.
4. Select >3Ø3W< or >3Ø4W< as required.
5. Select High Bandwidth mode (see section 5.2)
Check that the frequency is being monitored correctly. Measurement of the RMS values,
fundamentals and harmonics (up to the limit frequency of the filter) can now be analyzed. It
is normal for there to be a large difference between the Vrms & Vfund values, but only small
differences between Arms & Afund and Wrms & Wfund, as the inductive motor filters the
current.
Note that if a printer output is selected, then Watts Harmonics can be selected for printout (if
Aharm and Vharm have previously been selected in the menu). For measurement of
harmonics above the upper filter limit, see the later section on harmonics.
5.7.2 INPUT MODE
If the output of the drive is unbalanced, the input waveforms are modulated by the output
motor frequency. Accurate measurements are obtained by synchronizing the sampling of
data to the line frequency, and sampling over an interval (
follows:
Output frequency f
10 < f 1
1 < f < 10 10/f
f < 1 1/f
PowerlFundamentaPowerTotalLossesHarmonic
τ) between 1 and 10 seconds as
τ input time
window
PAGE 5-11

THE FUNCTION MENUS PM3000A USER MANUAL
For example, if f = 7.2Hz, then set τ to 10/7.2 = 1.39 (or a multiple of this value).
1. Connect the input of the drive to the PM3000A in 3Ø3W or 3Ø4W mode (see
diagram in section 2.3).
2. Select PWM DRIVES >input< mode and the display will be as follows:
PWM INPUT WINDOW
>1.000<
3. Use the digit keys to set the calculated value for
you make a mistake, press [SELECT] to re-enter the value and then press [ENTER].
4. Select >3Ø3W< or >3Ø4W< as required.
The PM3000A will now measure input power over an integral number of input cycles
within the selected time window of measurement, 1.39 seconds.
τ (e.g. 1.39) and press [ENTER]. If
5.7.3 REAL TIME OUTPUT MODE
Real time output of the FILTERED values of Vrms, Arms, Wrms, and PF, can be output
as analogue outputs for chart recorders.
1. Connect the output of the drive to the PM3000A in 3Ø3W or 3Ø4W mode (see
diagram in section 2.3).
2. Select PWM DRIVES >real time output< mode and the display shows as follows:
PWM OUTPUT RANGE
>5 Hz to 1kHz<
3. Use the [SELECT] and [ENTER] keys to choose the frequency band depending on
the motor operating speed range, e.g. ‘5Hz to 1kHz’.
4. Use the digit keys to enter the maximum PWM OUTPUT VOLTS for recorder
scaling, e.g. 250. Press [ENTER].
5. Use the digit keys to enter the maximum PWM OUTPUT AMPS for recorder scaling,
e.g. 20. Press [ENTER].
6. Use the digit keys to enter the maximum PWM OUTPUT WATTS for recorder
scaling, e.g. 5000. Press [ENTER].
PAGE 5-12

PM3000A USER MANUAL THE FUNCTION MENUS
The computed results appear on outputs 1 to 4 of the analogue output connector. For
example:
Output 1 total Vrms 0 to 5V = 0 to 250 V
Output 2 total Arms 0 to 5V = 0 to 20 A
total Watts 0 to 5V = -5000W
5.7.4 HARMONICS
To extend the measurement of harmonics that exceed the filter cut-off frequency
(provided the frequency is not fluctuating), the following procedure can be followed.
First measure and store the frequency with the PWM filter on. Switch to a configuration
that uses the stored frequency and disables the filter. Harmonics to the 99th may now be
analyzed. By using the PROGRAM SWITCH, these two configurations can be toggled to
update the stored frequency.
1. Select PWM >output< mode and the appropriate filter, as described in the
earlier sections.
2. Select [F],[P] 36 LOAD FIXED FREQUENCY and set >enable<. Press
[ENTER]. This will store the frequency.
3. Save as Program 1 (see section 4.1). Note that this overwrites any program
previously stored in P1.
4. Set PWM mode F[7] to >disabled<.
5. Select [F],[P] 21 FIXED FREQUENCY and set >enabled<.
6. Save as in Program 2.
7. Load Program 1 (see section 4.1.1).
8. Enable the PROGRAM SWITCH (see section 5.5).
9. The [P] key now toggles the configuration between Program 1 and Program 2,
each time it is pressed. Full harmonics can be measured when Program 2 is
set.
Output 3
to +5000W
Output 4 total PF 0 to 5V = 0 to 1
PAGE 5-13

THE FUNCTION MENUS PM3000A USER MANUAL
VavV
5.8. F[8] BALLAST/ULTRASONIC MODE
In situations where high-frequency voltage and current waveforms are heavily modulated
by mains borne frequencies, it is difficult to make accurate measurements, as the
sampling is not synchronized to the 50/60 Hz modulation. This occurs frequently with
lighting ballast power measurements.
The ballast/ultrasonic mode F[8] solves this problem. Voltech Application Note 101 covers
its use in detail. To use the function:
1. Press the [F] key and use [SELECT] and [ENTER] to choose F[8] ‘BALLAST’ mode.
2. Select ‘off’ or ‘50Hz’ or ‘60Hz’ and press [ENTER].
2. The PM3000A will now capture and analyze the relevant number of samples that
correspond to one complete cycle of 50Hz or 60Hz at the fastest sampling rate.
Once captured, the subsequent processing is carried out as normal, including
autoranging. The display automatically sets to a four-function display.
The frequency displayed is the carrier frequency.
4. If three-phase, three-wire mode has previously been selected as the wiring
configuration, then after selecting 50/60Hz (step 2), you can select INDEPENDENT
CH3. This allows you to measure ballast power output using CH1, CH2, and ∑,
whilst measuring input power on CH3.
5.9 F[9] TRANSFORMER MODE
The Transformer Test Mode has an application in the measurement of ‘no-load’ losses
when testing large (e.g. 10 to 20 kVa) power transformers. The ‘no-load’ losses include
core loss, dielectric loss, conductor loss in the winding due to excitation current, and
conductor loss due to circulating current in parallel windings. The core loss is usually the
most important; it is a function of the magnitude, frequency and waveform of the input
voltage, and it also varies significantly with temperature.
The method of testing is specified in the Standards: IEC76 - 1 and IEEE C57. An example
single-phase test circuit as specified in IEEE C57 is as follows:
Source
Arms
where:
Arms = Ammeter (rms)
W = Wattmeter
Vrms = Voltmeter (rms)
Vav = Voltmeter (mean sensing - rms scaled for sinewave).
rmsW
PAGE 5-14

PM3000A USER MANUAL THE FUNCTION MENUS
Other test circuits are shown in the Standards, involving both current and voltage
(instrumentation) transformers, and three phases.
IEEE C57 also quotes the formula:
P
PT
cm
()=
mr
PkP
+
12
Where:
T
m
P
c(Tm
P
m
P
1
P
2
E
= the test voltage measured by the rms voltmeter (≡ Vrms)
r
E
a
= temperature
) = the no load losses corrected for waveform at temperature Tm
= the measured no load losses at temperature Tm
= the ratio of hysteresis loss to total iron losses
= the ratio of eddy-current loss to total iron losses
= the test voltage measured by the mean-sensing voltmeter (≡ Vav)
In the Transformer Test Mode, the PM3000A will measure the Vav, and will calculate the
factor ‘k’ and the corrected power P
(using a value of 0.5 for both P1 and P2).
c
5.9.1 SETTING UP TRANSFORMER TEST MODE
Press the [F] key and use [SELECT] and [ENTER] to choose F[9] ‘TRANSFORMER’
mode. The display is as follows:
TRANSFORMER MODE
>off<
2
E
k
=
E
a
Use [SELECT] and [ENTER] to choose from the following options:
Vav
k-fctr
P-corr.
The measured results are typically displayed as:
0.000 V 0.000%
+0.000 W 0.000 V*
for Vav,
0.000 V 0.000 A
+0.000 W 0.000
for k-fctr,
0.000 V 100.00%
+0.000 W 0.000 W*
for P-corr,
although use of the function keys and other display changes will alter the parameters
displayed.
PAGE 5-15

THE FUNCTION MENUS PM3000A USER MANUAL
5.10 F[10] CALIBRATION
5.10.1 CALIBRATION OVERVIEW
All calibration constants are stored in EEPROM, allowing the PM3000A to be calibrated
without having to remove the cover. The calibration sequence is passcode protected. All
three voltage or current inputs are calibrated simultaneously for maximum efficiency,
although it is possible to calibrate each channel separately if required. The integrity of the
EEPROM contents is verified at power-on, and the message ‘UNCALIBRATED’ is
displayed if the contents are invalid.
5.10.2 PASSCODE
The passcode is a 4-digit number that allows entry to the calibration routines. It comes
factory set at 3000 but may be changed by the user for extra security. (If the new code is
lost or forgotten then a master code is held at Voltech to allow access. Contact Voltech or
your dealer if this is needed.)
To change the passcode press the [F] key and use [SELECT] and [ENTER] to choose
F[10] ‘CALIBRATION’ mode. Press [ENTER] to proceed. The display is as follows:
Enter the current 4-digit passcode – if this is incorrect you will be returned to the default
display. The display then shows:
Press [ENTER] to change the passcode and then enter the new code. (If the instrument
does not require calibration it may be switched off at this point.) To skip entering a new
passcode press [SELECT] to display >no< and then [ENTER]. The system will now enter
the main calibration menu. Refer to section 5.10.8 for the equipment needed.
5.10.3 MANUAL CALIBRATION
Switch on the PM3000A into its standard power-up mode, and allow at least 30 minutes
for the analyzer to reach a stable temperature. Follow the instructions in the previous
section until the following display appears:
CAL CODE ? 0-9999
>0<
ENTER NEW CAL CODE ?
>yes<
PAGE 5-16
CHANGE CONFIGURATION
>yes<

PM3000A USER MANUAL THE FUNCTION MENUS
If >yes< is selected the instrument can be re-configured as a single phase, two phase or
three phase instrument. Press the [SELECT] key to display >no< and then press [ENTER]
to continue to the next display:
SELECT CHANNELS
CH1 CH2 CH3
You can deselect (and reselect) each of the channels to be simultaneously calibrated by
pressing the CHANNEL SELECT keys. If all three channels are to be calibrated together,
press [ENTER].
The next display shows:
CALIBRATE VOLTS ?
>yes<
Press [ENTER] for the voltage calibration routines. Press [SELECT] to display >no<
followed by [ENTER] if the voltage channels do not need calibration.
5.10.4 VOLTAGE RANGE CALIBRATION
The display shows:
VR1 input 200mV rms
Value in V >0.000<
If you wish to by-pass the calibration of this range, press [ENTER] and the program will
move on to the next range.
To calibrate the range, set the voltage generator output to approximately the value
requested on the display (±10%), and allow it to settle. Key-in the measured value from
the digital multimeter. Enter the data in volts (e.g. 0.200V).
Press [ENTER]. The voltage will be measured on all three inputs, and the calibration
constants for each analogue channel will be calculated.
The display will then show either:
PASS
PAGE 5-17

THE FUNCTION MENUS PM3000A USER MANUAL
or (for example):
**FAIL**
Channel 2
If a calibration fail occurs, the display advises which channel(s) have failed. In either case,
press [ENTER] to continue. If a PASS occurs, the next range is set. For a FAIL, the
display returns to the range on which the fail occurred (press [ENTER] to move on
through the menu, or retry the range calibration again). Repeat for all twelve ranges (VR1VR12).
The display will then show:
INPUT 10Vrms 20kHz
enter to continue
This allows the calibration of the low bandwidth filter (20kHz on standard and 001 models,
4kHz on 002 models).
This step can be bypassed by pressing the [F] key, which will cause the previously stored
filter calibration to be retained.
Input 10Vrms sinewave at the specified frequency, then press the [ENTER] key. The
PM3000A will calibrate and after a few seconds, will display:
or indicate the failed channels. Press [ENTER] to continue.
The display will then show:
If only the Voltage channels require calibration, press [SELECT] to display >no< followed
by [ENTER] and move to the ‘SAVE NEW CAL DATA?’ prompt). The Current channels
may now be calibrated by choosing >yes<.
5.10.5 AMP RANGE CALIBRATION
The display shows:
CHANNEL 1+2+3
PASS
CALIBRATE AMPS ?
>yes<
AR1 input 20mA rms
Value in A >0.000<
If you wish to by-pass the calibration of this range, press [ENTER] and the program will
move on to the next range.
PAGE 5-18

PM3000A USER MANUAL THE FUNCTION MENUS
To calibrate the range, set the current generator output to approximately the value
requested on the display (±10%), and allow it to settle. Key-in the measured value from
the digital multimeter. Enter the data in amps (e.g. 0.020A).
Press [ENTER]. The current will be measured on all three inputs, and the calibration
constants for each analogue channel will be calculated.
The display will then advise PASS or FAIL (as for the voltage range). Proceed as
described in section 5.10.4. Repeat for all twelve ranges (AR1-AR12).
The display will then show:
INPUT 250mArms 20kHz
enter to continue
This allows the calibration of the low bandwidth filter (20kHz on standard and 001 models,
4kHz on 002 models).
This step can be bypassed by pressing the [F] key, which will cause the previously stored
filter calibration to be retained.
Input 250mArms sinewave at the specified frequency, then press the [ENTER] key.The
PM3000A will calibrate and after a few seconds, will display:
or indicate the failed channels. Press [ENTER] to continue.
The display will then show:
CALIBRATE EXTERNAL ?
If the external inputs do not require calibration, press [SELECT] to display >no< followed
by [ENTER] and move to the ‘SAVE NEW CAL DATA?’ prompt. Choose >yes< to
proceed with the calibration.
5.10.6 EXTERNAL INPUT CALIBRATION
Note: To calibrate EXTERNAL, the AMP RANGE must already be calibrated. The display
shows:
XR7 input 31mV rms
Value in V >0.000<
CHANNEL 1+2+3
PASS
>yes<
To proceed, set the voltage generator output to approximately the value requested on the
display (±10%), and connect to all external inputs. Key-in the measured value from the
digital multimeter. Enter the data in volts (e.g. 0.031V).
PAGE 5-19

THE FUNCTION MENUS PM3000A USER MANUAL
Press [ENTER] and the calibration constants will be calculated.
The display will then advise PASS or FAIL (as for the voltage range). Proceed as
described in section 5.10.4. Repeat for all six ranges (XR7-XR12). If the instrument has
the –001 option the display will then show:
CALIBRATE AUX ?
>yes<
If the auxiliary inputs do not require calibration, press [SELECT] to display >no< followed
by [ENTER] and move to the ‘SAVE NEW CAL DATA?’ prompt (see section 4.6.8.7).
Choose >yes< to proceed with the calibration.
5.10.7 AUXILIARY INPUT CALIBRATION
The display shows:
10V AUX input 1V dc
Value in V >0.000<
To proceed, set the voltage generator output to approximately the value requested on the
display (±10%), and connect to both auxiliary inputs (A & B). Key-in the measured value
from the digital multimeter. Enter the data in volts (e.g. 0.031V). The display then shows:
10V AUX input 9V dc
Value in V >0.000<
Repeat the above but with a 9V dc input. Press [ENTER] and the calibration constants will
be calculated.
The display will then advise PASS or FAIL for the two inputs (similar to the voltage range).
Proceed as described in section 5.10.4 pressing [ENTER] to continue and/or repeat the
calibration as required.
Press [ENTER] to continue and repeat the above procedure for the 1V AUXILIARY
RANGE. The display will then show:
SAVE NEW CAL DATA?
>yes<
To save any new calibration data press [ENTER] to select >yes<. Press [SELECT] and
then [ENTER] to return without altering the EEPROM contents.
PAGE 5-20

PM3000A USER MANUAL THE FUNCTION MENUS
The next display will show:
PRINT CALIBRATION?
>yes<
Connect a printer to the Centronics port, and press [ENTER] to select >yes< if a printout
is required. Otherwise, select >no< and press [ENTER] to end the calibration routine.
5.10.8 R
The following equipment is required to calibrate the PM3000A:
1. Datron 1271 or equivalent (high accuracy, true RMS digital voltmeter).
2. Current generator:
Current 0 - 30 Amps
Frequency 120 Hz
3. Voltage Generator:
Voltage 0 - 1000 Volts
Frequency 120 Hz
4. Shunts:
5. Printer.
ECOMMENDED EQUIPMENT
(a) Resistance - 1.0000 Ohms, Current - 2.0 Amp
(b) Resistance - 0.10000 Ohm, Current - 40 Amp
PAGE 5-21

THE FUNCTION MENUS PM3000A USER MANUAL
5.10.9 VOLTAGE CALIBRATION CONNECTION
PAGE 5-22

PM3000A USER MANUAL THE FUNCTION MENUS
5.10.10 CURRENT CALIBRATION CONNECTION
PAGE 5-23
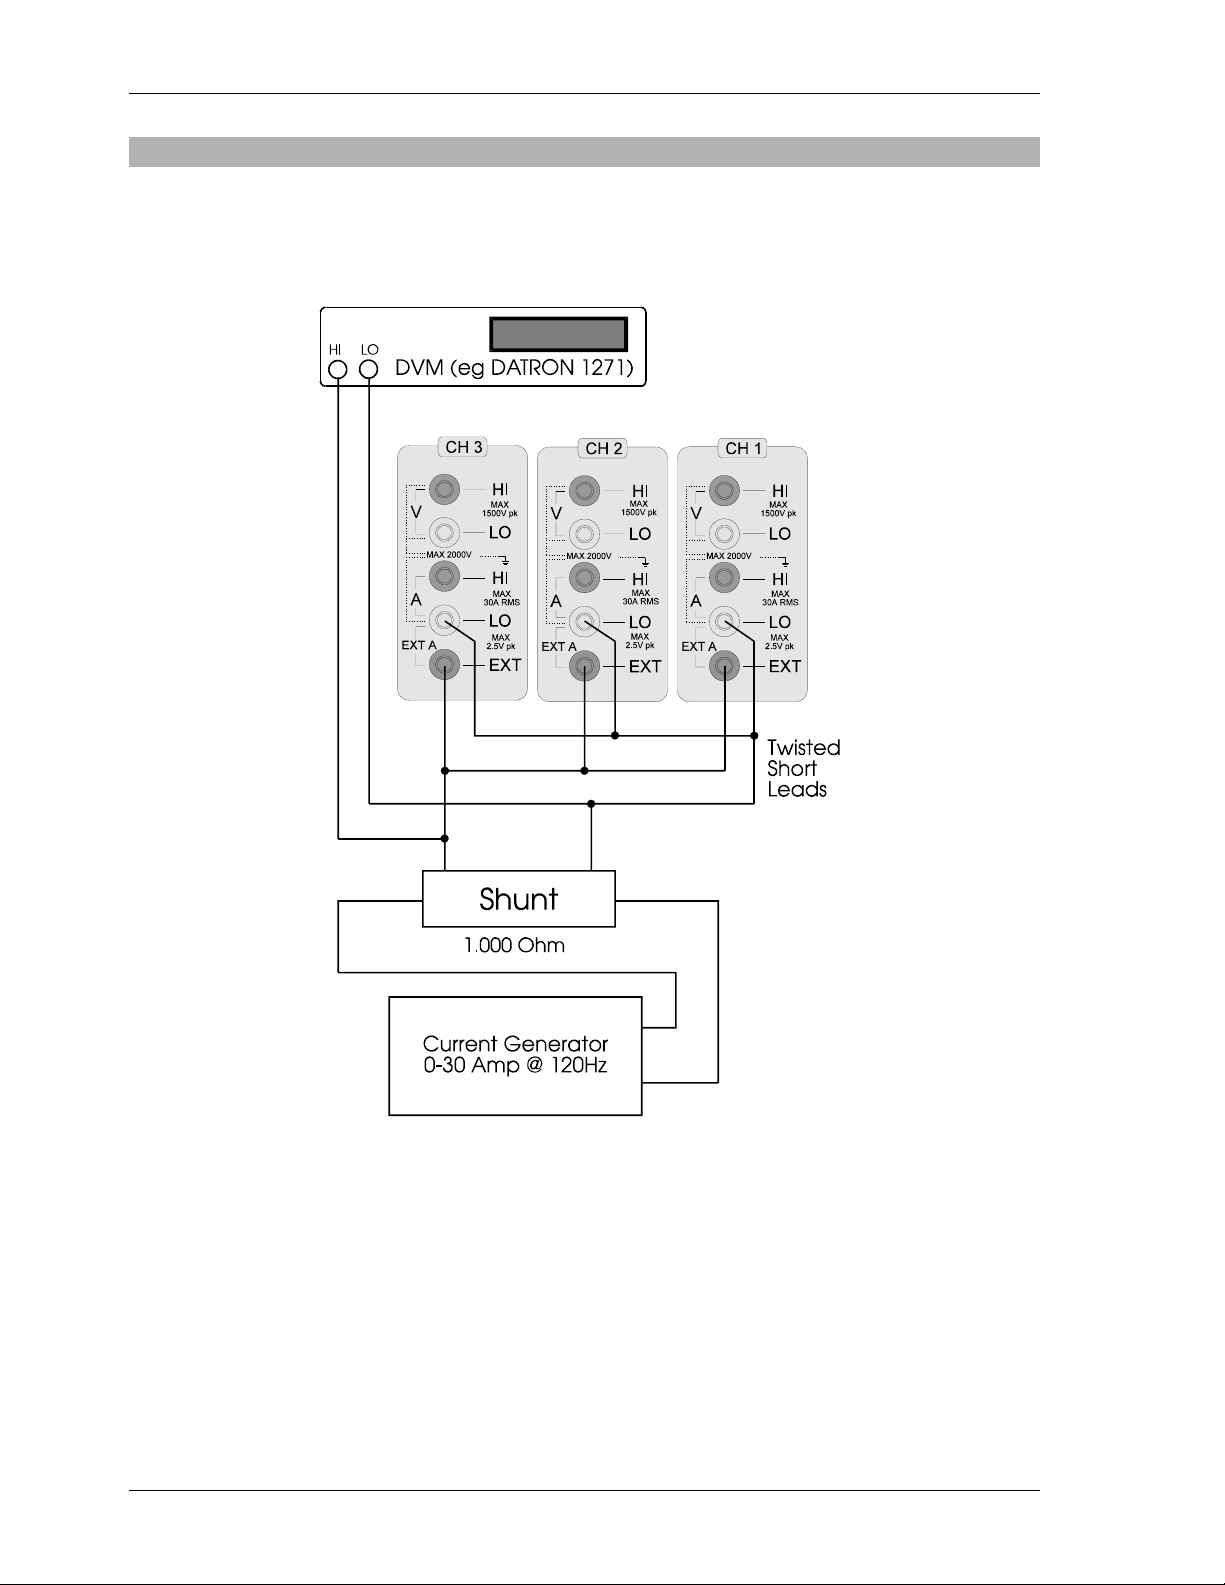
THE FUNCTION MENUS PM3000A USER MANUAL
5.10.11 EXTERNAL CURRENT CALIBRATION
PAGE 5-24

PM3000A USER MANUAL ADVANCED CONFIGURATION
CHAPTER 6
DVANCED CONFIGURATION
A

ADVANCED CONFIGURATION PM3000A USER MANUAL

PM3000A USER MANUAL ADVANCED CONFIGURATION
6.1 [F][P] CONFIGURATION
The [F] and [P] keys pressed consecutively provide a greater selection of instrument
configuration. Press [F], then [P], followed by the required number from the selection list
below, and then [ENTER]. Use the [SELECT] key to highlight the required configuration
setting (e.g. ‘harmonic series’ for [F],[P] 16), or a digit key for a display with numeric
information (e.g. 5 for [F],[P] 13). Then press [ENTER].
Note that only the most common [F],[P] selection numbers are shown below, for full list
refer to CONFIGURATION LISTING under section 10.6.4.
0 MANUAL ZERO. To reduce the current and voltage offsets, a zeroing calibration
can be carried out. Each of the inputs should be shorted together and >MANUAL
ZERO< should be selected. The instrument will proceed to self-calibrate for each
measurement range.
10 LANGUAGE MODE.
can be changed to the desired language.
16 THD FORMULA. The displayed THD value may be calculated from the difference
formula or from series THD (see section 3.3.3). If calculated from series THD, the
background averaging is used, and the displayed value is updated each time the
averaging is filled. The top line continues to be updated at the normal rate. The
default setting is the difference formula. To select series THD:
* Press [F],[P] 16 and [ENTER]
Select ‘harmonic series’ and [ENTER].
* Press [F],[P] 19 and [ENTER]. Select ‘H0(dc) excluded’ or ‘H0(dc) included’ as
required. Press [ENTER].
* Press [F],[P] 135 to select odd or odd and even harmonics in the THD series.
Press [ENTER].
* Press [F],[P] 136 to select max. harmonic for the THD series. Press [ENTER].
17 HARMONIC REFERENCE. The fundamental or RMS value may be chosen as
reference for THD calculation, both on the display and the printout. The default is
fundamental.
18 HARMONIC DISPLAY
the reference or as actual values of volts or amps.
19 HARMONIC ZERO (DC). The zero harmonic (DC) can be included or excluded in
the THD series formula.
20 DISPLAY UPDATE RATE. This is set as 0.5 sec default. It may be changed from 0
to 9.9s in units of 100ms in this option, by selecting 0-99.
21 FIXED FREQUENCY ENABLE. For accurate operation, the PM3000A needs to
obtain the frequency of whatever source it measures. Sometimes this may be
impractical. To overcome this, the user can set a fixed frequency value in [F],[P] 22
and enable it as the instrument’s source of reference. >disabled< is the default
(normal operation).
22 FIXED FREQUENCY. Through this option, the value of fixed frequency can be set.
It is activated by selecting ‘enabled’ in [F],[P] 21.
The default display language is English. Using this option, it
. The harmonics may be chosen to display as percentage of
PAGE 6-1

ADVANCED CONFIGURATION PM3000A USER MANUAL
26 LOW VALUE BLANKING. If the PM3000A is operated in manual ranging (or if the
lowest range is operating in autoranging), the display value will blank to zero if the
voltage or current falls below a given value. If, however, you want to observe the
(blanked) value, the blanking can be disabled through this option.
28 RANGE LOCKING
the maximum input on all three channels. This is ‘locked’ operation. The ranging can
be made ‘independent’ through this option. Once selected, each channel will range
according to the level of inputs experienced by that channel or to a pre-set fixed
range.
36 LOAD FIXED CHANNEL 1 FREQUENCY. When enabled, this option allows you to
use existing measured frequency as the frequency reference source for later
measurements. It is used, for example, in the PWM MODE when measuring
harmonics above the filter cut-off frequency.
38 CH1 AVERAGING DEPTH. This option allows the averaging depth to be set from 1
to 64. It is useful for reconfiguring the depth for AUTO mode (see section 3.2.3).
The equivalent [F],[P] setting for CH2 is 58 and CH3 is 78.
46 RMS/MEAN MEASUREMENT MODES.
in either true RMS or rectified MEAN values. This option allows you to select
between the two modes.
115 INTEGRATOR DISPLAY.
values (e.g. WHr) or >averaged< values (e.g. W average) for the integrator period.
126 CURSOR HOME. The PM3000A can be connected to a PC via RS232 and
configured to send ‘Print mode’ results to the screen using the [DATA DUMP] key
for remote monitoring. Using a VT100 or VT320 terminal and this configuration,
‘Print Mode’ results can be displayed with each ‘Dump’ beginning at the top left
hand corner of the screen, rather than scrolling from the bottom of screen.
127 DISPLAY MODE. In ‘communications control’ the display will show
‘Communications Control’ instead of updating the display measurements.
Communications speed is improved.
0 = Normal display mode
1 = Communications control display mode
135 HARMONIC SERIES. This option allows selection of >odd-only< or >odd and even<
harmonics in the harmonic series for THD or printout.
136 MAXIMUM HARMONIC.
the harmonic series for THD or printout.
190 POWER FACTOR POLARITY. This may be reversed from the normal applied
convention by enabling this option.
. The normal mode of operation is that the PM3000A responds to
The voltage and current can be displayed
This option allows selection of >accumulated< integrator
This option allows selection of the maximum harmonic in
PAGE 6-2

PM3000A USER MANUAL ADVANCED CONFIGURATION
∑
191 SUM A =(A1+A2+A3)/3. The Summation Current is normally calculated using the
formula:
/3
∑VAV
The Summation current can be calculated as the arithmetic mean of the 2Ø or 3Ø
channel inputs using [F],[P] 191.
)A +A +(A
3 2 1
∑
= A3Ø4W
3
21
)A + (A
∑
=A3W 3W/3Ø Ø1
2
192 SUM V=(V1+V2+V3)/3. The Summation Voltage for 3Ø4W wiring is normally
calculated using the formula:
12+3
∑ V=
(V +V V )
3
The Summation Voltage can be calculated as the arithmetic mean for 3Ø4W wiring
using [F],[P] 192.
12+3
∑ V=
(V + V V )
3
275 RS232 VERBOSE MODE. The PM3000A defaults to Verbose mode with echoed
data when communicating via the RS232 link. This echo function can be disabled
via this configuration setting.
276 DATA RETURN FORMAT.
of data on each line. This requires a data return request to be issued to the analyzer
at the end of each line.
In ‘single reply string’ mode, all of the data is returned in one string with a line feed
as a terminator. There is no ‘END OF DATA’ appended to the data
0 = Normal multi-line reply string
1 = Single reply string
277 V, A, W, F ONLY MODE. By restricting the parameters computed by the analyzer,
communications speed is improved.
0 = Normal functions available
1 = V, A, W, and Frequency are the only measurements available
279 DATA RETURN FORMAT. Data is normally returned in 4.5-digit ASCII. This
configuration can set the returned data to 5-digit ASCII.
282 PAGE FEED.
Appends a printed document with a page feed.
Data is normally returned in multiple lines, with 8 pieces
PAGE 6-3

ADVANCED CONFIGURATION PM3000A USER MANUAL
PAGE 6-4

PM3000A USER MANUAL INTEGRATOR
CHAPTER 7
NTEGRATOR
I

INTEGRATOR PM3000A USER MANUAL

PM3000A USER MANUAL INTEGRATOR
7.1 INTEGRATOR MEASUREMENTS
The PM3000A provides comprehensive integration capability for determining energy
consumption or maximum demand. The ACCUMULATED VALUES of WHr, VAHr, VArHr, AHr, average power factor and correction VArs, are normally displayed and printed
out. These can be changed to provide AVERAGED VALUES of W, VA, VAr, and A, for
the elapsed integrator period by using [F],[P] 115 to 'averaged' (see section 6.1). This can
be set during, before or after the integration period. The instrument operates
independently of other measurement functions, allowing the operator to make normal
measurements whilst integration is in progress. The following functions are available:
7.1.1 [W-HR] WATT HOURS
This records total energy consumption. When used in conjunction with the [FUND] key,
the integrator will display energy consumption due to fundamental components only.
When the key is pressed the display changes to:
Elapsed time 0.00000
W hrs = +0.000
7.1.2 [VA-HR] VA HOURS
This records the apparent energy consumption or maximum demand. When used in
conjunction with the [FUND] key, the integrator will display energy consumption due to
fundamental components only. The display format is similar to that shown above.
7.1.3 [VAR-HR] VAR HOURS
This records the reactive energy consumption. When used in conjunction with the [FUND]
key, the integrator will display energy consumption due to fundamental components only.
7.1.4 [A-HR] AMPERE HOURS
This measures the ampere-hours consumed. This function can be programmed to
respond to true rms or rectified mean current. When used in conjunction with the [FUND]
key, the integrator will display energy consumption due to fundamental components only.
7.1.5 [AV PF] AVERAGE POWER FACTOR
This displays the average power factor during the integration interval. When used in
conjunction with the [FUND] key, the integrator will display average power factor due to
fundamental components only.
PAGE 7-1

INTEGRATOR PM3000A USER MANUAL
7.1.6 [CORR VAR] CORRECTION VARS
This displays the value of the VArs required to correct the average power factor to a
target power factor, pre-set by the user. [F],[P] 2 can be used to change the default value
from 1.000. The correction will calculate the necessary VArs to provide the phase shift to
reach the target power factor; it does not compute the total VArs (e.g. if a poor power
factor is completely due to distortion, no amount of phase lead or lag will improve it. This
implies that the correction VArs value will be very low, due to the fundamental power
factor being unity)
7.2 INTEGRATOR MENU
The integrator allows total flexibility and is controlled in response to:
1. Manual control, i.e. local control.
2. External/remote control.
3. The internal real time clock.
4. IEEE commands.
The required integrating mode is selected by pressing the [INTEGRATOR] key in the
Menu section of the front panel. The display will show:
ENABLE INTEGRATOR
>disabled<
Use the [SELECT] and [ENTER] keys to enable the integrator. The display will then show:
INTEGRATOR CONTROL
>trigger<
Use the [SELECT] and [ENTER] keys to choose between ‘trigger’ and ‘timed’ operation.
Assuming trigger operation has been selected the display will now show:
EXTERNAL TRIGGER INT
>disabled<
If manual operation is required, press the [ENTER] key to disable the external trigger. The
display will show:
INTEGRATOR RUN TIME
HH:MM >00:00<
PAGE 7-2

PM3000A USER MANUAL INTEGRATOR
Use the digit keys to enter the time for which the integrator will run after manual triggering
(pressing the [START RESET] key). If the integrator is to run continuously until the
[STOP] key is pressed, enter a time of 00:00.
Use the [SELECT] and [ENTER] keys to enable or disable printed output. The LED
beneath the integrator key will be illuminated and the system waits for the manual trigger.
To start the integrator, press the [START RESET] key. The LED under the start key will
turn on to indicate that the integrator is running. Pressing any of the integration function
keys will display the run time in hours and value of the integrated parameter.
If RUN TIME was set to ‘00:00’, the integrator can now be reset or stopped. To reset,
press the [START/RESET] key again. The integrator will be reset and restarted. Each
time the integrator is reset, the selected integrator functions for that point-in-time will be
printed-out, provided the interface has been configured.
To stop the integrator, press the [STOP] key. The LED under the [START RESET] key will
turn-off, and the integrator will stop. The terminal results are held and can be viewed from
the front panel display. They will automatically be printed if the printer interface is
enabled.
The integrator can be restarted at this point by pressing [START] again, or can be
disabled by entering the integrator menu and selecting disabled.
7.2.1 SETUP EXTERNAL TRIGGER
Enter the integrator menu, use [SELECT] and [ENTER] to >enable< the integrator, then
select >trigger< control. Use [SELECT] and [ENTER] to >enable< the external trigger.
The LED under the [INTEGRATOR] key will illuminate to show that the integrator is ready
to be triggered.
The integrator will start when the external trigger input on the rear panel is grounded. The
integrator will run whilst this input is low. To stop the integrator, release the input. The
terminal results may then be viewed on the front panel display, and will automatically be
printed (providing the printer interface is enabled).
The integrator can be reset and restarted at this point by grounding the external input
again or can be disabled by pressing the integrator menu key and selecting >disabled<.
7.2.2 SET UP TIME CONTROL
With the integrator enabled, use [SELECT] and [ENTER] to choose >timed< control. Enter
a start date, followed by a stop date. Follow this with a start time and a stop time. (After
each date/time entry, press [ENTER] to move on to the next display.)
Dates and times are entered in the following format:
Day(DD) : Month(MM) : Year(YY)
Hour(HH) : Minutes(MM)
The next display offers selection of CYCLIC INTEGRATION (see next section). Select
>disabled<.
PAGE 7-3

INTEGRATOR PM3000A USER MANUAL
The display then offers selection of 5 timeband resets within the integration period (see
section 7.2.4). Repeatedly press [ENTER] to skip these.
For timed integration there is the option to reset (clear) the integrator result with each
timeband or cyclic interval. If the INTEGRATOR RESET option is disabled, the integrator
results will be printed at each cyclic interval or timeband, giving an accumulation between
the start and stop times without resetting. ‘Enabled’ will clear the results at each cyclic
interval or timeband. When CYCLIC INTEGRATION or TIMEBAND INTEGRATION is not
selected, the setting of this option has no effect, press [ENTER].
There is then the option to configure the printer (as described earlier), and the integrator
is then set, and will integrate between the start and stop times automatically.
The terminal results may then be viewed on the front panel display, and will automatically
be printed-out if the printer interface is enabled.
7.2.3 C
If the CYCLIC INTEGRATION option is >enabled< after inputting the start and stop
dates/times for the integration period (see above) the next display is as follows:
YCLIC INTEGRATION
CYCLIC INTERVAL
HH:MM >00:00<
Use the digit keys to enter the cycle interval. Use [SELECT] if you make a mistake whilst
entering the time. Press [ENTER] when the interval is correct. Next enter the reset period
in hours (HH) and minutes (MM), and press [ENTER].
There is then the option to configure the printer (as described earlier), and the integrator
will then run between the start and stop times, and printout at each cyclic interval.
7.2.4 TIMEBAND INTEGRATION
If CYCLE INTEGRATION is >disabled<, the display prompts for timeband resets B1, B2,
B3, B4, and B5. Enter each band-reset time in hours (HH) and minutes (MM), and press
[ENTER]. If not all resets are needed, skip them by pressing [ENTER] without selecting a
time.
There is then the option to configure the printer (as described earlier). The integrator will
then integrate between start and stop times, resetting and printing out results (printer
enabled) at each timeband setting. If the integrator is set over several days, the timeband
resets will continue in a cyclic manner for each day of the period.
PAGE 7-4
This option is useful for monitoring and costing consumption over different tariff bands.

PM3000A USER MANUAL INTERFACE SET-UP
CHAPTER 8
NTERFACE SET-UP
I

INTERFACE SET-UP PM3000A USER MANUAL

PM3000A USER MANUAL INTERFACE SET-UP
8.0 INTERFACE MENU
This key allows the user to program the digital and analogue interfaces of the PM3000A.
When pressed the display will show the following:
INTERFACE
>printer<
The [SELECT] key is used to display the options available and the [ENTER] key used to
access a specific option:
>printer<
>IEEE488<
>RS232<
>chart recorder<
>analogue outputs<
>auxiliary inputs< (PM3000A – 001 option only)
Each of these is described in more detail in the following sections
8.1 PRINTER INTERFACE
The printer used may be either:
a) A text printer with an RS232 (serial) interface.
b) A text printer with a parallel (Centronics) interface.
Centronics is the default but the output will be directed to the RS232 port if this interface
is enabled (see section 8.3.1). The printout can be from one of four sources:
a) The results on the front panel display.
b) The results from one or more channels.
c) The integrator results.
d) The datalog results.
8.1.1 PRINTING FRONT PANEL DISPLAY RESULTS
Press the [INTERFACE] key and use [SELECT] and [ENTER] to >enable< the printer.
Then use [SELECT] and [ENTER] again to choose >display<. The front panel display
shows:
EXTERNAL TRIGGER PRN
>disabled<
To print use a manual trigger press [ENTER] to choose the >disabled< option. Pressing
the [DATA DUMP] key will trigger the printout.
To print use an external trigger use the [SELECT] and [ENTER] keys to choose the
>enabled< option. Shorting the Ext Trigger input will trigger the printout.
PAGE 8-1

INTERFACE SET-UP PM3000A USER MANUAL
The timed trigger setup is then entered. The display shows:
TIMED TRIGGER PRN
>disabled<
The PM3000A will automatically print at a user specified time interval if this mode is
enabled. Use the [SELECT] and [ENTER] keys to >enable< or >disable< this option as
required. If enabled the display will show:
PRINTOUT INTERVAL
HH:MM >00:00<
Use the digit keys to enter the time interval between printed output. Use [SELECT] if you
make a mistake whilst entering the time. Press [ENTER] when the interval is correct.
Printouts will then occur automatically at the time interval selected. Additional printouts
may be initiated by pressing the [DATA DUMP] key.
8.1.2 PRINTING CHANNEL SELECTION RESULTS
Press the [INTERFACE] key and use [SELECT] and [ENTER] to >enable< the printer.
Then use [SELECT] and [ENTER] again to choose >selection<. The front panel display
shows:
SELECT CHANNELS
CH1
Use the Channel Select keys to choose the channels for which results will be printed. If a
channel is already displayed, pressing its key again will cancel it. Press [ENTER] when
the choice is correct.
Now use the function keys ([W], [VA], [VAr] etc) to enter the functions to be printed. If a
parameter is already displayed, pressing its key again will cancel it. Press [ENTER] when
the choice is correct.
If the fundamental components need to be printed use [SELECT] and [ENTER] to
>enable< this option. If both volts and amps harmonics have been selected, watts
harmonics can also be selected for print.
If harmonic measurements have been selected, the next display allows the user to enter
the maximum harmonic to be printed (1 to 99), and whether to print all harmonics (odd
and even) or odd only. (Note that choosing more than the fundamental harmonic of either
volts or amps will impose an additional burden on the processor and will lengthen the
measurement cycle).
The magnitude of the harmonics is printed in volts or amps, and as a percentage of the
fundamental value.
Finally the choice of triggering method is set as described in section 8.1.1.
PAGE 8-2

PM3000A USER MANUAL INTERFACE SET-UP
8.1.3 PRINTING INTEGRATOR RESULTS
Printouts will be generated automatically if the appropriate settings are made in the
integrator setup menu (see section 7.2)
8.1.4 PRINTING DATALOG RESULTS
Printouts will be generated automatically if the appropriate settings are made in the
datalog setup menu (see section 9.1)
8.2 IEEE488 INTERFACE
The PM3000A is configurable to IEEE488.1 and IEEE488.2 protocol standards. See
section 10 for a full description of the commands available in both modes.
To enable the IEEE488 interface, first use [ENTER] to choose the IEEE488 option from
the Interface menu, and then use [SELECT] and [ENTER] as necessary to choose
>enabled<. Next you are prompted for the IEEE bus address to be used by the
instrument. Enter the required address between 1 and 30 and press [ENTER]. Then use
[SELECT] and [ENTER] as necessary to choose >enabled< or >disabled< for the
IEEE488.2 protocol.
8.3 RS232 INTERFACE
The RS232 interface operates with 1 start bit, 8 data bits, 2 stop bits and no parity. The
baud rate is user selectable. Simple CTS/RTS handshaking is used to control data flow.
To enable the RS232 interface, first use [ENTER] to choose the RS232 option from the
Interface menu, and then use [SELECT] and [ENTER] as necessary to choose
>enabled<. The display will be similar to that shown below:
RS232 BAUD RATE
>19200<
Use the [SELECT] key to choose the required baud rate and press [ENTER] to confirm
the selection. The user must now choose between >printer< and >computer control<
using the [SELECT] and [ENTER] keys.
8.3.1 USING THE RS232 INTERFACE WITH AN EXTERNAL PRINTER
Choose the >printer< mode as described above. The printer output will now be directed to
the RS232 port on the rear of the PM3000A and a printer with a suitable serial interface
may be connected.
8.3.2 USING THE RS232 INTERFACE FOR COMPUTER CONTROL
Choose the >computer control< mode as described above to allow the interface to be
used for computer control. Note that all of the commands described in section 10 of this
manual are obeyed (IEEE488.1 and IEEE488.2).
PAGE 8-3

INTERFACE SET-UP PM3000A USER MANUAL
The PM3000A operates with a simple ASCII protocol where any received characters are
echoed back to the sender. On receipt of a carriage return, the command is processed
and any reply is returned terminated with an idle prompt, ">". Note that this means that all
commands return some characters (only the idle prompt if no other data). If the PM3000A
is unable to receive characters due to internal operations, it will de-assert the RTS
handshaking line. Due to delays in responding to the RTS line, the preferred method of
communicating with the PM3000A is to wait for the echoed data before sending the next
character.
The completed protocol then becomes:
DO send character
wait for echo
UNTIL all strings sent
send carriage return ('\r' or OD, hex or 13, decimal)
DO receive data
UNTIL '>' received
The echo function can be disabled by [F][P] 275 Verbose Mode (see Section 6.1).
The ‘REMOTE’ LED illuminates when the first command has been sent. A screen prompt
(>) is provided to denote that the RS232 line is idle. Connection details are shown in the
following tables:
25-way PC Connector
9-way PC Connector:
:
PM3000A Computer
screen 1 1 screen
Rx 2 2 Tx
Tx 3 3 Rx
CTS 4 4 RTS
RTS 5 5 CTS
20 20 DTR
6 6 DSR
ground 7 7 ground
Note: On some PC's it may be necessary to
link pins 20 and 6 at the PC connector
PM3000A Computer
Rx 2 3 Tx
Tx 3 2 Rx
CTS 4 7 RTS
RTS 5 8 CTS
1 DCD
4DTR
6DSR
ground 7 5 ground
Note: On some PC's it may be necessary to
link pins 1, 4 and 6 at the PC connector
PAGE 8-4

PM3000A USER MANUAL INTERFACE SET-UP
8.4 CHART RECORDER INTERFACE
In Chart Recorder mode, the ‘Analog – Alarms’ interface provides eight 0 to 5V DC
outputs. The signal provided from these outputs is proportional to the level of the function
being monitored. The Chart Recorder menu can be configured to record any eight
functions, including fundamentals and integrated values (except inrush current, Vpk, Apk,
Vharm, Aharm, CORR Vars, and AV PF) from channels 1, 2, 3, and SUM.
To enable the Chart Recorder interface first use [ENTER] to choose the chart recorder
option from the Interface menu, and then use [SELECT] and [ENTER] as necessary to
choose >enabled<. The display will be similar to that shown below:
CHART RECORDER
>R1<
Use the [SELECT] key to choose the required recorder output channel from R1 to R8 and
press [ENTER]. The display will then be similar to that shown below:
CHART RECORDER R1
>enabled<
Use the [SELECT] and [ENTER] keys as necessary to enable the recorder output
channel. The display will be similar to that shown below:
CHART RECORDER R1
>CH1<
Now use the Channel Select keys to set the required channel (CH1, CH2, CH3, ∑ or N)
and press [ENTER].
The function keys may be used to set the required parameter (e.g. Watts, VA, PF etc.),
followed by the [FUND] key if the fundamental is to be recorded. Then press [ENTER].
The display will be similar to that shown below:
RECORDER MINIMUM R1
>0.000<
Use the digit keys (along with the [k, M] key) to set the minimum value. The [SELECT] key
will allow the sign to be changed. Press [ENTER] and use a similar procedure to set the
maximum value. Press [ENTER] again, and the display returns to the recorder channel
selection mode.
When level of reading for a selected function is less than or equal to the lower limit, the
Chart Recorder output will be zero. When the level of the reading for the selected function
is greater than or equal to the upper limit, the Chart Recorder output will be +5V.
Repeat the above process to set all required recorder channels and then use [SELECT] to
display >Quit<. Press [ENTER] to save the settings and return to the default display.
PAGE 8-5

INTERFACE SET-UP PM3000A USER MANUAL
The chart recorder output is now active, and available at the ANALOGUE ALARMS output
connector on the rear panel. See the next section for the pin-out connections. To disable
it, re-enter the menu and choose ‘disabled’.
With the Chart Recorder enabled, the Chart Recorder level will change between 0 and
5V, in proportion to the function being recorded between the upper and lower limits.
8.5 ANALOGUE OUTPUTS INTERFACE
The PM3000A has an Analogue Alarms interface at the rear panel, which can be
configured to work as a Chart Recorder (described above), Analogue Alarm, or as an
Analogue Output.
8.5.1 ANALOGUE ALARMS
To set alarms simply program the low and high limits in the Chart Recorder option to the
same value. If the measured value is below the limit, the recorder output will be 0V, if the
measured value is above the limit, the recorder output will move to +5V.
ANALOGUE PIN RECORDER
CONNECTOR
25 WAY 'D' 1 R1
SOCKET 3 R2
5 R3
7 R4
9 R5
11 R6
13 R7
15 R8
2-16 even GROUND
8.5.2 A
In this mode the waveforms on each input are digitized and sent to the analogue outputs.
The outputs can therefore be conveniently viewed in real time and at a safe potential (0 to
5V). The outputs can be viewed without distortion for waveforms with frequencies less
than 1kHz. The voltage and current ranges can be changed to obtain the best resolution,
but all other measurement functions cease when this mode is active. For this reason it is
not possible to enter this mode whilst the integrator is running.
To enable the Analogue Outputs interface first use [ENTER] to choose the analogue
outputs option from the Interface menu. The display shows:
NALOGUE OUTPUTS
PAGE 8-6
ANALOGUE OUTPUT MODE
time date

PM3000A USER MANUAL INTERFACE SET-UP
The waveforms will now be output to the analogue connector. Cancel this mode by
pressing the [INTERFACE] key. See the table below for pinout details.
WIRING PIN WAVE FORM
SINGLE PHASE/
TWO WIRE
SINGLE PHASE / THREE
WIRE
THREE PHASE / THREE
WIRE
1
3
15
2-16 EVEN
1
3
5
7
13
15
2-16 EVEN
1
3
5
CH1 AMPS
CH1 VOLTS
SCOPE TRIGGER
GROUND
CH1 AMPS
CH1 VOLTS
CH2 AMPS
CH2 VOLTS
NEUTRAL AMPS
SCOPE TRIGGER
GROUND
CH1 AMPS
CH1 VOLTS
CH2 AMPS
THREE PHASE / FOUR
WIRE
7
13
15
2-16 EVEN
1
3
5
7
9
11
13
15
2-16 EVEN
CH2 VOLTS
NEUTRAL AMPS
SCOPE TRIGGER
GROUND
CH1 AMPS
CH1 VOLTS
CH2 AMPS
CH2 VOLTS
CH3 AMPS
CH3 VOLTS
NEUTRAL AMPS
SCOPE TRIGGER
GROUND
ANALOGUE OUTPUT CONNECTOR: Note that the neutral current will be output on a
reduced scale compared to the other phase current.
PAGE 8-7

INTERFACE SET-UP PM3000A USER MANUAL
8.6 AUXILIARY INPUTS
If fitted with this option the PM3000A has two BNC input connectors on the real panel
marked AUXILIARY INPUTS A and B. Each input can accept a slowly fluctuating DC level
of 0-1V or 0-10V (menu-selected) from a signal conditioner connected to a motor tachogenerator or torque transducer. In addition, the EXTERNAL FREQ BNC connector can be
used to input a pulse signal from a transducer, which is proportional to motor speed.
These features allow the user to monitor motor torque, speed and mechanical power,
together with efficiency based upon these inputs, and the electrical power delivered to the
motor (monitored on the main channel inputs).
Connect the motor electrical inputs to CH1/CH2/CH3 in 3Ø3W or 3Ø4W mode. Connect
the torque and speed inputs to the marked BNC inputs (Channel A = torque input,
Channel B or EXTERNAL FREQ = speed input).
To enable the Auxiliary Inputs interface first use [ENTER] to choose the auxiliary inputs
option from the Interface menu, and then use [SELECT] and [ENTER] as necessary to
choose >enabled<. The display will be similar to that shown below:
TORQUE INPUT
>10V full scale<
Use the [SELECT] and [ENTER] keys to choose the appropriate DC voltage range for the
input to the Torque Channel (10V or 1V). The display will then show:
TORQUE INPUT
>torque in Nm<
Use the [SELECT] and [ENTER] keys to choose Newton-meters (Nm) or foot-pounds
(ftlb) as the units of torque for the display. The display will then show:
TORQUE INPUT
>1.000 per Volt<
Use the digit keys to enter the scaling for the torque input in the selected units, and press
[ENTER]. The display will then show:
RPM INPUT
>pulse<
Use the [SELECT] and [ENTER] keys to choose the appropriate input for motor speed
(rpm). Choose ‘pulse’ if a pulse transducer output has been connected to EXTERNAL
FREQ. Choose ‘voltage’ if a voltage transducer output has been connected to the
AUXILIARY input B.
PAGE 8-8

PM3000A USER MANUAL INTERFACE SET-UP
P
t
P
If ‘voltage’ has been selected, the display will show:
RPM INPUT
>10V full scale<
Use the [SELECT] and [ENTER] keys to choose the appropriate DC voltage range for the
input to the RPM Channel (10V or 1V). The display will then show:
RPM INPUT
>1.000 per Volt<
Use the digit keys to enter the scaling for the RPM input and press [ENTER]. The display
will then show:
If ‘pulse’ has been selected for the RPM INPUT, the display will show:
HIGH FREQUENCY
>disabled<
Use the [SELECT] and [ENTER] keys to enable the high frequency mode if required. The
display will then show:
RPM INPUT
>1.000 pulses/rev<
Use the digit keys to enter the scaling for the speed input, in pulses per revolution of the
motor, and press [ENTER].
With 3Ø3W or 3Ø4W selected, and [W] selected for display, press the [∑] channel key.
The display will now show:
xxxx Nm xxxx rpm
xxxx W xxxx %
The top line shows torque and speed. The bottom line shows mechanical power and
motor efficiency (horsepower and ft.lb would be used if originally selected).
Pressing the [DISPLAY] key when [∑W] is selected will toggle the display between the
mechanical data presentation (auxiliary inputs) and the electrical data presentation (CH1,
CH2, CH3 inputs).
Efficiency is calculated from the formula:
100 ×
owerOu
%
ower In
Where Power Out is the Mechanical Power displayed in the auxiliary window, and Power
In is the simultaneous electrical power input to the motor on the
∑ channel.
PAGE 8-9

INTERFACE SET-UP PM3000A USER MANUAL
If a background selection printout is requested, while this mode is selected, it will
automatically printout the auxiliary data (there is no means of requesting it in the printer
menu), as seen in the following example.
04 July 98 15:54
RMS DC COUPLED
VOLTAGE FREQUENCY SOURCE
************* CHANNEL 1 *************
Watts + 12.367 W
Vrms 96.96 V
Arms 127.72mA
************* CHANNEL 2 *************
Watts + 13.830 W
Vrms 97.21 V
Arms 142.37mA
************* CHANNEL 3 *************
Watts + 13.297 W
Vrms 98.01 V
Arms 136.12mA
************* SUM 1+2+3 *************
Watts + 39.49 W
Vrms 168.69 V
Arms 135.38mA
************* AUXILIARY *************
Torque 50.63 Nm
Speed 7.002 rpm
Power 37.13 W
Efficiency 94.01 %
****************************************
PAGE 8-10

PM3000A USER MANUAL DATA LOG
CHAPTER 9
D
ATA LOG

DATA LOG PM3000A USER MANUAL

PM3000A USER MANUAL DATA LOG
9.1 DATA LOG OVERVIEW
The PM3000A can record and analyze short term events, from a few milliseconds, up to
several seconds. The waveforms are recorded and parameters already set up on the
printer menu are printed after analysis.
Data logging can be triggered manually, or triggered externally using the ‘external trigger’
input on the rear panel. The waveforms themselves are available on the analogue
outputs.
The results from the analysis are not available at the front panel display. Prior to using
data log the user has to specify the functions to be printed (printer menu). When the
results have been computed they will automatically be sent to the printer.
There are two Data Log modes:
‘Cycle by Cycle’ - where the analysis is performed on a per-cycle basis.
‘Datalog’ - where the analysis is performed over a user entered time.
To set up the mode, press the [DATA LOG] key and next display is as follows:
CYCLE BY CYCLE LOG
>disabled<
Use the [SELECT] and [ENTER] keys to choose >disabled< or >enabled< as required.
9.2 CYCLE BY CYCLE ANALYSIS
After entering the number of cycles to analyze, the PM3000A will produce RMS
measurements for each cycle - there is no averaging over cycles, or missing cycles. The
data may be printed, or returned to a computer for further analysis over the IEEE488 or
RS232 interfaces.
The following parameters may be measured on a cycle-by-cycle basis:
CH1, CH2, CH3 - Watts, Volts, Amps, VA,
VAr, Power Factor,
Frequency, and Impedance.
∑ Watts, Volts, Amps, VA,
VAr, and Power Factor.
Neutral - Amps.
Auxiliary Inputs - Torque, Speed.
The speed input must be the analogue level to input B, since a pulse speed input cannot
be analyzed on a cycle-by-cycle basis.
PAGE 9-1

DATA LOG PM3000A USER MANUAL
9.2.1 SETTING UP CYCLE BY CYCLE MODE
Choose >enabled< for CYCLE BY CYCLE LOG and the next display will be:
LOG SAMPLES/CYCLES
>1860<
Use the digit keys to input the number required and then press [ENTER]. The maximum is
1860 (31 seconds at 60Hz). The display will then show:
EXTERNAL TRIGGER LOG
>disabled<
Analysis can be triggered via the front panel [START] key, the rear trigger input or the
IEEE LOG:TRG (or EXT) :CYC(x) command (x=number of cycles).
Use the [SELECT] and [ENTER] keys to choose >disabled< or >enabled< for the rear
panel trigger input as required. The display will then show:
DATALOG
SET MANUAL RANGE
In cycle-by-cycle mode, the auto-ranging feature is disabled and the user must set the
correct volts and amps range to suit the intended measurement. The ranges should be
set higher than the maximum peak input likely to occur. For example, if an inrush of about
20 amps peak is expected, the 50-amp range should be chosen.
Use the up and down arrow keys beneath the appropriate LED array to select a
measurement range for voltage and current, and then press [ENTER]. The display now
changes to:
DATALOG
waiting for trigger
The measurements will then commence after the trigger has been received, and the lower
display line will show ‘triggered’.
For local operation, the data is output to the selected printer port (parallel or RS232) with
each cycle on one line, as shown in the example printout on the next page.
The status indicates OVER if a higher range is required (data invalid), or UNDER if a
lower range could be used (data may be outside specification).
Note that once triggered, analysis begins in 10 to 20µsec. The data used for cycle ‘0’ will
be incomplete and should be ignored.
PAGE 9-2

PM3000A USER MANUAL DATA LOG
9.2.2 CYCLE BY CYCLE EXAMPLE PRINTOUT
18 Jly 95 13:42
RMS DC COUPLED
Cycle Status Frequency Channel 1
Hz W V A PF
0 OVER 2.620 +1.9453 357.7m 5.469 0.994
1 OK 10.064 +15.376 1.0134 12.874 1.000
2 OK 10.072 +15.409 1.0140 12.847 1.000
3 ......
9.3 DATALOG
In Datalog, the user has to specify the capture time, the voltage and current ranges (auto
ranging is not available in datalog), and the trigger. Once triggered the instrument takes a
number of samples on all channels over the chosen capture time. This data is then
analyzed.
9.3.1 TO S
A selection of results to be printed must first be made from the printer menu (see section
8.1.2).
Check that the correct wiring, coupling, shunt etc. has been chosen. Datalog is not
configurable with Integrator or PWM mode.
Press the [DATA LOG] key and next display is as follows:
ET UP DATALOG FUNCTIONS
CYCLE BY CYCLE LOG
>disabled<
Use the [SELECT] and [ENTER] keys to choose >disabled< and the next display will be:
DATALOG WINDOW
>30 ms<
Using the [SELECT] and [ENTER] keys choose the required time from >30 ms<, >60
ms<, >300 ms<, >1 s<, >5 s<, or >18 ms – 65 s<. If the latter option is chosen use the
digit keys to enter the required time in ms (e.g. for 9 sec, enter 9000), then press
[ENTER].
PAGE 9-3

DATA LOG PM3000A USER MANUAL
The next display will then show:
EXTERNAL TRIGGER LOG
>disabled<
Analysis can be triggered via the front panel [START] key or the rear trigger input.
Use the [SELECT] and [ENTER] keys to choose >disabled< or >enabled< for the rear
panel trigger input as required. The display will then show:
DATALOG
SET MANUAL RANGE
In data log mode the autoranging feature is disabled and the user must set the correct
volts and amps range to suit the intended measurement. The ranges should be set higher
than the maximum peak input likely to occur. For example, if an inrush of about 20 Amps
peak is expected, the 50 amp range should be chosen.
Use the up and down arrow keys beneath the appropriate LED panel display to select a
measurement range for voltage and current, and then press [ENTER]. The display now
changes to:
DATALOG
waiting for trigger
Press the [START] key to capture the event. The delay from trigger to the commencement
of sampling is in the order of 10 - 20 µS. The display will show:
DATALOG
triggered
After the trigger, the LED under the [START RESET] key will illuminate to show that the
analysis is under way. When the analysis is complete, the LED will turn off and the results
chosen to be output will be printed. At the same time the captured waveforms will be
presented on the analogue outputs connector. If there is a neutral wire, the calculated
neutral waveform will be output. An oscilloscope trigger output is also generated.
After the event has been captured the display will show:
DATALOG
>stop< or >reset<
PAGE 9-4
To set up a different menu in DATALOG, first exit DATALOG by pressing [STOP] and
then re-enter the menu. Press [RESET] to arm the PM3000A for another datalog trigger
under the same conditions.

PM3000A USER MANUAL DATA LOG
9.3.2 DATA LOG SAMPLE RATES
WIRING CAPTURE
TIME
ALL WIRING SETUPS 30 mSec 5 uS 50kHz 6000
60 mSec 10 uS 25kHz 6000
300 mSec 50 uS 5kHz 6000
1 Sec 167 uS 1.5kHz 6000
5 Sec 833 uS 300Hz 6000
NOTE: The maximum input wave form frequency is limited as indicated in the MAX. FREQ
column, if harmonic analysis, fundamental or frequency are to be recorded.
SAMPLE
RATE
MAX. FREQ SAMPLES /
CHANNEL
PAGE 9-5

DATA LOG PM3000A USER MANUAL
PAGE 9-6

PM3000A USER MANUAL IEEE COMMUNICATION
CHAPTER 10
EEE COMMUNICATION
I

IEEE COMMUNICATION PM3000A USER MANUAL
 Loading...