

Page 1

Datalogger Graph Software Help
Version 1.2, March 9, 2007
For additional information refer to the user guide included on the supplied program disk.
CONTENTS
Quick Start Guide
Installing Graph Software
Installing USB Driver
LED Status Guide
Menu Bar Description
Logger Setup
Logging Readings
Downloading Readings to PC
Data Graph Window description
Save and Open Data Files
Print Data Graph
Clear Logged Data
Page 2

QUICK START GUIDE
1. Remove the semi-transparent cap from the Datalogger.
2. Install the battery in the Datalogger. If battery has been installed, you’d better make sure the battery in the
Datalogger is sufficient to finish your task. For more details, see USER’S GUIDE.
3. Insert the Datalogger into a free USB port on your computer. The computer will automatically detect the
presence of the Datalogger and start the hardware installation process.
4. Double-click the Datalogger icon on your desktop to launch the graph software. You will see the Main Screen.
5. Set up and start the Data Logger and follow the setup procedure:
-Select the Start Mode
-Enter the Logger Name
-Select the Sample Point
-Select the LED Flash Cycle
-Confirm whether LEDs flash when the logging exceed the configured alarm level.
-Select the Unit for Temperature.
-Enter Low Alarm and High Alarm for Temperature and Relative Humidity.
-Then click the Setup button
6. The
7. Remove the Logger from the computer and place it in the location where you want to measure temperature.
summary screen will appear.
Notes: When the Logger is connected to the USB port, the battery inside the Data Logger is discharged at a higher rate
than normal. To conserve battery life, do not leave the Logger connected to the USB port for a prolonged period of time.
INSTALLING GRAPH SOFTWARE
1. Start Windows
2. Insert the CD into the CD-drive of your computer.
3. Run SETUP.EXE installation program on the CD, install it to the referred file directory.
4. The datalogger icon will be built on your desktop.
INSTALLING USB DRIVER
1. Insert the datalogger into a USB port on the computer.
2. Then the Windows system will show finding a new hardware.
3. Ensure the CD is in the CD-drive.
4. Choose specific directory to the CD in the CD-Drive.
5. The Windows system will start copying USB driver to your computer.
Page 3
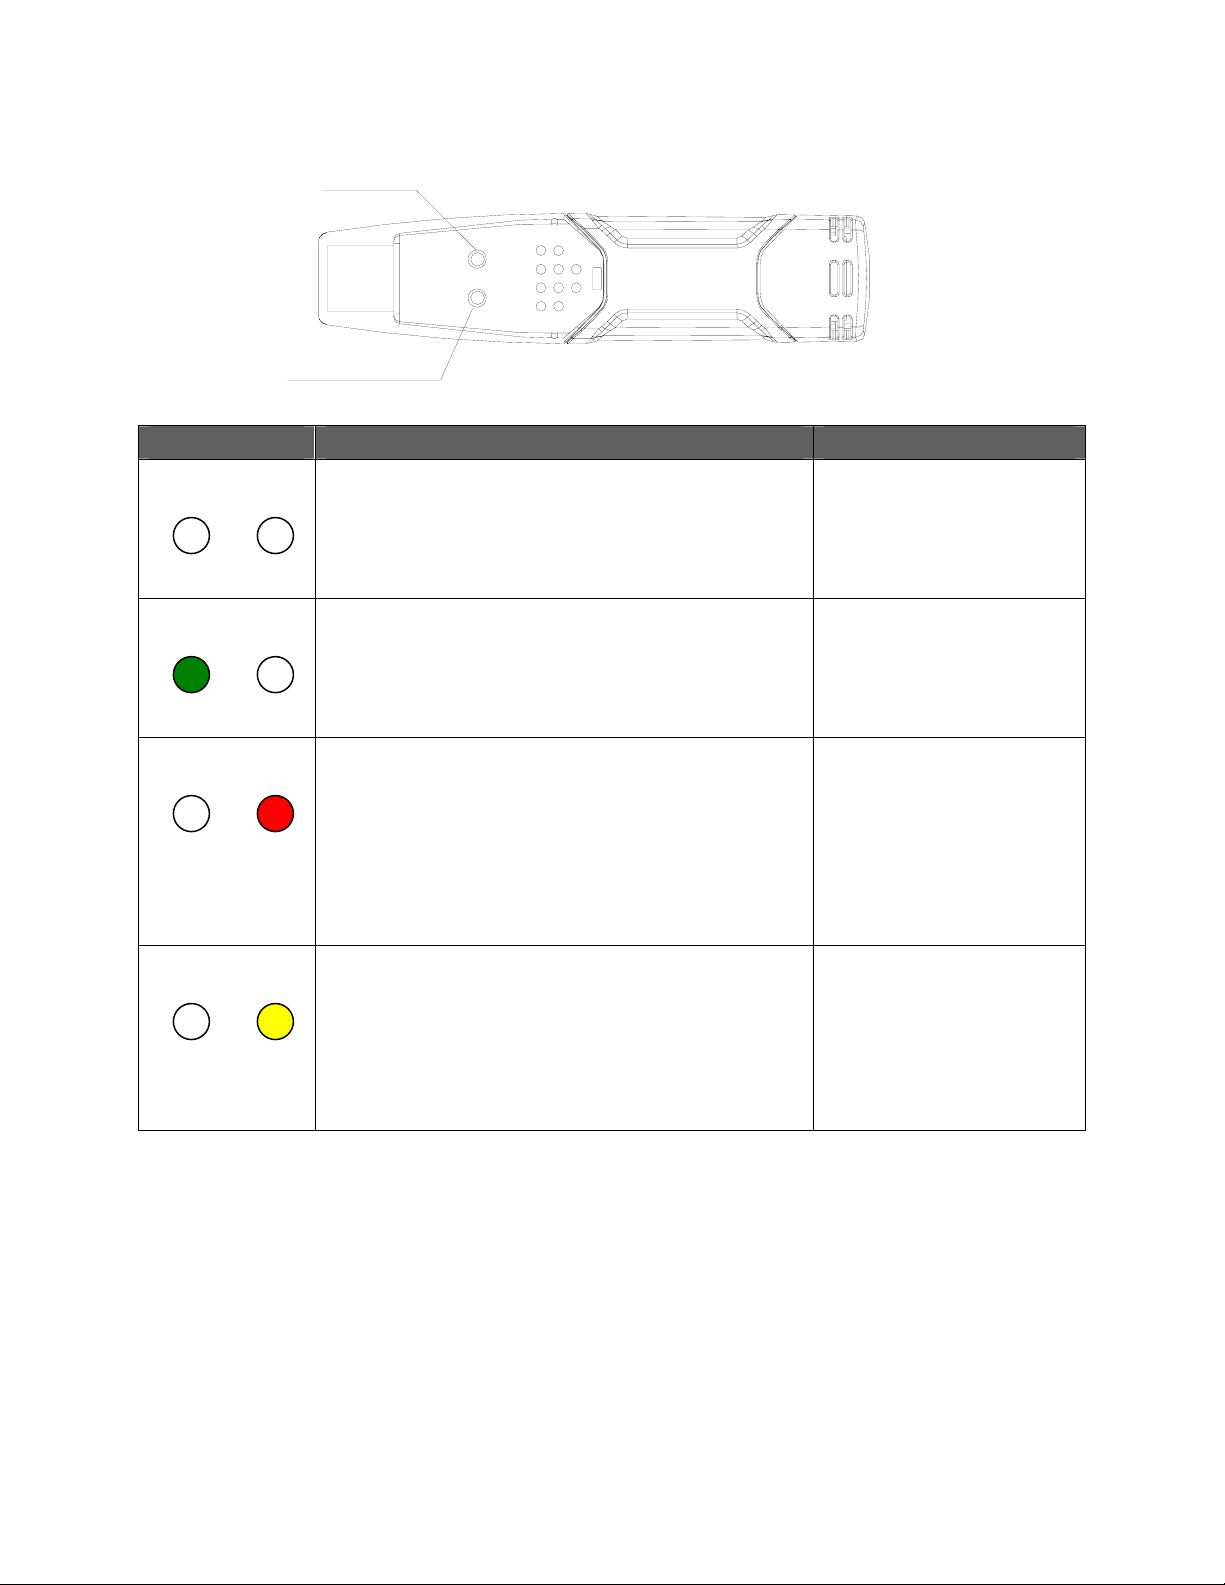
LED STATUS GUIDE
Green LED
REC
ALM
Red/Yellow LED
LED Status Indication Action
REC ALM
REC ALM
Logging active, no alarm condition**
REC ALM
REC ALM
Logging active, low alarm condition for RH***
Logging active, high alarm condition for RH***
Yello w single flash every 10 sec. *
Logging active, low alarm condition for TEMP***
Yello w double flash every 10 sec. *
Logging active, high alarm condition for TEMP***
* To save power, the logger’s LED flashing-cycle can be changed to 20s or 30s via the supplied software.
** To save power, alarm LEDs for temperature and humidity can be disabled via the supplied software.
***When both temperature and relative humidity readings exceed alarm level synchronously, LED status indication
alternate every cycle.
****When the battery is low, all operations will be disabled automatically. NOTE: Logging auto matically stops when
the battery weakens (logged data will be retained). The supplied software is required to resta rt loggin g and to
download logged data.
Both LED lights OFF
Logging not active
Or
Low Battery
One green flash every 10 sec. *
Green double flash every 10 sec.
Delayed start
Red single flash every 10 sec. *
Red double flash every 10 sec. *
Red single flash every 60 sec.
Low Battery****
Yello w single flash every 60 sec.
Logger memory full
Start logging
Replace battery and
download the data
To start, hold the start
button until Green and
Yellow LED flash
If logging, logger will stop
automatically. No data will
be lost. Replace battery
Download the data
Page 4

MENU BAR
From left to right the menu bar icons represent DATA DOWNLOAD, LOGGER SETUP, FILE OPEN, FILE
SAVE-AS, FILE PRINT, VIEW ALL, and ZOOM. In addition, the FILE, VIEW, LINK, and HELP pull-down menus
are available here. All will be discussed in the following paragraphs. Start by setting up the Logger as explained in
the following section.
SETUP THE LOGGER
Click on the computer icon on the menu bar (2nd from left) or select LOGGER SET from the LINK pull-down menu.
The Setup window will appear as shown below; descriptions for each field in the Setup window are listed directly
below the illustration:
The CURRENT TIME field will automatically synchronize with the PC date and time setting
The MANUAL and INSTANT select buttons allow the user to start datalogging immediately when the Setup
window is exited (INSTANT) or at a later time (MANUAL). Explained in the LOGGING READINGS section
The LOGGER NAME field allows the user to select a unique name for the logger
The SAMPLE POINTS field instructs the logger to take a finite number of readings
The SAMPLE RATE pull-down menu instructs the logger to log readings at a specific rate
The LED Flash Cycle can be set by the user (the longer the time, the longer the battery life)
The ALARM SETTINGS portion of the SETUP window allows the user to set HIGH and LOW temperature/RH
limits and disable the flashing of the Logger’s LEDs thereby conserving battery energy
Click on the SETUP button to save changes. Press the DEFAULT button to set the Logger to factory default
condition. Press the CANCEL button to abort the setup.
Notes: Any stored data will be permanently erased when Setup is finished. To enable you to save this data before it is
lost, click Cancel and then you need to download data.
The battery will in all likelihood run out before logger will have finished specifi ed sample points. Always ensure
that the remaining charge in the battery is sufficient to last the complete duration of your logging exercise. If in doubt,
Page 5

we recommend that you always install a fresh battery before logging critical data.
LOGGING READINGS
If INSTANT was selected in the SETUP window, the Logger begins logging at the instant the SETUP button is
pressed. If MANUAL was selected, the Logger must be manually started by pressing and hol ding the Logger’s
yellow button for approx. 3 seconds or until the two LEDs on the Logger flash at the same time.
Logging will continue at the programmed sample rate until the number of reading s (sample points) specified in the
Setup window is reached.
The green LED flashes once per sample point and the red or yellow LED flashes when user programmed alarm
limits are exceeded. For details, see LED status guide.
DOWNLOAD SAVED DATA TO PC
To transfer the readings stored in the Logger to the PC:
1. Connect the Logger to the same USB port used when the Logger was initialized
2. Open the Datalogger software program if it is not still running
3. Click the Download icon (1
4. The Window shown below will appear. Press DOWNLOAD to begin transferring readings
st
on the left) or select Data Download from the LINK pull-down menu
If readings are successfully transferred, the VIEW screen and the SAVE screen (both shown below) will appear.
In the SAVE screen, name the file and save it to a convenient location. At a later time, the user can select
SAVE-AS and save the data as an Excel, Text, or Bitmap file (explained in next section), however, the data in this
case is saved as an .rec file for use in this program only.
In the VIEW screen (below) press VIEW to see the data graphically. If there are no reading s currently stored in the
Logger, the program will let the user know via warning screen.
Page 6

When VIEW is pressed, the Data Graph window appears (pictured and discussed in the next se ction)
DATA GRAPH
The Data Graph window presents the transferred data in x-y graph format with Date/Time represented on the
horizontal axis and Temperature / %Relative Humidity / Dew Point / Alarm Limits represented on the y axis:
To zoom in and zoom out data regions, there are several approaches, these are:
1. Use the mouse to click and drag a box around any data area to magnify the area selected.
2. Click on the zoom magnifier icon tool on the menu bar
3. Select VIEW ALL or ZOOM OUT from the VIEW pull-down menu.
Page 7

In the example graph above, the Temperature is represente d by the solid red line (the lines are known as ‘traces’),
the Relative Humidity % by the solid yellow trace, and the Dew Point Temperature by the solid green trace. The
low and high alarm values for temperature are represented by the dash ed red trace, the low and high alarm v alues
for Relative Humidity by the dashed yellow trace.
To customize the graph window select SHOW TRACES, BACKGROUND, GRID LINES, and MASK POINTS from
the VIEW pull-down menu. These options provide the following features:
SHOW TRACES: Allows the user to select which data to view as a trace (Tempe rature, RH, Dew Point, & Alarms).
BACKGROUND: Select background color scheme.
GRID LINES: Add or remove grid lines from x and y axes.
MASK POINTS: Places dots on the traces for the actual data points, breaking up the continuous nature of a trace.
Notes: The horizontal grid line will be aligned to specific values on the temperature axis, while any alignment with
specific values on the relative humidity axis is merely coincidental.
SAVE AND OPEN DATA FILES
To save the transferred data in a format other than the proprietary .rec format, click the SAVE AS icon from the
menu bar (4
formats:
TEXT FILE (.txt)
EXCEL FILE (.xls)
BITMAP FILE (.bmp)
th
from right) or select SAVE AS from the FILE pull-down menu. The data can be saved in the following
To open an existing data file for viewing on the data graph window, click on the FILE OPEN icon on the menu bar
rd
from left) or select FILE OPEN from the FILE pull-down menu. When prompted, select a .rec file saved earlier.
(3
PRINT DATA GRAPH
To print a data graph window to a line or network printer, click on the printer icon or select PRINT from the FILE
pull-down menu. Note that color graph windows can be accurately printed on color printers.
CLEAR LOGGER DATA
The Logger retains data in its internal memory until the user begins a new loggin g session. Starting a new logging
session clears all of the logger’s stored readings; be sure to save data before starting a new logging session.
 Loading...