


USER’S GUIDE
6000-2 & 6000-3
Phase Angle Voltmeters


Warranty
This Vitrek instrument is warranted against defects in material and workmanship for
a period of two years after the date of purchase. Vitrek agrees to repair or replace
any assembly or component (except batteries) found to be defective, under normal
use, during the warranty period. Vitrek's obligation under this warranty is limited
solely to repairing any such instrument, which in Vitrek's sole opinion proves to be
defective within the scope of the warranty, when returned to the factory or to an
authorized service center. Transportation to the factory or service center is to be
prepaid by the purchaser. Shipment should not be made without prior authorization
by Vitrek.
This warranty does not apply to any products repaired or altered by persons not
authorized by Vitrek or not in accordance with instructions provided by Vitrek. If
the instrument is defective as a result of misuse, improper repair, or abnormal
conditions or operations, repairs will be billed at cost.
Warranty 3
Vitrek assumes no responsibility for its product being used in a hazardous or
dangerous manner, either alone or in conjunction with other equipment. Special
disclaimers apply to this instrument. Vitrek assumes no liability for secondary
charges or consequential damages, and, in any event, Vitrek's liability for breach of
warranty under any contract or otherwise, shall not exceed the original purchase
price of the specific instrument shipped and against which a claim is made.
Any recommendations made by Vitrek or its representatives, for use of its products
are based upon tests believed to be reliable, but Vitrek makes no warranties of the
results to be obtained. This warranty is in lieu of all other warranties, expressed or
implied and no representative or person is authorized to represent or assume for
Vitrek any liability in connection with the sale of our products other than set forth
herein.
Instrument Serial Number: _________________________________________

4 6000-2 & -3 User Guide, Rev E
Document Part Number MO-6000-M Revision E
Copyright
Copyright© 1995–2005 Vitrek. All rights reserved.
All rights reserved. No part of this publication may be reproduced, transmitted,
transcribed, stored in a retrieval system, or translated into any language in any form
with prior written consent from Vitrek. This product manual is copyrighted and
contains proprietary information, which is subject to change without notice. The
product displays and manual text may be used or copied only in accordance with the
terms of the license agreement.
Vitrek
is a trademark of Vitrek. All other trademarks or
registered trademarks are acknowledged as the exclusive property of their respective
owners.
In the interest of continued product development, Vitrek reserves the right to make
changes in this guide and the product it describes at any time, without notice or
obligation.
Manufacturers of Engineering & Production Test Equipment
12169 Kirkham Road
Poway, CA 92064
(858) 689-2755
E-Mail: info@vitrek.com

Contents 5
Contents
Warranty_________________________________________________ 3
Introduction _____________________________________________ 11
Features _________________________________________________11
Principles of Operation _____________________________________12
Central Processor _______________________________________ 12
Signal Conditioning and DSP Sections ______________________ 13
Input Scaling___________________________________________ 14
Amplitude Measurement Circuitry and DSP __________________ 14
Frequency Measurement _________________________________ 15
Range/Mode Control ____________________________________ 15
Sample Clock Generation _____________________________ 15
Filter Clock Generation _______________________________ 16
Front Panel Operation _____________________________________ 17
Front Panel Operational Features______________________________17
Power Switch __________________________________________ 17
The Display ___________________________________________ 17
Display Select Keys _____________________________________ 18
The Up and Down Arrow Keys ____________________________ 19
The Left and Right Arrow Keys____________________________ 19
Total & Harms Keys_____________________________________ 19
Numeric Entry Keys_____________________________________ 20
Clear & Enter Keys _____________________________________ 20
Store & Recall Keys_____________________________________ 20
Setup Key_____________________________________________ 21
Local Key & Indicator ___________________________________ 21
Calibration Key ________________________________________ 22
Print Key______________________________________________ 22
The Nullmeter _________________________________________ 22
Input Connector Keys & Indicators _________________________ 23

6 6000-2 & -3 User Guide, Rev E
Making Input Connections___________________________________24
Guard Connections______________________________________ 24
Input Cables ___________________________________________ 25
Using the Operational Keys __________________________________25
Changing Displayed Information or Settings__________________ 25
Setting Defaults ________________________________________ 27
Entering New or Changed Information ______________________ 30
Setting/Formatting Time & Date ___________________________ 31
Storing & Retrieving Configurations___________________________32
Store & Recall Memory Menus ____________________________ 33
Storage Area Maintenance ________________________________ 34
Repacking of the Storage Areas____________________________ 35
Rear Panel ______________________________________________ 37
Connectors & Controls _____________________________________37
Power Connection ______________________________________ 38
Configuration Control Switch _____________________________ 38
Parallel Printer Interface__________________________________ 38
RS232 Connectors ______________________________________ 38
IEEE488 Connector _____________________________________ 38
Configuration Setup_______________________________________ 39
Setup Guidelines __________________________________________39
Input Configuration Menu ___________________________________43
Input Scaling___________________________________________ 43
Guard ________________________________________________ 43
Measurement Configuration Menu ____________________________44
Fundamental Frequency__________________________________ 44
Fundamental Frequency Range ____________________________ 45
Fundamental Source_____________________________________ 45
Nominal Amplitude Measurement Period ____________________ 46
Filter Frequency ________________________________________ 47
Maximum Harmonics____________________________________ 47
Fundamental÷Bandwidth _________________________________ 48
Analysis ______________________________________________ 48
Fundamental Frequency Averaging _________________________ 49
Fundamental Frequency Measurement Period_________________ 49
Nullmeter Display Menu ____________________________________49
Nullmeter Parameter Types _______________________________ 49

Contents 7
Parameter Display Menus ___________________________________50
Parameter (p) __________________________________________ 50
Reference Parameter (r) __________________________________ 54
Reference Parameter Type ________________________________ 54
Data Result Units _______________________________________ 54
Comparison Limit_______________________________________ 55
Filter Time Constant_____________________________________ 56
Some Useful Hints ______________________________________ 56
Showing Percentages & dB Changes_____________________ 56
Unstable Displayed Results ____________________________ 57
Display Line Format _______________________________________57
Nullmeter Scale Menu ______________________________________58
Scale Factor ___________________________________________ 58
Type _________________________________________________ 59
Additional Application Examples _____________________________60
Interface Operation _______________________________________ 63
RS232 Data Format Selection ________________________________63
IEEE488 Interface Setup ____________________________________64
Configuring the Controller Card ___________________________ 65
Configuring the Controller Software ________________________ 66
Interrogating the Data ______________________________________67
Reading Data __________________________________________ 67
Sending Data __________________________________________ 68
RS232 Interfacing_______________________________________ 69
IEEE488 Interfacing_____________________________________ 69
Bus Timing_________________________________________ 69
Bus Commands _____________________________________ 69
Application for the Lower Case Portions of Commands______ 70
Command Set_____________________________________________71
Interface Commands_____________________________________ 71
Available Parameter Strings_______________________________ 74
Retrieving Parameters ________________________________ 75
Source and Bandwidth Strings__________________________ 79
Sub-Definition Strings ________________________________ 80
Special Parameter Strings _____________________________ 81
ID Data Format _____________________________________ 82
UNITS=String Format ________________________________ 82
Full-Parameter Definition Format _______________________ 84

8 6000-2 & -3 User Guide, Rev E
High Speed Operation ______________________________________85
Measurement Periods____________________________________ 85
Frequency Measurement _________________________________ 85
Harmonic Measurement__________________________________ 85
Interrogating Results ____________________________________ 85
Maintenance & Calibration _________________________________ 87
Daily Maintenance_________________________________________87
Low Level DC Measurements _____________________________ 87
Procedure without Equipment __________________________ 87
Procedure with Equipment_____________________________ 88
External Calibration________________________________________89
Preparation for Calibration________________________________ 90
Required Equipment_____________________________________ 91
Calibration Procedure____________________________________ 91
Performing a Partial Calibration ______________________________93
Performing a Calibration Check Only __________________________93
Appendix A: AIO Option___________________________________ 95
AIO Option Features _______________________________________95
AIO Option Commands_____________________________________95
Appendix B: Specifications _________________________________ 97
Voltage Input _____________________________________________97
Current Input _____________________________________________98
Input Filtering ____________________________________________98
Phase ___________________________________________________98
Fundamental Frequency Measurement _________________________99
Harmonic Analysis_________________________________________99
Peak Parameters__________________________________________100
Date and Time ___________________________________________100
General_________________________________________________100

Contents 9
Figures
Figure 1. System Block Diagram _______________________________________ 12
Figure 2. Digital Signal Processing Block Diagram_________________________13
Figure 3. Sample Clock_______________________________________________ 16
Figure 4. The 6000-3 Voltmeter Front Panel ______________________________17
Figure 5. Display Showing Results Data _________________________________18
Figure 6. The Nullmeter ______________________________________________22
Figure 7. Input Terminals _____________________________________________ 23
Figure 8. Display Line Configuration Data _______________________________ 26
Figure 9. Rear Panel Partial View_______________________________________ 37
Figure 10. Initial Setup Display ________________________________________ 39
Figure 11. Setup Measurements Display__________________________________40
Figure 12. Input Configure Display _____________________________________41
Figure 13. Nullmeter Sample Display____________________________________42
Configuration Examples
ØTo change a display line of Results Data: _______________________________ 26
ØTo select an option: ________________________________________________ 26
ØTo set defaults:____________________________________________________27
ØTo abort a displayed menu and discard any changes: ______________________ 28
ØTo change a display line: ____________________________________________28
ØTo adjust a “noisy” measurement (to a given value): ______________________29
ØTo provide a “fast/medium/slow” style of adjustment capability: ____________ 29
ØTo add display lines (up to 50 lines possible): ___________________________ 30
ØTo delete a display line:_____________________________________________30
ØTo add dashes in a display line as a separator: ___________________________ 30
ØTo “enter” data and changes into the menu—when the cursor is flashing:______ 30
ØTo “enter” data and changes into the menu—when no cursor is visible: _______31
ØTo adjust the time display:___________________________________________ 31
ØTo format the time display: __________________________________________ 32
ØTo set the date format: ______________________________________________ 32
ØTo set the date display: _____________________________________________32

10 6000-2 & -3 User Guide, Rev E
ØTo store a configuration in an already defined storage area:_________________33
ØTo store a new configuration (presently displaying): ______________________33
ØTo recall a configuration:____________________________________________ 34
ØTo rename an existing storage area:____________________________________34
ØTo delete a storage area: ____________________________________________34
ØTo manually prompt the repacking of storage areas:_______________________ 35
ØSetting fundamental frequency mode and range for input connectors: _________39
ØSetting the input mode for each input connector: _________________________41
ØTo change the (input) scale factor: ____________________________________42
ØSetting the Guard connection for each input connector: ____________________42
ØTo configure the Nullmeter parameter display:___________________________42
ØTo complete a configuration setup: ____________________________________ 43
ØTo measure signal content of harmonics, amplitude, phase, and sync:_________60
ØTo measure harmonic content, or wideband amplitudes synchronously: _______61
ØTo perform spectral analysis of the input signal.__________________________62
ØTo measure wideband amplitudes over a known period of time: _____________ 62
ØTo perform an external calibration: ____________________________________ 91
ØTo perform a calibration check:_______________________________________ 93

Introduction
Congratulations on purchasing one of the high technology signal analysis
instruments available from Vitrek. The 6000 family of Phase Angle Voltmeters
offers the utmost in accuracy and flexibility.
These instruments contain an automatic switching power supply, thus no changes are
required for local AC supply voltage or frequency variations, simply select the power
cord extension that connects to your supplied power.
Features
The Phase Angle Voltmeter instruments are available as a two input, the 6000-2, and
as a three input, the 6000-3. Both have full accuracies available on all inputs fitted.
The following lists some of their significant features.
Introduction 11
• Fully digital signal processor (DSP) based operation, no analog phase-locked
loops, phase detectors or other delicate, inaccurate circuitry. These instruments
have a 0.0005Hz to 200kHz range of frequencies.
• True 18-bit resolution on each input, which yields exceptional phase, amplitude
and harmonic resolution.
• 500kHz sampling frequency on each input simultaneously, which yields
excellent high frequency accuracies, even with heavily distorted waveforms, and
the widest range of harmonics measurement (up to the 2047th harmonic).
• DSP based fundamental frequency component detection, which yields the widest
range of fundamental “reference” input, even when buried in noise and
distortion.
• Two 40mHz 24-bit Digital Signal Processors for each pair of inputs, and one
68020 32-bit Central Processor, which yields the highest measurement speeds
available.
• Full Range of measurement capabilities, not just amplitude, frequency and
phase. THD, inter-harmonic phase, spectrum analysis, cross-correlation are just
a few of the additional measurements available at the touch of a button.
12 6000-2 & -3 User Guide, Rev E
• Fully customizable display window. Shows 4 lines at a time and is scrollable to
50 lines.
• High resolution bargraph contains 101 elements and two supporting interface
keys.
• Both voltage and current input capabilities on each input, which allows for high
accuracy power measurements from a few nanowatts to hundreds of watts.
• The interface package adds control capabilites with the IEEE488 and RS232
connections; printing capacity with the Parallel printer connectors; and analog
output ability with 12 analog connections, when AIO option is fitted.
Principles of Operation
For basic details regarding the circuitry and methods used in the 6000 instruments,
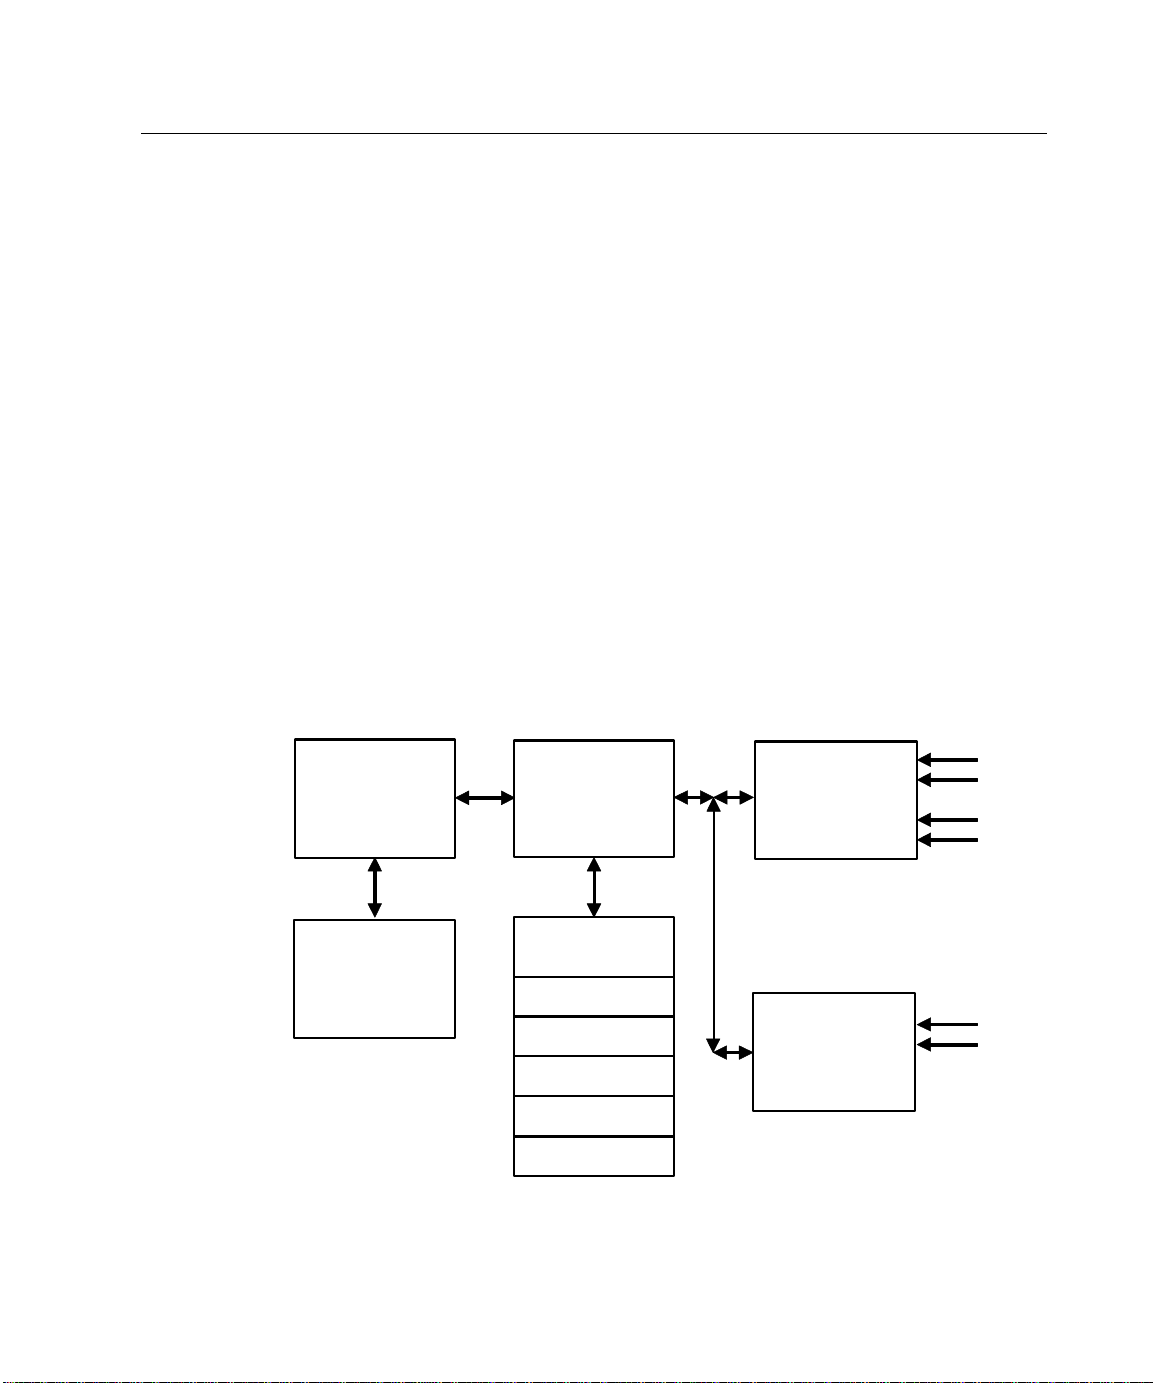
Figure 1 shows the overall block description of their internal system’s circuitry.
Central Processor
The central processor consists of circuitry surrounding a Motorola 32-bit
MC68EC020 processor and a MC68882 math co-processor, both of which run at
25mHz. These processors perform all interfacing and inter-digital signal processing
and coordination required in the instrument.
Equation
Coprocessor
(MC68882)
Flash
Memory
(up to 4 Mbyte)
Central
Processor
(MC68020)
Interfaces
Front Panel
IEEE488
2 x RS232
Parallel Printer
Option AIO
Figure 1. System Block Diagram
Conditioning
and DSPs
(2xDSP56001)
Conditioning
and DSPs
(2xDSP56001)
Signal
Signal
A
B
Sync
Introduction 13
High Speed
High Speed
High Speed
Optical Isolation Barrier
Digital Peak
Digital Peak
Range/Mode
V
A
High Speed
The software run by this processor is stored in flash memory, allowing the
instrument’s software to be field upgradeable without requiring removal of the
covers or any circuitry. The interface of this processor to the interface components:
IEEE488, (2) RS232 and Parallel Printer is via the processor’s native bus interface.
This bus interface uses standard commercial integrated circuits for hardware. All of
these interfaces use interrupt driven software to perform their input/output duties,
yielding a high-speed interface.
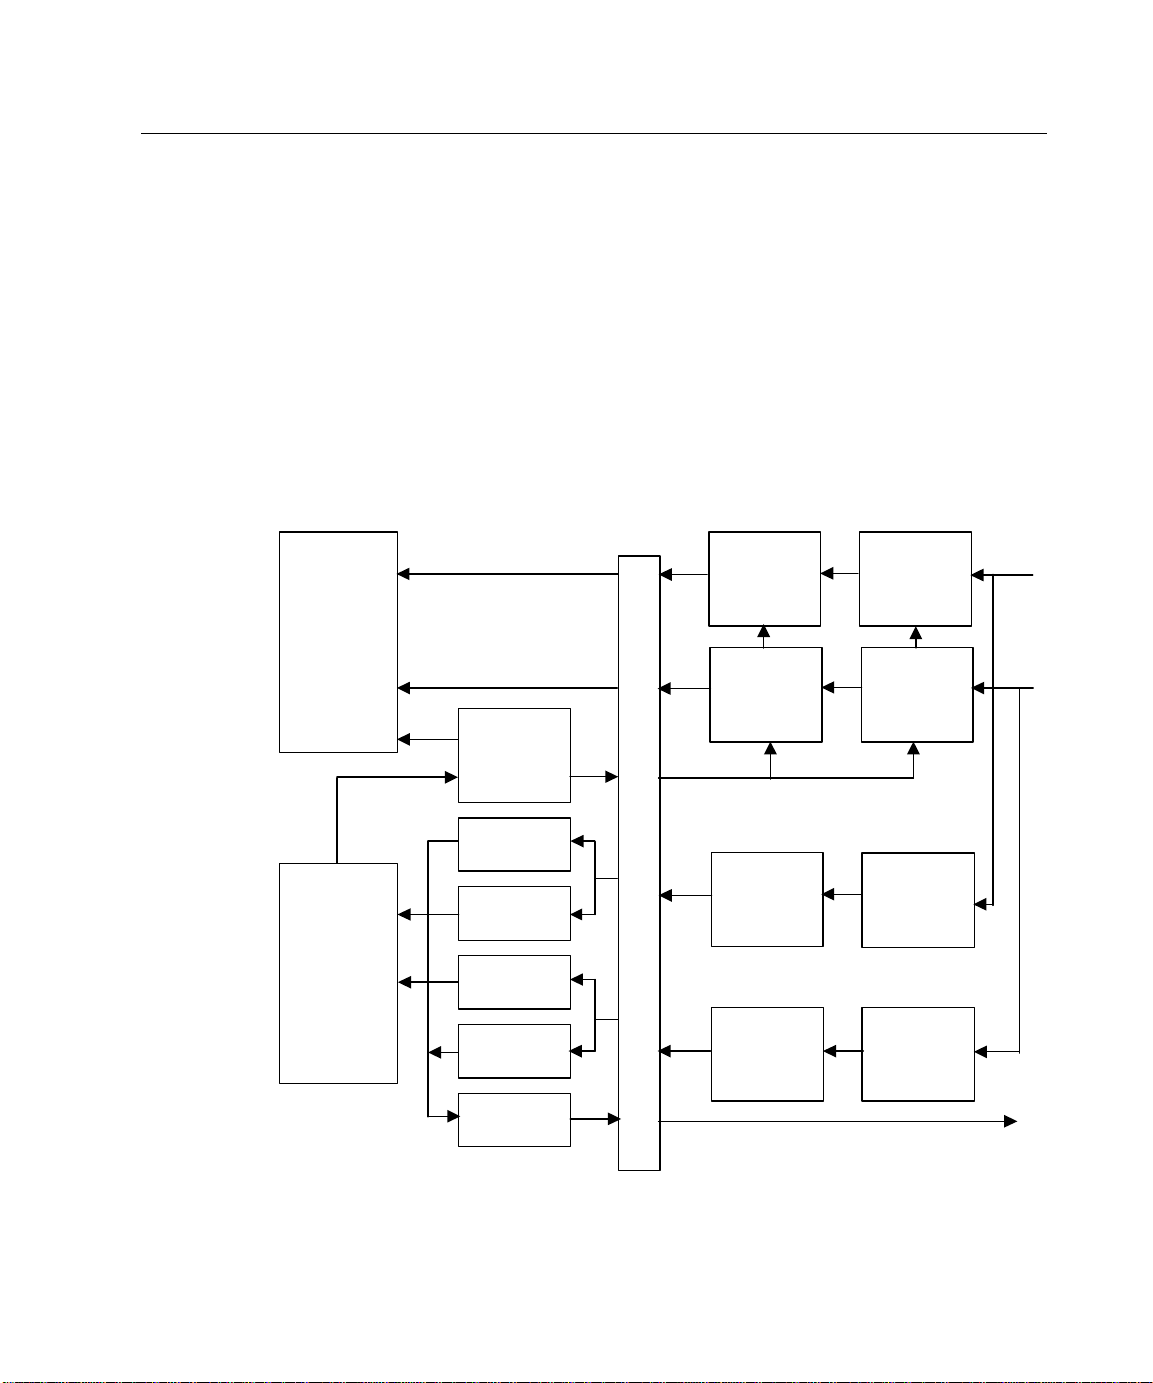
Signal Conditioning and DSP Sections
For each pair of the instrument’s inputs, there is a set of circuitry that contains two
Motorola DSP56001 24-bit processors interfaced to the central processor. The
interface is made via a high speed RS485 data link. Refer to Figures 1 and 2.
56-bit
Digital
Signal
Processor
(DSP56001)
56-bit
Digital
Signal
Processor
(DSP56001)
AMPLITUDE
MEASUREMENT
Digital
Noisy
Sample
Generator
Detector
Digital HI-Q
BP Filter
Digital HI-Q
BP Filter
Detector
500KHz
18-bit
Digitizer
500KHz
18-bit
Digitizer
SYNCHRONOUS SAMPLE CONTROL
2MHz
8-bit
Digitizer
FREQUENCY MEASUREMENT
RANGE/MODE CONTROL
2MHz
8-bit
Digitizer
Digital
LP filter
(Variable)
Digital
LP filter
(Variable)
Analog
LP filter
(1 MHz)
Analog
LP filter
(1 MHz)
control
Range & Mode
Figure 2. Digital Signal Processing Block Diagram

14 6000-2 & -3 User Guide, Rev E
These sections also provide the primary isolation between the grounded digital
circuitry of the instrument and the floating input circuitry via an optical isolation
barrier, which passes digital signals only.
Each of these sections is capable of operating independently, or can be “joined” to
one or both of the other sections to perform simultaneous sampling, as required, by
the central processor.
Input Scaling
Each input has identical systems that perform the required scaling of the input
signals to the levels required by the amplitude and supervisory systems. Each
input’s scaling is fully differential throughout, and is powered by isolated power
supplies having its common driven by the respective GUARD terminal. In this
manner, excellent common-mode performance is achieved, and the signal quality
delivered to the respective amplitude and supervisory sections is maintained, even in
a digital “backplane” environment. Each input’s scaling and mode is controlled by
parallel digital codes provided by the relevant supervisory DSP. The form of
amplification chosen maintains excellent phase shift, even at high frequencies, using
many gain stages for amplification. Each gain stage is configured to produce the
same nominal phase shift independent of gain setting. Each input system also
presents the GUARD terminal connection to its amplitude and supervisory DSPs to
act as the common for their isolated power supply requirements.
Amplitude Measurement Circuitry and DSP
Each input, after scaling, is filtered by a high speed digital low-pass filter having its
corner frequency (filter clock frequency) controlled by one of three filter clocks
common to all amplitude systems. After filtering, each input signal is then converted
to 18-bit digital form by an 18-bit. analog-to-digital converter system, whose sample
clock is taken from one of three sample clocks common to all amplitude systems.
Each converter consists of a pair of time interleaved 250kHz converters, allowing for
sampling up to 500kHz. Refer to Figure 2, the Digital Signaling Processing Block
diagram.
The output of all four converters (two per input) is read by Motorola’s digital
converter, DSP56001, at a rate controlled by the same sample clock used by the
converters.
This processor performs all amplitude and harmonic analysis required by the system,
and maintains a database of the results of the latest such measurements for its
channel. The central processor gains access to these results via a high speed RS485
data link. This same link is used to pass to the DSP the selections to use for its
sample and filter clock signals, and details regarding the measurements to be made.

Introduction 15
The channel’s circuit board with this harmonic analysis DSP is internally named the
"Amplitude DSP".
Frequency Measurement
Each scaled input passes to a second sub-system for additional analysis. This second
sub-system is internally named the “Supervisor DSP” board and consists of the
following portions:
Filter and High Speed ADC—Each input passes through an analog 1mHz low
pass filter, and sampled at 2mHz by a pair of 8-bit analog-to-digital converters.
Supervisory Processor—The outputs of the pair of 8-bit converters is read by a
Motorola DSP56001, which performs several asynchronous tasks using this data.
This processor is linked to the central processor using the high speed RS485 data
link.
Range/Mode Control
Overload and Underload Detection—Each sample is checked for overload
status. If an overload is detected then the DSP changes the range presented to the
input scaling circuitry (if able) and informs the central processor that a range change
has occurred.
If an underload condition remains for longer than a period provided by the central
processor (actually set by the minimum fundamental frequency expected) then the
DSP changes the range presented to the input scaling circuitry (if able), and informs
the central processor that a range change has occurred. This process is continuous,
independent between the inputs, and completely independent of any other activities
in progress in the instrument. You can also set a fixed range, rather than the above
autorange process.
Bandpass Filtering and Frequency Measurement—Input samples are
passed through a proprietary system. The system performs a tracking bandpass filter
function, maintaining track of the fundamental frequency reading within set range.
This tracked frequency reading is then used to measure the frequency of the
remaining signal component. This process is continuous and independent between
the inputs, and completely independent of any other instrument or supervisory
processor activities in progress.
Sample Clock Generation
Under the direction of the central processor, the supervisory DSP controls circuitry
contained in an ASIC, which generates a digital clock signal whose average
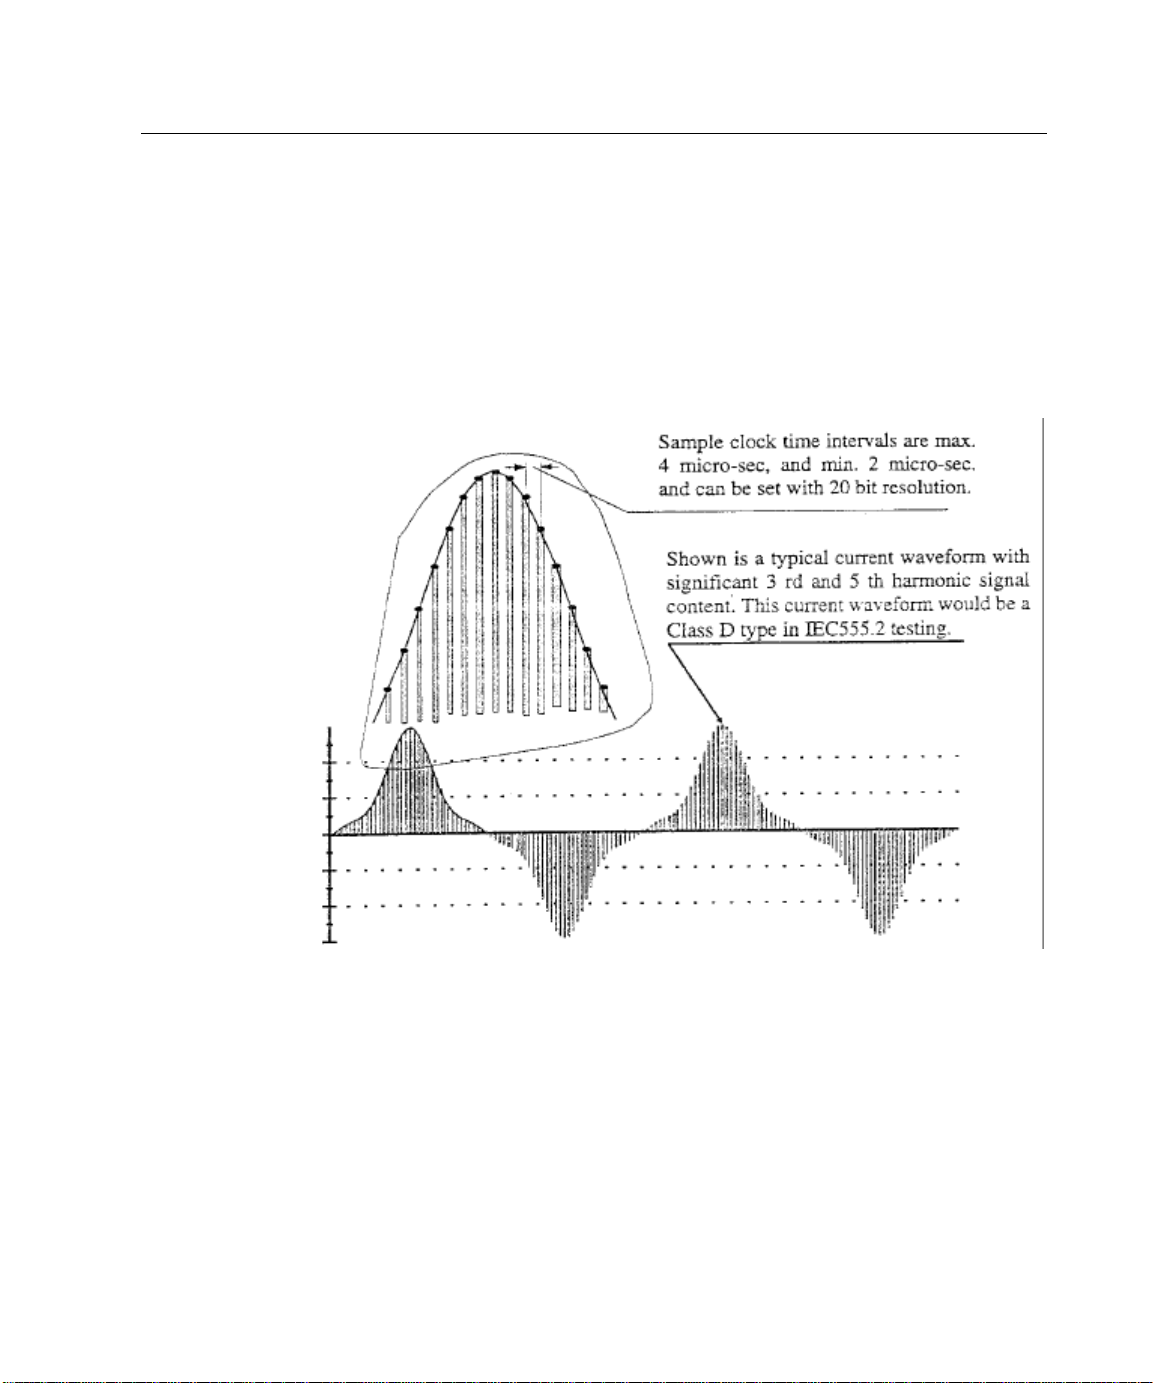
16 6000-2 & -3 User Guide, Rev E
frequency is settable with 20-bit resolution over a 2:1 range of frequencies. This
clock signal is available to all amplitude DSP systems on one of three such signal
lines. If desired by the central processor, the supervisory processor can “link” this
frequency to that of either of its measured input frequencies. The form of the sample
clock is such that the individual sample-to-sample clock period can vary by up to
1%, however, the average over any 256 sample period is always within 1ppm of the
set value. This “jittered” sampling ensures that no input signal component can be
synchronous to the amplitude system’s sample rate, removing the anomalous effects
that occur when this happens.
Figure 3. Sample Clock
Filter Clock Generation
Under the direction of the central processor, the supervisory DSP controls circuitry
contained in an ASIC which generates a digital clock signal whose frequency is
selectable in 1.2:1 steps over 4.5 decades of frequencies. This clock signal is
available to all amplitude DSP systems on one of three such signal lines.
Front Panel Operation 17
Not installed on the 6000-2
Front Panel Operation
This section includes a description of the front panel interface features of the Phase
Angle Voltmeter instruments and their basic operation. Refer to Configuration
Control for an explanation of the menus.
Front Panel Operational Features
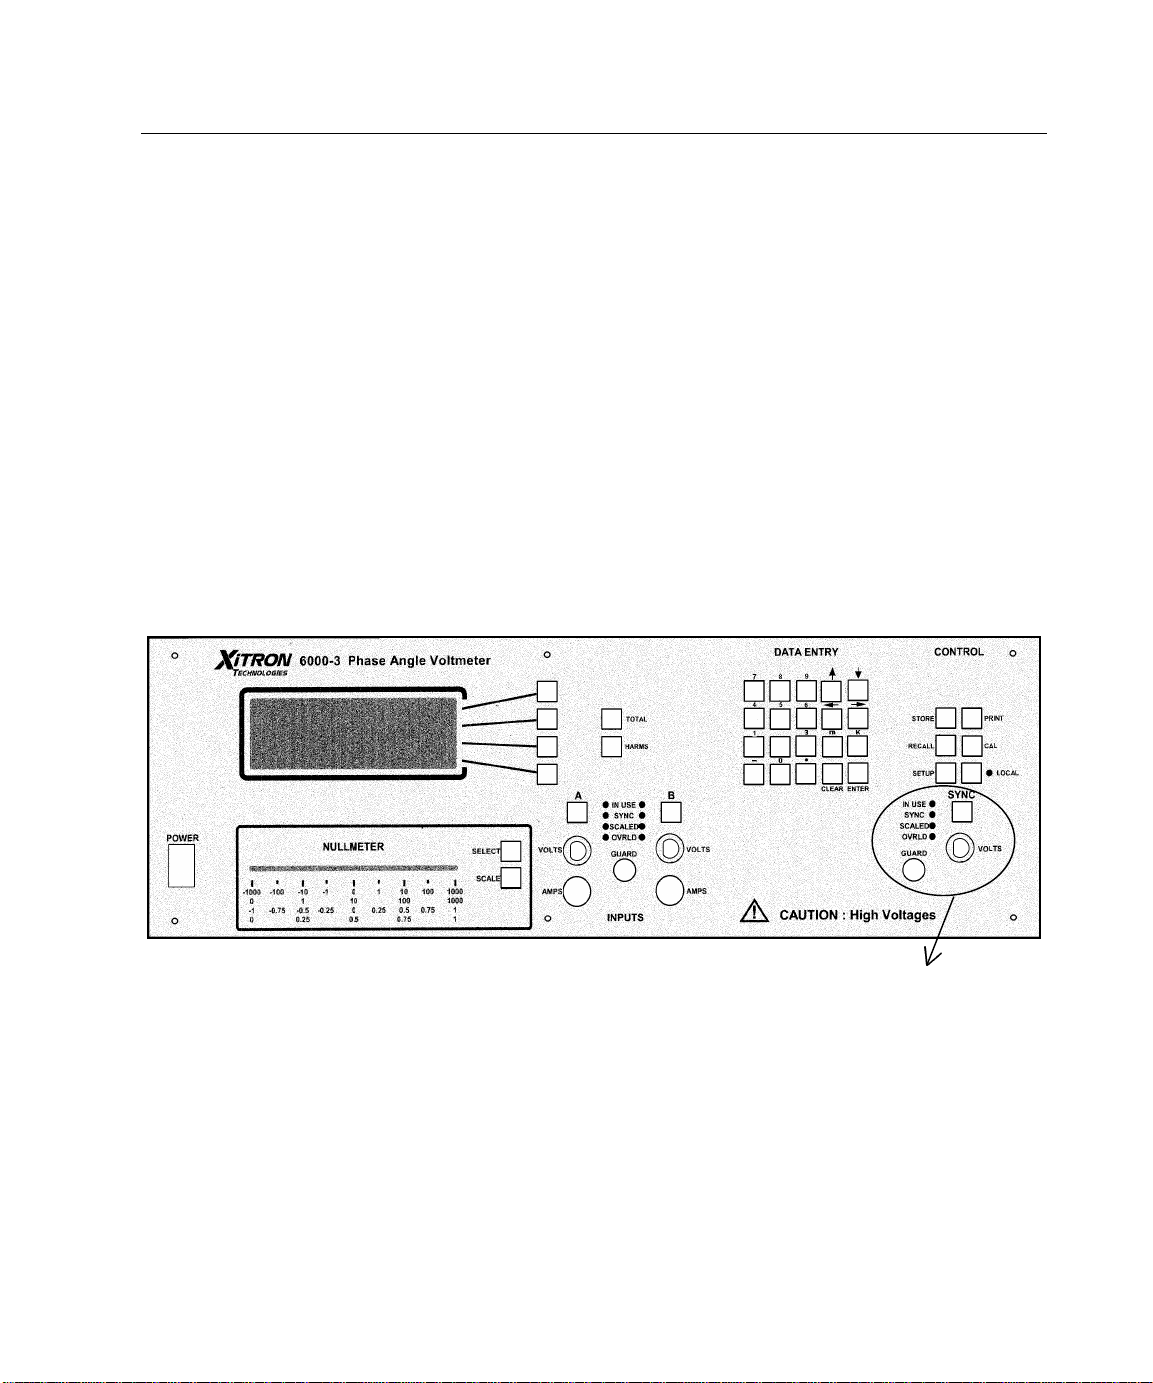
The 6000-2 and -3 Phase Angle Voltmeter instruments have a number of controls
and indicators available. See Figure 4.
Figure 4. The 6000-3 Voltmeter Front Panel
Power Switch
Turns the unit ON and OFF.
The Display
The front panel display is a “window” that provides a visual interface to the alphanumeric measurement Results Data and the changeable configuration menu. Refer to
18 6000-2 & -3 User Guide, Rev E
Figure 5. The instrument’s display can show (up to) four lines of information at one
time and maintains up to fifty lines of displayable measurement results, which are
accessible by scrolling. You can add or delete lines, as necessary. The display is the
interface focus, as it responds to all front panel key presses, showing the options
available for that key.
rms 118.7 Vrms B
rms 3.410 Arms B
true 350.2 W A
true 404.8 VA A
The display responds to all front panel keys described below. To place a cursor in a
display line, use a DISPLAY SELECT key, which are the corresponding unmarked keys
on the right. Press the ENTER key once to remove the cursor. Press it twice to action
the configuration.
Figure 5. Display Showing Results Data
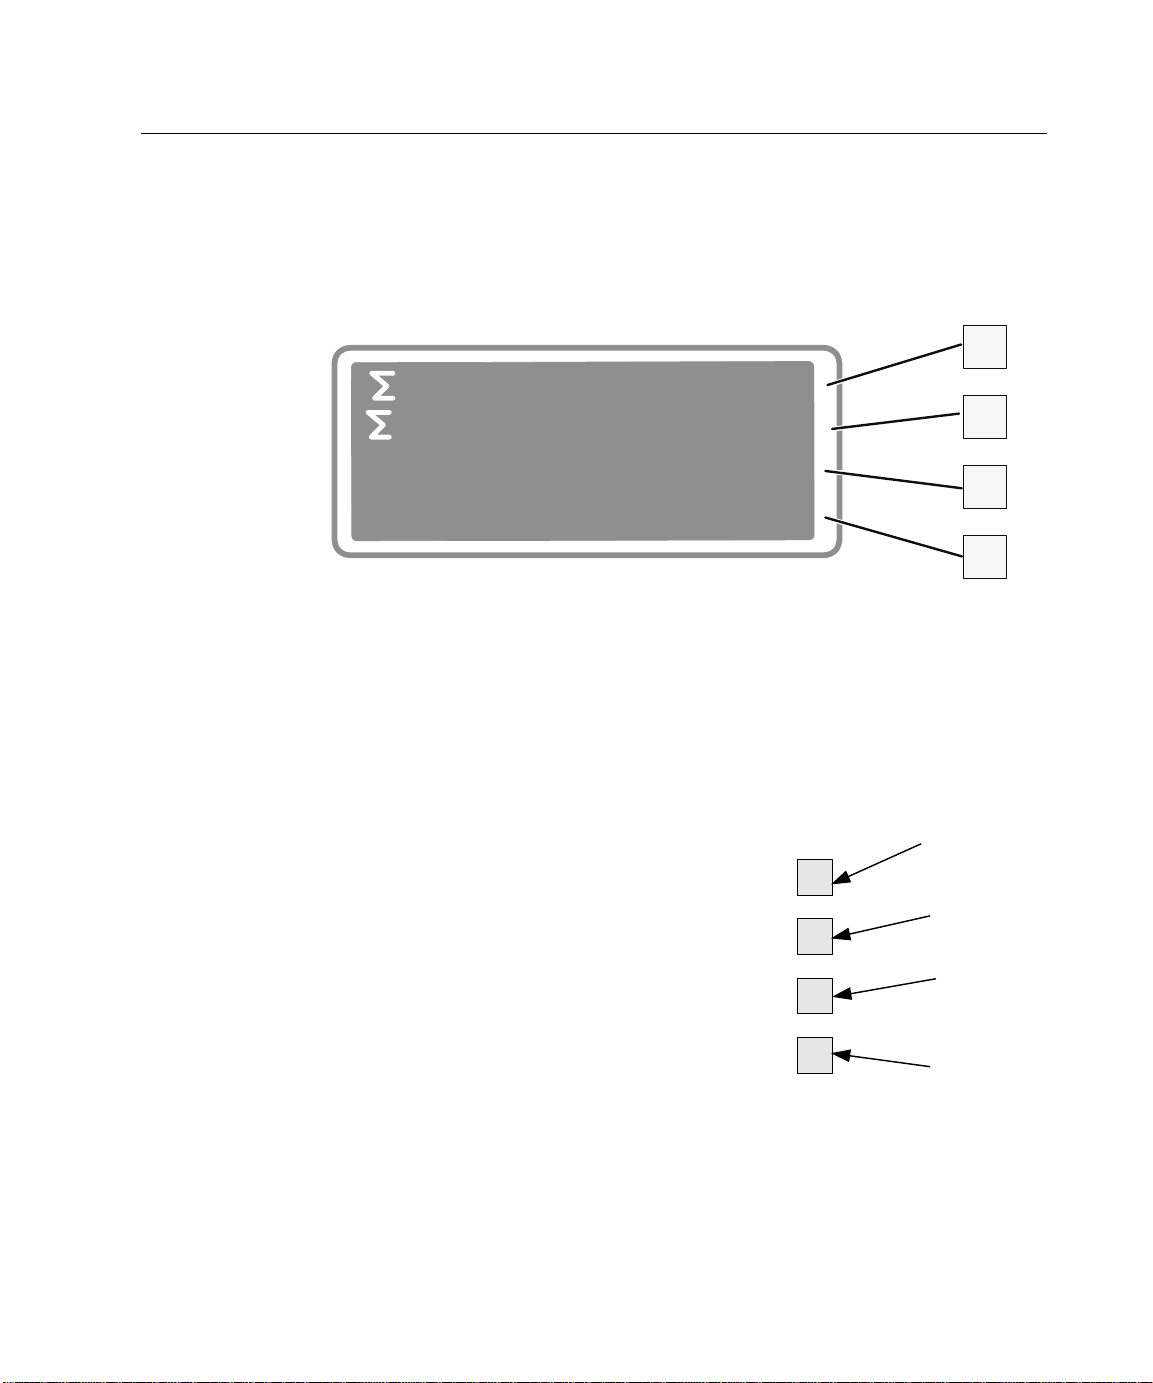
Display Select Keys
The unmarked keys located to the right of the
display are called the DISPLAY SELECT keys.
The topmost key is 1, second is 2, third is 3, and
forth is 4:
• Use to bring up the configuration for each
line of Results Data, including blank lines.
• Use to place the cursor in the menu display.
• Use to page through the various parameter
screens using the topmost key identified
here as the DISPLAY SELECT 1 key; and
• Use in combination with arrow keys, to
scroll through options to edit a
configuration menu item.
1
2
4
3

Front Panel Operation 19
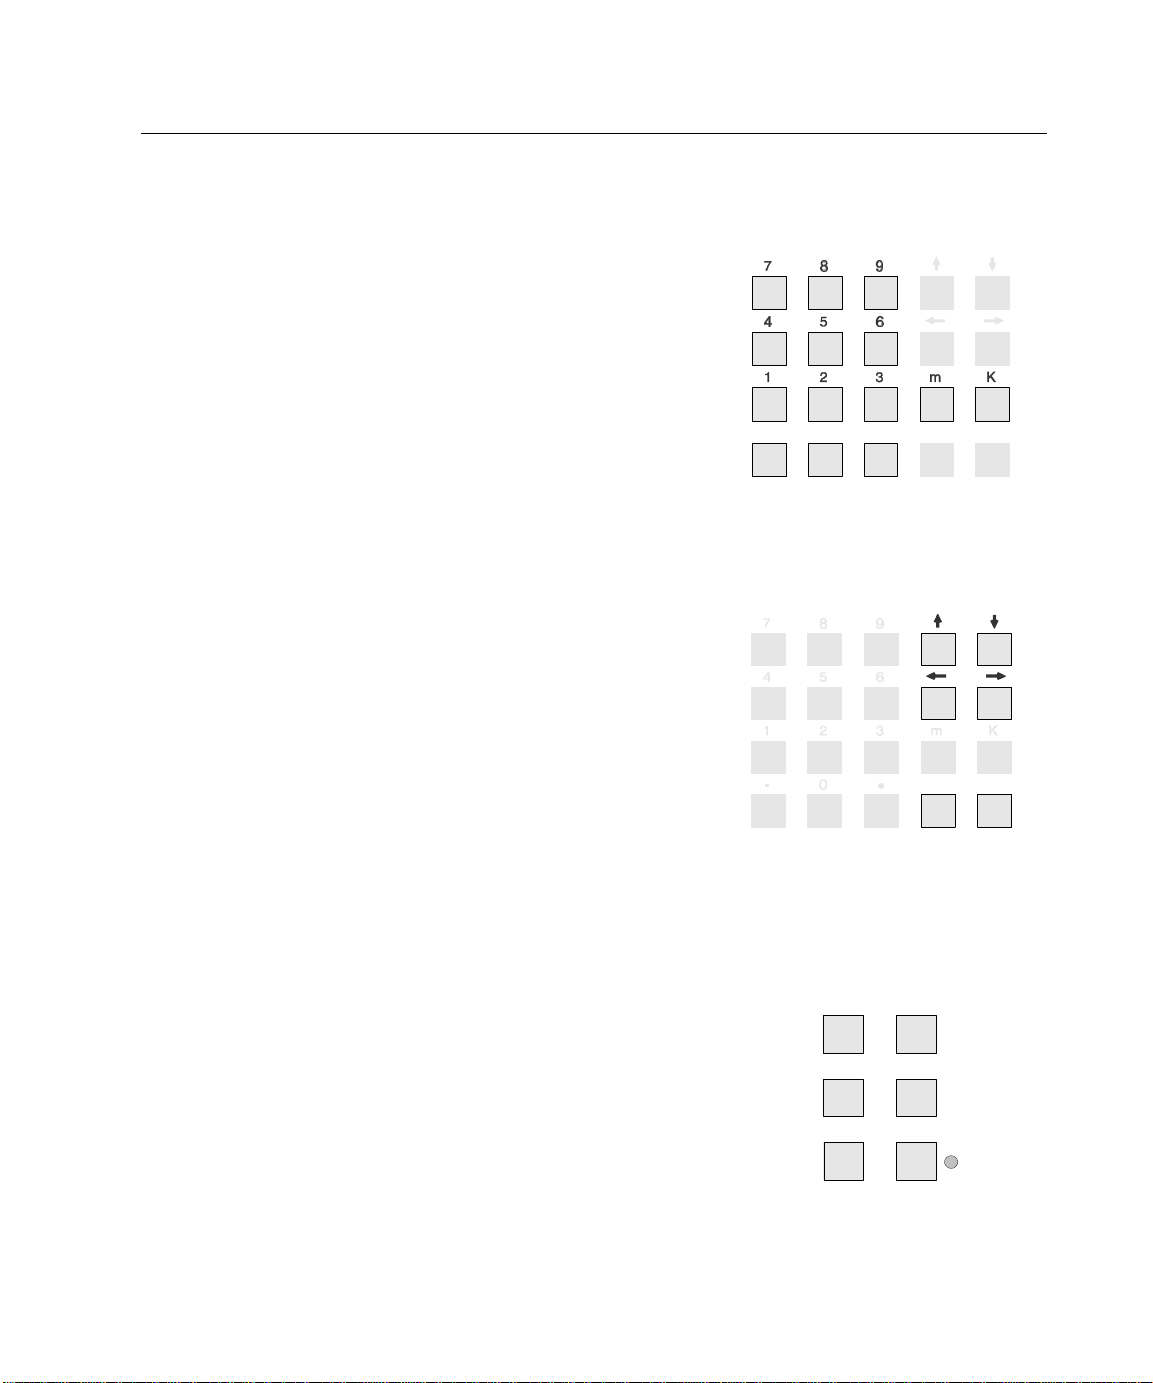
The Up and Down Arrow Keys
The é and ê keys (up and down arrows) are
part of the DATA ENTRY keypad. Use these keys:
• For scrolling the display Results Data lines,
one line at a time;
• To scroll through selectable options at a
DATA ENTRY
cursor position;
• When no cursor displays, use the é and ê
keys to scroll through various parameter
menu details given in the last three
configuration menu lines.
The Left and Right Arrow Keys
The ç and è keys (left and right arrows) are
part of the DATA ENTRY keypad.
Use these keys:
• To move the cursor to a new selectable
option within a menu line.
• When no cursor displays, use the ç and è
keys to scroll through various parameter
menu details given in the last three
configuration menu lines.
Total & Harms Keys
The TOTAL key requests a total value of the
selected parameter item.
The HARMS key toggles the “bandwidth”
selection between AC+DC and a harmonic
range.
TOTAL
HARMS
20 6000-2 & -3 User Guide, Rev E
Numeric Entry Keys
These keys are part of the DATA ENTRY keypad:
• Use the numbered keys to enter numerical
data into the display.
• Use the – (minus sign) to enter negative
integers and to change negative integers to
positive, as required.
• Use the . (decimal point) to enter decimal
values.
• Use the m and K keys to designate “micro”
and “kilo”. Note that these keys become
disabled automatically when not applicable.
Clear & Enter Keys
The CLEAR key is part of the DATA ENTRY
keypad and is used to:
• Discard changes made in either a menu line
or a menu.
• Abandon any change made, restarting the
selection from the beginning.
The ENTER key is part of the DATA ENTRY
keypad and is used to:
• Implement the action per the changes made
in either a menu line or a menu.
• Enter updated data into the menu settings.
DATA ENTRY
.
0
-
CLEAR
DATA ENTRY
ENTER
CLEAR ENTER
Store & Recall Keys
The STORE and RECALL keys are part of the
CONTROL keypad. These keys are used within
the Configuration Setup menus to:
• Store configurations in the internal non-
volatile “library” (65535 configurations).
• Recall any of the stored configurations.
• Overwrite and remove a configuration,
select or enter the number of an already
defined stored configuration.
Refer to Storing and Retrieving Configurations
on page 32.
STORE
RECALL
SETUP
CONTROL
PRINT
CAL
LOCAL

Setup Key
The SETUP key brings up a menu list so you can
reset the instrument to its default configuration.
Note that the Measurement Configuration
default is set to measure signals in the 40Hz to
500Hz frequency range.
• Use to set Analog inputs and outputs. Note
that the AIO option provides additional
outputs, if fitted.
• Use to set the IEEE488, RS232 interfaces
and Parallel printer. For more details refer
to Interface Operation on page 63.
• Use to set the display format of time and
date information. Refer to Setting/Format-
ting Time & Date on page 31, for details.
• Use to set the internal real time clock.
• Use to enable the ê key to scroll the
display to the lowermost menu lines.
• Use to perform “covers-on” software
upgrades.
Note: Contact Vitrek for specific details to
perform software upgrades.
Front Panel Operation 21
CONTROL
STORE
RECALL
SETUP
PRINT
CAL
LOCAL
Local Key & Indicator
The LOCAL key is part of the CONTROL keypad.
• Use to return control to the front panel
when using the IEEE488 interface to
another controller. For more details refer to
Interface Operation on page 63.
• The indicator light illuminates when front
panel operation is active.
22 6000-2 & -3 User Guide, Rev E
Calibration Key
The CAL key, is used to perform the following
tasks:
• Display the present status of the instrument:
Model
Options fitted
Software version
# of days since last calibration
Status of the internal multiprocessor
communications and memory checks.
• Test of the internal digital and analog
circuitry.
• Perform an Internal, Input, and External
Calibration of the instrument.
Print Key
Use the PRINT key to print the display menu or
data results.
STORE
RECALL
SETUP
CONTROL
PRINT
CAL
LOCAL
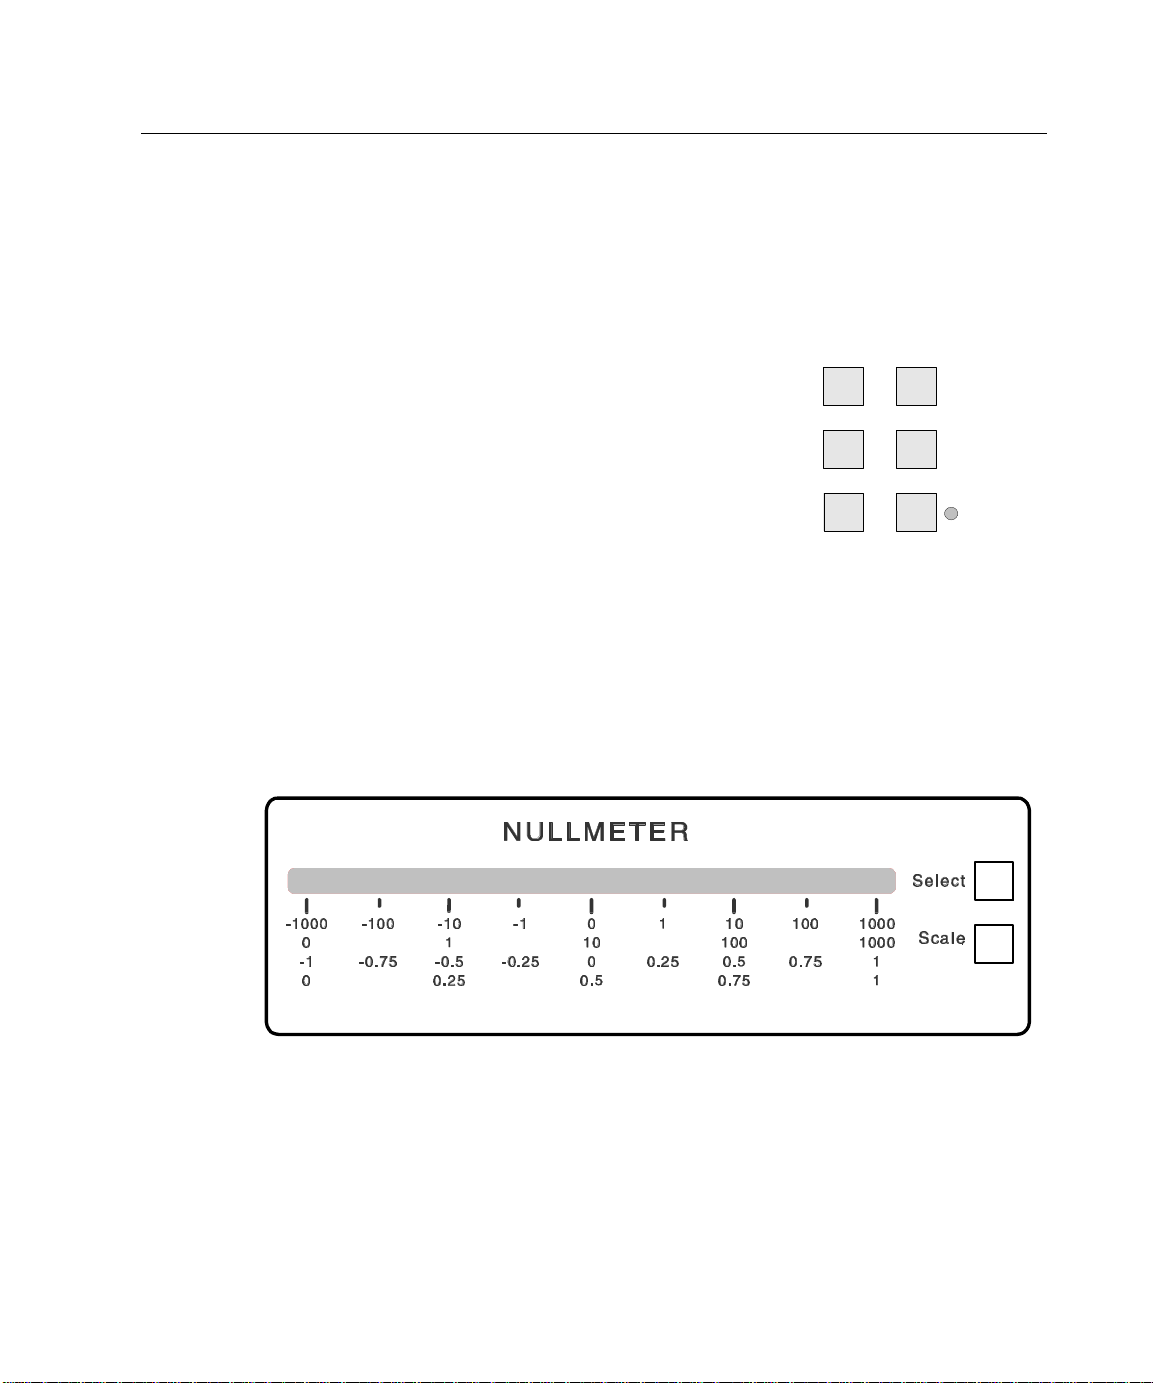
The Nullmeter
The nullmeter is a lighted bargraph. You can customize the graph by pressing its
SELECT and SCALE keys.
Figure 6. The Nullmeter
The NULLMETER SELECT key allows you to select the parameter to be displayed on
the nullmeter in the same manner as defining a display line parameter.
Note: If the zero position of the nullmeter is defined as other than zero, then a
deviation parameter must be selected to perform the required offset. Refer to the
Nullmeter Display Menu on page 49, for details on displaying Nullmeter results.
Front Panel Operation 23
The NULLMETER SCALE key allows you to select the:
• Scaling type: dot or bar;
• Linearity: linear or logarithmic;
• Zero position: left, centered, or mirrored around the center.
Note: The center zero position, log-scaled format provides a useful adjustment
capability of “coarse/medium/fine”. Refer to Nullmeter Scale Menu on page 58,
for more details.
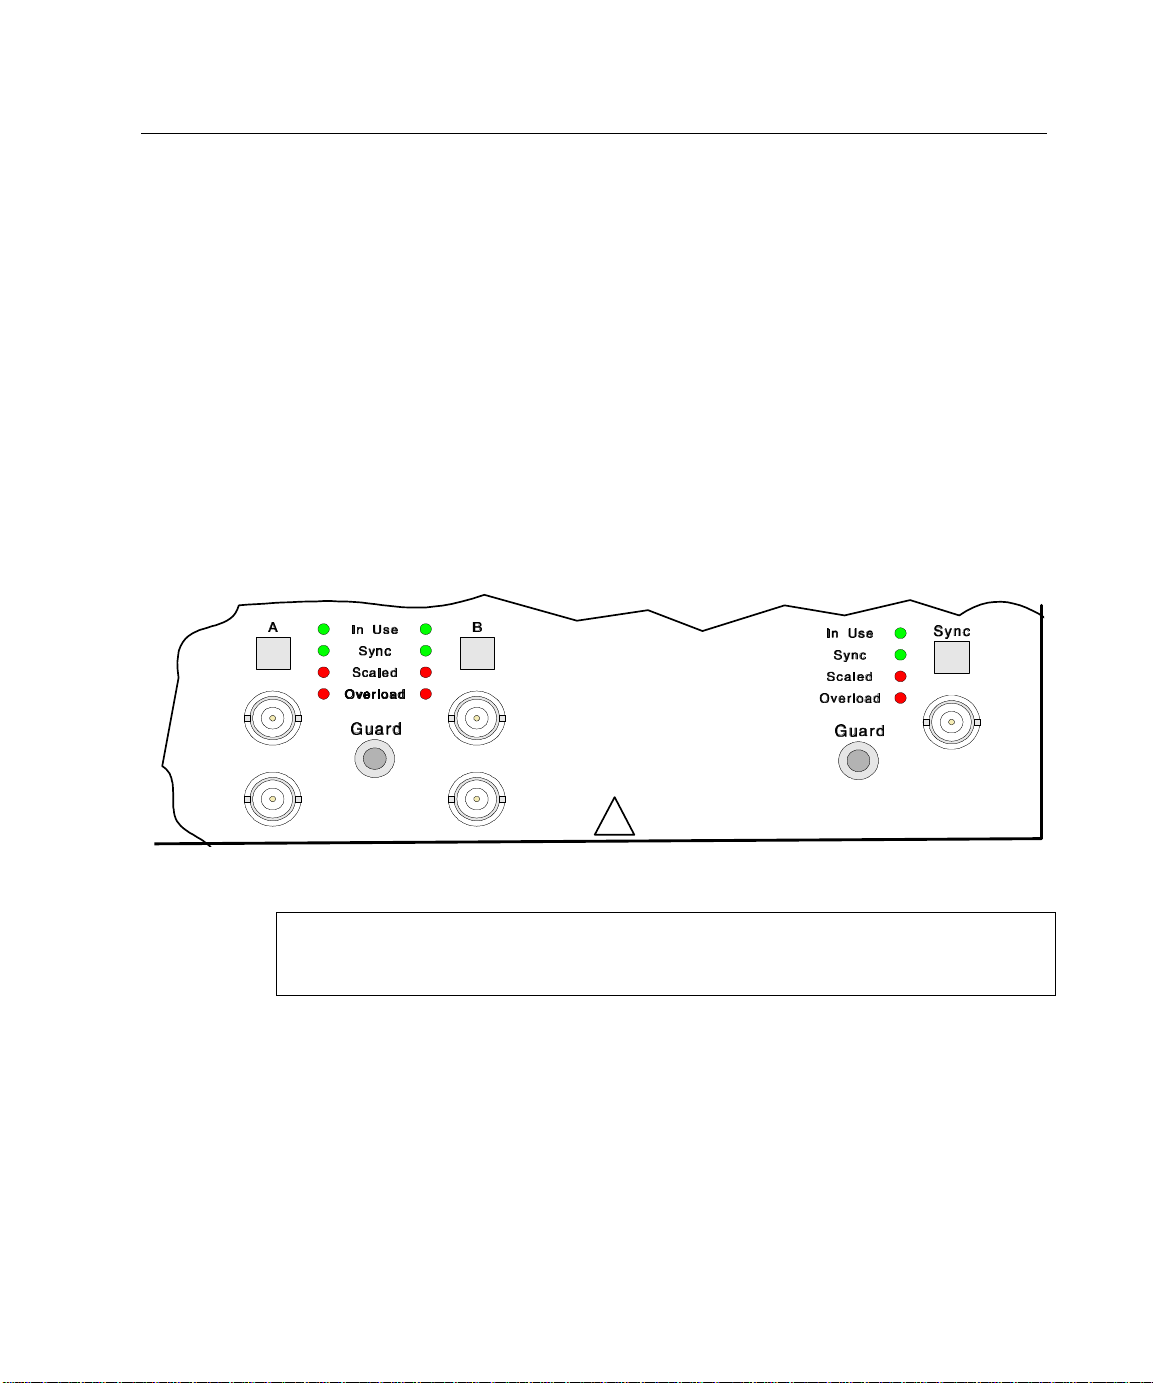
Input Connector Keys & Indicators
Use either the voltage (V) or the current (A) input connection, but not both. The
6000-2 voltmeter has inputs A and B, and the 6000-3 voltmeter has A, B and SYNC.
If you select an externally driven guard, then connect a convenient source of a low
impedance-guarding signal to the GUARD terminal.
Volts
Amps Amps
Volts
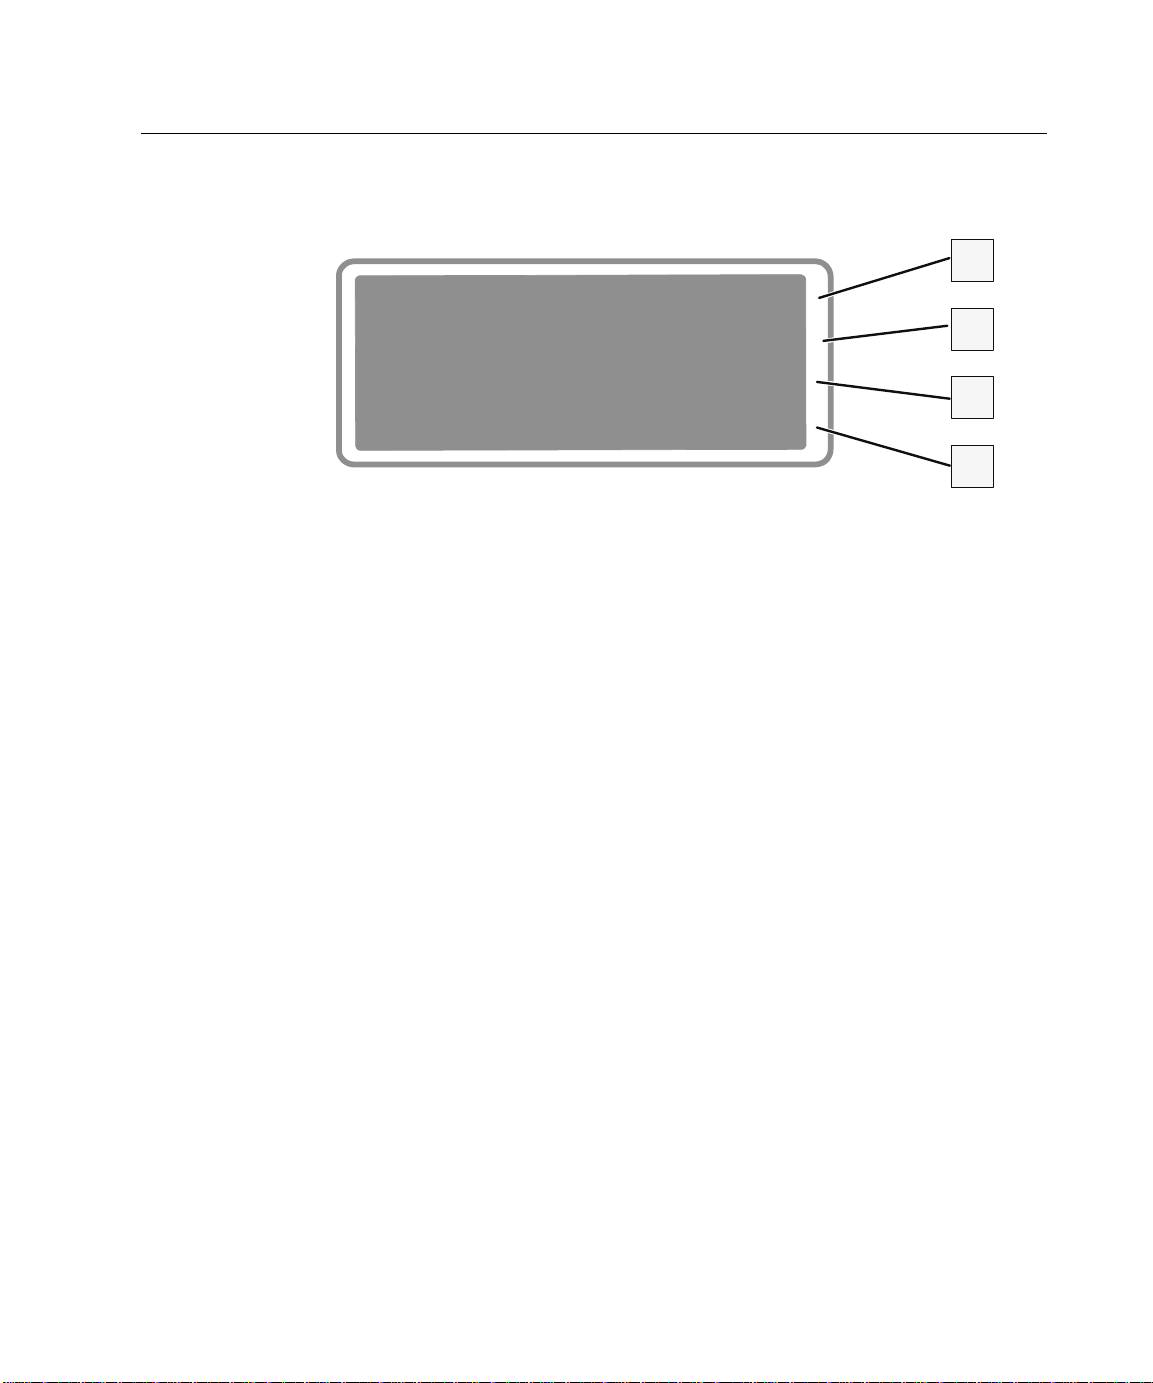
Figure 7. Input Terminals
Warning: Ensure that all voltages are removed before coming in contact with any
of the input signal wiring to your voltmeter. This caution particularly applies to the
outer cover of the input BNC connectors.
Use the respective input (A, B, or SYNC) key:
• To select the individual input range (or autorange) and mode desired.
• To set a desired amplitude scaling for each individual input.
• To select whether the GUARD terminal is to be internally or externally driven.
Refer to Configuration Setup on page 39.
!
CAUTION : High Voltages
Volts

24 6000-2 & -3 User Guide, Rev E
View the respective connector’s indicator lights to determine, which input is being:
• Measured (IN USE);
• Used for fundamental frequency determination (SYNC);
• Scaled (SCALED);
• Overloaded (OVERLOAD). The instrument automatically protects itself against
serious overload, even when held on the most sensitive input range
Notes:
1) The maximum voltage between the GUARD terminal and an Input Low is 10V for
all voltage ranges of 2.5V and below, and for all current ranges. On the higher
voltage ranges, up to 1000V may be present between the terminal and input.
2) Noisy and inaccurate readings may result if the GUARD terminal is left
disconnected when external guard has been selected.
Making Input Connections
When deciding which inputs to use, attempt to follow the same pattern for all
applications. Use the following guidelines:
• If measuring amplitudes and/or distortion of a single signal, use input A.
• If measuring phase (or phase related amplitudes) between a pair of signals,
connect the ‘reference’ signal to input A and the “unknown” signal to input B.
• If making a power measurement, use input A for voltage and B for current.
• If using a third signal purely for synchronization purposes, use the SYNC input
for this purpose.
Guard Connections
The input capacitance of each input to ground is very low (a few hundred picofarads)
thus the use of an external connection for guard is rarely needed. We recommend
using external guarding under the following circumstances:
• If low level (less than 1V or 10mA) signals are being measured in the presence
of significant common mode voltages or interference.
• The input connections are extremely long (greater than 10ft).
• When using the current input, current low MUST be externally connected to the
GUARD terminal. And the input pair configured to use External guard
• When using internally connected Guard, choose the input having the largest
signal.

Front Panel Operation 25
Input Cables
Signal input connections are made to the front panel BNC connectors, using the V or
A connector for each input as desired. Each input is configured, such that the outer
shell of the connector is the input LO (negative) connection, and the central pin is the
input HI (positive) connection.
• Reconfigure each input while no signals are present.
• Check the configuration of each input prior to making connections, particularly
the GUARD connections.
Warning: NEVER TOUCH the outer shell of any of the BNC connectors
(including unused ones) when signals are applied to the instrument.
Notes:
1) Particularly when high frequency phase sensitive measurements are being made, it
is highly recommended that all cables be similar in both construction and length.
The phase shift caused by dissimilar cable lengths is of the order of 0.03° per foot at
100kHz.
2) When measuring voltages, reduce potential interference and crosstalk between
inputs by the use of shielded cables (e.g., coaxial cable). If input capacitance is of
concern, then use tightly wound wires of small gage, twisted pairs.
3) When measuring currents, particularly at the lower levels (10mA and less), use
tightly twisted pairs of wires of sufficient gage for the current being carried. In the
presence of severe interference, or where the current signal has significant common
mode voltage, keep the input connections as short as possible.
4) The GUARD connections (if any) may be made with any suitable form of
connection.
Using the Operational Keys
Whether viewing a display showing parameters, measurement results, or
configuration menu items, the method of front panel operation is the same. Refer
also to Configuration Setup on page 39.
Changing Displayed Information or Settings
To enter changes to a configuration, press a DISPLAY SELECT key to place the cursor
on the line of data you are modifying. If you press the ENTER key once, the cursor
disappears, although the displayed menu accommodates the new data. Press a
26 6000-2 & -3 User Guide, Rev E
DISPLAY SELECT key again to place the cursor in the display. If you press the ENTER
key twice the new data is applied and the display shows the Results Data.
Line #03 Parameter
p= Phs Bh01--Ah01
Display as +/-180
Filter = 30.000s
Figure 8. Display Line Configuration Data
Ø To change a display line of Results Data:
1. While the display shows the Results Data screen, press the DISPLAY SELECT key
that corresponds to the display line requiring change. A display showing
parameter values will come up.
o
2. Press a corresponding DISPLAY SELECT key a second time. A cursor will flash in
the display line to allow you to:
• Directly change the displayed information at the cursor.
• Change the displayed selection to the next one available.
3. Use the ç and è keys to move the cursor to the data or option you wish to
change.
4. Use the DATA ENTRY keys to enter a value.
5. Press the é and ê keys to scroll the options, as required.
6. Press the ENTER key twice to apply the change.
Ø To select an option:
1. From the Results Data display, press a DISPLAY SELECT key that correlates with
the line of Results Data you wish to modify. Refer to the Display Select Keys on
page 18.
2. From the Parameter display, press the DISPLAY SELECT key that correlates with
the line containing the option you wish to select, until the cursor flashes at the
option.
3. Use the é, ê, ç and è keys to select a new option. Press ENTER twice.

Front Panel Operation 27
Setting Defaults
Ø To set defaults:
Important Note: This action applies to all configured Results Data display lines.
Store any preferred setups before performing this step.
1. Press the SETUP key.
2. Press the DISPLAY SELECT key correlating to Set Defaults. The defaults will
automatically apply.
3. Press the ENTER key. The Results Data display will show the first four
configured lines, which are based on the preset Parameter and Setup
Measurement defaults.
For line #00 the Results Data is: Fund xx.xu Vrms A
The default Parameter setup is: p = True RMSAh 1 - 1
Display as volts rms
Filter = 0.000S
For line #01 the Results Data is: Fund xx.xu Vrms B
The default Parameter setup is: p = True RMSBh 1 - 1
Display as volts rms
Filter = 0.000S
For line #02 the Results Data is: Greal + x.xx B
The default Parameter setup is: p = Gre Bh01/Ah01
Display as Ratio
Filter = 0.000S
For line #03 the Results Data is: Fund - xxx.xxx B
The default Parameter setup is: p = Phs Bh01/Ah01
Display as +/- 180
Filter = 0.000S
If you press the Nullmeter’s SELECT key, the default Nullmeter Parameter screen
displays. Press ENTER to show Nullmeter Results Data and the Nullmeter light will
reflect the reading.
The default Nullmtr: Parameter setup is: p = Phs Bh01/Ah01
Display as +/- 180
Filter = 0.000S

28 6000-2 & -3 User Guide, Rev E
The default Nullmeter Scaling screen is: NULLMETER SCALING
0 to 1 = + 180.000
Bar Lin Centered
The default Setup Measurements are as follows:
Fundamental Frequency Fund: Measured
Fundamental Frequency Range Fund: 40.0 – 500 Hz
Fundamental Source From: AB
Nom Amplitude Measurement Period Min Period 0.250S
Filter frequency Filter 50.0kHz
Maximum Harmonics Max Harmonics: 200
Fundamental Bandwidth Fundamental÷BW: 2
Analysis FFT Type: Normal
Fundamental Frequency Averaging Sync Averaging: med
Fundamental Frequency Measured Period Sync Period: 0.250S
Ø To abort a displayed menu and discard any changes:
• Press the CLEAR key to abandon any change made and restart the selection from
the beginning. Note that the cursor remains in the item being changed.
—Or—
• Select an all-uppercase “heading line” and press the DISPLAY SELECT 1 key.
Press a new DISPLAY SELECT key.
Ø To change a display line:
1. Within the Results Data display, press the DISPLAY SELECT key next to the line
to be changed. Use the é and ê keys to scroll up and down to the various lines.
Note that the topmost line is #00.
2. The display will show the present measurement details/configuration for that
Results Data line. Press the DISPLAY SELECT 1 key repetitively, to change the
Parameter Type for the display data.
• With this menu line, you may select: a single parameter; a deviation between
two parameters, such as a parameter and constant; or various “special” data.
• The menu line corresponding to DISPLAY SELECT 2 key, indicates the
primary (p) parameter for that Results Data display line and it may give the
bandwidth, harmonic, or harmonic range that applies to the primary
parameter.

Front Panel Operation 29
Note: These parameters: gain (ratio), real (in phase), imaginary (quad), and
phase have a primary input, a reference input and a harmonic specification.
Since the 6000 instrument family has no dedicated reference input or
harmonic specification, it offers greater flexibility in usage.
• You may select a reference parameter (r) similarly to the primary parameter
from a difference (p-r), a ratio (p/r) or a ratio difference (p/r: 1).
• You can choose to display the Results Data measurement in units other than
the instrument’s default units for that parameter. Note that the instrument
automatically applies any conversions necessary.
• Filter the final measurement result using a single pole filter having any time
constant between 10mS and 1000S. Note that the filtering applies to each
Results Data line. Note that the same parameter or Results Data can be
displayed in a separate display line using either no filtering or completely
different filtering.
3. Press the ENTER once to set the change. This action removes the cursor, but
rather than implementing the change allows you to make another edit.
4. When the displayed menu has been changed to suit your requirements, press the
ENTER key, once if no cursor is flashing and twice if one is, to action any
changes made. The Results Data will display with readings based on the changes
you made.
Ø To adjust a “noisy” measurement (to a given value):
1. Press the DISPLAY SELECT key next to the line to be changed. The display will
show details of the presently selected parameter for this measurement result.
2. Press the DISPLAY SELECT key corresponding to FILTER =.
3. Enter a numeric value using the DATA ENTRY keys to apply a single pole filter
having any time constant between 10mS and 1000S.
4. Press ENTER twice.
Ø To provide a “fast/medium/slow” style of adjustment capability:
1. Press the DISPLAY SELECT key next to the line to be changed. The display will
show details of the presently selected parameter for the measurement result for
this line.
2. Apply a single pole filter having any time constant between 10mS and 1000S.
3. Select the same parameter for three or more Results Data display lines and apply
decreasing degrees of filtering, the smaller the filter the less the adjustment
capacity.

30 6000-2 & -3 User Guide, Rev E
Ø To add display lines (up to 50 lines possible):
1. Scroll the Results Data display until a blank line shows.
2. Press the DISPLAY SELECT key next to the blank line. As a starting condition, the
display will show the next line number with the same parameter/configuration
menu as the previous line.
3. Redefine the display line, as required.
Ø To delete a display line:
1. Press the DISPLAY SELECT key next to the Results Data display line to be
deleted. The display will show the line number and the parameter details for the
selected line.
2. Press the DISPLAY SELECT 1 key repetitively, to move the parameter format
through several format options. Note that the line number does not change.
Continue pressing until the command, Delete shows in the display.
3. Press the ENTER key. Note that if the deleted line was between other display
lines the other lines automatically close up around the deleted line.
Ø To add dashes in a display line as a separator:
1. Press the DISPLAY SELECT key next to the Results Data display line to have
separation dashes below it. The display will show details of the presently
selected parameter for the Results Data for this line.
2. Press the DISPLAY SELECT 1 key repetitively, to move the parameter format
through several format options. Note that the line number does not change.
Continue pressing until the command, Blank shows in the display.
Entering New or Changed Information
Ø To “enter” data and changes into the menu—when the cursor is flashing:
1. Move the cursor to the display line’s data or menu item you wish to change.
Press the ç or è keys to move the cursor along the line to the previous or next
(respectively) data or menu item to be changed.
2. Display the desired option: Press the é or ê keys when the cursor is in a
multiple-choice type of selection,
—Or—
Use DATA ENTRY keys to enter a numeric value.
3. Press the ENTER key. Note that the remaining contents of the menu may also
change because of a significant change in menu selections.
4. Press the ENTER key a second time to view the Results Data for your change.

Front Panel Operation 31
Ø To “enter” data and changes into the menu—when no cursor is visible:
• Press the ENTER key to “enter” the selections contained in a menu display. The
instrument will replace the menu display with the selected measurement Results
Data, based on the menu entered.
• Press a DISPLAY SELECT key and the cursor will reappear on the corresponding
display line, then press the ENTER key twice.
Setting/Formatting Time & Date
Use the Set Time and Date menu to set and adjust the present time and date
maintained by the instrument. Using this menu, you can select a display format for
the time and date for use as a “time & date stamp” for printing with your Results
Data.
Note: The selected display changes apply when printing, if the option INT is fitted.
Ø To adjust the time display:
1. Initiate this menu by pressing the SETUP key.
2. Use the ê key to scroll to Set Time and Date in the display and press the
DISPLAY SELECT key next to this line.
3. Select the TIME display line by pressing the corresponding DISPLAY SELECT
key.
4. With the cursor flashing at the displayed time, use the DATA ENTRY keys to enter
two digits each for the hours, minutes and seconds based on 24-hour time. Note
that you cannot enter PM, however, the instrument translates 24-hour time to 12hour time, if the 12 Hour time format is selected.
For example: Enter “05” for the hour of 5am and “17” for the hour of 5pm.
5. Press the ENTER key to set the internal real time clock to your adjusted hours,
minutes and seconds.
6. Press the CLEAR key to abort and start again.

32 6000-2 & -3 User Guide, Rev E
Ø To format the time display:
1. From the Set Time and Date menu, press the DISPLAY SELECT key next to the
Time Format line.
2. Repeated presses of the corresponding DISPLAY SELECT key will toggle the
display between the two choices of: 12 Hour and 24 Hour.
• 12 hour format is displayed as between:
12:00:00am and 12:59:59am—Or—01:00:00am and 11:59:59am
—Or—
12:00:00pm and 12:59:59pm—Or—01:00:00pm and 11:59:59pm.
• 24 hour format is displayed as between: 00:00:00 and 23:59:59.
3. When the displayed menu has been altered to suit your requirements and even
though no cursor character is displayed, press the ENTER key to action any
changes made.
Ø To set the date format:
1. From the Set Time and Date menu, press the DISPLAY SELECT key next to the
Date Format: display line.
2. Use the ê key to toggle between the three choices of: dd/mm/yy, yy/mm/dd,
and mm/dd/yy. Note that the displayed date is based on format.
3. To select a format, press the ENTER key, while the format shows in the display.
Ø To set the date display:
1. From the Set Time and Date menu, press the DISPLAY SELECT key next to the
DATE line.
2. Using the DATA ENTRY keys, enter all six digits of the present date. Follow the
format as defined in the Date Format: line.
3. Press the ENTER key to set the internal real time clock to the entered day, month,
and year.
Storing & Retrieving Configurations
This section describes, in detail, the Configuration menus that allow you to store and
retrieve configurations of the instrument. Maintenance of these storage areas is also
covered in this section. These menus are initiated using the STORE and RECALL keys
found in the CONTROL keypad.

Front Panel Operation 33
Store & Recall Memory Menus
The lowermost two lines of the STORE MEMORY menu and the RECALL MEMORY
menu show the presently defined storage areas. The storage area number that has an
* (asterisk) character adjacent to it, is the area that was last accessed. You can use é
or ê keys to scroll the storage lines up and down. (Shown with an asterisk)
Power Up Conditions—
When power is applied, the instrument automatically recalls and uses the contents of
the storage area you last accessed, before removal of power.
Storage Areas—
Each “stored” configuration is internally kept in an area of memory, identified by a
set of numbers and a character string, which you have defined. The numeric portion
can be up to 5 digits and the alpha characters up to 12. These storage areas are nonvolatile, that is they are maintained even when the instrument is not powered up for
10 years.
Ø To store a configuration in an already defined storage area:
1. Press the STORE key.
2. Use the é or ê keys to scroll through the numerically ordered list of defined
storage areas,
—Or—
Use the numeric keys to type the number of the desired storage area and press
the ENTER key.
3. When the desired storage area number displays, press the corresponding
DISPLAY SELECT key. You will get the message: Settings Recalled from
Memory and the instrument will go to the Results Data display reflecting the
recalled settings.
Ø To store a new configuration (presently displaying):
1. Press the STORE key.
2. Press the é or ê keys to scroll the cursor to the lower most lines.
3. Choose a number to represent the new storage area, use up to 5 digits,
—And—
Review the already defined storage areas, to ensure your new storage area
number does not already exist. Use the é or ê keys to scroll.
4. Use the numeric DATA ENTRY keys, to type the number of the new storage area.
5. Press the ENTER key.

34 6000-2 & -3 User Guide, Rev E
Ø To recall a configuration:
1. Press the RECALL key.
2. Use the é or ê keys to scroll through the numerically ordered list of defined
storage areas.
3. When the desired storage area number displays, press the corresponding
DISPLAY SELECT key.
—Or—
Use the numeric keys to type the number of the desired storage area, then press
the ENTER key to bring up the stored configuration on your instrument.
Storage Area Maintenance
Maintenance includes renaming and deleting previously created storage areas for
organizational purposes. An existing storage area may be renamed or deleted. Note
that a presently active storage area (that last accessed) cannot be modified. If you
wish to rename or delete an area, then first store the present configuration, or recall
another storage area.
Ø To rename an existing storage area:
1. Press either the STORE or RECALL key.
2. Press the DISPLAY SELECT key next to the Edit Directory menu line.
3. Scroll using the é or ê keys to display the Storage number you wish to rename.
4. Press the DISPLAY SELECT 2 key, which corresponds to the Name: menu line.
5. Enter the new name using the numeric keys in the DATA ENTRY. Use the CLEAR
key to correct a mistake.
6. When the required numeric characters have been entered, press the ENTER key.
Your previous storage area number and your new one will show in the display.
7. Press ENTER a second time to display your Results Data.
Ø To delete a storage area:
1. Press either the STORE or RECALL key.
2. Press the DISPLAY SELECT key next to the Edit Directory menu line. Review the
contents of these display lines to find the correct storage area you will delete.
3. Use the é or ê keys to show the storage area number, then press the
corresponding DISPLAY SELECT key.

Front Panel Operation 35
4. Press the DISPLAY SELECT 3 key, which corresponds to the Delete menu line. A
message saying Deleted Memory will show and your display return to Results
Data. Note that if you have chosen a storage number that reflects your active
settings, the number will not delete.
Repacking of the Storage Areas
The media used for these storage areas is known as “Flash Memory”. This nonvolatile memory is both readable and writable, but only previously erased areas of
memory may be written to. The internal system of the instrument ensures that this
memory is correctly written to, while maintaining its efficient usage.
This storing process will slowly fill the memory with each written storage area until
the memory becomes full. When full, the system automatically retrieves all storage
areas into internal volatile memory, erases the entire non-volatile memory, and then
rewrites all the storage areas back into non-volatile memory. Thus, rarely, will you
need to manually prompt the execution of this procedure, except when a software
upgrade has been performed, or in the unlikely event that a storage area has become
corrupted.
Ø To manually prompt the repacking of storage areas:
Caution: Power must not be removed while this procedure is being performed,
complete data loss (including calibration data) may result if this occurs.
1. Press the SETUP key.
2. Scroll to NV Data Control menu line.
3. Press the corresponding DISPLAY SELECT key to edit.
4. Press the DISPLAY SELECT key corresponding to Pack Data in Memory menu
line. You will get a message saying Erasing Flash Memory.

36 6000-2 & -3 User Guide, Rev E

Rear Panel 37
Rear Panel
Connectors & Controls
The rear panel contains the power cord connection; Configuration Control switch
and four connectors: Analog output, Digital I/O, Parallel printer, IEEE-488, and two
RS232. Refer to Figure 9.
DIGITAL I/O
ANALOG OUTPUT
RS232 #1
PARALLEL PRINTER
!
IEEE488
RS232 #2
Figure 9. Rear Panel Partial View
CONFIGURATION
LOCKED
UNLOCKED
!

38 6000-2 & -3 User Guide, Rev E
Power Connection
The 6000 instrument is designed to operate with a three-conductor power cord. The
third conductor is securely connected to ground to ensure the external chassis of the
instrument remains at ground potential.
Warning: Operation with a two-conductor power cord, or without a secure ground
connection may render the Phase Angle Voltmeter instrument unsafe for use.
Configuration Control Switch
The Configuration Control switch allows you to disable reconfiguration of the
instrument by unauthorized users. This switch is located in the upper right-hand
corner of the rear panel. When in the LOCKED (upper) position the instrument’s
configuration is locked against changes, other than any caused by recalling
predefined memory locations.
The following changes are made to the menus when in the Configuration Control
switch is in the LOCKED position:
• Display lines cannot be altered.
• The SETUP and STORE keys are disabled.
• The Nullmeter’s SELECT and SCALE keys are disabled.
• The CALIBRATION menu is reduced to System Status and Internal
Calibration selections.
• The phase A, B, SYNC and GUARD input keys are disabled.
Parallel Printer Interface
Use standard Centronics parallel cable compatible with IBM-PCs. This interface
option supports serial stand-alone types or PCL and compatible printers only.
RS232 Connectors
Use this connection for control or for printer output. Baud rates can be set from
1,200 to 38,400 baud. Flow control via RTS/CTS handshake. See Interface
Operation on page 63, for information on using this feature.
IEEE488 Connector
This connection enables full talk/listen capabilities. See Interface Operation on
page 63, for information on using this feature.

Configuration Setup 39
Configuration Setup
The various menu selections available allow you to define the data configuration
appropriate for testing your products. The menus that facilitate setup include: Setup
Measurements, Input Configure, the Parameter displays and if you wish to use the
Nullmeter, the Nullmeter displays. For basic use of the keys and the display
interface, refer to Using the Operational Keys on page 25.
Important Note: Before using your instrument, be aware of the rear panel mounted
“Configuration Disable” switch. This slide switch must be in the UNLOCKED ,
specifically in the down position, to enable any reconfiguration activities.
Setup Guidelines
As a standard setup, configure each input independently for input mode, fundamental
frequency, ranging, and scale factor. Setup the input pair’s GUARD terminal for
internal or external connection. Refer to the following “setting” instructions as
guidelines for standard setups. Initial steps to configuring inputs include:
• Removal of all connections to the BNC and GUARD terminals; and
• Resetting the configuration using the Set Defaults menu, unless the present
configuration has been set for your needs. Please refer to Using the Operational
Keys on page 25.
Ø Setting fundamental frequency mode and range for input connectors:
1. Press the SETUP key while
viewing Results Data to bring
up the SETUP
CONFIGURATION menu.
See Figure 10.
2. Press the DISPLAY SELECT
key corresponding to Setup
Measurements.
SETUP CONFIGURATION
Set Defaults
Setup Measurements
Interface
Figure 10. Initial Setup Display

40 6000-2 & -3 User Guide, Rev E
3. The first four display lines of the SETUP MEASUREMENTS menu show the
fundamental frequency measurement type, range, and input source menu. See
Figure 11.
4. On the second line, select
the type of Fundamental
Frequency. See Funda-
mental Frequency on
page 44.
5. When fundamental frequency is not Fixed, you
have the option of setting
its range.
The default range and menu line reads: Fund: 40.0 – 500 Hz. For details, see
Fundamental Frequency Range on page 45.
6. The fourth line reads From: and shows the input connector signal source, or to
which inputs your fundamental frequency applies. You can change this selection
by pressing one or more of the INPUTS keys: A, B, AB, or SYNC (-3 only). Those
located above the BNC connectors. Note that if the display reads an input, such
as A, and you press A, the display will read none.
SETUP MEASUREMENTS
Fund: Meas x .000000
Fund: 40.0 - 500 Hz
From: AB
Figure 11. Setup Measurements Display
You may get two different message displays here:
Action at Input Source menu line Message Display
Use INPUT Keys
If you attempt to use the DISPLAY SELECT keys to
change inputs:
Use Fundamental
If you press ENTER when none shows in the
display:
Use Fundamental
7. When complete with the Setup Measurement display, press ENTER twice to
action the changes.
Note: To access all the display lines of the SETUP MEASUREMENTS menu,
scroll down using the é and ê keys when no cursor is flashing. To remove the
cursor, press ENTER once. This menu’s additional display lines include:
minimum period, filter, maximum harmonics, fundamental bandwidth, FFT type,
and synchronize averaging and period. Refer to Measurement Configuration
Menu on page 44, for details.
To
Select/Deselect
Sorry
Must Select
An input To

Configuration Setup 41
Ø Setting the input mode for each input connector:
These settings select which signal, voltage or current, is going to be measured on
which input. Additional settings in the display affect the range for voltage and
current, Scaling and the Guard connection being internal or external. Note that when
making these input settings you must call up the INPUT CONFIGURE display
uniquely for each input connector used. See Figure 12.
1. Press the A, B, AB, or S
(-3 only) key located at the
INPUT connectors while
viewing the Results Data.
The display now shows the
INPUT A CONFIGURE menu
corresponding to the A input
key, or the one you pressed.
2. Correlate the display’s input mode (power measurement) with the actual input.
Note that the display shows the input configured for voltage measurements, using
DC coupling. Update the display by pressing the DISPLAY SELECT 2 key twice
and using the é or ê keys to alter the option. The input mode choices are:
V (dc); V (ac); V (50) and A (dc).
Note: Use the respective VOLTS BNC connector for all voltage input V. Use
AMPS input connector for the current input A.
Important Note: Take care, when measuring low frequency signals, particularly phase measurements. After applying a signal containing a significant DC
level, the input may take an extended period (time) to settle as the input time
constant is 300mS ± 2%.
3. The default for voltage/current input range is auto. To set a fixed range value,
scroll through the given selections. Choose a range of 6Vrms, or higher, which
effectively creates an input impedance of 600kΩ. The selectable options are: 2.5;
6; 20; 65; 200; 700; 6m; 20m; 70m; 200m; and 750m. Note that the range
currently being used shows in brackets to the right when the selected input mode
and the in-use input mode are the same.
INPUT A CONFIGURE
auto ( 6m) V(dc)
Scaling x +1.0000
Guard : Lo Input A
Figure 12. Input Configure Display
4. Press ENTER once to move onto the next display line, press ENTER twice to
action changes for the separate input connections.

42 6000-2 & -3 User Guide, Rev E
Ø To change the (input) scale factor:
1. While viewing the INPUT CONFIGURE display for the respective input you are
configuring, press the DISPLAY SELECT 3 key.
2. Enter the desired scale factor using the DATA ENTRY keypad. For details, see
Input Scaling on page 43.
3. Press ENTER once to move onto the next display line, press ENTER twice to
action changes for the separate input connections.
Ø Setting the Guard connection for each input connector:
1. While viewing the INPUT CONFIGURE display for the respective input you are
configuring, press the DISPLAY SELECT 4 key.
2. Repetitively press the DISPLAY SELECT 4 key to toggle the options for external
and internal connections. Choose External, or one of the internal connections:
Lo Input A, Lo Input B, or Lo Input Sync (-3 only).
3. When complete with your input connector selections, press ENTER to action the
changes.
Ø To configure the Nullmeter parameter display:
The Nullmeter does not light until valid measurements for Results Data are
configured. For details on the options, refer to Nullmeter Display Menu on page 49.
1. Press the NULLMETER
SELECT key. One of five
Nullmeter parameter displays will come up.
See Figure 13.
2. Continue pressing the
DISPLAY SELECT 1 key to
view the four possible parameter displays for the
Nullmeter.
Refer to Nullmeter Parameter Types on page 49.
4. Press the NULLMETER SCALE key. Refer back to The Nullmeter on page 22.
If you do not choose to use the Nullmeter, then configure a Parameter (p) display to
match your measurement requirements. Refer to Parameter Display Menus on
page 50.
Nullmtr:- Parameter
p = Phs Bh01--Ah01
Display as +/-180
o
Filter = 0.000s
Figure 13. Nullmeter Sample Display

Configuration Setup 43
Ø To complete a configuration setup:
1. Connect the signal(s) to the respective BNC and GUARD terminals.
2. Apply signals.
3. Make any adjustments required to SETUP MEASUREMENT configuration.
4. Make adjustments, as needed to the parameter displays or the Nullmeter
parameter displays.
5. When complete with this setup store the configuration using the Control
keypad’s STORE key. See Storing & Retrieving Configurations on page 32.
Input Configuration Menu
Each selectable option of the Input Configuration menu is described in the following
subsections. When the displayed menu has been altered to suit your requirements,
press the ENTER key twice to action any changes made.
Input Scaling
This indicates the present amplitude scale factor (if any) applied to measurements of
this input. If the default scale factor of +1.0 shows in the display, then no input
scaling is performed. You may enter any desired scale factor (including negative
factors) for application to each input. Negative scale factors are correctly applied,
such as, the corresponding positive scale factor is applied, in concert with a 180°
phase shift.
Guard
This indicates the presently selected GUARD terminal connection.
• External—Indicates that the GUARD terminal is to be externally driven.
• Lo Input A, B or S (-3)—Indicates that the GUARD terminal is internally
connected to the respective input’s BNC outer shell.
Caution: If you are measuring current, or if the voltage range is less than 6vrms,
ensure that less than 10Vpk exists between each BNC outer shell of the pair of inputs
and outer shell and the guard terminal.
Notes:
1) When making external connections only connect to the GUARD terminals.
2) When using the current input, current low MUST be externally connected to the
GUARD terminal and the input pair configured to use external guard.

44 6000-2 & -3 User Guide, Rev E
Measurement Configuration Menu
The Setup Measurements line of the SETUP key menu allows you to fully configure
your instrument’s measuring characteristics according to each particular situation.
The discussions below deal with each menu line in the same order as shown in the
display menu. For this display, scroll using the ê key, to access the lower lines.
When the displayed menu matches your requirements, press the ENTER key once or
twice, as required, to action any changes made.
Fundamental Frequency
The Fund: menu line allows you to select from three types of fundamental frequency
measurements, which you can use to synchronize your instrument’s amplitude
measurements.
The fundamental frequency types are:
Measured—
The default is MEASURED. A selected input measured frequency is indicated for the
instrument’s fundamental frequency.
Measured (multiplied by a factor)—
The option Meas x .000000 allows you to select an input measured frequency
multiplied by a defined factor, as its fundamental frequency. Enter a value with this
selection. You can also use this menu item to measure sub-harmonic content of a
signal, for example, at 1/2 the fundamental frequency.
Fixed—
The FIXED type directly sets the fundamental frequency to be any frequency you
have entered within the range of 0.0005HZ to 100kHZ:
Select the FIXED type when:
• There is no signal present, which has sufficient amplitude at the fundamental
frequency.
• The fundamental frequency is not stable.
• The input signal is first applied and the input fundamental frequency is well
known (within a few percent), rather than allowing the instrument time to
establish the fundamental frequency.
• The fundamental frequency is very low (e.g., 0.0005Hz), forcing the instrument
to wait at least 4 cycles of the input waveform before starting harmonic analysis.

Configuration Setup 45
• You want to perform a spectral analysis of the input signal(s), rather than
harmonic analysis.
Note: When performing a spectral analysis, set the fundamental frequency to
the desired frequency step between available spectral points, set the RBW ratio
to 1, and set the maximum harmonic to the number of spectral points, desired.
Fundamental Frequency Range
When the fundamental is not fixed, the Fundamental Frequency Range menu is
active. The menu line Fund: 40.0 – 500 Hz allows you to set a frequency range for a
measured fundamental frequency.
• The default frequency range shows on the display as 40Hz to 500Hz. You may
set any range of frequencies within the 0.0005Hz to 100kHz range, with a limit
of a 128:1 range.
• When in-phase precision is required, or where harmonic distortion is present, it
is beneficial to reduce this to a 2:1 range around the nominal fundamental
frequency. An example of this is 40 to 80Hz.
• When specifying a fundamental frequency range, consider that the instrument
will take the lowest frequency component having a signal of greater than 5% of
range, as its fundamental. If there is signal having a sub-fundamental frequency
component of any significance, then the exclusion of that frequency from the
selected range will substantially eliminate its effect on the measurement.
• If your instrument requires signal measurements having fundamental frequencies
beyond the 40Hz to 500Hz range, or other requirements to accommodate
abnormal measurement situations;
—Then—
Use the SETUP key to enter a configuration reflecting your instrument’s needs.
Note that previous configurations may be stored and recalled using the STORE
and RECALL keys.
Fundamental Source
When the fundamental frequency is not fixed, the From: menu line becomes active.
The Fundamental Source menu sets an input, or a set of inputs. The fundamental is
based on the measured frequency of the input(s) set by this menu line.
The source applies when:
• An input is added to or removed from the list by pressing the respective INPUT
key.
• The default is set to AUTO-SELECT between all inputs.

46 6000-2 & -3 User Guide, Rev E
• When selecting this input, or set of inputs, consider which input has the least
noise content, the least amplitude variability, and the least cycle-to-cycle phase
noise.
—An example of a signal that should NOT be allowed to act as the fundamental
frequency source is a RVD or LVD transformer’s output, which has its
frequency shifted during the time it is moved—
• If more than one input is selected, the instrument will continuously monitor all
selected inputs, selecting the one having the most stable frequency measurement.
The front panel SYNC lights indicate, which input is actually being used at any
given moment.
Nominal Amplitude Measurement Period
The Nominal Amplitude Measurement Period menu, shows on the display as Min
Period: It is always active and allows you to define the period of time amplitude
measurements are made. For all, but the shortest of periods, this effectively sets the
results update rate of the instrument. Note that the default measurement period is
250S.
The update rate of the display is limited to 250mS and the Nullmeter is limited to
100ms. Selecting a measurement period, less than these figures is ineffective when
using front panel operation.
The length of time that is required to measure a harmonic characteristic takes
precedence over the selected amplitude measurement period. This means that if you
enable a 50Hz harmonic measurement signal expect at least a 1mS measurement
period. The minimum required for analysis is 20mS, 1 cycle.
Limitations on the actual measurement period are:
• The minimum measurement period attainable under all circumstances is 0.01S.
• The minimum period is further set by RBW Ratio x Fundamental Period, unless
the Maximum Harmonics line is set to zero (thus turning off harmonic
analysis).
• The maximum period is 100000S.
• The maximum period is further set by (Fundamental Period x 8192) / (RBW
Ratio x Maximum Harmonics) if harmonic analysis is enabled.

Configuration Setup 47
Filter Frequency
The Filter Frequency menu line is always active. This menu line reads as Filter: with
a default frequency of 50kHZ. It allows you to select a low-pass filter, used to limit
the input signal to the entered value before amplitude measurements. Note that this
filter has no direct affect on frequency measurement. You may select from 0.0005Hz
through 2mHz for this filter’s 3dB frequency.
The limitations on the actual corner frequency are regarding the following:
• There is no actual filter for entered frequencies above 250kHZ. In this case the
actual bandwidth is in excess of 2mHz.
• The actual minimum filter frequency is 4.88Hz.
• The physically available filter frequencies are in the ratio of 1.2:1 steps within
the 4.88Hz to 200kHz range.
• Be aware that if the ratio of the filter frequency is less than 50 times the
fundamental frequency,
—Then—
The instrument’s amplitude accuracy is affected and the number of available
harmonics is reduced in accordance with the ratio.
Maximum Harmonics
This sets the Maximum Harmonic number that will be available for Results Data.
The display reads: Max Harmonics: The default is 200. Setting a higher number in a
parameter selection than the set harmonic number will yield zero results. For
optimum harmonic results, note that:
• The frequency of the maximum available harmonic is nominally 200kHZ.
• Set the MAXIMUM HARMONIC fairly high for low-frequency fundamental
frequencies, such as, 200 at 50Hz, to reduce higher fundamental frequencies,
such as, 10 at 20kHz.
• Setting an abnormally low maximum harmonic at low fundamental frequencies
may affect the stability of the phase measurement, as may setting an unusually
high harmonic at high fundamental frequencies.
• The maximum available number of harmonics is the lower of 4096 / RBW Ratio,
or 2047.
• Setting a maximum harmonic of zero, inhibits all harmonic analysis. In this case
only AC+DC, AC only, and DC only, parameters will yield measured results, all
harmonic related results will be zero. If these are the only required parameters,
then some increase in performance may be found by disabling harmonic analysis
in this manner.

48 6000-2 & -3 User Guide, Rev E
Fundamental÷÷Bandwidth
The Fundamental÷BW is also known as RBW ratio. The RBW ratio default is 2:1.
This menu line sets the minimum number of fundamental frequency cycles the
analysis is performed. In cases where a signal is known to have excellent frequency
stability, and you desire superior inter-harmonic noise rejection, setting this ratio to a
high value, such as, 20:1 is of benefit. Conversely, for signals having poor frequency
stability this figure can be reduced to as low as 1. We recommend a ratio between
2:1 and 10:1. Note that the lower frequency limit for the second harmonic is the
same as the upper frequency limit on the fundamental amplitude measurement.
Fundamental÷Bandwidth characteristics are:
• The bandwidth for any harmonic is given by Fundamental Frequency / RBW
ratio.
• The maximum RBW available is 4096 / Maximum Harmonic.
• Setting the RBW ratio to a high value may result in instability of measurement
results, particularly at higher harmonics.
Note: If a value of 100 is set for RBW, then the frequency stability of the
fundamental must be <0.1% for a stable measurement of the 10th harmonic.
Analysis
The Discrete Fourier Transform analysis type menu line reads as FFT Type: This
option can be set as Normal or Windowed. The analysis can be performed with
either function selected. This analysis option reduces both the effect of being
nonsynchronous with the incoming frequency and the effects of non-harmonic signal
content. The benefit of the Windowed function is offset by the fact that phase
accuracy is adversely affected and that 4:1 more cycles are required for the
measurement to achieve the same bandwidth. Normal is the default and is
recommended, however, superior amplitude performance can be achieved using the
Windowed selection. The actual window function used in the 6000 family of
products is a modified Blackman-Harris function.

Configuration Setup 49
Fundamental Frequency Averaging
An accurate, noise free, measurement of the fundamental frequency is the basis for
any high-resolution phase measurement. Thus some averaging, or filtering of the
fundamental frequency measurement results, is desirable. However, averaging and
filtering slows the instrument’s response to changes in frequency.
• The default is med.
• For operation at frequencies above 10Hz, the use of the fast or med selections
are recommended.
• If the fundamental frequency is exceptionally noisy, or the ultimate in phase
accuracy is required, then use the slow selection.
• For operation at low frequencies, such as 0.0005Hz, the none selection is
desirable. Otherwise the instrument may take more than one day to adequately
acquire the fundamental frequency.
Fundamental Frequency Measurement Period
The FUNDAMENTAL FREQUENCY MEASUREMENT PERIOD menu line sets the
base measurement period for the fundamental frequency measurement. Setting this
measurement to a longer period than the default of 250mS, reduces frequency
measurement noise at the expense of a longer settling time.
• A better reduction in frequency measurement noise can be achieved by using
longer fundamental frequency averaging.
• Settings in the range of 0.25 to 1 are recommended for normal frequencies, with
longer periods being desirable for low frequency operation.
• The actual minimum measurement period is 4 cycles of the lowest fundamental
frequency.
• The maximum measurement period is 512 cycles of the highest fundamental
frequency.
Nullmeter Display Menu
Bring the Nullmeter menu up by pressing the NULLMETER SELECT key. To view the
four different Nullmeter parameter displays, press the DISPLAY SELECT 1 key.
Nullmeter Parameter Types
The first line of the menu display shows the Nullmeter types. You can change the
types by repeated presses of the DISPLAY SELECT 1 key. The Nullmeter’s results
show in the display.

50 6000-2 & -3 User Guide, Rev E
Parameter—
This indicates that the result will be directly obtained from the measurement
parameter defined in the second (p) line of the menu.
Param-Ref—
This indicates that the result will be the difference between the parameter defined in
the second (p) line of the menu, minus the result of the third (r) line of the menu.
The reference (r) parameter may be continuously updated, or a previously measured
value of this parameter (as defined by the fourth line of the menu).
Param/Ref—
This indicates that the result will be the difference between the parameter defined in
the second (p) line of the menu, divided by the result of the third (r) line of the menu.
The reference (r) parameter may be continuously updated, or a previously measured
value of this parameter (as defined by the fourth line of the menu).
Param/Ref-1—
This indicates that the result will be the parameter defined in the second (p) line of
the menu, divided by the result of the third (r) line of the menu, minus 1 (i.e., [p/r]-
1). The reference (r) parameter may be continuously updated, or a previously
measured value of this parameter (as defined by the fourth line of the menu).
Parameter Display Menus
Bring the parameter displays up by pressing any DISPLAY SELECT key. Press
DISPLAY SELECT 1 key repetitively to view the various parameter displays. Refer to
the following paragraphs for descriptions/definitions.
Parameter (p)
Edit the line that contains Parameter (p) by first pressing the corresponding DISPLAY
SELECT key. The format of this line is dependent on its contents. Each portion of
the line may be edited by using the é and ê keys, the INPUT keys, or the DATA
ENTRY keys (as applicable). The ENTER key should be pressed when all the sections
of this line are to your requirements.
The leftmost selection on this line is the parameter type. The available selections are
(in the order selected by the é key) as follows:
True RMS—
Represents the TRUE RMS amplitude of the selected input. The “bandwidth” of the
result may be set as DC only, AC only, AC+DC, or a range of harmonics. Note that
setting the same start and end harmonic yields the amplitude of the given harmonic.

Configuration Setup 51
Rectify—
Rectify in the menu means the average rectified amplitude (or mean modulus) of the
selected input.
Form Factor—
FF in the menu means form factor of the selected input, such as, the ratio of the
average rectified and true RMS amplitudes.
Crest Factor—
CF in the menu means the crest factor of the selected input, such as, the ratio of the
peak and true RMS amplitudes.
Highest Peak—
High Pk In the menu means the highest detected peak amplitude of the selected
input, such as the most positive.
Lowest Peak—
Low Pk in the menu means the lowest detected peak amplitude of the selected input,
such as the most negative.
Peak—
Peak represents the highest detected peak amplitude of the selected input, such as
either the most positive or the most negative.
Pk-Pk—
This is the difference between the highest and lowest detected peak amplitudes of the
selected input.
THD-Fund—
This is the total harmonic distortion of the selected input, relative to the fundamental
component—You may select the maximum harmonic to be included.
THD-Harm—
This is the total harmonic distortion of the selected input, relative to the total
harmonic content—You may select the maximum harmonic to be included.
THD-Sig—
This is the total harmonic distortion of the selected input, relative to the total RMS
signal content—You may select the maximum harmonic to be included.
Frequency—
This is the fundamental frequency of the selected input, or the fundamental
frequency selected as sync. for amplitude measurements.

52 6000-2 & -3 User Guide, Rev E
Watts—
This is the real power measured by the pair of inputs—Assuming one input is
measuring voltage and other is measuring current—The “bandwidth” of the result
may be set as DC only, AC only, AC+DC, or a range of harmonics (setting the
same start and end harmonic yields the power at the given harmonic).
VAR—
This is the imaginary power measured by the pair of inputs. Assuming one input is
measuring voltage and other is measuring current—The “bandwidth” of the result
may be set as AC only, AC+DC, or a range of harmonics (setting the same start and
end harmonic yields the VARs at the given harmonic).
VA—
This is the “apparent” power measured by the pair of inputs. Assuming one input is
measuring voltage and other is measuring current. The “bandwidth” of the result may
be set as DC only, AC only, AC+DC, or a range of harmonics (setting the same
start and end harmonic yields the VA at the given harmonic).
PF—
This is the power factor (i.e., Watts/VA) measured by the pair of inputs. Assuming
one input is measuring voltage and other is measuring current. The “bandwidth” of
the result may be set as AC only, AC+DC, or a range of harmonics (setting the
same start and end harmonic yields the power factor at the given harmonic)—Note
that this is the correlation coefficient of the two signals over the bandwidth defined.
DPF—
This is the displacement power factor (i.e., Watts/VA of the fundamental) measured
by the pair of inputs. Assuming one input is measuring voltage and other is
measuring current. Note that this is the Power Factor or Correlation of the
fundamental components only.
Eff.Phs—
This is the “Effective Phase” [i.e., cos-1(Watts/VA)] measured by the pair of inputs.
Assuming one input is measuring voltage and other is measuring current. The
“bandwidth” of the result may be set as AC only, AC+DC, or a range of harmonics
(setting the same start and end harmonic yields the Effective Phase at the given
harmonic).
Pk VA—
This is the highest detected real-time cross product of the waveforms of the selected
pair of inputs. Assuming one input is measuring voltage and other is measuring
current.

Configuration Setup 53
Load Z—
This is the computed load impedance as measured by the pair of inputs. Assuming
one input is measuring voltage and other is measuring current. The “bandwidth” of
the result may be set as DC only, AC only, AC+DC, or a range of harmonics
(setting the same start and end harmonic yields the Load Impedance at the given
harmonic).
Load R—
This is the computed load resistance (i.e., in phase component of impedance) as
measured by the pair of inputs. Assuming one input is measuring voltage and other is
measuring current. The “bandwidth” of the result may be set as DC only, AC only,
AC+DC, or a range of harmonics (setting the same start and end harmonic yields
the Load Resistance at the given harmonic).
Load X—
This is the computed load reactance (i.e., quadrature component of impedance) as
measured by the pair of inputs. Assuming one input is measuring voltage and other is
measuring current. The “bandwidth” of the result may be set as DC only, AC only,
AC+DC, or a range of harmonics (setting the same start and end harmonic yields
the Load Reactance at the given harmonic).
Spectrum—
This is the RMS amplitude of the selected input at the selected spectrum point of the
spectrum analysis—Use Spect Hz to determine the frequency of the selected
spectrum point.
Spect Hz—
This is the frequency of the selected spectrum point of the spectrum analysis.
Gain—
This is the ratio between the total amplitudes of the selected input/harmonic pair.
Gre—
This is the ratio between the amplitudes of the in phase component of the selected
input/harmonic pair.
Gim—
This is the ratio between the amplitudes of the quadrature component of the selected
input/harmonic pair.
Real—
This is the in phase component of the selected input/harmonic pair.

54 6000-2 & -3 User Guide, Rev E
Imag—
This is the quadrature component of the selected input/harmonic pair.
Phs—
This is the phase between the selected input/harmonic pair.
Constant—
This sets the value to what you have entered.
Reference Parameter (r)
Edit this line by pressing the corresponding DISPLAY SELECT key. The method of
selecting the parameter etc., is the same as for the parameter (p) line described
above.
Reference Parameter Type
This line is changed by pressing the corresponding DISPLAY SELECT key, using the
é key to change the selection, then pressing the ENTER key. The line is only present
when the reference parameter line is present and is not set to a constant. The
available selections are:
Updated Ref. Param.—
This selects continuous update for the reference parameter.
Fixed Ref. Param.—
This selects no continuous updating for the reference parameter, but that a previously
set value of this parameter will be used.
Fix Ref. Param. Now—
This selects that the reference parameter will be fixed at the currently measured
value. The selection changes to Fixed Ref. Param. after pressing the ENTER key.
Data Result Units
This line allows you to set the units for the result of the parameter measurement or
deviation. You may select any unit, which is compatible with the parameter or
deviation. The unit chosen is automatically set to the default when the primary
parameter is being edited. The instrument automatically provides any conversion
required.
Note that the unit is NOT automatically updated when the selected input(s) has its
mode changed between voltage and current (or vice versa). If you have changed the
mode, select the display line (or nullmeter select) and manually change the units,

Configuration Setup 55
specifically press the corresponding DISPLAY SELECT key, then use the é and ê
keys to change the selection. Press the ENTER key when the desired unit is displayed.
The available units are:
Application Units of Measure / Notes
Amps “A” with optional ac, avg, dc, rms, pk, pkpk, imag or real
Volts “V” with optional ac, avg, dc, rms, pk, pkpk, imag or real
dBV or dBµV decibel ratio to 1V or 1µV respectively.
Watts “W” with optional ac or dc
dBW or dBm decibel ratio to 1W or 1mW respectively
VA with optional dc, ac or pk
VAR with optional ac
Horse power “HP”
% percentage
dB decibel
±180° or 0-360°
Grad
Radians
Half or full circle
±200 or 0-400
±π or 0-2π
π radians ±1 or 0-2
Hertz “Hz”
Cycles per second “cps”
Revolutions per min. “rpm”
Seconds “sec”, inverse Hz
Hours “Hr”
Resistance
Conductance “S”, with optional dc, ac, imag or real
“Ω”, with optional dc, ac, imag or real
Comparison Limit
If you have selected a limit comparison to be performed, then this line becomes
visible. The constant value set in this line sets the amount by which the primary
parameter may deviate from the reference parameter before the displayed status
changes from PASS to either HIGH (p > r + limit) or LOW (p < r: limit). The limit
may be changed by pressing the corresponding DISPLAY SELECT key, using the
numeric keys to enter the desired limit, pressing the ENTER key when the desired
limit has been entered.

56 6000-2 & -3 User Guide, Rev E
Filter Time Constant
The parameter or deviation result may be filtered (averaged) with a single order filter
have any user specified time constant in the range 0.01S to 10000S. Setting this
value to zero, disables the filter. Change the filter time constant by pressing the
corresponding DISPLAY SELECT key; using the numeric keys to enter the desired
filter time constant; and then pressing the ENTER key when the desired filter time
constant has been entered.
Notes:
• The filter only affects the selected display line, or the nullmeter (as applicable).
• The filter is automatically “bypassed” and reset when the result changes by more
than approximately 1000 least significant displayed digits. This gives fast
settling with the maximum amount of filtering.
• The filter is automatically reset when the display line (or nullmeter) is selected.
• The filter is applied after computing any deviation, thus it is the deviation which
is filtered, NOT the parameter and the reference individually.
• The filter is applied prior to units conversion, thus operates correctly on “nonlinear” units (e.g., dB).
Some Useful Hints
Showing Percentages & dB Changes
1. Set a display line to the PARAM/REF-1 type [the (X/REF)-1 key is useful for
this].
2. Set both P and R to the same parameter.
3. Apply the input(s), in the reference (0% or 0dB) conditions.
4. Select to FIX REF. PARAM. NOW.
5. Select the desired display units (usually either PERCENT or DB RATIO).
6. Enter the display line. The display will now continuously display the percentage
or dB change of the selected measurement result from that at the reference
conditions.
If you wish to reset the reference level, simply reselect the display line, and reselect
to FIX REF. PARAM. NOW.

Configuration Setup 57
Unstable Displayed Results
Select for the result to be filtered by selecting the display line and setting the Filter:
menu selection to a non-zero time constant. A value of 1 or 2 seconds is usually
suitable for frequencies above 10Hz. Set a value proportionately longer for lower
frequencies.
Display Line Format
All displayed parameter or deviation data follow the same general format. Each
display line is sectioned into four portions, from left to right:
Measurement Type—
This is indicated in the first five characters of the display line, and indicates either
the method used to measure the parameter displayed (e.g., Σrms or Harmonic), or
the type of deviation used.
Numeric Result—
This is indicated in the following 8 characters of the display line, and indicates the
numeric value of the parameter, or the result of the deviation. Where applicable, this
also indicates the polarity. The value of the least significant digit used by the display
is automatically maintained by the instrument such that immeasurable resolution will
not be shown, even after units conversions or passing through user defined
equations.
Result Unit—
This is indicated in the following 5 characters of the display line, and not only
indicates the unit you have chosen, but may also indicate further details regarding the
method used for measurement (e.g., Vrms or Vavg). Power Factor Lead or Lag
information is also shown in this section of the display line when applicable.
Input Measured—
This is indicated in the rightmost character of the display, and indicates the input
used for the displayed result. When the displayed result is from a primary and a
reference input (e.g., phase B:A), then the primary input’s letter is displayed. When
the displayed result is a deviation, then the primary input of the primary parameter is
displayed.
Under certain conditions, no numerical result can be presented for the selected
parameter or deviation, in these conditions the central portions of the display are
replaced by an informational message.

58 6000-2 & -3 User Guide, Rev E
The following terms may display in a message:
Invalid—
This is displayed if the parameter or deviation defined for the display line had
invalid syntax. This generally can only be displayed when the display line’s contents
was defined via an interface, the display line definition menu maintains correct
format for this definition.
Invalid chnl—
This is displayed if the parameter of deviation contains a reference to an input which
is not fitted in this instrument (e.g., defining input C in a 6000-2). This generally can
only be displayed when the display line’s contents was defined via an interface, the
display line definition menu maintains correct format for this definition.
Low input—
This is displayed when a requested parameter cannot presently be correctly
measured. The usual reason is when the input level is too low (below approximately
0.5% of range if filtered, 5% if unfiltered). Other reasons are: when you have the
parameter-required harmonic analysis disabled and either harmonic analysis
disabled; and when the requested harmonic was higher than what is available; and
when no fundamental component was found in the frequency range defined.
Overflow—
This is displayed when a deviation or equation computation resulted in a numerical
overflow (e.g., divide by zero).
Nullmeter Scale Menu
Independently of the parameter selected, the Nullmeter may be scaled in various
ways. The selection of Nullmeter Scaling is initiated by pressing the Nullmeter’s
SCALE key.
Scale Factor
The Scale Factor menu line allows you to set the value for the Nullmeter’s
parameter, which you can select using the Nullmeter’s SELECT key, and corresponds
to the distance between the 0 and 1 values of the Nullmeter. This displayed value
may be altered by the following procedure:
1. Press the DISPLAY SELECT 2 key.
2. Using the DATA ENTRY keys, enter the desired scale factor. Note that negative
numbers may be used, as required.
3. Press the ENTER key.

Configuration Setup 59
Type
The TYPE menu line allows you to select the type of nullmeter that will be used.
The type is selected by a combination of three settings, which are displayed in this
menu line. From left to right, these are:
Dot or Bar type:
• SmlDot
This selection indicates that a single dot is used as the marker.
• MedDot
This selection indicates that three dots is used as the marker. The inner dot
is fully illuminated; the outer dots are dim.
• LrgDot
This selection indicates that five dots is used as the marker. The inner dot is
fully illuminated; the outer dots are successively dimmer.
• Bar
This selection indicates that the Nullmeter will be a bargraph, with all
positions illuminated from 0 to the marker position.
Linearity:
• Lin
This selection indicates that the Nullmeter will use linear scaling. Note that
this gives the Nullmeter a 0 to 1 dynamic range, i.e. the range set by the
Scale selection.
• Log
This selection indicates that the Nullmeter will use logarithmic scaling.
Note that this gives the Nullmeter a 0 to 1000 dynamic range, i.e. 0 to 1000
times the Scale selection, with results less than 0.1 being shown as 0.
Note: Setting the Scale selection to your specified adjustment limit enables the
adjustment of your input(s) with fine resolution at null, but without loosing visibility
of adjustment when far away from null.
Zero Position and Polarity Sensitivity:
• Left
This selection indicates that only positive results are displayed, and that the
0 position is at the extreme left end.
• Centered
This selection indicates that either polarity results are displayed, with the 0
position in the center. Positive results are displayed to the right, negative
results are displayed to the left.

60 6000-2 & -3 User Guide, Rev E
• Mirrored
This selection is similar to Centered, but is mirrored around the central 0
position. Note that this yields increased visibility for null detection, at the
cost of not knowing polarity.
These settings may be altered by:
1. Pressing the DISPLAY SELECT 3 key.
2. Using the é or ê keys to change the selection containing the cursor character.
3. Using the ç or è keys to move the cursor character between the three
selections.
4. Pressing the ENTER key when all three selections are made.
Additional Application Examples
Select the Set Defaults menu item under the SETUP key prior to configuring
measurements for a specific application, to ensure the configuration is starting from
a known condition.
The following example procedure applies:
• If you need to measure harmonic content, amplitude, or phase while tracking the
fundamental frequency
• If you need to measure wideband amplitudes synchronously with the input
signal—a requirement when below 1kHz.
Ø To measure signal content of harmonics, amplitude, phase, and sync:
1. Set the FUND: RANGE menu selection to the desired range of fundamental
frequencies. You may set any range of frequencies within the 0.0005Hz to
100kHz range, with a limit of a 128:1 range.
• More stable harmonic measurements will result if you set the frequency
range to a ratio as low as possible, such as, 2:1. For example, set range from
40 to 80Hz for 60Hz measurements.
• Under situations where the signal contains significant non-harmonic content,
such as, asynchronous PWM or noise, or significant low order harmonic
content,
—Then—
Set the frequency for this range to as low as possible. Note that this lowest
position is just above the expected highest fundamental frequency.
2. Set the From: menu selection to obtain the fundamental frequency only from one
of the inputs being used. Choose the input having the largest signal with the least
extraneous signal content.

Configuration Setup 61
3. Set the Min Period: menu selection to the desired update interval. The
recommended setting is the longer time: 250mS or 4 periods of the minimum
fundamental.
4. Set the Filter: menu selection to eliminate any undesired high frequency signal
content.
• If the upper limit of the frequency range is above 1kHz, increase this setting.
• If harmonic measurements of squarewaves or signals with significant non-
harmonic content are to be performed,
—Then—
Set this as low as possible. The recommended setting is the lower of 50
times the fundamental, or 100kHz.
5. Set the Max Harmonics: menu selection.
• Set 0 if no harmonic analysis is required.
• Set to 200, if measurements of phase or of high-order harmonic amplitude
are required.
• Set to 50 if measurements of amplitude harmonics, only, are required.
• If you are performing phase measurements using squarewaves,
—Then—
The recommended setting is as high as possible—up to the maximum 2047.
6. The default Fundamental÷BW: selection (2) does not require changing, if
the signal contains significant random noise, or you are measuring squarewaves.
7. Change the default Fundamental÷BW: selection (2), if an increase is needed
for stable measurements.
8. Change the FFT Type: setting to Windowed, if you are making only amplitude
harmonic measurements, or phase measurements of squarewaves.
9. If the fundamental frequency is less than 20Hz, set the Sync Averaging:
selection to none.
Note that the default Sync Period: selection (0.25S) does not require changing, as
the instrument will automatically extend this period at low frequencies.
Ø To measure harmonic content, or wideband amplitudes synchronously:
Note: Applies where the input signal is below 1kHz and the fundamental frequency
is either immeasurable or predictably within 2%.
1. Set the Fund: menu selection to Fund: Fixed, and set the frequency to the
required fundamental frequency.
2. Set the Min Period: menu selection to the fastest desired update interval,
whichever is the longer: 250mS or 4 periods of the fundamental.

62 6000-2 & -3 User Guide, Rev E
3. If the fundamental frequency is above 500Hz, or the default 50kHz filter cutoff
frequency is undesirable,
—Then—
Change the Filter: menu selection to LOW-PASS FILTER CUTOFF
FREQUENCY.
4. In the Max Harmonics: menu selection set the harmonic to 50, or if no
harmonic analysis is required, set it to 0.
5. The default Fundamental÷BW: selection (2) does not require changing.
Ø To perform spectral analysis of the input signal.
Note: For optimum results use an FFT type setting of Windowed.
1. Set the Fund: menu selection to Fund: Fixed, and set the frequency to the
required frequency resolution for the spectral analysis.
2. Set the Min Period: menu selection to the fastest desired update interval. We
recommend the longer time between 250mS or 4 periods of the frequency
entered in step 3 of measuring signal content regarding setting minimum period.
3. Set the Filter: menu selection to the highest frequency desired to be included in
the spectral analysis.
4. Set the Max Harmonics: menu selection to the number of spectral analysis
points required. Note that the highest frequency within the spectral analysis is
the frequency entered in step 1. above, times the maximum harmonics.
5. Set the Fundamental÷BW: selection to 1.
Ø To measure wideband amplitudes over a known period of time:
Example: when amplitudes are asynchronous to the input signal
1. Set the Fund: menu selection to Fund:Fixed, and set a frequency of 10kHz.
This sets the resolution of the measurement to 100µs.
2. Set the Min Period: menu selection to the desired measurement interval. Note
that any period between 1mS and 100000S may be entered.
3. If the default 50kHz filter cutoff frequency is undesirable,
—Then—
Change the low-pass filter cutoff frequency. Refer to the Filter: menu.
4. Set the Max Harmonics: menu selection to 0.
The instrument will downrange at 10mS intervals if autorange is enabled. We
recommend you use a fixed input range if the signal contains more than 5% content
(including amplitude modulation) at frequencies below 100Hz.

Interface Operation 63
Interface Operation
The 6000 instrument family has optional IEEE488 and RS232 interfaces, which may
be configured to allow the instrument to be both controlled and interrogated by a
computer.
Both interfaces operate in a similar manner, using the same command set. There are
two operational differences between these interfaces:
• The ability of the IEEE488 interface to switch between remote and local
command states, which the RS232 interface does not offer; and
• The ability of the controller to continuously read the same data from the
IEEE488 interface, where as the controller must prompt the instrument to
transmit the desired data from the RS232 interface each time.
Throughout this section it is assumed that you are conversant with manual operation
of the instrument, and with the methods of operating the controller for the particular
interface being used.
RS232 Data Format Selection
Ensure that the computer connected to the RS232 port is set to the same baud rate as
the instrument’s serial port, 8 bit data with no parity, 1 stop bit and 1 start bit. For
normal operation, select the highest (38400 baud) rate.
Note that some IBM PC compatible computers do not operate correctly at the highest
baud speed, particularly when operating in a multi-tasking environment. To reduce
data transfer error rates you can decrease the selected baud rate, especially when
your operating environment has severe interference; when you are using long cable
lengths; or when you are unsure whether the computer is capable of this highest rate.

64 6000-2 & -3 User Guide, Rev E
IEEE488 Interface Setup
Throughout this section of the manual, the use of a National Instruments AT-GPIB®
IEEE488 controller board in an IBM AT (or compatible) is assumed. If you are
using a different controller or a controller card from another vendor, then the exact
methods used will differ from those shown. If you are using a computer with a builtin interface (such as the Hewlett-Packard series 300 and similar computers) then no
configuration is usually required.
Configure each interface via the 6000 instrument’s front panel using the SETUP key
in the CONTROL keypad and selecting the Interface option line. Interfaces for
controlling the instrument must be selected as being “Control” type interfaces.
Other than enabling the interface to act as a control interface, setting the desired
address and connecting the IEEE488 cable, you need not perform any specific
configurations on the instrument. Note that as with all IEEE488 instruments and
devices, ensure that the selected address does not conflict with any other devices in
the system. When using the instrument with the National Instruments controller card
(and with many other cards for the IBM AT) do not select an instrument address of
zero, as this will conflict with the address of the card.
Table 1. Settings for the Instrument.
Primary Address 2.1 Set EOI with EOS on
no.5
Write
Secondary Address NONE.1 Type of Compare on EOS 7-bit.4
Timeout Setting T1s.2 Set EOI w/last byte of
yes.5
Write
EOS Byte 0AH.3 Repeat Addressing no.6
Terminate read on EOS yes.4
Caution: To prevent unreliable operation of both the bus and the computer device
names should not also exist as file, directory, or sub-directory names within the
computer system as documented in the National Instruments manual. Additionally,
when operating in a network environment, use names that are cryptic to reduce the
probability of this kind of duplication occurring.
Notes:
1) Verify that the address matches what is configured in the instrument. These
instruments do not use secondary addressing.

Interface Operation 65
2) The only command that may hold the bus handshake for longer than 20mS is the
device clear command. If this command is not used, then even shorter timeout
periods can be used to detect a failure. The device clear command may hold the bus
handshake for up to one second. When using the command pass-through feature of
the MIB (i.e. controlling another instrument via the MIB), longer timeout periods
may be required.
3) These instruments always send a carriage return (0DH) and a line feed (0AH)
with EOI asserted at the end of each data transfer.
4) Terminating a data read with the defined EOS byte ensures that data transfers are
correctly terminated. This ensures that you do not have to specify the exact number
of characters for each transfer. Data transfers from these instruments are all 7-bit
ASCII data with no parity.
5) These instruments will terminate a data receive operation with either a line feed
character (0AH), or any character with EOI asserted, or with a device trigger.
Selecting the EOI w/last byte of “Write” option ensures the shortest possible data
transfer.
6) These instruments do not “unaddress” at the completion of a transfer. Thus,
assuming no other device has been subsequently addressed, there is generally no
requirement to re-address the instrument. However, if the instrument is locally reset
to the local state then it must be re-addressed to reenter the remote state.
Configuring the Controller Card
Follow the manufacturer’s recommended installation procedure when installing the
card in the computer. Note that when installing an IBM PC (i.e., 8-bit) card into an
IBM AT type machine (i.e. 16-bit or higher), take particular note of the hardware
interrupt and DMA input selected for the card.
Most manufacturers of these cards set these parameters to those compatible with the
IBM PC, unfortunately these usually conflict with other cards normally found in the
IBM AT class computers. Be aware that the first parallel port in an IBM AT class
computer uses interrupt IRQ7.
When a conflict occurs between interrupts and DMA inputs, the problems may not
appear for some time, or may only cause intermittent operation. The recommended
action when any doubt occurs is to first deselect the DMA input, and secondly—if
the problem persists—deselect the IRQ. Although this will perform slightly slower
than the published specifications for the card, this will ensure that no conflicts occur.

66 6000-2 & -3 User Guide, Rev E
Notes:
1) Some 8-bit cards will not reliably operate in high-speed computers (such as 80386
based machines). Consult the manufacturer of the card regarding this issue.
2) When operating using hardware interrupts and DMA inputs, and the computer is
operating under the control of multi-tasking software, such as “Microsoft Windows”,
you may then have multiple issues that require attention. In these circumstances,
consult with the vendor of the controller card for specific configuration details.
Configuring the Controller Software
With the National Instruments AT-GPIB controller card, and with many other cards,
there is a configured “device driver” installed in the computer. Configure this driver
correctly to ensure reliable operation with the instrument.
This section describes the settings that have been tested with the National Instrument
AT-GPIB driver revision 1.5 accessed with the “ibconf” program supplied with the
controller card, other drivers and revisions may be similar to those shown in Table 1.
Note that these settings may be varied dependent on other instrumentation using the
IEEE488 bus.
The selections shown in Table 2 are only for data transfers regarding the controller
card itself. Thus other settings may be used, but have not been fully tested by
Vitrek.
Table 2. Controller Card Configuration (GPIB0)
Primary Address 0.1 Assert REN when SC no.
Secondary Address NONE.1 Enable Auto Serial
1,2
yes.3
Polling
Timeout Setting T10s.1 Timing 500nS.4
EOS 00H.1 Enable 488.2 Protocols yes.5
Terminate on EOS no.1 CIC protocol no.2
Set EOI with EOS on
no.1 Interrupt Setting 11.6
Write
Type of Compare on
7-bit.
1
Base I/O Address 02C0H.6
EOS
Set EOI w/last byte of
yes. DMA Input 5.6
Write
System Controller yes.2

Interface Operation 67
Notes:
1) These selections assume the use of a single controller. In configurations where a
second controller exists these may be altered, other settings have not been fully tested
by Vitrek.
2) These instruments do not currently use the SRQ and Serial Poll capabilities of the
IEEE488 bus. This setting will be dependent on other instruments, thus does not
affect your 6000 instrument.
3) Timings of longer than this are also valid. The 350nS selection has been tested on
shorter cable lengths by Vitrek. and may be used. However, in normal operation there
is little overall performance gain by using it with these instruments. A shorter time
may be selected, if, other high-speed devices exist in the system.
4) These instruments do not use the IEEE488.2 specifications, thus this setting has no
affect on these instruments if you have otherwise ensured that no IEEE488.2 type
transfers take place with these instruments. If all other devices also do not use the
IEEE488.2 type transfers, then this setting should be set to “NO” to ensure
compatibility.
5) Although these settings have no affect on these instruments, ensure that no
hardware conflicts exist with other installed devices in the computer. The settings
shown above are highly recommended, as the probability of conflict is lowest with
these settings.
Interrogating the Data
With either interface, you may interrogate the various data held by the instrument.
Reading Data
Interrogation is achieved by sending a “DATA READ” command string that defines
the data is to be interrogated, and then by reading that data from the instrument. Up
to 1000 characters may be read from the instrument as a result of sending a DATA
READ command. Refer to Command Set on page 71.
In the RS232 interface, this data is automatically transmitted from the instrument to
the controller, the instrument will then wait for a further DATA READ command
before sending further data.

68 6000-2 & -3 User Guide, Rev E
In the IEEE488 interface, the controller may immediately attempt to read the
requested data, the controller will then be held for a short delay (typically less than
1mS) until the requested data is available, then the requested data will be read by the
controller. This data may be read by the interface any number of times; the data
transmitted will always be the latest available data—unless the instrument is in the
HOLD state.
In either interface, the instrument typically responds by sending a single space
character, followed by a numeric string (with a preceding polarity symbol), followed
by the respective engineering format exponent data in the form “e+3”, and
terminated by the carriage return and line feed characters. Note that with the
IEEE488 interface this last character is sent with the EOI line asserted.
Certain data do not follow this format, these are described in the following
paragraphs. See the READ= command description. You may also request more than
one item of data to be transmitted. In these cases the individual items sent from the
instrument are separated by the comma (,) character.
Sending Data
Both the RS232 and IEEE488 interfaces operate similarly when sending data to the
instrument, the only difference being, the requirement to place the instrument in the
REMOTE state with the IEEE488 interface. ASCII characters transmitted to the
interface are stored in a "buffer" until either a "line feed" character is received, or a
character with the EOI line asserted, or a “Group Execute Trigger” command is
received. The received characters then are decoded and actioned.
Up to 1000 characters may be stored in the “receive buffer”, which may contain
more than one complete command string type if desired. If you send conflicting
commands within the same command string, then the last effective command will be
used.
Separate individual commands within the same strings using the (,) comma or (;)
semi-colon characters. For commands that require several items of data, separate
these data by the (/) forward slash or (:) colon characters. Note that only the colon
character may be used for the READ= command.
The 6000 family of instruments operate on the received ASCII characters, the
command used to send these characters via the designated interface is dependent on
the computer system and peripheral used.

Interface Operation 69
RS232 Interfacing
The RS232 interface is configured to use the RS232 hardware “handshake” lines
RTS and CTS to handshake data. The usage of these hardware "handshake" lines
ensures that data will not be lost due to different speeds in the instrument and the
computer. Sometimes the particular computer used is not able to use these
handshake lines properly.
As an example, some computer systems continue to transmit a few characters after
being “held off” from transmitting. Place delays between sending individual
command strings in these cases to prevent “data overrun.”
IEEE488 Interfacing
There are several differences between the IEEE488 and RS232 interface operation;
these are all due to the extended capabilities of the hardware interface of the
IEEE488 standard.
Bus Timing
Almost all of the timing requirements of the bus interface are handled by the
hardware handshake system used by the IEEE488 interface. During decode of a
command all further received data are “held-off” by this hardware handshake until
the decode has been completed. Typically, data transfer rates of up to 50,000
characters per second are attainable.
Bus Commands
As previously mentioned, the IEEE488 interface can perform tasks that the RS232
does not, such as, using separate remote and local states. In either state, the
instrument may have its present status read by the interface.
Local state—
Following the initial application of power, the instrument will only respond to
commands from the instrument’s front panel while in the local state.
You can release the instrument back to the local state (from remote) by a command,
or by pressing the LOCAL key on the front panel. The light next to the LOCAL key
indicates when the instrument is in the local state.
Remote state—
This state is entered via the IEEE488 interface bus. Normally this is achieved
automatically when the instrument is correctly addressed to “listen” to a command
string. After placing the instrument in the remote state, via the interface command,
the instrument will only respond to commands received via the interface.

70 6000-2 & -3 User Guide, Rev E
Device Clear—
The IEEE488 defined DEVICE CLEAR functions (both selective and global) force
the instrument to perform a power-on reset function.
Interface Clear—
The IEEE488 standard defines this command, which causes the interface portion of
the instrument to be reset to the power on conditions, aborting any bus activity in
progress.
Should a handshake sequence improperly complete during a transfer of data to, or
from, the IEEE488 interface, the instrument will automatically perform a POWER-
ON RESET sequence. This facility prevents the interface from becoming “locked
out” if the interface cable is removed or becomes faulty during a data transfer.
Note: Following a POWER-ON RESET, or a DEVICE CLEAR via the IEEE488
interface, all analog outputs are returned to their respective front panel configured
parameters, inputs, zero offsets and spans.
Application for the Lower Case Portions of Commands
The upper-case portion is the command operator, the lower case portions represent
the optional parameter(s) for the command.
• parameter—
Specifies placement (position) for the required parameter’s descriptor. Refer to
the end of this section for a complete list of the available parameter descriptors
and formats.
• n—
An integer number having the specified range. In cases where more than one
digit is possible, you may optionally place the leading zero characters. This data
may not have a preceding polarity sign character.
• numeric—
A floating point number having the specified units. This data may have an
optional preceding polarity character. The decimal point is optional, and may be
in any desired position. “e” format numbers are also accepted.
• string—
One of the specified possible character strings for the specific command, can be
up to 12 characters in length.

Interface Operation 71
Command Set
The various features of the instrument may be controlled by the controller sending
certain command “strings” to the instrument.
The features include:
• Distribution of “space” and non-printing characters between commands
throughout the command string.
• The ability to use either lower or upper case characters.
• Capability of sending more than one command before sending the termination
character.
• Three ways of terminating commands: by the reception of a line feed; by the
reception of a character with the EOI line asserted; or by the reception of the
“Group Execute Trigger” command.
Interface Commands
The following commands are available with both the RS232 and the IEEE488
interfaces. They allow you to:
• Control another instrument or power supply via this analog level.
• Override an analog output used to drive a plotter or alarm output.
CLRDISPLAY—
This command clears all display lines.
CLRUPTIME—
This command clears the timer which may be used to identify the exact time at
which each input’s parametric data was last established (see the ‘READ=‘
command’s ‘UPTIME[i]’ parameter).
DISP[n]=parameter—
This command specifies that the selected display line (n), a possible 0 through 49,
will display the specified parameter. If the optional (n) portion is not specified, or
specifies a line beyond the last defined line, then the first undefined line is affected.
The = character is optional. See the list at the end of this section for the available
parameter descriptors.
FFT=maxharm/bandwidth/type—
This command configures the FFT based harmonic analysis as defined by
MAXHARM/BANDWIDTH/TYPE. Refer also to the commands FUND and HARMS.

72 6000-2 & -3 User Guide, Rev E
MAXHARM—
This integer defines the highest harmonic number which is to be made available, this
overrides any requests for higher harmonics by individual parameter requests.
Setting this to 0 disables FFT based harmonic analysis for this group.
BANDWIDTH—
This integer defines the ratio between the fundamental frequency and the bandwidth
over which each harmonic is measured. Setting this to 0 disables FFT based
harmonic analysis for this group.
TYPE—
This string may be either NORMAL or WINDOWED.
FILT=n or FILT=numeric—This command sets the input as using a digital filter.
The = character is optional. The available formats are as follows:
• FILT=0—No filtering.
• FILT=numeric—Sets the low pass filter corner frequency to the passed numeric
value, in Hz. A minimum value of 6Hz is allowed, a value in excess of 200kHz
yields a 5mHz filter.
FMEAS=min/max/period/filter—
This command sets the measurement of frequency as being performed over the
frequency range from min to max numeric value frequencies, in Hz, over the period
numeric value, in seconds. This frequency measurement command uses the optional
result filtering of 0=none, 1=fast, 2=medium, 3=slow.
If the specified input is enabled as a synchronization source to establish the
fundamental frequency of one or more input groups,
—Then—
The frequency measurement command sets all input measurements to these values
and sets the minimum expected frequency to the value specified by min. Note that
for down ranging purposes, refer also the RANGETIME command.
FUND=string—This command sets the input as having its fundamental frequency
defined by string. Valid string contents are as follows:
• chlist/inlist/multiplier—the fundamental frequency is established from the
input(s) listed in the string chlist (e.g. ABC), using the input(s) listed in the
string inlist (e.g. VI), using an optional multiplier numeric quantity. The inputs
specified must all be members of the group to which the [i] input belongs, or be
a single nonmember input.
• Numeric—the fundamental frequency is set to the fixed value set by the numeric
value (in Hz).

Interface Operation 73
HARM=string—
This command sets the measuring harmonic signal content as defined by string. See
also the FFT and FUND commands.
Valid string contents:
• OFF—no harmonic analysis is performed within the group. The FFT command
has no affect with this setting.
• SINGLE—a single harmonic analysis is performed within the group during each
amplitude measurement period.
• NORM—harmonic analysis is performed within the group, with multiple
analysis being averaged during the measurement period, as necessary, to
encompass the entire period.
HOLD—
This commands the instrument to enter the HOLD state. All database parameters
are maintained at the values present at the time this command is received. These
parameters may be subsequently released by the RUN command.
MEAS=numeric—
This command specifies the measurement period (in seconds). The numeric portion
may be between 0.001 and 10000.0 inclusive, values outside this range will be set to
the closest allowable value.
RANGETIME=numeric—
This command sets the minimum downrange timing. Set by entering a numeric
value, in seconds. This value is only used if the downrange time is more than 1/2 of
the fundamental frequency’s minimum period (as defined in your instrument).
READ=parameter—
This command determines which parameter(s) the instrument will transmit next to
the controller. For the RS232 interface the requested data will be transmitted
automatically following decode of this command, whereas the IEEE488 will simply
store this request until the instrument is next interrogated by the controller (i.e.
addressed as a talker).
Several parameters (up to a maximum of 30) may be specified to be read
simultaneously, if desired, with a maximum response string length of 1000
characters. Here, each parameter should be separated by the “:” (colon) character.
If READ is commanded, then each data item read will be separated by the “,”
(comma) character in the received data string.

74 6000-2 & -3 User Guide, Rev E
RECALL=n—
This commands the instrument to reset the configuration to that contained in the
specified storage location. The number n should be between 0 and 65535. Note that
this also sets, which saved configuration will be retrieved following a reset of the
instrument.
RESYNC—
These commands allow you to resynchronize parameter readings to accommodate
changes in the input waveforms. This command has no affect if the instrument is
presently in the HOLD state. The overall affect of implementing the RESYNC
command is that any measurement in progress is aborted and a new measurement is
initiated immediately following any settling delay that is imposed by input filtering
requirements.
Note: Attempts to read data from the instrument during the RESYNC will be
unavailable until the next measurement is completed.
RUN—
This command releases a previously received HOLD command. If the instrument is
not presently in the HOLD state then this command has no effect.
SAVE=n/string—
This commands the instrument to save the present configuration in the specified
storage location. The number n can be set between 0 and 65535. Note that this also
sets which saved configuration will be retrieved following a reset of the instrument.
The command may optionally contain a name string, which is used to name the
specified storage location.
@—
This character command is used in the RS232 interface to cause the results of a
previously defined set of parameter data requests (i.e. READ=parameter command)
to be resent with the latest available data.
Available Parameter Strings
The DISP and READ commands accept the string components as defining the data
to be interrogated, where: parameter[source and bandwidth]{sub-definition string}
and special-parameter
parameter—
is a string defining the parameter

Interface Operation 75
source and bandwidth—
Is a series of strings or numeric data defining the source and bandwidth for the
parameter, this string is surrounded by “[ and ]” (square brackets).
sub-definition string—
Is an optional string, enclosed by “{ and }” (curly braces), containing optional
additional operations to be performed on the parameter result. If no further
processing is required, then the surrounding brackets/braces need not be present.
special-parameter—
Is a special parameter definition string defining the special (textual) data to be
retrieved.
Retrieving Parameters
A parameter string contains one of the following strings, which defines the “base”
parameter to be retrieved. For example, the defined string “source and bandwidth”
retrieves the parameter’s source and bandwidth:
The available formats are as follows:
AMPL—
The RMS amplitude (i.e. Volts or Current). This parameter requires a single input
source and either a string bandwidth or a pair of integers defining the harmonic range
for the data. The default units for these results is Vrms or Arms as applicable.
AMPLFR—
The RMS amplitude (i.e. Volts or Current). This parameter requires a single input
source and a pair of numeric frequencies defining the center frequency and halfbandwidth for the data (in Hz). (Note that this data is not available from the front
panel). The default units for these results is Vrms or Arms as applicable.
AVG—
The average rectified amplitude (i.e. Volts or Current). This parameter requires a
single input source. The default units for these results is V or A as applicable.
CORREL—
Power Factor or Correlation (i.e. W/VA). This parameter requires a input or group
of inputs, and either a string bandwidth or a pair of integers defining the harmonic
range for the data. The default units for this result is none.
CF—
Crest Factor (i.e. Peak/RMS Volts or Current). This parameter requires a single
input source and a string bandwidth. The default units for this result is none.

76 6000-2 & -3 User Guide, Rev E
DPF—
Dissipation or Displacement Power Factor (i.e. W/VA at the fundamental frequency
only). This parameter requires a input or group of inputs. The default units for this
result is none.
EPA—
The inverse cosine of Power Factor. This parameter requires an input or group of
inputs, and either a string bandwidth or a pair of integers defining the harmonic
range for the data. The default units for this result is radians.
FF—
Form Factor (i.e. RMS/Average Rectified Voltage or Current). This parameter
requires a single input source. The default unit for this result is “none”.
FREQ—
Frequency. This parameter requires either a single input source, or a single input
source and an optional single integer harmonic number. The default unit for this
result is Hz.
GAIN—
The Gain or ratio between any two signals. This parameter requires a single input
source and single integer harmonic (dividend), and a single reference source and
single integer harmonic (divisor). The default unit for this result is none (i.e. a pure
ratio).
GAINI—
The imaginary portion of GAIN (see above, GAIN = GAINR + j.GAINI). Both inputs
should belong to inputs within the same group for the result to be meaningful. The
default unit for this result is none (i.e. a pure ratio).
GAINR—
The real portion of GAIN (see above, GAIN = GAINR + j.GAINI). Both inputs
should belong to inputs within the same group for the result to be meaningful. The
default unit for this result is none (i.e. a pure ratio).
HIGH—
The highest positive excursion of a signal (Volts or Current). This parameter
requires a single input source. The default unit for these results is Vpk or Apk as
applicable.
HZ—
Frequency (alternative for FREQ above).

Interface Operation 77
IMAG—
The quadrature portion of a signal (Volts or Current). This parameter requires a
single input source and single integer harmonic, and a single reference source and
single integer harmonic. Both inputs should belong to the same group for the result
to be meaningful. The default unit for these results is Vrms or Arms as applicable.
IMP—
The load impedance (i.e. Volts/Current). This parameter requires a input and either
a string bandwidth or a pair of integers defining the harmonic range for the data.
The default unit for this result is ohms.
INPHS—
The In-Phase portion of a signal (Volts or Current). This parameter requires a single
input source and single integer harmonic, and a single reference source and single
integer harmonic. Both inputs should belong to the same group for the result to be
meaningful. The default unit for these results is Vrms or Arms as applicable.
LOW—
The highest negative excursion of a signal (Volts or Current). This parameter
requires a single input source. The default unit for these results is Vpk or Apk as
applicable.
PEAK—
The largest absolute value of HIGH or LOW (see above).
PF—
An alternate for CORREL (see above).
PHASE—
The Phase between two signals. This parameter requires a single input source and
single integer harmonic, and a single reference source and single integer harmonic.
Both inputs should belong to the same group for the result to be meaningful. The
default unit for this result is radians.
PHS—
An alternate for PHASE (see above).
PKPK—
The difference between HIGH and LOW (see above).
PKVA—
The highest recorded absolute value of instantaneous VA. This parameter requires a
single input source. The default unit for this result is VApk.
PK—
An alternate for PEAK (see above).

78 6000-2 & -3 User Guide, Rev E
PWR—
True Power. This parameter requires an input or group of inputs and either a string
bandwidth or a pair of integers defining the harmonic range for the data. The default
units for this result is W.
QUAD—
An alternate for IMAG (see above).
R—
The load resistance (i.e. in-phase Volts/Current, IMP = R + j.X). This parameter
requires a input and either a string bandwidth or a pair of integers defining the
harmonic range for the data. The default unit for this result is ohms.
RATIO—
An alternate for GAIN (see above).
RATIOI—
An alternate for GAINI (see above).
RATIOR—
An alternate for GAINR (see above).
REAL—
An alternate for INPHS (see above).
REA—
The load reactance (i.e. quadrature Volts/Current, IMP = R + j.REA). This
parameter requires a input and either a string bandwidth or a pair of integers defining
the harmonic range for the data. The default unit for this result is ohms.
RECTIFY—
An alternate for AVG (see above).
RES—
An alternate for R (see above).
RMS—
An alternate for AMPL (see above).
SPAMPL—
The signal amplitude measured at the specified spectrum point for the specified
single input. The default unit for these results is Vrms or Arms as applicable.
SPFREQ—
The frequency associated with the specified spectrum point for the specified single
input. The default unit for this result is Hz.

Interface Operation 79
THDF—
The Total Harmonic Distortion of the selected signal (Volts or Current), relative to
its fundamental component. This parameter requires a single input source and a
single integer defining the highest harmonic to include in the summation. The
default unit for this result is none (i.e. a pure ratio).
THDH—
The Total Harmonic Distortion of the selected signal (Volts or Current), relative to
its total harmonic content. This parameter requires a single input source and a single
integer defining the highest harmonic to include in the summations. The default unit
for this result is none (i.e. a pure ratio).
THDT—
The Total Harmonic Distortion of the selected signal (Volts or Current), relative to
its total RMS content. This parameter requires a single input source and a single
integer defining the highest harmonic to include in the summation. The default unit
for this result is none (i.e. a pure ratio).
VAR—
Reactive or Imaginary Power. This parameter requires a input or group of inputs and
either a string bandwidth or a pair of integers defining the harmonic range for the
data. The default unit for this result is VAR.
VA—
Apparent Power. This parameter requires a input or group of inputs and either a
string bandwidth or a pair of integers defining the harmonic range for the data. The
default unit for this result is VA.
WATTS—
An alternate for PWR (see above).
X—
An alternate for REA (see above).
Z—
An alternate for IMP (see above).
Source and Bandwidth Strings
The source and bandwidth strings contain one or more of the following strings
separated by commas:
A—Input A.
B—Input B.

80 6000-2 & -3 User Guide, Rev E
S—Input SYNC
AB—Input pair A and B.
I, IN or INPUT—The total of all inputs defined as measuring input parameters.
O, OUT or OUTPUT—The total of all inputs defined as measuring output
parameters.
DC—The DC component only of a parameter.
AC—The AC component only of a parameter.
ACDC or DCAC—The DC and AC components (i.e. the total) of a parameter.
AC+DC or DC+AC—The DC and AC components (i.e. the total) of a parameter.
Integer—A harmonic in the range 0 through 2047.
Sub-Definition Strings
“Sub-definition strings” are separated by semi-colons. See the following strings:
FILTER=numeric—
Sets that this parameter result is to be filtered with the set numeric time constant (in
seconds).
UNITS=string—
Sets that the resultant units for the parameter are to be those specified by string. See
a later section for available units strings.
NOMINAL=parameter[source and bandwidth]—
Sets that the nominal or reference value of this parameter is the value of the set
parameter with its associated source and bandwidth.
NOMINAL=numeric—
Sets that the nominal or reference value of this parameter is the value of the numeric.
NOMINAL@parameter[source and bandwidth]—
Sets that the nominal or reference value of this parameter is the value of the set
parameter with its associated source and bandwidth, this value being established at
the time that this string is decoded.
DELTA—
Sets that the difference between the parameter and the reference or nominal value is
to be obtained. A nominal string must be present. Use only one of DELTA, RATIO,
DELTAR or LIMIT formats for a single parameter.

Interface Operation 81
RATIO—
Sets that the ratio between the parameter and the reference or nominal value is to be
obtained. A nominal string must be present. However, use only one of DELTA,
RATIO, DELTAR or LIMIT formats for a single parameter.
DELTAR—
Sets that the ratio between the difference between the parameter and the reference or
nominal value, and the nominal value, is to be obtained. A nominal string must be
present. However, use only one of DELTA, RATIO, DELTAR or LIMIT formats for a
single parameter.
LIMIT=numeric—
Sets the maximum allowable deviation from the reference or nominal value. The
string HIGH, PASS or LOW is returned instead of the value of the parameter. Use
only one of DELTA, RATIO, DELTAR or LIMIT formats for a single parameter.
Special Parameter Strings
The special-parameter strings are available as follows:
BLANK (DISP[n]= only)—
Defines a blank ("--") display line.
DELETE (DISP[n]= only)—
Defines that the display line is to be deleted, the ‘gap’ caused by this is ‘closed’ up
by shifting all lower display lines upwards.
DATE—
Defines that the date will be returned, in the format set by the SYSTEM menu entry.
TIMEDATE—
Defines that the time and date will be returned in the formats set by the SYSTEM
menu entry, separated by a single space character.
TIME—
Defines that the time will be returned in the format set by the SYSTEM menu entry.
ACCTIME—
Defines that the number of seconds within the nearest millisecond that the running
accumulation will be returned.
UPTIME[i]—
Defines that the number of seconds within the nearest millisecond, at which the
selected input’s measurement data was last updated will be returned. This data may
be reset to zero at any time using the CLRUPTIME command, which clears all
inputs' timers simultaneously.

82 6000-2 & -3 User Guide, Rev E
ID (READ= only)—
Defines that a string defining the instrument and software revisions are to be
returned. See ID Data Format.
ID Data Format
READ=ID—
Returns data having the following sub-strings, separated by comma characters. 6000:
nn.nn main software revision.
nn.nn inputs A & B supervisor DSP software revision (00.00 if not fitted).
nn.nn inputs A & B amplitude DSP software revision (00.00 if not fitted).
nn.nn analog I/O co-processor software revision (00.00 if not fitted).
00.00 a special string allocated to any customer special software versions.
This enables customer specific instruments to be recognized.
UNITS=String Format
Ensure UNITS=string within a sub-definition string contains one of the following
units definition strings available in the instrument. Not all parameters are
compatible with all units strings, wherever possible the instrument will attempt to
convert the base parameter to the desired final units. Setting a unit does NOT
change the bandwidth of the parameter, nor change the parameter itself. The strings
shown below are case-sensitive.
—a blank string is no units
%—Percentage (ratio)
Aac—AC Amperes
A—Amperes
Aavg—Average, or Mean Rectified
Amperes
Adc—DC Amperes
Aimag—Imaginary Amperes
Apk—Peak Amperes
Apkpk—Peak to Peak Amperes
Areal—Real Amperes
Arms—RMS Amperes
cps—Cycles-Per-Second
dB—decibel (ratio)

Interface Operation 83
dBmW—Power decibels rel. to 1mW level
dBuV—Voltage decibels rel. to 1µV level
dBV—Voltage decibels rel. to a 1V level
dBW—Power decibels rel. to a 1W level
deg360—degrees (0-360° range)
deg—degrees (±180° range)
grad—grads
HP—Horse Power
Hr—Hours
Hz—Hertz
ohm—Ohms
pirad—pi-radians (1 is equiv. to 180°)
rad—radians
rpm—Revolutions-Per-Minute
s—seconds
S—Siemens
V—Volts
VAac—AC Volt-Amperes
Vac—AC Volts
VAdc—DC Volt-Amperes
VApk—Peak Volt-Amperes
VARac—AC Reactive Power
VAR—Reactive Power
Vavg—Average & Mean Rectified Volts
VA—Volt-Amperes
Vdc—DC Volts
Vimag—Imaginary Volts
Vpk—Peak Volts
Vpkpk—Peak to Peak Volts
Vreal—Real Volts
Vrms—RMS Volts
W—Watts
Wac—AC Watts
Wdc—DC Watts

84 6000-2 & -3 User Guide, Rev E
Full-Parameter Definition Format
This section shows some examples of full-format parameter definitions. These may
be used to define individual items to be interrogated via the interface (i.e. in a
READ= command) or to define a display line (i.e. in a DISP[n]= command). In the
case of the READ= command, multiple items may be defined for interrogation at the
same time (up to 30 items) by separating each parameter definition by the: (colon)
character.
AMPL[A]—
Defines AC+DC RMS amplitude on input A.
AMPL[A,DC]—
Defines DC only RMS amplitude on input A.
AMPL[B,1,1]—
Defines fundamental only (harmonic #1) amplitude on input B.
AMPL[F,2,1000]—
Defines RMS amplitude on input F measured over the range of 2nd harmonic thru'
the 1000th harmonic.
AMPLFR[B,20e3,5e3]—
Defines RMS amplitude on input B measured over a range centered on 20kHz with a
±5kHz bandwidth (i.e., 15-25kHz).
RATIO[A,1,B,1]—
Defines the ratio between the fundamental amplitude of input A and the fundamental
amplitude of input B.
THDF[B,49]{UNITS=%}—
Defines THD (relative to fundamental) on input B, measured up to and including the
49th harmonic, expressed in percentage units.
AMPL[A,AC]{NOMINAL=AMPL[B,AC];LIMIT=5.0;FILTER=2.00}—
Defines a pass/fail check of the AC amplitude of input A, compared continuously
against the AC amplitude of input B, allowing up to 5V difference before failing, and
using a 2 second single order filter.
RATIO[B,3,B,1]{NOMINAL=0.0;LIMIT=0.2}—
Defines a check of the ratio between 3rd harmonic and fundamental amplitude of
input B, with a maximum limit of 20%.

Interface Operation 85
High Speed Operation
The 6000 instrument family has the capacity to operate at over 100 readings per
second when correctly configured. This section covers some useful information
concerning achieving the highest possible speed from these instruments.
Measurement Periods
The highest possible reading rates are obtained when only those inputs, which are
required to be high speed are configured with short measurement periods. Inputs that
are not required can be turned off, or set to an amplitude measurement period in
excess of 0.25 seconds. See the MEAS command for details.
Frequency Measurement
Inputs which are not configured for use for fundamental frequency determination
should have their frequency measurement turned off. There is a significant speed
improvement when the fundamental frequency range covers a range of less than 2:1.
If harmonic measurements are not needed, or the fundamental frequency is well
known (to with 1%, e.g. line voltage), then the use of a fixed frequency fundamental
will achieve significant results. See the FMEAS and FUND commands for details.
Harmonic Measurement
Only enable a harmonic measurement in groups of inputs for which it is required.
The maximum range of harmonics should be limited and the fundamental:
bandwidth ratio kept to the default values, if possible. If high frequencies are to be
measured, then a significant improvement in speed can be realized by only allowing
a single analysis per measurement period. See the HARM command for further
details.
Interrogating Results
Read as many parameters at the same time as possible. This saves time in reducing
the transmission of new READ= commands, and their decode in the instrument.
The amount displayed on the front panel should be reduced to as little as possible
(less than four lines if possible) and any display line filters should be eliminated as
these are continuously updated whether displayed or not.

86 6000-2 & -3 User Guide, Rev E

Maintenance & Calibration 87
Maintenance & Calibration
This chapter discusses the procedures you can use to ensure your instrument remains
optimally functional. They include routine maintenance and calibration.
Daily Maintenance
For optimum DC offset performance, perform an Input Calibration sequence at daily
intervals, or following 5°C + temperature changes. Perform an Internal Calibration
for optimum phase performance.
The following daily procedure is highly recommended to ensure that the highest
quality of measured results is obtained.
Low Level DC Measurements
In all cases, if the operation of the instrument is suspect, the operating temperature of
the instrument has significantly changed, or the instrument has not been in use for
longer than 30 days, then perform this procedure.
Procedure without Equipment
This procedure requires no external equipment and no external connections. Note
that external connections present need not be removed during the procedure.
1. Ensure that the instrument has been operating for at least 30 minutes.
2. Press the Cal key.
3. Press the DISPLAY SELECT 1 key (next to the System Status display line).
a) Take careful note of the scrolled display messages.
b) If any input(s) are shown as inactive or faulty then the instrument requires
repair, corrective action is required.

88 6000-2 & -3 User Guide, Rev E
c) If any of the DSP COMM RETRIES percentages are in excess of 10% then
this indicates that either the environment in exceptionally noisy, or that the
instrument contains a fault which is currently being overcome due to internal
redundancy. Note that small percentages of less than 0.1% are normal and
should not be cause for concern.
d) Take note of the numbers displayed during the LAST INT INP EXT CAL
status display. If any of the INP or EXT column displays numbers in excess
of the recommended calibration interval in use by your facility, then the
instrument is overdue for calibration against certified standards. Note that
Vitrek recommends 1 year, or 365 days
If any of these numbers show “?” or “req”, it indicates the instrument has
“lost” some of its calibration data, and calibration against certified standards
is definitely required.
4. When the System Status messages have completed (typically 10 seconds),
press the Cal key.
5. Press the DISPLAY SELECT 2 key (next to the Internal Calibration display
line).
a) The instrument will automatically perform an internal test and calibration of
its analog and digital circuitry. If any error messages come up during this
procedure, then this indicates that an internal fault has been discovered, and
corrective action is required.
b) When the Internal Calibration procedure has been successfully completed
(30 to 60 seconds typically), press the ENTER key. This returns the
instrument to normal operation.
6. This concludes the recommended daily maintenance procedure.
Procedure with Equipment
This procedure requires the use of either shorting plugs or 50Ω terminators on all
voltage inputs of the 6000 instrument. All external input wiring should be removed
during this procedure.
1. Operate the instrument for at least 30 minutes before performing. Verify time.
2. Press the Cal key.
3. Press the DISPLAY SELECT 1 key (next to the System Status display line).
Take careful note of the scrolled display messages.
a) If any input(s) are shown as inactive or faulty then the instrument requires
repair, corrective action is required.
b) If any of the DSP COMM RETRIES percentages are in excess of 10% then
this either indicates the environment in exceptionally noisy,

Maintenance & Calibration 89
—Or—
Indicates the instrument contains a fault that is currently being overcome due
to internal redundancy. Note that small percentages of less than 0.1% are
normal and are not cause for concern.
c) Note the numbers displayed during the LAST INT INP EXT CAL status
display.
—If—any of the EXT column displays numbers in excess of the
recommended calibration interval in use by your facility, then your 6000
instrument is overdue for calibration against certified standards. Note that
Vitrek recommends 1 year, or 365 days.
—If—any of these numbers show ? or req, then this indicates that the
instrument has “lost” some of its calibration data, and calibration against
certified standards is definitely required.
4. When the System Status messages have completed (10 seconds typically),
press the CAL key.
5. Ensure that shorting plugs or 50Ω terminators are fitted on all voltage inputs and
check that all other external input wiring has been removed.
6. Press the DISPLAY SELECT 3 key (next to the Input Calibration display line).
a) The instrument automatically:
Performs an internal test and calibration of its analog and digital circuitry,
Checks and calibrates any DC offsets present in its input circuitry.
b) If any error messages are displayed during this procedure, then this indicates
that an internal fault has been discovered, and corrective action is required.
7. When the Input Calibration procedure has been successfully completed (45 to
90 seconds), press the ENTER key. This returns the instrument to normal
operation.
8. This concludes the recommended daily maintenance procedures.
External Calibration
Externally calibrate the 6000 family of instruments against certified standards at
yearly intervals. Note that this procedure calibrates the voltmeters for certifiable
amplitude accuracy only. The frequency response characteristics, phase accuracy and
other performance aspects of the 6000-2 and -3 voltmeters are intrinsic to their
design, and are not adjustable. However, you can check these aspects as a
maintenance routine following calibration to verify correct operation.

90 6000-2 & -3 User Guide, Rev E
Preparation for Calibration
Prior to performing the external calibration procedure, perform the following
actions:
1. Continuously power the 6000 instrument in the calibration environment for at
least 1 hour before attempting calibration.
2. Ensure that all input connectors and cable connectors are clean and free of
corrosion.
3. Ensure that the instrument has been set for the correct date and time.
a) Press the SETUP key.
b) Press the DISPLAY SELECT key next to the Set Time and Date line. It may
be necessary to press the ê key once or twice to display this line
c) If the displayed date and time does not require changing, then press the
CLEAR key at this time, and disregard the remainder of this sub-procedure.
d) Set the displayed time format to 24hr format (press the DISPLAY SELECT 1
key to change the format).
e) If the displayed time requires changing: press the DISPLAY SELECT 3 key,
enter the correct time using the numeric keys (in 24hr format, hh:mm:ss) and
then press the ENTER key.
f) If the displayed date requires changing: press the DISPLAY SELECT 4 key,
enter the correct date using the numeric keys (in the format displayed in the
second line of the display) and then press the ENTER key.
g) Return the displayed time format to that previously selected.
h) Press the ENTER key.
4. Perform an Input Calibration of the instrument with all voltage inputs either
shorted or with 50Ω terminations fitted. If any input fails this procedure then
make all corrective actions prior to performing an external calibration.
a) Press the CAL key.
b) Ensure that all voltage inputs are either shorted or have 50Ω terminators
fitted.
c) Press the DISPLAY SELECT 3 key (next to the Input Calibration line of the
display).
d) The instrument automatically performs the procedure and will display an
error message should any input fail. If any input does fail this procedure then
perform corrective action prior to performing an external calibration.
e) When the procedure is completed, as indicated in the display of the 6000
instrument, press any of the DISPLAY SELECT keys.

Maintenance & Calibration 91
Required Equipment
Vitrek recommends the use of a Fluke 5700A+5725A with wide band option as the
calibration standard for external calibration of the 6000 instrument. This equipment
should have its wideband output (50Ω) previously calibrated at the desired frequency
and output levels into a known 50Ω load, if its stated accuracy is insufficient.
Other equipment may be used with the following output levels required at the desired
frequency of calibration. For the required accuracy at each level, see the
specifications section of this manual.
700V, 200V, 65V, 20V, 6V, 2.5V, 750mV, 200mV, 70mV, 20mV and 6mV
2.5V, 750mV, 200mV, 70mV, 20mV and 6mV at 50Ω
750mA, 250mA, 75mA, 25mA, 7.5mA, 2mA and 600µA
Calibration Procedure
The instrument prompts the steps to this external calibration procedure. Before
initiating an external calibration procedure, decide upon a prefer calibration
frequency for the instrument. Choose the frequency most commonly used in the
range 10Hz to 1kHz. Frequencies up to 10kHz may be used with some resultant
degradation in the low frequency performance of the instrument. Note that Vitrek
calibrates the 6000 family of instruments at a frequency of 400Hz, unless
otherwise instructed.
Warning: HIGH VOLTAGES MAY BE PRESENT. When moving the input
connection to a different input connector, ensure that the output voltage has been
fully removed before touching the outer shell of the BNC connector.
Ø To perform an external calibration:
1. Press the CAL key.
2. Press the DISPLAY SELECT 4 key (next to the display line showing External
Calibration).
3. Repeat steps 4 through 9 for each input level prompted in the uppermost display
line. Take careful note of the following points:
• Most output levels are repeated for different groups of inputs (inputs B and
Sync).
• You may need to reset the calibration source’s output frequency to maintain
the desired frequency in each step.

92 6000-2 & -3 User Guide, Rev E
• Ensure that the correct input connector is used for each step, all voltage
calibration steps use the respective V BNC connector, while all current
calibration steps use the respective A BNC connector.
• Although multiple inputs are allowed, calibrate only one input at a time.
NEVER connect any inputs in parallel for other than normal voltage
calibration points.
• Particularly when performing the 50Ω voltage input steps, ensure that the
BNC input connector is properly seated, is clean and is clear of corrosion, at
both the instrument and the source ends of the cable.
• The GUARD terminals of the instrument are automatically set for external
connection during this procedure; these should be tied to the GUARD or
other suitable terminal on the source during the entire procedure.
• This procedure includes calibrations with high accuracy at low voltage
levels. Ensure that there are no significant noise sources nearby with
frequencies close to the calibration frequency.
• During the procedure, the input range of the instrument is held at that
required for the calibration level. When changing input connections, or
stepping the instrument to the next calibration step, the Overload light may
illuminate momentarily, this should be disregarded. If Overload remains
illuminated during the calibration step, then investigate a cause. The
instrument’s internal protection systems are enabled at all times, thus no
damage to the instrument will result unless the specified overload abilities of
the instrument are exceeded.
4. Repeat steps 5 through 8 for each input listed in the display (the Sync input is
denoted by the letter S).
5. Ensuring that the calibration source is in Standby, or otherwise has its output
disabled, attach the calibration source’s output terminals to the input of input
terminals when Input Applied? shows in the display.
6. Set the calibration source’s output level to that displayed in the uppermost line
of the display and allow time for the source to settle to within the required
accuracy.
7. For the input being calibrated, press the DISPLAY SELECT key next to the line for
that input. The 6000 instrument will now display the actually measured input
level and the percentage deviation of the instrument at that level.
8. After allowing the displayed values to settle, a few seconds, press the DISPLAY
SELECT key next to the line for that input. That display line will then change to
Completed. If the calibration results with an out of tolerance condition within
the instrument, then an error message will be issued and that input will not be
available for external calibration for the remainder of the procedure.

Maintenance & Calibration 93
9 Press the DISPLAY SELECT 1 key to step to the next calibration step. When the
uppermost display line indicates Ext. Cal. Completed, this external calibration
procedure is completed.
10. When the procedure is complete, then the uppermost display line indicates Ext.
Cal. Completed. You may select to store the calibration data collected by
pressing any of the DISPLAY SELECT keys or the ENTER key. If any input failed
calibration, then its calibration data will not be updated by this action. To abort
the calibration without storing any data collected, then press the CLEAR key at
any time during the procedure.
Performing a Partial Calibration
In certain conditions, it may be desired to only partially perform a calibration
procedure. This is achieved by following the same procedure outlined above, but
skipping any input or output level by either not pressing the respective input’s
DISPLAY SELECT key or by pressing the DISPLAY SELECT 1 key immediately during
each step.
Performing a Calibration Check Only
The standard external calibration procedure shown above may also be used for a
calibration check only.
Ø To perform a calibration check:
1, Note the percentage deviations displayed
2. When all steps have been completed press the CLEAR key, to discard the
calibration data collected.

94 6000-2 & -3 User Guide, Rev E

Appendix A 95
Appendix A: AIO Option
The AIO Option is an Analog Output, providing 12 analog interface outputs driven
from a single, multiplexed, 16-bit digital-to-analog converter. This sub-system is
controlled by a single Motorola DSP56001 24-bit processor, which is interfaced to
the central processor via an internal high speed RS485 data link. Refer to Figure 8,
Rear Panel Partial View.
The Analog Output and the Digital I/O connectors supports the AIO option when
fitted. You can request this option to be fitted with your Phase Angle Voltmeter.
AIO Option Features
This option’s key features include:
• Each analog output is individually setable for ±5V or ±5mA output span with
0.05% basic accuracy.
• Each analog output may be set to output any parameter or parametric deviation,
with user defined offset, span, and filtering.
AIO Option Commands
Analog Command Analog Command Action
ANALOG[n]=DEFAULT
ANALOG[n]=parameter
ANALOG[n]=range/zero/span
To return the analog output (n) to the
parameter’s zero offset and span as specified via
the front panel control, using command string.
To set the output level to one determined from
the value of the passed parameter.
To configure the analog output (n) to the
indicated range of 5V, 10V, or 5mA, and the
numeric value for the parameter’s zero offset
and span.

96 6000-2 & -3 User Guide, Rev E
ANALOG[n]=numeric
To force the analog output (n), a possible 0 to
11, to the specified output level, 1.0 to + 1.0,
which yields an output level between fullscale
and + fullscale.
Upper-case portions = command operator / lower case portions = optional
parameter(s).

Appendix B 97
Appendix B: Specifications
Unless otherwise indicated, all accuracy specifications given in this chapter are valid
throughout the specified operating temperature range, for a period of 1 year,
following a 30 minute warm-up period, and are relative to routinely performed
Calibration Standards. Throughout this section, F = frequency, FC = Filter corner
frequency, or 500kHz (whichever is lower). Accuracy specifications are valid for
frequencies < FC /2.5.
Voltage Input
Ranges: 700V, 200V, 65V, 20V, 6V, 2.5V, 750mV, 200mV, 70mV, 20mV
and 6mV RMS, autoranging or fixed
[2.5V maximum when V(50) mode selected].
Frequency Range: 0.0005Hz to 200kHz.
Amplitude Accuracy: DC: 0.05% of input + 0.1% of range + 50µV.
AC: (0.05 + 2F/FC)% of input + 0.03% of range + 20µV
Option HA (AC): (0.035 + 2F/FC)% of input + 0.015% of range + 20µV
Unfiltered (AC): Add 0.05% of range + 300µV.
Minimum Input: Filtered: 1% of range + 60µV.
Unfiltered: 10% of range + 600µV.
Max. Measurable Peak: >1.5 times range
[i.e., Crest Factors up to 150 (filtered) or 15 (unfiltered)].
Protection: 2000V peak (10V peak when V(50) mode selected).
Input Impedance: 600KΩ||5pF from each voltage terminal to guard terminal. 50Ω ±
0.05% between input terminals when V(50) mode selected.
Voltage Lo (BNC outer shell) connected to Guard via 100Ω when
Internal Guard selected.
Isolation: 1000MΩ||200pF to chassis ground, 2000V peak max., <2500V/µS.
DC Withstand: 400V DC maximum when V(ac) mode selected.

98 6000-2 & -3 User Guide, Rev E
Input Time Constant: 300mS ± 2% when V(ac) mode selected.
Overall CMRR: >160dB at F<100Hz: 20dB/decade.
CMRR (Input:Guard): >80dB at F<1kHz: 20dB/decade.
Current Input
Ranges: 750mA, 250mA, 75mA, 25mA, 7.5mA, 2mA, 0.6mArms,
Frequency Range: 0.0005Hz to 200kHz.
Amplitude Accuracy: DC: 0.05% of input + 0.1% of range + 5µA.
Option HA (AC): (0.035 + 2F/FC)% of input + 0.015% of range + 2µA.
Unfiltered (AC): Add 0.05% of range + 30µA.
Minimum Input: Filtered: 1% of range + 6µA.
Max. Measurable Peak: >1.5 times range.
Protection: Protected up to 5A peak (2.5Arms) on any range.
autoranging or fixed.
AC: (0.05 + 2F/FC)% of input + 0.03% of range + 2µA.
Unfiltered: 10% of range + 60µA.
Burden: <3.5Ω (below 75mA range), <0.2Ω (75mA range and above).
Isolation: 1000MΩ||200pF to chassis ground, 2000V peak max., <2500V/µS.
CMRR: 75mA range and higher: <1µA/Volt @ F≤100Hz,
Input Filtering
Low Pass Filters: None or any 3dB corner frequency between 4.88Hz and 240kHz.
Attenuation: >40dB at twice FC.
Phase
Frequency Range: 0.0005Hz to 150kHz.
A:B, C:D or E:S: Standard: (0.04 + 3F/ FC) times harmonic number.
Any other input pair: Standard: (0.1 + 3F/ FC + 3F/ 500kHz) times harmonic number.
+ 20dB/decade.
Below 75mA range: <50nA/Volt @ F≤100Hz,
+ 20dB/decade.
Option HA: (0.02 + 2F/ FC) times harmonic number.
Option HA: (0.05 + 2F/ FC + 2F/ 500kHz) times harmonic number.

Appendix B 99
Mode Effect: Add (0.04 + 5F/FC)° for voltage: current phase.
Ranging Effect: Add (0.02 + 3F/FC)° per range difference between inputs.
Fundamental Frequency Measurement
Accuracy: 0.01% + (0.03% divided by measurement period in seconds).
Min. Fundamental: 5% of range.
Frequency Range: 0.0005Hz to 200kHz.
Technique: Period measurement of filtered signal using a “tracking” bandpass
filter having a bandwidth of 0.8 to 1.2 times the measured
fundamental frequency.
Harmonic Rejection: Detects fundamental component having an amplitude down to 30%
of total signal.
Measurement Filter: Optional “moving average” filtering may be applied.
Response Time: <1.5 measurement periods.
Harmonic Analysis
Normal Analysis: User definable window period between 1 and 512 fundamental
cycle periods, using rectangular window with no overlap and with
no gaps for fundamental frequencies <100Hz. Automatically sized
(256 to 4096 point) Fast Fourier Transform with average sampling
frequency maintained within 10ppm of relevant ratio from the
fundamental frequency.
Windowed Analysis: User definable window period between 8 and 512 fundamental
cycle periods, using a modified Blackman-Harris window with no
overlap and with no gaps for fundamental frequencies <100Hz.
Automatically sized (256 to 4096 point) Fast Fourier Transform
with sampling frequency maintained within 10ppm of relevant ratio
from the fundamental frequency.
Frequency Range: 0.0005Hz to 150kHz, up to 2047th harmonic.
Abs. Single Harmonic: (0.05 + 2F/FC)% of reading + 0.01% of range + (2F/FC)% of total
signal. F is the frequency of the harmonic.
Abs. Harmonic Range: (0.05 + 2F/FC) % of reading + (0.01% of range + (2F/FC) % of total
signal). √ (number harmonics). F is the frequency of the
fundamental.
THD Accuracy: (0.01 + 2F/FC) %. (range / total signal level) .√ (number
harmonics). F is the frequency of the fundamental.

100 6000-2 & -3 User Guide, Rev E
Peak Parameters
Min. Impulse Width: Repetitive: 500nS, >100 impulses / measurement.
Accuracy: As relevant input accuracy specifications at the frequency of the
Date and Time
Accuracy: 0.005%
General
Power: 105 to 130V or 210 to 260V (auto-selected) RMS AC 50/60Hz @
Size: 17" wide by 7" high by 14" deep.
Weight: 20lbs. in use, 30lbs. (13.5kg) shipping.
Operating Range: 0°C to 50°C, less than 85% RH @ 40°C (non-condensing).
Single: 4µS
impulse (use 1/impulse period if unknown). Valid for impulse
frequency < FC.
125VA.
Storage Range: -30°C to +65°C, less than 95% RH @ 40°C (non-condensing).
 Loading...