


USER GUIDE
2801/2802
Advanced
Single and
Dual-Channel
Power Analyzers

2 2801/2802 Power Analyzer User Guide

Warranty
Warranty 3
The Vitrek instrument is warranted against defects in material and workmanship
for a period of two years after the date of purchase. Vitrek agrees to repair or
replace any assembly or component (except batteries) found to be defective,
under normal use, during the warranty period. Vitrek’s obligation under this
warranty is limited solely to repairing any such instrument, which in Vitrek’s
sole opinion proves to be defective within the scope of the warranty, when
returned to the factory or to an authorized service center. Transportation to the
factory or service center is to be prepaid by the purchaser. Shipment should not
be made without prior authorization by Vitrek.
The warranty does not apply to any products repaired or altered by persons not
authorized by Vitrek, or not in accordance with instructions provided by Vitrek.
If the instrument is defective as a result of misuse, improper repair, or abnormal
conditions or operations, repairs will be billed at cost.
Vitrek assumes no responsibility for its product being used in a hazardous or
dangerous manner, either alone or in conjunction with other equipment. Special
disclaimers apply to this instrument. Vitrek assumes no liability for secondary
charges or consequential damages, and, in any event, Vitrek' liability for breach
of warranty under any contract or otherwise, shall not exceed the original
purchase price of the specific instrument shipped and against which a claim is
made.
Any recommendations made by Vitrek or its Representatives, for use of its
products are based upon tests believed to be reliable, but Vitrek makes no
warranties of the results to be obtained. This warranty is in lieu of all other
warranties, expressed or implied, and no representative or person is authorized
to represent or assume for Vitrek any liability in connection with the sale of
Vitrek products other than set forth herein.
Instrument Serial Number: __________________________________

4 2801/2802 Power Analyzer User Guide
Document Part Number: MO-2801/2802-M Revision A
Print date: June 28, 2007
Copyright
Copyright© 2007 Vitrek All rights reserved.
All rights reserved. No part of this publication may be reproduced,
transmitted, transcribed, stored in a retrieval system, or translated into any
language in any form without prior written consent from Vitrek. This product
manual is copyrighted and contains proprietary information, which is subject
to change without notice. The product's displays and manual text may be
used or copied only in accordance with the terms of the license agreement.
XiTRON is a trademark of Vitrek. All other trademarks or registered
trademarks are acknowledged as the exclusive property of their respective
owners.
In the interest of continued product development, Vitrek reserves the right to
make changes in this guide and the product it describes at any time, without
notice or obligation.
Vitrek
Manufacturers of Engineering & Production Test Equipment
12169 Kirkham Road
Poway, California 9206 USA
Telephone: (858) 689-2755
Fax: (858) 689-2760
E-mail: info@vitrek.com

Contents
Contents 5
INTRODUCTION ____________________________________________________ 15
Scope _________________________________________________________ 15
Features _______________________________________________________ 16
FUNCTIONAL DESCRIPTION _________________________________________ 17
Theory of Operation ______________________________________________ 17
Analog Channel Board ________________________________________ 18
Interfaces ______________________________________________________ 23
Front Panel _________________________________________________ 23
IEEE488 ___________________________________________________ 23
USB Device_________________________________________________ 23
USB Host __________________________________________________ 24
RS-232 ____________________________________________________ 24
Digital I/O __________________________________________________ 24
Ethernet____________________________________________________ 24
USING THE POWER ANALYZER ______________________________________ 25
Setting Up______________________________________________________ 25
Using the Front Panel Interface _____________________________________ 26
Grounding of the Analyzer _________________________________________ 29
Rear Panel Connections - 2801 and 2802 _____________________________ 31
Power Requirements _________________________________________ 31
2801 Rear Panel Connections ______________________________________ 32
Single-Channel Measurements of a Power Source: Connection Method 1 34
Single-Channel Measurements of a Power Source: Connection Method 2 35
Single-Channel Measurements of a Load: Connection Method 1 _______ 36
Single-Channel Measurements of a Load: Connection Method 2 _______ 37
Measurements of a Power Source:Connection Method 1 – Ext CT ______ 38

6 2801/2802 Power Analyzer User Guide
2802 Rear Panel Connections ______________________________________ 39
Measurements of a Power Source: Connection Method 1 _____________ 39
Measurements of a Power Source: Connection Method 1 _____________ 40
Measurements of a Power Source: Connection Method 2 _____________ 41
Measurements of a Load: Connection Method 1 ____________________ 42
Measurements of a Load: Connection Method 2 ____________________ 43
Measurements of a Power Source and Load: Method 1, Two Ind. Chnls _44
Measurement: 3P-3W 2 Meter Connection, Method 1 ________________ 45
Measurements of a Power Source: Connection Method 1 – Ext CT _____ 47
Using an External Current Transducer________________________________ 48
Starting the Analyzer _____________________________________________ 50
Configuring the Power Analyzer 2801/2802____________________________ 51
Getting Started ______________________________________________ 52
Channel Configuration (2802 Only) ______________________________ 53
Configuring the Analyzer Measurement Results ________________________ 54
Setting Up the Measurement Configuration ________________________ 56
Setting Up the Ch2 Measurement Configuration (2802 Only) __________ 71
Setup System ___________________________________________________ 71
Configuration Storage ____________________________________________ 74
Perform DC Zero ________________________________________________ 75
Diagnostics_____________________________________________________ 75
About _________________________________________________________ 77
Default Settings _________________________________________________ 78
Using the Line Switch and Inrush Capabilities __________________________ 79
DISPLAY SCREENS _________________________________________________ 82
Viewing Measurement Results______________________________________ 82
Numeric Display Screens ______________________________________ 82
Chart Displays __________________________________________________ 88
Starting Startup and Inrush Charts___________________________________ 88
Line Switch Disabled and Inrush Detection Disabled _________________ 88
Line Switch Disabled and Inrush Detection Enabled _________________ 88
Line Switch Enabled and Inrush Detection Disabled _________________ 88
Line Switch Enabled and Inrush Detection Enabled __________________ 89
Chart Formats _______________________________________________ 89

Introduction 7
PRINTING RESULTS ________________________________________________ 99
Sample Printouts ________________________________________________ 99
SENDING COMMANDS AND INTERROGATIVES ________________________ 108
Operating using Multiple Interfaces _________________________________ 108
Interrogatives __________________________________________________ 108
USB______________________________________________________ 109
RS232 ____________________________________________________ 109
IEEE488 __________________________________________________ 109
Remote / Local Operation ________________________________________ 109
Resetting the Instrument _________________________________________ 110
Initializing an Interface ___________________________________________ 110
Identifying the Instrument _________________________________________ 110
Querying the Date or Time________________________________________ 110
Setting the Date or Time _________________________________________ 111
Setting the Interface & Front Panel Language _________________________ 111
Storing and Recalling Configurations ________________________________ 111
IEEE488 Status Byte Commands __________________________________ 112
Commands which affect the measurement process ____________________ 112
Commanding and Controlling a DC Zero _____________________________ 115
Controlling the Line Switch________________________________________ 115
Controlling the Display Backlight & Contrast __________________________ 115
Configuring Measurements _______________________________________ 116
APPLICATION – Application___________________________________ 116
RESULTAVG – Result Averaging Period _________________________ 117
MSRTYPE – Measurement Type _______________________________ 117
FILTERTYPE – HF Cutoff Filter ________________________________ 118
FILTERFREQ – HF Filter Cutoff Frequency _______________________ 118
CURRENTSYNC – Use current synchronization ___________________ 118
MINFUND – Minimum Fundamental Frequency____________________ 118
MAXFUND – Maximum Fundamental Frequency___________________ 119
MAXHARMS – Maximum Number of Measured Harmonics __________ 119
GENDNRANGEDLY – User Set Minimum Downrange Delay _________ 119
MSRDCRIPPLE – DC Ripple Measurement Method ________________ 119
RIPPLEFREQ – DC Ripple Base Frequency ______________________ 120

8 2801/2802 Power Analyzer User Guide
DCDNRANGEDLY – User Set Minimum Downrange Delay __________ 120
VRANGE – Select a Voltage Input Range ________________________ 120
AINPUT – Select the Current Input Mode_________________________ 120
ARANGE – Select a Current Input Range (Shunt Input Only) _________ 121
TRANGE – Select a Current Input Range (Transducer Input Only) _____ 121
STRICTRANGING – Forces the App. of the Requested Fixed Range___ 121
SHUNTRATIO1 and SHUNTRATIO2 – Sets A input CT Ratio ________ 122
TRANSRATIO1 and TRANSRATIO2 –sets T input CT Ratio__________ 122
MSRSOURCE – Sets Whether the Pwr Source / Load is to be Meas.___ 123
WIRINGCOMP – Enables Wiring Impedance Compensations_________ 123
WIRINGLOSS – Sets the Wiring Loss Impedance Value _____________ 123
WIRINGLOSSN – Neutral Wiring Loss (2802 only) _________________ 123
WIRINGLOSSG – Ground Wiring Loss (2802 only) _________________ 123
VBURDENCOMP – Enables Voltage Burden Compensation _________ 124
REVERSEV – Enables Reversal of Voltage Measurement Polarities ___ 124
REVERSEA – Enables Reversal of Current Measurement Polarities ___ 124
LINECONTROL – Configures the Line Switch _____________________ 124
LINEPHASE – Internal Line Switch Turn On Phase_________________ 124
INRUSHARNG – Sets the A input Inrush Range ___________________ 125
INRUSHTRNG – Sets the T input Inrush Range ___________________ 125
FILTEREDINRUSH –Filtered or Unfilt. Signal is Captured During Inrush 125
WAVETRIG – Sets the Method of Triggering Waveform Capture ______ 125
TRIGVOLTS – Sets the Voltage for Waveform Capture Triggering _____ 126
TRIGAMPS – Sets the Current for Waveform Capture Triggering ______ 126
READ and UPDATE commands ___________________________________ 127
Normal Results –____________________________________________ 129
Highest Measurement During an Inrush & Startup __________________ 138
Integrated Results (scaling in unit.Hours) _________________________ 139
Integrated Average Results ___________________________________ 139
Measurement Extents during Integration _________________________ 140
Charge & Discharge data (scaled in unit.Hours) ___________________ 143
Special Data _______________________________________________ 143
APPENDIX A - PHYSICAL SPECIFICATIONS____________________________ 146
General_______________________________________________________ 146
Environment _______________________________________________ 146

Introduction 9
Altitude Equivalent __________________________________________ 146
Warm Up __________________________________________________ 146
Accuracy __________________________________________________ 146
APPENDIX B - MEASUREMENT SPECIFICATIONS_______________________ 148
Autorange _________________________________________________ 148
Ranging___________________________________________________ 148
Input Filtering ______________________________________________ 148
Low Frequencies____________________________________________ 148
Measurement Rate Frequency _________________________________ 148
Non-Harmonics _____________________________________________ 149
Harmonics _________________________________________________ 149
DC Input Offset Compensation _________________________________ 149
Frequency Measurements ____________________________________ 149
Harmonic Analysis __________________________________________ 149
Result Averaging____________________________________________ 150
Input Sampling _____________________________________________ 150
Integration _________________________________________________ 150
History Charts ______________________________________________ 150
Startup Charts ______________________________________________ 151
Waveform Data _____________________________________________ 151
Captured Waveforms ________________________________________ 151
Inrush Waveforms___________________________________________ 151
Line Switch ________________________________________________ 151
APPENDIX C-INPUT & TARGET SPECIFICATIONS_______________________ 154
Voltage Input Specifications _______________________________________ 154
Transducer (15V) Input Specifications ___________________________ 157
Power Factor Specifications ___________________________________ 158

10 2801/2802 Power Analyzer User Guide

Introduction 11
Figures
Figure 1. Overall Block Diagram ____________________________________ 17
Figure 2. Voltage Input Attenuator Block Diagram_______________________ 19
Figure 3. Transducer Input Attenuator Block Diagram____________________ 20
Figure 4. Current and Line Switch Block Diagram _______________________ 21
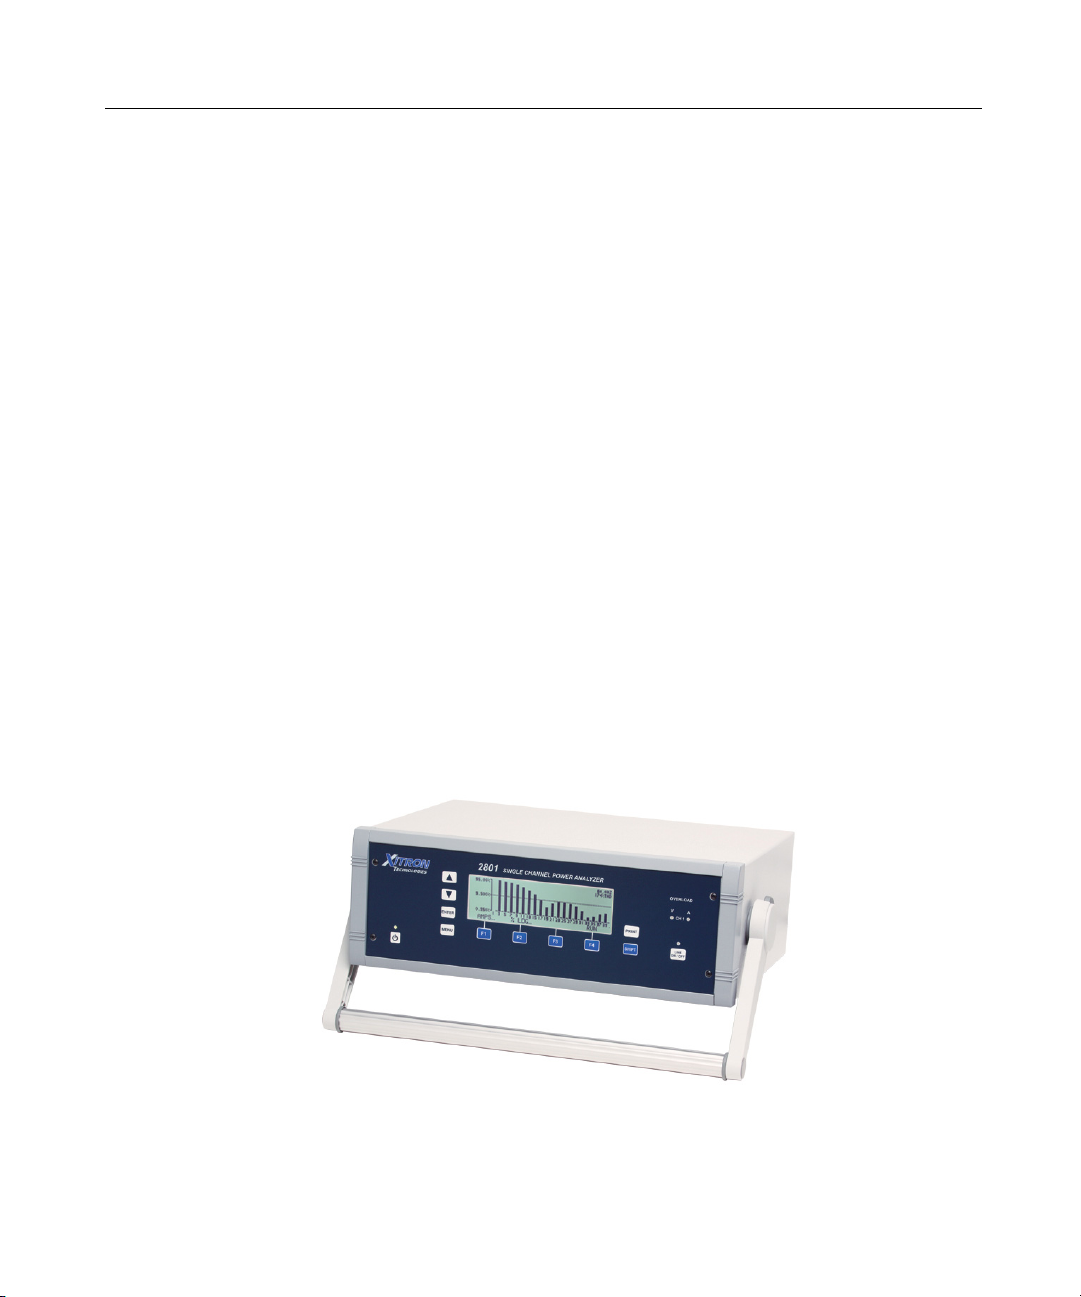
Figure 5. Benchtop Version of 2801 Power Analyzer ____________________ 25
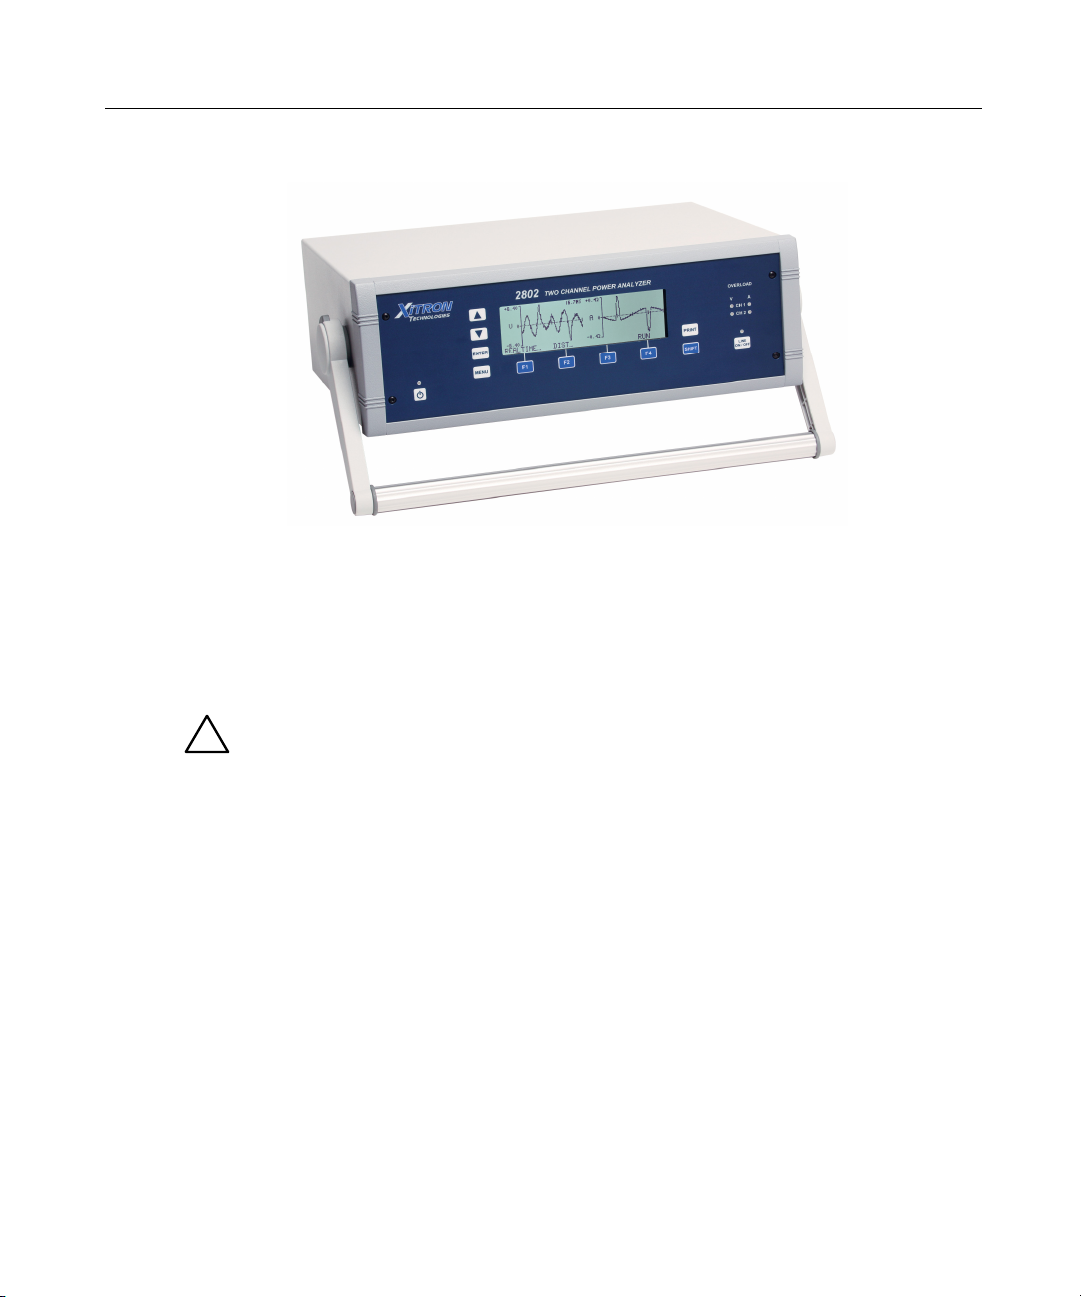
Figure 6. Benchtop Version of 2802 Power Analyzer ____________________ 26
Figure 7. 2801 Front Panel Interface Detail ____________________________ 27
Figure 8. 2802 Front Panel Interface Detail ____________________________ 27
Figure 9. Sample Display __________________________________________ 27
Figure 10. Rear Connection Panel ___________________________________ 33
Figure 11. Measuring a Power Source, Method 1 _______________________ 34
Figure 12. Measuring a Power Source, Method 2 _______________________ 35
Figure 13. Measuring a Load, Method 1 ______________________________ 36
Figure 14. Measuring a Load, Method 2 ______________________________ 37
Figure 15. Measuring a Source Using a CT, Method 1 ___________________ 38
Figure 16. Rear Connection Panel ___________________________________ 39
Figure 17. Measuring a Power Source, Method 1 _______________________ 40
Figure 18. Measuring a Power Source, Method 2 _______________________ 41
Figure 19. Measuring a Load, Method 1 ______________________________ 42
Figure 20. Measuring a Load, Method 2 ______________________________ 43
Figure 21. Measuring a Power Source and Load, Method 1, Two Ind. Chnls __ 44
Figure 22. Measure 3P-3W 2 Meter Connection, Method 1 _______________ 45
Figure 23. Measuring a Source Using a CT, Method 1 ___________________ 47
Figure 24. External Transducer Test Connections ______________________ 48
Figure 25. Startup Screen 2801 and 2802 _____________________________ 50

12 2801/2802 Power Analyzer User Guide
Figure 26. Main Menu Screen ______________________________________ 51
Figure 27. Measurement Configuration Screen _________________________ 56
Figure 28. Measurement Configuration Screen _________________________ 56
Figure 29. Wiring Adjustments Menu Screen___________________________ 63
Figure 30. System Menu Screen ____________________________________ 72
Figure 31. LOAD/SAVE Main Menu Screen ___________________________ 74
Figure 32. Load Configuration Selection Screen ________________________ 74
Figure 33 Erase Configuration Selection Screen ________________________ 75
Figure 34. DC Zero Screen ________________________________________ 75
Figure 35. Diagnostic Menu Screen__________________________________ 76
Figure 36. Performance Screen _____________________________________ 77
Figure 37. About Screen __________________________________________ 77
Figure 38. ACDC Normal __________________________________________ 82
Figure 39. ACDC Inrush___________________________________________ 83
Figure 40. ACDC Integrated________________________________________ 83
Figure 41. DC Normal ____________________________________________ 84
Figure 42. Rectified Normal ________________________________________ 84
Figure 43. Fundamental Normal ____________________________________ 85
Figure 44. ΣHarmonics Normal _____________________________________ 85
Figure 45. DC Charge & Discharge __________________________________ 85
Figure 46. DC Charge & Discharge __________________________________ 86
Figure 47. Harmonics % Log in Bar Chart _____________________________ 86
Figure 48. Harmonics Absolute in List Form ___________________________ 87
Figure 49. Real-time Waveform _____________________________________ 87
Figure 50. Distortion Waveform _____________________________________ 87
Figure 51. No Inrush Detected ______________________________________ 91
Figure 52. History of Amps ACDC, Trend in Full View____________________ 92
Figure 53. History of Amps ACDC, Extents in Full View __________________ 92
Figure 54. History of Amps ACDC, Trend in Zoom Mode _________________ 92
Figure 55. History of Amps ACDC, Trend; Scrolled ______________________ 92
Figure 56. History of Amps ACDC, Extents in Zoom Mode ________________ 93
Figure 57. Startup in Full View, Trend ________________________________ 95
Figure 58. Startup in Full View, Extents _______________________________ 95
Figure 59. Startup, Partial, Extents __________________________________ 95

Introduction 13
Figure 60. Startup, Partial, Extents __________________________________ 95
Figure 61. Startup in Zoom Mode ___________________________________ 96
Figure 62. Range Change _________________________________________ 97
Figure 63. Amps Inrush in Normal Mode ______________________________ 98
Figure 64. Inrush in Zoom Mode ____________________________________ 98
Figure 65. Inrush in Zoom Mode, Additional Zoom Level _________________ 98
Figure 66. Configuration Printout ___________________________________ 101
Figure 67. Waveform Channel 1 Real-time ___________________________ 102
Figure 68. Waveform Channe1 Distortion ____________________________ 103
Figure 69. History Chart VOLTS ACDC, Trends View ___________________ 104
Figure 70. History Chart AMPS PERCENT THD Extents View ____________ 105
Figure 71. Harmonics Listing page 1 ________________________________ 106
Figure 72. Harmonics Listing page 2 ________________________________ 107
Figure 73. AC Voltage, Autorange __________________________________ 160
Figure 74. AC Voltage, Fixed Range, Low Frequency___________________ 161
Figure 75. AC Voltage, Autorange, High Frequency ____________________ 162
Figure 76. AC Voltage, Fixed Range, High Frequency __________________ 163
Figure 77. AC Current, Autorange, Low Frequency_____________________ 164
Figure 78. AC Current, Fixed Range, Low Frequency ___________________ 165
Figure 79. AC Current, Autorange, High Frequency ____________________ 166
Figure 80. AC Current, Fixed Range, High Frequency __________________ 167
Figure 81. DC Voltage, Autorange __________________________________ 168
Figure 82. DC Voltage, Fixed Range ________________________________ 169
Figure 83. DC Current, Autorange __________________________________ 170
Figure 84. DC Current, Fixed Range ________________________________ 171
Figure 85. AC Voltage (Transducer), Autorange, Line or LF Measurements _ 172
Figure 86. AC Voltage, (Transducer), Fixed Range, Line or LF Measurements173
Figure 87. AC Voltage, (Transducer), Autorange, HF Measurements_______ 174
Figure 88. AC Voltage, (Transducer), Fixed Range, HF Measurements _____ 175
Figure 89. DC Voltage, (Transducer), Autorange ______________________ 176
Figure 90. DC Voltage, (Transducer), Fixed Range_____________________ 177
Figure 91. Power, Autorange ______________________________________ 178
Figure 92. Power, Fixed Range ____________________________________ 179

14 2801/2802 Power Analyzer User Guide
Figure 93 VAR vs. Frequency _____________________________________ 180
Figure 94. Watts vs. Frequency ____________________________________ 181
Figure 95. Power Factor vs. Frequency ______________________________ 182

Introduction 15
Introduction
The purpose of this user guide is to describe the use and capabilities of the
2801/2802 Advanced Single and Dual-Channel Power Analyzers.
Scope
The 2801/2802 Advanced Single and Dual-Channel Power Analyzers
incorporate the ideal combination of precision, speed and ease-of-use in
instruments so economical they can be on every bench.
With an extended measurement range from micro-amps to hundreds of amps
and millivolts to kilovolts, the 2801/2802 is the ideal analyzer for efficiency,
standby power or ENERGY STAR testing. In addition to numerical results,
the 2801/2802 analyzer captures waveforms with true 512-point precision.
Results and waveforms can be displayed, read via the communication ports,
or sent directly at full resolution to a USB printer. Power and amplitude
measurements with an accuracy of <0.1% are automatically synchronized to
the fundamental frequency. Peak, RMS, rectified, and DC measurements of
voltage, current and power are provided including continuous, inrush, startup
and history modes, plus an integration mode for W-Hr, A-Hr, VA-Hr, as well
as integrated average power. The analyzer also provides waveform peak and
glitch capture modes.

16 2801/2802 Power Analyzer User Guide
Features
The 2801/2802 Power Analyzer’s features include the following—
• Highest Performance-to-Cost ratio in the industry
• Up to 2000V peak and 150A peak measurable internally (also external CT
capable)
• Base accuracy <0.08%. Current and voltage accuracies specified to less
than 1mArms and 1Vrms respectively (<0.2%)
• Measures and displays volts, current, power, frequency, harmonics, THD,
PF, CF, K-Factor, Triplens, inrush, distortion, glitches, and much more.
• Integrated line switch and inrush waveforms
• Source or load measurements with wiring loss and voltage burden
compensation
• DC charge and discharge measurements
• Frequency Range: DC and 20mHz – 200kHz
• Graphics display shows numerical results, waveforms, bar graphs, startup
& history plots
• 16-bit A/D converters at 235ksps
• 12 User-configurable digital I/O
• USB Flash drive support for data logging*
• Communications interfaces include GPIB (IEEE488), RS-232, and USB
(host and device) all standard.
* Planned feature
Functional Description 17
Functional Description
This chapter describes the circuitry and interfaces of the 2801/2802 Power
Analyzer.
Theory of Operation
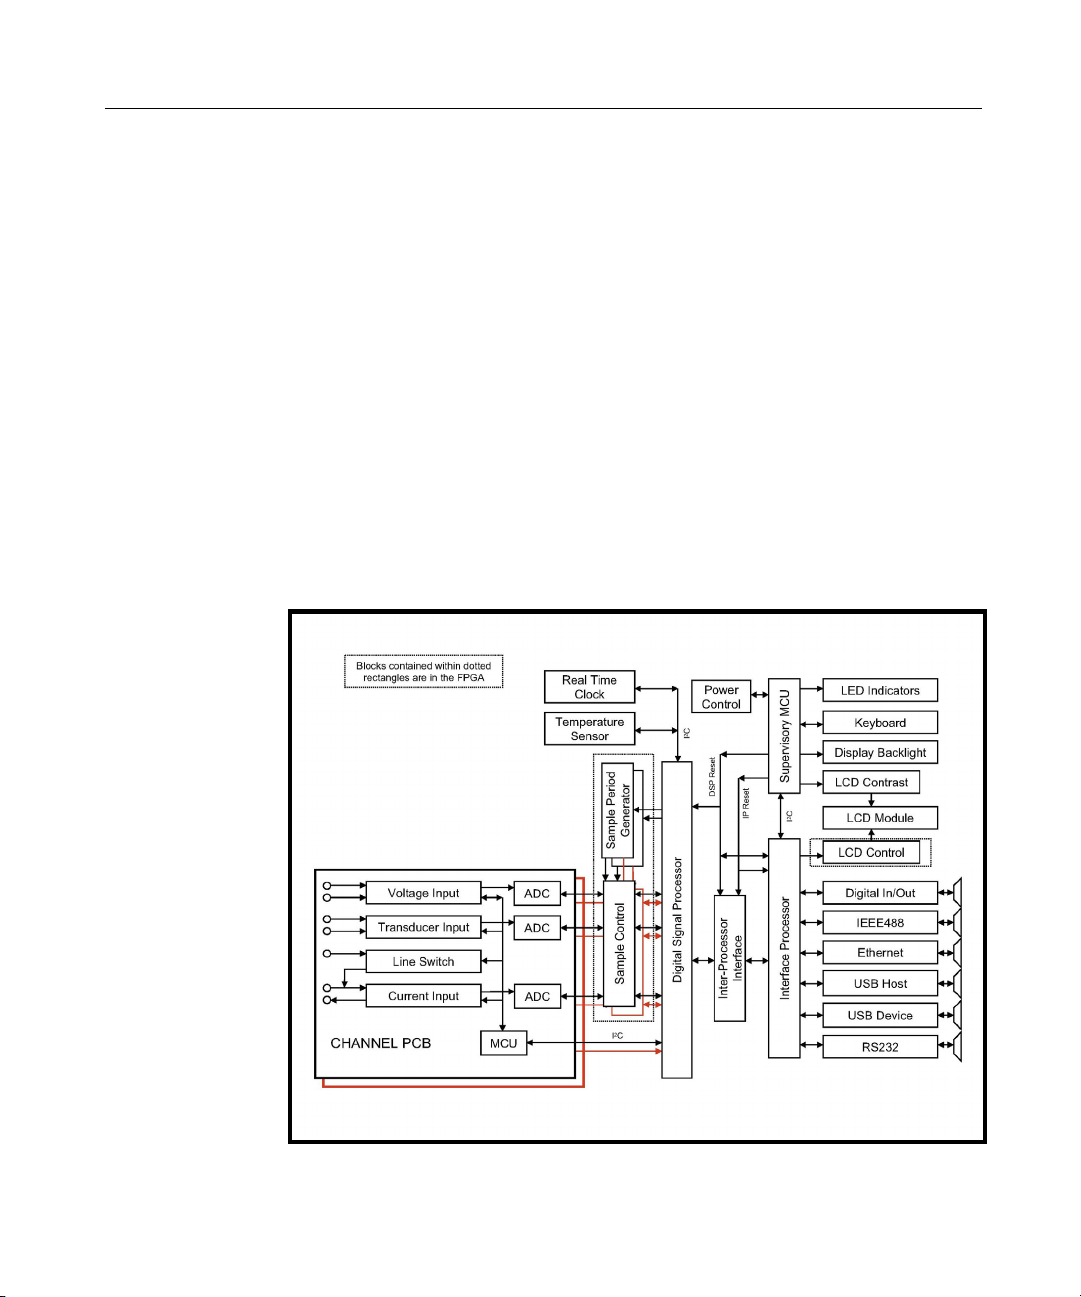
OVERALL BLOCK DIAGRAM
Figure 1. Overall Block Diagram

18 2801/2802 Power Analyzer User Guide
Analog Channel Board
The 2801 is built with one and the 2802 is built with two Analog Channel
Boards fitted. The block diagrams of this circuitry are shown below.
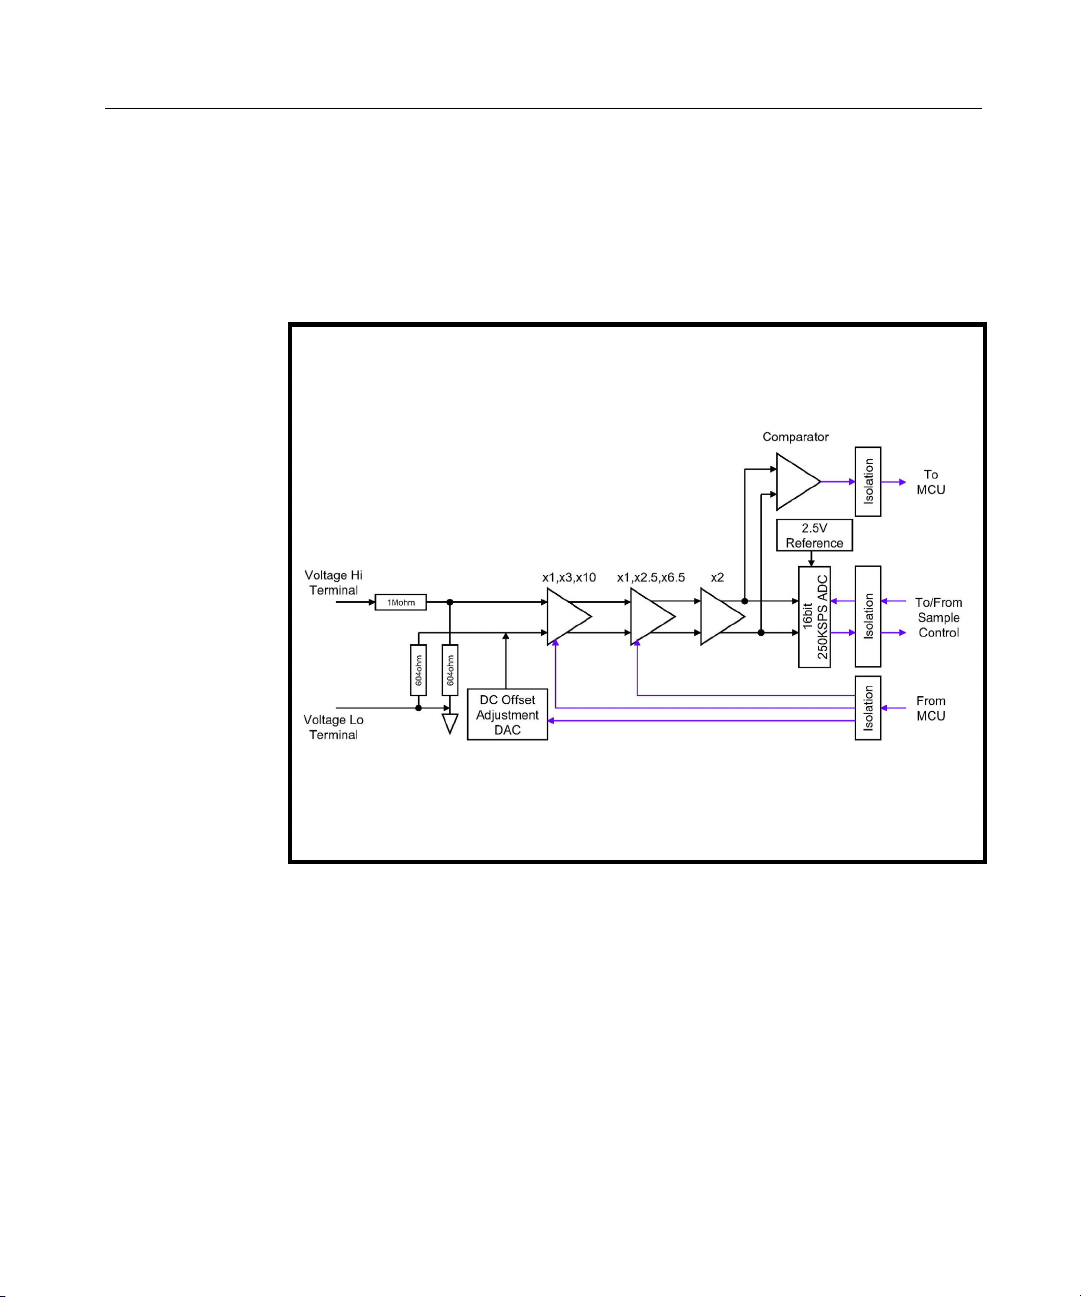
Voltage Input Attenuator Notes
The primary voltage-reducing element formed by the 1 Mohm portion of the
attenuator is comprised of several lesser value resistors in series:
a) To assure the input remains safe when a single resistor fails to a short
circuit;
b) To reduce the voltage coefficient of the attenuator caused by self heating
when high voltages are applied; and
c) To ensure that the input can withstand high voltages in excess of the
maximum specified to the user.
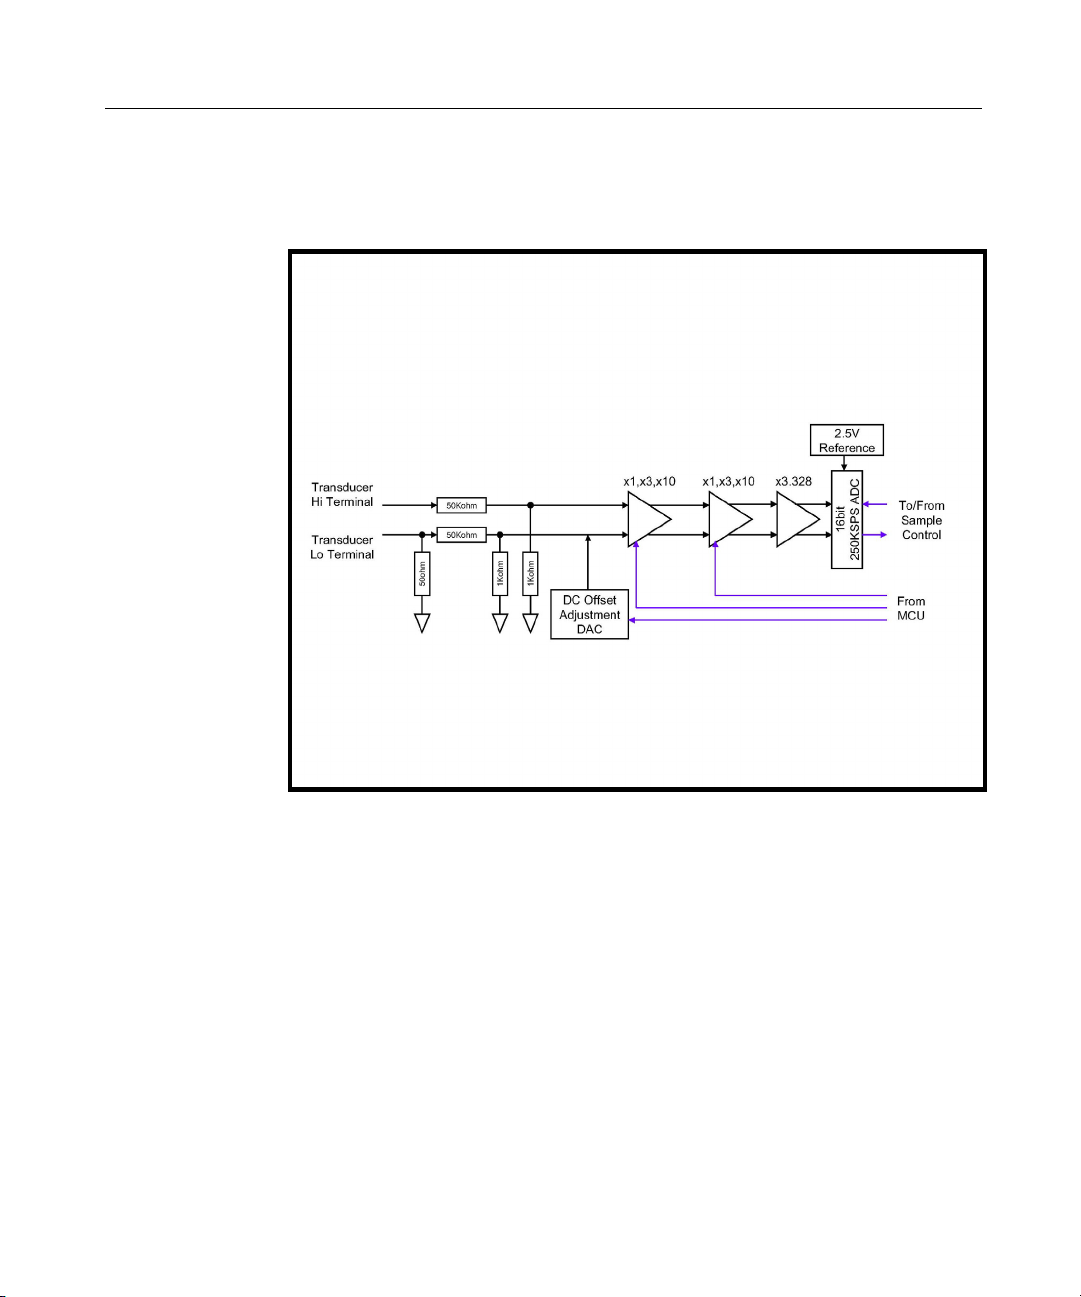
Transducer Input Attenuator Notes
The Transducer input attenuator is similar to the Voltage input attenuator but
with a much lower primary resistance value and a slightly higher output
impedance. Since the input voltages specified are low, only a single primary
attenuator resistor is used as there are no single fault safety issues with this
input.
Functional Description 19
Voltage Input Attenuator
Figure 2. Voltage Input Attenuator Block Diagram
20 2801/2802 Power Analyzer User Guide
Transducer Input Attenuator
Figure 3. Transducer Input Attenuator Block Diagram
Functional Description 21
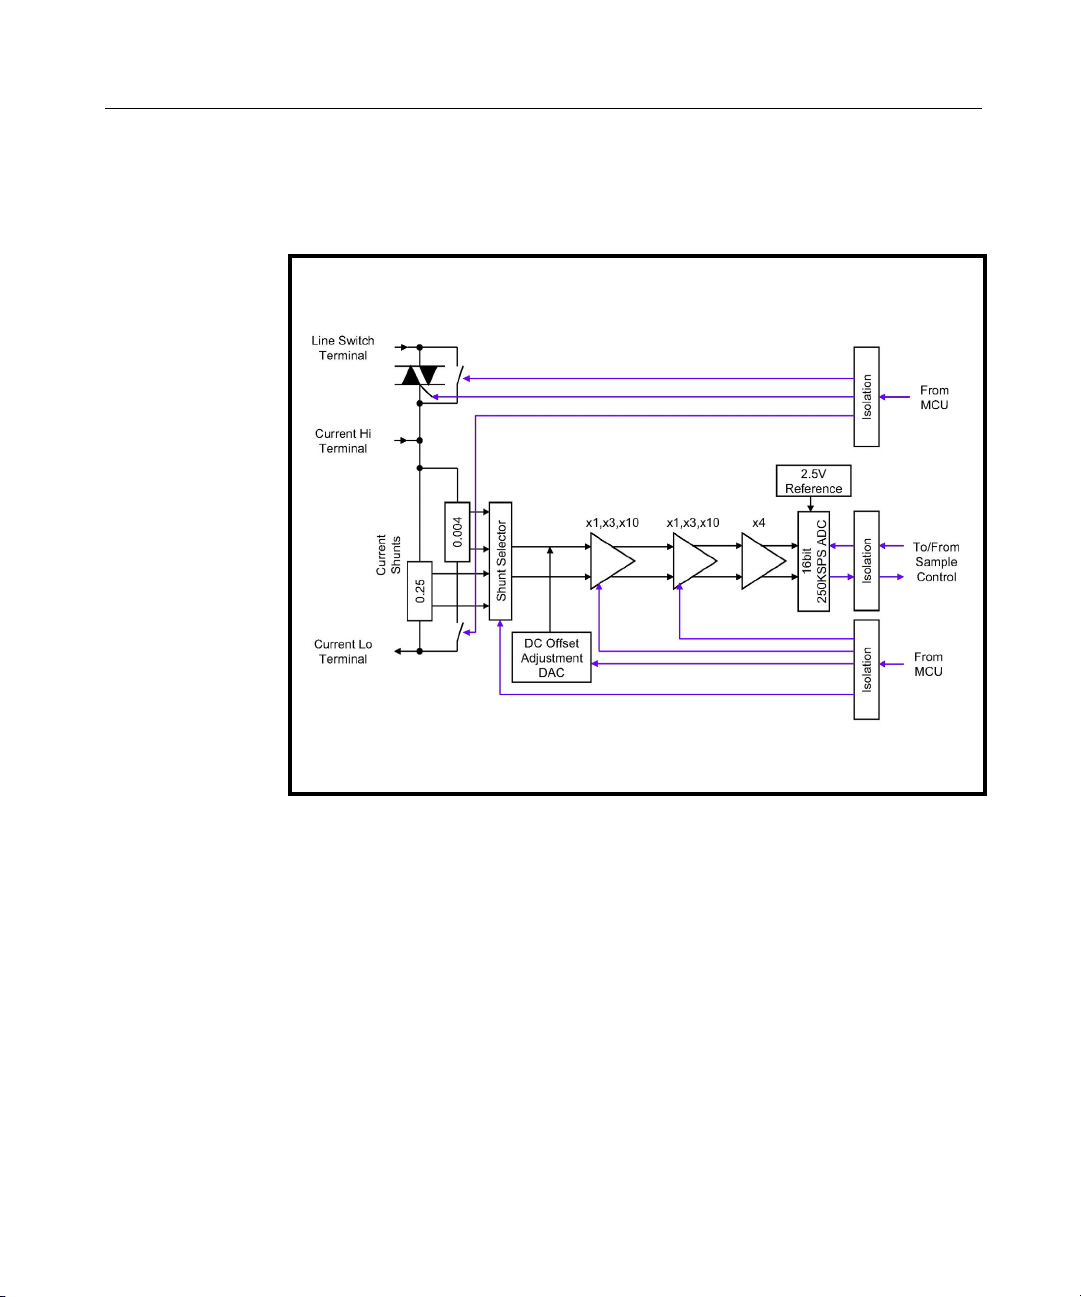
Current and Line Switch
Figure 4. Current and Line Switch Block Diagram
Line Switch Notes
The TRIAC and relay are controlled directly by the Channel MCU as
commanded by the DSP.
The timing of the turn on sequence when operating with AC voltages is
accomplished by the MCU delaying turning on the TRIAC (after being
commanded to do so by the DSP) by an amount commanded by the
DSP from the active edge of the “squared” signal from the comparator
in the Voltage Input circuitry. When set for DC voltage operation, the
TRIAC is turned on immediately after being commanded to do so
without reference to this signal.

22 2801/2802 Power Analyzer User Guide
Other than the delay noted above, the turn on sequence in either AC or DC
voltage modes is the same and is timed by the Channel MCU.
Nominally 50ms after the TRIAC is turned on, the parallel relay is
engaged, and then nominally 20ms after that the TRIAC has its control
signal removed. Since the relay has a low voltage drop, there is
insufficient current flowing through the TRIAC to hold it in the on
state, and thus only the relay conducts from this point onwards.
When configured for DC voltage operation, the turn off sequence
(controlled by the channel MCU) is simply to turn off the relay
immediately after being commanded to do so by the DSP.
When configured for AC voltage operation the timing sequence during turn
off is as follows. Immediately after being commanded to turn off the
switch, the MCU turns on the control signal to the TRIAC. After
nominally 20ms the relay is turned off, and after a further nominally
40ms the TRIAC control signal is removed. In this manner the actual
load turn off is controlled by the TRIAC rather than the relay.
If the switch is used in high dV/dT situations (e.g. inductive loads), then it
may be required that the user add an external snubber circuit. This
circuitry cannot be included internally, as it is dependent on the actual
load characteristics and its presence will directly affect the off
characteristics of the switch.
Since the relay is normally the current carrying device, the TRIAC does not
limit the continuous current capability of the switch as the thermal
issues with the TRIAC are not present. The TRIAC is only used to
withstand the turn on surge of the load, and to withstand any reverse
“kick” when an AC load is turned off. Similarly, the relay is not
required to withstand the surge current of the load during turn on, nor is
it required to withstand the turn off surge of an inductive AC load, so
the requirements on the relay are reduced.
DC Offset Adjustment DACs (all inputs)
The DC Offset adjustment DACs are adjusted by the DSP (via the Channel
MCUs) to produce a zero DC reading when commanded to do so by the user.
This is accomplished independently for each input, each range, and each
current shunt selection. The DAC settings required to produce each zero DC
reading is stored independently for each combination in the Channel MCU in
non-volatile memory.

Functional Description 23
Isolation (all inputs except the Transducer input)
The digital signals are all passed through digital isolation barriers. This
provides the required isolation between the measurement circuitry and
the chassis ground of the product.
A further area of isolation, not specifically shown on the block diagrams is
that of power to the analog circuitry in each input.
Interfaces
Note: Specifications are subject to change without notice.
Front Panel
Liquid Crystal Display—240 x 64 high-speed graphics LCD with CCFL
backlight (5" x 1.35" viewing area)
Keyboard—Seven fixed-purpose keys + four softkeys
IEEE488
Interface—
IEEE488.1 (Certain commands conform to IEEE488.2)
Addressing—
Single address, user selectable via front panel between 0 and 29 inclusive
Capabilities—
SH1 AH1 T6 L4 SR1 RL1 PP0 DC1 DT1 C0 E2 (350ns min. T1)
Max. Talk Data Rate—
>300,000 bytes per second
Max. Listen Data Rate—
>100,000 bytes per second
Command Set—
All front panel capabilities are provided via ASCII textual command
sequences.
Results—
Any results may be obtained at any time from the interface as ASCII textual
numerical data. Additionally, status and state interrogatives are provided for
on-the-fly determination of product status.
USB Device
USB 2.0 compliant, full-speed, multiple endpoint interface to a host.

24 2801/2802 Power Analyzer User Guide
Driver provided with instrument is for PC compatible computers running
Windows 2000 or later
USB Host
USB 2.0 compliant, low or full-speed (as selected by the device).
Compatible with all printers supporting either the PCL3 (or higher) language
or supporting unformatted text transfers.
Printer must be directly connected to the 2802 (hubs are not supported).
RS-232
RTS/CTS hardware handshaking. Also supports the DTR and DSR signals.
Baud rate user selectable as 9600, 19200, 38400, 57600, 115200 or
230400baud.
8 bits per character, no parity, 1 stop bit transmission format.
Digital I/O
The Digital I/O port can be used to control the internal line switch or to
control integration..
Ethernet
Not yet available.
Using the Power Analyzer 25
Using the Power Analyzer
The purpose of this chapter is to describe how to set up and use the 2802.
This chapter covers—
• Setting up the analyzer
• Using the front panel interface
• Rear panel connections
• Power testing
Setting Up
The power analyzer is made to sit on the bench. The viewing angle can be
optimized by adjusting the handle and the viewing brightness enhanced by
adjusting the DISPLAY CONTRAST. An optional rack adapter is available.
Figure 5. Benchtop Version of 2801 Power Analyzer
26 2801/2802 Power Analyzer User Guide
Figure 6. Benchtop Version of 2802 Power Analyzer
To adjust the handle—
Press and hold the buttons located on the rear side where the handle attaches
to the case sides. Rotate the hand
le until it clicks into place.
WARNING: IF THE POWER ANALYZER IS USED IN A MANNER NOT SPECIFIED
!
BY VITREK, THE PROTECTION PROVIDED BY THE EQUIPMENT MAY BE
IMPAIRED.
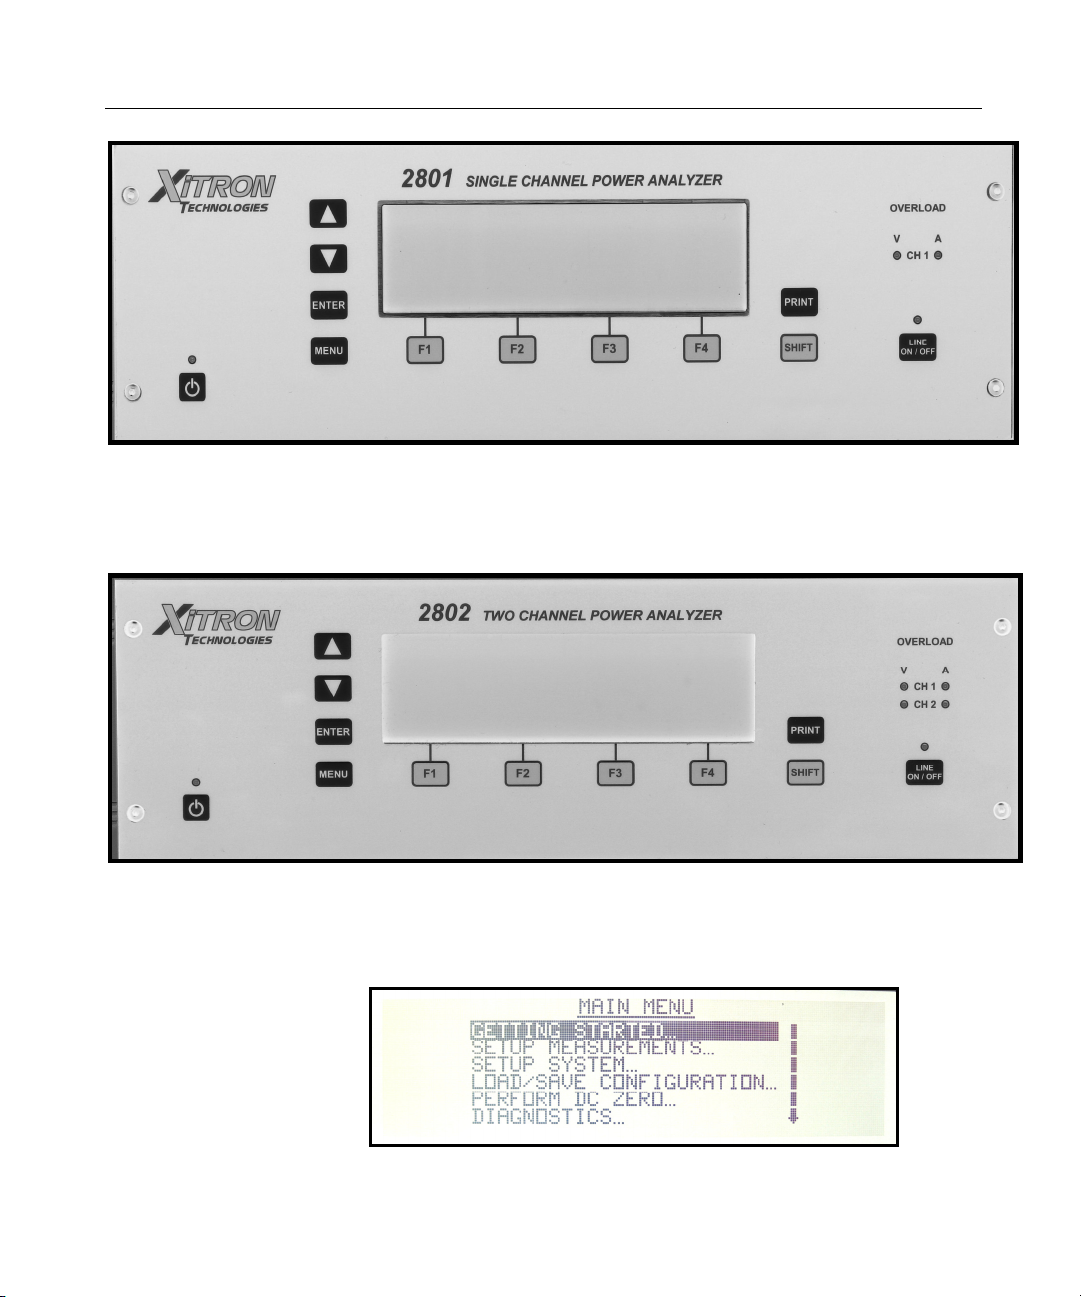
Using the Front Panel Interface
Use the 2801/2802 front panel interface to select and setup the desired tests
and to read the test results. The interface includes a power switch; LCD
display; two keys used for scrolling; a shift key to alter the softkey functions;
a line switch key; and separate keys used to pull up menus, to make
selections, and to print. Additionally, there are four softkeys. The four LEDs
function as indicators. Figure 7 shows the front panel interface display, keys
and LEDs.
Using the Power Analyzer 27
Figure 7. 2801 Front Panel Interface Detail
Figure 8. 2802 Front Panel Interface Detail
The highlighted menu item will be initiated by pressing the ENTER key.
Figure 9. Sample Display
28 2801/2802 Power Analyzer User Guide
The display is used to view and select the various menu options and to review
the power measurement results numerically and graphically, as shown in the
section on Viewing Results.
The display contains helpful navigational symbols, such as, the softkey labels;
and on the right there may be an arrow pointing either up or down, if
additional line items are available. The F1 through F4 softkey labels correlate
with each display and are used to modify setups and to expand on existing
numerical and graphical measurement results.
If the LED above the power key is yellow, it indicates power
has been connected. To power up the analyzer, hold the
power key until the LED turns green. It requires that the key
be pressed for 500 milliseconds. When turning it off the
LED turns from green to yellow.
Use the and (up and down arrow) keys to scroll a
highlight bar through options in a menu, to bring up the
various measurement results for viewing, and to view
additional measurement results. The up arrow key moves the
display to the previously viewed screen or item. The down
arrow key moves to the next viewable screen or item.
The SHIFT key provides additional options for softkeys F1
SHIFT
through F4 when applicable. This feature is most valuable
when viewing charts.
Use the ENTER key to make a selection. Press ENTER
ENTER
when the desired menu option or measurement selection is
highlighted.
Use the MENU key to access the MAIN MENU. The
MENU
MENU key is also used to move from submenus to higher
level menus and from the MAIN MENU to Measurement
Results.
The four softkeys, F1 through F4, change functionality
F1
within a display and correlate with that specific menu or
Measurement Results display.
Using the Power Analyzer 29
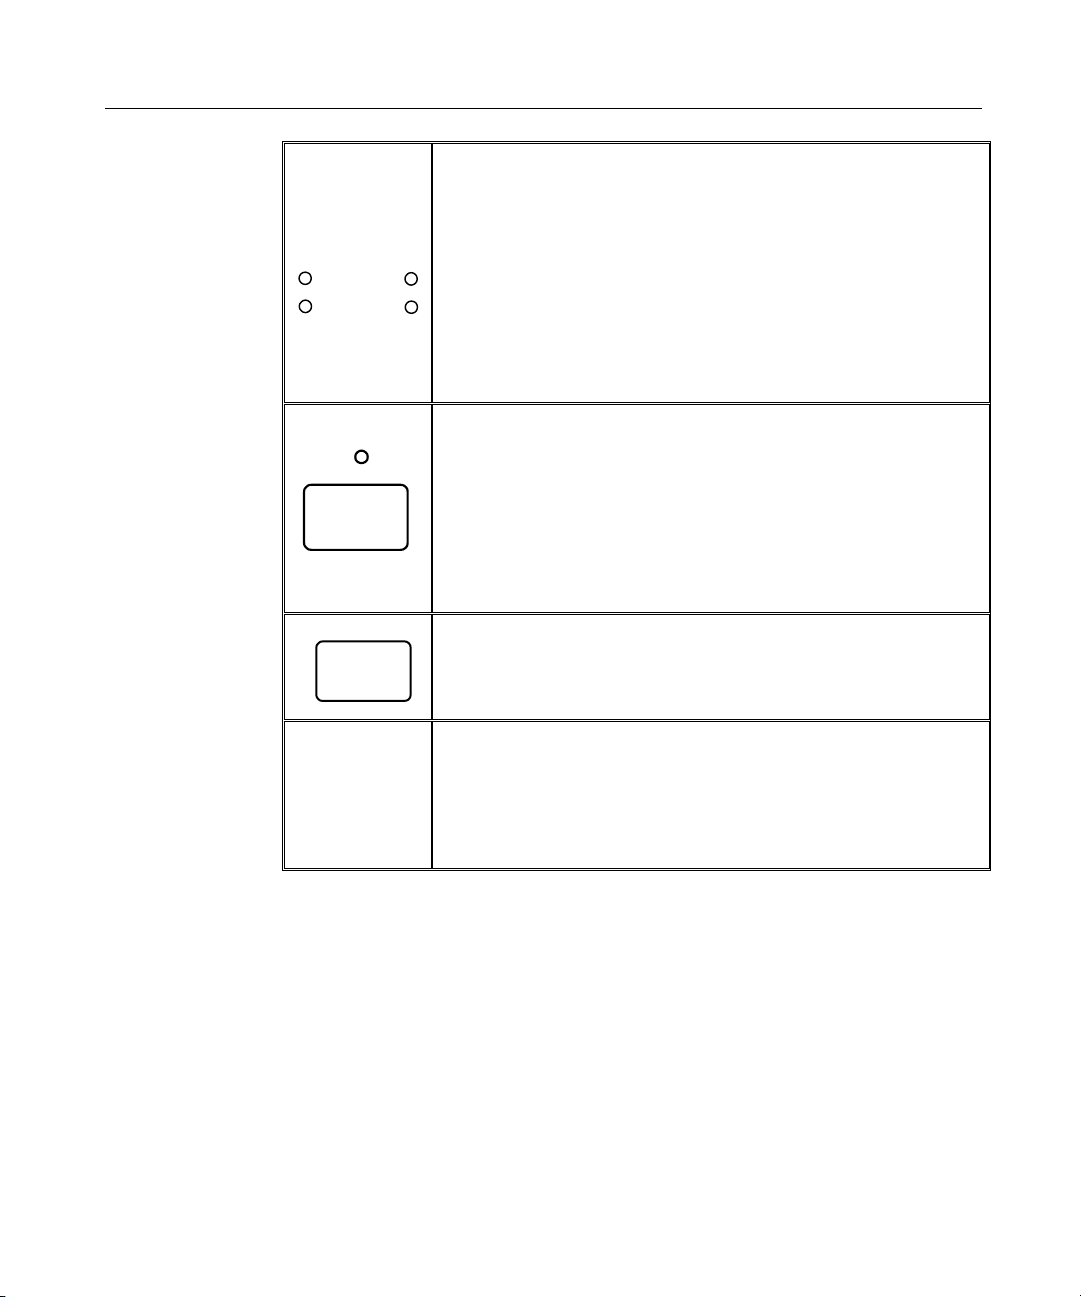
The LEDs designated OVERLOAD V and A indicate the
OVERLOAD
VA
CH 1
CH 2
selected current/voltage threshold has been exceeded, such
as, an input signal is greater than the selected range value,
above strict ranging or the selected maximum range. Note
that when either of these LEDs remains lighted, changes to
the test device’s signal input or values in the SETUP
MEASUREMENTS MENU are required.
2802 is shown, 2801 only has CH1 Overload LEDs
A lighted LED at LINE ON/OFF indicates that power has
been turned on to the device connected to the analyzer for
testing/measuring.
LINE
ON / OFF
Hold the LINE ON/OFF key for a few milliseconds to
power up or power down the test device. Note that this line
switch is ENABLED or DISABLED from within the
SETUP MEASUREMENTS MENU.
The PRINT key allows the user to print a full page of data
PRINT
reflecting the display results. The formatting of the printout
is either graphical or numerical tabulation.
The F1, F2, F3 and F4 keys are softkeys. They correlate
with labels given on the display. The softkey labels indicate
other options available or the status of the display. An
ellipsis (…) following the label indicates additional choices
available. See below.
Grounding of the Analyzer
There are two distinct grounded areas built into the 2801/2802 Power
Analyzer.
Chassis Ground
This comprises the entire external and internal chassis mechanical
components, the outside shells of all interface connectors, and the shield
connection in the IEEE488 interface connector. An external protective
ground terminal is directly connected to this ground.
Internal Electronic Ground
This comprises all grounded circuitry within the product and is the reference

30 2801/2802 Power Analyzer User Guide
for all interface signals within the interface connectors except for the Ethernet
connections (which are transformer isolated according to the applicable
Ethernet standards). This area is electrically connected to the negative side of
the DC power input via an RF pi filter network having a low DC resistance.
Notes on Grounding:
Between the two ground areas there is a 50ohm (1%) power resistor in
parallel with a 1000pF/50V ceramic capacitor for RF filtering.
The T input connections are isolated from the Internal Electronic Ground
via a nominally 50ohm (1%) power resistor. An isolating current
transducer having sufficient safety rating for the signals being measured
MUST be used when using this input.
The A and Line Switch connections are fully isolated from the Internal
Electronic Ground using transformer isolation to the requirements of
EN61010. This isolation is 100% tested to 4.5kV peak.
The V connections are fully isolated from the Internal Electronic Ground
using transformer isolation to the requirements of IEC61010. This
isolation is 100% tested to 4.5kV peak.
The V connections are resistively isolated from each other with nominally
1Mohm to the requirements of EN61010 in no fault, single fault and
dual fault conditions. This isolation is 100% tested to 2kV peak.
Mechanical isolation is provided between the V connections and the A and
Line Switch connections, which is well in excess of the class ratings of
either set of terminals, there are no electrical signals between these
connections.
Because of the use of transformer isolation, there is very little current
flowing between the UUT terminals and the ground of the product. The
isolation impedance is >10
9
ohms and the capacitance is typically a few
10s of pF.
The EN61010 ratings in each application category for each terminal are
stated on the rear panel of the product next to the terminals.

Using the Power Analyzer 31
Rear Panel Connections - 2801 and 2802
Power Requirements
In order to comply with the safety ratings stated on the rear panel of the
product according to the requirements contained in EN61010,these products
must be provided with an external ground connection in some manner (either
through the power source for the product or by connection to the protective
ground on the product).
These products must only b
isolation from the mains supply which meets the requirements of
EN61010.
WARNING: TO AVOID AN UNSAFE AND POTENTIALLY DAMAGING
CONDITION, NEVER USE AN EXTERNAL DC POWER SOURCE TO THIS
PRODUCT, WHICH IS NOT ISOLATED FROM THE MAINS SUPPLY.
When used with the external power supply provided with the product by
, the ground is supplied via the negative DC power input. If the
Vitrek
product is powered by any other equivalent grounded output DC
power supply, then the ground is supplied via that power supply. In
these cases the user need not provide any additional ground connection
to the product provided that the external DC Supply has a ground
connection to it.
In all other cases, e.g. powered from an external battery or any other
isolated DC supply, the instrument MUST be provided with a ground
connection to the protective ground terminal located on the rear panel of
the product (this is marked according to the requirements of EN61010.)
Never use an
from the mains supply – this is UNSAFE and may cause DAMAGE to
the product.
external DC power source to the product which is not isolated
e used with a power supply which contains
If at any time there is doubt regarding the continuity of the ground
connection to
rear panel protective ground terminal.
Operation of the product in the absence of any ground connection does not
intrinsically
the UUT terminals are significantly reduced in this situation. Safety
the product, then it is strongly recommended to use the
render the product unsafe; however the safety ratings for

32 2801/2802 Power Analyzer User Guide
ratings for the products have not been formally established when
operating without a ground connection.
!
!
WARNING: To avoid possible electrical shock, do not operate the product
without an external ground connection in a manner described herein.
CAUTION: The external DC power source for the product MUST be rated
to meet the voltage range and minimum current requirements stated on the
rear panel of the product.
2801 Rear Panel Connections
The 2801 Power Analyzer
to Figure 10. The connectors used for testing/measuring functions are along
the midline of the instrument. The connectors used for communications and
control are along the bottom. The ground terminal is at the lower left corner.
!
!
!
WARNING: IF THE POWER ANALYZER IS USED IN A MANNER NOT SPECIFIED
BY VITREK, THE PROTECTION PROVIDED BY THE EQUIPMENT MAY BE
IMPAIRED.
WARNING: IT IS RECOMMENDED THAT THE PROTECTIVE CONDUCTOR
TERMINAL IS CONNECTED TO EARTH GROUND WHEN THE SIGNALS
BEING MEASURED ARE REFERENCED TO EARTH GROUND.
CAUTION: THE USE OF THE T5 CHARGER FROM VITREK OR A VITREK
RECOMMENDED REPLACEMENT MUST BE USED TO ENSURE THAT THE UNIT
GROUND IS NOT COMPROMISED.
rear panel contains a variety of connectors. Refer
CAUTION: FOR ALL CONNECTIONS, KEEP INPUT AND OUTPUT WIRING
SEPARATED.

Using the Power Analyzer 33
Power Line Connection
Ground Terminal
Voltage Input
T- Connector
Optional
Line In
Figure 10. Rear Connection Panel
Current Input

34 2801/2802 Power Analyzer User Guide
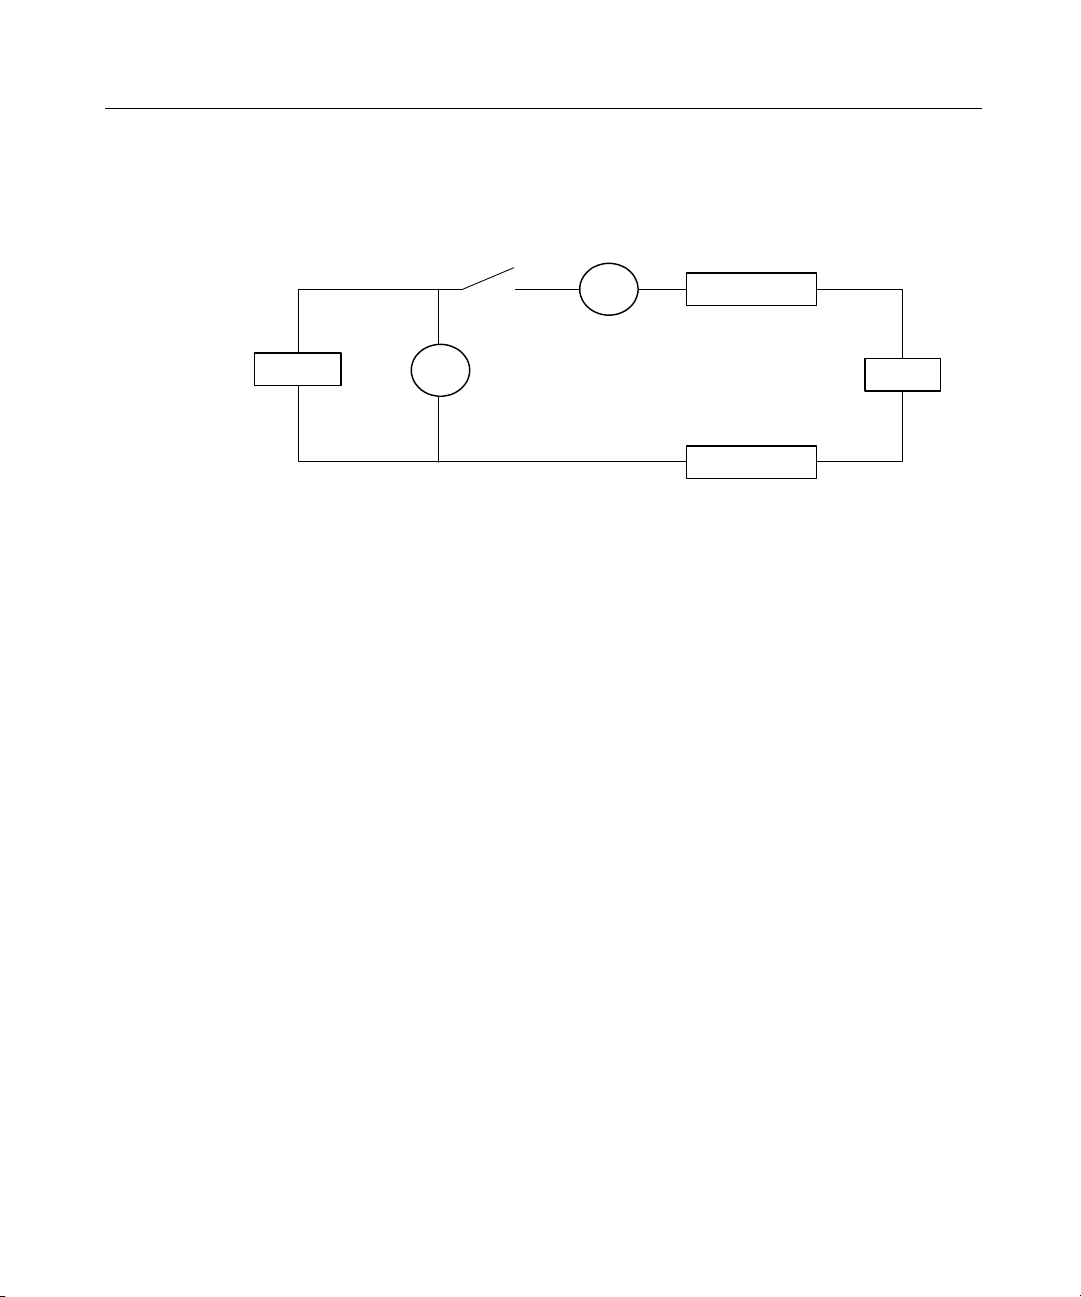
Single-Channel Measurements of a Power Source:
Connection Method 1
Wiring Loss
W1 ohms
Source
Wiring Loss
ohms
W
2
Figure 11. Measuring a Power Source, Method 1
Configure the channel as follows -
• This connection method is suitable for most applications.
• At high frequencies, the wiring length between the source and the
current and voltage measurement points should be kept as short as
possible to avoid inductive and capacitive losses causing inaccuracies.
Optional
Line Switch
+
V
-
+
-
A
Load
• Optionally, set Wiring Impedance to (W1 + W2) ohms. Include all
wiring resistances between the source and the points at which the
voltage is measured in the entered value for wiring impedance.
• Set V Burden Compensation to YES.
• If the current measurement terminals are reversed, then set Reverse
Current to YES, otherwise set to NO.
• If the voltage measurement terminals are reversed, then set Reverse
Voltage to YES, otherwise set to NO.

Using the Power Analyzer 35
Single-Channel Measurements of a Power Source:
Connection Method 2
Wiring Loss
ohms
W
1
Source
Wiring Loss
W2 ohms
Figure 12. Measuring a Power Source, Method 2
Configure the channel as follows -
• Method 2 may provide improved results for applications with very
low voltage and very high current, when using the internal shunt.
• At high frequencies, the wiring length between the source and the
current and voltage measurement points should be kept as short as
possible to avoid inductive and capacitive losses causing inaccuracies.
• Optionally, set Wiring Impedance to (W1 + W2) ohms. The
instrument will always automatically adjust for the internal shunt
burden resistance if the channel is set to use the internal shunt. Other
than the internal shunt burden, include all wiring resistances between
the source and the points at which the voltage is measured in the
entered value for wiring impedance.
+
-
A
+
V
Load
-
• Set V Burden Compensation to NO.
• If the current measurement terminals are reversed, then set Reverse
Current to YES, otherwise set to NO.
• If the voltage measurement terminals are reversed, then set Reverse
Voltage to YES, otherwise set to NO.
36 2801/2802 Power Analyzer User Guide
Single-Channel Measurements of a Load: Connection Method 1
Optional
Line Switch
+
Source
Configure the channel as follows -
• This connection method is suitable for most applications.
• At high frequencies, the wiring length between the load and the
current and voltage measurement points should be kept as short as
possible to avoid inductive and capacitive losses causing inaccuracies.
V
-
Figure 13. Measuring a Load, Method 1
+
-
A
Wiring Loss
W
ohms
1
Load
Wiring Loss
W2 ohms
• Optionally, set Wiring Impedance to (W1 + W2) ohms. The
instrument will always automatically adjust for the internal shunt
burden resistance if the channel is set to use the internal shunt. Other
than the internal shunt burden, include all wiring resistances between
the load and the points at which the voltage is measured in the entered
value for wiring impedance.
• Set V Burden Compensation to NO.
• If the current measurement terminals are reversed, then set Reverse
Current to YES, otherwise set to NO.
• If the voltage measurement terminals are reversed, then set Reverse
Voltage to YES, otherwise set to NO.

Using the Power Analyzer 37
Single-Channel Measurements of a Load: Connection Method 2
+
Source
-
A
+
V
Wiring Loss
ohms
W
1
Load
-
Wiring Loss
W2 ohms
Figure 14. Measuring a Load, Method 2
Configure the channel as follows -
• Method 2 may provide improved results for applications with very low
voltage and very high current, when using the internal shunt.
• At high frequencies, the wiring length between the load and the current
and voltage measurement points should be kept as short as possible to
avoid inductive and capacitive losses causing inaccuracies.
• Optionally, set Wiring Impedance to (W1 + W2) ohms. Include all wiring
resistances between the load and the points at which the voltage is
measured in the entered value for wiring impedance.
• Set V Burden Compensation to YES.
• If the current measurement terminals are reversed, then set Reverse
Current to YES, otherwise set to NO.
• If the voltage measurement terminals are reversed, then set Reverse
Voltage to YES, otherwise set to NO.

38 2801/2802 Power Analyzer User Guide
Measurements of a Power Source:Connection Method 1 – Ext CT
Source
+
CT
-
Load
Optional
Wiring Loss
ohms
W
1
Wiring Loss
ohms
W
2
Figure 15. Measuring a Source Using a CT, Method 1
Configure the channel as follows –
• This connection method is suitable for most external transducer
applications.
• At high frequencies, the wiring length between the source and the current
and voltage measurement points should be kept as short as possible to
avoid inductive and capacitive losses causing inaccuracies.
• Optionally, set Wiring Impedance to (W1 + W2) ohms. Include all wiring
resistances between the source and the points at which the voltage is
measured in the entered value for wiring impedance.
+ +
V
-
A or T
-
• Set V Burden Compensation to YES.
• If the current measurement terminals of the 2801 or the wire through the
CT (but not both) are reversed then set Reverse Current to YES,
otherwise set to NO.
• If the voltage measurement terminals are reversed, then set Reverse
Voltage to YES, otherwise set to NO.
• If using a current output CT then use the A terminals, otherwise use the T
connector, of the 2801. If using a current output CT and using the
internal line switch of the 2801, then take care to reduce the length of the
common wiring of the two signals to the A+ terminal of the 2801.

2802 Rear Panel Connections
The 2802 Power Analyzer rear panel contains a variety of connectors. Refer
to Figure 16. The connectors used for testing/measuring functions are along
the midline of the instrument. The connectors used for communications and
control are along the bottom. The ground terminal is at the lower left corner.
Using the Power Analyzer 39
!
BY VITREK, THE PROTECTION PROVIDED BY THE EQUIPMENT MAY BE
IMPAIRED.
WARNING: IT IS RECOMMENDED THAT THE PROTECTIVE CONDUCTOR
WARNING: IF THE POWER ANALYZER IS USED IN A MANNER NOT SPECIFIED
!
TERMINAL IS CONNECTED TO EARTH GROUND WHEN THE SIGNALS
BEING MEASURED ARE REFERENCED TO EARTH GROUND.
CAUTION: THE USE OF THE T5 CHARGER FROM VITREK OR A VITREK
!
RECOMMENDED REPLACEMENT MUST BE USED TO ENSURE THAT THE UNIT
GROUND IS NOT COMPROMISED.
CAUTION: FOR ALL CONNECTIONS, KEEP INPUT AND OUTPUT WIRING
SEPARATED.
Figure 16. Rear Connection Panel
Power Line Connection
Ground Terminal
Voltage Input
T- Connector
Optional
Line In
Current Input

40 2801/2802 Power Analyzer User Guide
Measurements of a Power Source: Connection
Method 1
Wiring Loss
W1 ohms
Source
Wiring Loss
ohms
W
2
Figure 17. Measuring a Power Source, Method 1
Configure the channel as follows -
• This connection method is suitable for most applications.
• At high frequencies, the wiring length between the source and the
current and voltage measurement points should be kept as short as
possible to avoid inductive and capacitive losses causing inaccuracies.
Optional
Line Switch
+
V
-
+
-
A
Load
• Optionally, set Wiring Impedance to (W1 + W2) ohms. Include all
wiring resistances between the source and the points at which the
voltage is measured in the entered value for wiring impedance.
• Set V Burden Compensation to YES.
• If the current measurement terminals are reversed, then set Reverse
Current to YES, otherwise set to NO.
• If the voltage measurement terminals are reversed, then set Reverse
Voltage to YES, otherwise set to NO.

Using the Power Analyzer 41
Measurements of a Power Source: Connection Method 2
Wiring Loss
W
ohms
1
Source
Wiring Loss
W2 ohms
Figure 18. Measuring a Power Source, Method 2
Configure the channel as follows -
• Method 2 may provide improved results for applications with very
low voltage and very high current, when using the internal shunt.
• At high frequencies, the wiring length between the source and the
current and voltage measurement points should be kept as short as
possible to avoid inductive and capacitive losses causing inaccuracies.
• Optionally, set Wiring Impedance to (W1 + W2) ohms. The
instrument will always automatically adjust for the internal shunt
burden resistance if the channel is set to use the internal shunt. Other
than the internal shunt burden, include all wiring resistances between
the source and the points at which the voltage is measured in the
entered value for wiring impedance.
+
-
A
+
V
Load
-
• Set V Burden Compensation to NO.
• If the current measurement terminals are reversed, then set Reverse
Current to YES, otherwise set to NO.
• If the voltage measurement terminals are reversed, then set Reverse
Voltage to YES, otherwise set to NO.

42 2801/2802 Power Analyzer User Guide
Measurements of a Load: Connection Method 1
Optional
Line Switch
+
Source
Configure the channel as follows -
• This connection method is suitable for most applications.
• At high frequencies, the wiring length between the load and the
current and voltage measurement points should be kept as short as
possible to avoid inductive and capacitive losses causing inaccuracies.
V
-
Figure 19. Measuring a Load, Method 1
+
-
A
Wiring Loss
W
ohms
1
Load
Wiring Loss
W2 ohms
• Optionally, set Wiring Impedance to (W1 + W2) ohms. The
instrument will always automatically adjust for the internal shunt
burden resistance if the channel is set to use the internal shunt. Other
than the internal shunt burden, include all wiring resistances between
the load and the points at which the voltage is measured in the entered
value for wiring impedance.
• Set V Burden Compensation to NO.
• If the current measurement terminals are reversed, then set Reverse
Current to YES, otherwise set to NO.
• If the voltage measurement terminals are reversed, then set Reverse
Voltage to YES, otherwise set to NO.

Using the Power Analyzer 43
Measurements of a Load: Connection Method 2
+
Source
-
A
+
V
Wiring Loss
W1 ohms
Load
-
Wiring Loss
W2 ohms
Figure 20. Measuring a Load, Method 2
Configure the channel as follows -
• Method 2 may provide improved results for applications with very low
voltage and very high current, when using the internal shunt.
• At high frequencies, the wiring length between the load and the current
and voltage measurement points should be kept as short as possible to
avoid inductive and capacitive losses causing inaccuracies.
• Optionally, set Wiring Impedance to (W1 + W2) ohms. Include all wiring
resistances between the load and the points at which the voltage is
measured in the entered value for wiring impedance.
• Set V Burden Compensation to YES.
• If the current measurement terminals are reversed, then set Reverse
Current to YES, otherwise set to NO.
• If the voltage measurement terminals are reversed, then set Reverse
Voltage to YES, otherwise set to NO.

44 2801/2802 Power Analyzer User Guide
Measurements of a Power Source and Load: Method
1, Two Ind. Chnls
Source
Source
Wiring Loss
W
ohms
1
Wiring Loss
W
ohms
2
V
V
+
-
+
-
+
A
Optional
Line Switch
-
Wiring Loss
W
ohms
1
Wiring Loss
W2ohms
+
Load
-
Channel 2
(Load Connection)
A
Load
Channel 1
(Source Connection)
Figure 21. Measuring a Power Source and Load, Method 1, Two Ind. Chnls
Configure the channels as follows -
• This connection method is suitable for most Independent or
Input/Output channel applications.
• At high frequencies, the wiring length between the source and the
current and voltage measurement points should be kept as short as
possible to avoid inductive and capacitive losses causing inaccuracies.

Using the Power Analyzer 45
• Optionally, set Wiring Impedance to (W1 + W2) ohms. Include all
wiring resistances between the source and the points at which the
voltage is measured in the entered value for wiring impedance.
• Set V Burden Compensation to YES.
• If the current measurement terminals are reversed, then set Reverse
Current to YES, otherwise set to NO.
• If the voltage measurement terminals are reversed, then set Reverse
Voltage to YES, otherwise set to NO.
Measurement: 3P-3W 2 Meter Connection, Method 1
X
Source
Z
Source
Y
Source
+
A
+
V
-
-
V
+
+
A
Figure 22. Measure 3P-3W 2 Meter Connection, Method 1
-
Load
Load
Load
X
Channel 2
Z
Y
Channel 1
-

46 2801/2802 Power Analyzer User Guide
The above diagram is applicable when there are 3 wires connecting to the
Load. For ease, we have used X, Y and Z instead of A, B and C. The phase
rotation of the Channels must be opposite of each other and the current
measurement is made in the line phase connected to the corresponding voltage
HI terminal.
Configure the channels as follows -
• Select 3P-3W from the Getting Started Menu.
• The 2802 will provide the following results
Two of the actual measured voltages (X-Z and Y-Z)
The Voltage Difference (= Y-X)
Two of the actual measured currents (X and Y)
The Sum Current (=Z)
The individual and totals for VA, W, VAR, PF etc.
• If the current measurement terminals are reversed, then set Reverse
Current to YES, otherwise set to NO. (Only if both currents are
backwards)
• If the voltage measurement terminals are reversed, then set Reverse
Voltage to YES, otherwise set to NO. .(Only if both Voltages are
backwards)

Using the Power Analyzer 47
Measurements of a Power Source: Connection Method 1 – Ext CT
Source
+
CT
-
Load
Optional
Wiring Loss
ohms
W
1
Wiring Loss
ohms
W
2
Figure 23. Measuring a Source Using a CT, Method 1
Configure the channel as follows –
• This connection method is suitable for most external transducer
applications.
• At high frequencies, the wiring length between the source and the current
and voltage measurement points should be kept as short as possible to
avoid inductive and capacitive losses causing inaccuracies.
• Optionally, set Wiring Impedance to (W1 + W2) ohms. Include all wiring
resistances between the source and the points at which the voltage is
measured in the entered value for wiring impedance.
+ +
V
-
A or T
-
• Set V Burden Compensation to YES.
• If the current measurement terminals of the 2802 or the wire through the
CT (but not both) are reversed then set Reverse Current to YES,
otherwise set to NO.
• If the voltage measurement terminals are reversed, then set Reverse
Voltage to YES, otherwise set to NO.
• If using a current output CT then use the A terminals, otherwise use the T
connector, of the 2802. If using a current output CT and using the
internal line switch of the 2802, then take care to reduce the length of the
common wiring of the two signals to the A+ terminal of the 2802.

48 2801/2802 Power Analyzer User Guide
Using an External Current Transducer
When using the external current transducer, access the MAIN MENU by
pressing the MENU key. The analyzer can be configured for two types
transducers, the Current-to-Current or the Current-to-Voltage type. The
Current-to-Current type will be connected to the current input receptacles on
the rear panel. The Current-to-Voltage type will be connected to the T input
connection on the rear panel which is a BNC-Type connection.
The following diagram shows the recommended method for wiring up an
external current transducer to the 2801 or 2802.
of
Source
+
CT
-
Load
Optional
Wiring Loss
ohms
W
1
Wiring Loss
ohms
W
2
Figure 24. External Transducer Test Connections
To setup the unit for the type of current transducer being used, it is
recommended to use the GETTING STARTED routine under the MAIN
MENU. If not, then refer to the SETUP MEASUREMENTS/ SETUP
CHANNEL menu to configure the CURRENT INPUT and the CURRENT
SCALING for the type of current transducer used.
+ +
V
-
A or T
-
When the second choice SELECT CURRENT MEASUREMENT is
displayed, there are 3 choices from which to choose. Select choice 2 or 3

Using the Power Analyzer 49
depending on the type of current transducer being used. Use the ARROW
keys to highlight the choice and press ENTER to select
1 Internal Shunt (A terminals)
2 External CT (Current Out, A Terminals)
3 External CT (Voltage Out, T Connector)
The ENTER CURRENT RATIO 1 will now be displayed. Use the arrow
keys to change the highlighted item. Press the F1 or F2 keys to move the
highlight left or right. Use the DEL key to delete numbers and use the .X to
enter a decimal point. As an example, to set up a ratio of +1000 : 1.005 from
the default settings,
PERFORM THE FOLLOWING STEPS:
• Press the F2 key twice
• Press the DEL key once. The decimal point will disappear and the
screen will show +10 A.
• Press the F2 key once, the screen will show +100 A.
• Press the F2 key one more time, the screen will show +1000 A.
• Press the ENTER key.
The ENTER CURRENT RATIO 2 will now be displayed, set this for a
setting of 1.005 (as an example).
• Press the F2 key 4 times, the screen will show 1.000 V.
• Press the UP ARROW key 5 times, the screen will show 1.005 V.
• Press the ENTER key.
Complete any additional changes required to configure the analyzer for the
desired measurements.
Note the following-
1. If the power analyzer unexpectedly displays negative watts indications,
these indications mean that the current flow in the transducer is reversed.
Check for one of these conditions:

50 2801/2802 Power Analyzer User Guide
• the wire is reversed in the transducer;
• the neutral wire was inadvertently routed through the transducer
(instead of the live wire), or;
• the transducer output has the incorrect polarity.
The negative watts indication may be resolved by correcting the wiring, or by
setting the current input scale factor in the power analyzer to a negative
polarity, or by selecting REVERSE CURRENT INPUT from the WIRING
ADJUSTMENTS menu.
2. If a transducer is being used which has DC current capability then the
user should perform the DC ZERO procedure. This is performed after
making the connections and allowing the external transducer to settle after
application of its power.
3. Particularly when operating at low current levels, it may be important to
ensure that the voltage signals cannot capacitively couple into the current
transducer output. The use of flexible coaxial cable is recommended for
the current transducer output wiring.
Starting the Analyzer
The following startup display will show for a few seconds and then return to
the measurement display last used.
SERIAL N UMBER:
SERIAL N UMBER:
Figure 25. Startup Screen 2801 and 2802
Xitron 2801
MAIN v2.12/v1.01
ANALOG v2.11/v1.02/v1.02
FPGA v1.02
Xitron 2802
MAIN v2.12/v1.01
ANALOG v2.11/v1.02/v1.02
FPGA v1.02

Using the Power Analyzer 51
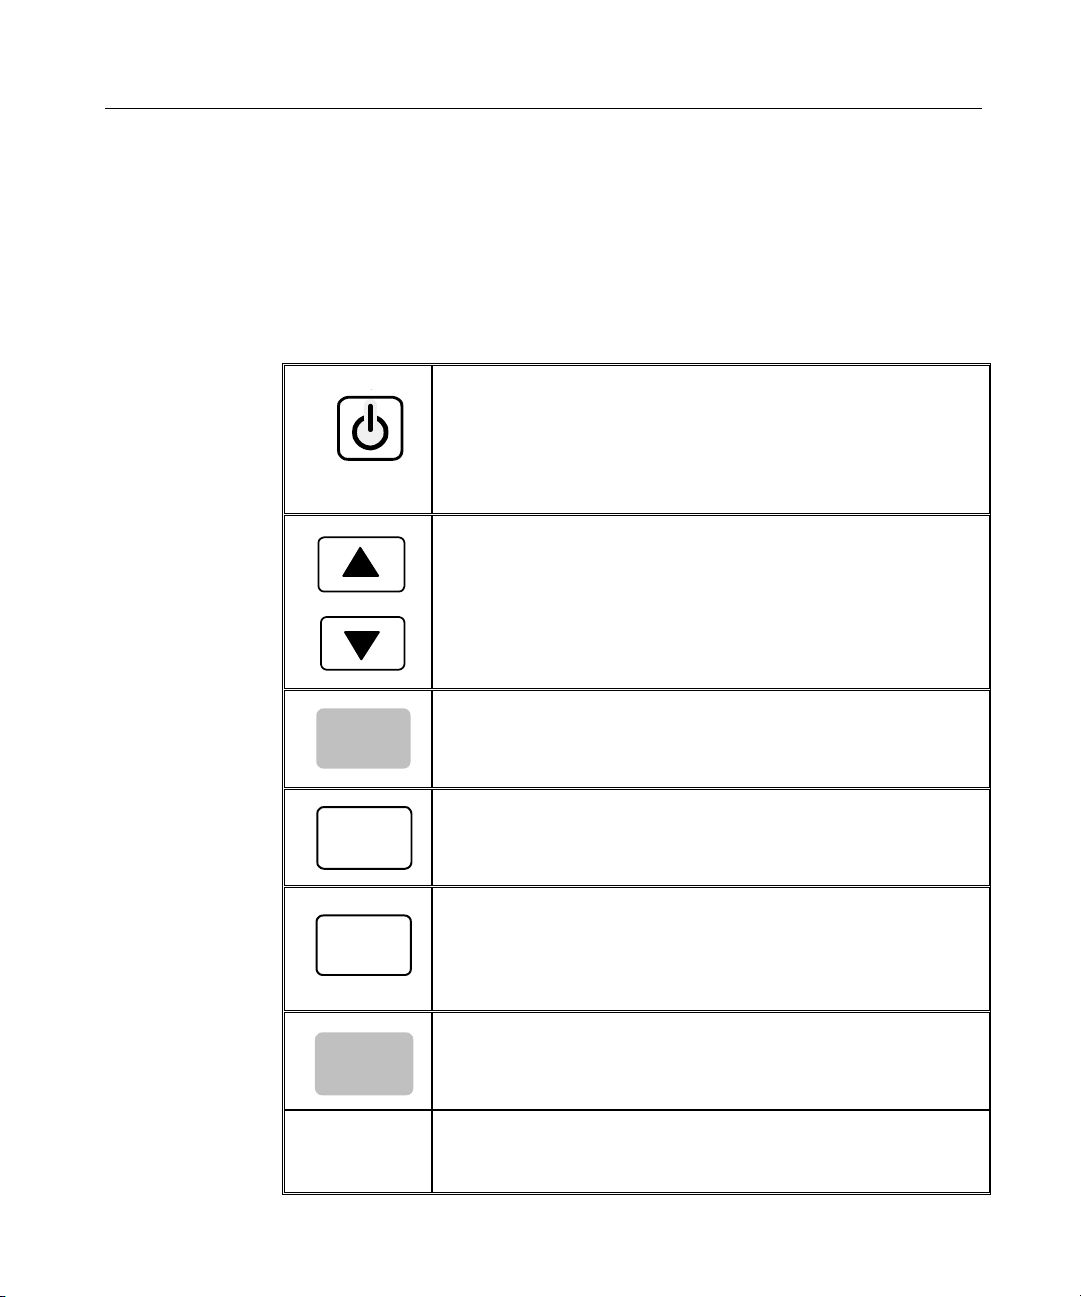
Configuring the Power Analyzer 2801/2802
The MAIN MENU screen gains access to the areas for setting up the
instrument. You will find the menus for the following routines –
2801
GETTING STARTED
SETUP MEASUREMENTS
SETUP SYSTEM
CONFIGURATION STORAGE
PERFORM DC ZERO
DIAGNOSTICS
ABOUT
2802
GETTING STARTED
CHANNEL CONFIGURATION
SETUP INPUT MEASUREMENTS
SETUP OUTPUT MEASUREMENTS
SETUP SYSTEM
CONFIGURATION STORAGE
PERFORM DC ZERO
DIAGNOSTICS
ABOUT
To gain access to the Main Menu, press the MENU key. This will bring up the
MAIN MENU screen display as shown below.
Figure 26. Main Menu Screen

52 2801/2802 Power Analyzer User Guide
Important Note: We recommend the GETTING STARTED setup
described below when setting up the 2801/2802 Power Analyzer for the
first-time.
Getting Started
The first item listed is GETTING STARTED. This is a listing of the preset
applications and predefined measurement settings that can be selected to
configure the 2801/2802. We recommend selecting the appropriate choice that
corresponds to your application when using the power analyzer for the first
time.
To initiate the Getting Started setup:
1. Press the up or down arrow key to highlight GETTING STARTED, press
the
ENTER key to view the application choices. The application in Bold
is the factory default setting
2801 APPLICATIONS
LINE (40Hz – 1kHz)
HF (40Hz-80kHz)
HF (10kHz-200kHz)
DC (40Hz-5kHz Ripple)
DC (nx50Hz Ripple)
DC (nx60Hz Ripple)
DC (nx400Hz Ripple)
LF (0.5Hz-20Hz)
LF (0.02Hz-5Hz)

Using the Power Analyzer 53
2802 APPLICATIONS
3Φ3w
2Φ3w
1Φ3w
DC:DC
DC:LINE
DC:HF
LINE:DC
LINE:LINE (SYNC)
LINE:LINE (ASYNC)
LINE:HF
DUAL:LINE (ASYNC)
DUAL HF (ASYNC)
2. Press the up or down arrow key to highlight the application that best fits
your intended use, press the
ENTER key to select your choice
Channel Configuration (2802 Only)
The second item listed is CHANNEL CONFIGURATION, this is used to set
how the channels will be used within the application. (Note. There is no need
to select one of these options if you had previously selected one of the
quick start choices)
This is a listing of the preset channel configuration settings that can be
selected to configure the 2802.
To initiate the CHANNEL CONFIGURATION setup:
1. Press the up or down arrow key to highlight CHANNEL
CONFIGURATION, press the
choices.
ENTER key to view the application

54 2801/2802 Power Analyzer User Guide
CHANNEL CONFIGURATION
3Φ3w
2Φ3w
1Φ3w
IN:OUT (ASYNC)
IN:OUT (SYNC)
INDEP CHANNELS
2. Press the up or down arrow key to highlight the application that fits your
intended use, press the
Configuring the Analyzer Measurement Results
This section gives a brief description of the menu selections from which to define the
desired measurements. The SETUP MEASUREMENT choices will vary depending
on which GETTING STARTED or CHANNEL CONFIGURATION has been
selected. Once in the setup menu the selections are listed in the order that they come
up on the analyzer display. Indentation is used to denote submenu position.
application in BOLD is the ship from factory default setting for the
2801/2802.
ENTER key to select your choice
The
For 2801 SETUP MEASUREMENTS is your only choice, for the 2802 and if the
application is set for
3Φ3w, 2Φ3w or 1Φ3w then the menu choice is
SETUP MEASUREMENTS
If the application is setup for DC:DC then the menu choice is
SETUP OVERALL MEASUREMENTS
SETUP INPUT MEASUREMENTS
SETUP OUTPUT MEASUREMENTS

Using the Power Analyzer 55
If the application is setup for DC:LINE, DC:HF, LINE:DC then the menu
choice is
SETUP INPUT MEASUREMENTS
SETUP OUTPUT MEASUREMENTS
If the application is setup for LINE:LINE (sync) then the menu choice is
SETUP OVERALL MEASUREMENTS
SETUP INPUT MEASUREMENTS
SETUP OUTPUT MEASUREMENTS
If the application is setup for LINE:LINE (async), LINE:HF then the menu
choice is
SETUP INPUT MEASUREMENTS
SETUP OUTPUT MEASUREMENTS
If the application is setup for DUAL:LINE (async), DUAL:HF then the
menu choice is (2802 Default setting)
SETUP Ch1 MEASUREMENTS
SETUP Ch2 MEASUREMENTS
To Select SETUP MEASUREMENTS 2801:
1. Press the
MENU key to bring up the MAIN MENU. The second
selection is SETUP MEASUREMENTS… Press the down arrow key
to highlight SETUP MEASUREMENTS.
2. Press the ENTER key to enter into the SETUP MEASUREMENTS,
as shown in Figure 26.

56 2801/2802 Power Analyzer User Guide
Figure 27. Measurement Configuration Screen
To Select SETUP MEASUREMENTS 2802:
3. Press the
MENU key to bring up the MAIN MENU. The third
selection is SETUP Ch1 MEASUREMENTS… from which Channel
One’s measurement settings are accessible.
4. Press the down arrow key to highlight SETUP Ch1
MEASUREMENTS.
5. Press the ENTER key to enter into the SETUP Ch1
MEASUREMENTS, as shown in Figure 27.
Figure 28. Measurement Configuration Screen
Setting Up the Measurement Configuration
There are six selections in the MEASUREMENT CONFIGURATION menu.
The following section defines each of the selections and the associated
submenu options available. Refer to the arrow on the side of this display and
scroll this menu down to access each one:

Using the Power Analyzer 57
RESULTS AVERAGING:
MEASUREMENT TYPE:
RANGING AND SCALING …
WIRING ADJUSTMENTS …
LINE SWITCH & INRUSH DETECTION …
WAVEFORM CAPTURE …
RESULTS AVERAGING
All displayed measurements can be averaged using a two-pole filter having a
user-selected time constant. This setting only affects the displayed
measurement results, it does not affect any charted measurement results.
• NONE; 10ms; 20ms; 50ms; 100ms; 200ms; 500ms; 1 Sec; 2 Sec; 5
Sec; 10 Sec; 20 Sec; 1 Min
MEASUREMENT TYPE
This menu item contains the following seven setup selections –
LINE FREQ (<1kHz)
Configures the analyzer to make optimal signal measurements at line
frequencies in the 40 to 1000Hz range. To accomplish this, the analyzer –
1) Synchronizes on the voltage waveform with frequencies in the range
of 40Hz to 1000Hz; and
2) Tracks the input signals using a low-pass filter where the filter corner
frequency automatically adjusts to maintain better than 5% accuracy at
200 times the fundamental frequency.
Note: When you enable autorange and a downrange is required, the
analyzer downranges at the rate of 20ms per range. LINE FREQ (401000Hz) is the recommended selection when making line measurements.

58 2801/2802 Power Analyzer User Guide
HIGH FREQ (>40Hz)
Configures the analyzer to make the optimal signal measurements at
frequencies higher than line frequency, in the range 40Hz to above
100kHz. The analyzer –
1) Synchronizes on the voltage waveform with frequencies in the range
of 40Hz to above 100kHz; and
2) Tracks input signals using no low-pass filtering.
Note: When you enable autoranging and a downrange is required, the
analyzer downranges at the rate of 20ms per range. HIGH FREQ (>40Hz)
is the recommended selection when making high frequency measurements
or for line measurements where a large amount of high frequency signal
content is present.
10kHz -200kHz
Configures the analyzer to make optimal signal measurements at
frequencies in the range 10kHz to 200kHz. To accomplish this, the
analyzer –
1) Synchronizes on the voltage waveform with frequencies in the range
of 10kHz to 200kHz; and
2) Tracks the input signals using a fixed low-pass filter where the filter
corner frequency is set to maintain better than 5% accuracy at 10kHz.
Note: When you enable autoranging and a downrange is required, the
analyzer downranges at the rate of 10ms per range. The 10kHz-200kHz
selection is recommended when making high frequency measurements.
The 10kHz -200kHz setting is not recommended for line measurements.
DC
Configures the analyzer to make optimal signal measurements at DC. To
accomplish this, the analyzer operates as follows.
1) When not configured for ripple measurements -
Measurements of DC and AC are made over 50ms periods. No harmonic
data is available. Frequency is not measured. Signals have a fixedcorner, 4kHz, low-pass filter applied.
2) When configured for ripple measurements –
All DC and non-harmonic AC measurements are made over the longer of
5ms (rounded upwards to the nearest integer number of cycles) or one

Using the Power Analyzer 59
cycle of the entered base ripple frequency. All harmonic data is measured
over the longer of 5ms (rounded upwards to the nearest integer number of
cycles) or four cycles of the entered base ripple frequency. Frequency is
not measured. Signals have a fixed-corner, low-pass filter applied with a
corner frequency equal to 200 times the entered base ripple frequency
Note: When you enable autorange and a downrange is required, the
analyzer downranges at the rate of 20ms per range. DC is the
recommended selection when making DC measurements.
USER SET
This selection brings up a menu choice in the Ch1 MEASUREMENT
CONFIGURATION that allows you to directly select USER SET
MEASUREMENT configuration parameters, which are automatically set
for the other selections. Refer to USER SET MEASUREMENT below.
Note: This USER SET selection is
not recommended for inexperienced
users.
LOW FREQ (0.5-20Hz)
Configures the analyzer to make optimal signal measurements at
frequencies less than line frequency, in the range 0.5 to 20Hz. To
accomplish this, the analyzer –
1) Synchronizes on the voltage waveform with frequencies in the range
of 0.5Hz to 20Hz; and
2) Tracks the input signals using a fixed low-pass filter where the filter
corner frequency is set to maintain better than 5% accuracy at 10kHz.
Note: When you enable autoranging and a downrange is required, the
analyzer downranges at the rate of 10s per range. The LOW FREQ (0.1100Hz) selection is recommended when making low frequency
measurements. LOW FREQ is not recommended for line measurements.
LOW FREQ (0.02-5Hz)
Configures the analyzer to make optimal signal measurements at
frequencies less than line frequency, in the range 0.02 to 5Hz. To
accomplish this, the analyzer –
1) Synchronizes on the voltage waveform with frequencies in the range
of 0.02Hz to 5Hz; and

60 2801/2802 Power Analyzer User Guide
2) Tracks the input signals using a fixed low-pass filter where the filter
corner frequency is set to maintain better than 5% accuracy at 10kHz.
Note: When you enable autoranging and a downrange is required, the
analyzer downranges at the rate of 10s per range. The LOW FREQ (0.02 5Hz) selection is recommended when making very low frequency
measurements. LOW FREQ is not recommended for line measurements.
USER SET MEASUREMENT…
The Following are the MENU choices for the
USER SET MEASUREMENT CONFIGURATION menu
HF FILTER TYPE:
SYNC SOURCE
MIN FUNDAMENTAL
MAX FUNDAMENTAL
MAX HARMONIC
DOWNRANGE DELAY
The following paragraphs define the above options.
• HF FILTER TYPE - NONE, ADAPTIVE CUTOFF OR FIXED
CUTOFF
• NONE: No HF Filter.
• Adaptive Cutoff HF Filter: This is a similar filter to that for the
Fixed Cutoff HF Filter, but the cutoff frequency is continuously
adjusted to maintain a specific ratio to the measured fundamental
frequency. Another name for this (and actually a better name) is a
Tracking Filter.
• Fixed Cutoff HF Filter: This provides a 4-pole Butterworth LP
filter which is 5% down at a defined, fixed, frequency.
• SYNC SOURCE
There are two selections for this entry –
FROM VOLTAGE
The analyzer measures the fundamental frequency from the

Using the Power Analyzer 61
signal content of the applied voltage signal. To measure the
fundamental in the applied voltage signal, enter both a maximum
fundamental frequency and a trigger level.
FROM CURRENT
This is similar to the FROM VOLTAGE selection, however,
uses the selected current input signal as the source of
fundamental frequency measurements. Most effective when used
where the voltage signal has complex frequency content. (e.g.
Use FROM CURRENT with switch-mode motor drives.)
• MIN FUNDAMENTAL
This option sets the lowest frequency to which the analyzer will
synchronize and sets the rate at which downranging occurs (if
ENABLED). Selecting an extremely low value makes auto-ranging
very slow, as the minimum down range interval is one period of this
settable frequency.
• MAX FUNDAMENTAL
This option sets the highest frequency to which the analyzer will
synchronize and determines the number of harmonics measurable.
• MAX HARMONIC
This sets the range of Harmonics that will be reported back. There are
two choices with in the menu, SET MIN and SET MAX.
• DOWNRANGE DELAY
This entry gives you control of the minimum time between successive
downranges when using autoranging. Typically set to one period of
the expected lowest frequency of any signal content (e.g. 20ms for
most measurements). However there may be cases where the applied
signal has considerable sub-fundamental signal content (e.g. a
computer may draw a varying current with a period of a few hundred
milliseconds, or a high frequency signal may have significant line
modulation). Note that to stop the analyzer from continuously
autoranging to accommodate these fast, regular, changes in signal, the
entry for the DOWNRANGE DELAY can be extended.
Note: Typically the analyzer can downrange up to two ranges per interval,
setting an overly lengthy MIN DOWNRANGE TIME can slow down
autoranging when traversing from the highest to the lowest range.
RANGING & SCALING
This menu item contains the following four setup selections –

62 2801/2802 Power Analyzer User Guide
VOLTAGE RANGE
This option allows the user to select AUTO (ranging) or a fixed range
to measure the voltage signal. When auto-range has been selected, the
actual range being used is displayed in parentheses after AUTO.
Selections: AUTO; 850V; 450V; 135V; 50V; 20V
Note : The instrument’s ability to safely withstand high voltages is
not affected by this selection.
CURRENT INPUT
This option allows the user to select whether the analyzer uses the
internal current shunt DIRECT (A INPUT), or an external transducer
having a voltage output (the BNC input, T), or an external transducer
having a current output (A INPUT) as the current signal.
TERMINALS (CURRENT): or TRANSDUCER (VOLTAGE): or
TRANSDUCER (CURRENT)
CURRENT RANGE
This option allows the user to select AUTO or a fixed range to be
used for measurements of the selected current signal. When autorange has been selected the actual selected range being used is
displayed in parentheses after AUTO.
AUTO; 65A; 20A; 6.5A; 2A; 0.65A; 300mA; 100mA; 30mA; 10mA
Transducer - AUTO; 15V; 5V; 1.5V; 0.5V; 0.15V.
Note: When using the internal current shunt and a fixed range of
300mA or lower, the analyzer does NOT have full ability to withstand
high current continuous overloads unless the analyzer is enabled to
up-range for protection (see the STRICT RANGING selection).
STRICT RANGING
This selection is only available if either the voltage, or current
input, (or both) has a fixed range selected. Setting this to NO
enables the analyzer to auto-range to a higher capability range than
that selected in order to protect itself from overloads. Setting this to
YES forces the analyzer to select the USER SET range.
NO or YES
CT RATIO
This option is only shown when the CT (A INPUT) or the CT (T
INPUT) is configured. This allows the user to apply a fixed scale
factor to all current measurements. This is normally used to adjust for

Using the Power Analyzer 63
the scale factor of an external current transducer.
CT RATIO SETTING
Press the DOWN arrow key to highlight CT RATIO, press the
ENTER key.
You can move the cursor in the window by using the F1 or F2 keys,
these keys will move the cursor left or right.
When the highlighted cursor is in the correct position, use the UP or
DOWN ARROW keys to change the highlighted number or symbol
Press the ENTER key when finished.
Note: You can press the CLEAR (F3) key to start over, or clear the
screen.
The INPUT scale is set first, when the ENTER key is pushed the CT
RATIO OUT screen will then be shown, repeat the above steps to
enter in the correct ratio number for the output setting.
Press the ENTER to key to finish entering in the CT RATIO
WIRING ADJUSTMENTS…
This selection brings up the WIRING ADJUSTMENTS menu –
Figure 29. Wiring Adjustments Menu Screen
o MEASURE
Select LOAD or SOURCE according to whether the “virtual”
voltage measurement point is closer to the load or to the source

64 2801/2802 Power Analyzer User Guide
from the analyzer.
LOAD or SOURCE
o WIRING COMPENSATE:
Setting this to YES enables the analyzer to adjust for any external
or internal wiring losses in the measurement of the voltage signal.
When set to YES an additional option becomes available –
WIRING LOSS.
NO or YES
o WIRING LOSS
Enter the estimated or measured external wiring impedance
between the point at which the analyzer’s actual voltage
measurements are being made and the point at which the desired
“virtual” voltage measurements should be made.
This is a four position, decimal point, milliohm unit of measure.
o COMPENSATE V BURDEN
Although very small, there is a finite current flowing between the
voltage terminals of the analyzer. Depending on the wiring
method, this current may flow through the current measuring
device (internal shunt or external transducer). If it is desired to
eliminate error in current measurements caused by this excess
signal, set this option to YES, which enables the analyzer to
automatically adjust the current signal for the current flowing in
the voltage terminals.
NO or YES
Note: When enabled this adjusts for the actual signal flowing in
the voltage terminals, in real-time.
o REVERSE VOLTAGE POLARITIES
Setting this to YES reverses the polarity of the voltage signal
being measured by the analyzer.
NO or YES
o REVERSE CURRENT POLARITIES
Setting this to YES reverses the polarity of the current signal
being measured by the analyzer.
NO or YES

Using the Power Analyzer 65
LINE SWITCH & INRUSH DETECTION
This option allows the user to define what type of signal is being controlled
by the internal line switch:
o NONE
If this is selected, the internal line switch is continuously held in
the ON state.
o INTERNAL
If this is selected, the internal line switch will turn on (when
commanded to do so) at the user-entered line switch phase of the
applied voltage signal and will turn off (when commanded to do
so) at the zero crossing of the current signal.
o EXTERNAL
If this is selected, an external line switch can be used to switch
signals without regard to phase or current state. The Digital I/O
can be used to control the external line switch (See SETUP
SYSTEM)
Note: Selecting DC when using an AC signal at large currents
may degrade the reliability of the analyzer.
TURN ON PHASE (Shows when INTERNAL is selected)
This option allows the user to select a user-defined phase of the input
voltage at which the line switch be turned on or a PRESET choice of
0°, 45°, 90°, 135°, 180°, 225°, 270° or 315°.
To set the TURN ON PHASE, press the ENTER key when TURN
ON PHASE is highlighted, you have the option to enter your own
value by using the F1, F2 keys to scroll the cursor right and left and
the use the up and down arrow keys to change the character.
To use one of the PRESET values, press the F4 key to enter the
PRESET menu, use the up and down arrow keys to highlight your
selection and press the ENTER key to select your choice. You can
then edit the number or press ENTER again to save and exit out of the
menu.
By pressing the F3 CLEAR key, this will clear your selection.

66 2801/2802 Power Analyzer User Guide
INRUSH CURRENT RANGE (Shows when INTERNAL is selected)
This option allows the user to select a fixed range to be used for
measurements of the selected current signal.
65A; 20A; 6.5A; 2A; 0.65A; 300mA; 100mA; 30mA; 10mA
INRUSH CURRENT TRIGGER ENABLE
• INRUSH CURRENT TRIGGER ENABLE
Setting this to YES enables the analyzer to capture INRUSH and
STARTUP screen captures based on user-defined current trigger
levels.
The Menu choices are NO and YES. These are set by pressing the
ENTER key when the INRUSH CURRENT TRIGGER ENABLE is
highlighted, use the up and down arrow keys to select NO or YES,
press ENTER to select.
When set to NO, the analyzer will use the line switch as the trigger to
capture data for the INRUSH and STARTUP screens.
The following guidelines can be used to setup the appropriate combination for
triggering the INRUSH and STARTUP charts.
1. When the LINE SWITCH is set to NONE and the INRUSH
CURRENT TRIGGER ENABLE is set to NO. Inrush & startup
capture is disabled.
2. When the LINE SWITCH is set to INTERNAL or EXTERNAL and
the INRUSH CURRENT TRIGGER ENABLE is set to NO. the
Inrush & Startup capture is triggered when the Line Switch is turned
on.
3. When the LINE SWITCH is set to NONE and the INRUSH
CURRENT TRIGGER ENABLE is set to YES. The user also has to
configure the inrush current trigger level (INRUSH DETECT
LEVEL). Inrush & Startup capture is triggered by an inrush current
detection.
4. When the LINE SWITCH is set to INTERNAL or EXTERNAL and
the INRUSH CURRENT TRIGGER ENABLE is set to YES. The

Using the Power Analyzer 67
user also has to configure the inrush current trigger level (INRUSH
DETECT LEVEL). Inrush & Startup capture is triggered when the
Line Switch is turned on and then waits for an inrush current
detection.
o Note: The inrush waveforms (voltage and current signals) are
always captured for a period of approximately 3ms before and
65ms after the trigger event. This data has a time resolution of
nominally 4.1us per point.
INRUSH DETECT LEVEL (Shows when INRUSH CURRENT TRIGGER
ENABLE is selected)
This option allows the user to select a user-defined trigger level for
the inrush current or PRESET choices of 100mA, 1A, 10A or 100A.
To set the preset INRUSH DETECTION LEVEL, press the ENTER
key when INRUSH DETECT LEVEL is highlighted. You have the
option to enter your own value by using the F1, F2 keys to scroll the
cursor right and left and the use the up and down arrow keys to
change the character.
To use one of the PRESET values, press the F4 key to enter the
PRESET menu, use the up and down arrow keys to highlight your
selection and press the ENTER key to select your choice. You can
then edit the number or press ENTER again to save and exit out of the
menu.
By pressing the F3 CLEAR key, this will clear your selection.
CAPTURE FILTERED WAVEFORM (Shows when INRUSH CURRENT
TRIGGER ENABLE is selected)
This option allows the user to configure the waveform capture system in the
analyzer. Waveforms are captured by the analyzer when an “event” occurs on
either the voltage or current signal. This event can be either a peak in the
actual signal or a peak in the “virtual” signal created by removing the

68 2801/2802 Power Analyzer User Guide
fundamental component.
The CAPTURE FILTERED WAVEFORM setting selects whether the
captured waveform is to be filtered or not -
The Menu choices are NO and YES. These are set by pressing the
ENTER key when the CAPTURE FILTERED WAVEFORM is
highlighted, use the up and down arrow keys to select NO or YES,
press ENTER to select.
• YES : the captured inrush waveform is filtered according to the
filtering selected by the measurement type (see below).
• NO : the captured inrush waveform is totally unfiltered (i.e. full
bandwidth of the product).
The filtering that is used for each measurement type is as follows, this
filtering applies to all measurements,
• MEASUREMENT TYPE = LINE : Uses an Adaptive HF Cutoff filter
with an upper cutoff (5% down) of the lower of 60kHz or twice the
maximum measured harmonic frequency.
• MEASUREMENT TYPE = HF : Uses a Fixed HF Cutoff filter with an
upper cutoff (5% down) at 200kHz.
• MEASUREMENT TYPE = 10kHz-200kHz : Uses no HF filtering.
• MEASUREMENT TYPE = USER SET : Filtering is set by the user.
• MEASUREMENT TYPE = DC : If uses a fixed frequency ripple
measurement - Uses a Fixed HF Cutoff filter with an upper cutoff (5%
down) at 200 times the user entered fixed ripple frequency, otherwise –
uses a Fixed HF Cutoff filter with an upper cutoff (5% down) at 4kHz.
• MEASUREMENT TYPE = 0.5-20Hz : Uses an Adaptive HF Cutoff filter
with an upper cutoff (5% down) of the lower of 14kHz or 100 times the
measured fundamental frequency.

Using the Power Analyzer 69
• MEASUREMENT TYPE = 0.02-5Hz : Uses an Adaptive HF Cutoff filter
with an upper cutoff (5% down) of the lower of 4kHz or 100 times the
measured fundamental frequency.
STARTUP (NOT SHOWN in the menus, this is for
information only)
To enable the STARTUP graph you must enable either the Line Switch or
turn on INRUSH CURRENT TRIGGER ENABLE to YES and set the
appropriate trigger level under the INRUSH DETECT LEVEL. This is found
under the MAIN MENU, SETUP MEASUREMENTS, LINE SWITCH &
INRUSH DETECTION.
Note: To get data on the INRUSH or STARTUP screen the unit must be
configured and set properly or the system will not trigger or show results on
the INRUSH and STARTUP graph screens.
The Startup Chart is not user settable. The STARTUP chart runs until the first
of the following occurs –
1. The chart is full (typically about 4 minutes)
2. The user turns off the Line Switch. The chart will run for about
350ms afterwards to ensure that the user can also see the “power
down” data.
STARTUP data is collected similarly to a history chart, so you can “inspect”
using the cursors to “zoom in” on a particular time span. To do this when
looking at the STARTUP graph, perform the following steps.
Press the CURSOR (F2) key, this will bring up the cursors.
Use the right or left arrow key to move the active cursor in the
display window, the CURSOR with the TRIANGLE on the top
and bottom of the cursor is the active cursor.
Press the CURSOR (F2) to toggle to the other cursor

70 2801/2802 Power Analyzer User Guide
Press ENTER to zoom into the data. The data that is between the
two cursors will fill the screen. This can be repeated to zoom in
further by repeating the above steps. Note: that the cursors will be
at the edge of the display windows each time you enter back into
the cursor window.
Press the ZOOM OUT (F3) key to zoom back out or you can
press the FULL SPAN (F4) key to exit back to the STARTUP
screen.
WAVEFORM CAPTURE
This menu item contains the following setup selections –
The WAVEFORM CAPTURE setting selects the signal on which the unit will
trigger when enabled.
The Menu choices are as follows.
NONE: Trigger is disabled
Vpeak: Unit will trigger on the voltage peak.
Vglitch: Unit will trigger on a voltage glitch or anomaly.
Apeak: Unit will trigger on a current peak.
Aglitch: Unit will trigger on a current glitch or anomaly.
These are set by pressing the ENTER key when the WAVEFORM
CAPTURE is highlighted. Then, press the ENTER key again to enter
into the menu choices. Use the up and down arrow keys to highlight,
then press ENTER to select.
Set the TRIGGER LEVEL.
Press the DOWN arrow key to highlight TRIGGER LEVEL, press the
ENTER key.
You can move the cursor in the window by using the F1 or F2 keys,
these keys will move the cursor left or right.

Using the Power Analyzer 71
When the highlighted cursor is in the correct position, use the UP or
DOWN ARROW keys to change the highlighted number or symbol
Press the ENTER key when finished.
Note: You can press the CLEAR (F3) key to start over, or clear the
screen.
Press the MENU key to exit back to the MEASUREMENT
CONFIGURATION menu, or keep pressing the MENU key to exit
back to the main display screens.
Setting Up the Ch2 Measurement Configuration (2802 Only)
There are four selections in the Ch2 MEASUREMENT CONFIGURATION
menu. The following section defines each of the selections and the associated
submenu options available. Refer to the arrow on the side of this display and
scroll this menu down to access each one:
RESULTS AVERAGING:
MEASUREMENT TYPE:
RANGING AND SCALING…
WIRING ADJUSTMENTS…
The configuration of these menus are identical to the methods described in the
section for Configuring the Analyzer’s Measurement Results.
Setup System
Access the SETUP SYSTEM MENU from the MAIN MENU. Press ENTER
at highlighted item to access.

72 2801/2802 Power Analyzer User Guide
The initial setup includes setting the correct date and time in the desired
format; adjusting the contrast and turning on the backlight, if necessary. Also
use this menu to configure the IEEE488 address, RS232 baud rate and
configure the DIGITAL I/O ports.
Setting Contrast and Backlight
Scroll through the 10 available contrast settings to determine the best one;
mid point is 5, 6, or 7. Select OFF for the backlight only if there is sufficient
external light to read the display.
DIGITAL I/0
Figure 30. System Menu Screen
The following are the available configurations for the DIGITAL I/O:
LINE ON INPUT
INTEGRATE INPUT
CLR INTEGRATE INPUT
LINE ON OUTPUT
INTEGRATE INPUT (CH2)
CLR INTEGRATION INPUT (CH2)
MEASUREMENT HOLD INPUT
Each of the above choices can be configured individually by highlighting your
selection, press ENTER, and use the UP or DOWN arrow key to select the
setting for this DIGITAL I/O port. The choices are
DISABLED
ACTIVE HIGH
ACTIVE LOW

Using the Power Analyzer 73
IEEE488 Address Setting
Select the appropriate IEEE-488 (GPIB) address from zero to 31 in
accordance with IEEE-488. The factory default setting is address 2.
RS232 Baud Rate Setting
Select the appropriate baud rate (RS-232). The choices that are available are
9600, 19200, 38400.57600, 115200 and 230400. The factory default setting is
115200.
Setting Date and Time
DATE
Select the correct date from a calendar format. Use the arrow keys to scroll
the highlight up and down. Use the F1 and F2 softkeys to scroll left and right.
The F3 softkey moves back one month and F4 moves forward one month.
Press ENTER when done.
TIME
Select the correct time in the default format. Use the arrow keys to increase or
decrease the number value. Use the F1 and F2 softkeys to move to a new
position. The factory default settings are in bold.
DATE FORMAT
Select the desired date format from the following choices:
MM/DD/YY 11/24/06
DD/MM/YY 24/11/06
MONTH DATE, YEAR November 24 2006
DATE MONTH YEAR 24 November 2006
TIME FORMAT
Select the desired time format from the following choices:
12 HOUR AM/PM 6:30:04PM
24 HOUR 18:30:04
LANGUAGE
Only ENGLISH is supported at this time.

74 2801/2802 Power Analyzer User Guide
Configuration Storage
Access the LOAD/SAVE CONFIGURATION from the MAIN MENU. Press
ENTER at highlighted item to access. There are 6 storage locations available.
They are numbered 1 through 6.
SAVE
To save configuration changes, highlight SAVE, press ENTER, scroll to the
configuration location in which you want to save your configuration and press
ENTER.
Figure 31. LOAD/SAVE Main Menu Screen
LOAD
To LOAD a previously saved configuration, press the ARROW key to select
LOAD and then press the ENTER key. The screen will change to LOAD
CONFIGURATION as shown below. Press the ARROW keys to scroll up or
down the choices.
Figure 32. Load Configuration Selection Screen

Using the Power Analyzer 75
ERASE
To ERASE a previously saved configuration, press the ARROW key to select
ERASE and then press the ENTER key. The screen will change to ERASE as
shown below. Press the ARROW keys to scroll up or down the choices.
Figure 33 Erase Configuration Selection Screen
Perform DC Zero
To initiate a DC ZERO, press the MENU key. Use the arrow keys up or down
to highlight PERFORM DC ZERO. Press the ENTER key and follow the
prompts.
NOTE: The T input BNC connector on the rear panel (external
transducer input) MUST be shorted using a 50 ohm BNC plug when
performing a DC ZERO.
Diagnostics
To perform DIAGNOSTICS, press the MENU key. Use the arrow keys to
highlight DIAGNOSTICS, press the ENTER key. Press the up or down arrow
Figure 34. DC Zero Screen

76 2801/2802 Power Analyzer User Guide
key to select from the choices LCD TEST; LED TEST; KEYPAD TEST;
PERFORMANCE.
The LCD TEST scans the pixels. This will continue until any one of the keys
is pressed, with exception of the LINE SWITCH key which is disabled while
in this menu.
The LED TEST will turn on and off the OVERLOAD LEDs and the LINE
SWITCH LEDs in a round robin format. This will continue until any one of
the keys is pressed, with exception of the LINE SWITCH key which is
disabled while in this menu.
The KEYPAD TEST is used to verify that the front panel keys are
operational. When a key is pressed, the key name will appear on the screen.
When the MENU key is pressed the name will flash on the screen and then
the screen will exit to the DIAGNOSTIC MENU.
Figure 35. Diagnostic Menu Screen
The PERFORMANCE screen provides the user with the present internal
instrument temperature and the temperature for which the EXT
CALIBRATION and DC ZERO were performed. If the internal temperature
has changed by more then +/- 5 Deg C, then it is recommended that the DC
ZERO procedure be followed.

Using the Power Analyzer 77
Figure 36. Performance Screen
About
The ABOUT screen displays the current firmware revisions and the
serial number of the unit.
Figure 37. About Screen

78 2801/2802 Power Analyzer User Guide
Default Settings
The following default settings for the 2801/2802 analyzer support the rear
panel’s wiring connection Method 1. Access the SETUP
MEASUREMENTS MENU from the MAIN MENU.
SETUP CHANNEL
MEASUREMENT TYPE LINE FREQ (<1kHz)
VOLTAGE INPUT AUTO
CURRENT INPUT DIRECT (A INPUT)
CURRENT RANGE AUTO
STRICT RANGING NO
CURRENT SCALING DISABLED
MEASURE LOAD
WIRING COMPENSATION NO
COMPENSATE V BURDEN NO
REVERSE VOLTAGE NO
REVERSE CURRENT NO
Note: Above 1kHz select HIGH FREQ; below 40Hz select LOW FREQ
SETUP WAVEFORM CAPTURE
TRIGGER ON VOLTS PEAK
TRIGGER LEVEL 500.00VPK
RESULTS AVERAGING 100mS
LINE SWITCH NONE
INRUSH CURRENT TRIGGER ENABLE NO

Using the Power Analyzer 79
SETUP SYSTEM MENU
CONTRAST 5
BACKLIGHT ON
DIGITAL I/O
IEEE-488 ADDRESS 2
RS-232 BAUD RATE 115200
SET DATE 8/1/06
SET TIME 09:01:36AM
DATE FORMAT MM/DD/YY
TIME FORMAT 12 HOUR AM/PM
LANGUAGE ENGLISH
Using the Line Switch and Inrush Capabilities
The following terms describe available settings for the Line Switch (Channel
1 only) and commands that can be initiated. All settings and commands can
be made from the front panel interface or by way of a control interface. Most
settings take affect on the next communication with the device-under-test.
Line On
A command initiated by pressing the front panel LINE ON/OFF key when the
LED is extinguished, or by means of a command issued via a control
interface. Note that this is not necessarily the state of the internal line switch.
Line Off
A command initiated by pressing the front panel LINE ON/OFF key when the
LED is illuminated, or by means of a command issued via a control interface.
Note that this is not necessarily the state of the internal line switch.
Rearm
A command initiated by pressing one of the front panel, F1 through F4 keys,
available when the LINE ON/OFF LED is illuminated, or by means of a
command issued via a control interface
Using the Line Switch
Make a signal connection to the device-under-test by pressing the front panel
LINE ON/OFF key with the internal line switch set to ENABLE. Its lighted
LED indicates connection.
CAUTION: When the line switch is set to DISABLED, it is actually held in
the ON (shorted) state. Do not connect the A+ and LINE terminals to different

80 2801/2802 Power Analyzer User Guide
circuits. It is best to use the A+ terminal only. The bolded items are default
settings.
Line Switch Inrush
On/Off
Key
LED Menu Control Trigger Detection
Table 1 Line Switch Options
On Lighted
Off Off
PRESET
PRESET
User Set
Disabled Line
Switch
AC (Phase
Programmable)
PRESET
PRESET
100mApk
1.0Apk;
10Apk;
100Apk;
Enabled
Disabled
Notes:
1) If the user is operating using the internal current terminals (A) and is either
using voltages above 500Vrms, or frequencies above 1kHz, then the Line
Switch must be set to the DISABLED state, otherwise damage could be
caused to the line switch in the long term.
2) Only use the Line Switch for switching DC, or AC with frequencies
between 40Hz and 600Hz. If the frequency being switched is outside of this
range then the switch will not reliably operate.
Inrush Detection
Detection of Inrush starts when the channel’s current waveform exceeds the
set level. Examples:
a): Detection occurs immediately, if the set level is zero and the internal line
switch is disabled
b): Detection occurs as soon as the LINE ON/OFF key is pressed, if the set
level is zero (or <Line Switch>) and the internal line switch is enabled.

Using the Power Analyzer 81
Inrush Enable
A setting that allows for the collection of Inrush waveforms and Startup data.
This setting can be disabled.
Inrush Period
Covers the first 65ms (nominally) after Inrush detection.
Inrush Range
A setting that allows the user to set a different current input range during the
Inrush Period than the one used when not in the Inrush Period.
Inrush Waveform
The voltage and current waveforms collected during the entire Inrush Period.
These waveforms are always collected during the Inrush Period when
enabled. The collected Inrush waveforms can be shown on the display,
printed, or retrieved from a control interface, at any time.
Startup Data
The measurements (e.g. Vrms, Arms, Watts etc.) collected during the Startup
Period. The collected Startup data can be shown on the display, printed, or
retrieved from a control interface, at any time.
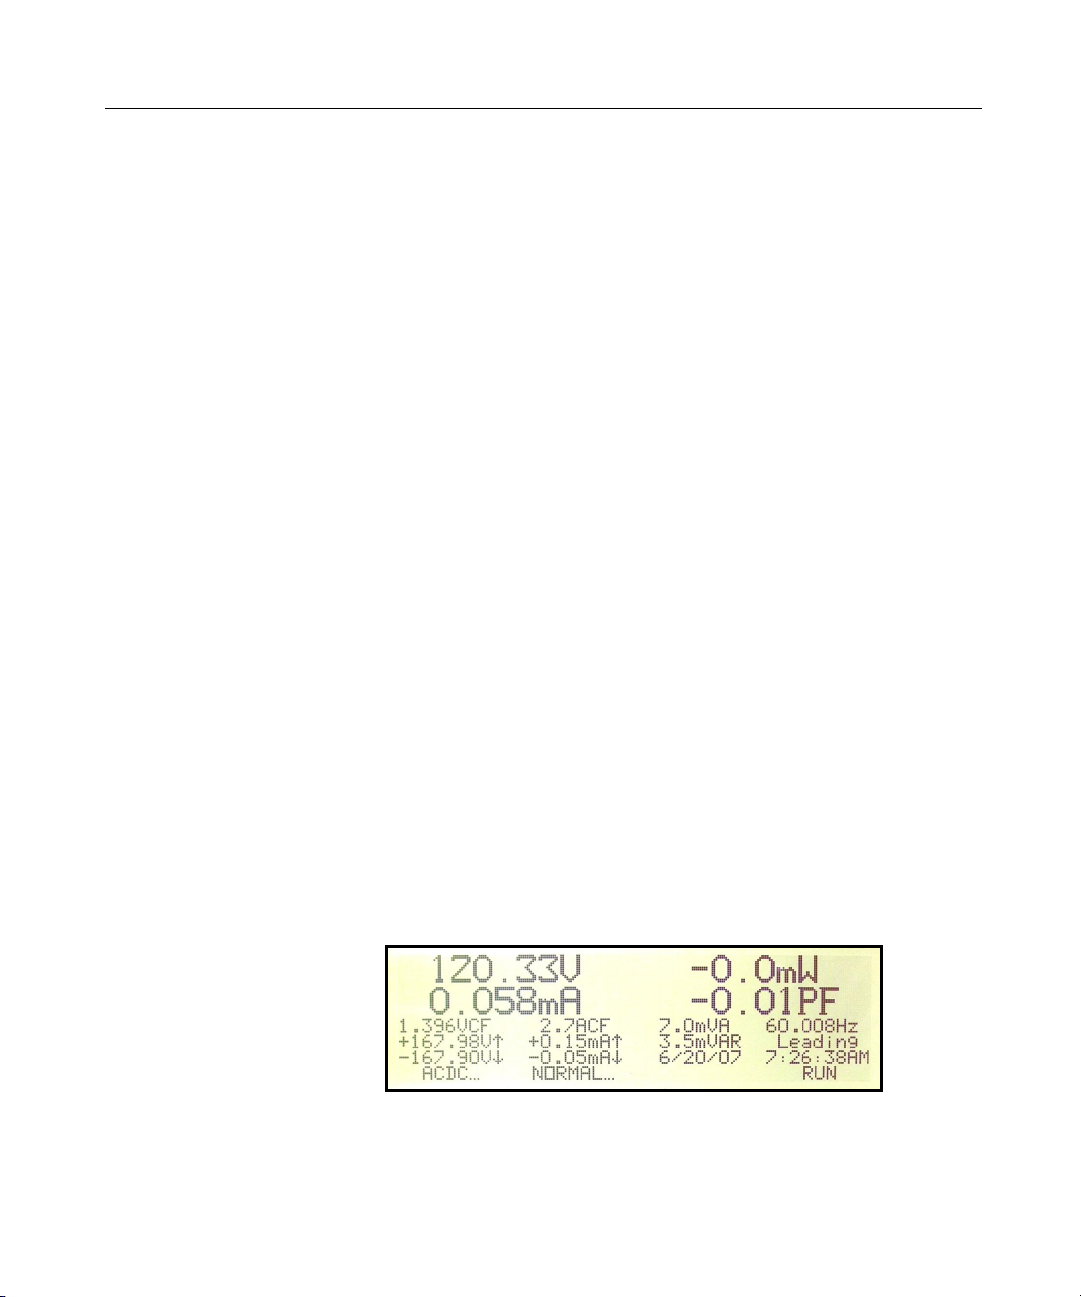
82 2801/2802 Power Analyzer User Guide
Display Screens
Viewing Measurement Results
This section describes the various Measurement Results display screens
available on the 2801/2802 Power Analyzer.
Numeric Display Screens
In a numeric display the labels for F1 (starting left) and F2 show the
measurement selection. As shown in Figure 37, the data displayed correlates
with ACDC and Normal. The F4 label showing “RUN” is an option. Shown
below is a display on “HOLD” where pressing F4 will continue updating the
data displayed.
a) Display Screens
In the Numerics screens, F1 allows selection of the desired
measurement to be displayed. All measurements are always available
all the time, the user simply selects the one to display. F2 allows for
the selection, from the list of parameters available, for the type of
measurement chosen.
i) Numerics
(1) ACDC (Total AC+DC signal, fundamental plus harmonics)
(a) Normal
Figure 38. ACDC Normal

Display Screens 83
(b) Inrush
Figure 39. ACDC Inrush
(c) Integrated
Figure 40. ACDC Integrated
(d) Integrated Average
(e) Integrated Maximum
(f) Integrated Minimum
(2) AC(rms)
(a) Normal
(b) Inrush
(c) Integrated
(d) Integrated Average
(e) Integrated Maximum
(f) Integrated Minimum

84 2801/2802 Power Analyzer User Guide
(3) DC
(a) Normal
(b) Inrush
(c) Integrated
(d) Integrated Average
(e) Integrated Maximum
(f) Integrated Minimum
(4) Rectified
(a) Normal
Figure 41. DC Normal
Figure 42. Rectified Normal
(b) Inrush
(c) Integrated
(d) Integrated Average
(e) Integrated Maximum
(f) Integrated Minimum

Display Screens 85
(5) Fundamental
(a) Normal
Figure 43. Fundamental Normal
(b) Integrated
(c) Integrated Average
(d) Integrated Maximum
(e) Integrated Minimum
(f) Load
(6) ΣHarmonics
(a) Normal
Figure 44. ΣHarmonics Normal
(7) DC Charge & Discharge
(a) Integrated
Figure 45. DC Charge & Discharge

86 2801/2802 Power Analyzer User Guide
(8) LOAD
Figure 46. DC Charge & Discharge
ii) Harmonics Bar Charts
(1) Volts
(a) Percent Log
(b) Percent Linear
(c) Absolute Log
(d) Absolute Linear
(2) Amps
(a) Percent Log
(b) Percent Linear
(c) Absolute Log
(d) Absolute Linear
(3) Watts
Figure 47. Harmonics % Log in Bar Chart
(a) Percent Log
(b) Percent Linear
(c) Absolute Log
(d) Absolute Linear

Display Screens 87
iii) Harmonics Listing
(1) Absolute
Use F2 and F3 to scroll from the Fundamental Harmonic to
the 100
th
.
Figure 48. Harmonics Absolute in List Form
(2) Percent
(3) Phase
iv) Waveforms
(1) Real-time
Figure 49. Real-time Waveform
(2) Distortion
Figure 50. Distortion Waveform
(3) Captured
(4) Glitch

88 2801/2802 Power Analyzer User Guide
Chart Displays
Starting Startup and Inrush Charts
As previously described, the Startup and Inrush charts are initiated by the
detection of an Inrush current and/or the turning on of the internal line switch.
Note that the reported Inrush Numeric Measurement results are the maximal
results collected during the period defined by the Startup chart.
The internal line switch can be disabled or enabled (for either DC or AC
operation) as configured by the user in the MEASUREMENT SETUP menu.
The user can set the Inrush Detection Level in the MEASUREMENT SETUP
menu, or it can be disabled by setting the detection level to zero.
The method used is dependent on the specific configuration chosen by the
user as follows.
Line Switch Disabled and Inrush Detection Disabled
In this case the Startup and Inrush Charts are disabled. Any data previously
captured is maintained in the 2801/2802 as long as power is turned on and the
user does not clear the chart.
Line Switch Disabled and Inrush Detection Enabled
In this case the Startup and Inrush charts are started whenever the actual peak
current waveform changes from having been continuously below the Inrush
Detection Level for at least 20ms to being above the Inrush Detection Level
for at least 4us. This is accomplished in a manner such that the Startup chart
cannot restart mid-way through a data collection (i.e. once the Startup and
Inrush charts have been started they will always run to completion while in
this mode).
Line Switch Enabled and Inrush Detection Disabled
In this case, the Startup and Inrush charts are started concurrently with
the line switch being turned on by the user. If using the Internal Line
Switch (either DC or AC mode), then the charts are started at the time
that the line switch actually turns on. Once started, the user can turn

Display Screens 89
off the line switch at any time; this has no affect on the collection of
data for the Startup and Inrush Charts. In this mode, if the user has
selected to use the Internal Line Switch (either DC or AC mode), and
the user has enabled auto-range on the current input, then the
2801/2802 automatically selects the uppermost range of the selected
current input just before it actually turns on the line switch. It then
returns the range to that selected by the user when either the inrush
chart has been fully collected or the line switch is turned off by the
user, whichever occurs first. The operation is the same when a range is
fixed, but the user has disabled strict ranging,
Line Switch Enabled and Inrush Detection Enabled
This is similar to the case with the Line Switch Enabled and the Inrush
Detection disabled, described above, the only difference being the addition of
not starting data collection until the Inrush detection level has been exceeded
after the line switch has been turned on by the user. Note that the current must
be below the Inrush detection level for at least 20ms before the 2802 will
allow a new chart to be started. If the current is not below this level prior to
turning on the line switch, no Startup or Inrush data collection will occur (the
line switch will operate, however).
Chart Formats
There are Chart display screens for History, Startup and Inrush data. The chart
screens include a labeled axis, the actual chart data plotted graphically, and
descriptive information regarding the chart. Optional chart data is available
through using the softkeys, which are labeled at the bottom.
The chart gives a graphical representation of the selected measurement results
plotted over time. The charts use time as the x-axis, with earlier time being to
the left and later to the right. The y-axis automatically scales to give the
fullest resolution for that measurement, with both the upper and lower limits
adjusted dynamically. In all cases, the upper limit is greater than the lower
limit.
Viewing Modes
There are two x-axis modes of viewing the chart data, Normal and Inspect.
These two viewing modes are accessed using the CURSOR F2 softkey.

90 2801/2802 Power Analyzer User Guide
Pressing F2 when viewing a chart display will enter you into the Inspect
Mode and enable the cursors for inspecting the data..
Normal viewing mode: In this mode the selected data covers a time span
equal to the extent of the data collected. The reference date/time and the
total time span being shown are included on the chart screen. While in
this mode the viewed chart is continuously updated with the latest
available data.
Inspect viewing mode: In this mode the user is able to view a portion of the
data shown in Normal viewing mode. It enables the user to zoom in
using the cursors to select the portion of the history data to inspect. The
cursors can be used to zoom in to a particular area or can be moved
within the display screen by using the Left (F3) softkey or the RIGHT
(F4) softkey. To ZOOM into the selected area press the ENTER key,.
The displayed data is the data between the two cursor settings. The user
can zoom in further by using the cursors again to select the area to be
inspected and pressing ENTER to zoom into this section, this can be
done until the unit reaches its resolution point.
When in the inspect mode the user can use the ZOOM OUT (F3)
softkey to ZOOM back out a level at a time or can use the FULL-SPAN
(F4) key to exit back to the normal viewing screen.
The reference date/time, the time offset to the leftmost data displayed
and the time span being displayed are all included on the chart. The
data viewed in this mode is only computed when the scroll offset or the
zoom level is changed, thus any changes to the chart occurring (e.g. a
new startup and inrush chart being started) may not become evident
until one of these is changed.
Data is unavailable whenever no measurements are being made, whether due
to ranging operation or due to user hold of measurements. Note that a user
hold of measurements is different from a user hold of the chart. The y-axis is
drawn as a vertical solid line at the leftmost end of the chart, with tick marks
extending left from the axis and with the associated y scale values next to the
tick marks. These tick marks are at the lowermost, center and uppermost
pixels, with the actual value corresponding to the center point of each pixel
row in the displayed chart. The chart extends to an odd number of pixels in
both X and Y directions.
For the STARTUP and HISTORY screens the data that is displayed can be
shown in the EXTENTS or the TRENDS mode. EXTENTS is the maximum

Display Screens 91
and minimum for each measurement period and the TREND is the averaged
or smoothed data. This is selected by pressing the F1 key and moving the
cursor to EXTENTS OR TREND. Press the ENTER key and use the UP or
DOWN arrow key to select EXTENTS or TREND. Press the ENTER key
when finished.
Figure 51. No Inrush Detected
History Charts
The History chart is always running and does not need configuring by the
user. The data collected by the History chart is all of the basic measurement
results (e.g. Vrms, Vac, Vdc, Arms, Watts) including fundamental, percent
THD, and internal temperature results. Data is collected as new results
become available, any data that is unknown, whether because of the lack of a
reference signal (e.g. for frequency or harmonic data), or due to range
changing, or after pressing the HOLD softkey the measurements, are not
charted. Unknown data is shown as a “blank” spot in the chart, the relative
timing of all data is always accurate within the resolution limits of the chart.
The date and time at which the chart was last started is saved as the chart
reference date/time. This date is made available (i.e. the chart is manually
cleared or the 2801/2802 power was turned on), as is the total time span
covered by the chart (always the difference between the reference date/time
and the present date/time). Data is viewable with a typical time resolution of
1 cycle or 0.1% of the age of the data (whichever is larger).
As data becomes limited in time resolution due to age, the data is set to the
average (except peak results) or the highest (peak results) measurement in the
resolution limited period. This action tends to “smooth” the chart for nonpeak results as the time span covered becomes longer because the history
chart is always plotted with the time resolution determined by the oldest
displayed data. If the user zooms in to only show more recent data (using the
inspect mode), then the time resolution can be regained.

92 2801/2802 Power Analyzer User Guide
For the History chart in Normal viewing mode, all of the available history
data is shown. Note that the right end of the scale shows the most recent data
and the left end value of the x-axis is fixed at the time at which the data
collection was started.
Figure 52. History of Amps ACDC, Trend in Full View
Figure 53. History of Amps ACDC, Extents in Full View
Figure 54. History of Amps ACDC, Trend in Zoom Mode
Figure 55. History of Amps ACDC, Trend; Scrolled

Display Screens 93
Figure 56. History of Amps ACDC, Extents in Zoom Mode
The following is a list of available data for the History charts. The
data to be displayed is selected by pressing the F1 key which will
enter you into the HISTORY CHART DATA menu.
Use the UP or DOWN arrow key to highlight MEASUREMENT
if it is not highlighted, press the ENTER key to view the available
display types, use the UP or DOWN arrow keys to scroll through
the choices and press the ENTER key to select, the following are
the available choices.
VOLTS
AMPS
WATTS
VA
VAR
PF
FREQUENCY
TEMPERATURE
The TYPE of data to be displayed can be set in the HISTORY
CHART DATA. The TYPE can be found by pressing the F1 key
which will enter into the HISTORY CHART DATA menu.
Use the UP or DOWN arrow key to highlight TYPE if it is not
highlighted, press the ENTER key to view the available display
types, use the UP or DOWN arrow keys to scroll through the
choices and press the ENTER key to select, the following are the
available choices.

94 2801/2802 Power Analyzer User Guide
ACDC
AC
DC
FUNDAMENTAL
PERCENT THD
PEAK
PEAK AC
Startup Charts
The Startup chart maintains a record of the same set of measurement results as
the History chart, but is started and stopped depending on the detection of an
Inrush current and/or by turning on the internal Line Switch (depending on
configuration). The date/time at which the chart was started is saved as the
reference date/time for startup charts. Data is viewable with a typical time
resolution of 1 cycle or 0.1% of the pre-configured startup chart period
(whichever is larger).
The Startup period is factory set to approximately 4 minutes. Data is
collected over this time at full resolution.
In the case of the Startup and Inrush charts the operation is fundamentally the
same as that for the History chart, however the left and right end values of the
x-axis are set by scroll and zoom. When plotting the measured data, there may
be periods of time for which the data was unavailable. In those cases, no data
is charted for the affected period(s) of time.
In the Startup chart format, the x-axis in Normal viewing mode is sufficient to
cover the startup period.
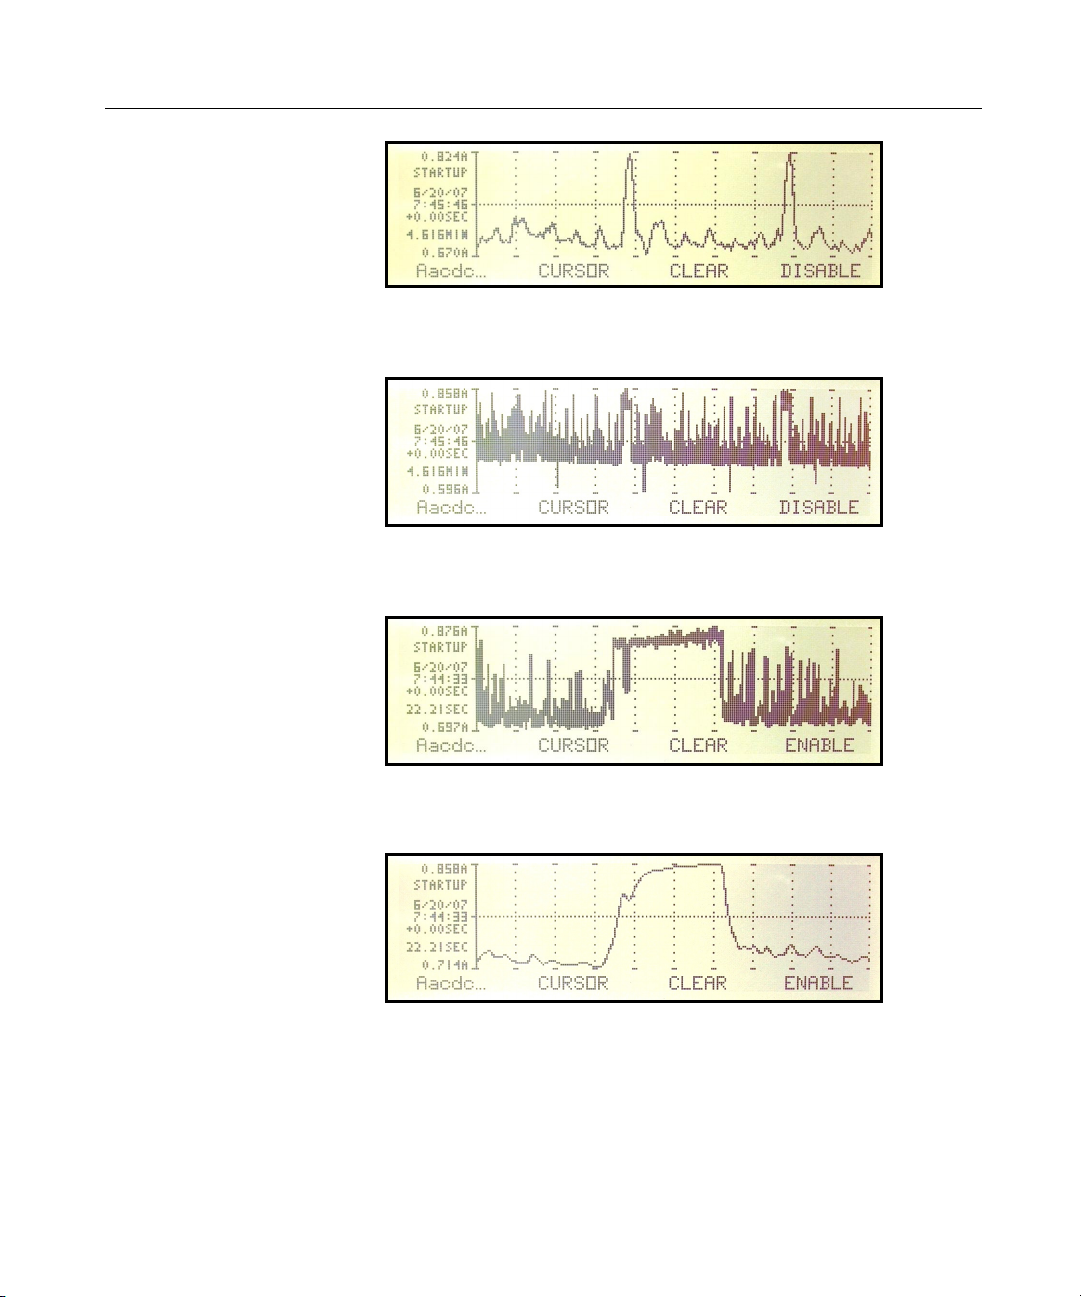
Display Screens 95
Figure 57. Startup in Full View, Trend
Figure 58. Startup in Full View, Extents
Figure 59. Startup, Partial, Extents
Figure 60. Startup, Partial, Extents

96 2801/2802 Power Analyzer User Guide
The following is a list of available data for the STARTUP charts.
The data to be displayed is selected by pressing the F1 key which
will enter you into the HISTORY CHART DATA menu.
Use the UP or DOWN arrow key to highlight MEASUREMENT
if it is not highlighted, press the ENTER key to view the available
display types, use the UP or DOWN arrow keys to scroll through
the choices and press the ENTER key to select, the following are
the available choices.
VOLTS
AMPS
WATTS
VA
VAR
PF
FREQUENCY
Figure 61. Startup in Zoom Mode
The TYPE of data to be displayed can be set in the STARTUP
CHART DATA. The TYPE can be found by pressing the F1 key
which will enter into the HISTORY CHART DATA menu.
Use the UP or DOWN arrow key to highlight TYPE if it is not
highlighted, press the ENTER key to view the available display
types, use the UP or DOWN arrow keys to scroll through the
choices and press the ENTER key to select, the following are the
available choices.
ACDC
AC

Display Screens 97
DC
FUNDAMENTAL
PERCENT THD
PEAK
PEAK AC
Inrush Charts
The Inrush chart maintains a record of the actual current and voltage
waveforms from a time nominally 3ms prior to the detection of an Inrush
current and/or by the turning on of the internal line switch (depending on
configuration) to nominally 65ms afterwards. Data is viewable with a typical
time resolution of 4.1 microseconds.
The Inrush chart is not capable of capturing data during a change in range. In
order for an Inrush chart to be produced, the user must ensure that no ranges
occur during this period of time.
Figure 62. Range Change
The date/time at which the chart was started is saved as the reference
date/time for Inrush charts (note that this is the same reference date/time as
for the startup chart).
The Inrush chart format, the x-axis in Normal viewing mode is sufficient to
cover the nominal 68ms inrush event, which cannot change while data is
being collected. Note that the left end of the scale is fixed in time relative to
the time of the inrush event and all data is placed in accordance with age
relative to that time. For the Inrush chart Y-axis, the center value will always
be zero, and thus the upper and lower data will always be of the same value
but with opposite polarities.
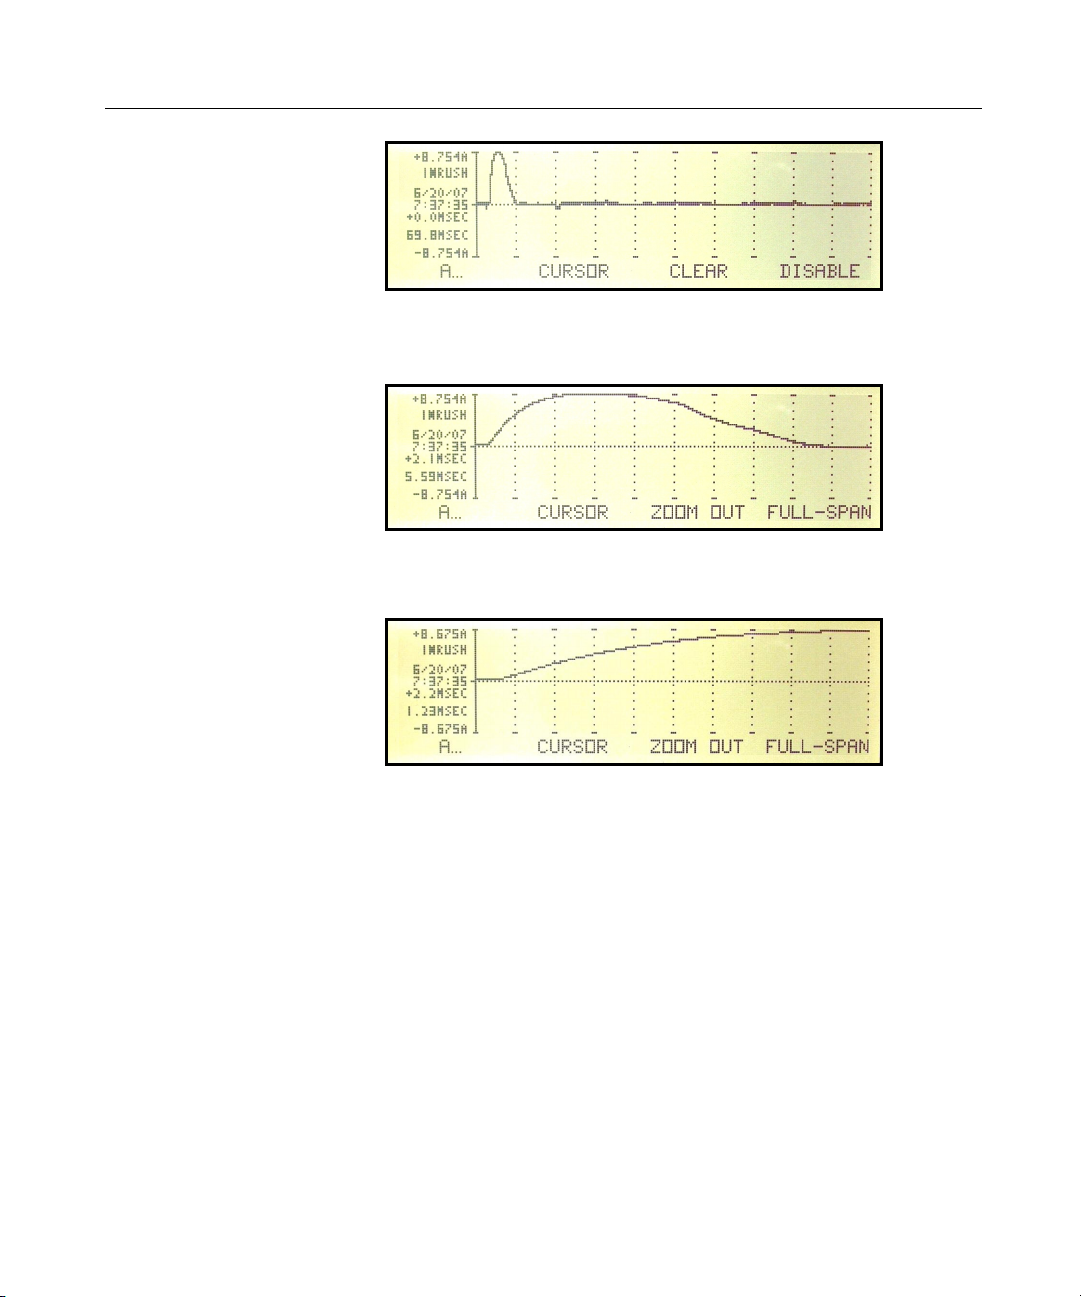
98 2801/2802 Power Analyzer User Guide
Figure 63. Amps Inrush in Normal Mode
Figure 64. Inrush in Zoom Mode
Figure 65. Inrush in Zoom Mode, Additional Zoom Level
The following is a list of available data for the INRUSH charts.
The data to be displayed is selected by pressing the F1 key which
will enter you into the INRUSH CHART DATA menu.
Press the ENTER key to view the available display types, use the
UP or DOWN arrow keys to scroll through the choices and press
the ENTER key to select. the following are the available choices.
VOLTS
AMPS

Printing Results
This chapter illustrates some of the various printouts available using the
2801/2802. Each printout reflects the data from the display group presently
viewed.
Sample Printouts
.
A text or graphic print is immediately initiated when the PRINT key is
pressed for ea
Every printout includes—
• Descriptiv
• Configuration selections
• Current date (month, day, year)
• Calibrated date
• Time in hours : minutes : seconds
• Elapsed time
• Vitrek 2801 or 2802 model number
• Firmware Version number
ch of the results display screens.
e title of the data
Printing Results 99
The samples provided have been printed from each of the display groups
Basics, Harmonics, Waveforms, and History.
• All the data viewed in the Basics group of displays will print on one page.
• The Harmonics LISTING data, including ABS, PCT, and PHASE will
n one pa
print o
ge. .

100 2801/2802 Power Analyzer User Guide
• The Harmonics BARGRAPH data will print separate bar charts for ABS, %, Lin
or Log for current or voltage.
• For the Waveforms group, volts, amps and power waveforms will print together
if a graphical print is selected. If a text only printer is selected, then volts and
amps will print together.
• Voltage and current Waveforms for PEAK, DIST and GLITCH captures will
print separately.
• Each History display will print a full page of graphically formatted data. .
The following pages illustrate the sample printouts.
 Loading...