

Page 1
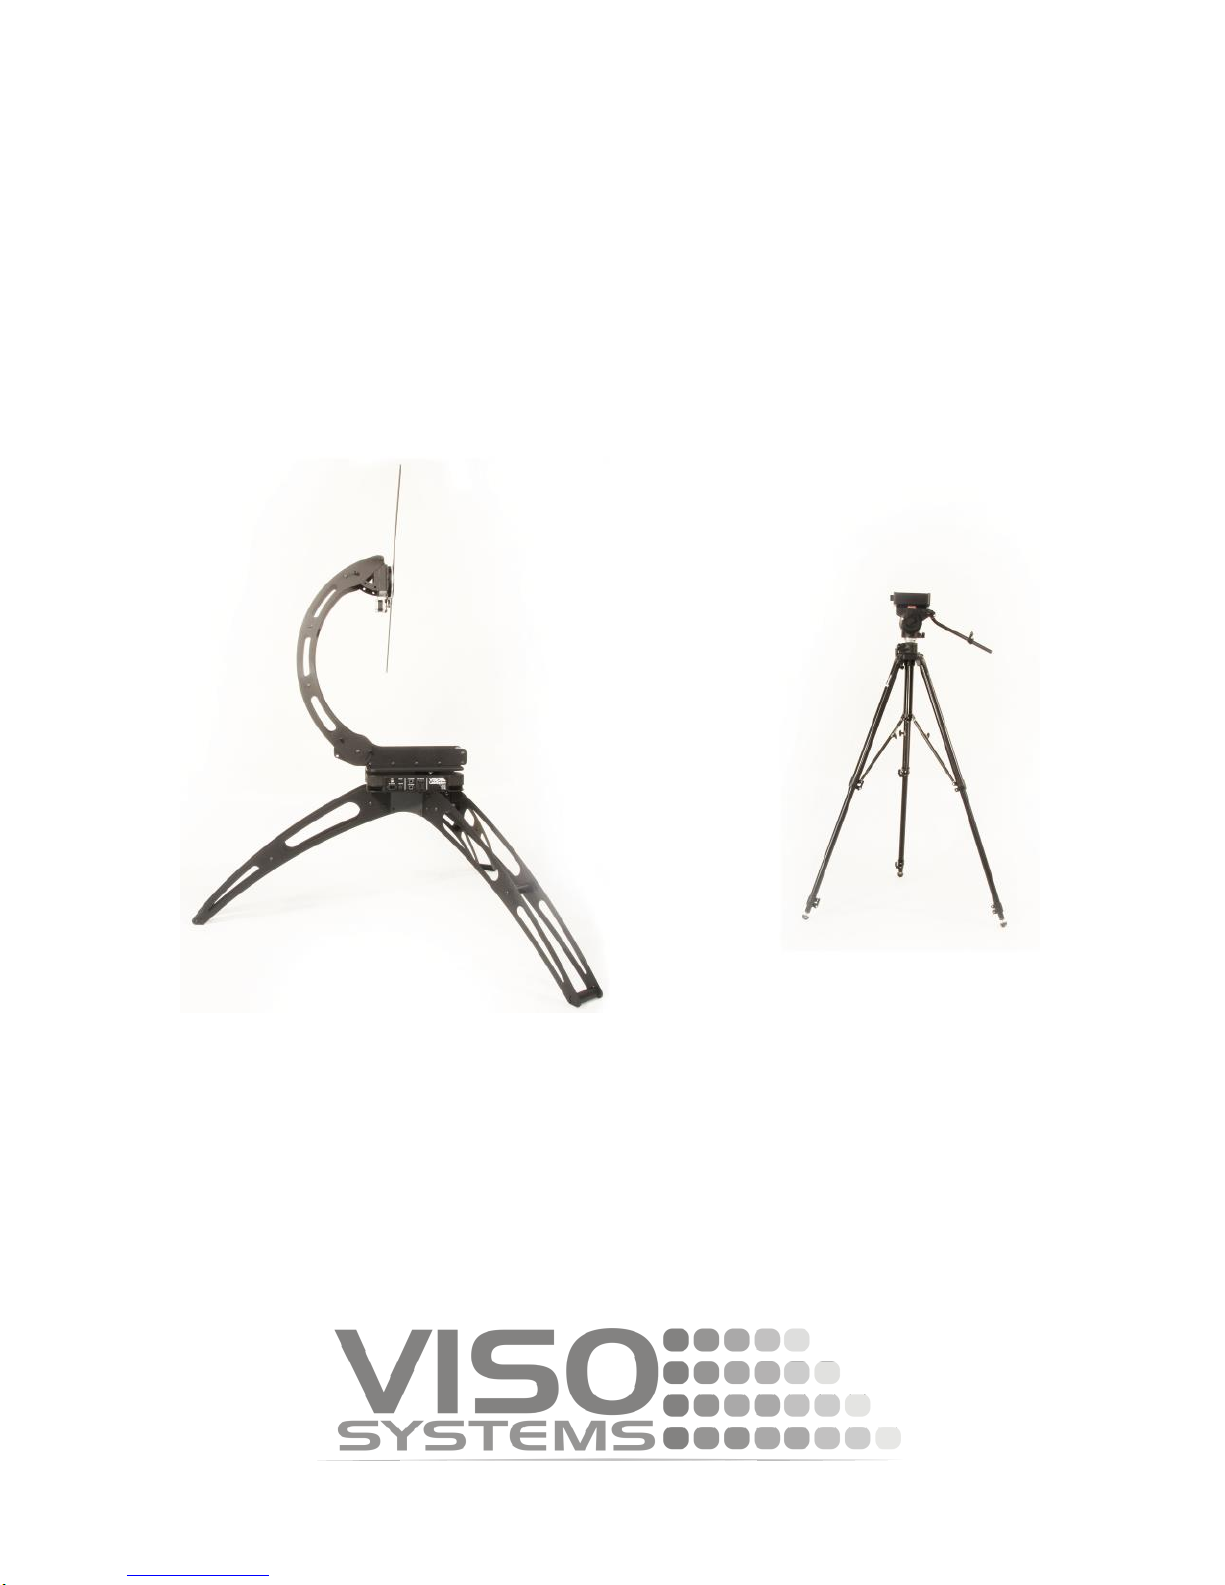
LabSpion
Patent pending
User guide
Preliminary edition
Last edited: 2014-04-22
Page 2
© 2007 Viso Systems ApS, Denmark
All rights reserved. No part of this manual may be reproduced, in any form or by any means,
without permission in writing from Viso Systems ApS, Denmark.
Information subject to change without notice. Viso Systems ApS and all affiliated companies
disclaim liability for any injury, damage, direct or indirect loss, consequential or economic loss
or any other loss occasioned by the use of, inability to use or reliance on the information
contained in this manual.
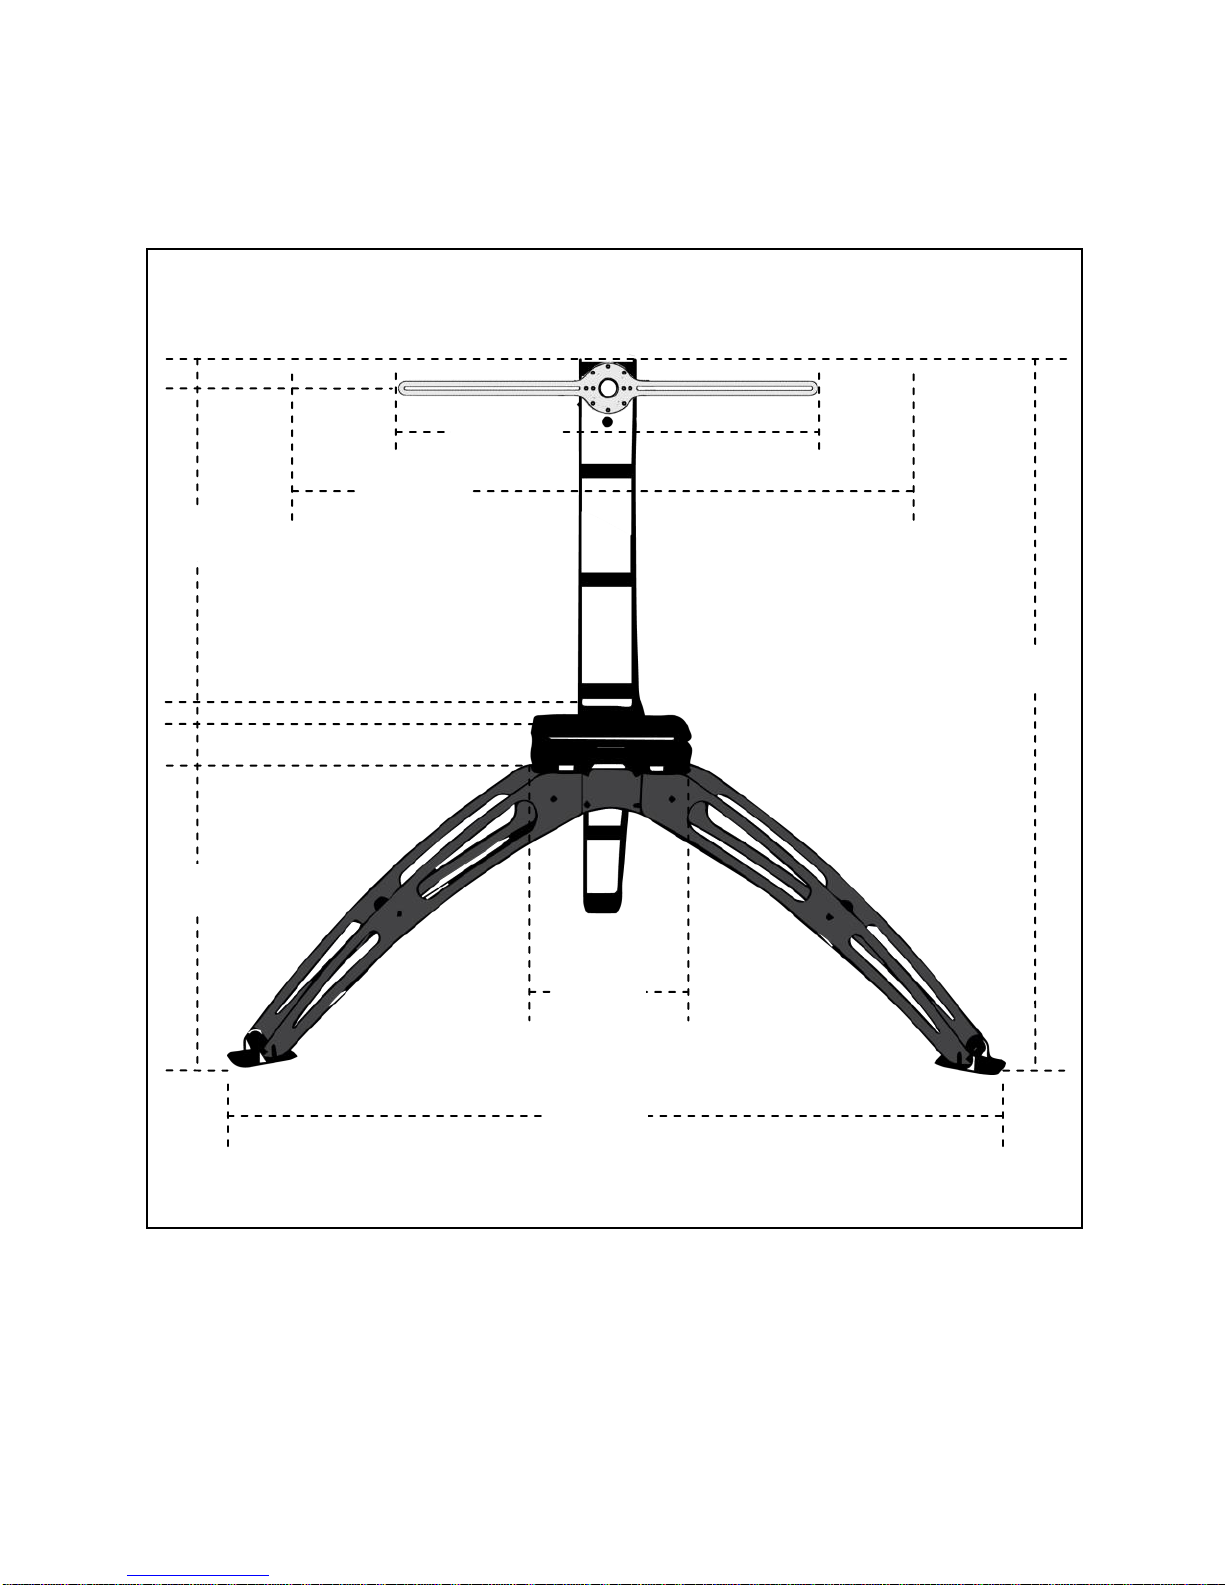
Dimensions
190cm
162,5cm
80cm
45cm
122cm
150cm
Maximum lamp length
8cm C-plane base height
9,5cm LabSpion base height
65cm
Page 3
3 LabSpion user guide
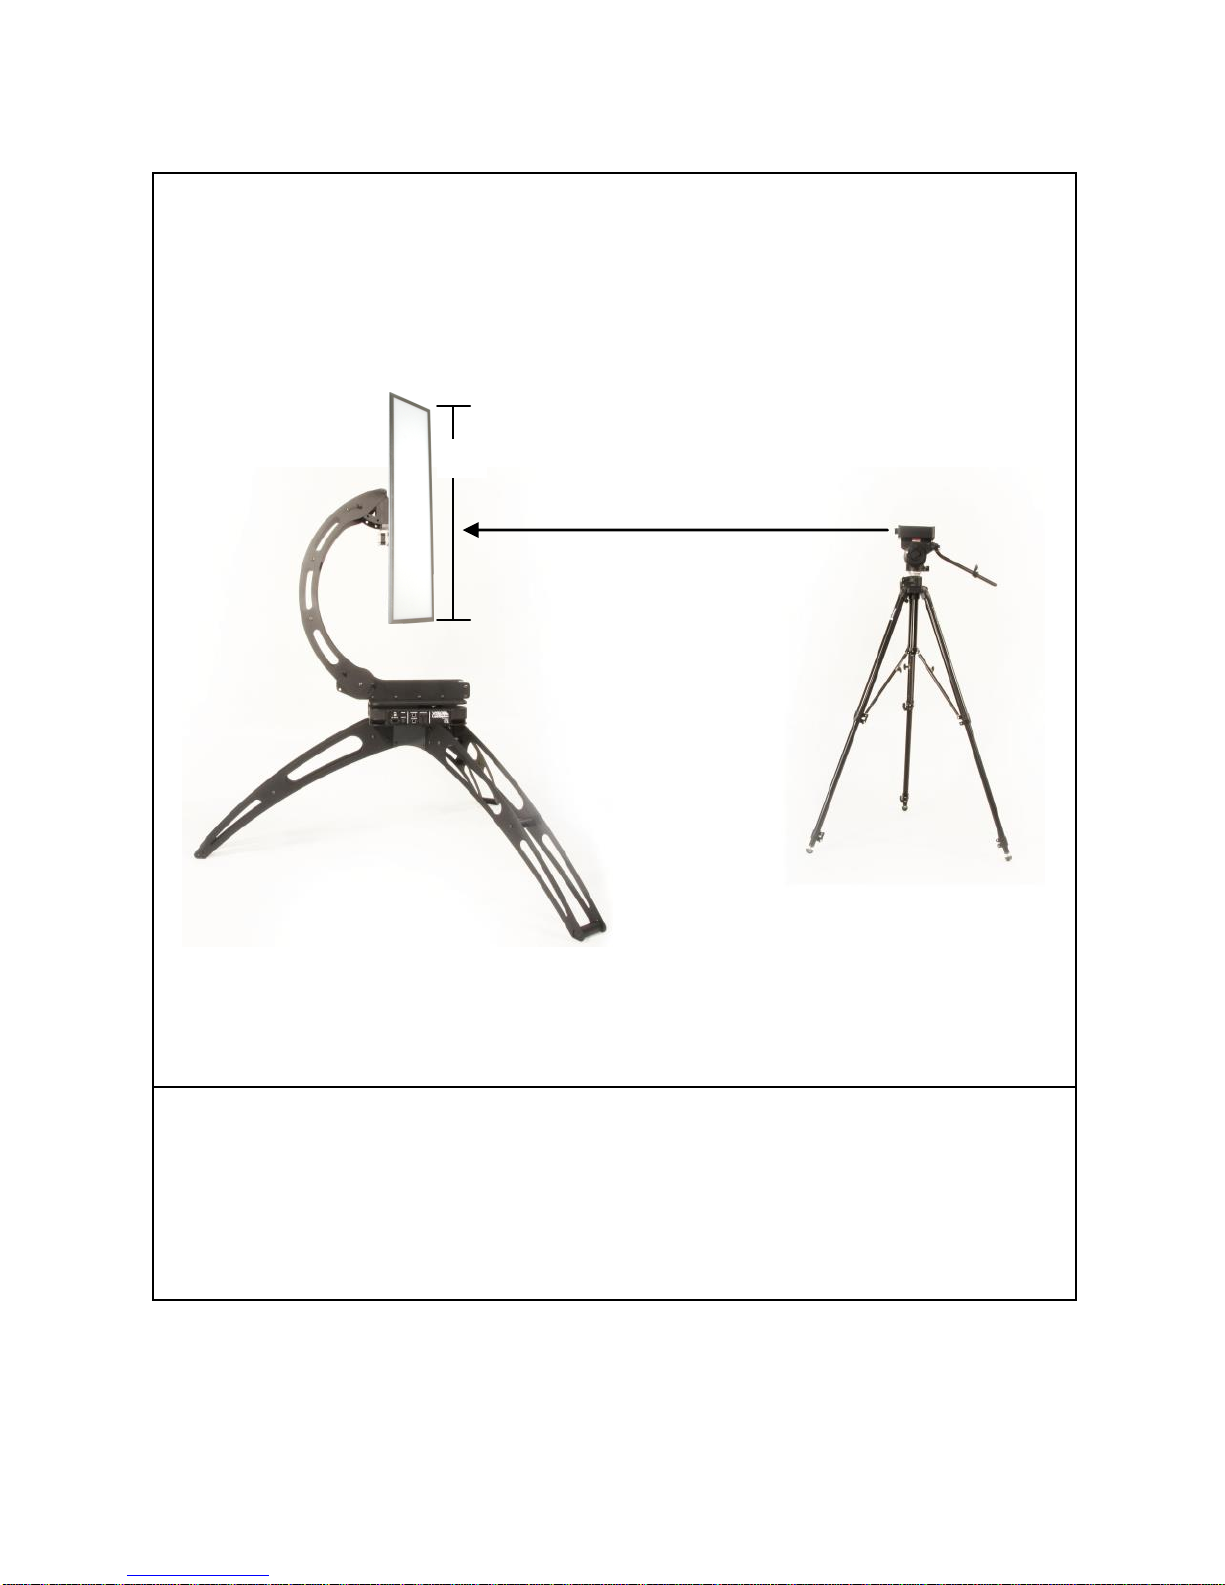
Sensor distance L
Measurement method: Far Field
D
L = 10 x D
Please note the sensor distance to the lamp must be minimum 10 x
the diameter of the lamp.
The ”Far Field” measurement method requires this distance for
accurate measurement data.
Page 4
4 LabSpion user guide
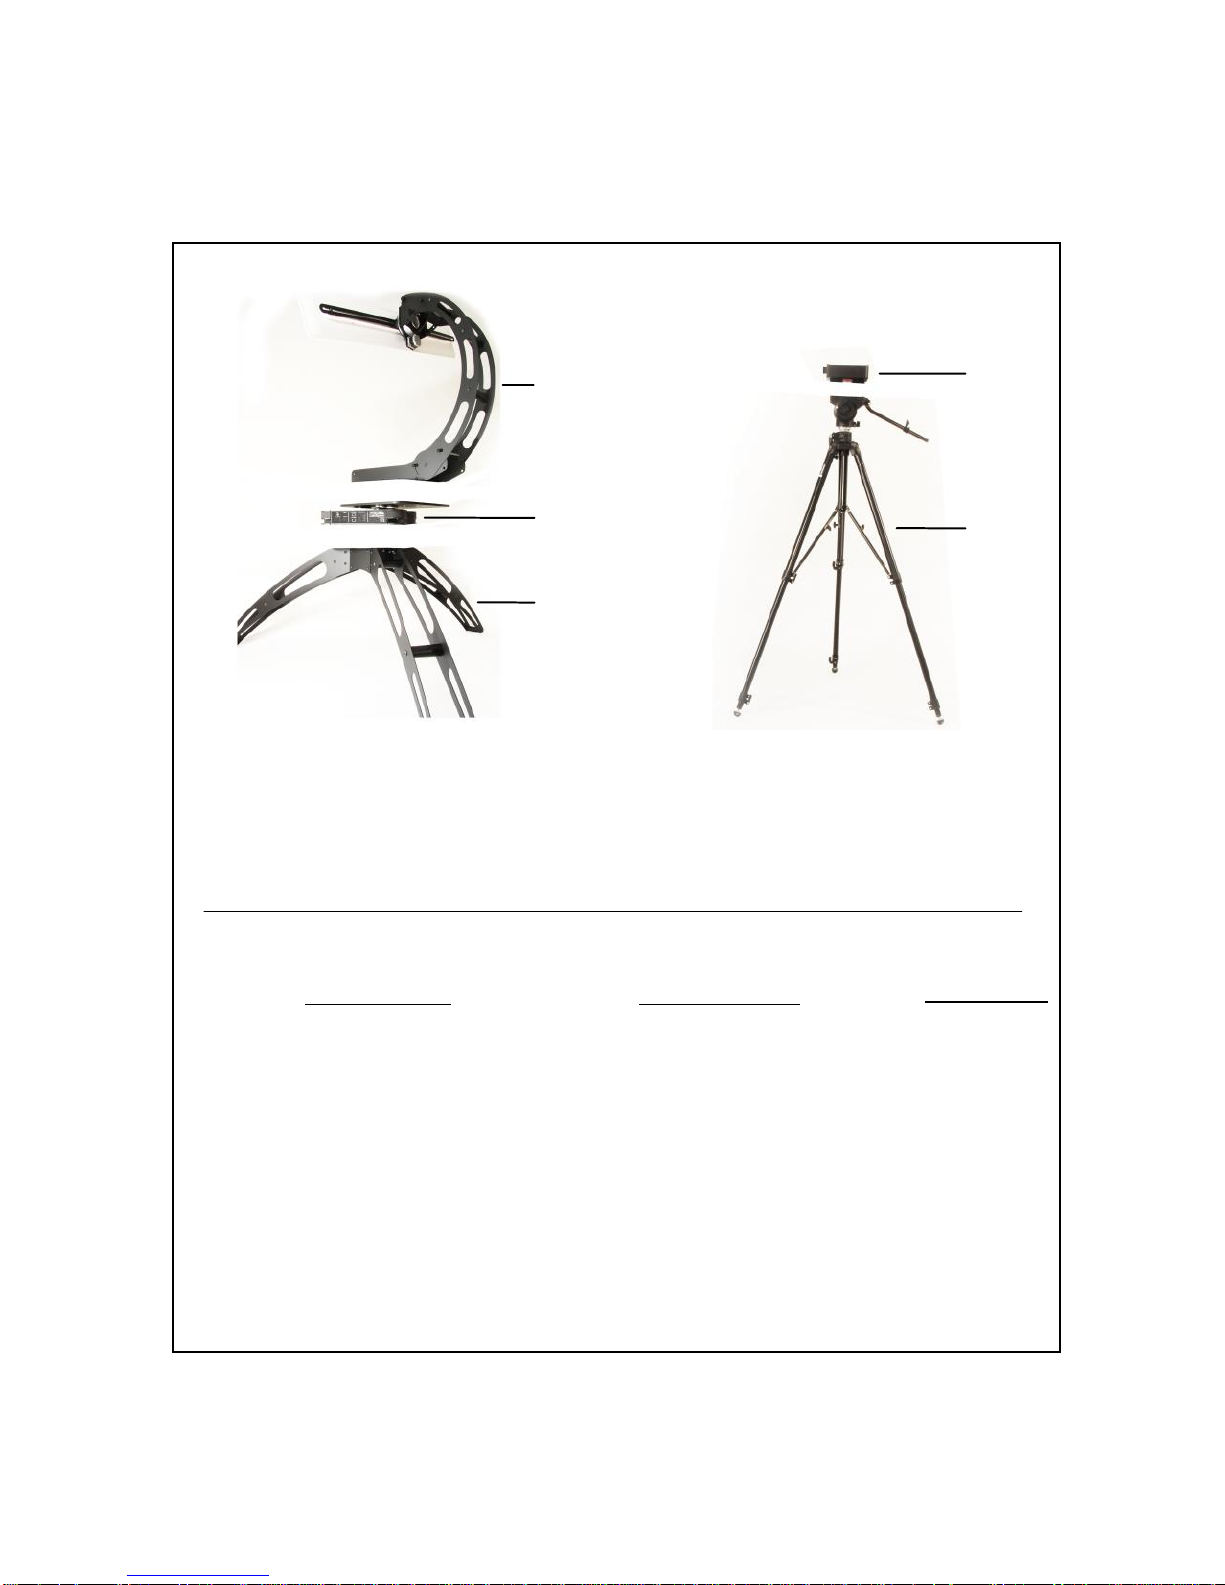
Weight
15 Kg
25 Kg
16 Kg
2 Kg
3 Kg
LabSpion weight
56 Kg
LabSensor weight
5 Kg
Total shipping weight: 69 Kg
Packages: 4 pcs
Total weight: 63 Kg
Shipping packages
1. C-Plane goniometer 140x50x15cm 17Kg
2. LightSpion base 50x50x20cm 27Kg
3. 3 point base table 140x50x15cm 19Kg
4. Sensor + tripod 100x35x35cm 6Kg
Shipping dimensions
Shipping weight
Page 5

5 LabSpion user guide
Contents
Introduction ........................................................................ 8
About the LabSpion ........................................................ 8
System content .............................................................. 8
About this document ....................................................... 9
Installation ....................................................................... 10
Software installation ..................................................... 10
Connecting power ........................................................ 11
Connecting USB ........................................................... 12
Connecting LabSensor ................................................. 13
Connecting C-plane goniometer ................................... 14
Connecting lamp power ................................................ 15
Connecting diagram ..................................................... 16
Making measurements ..................................................... 17
Alignment of sensor ...................................................... 17
Alignment of lamp ......................................................... 18
Quality selection ........................................................... 19
Full automatic ............................................................... 20
Manual power control ................................................... 23
Manual integration time setup ....................................... 24
Free running spectrometer ........................................... 25
Measurement data ........................................................... 26
Power details ................................................................ 29
CRI details .................................................................... 31
Page 6

6 LabSpion user guide
Spherical limit ............................................................... 33
Attaching pictures ......................................................... 34
Saving measurement ................................................... 35
Exporting to IES/LDT .................................................... 36
Exporting to PDF .......................................................... 37
Exporting to PNG ......................................................... 37
Exporting to CSV .......................................................... 39
Emailing measurement ................................................. 40
Specifications ................................................................... 41
Page 7
7 LabSpion user guide
Safety Information
Warning! This product is not for household use.
Read this manual before installing and operating the
controller, follow the safety precautions listed below, and
observe all warnings in this manual.
Preventing electric shocks
Always ground (earth) the power supply.
Use only a source of AC power that complies
with local building and electrical codes, and that
has both overload and ground-fault protection.
If the controller or power supply are in any way damaged,
defective, wet, or show signs of overheating, disconnect the
power supply from AC power and contact Viso Service for
assistance.
Do not install or use the device outdoors. Do not spray with
or immerse in water or any other liquid.
Do not remove any covers or attempt to repair the device or
power supply. Refer any service to Viso.
Disposing of this product
Viso products are supplied in compliance with Directive
2002/96/EC of the European Parliament and of the Council of
the European Union on WEEE (Waste Electrical and
Electronic Equipment), as amended by Directive 2003/108/EC,
where applicable.
Help preserve the environment! Ensure that this product is
recycled at the end of its life. Your supplier can give details of
local arrangements for the disposal of Viso products.
Page 8
8 LabSpion user guide
Introduction
About the LabSpion
The LabSpion is a revolutionary new far field goniometer
system using a spectrometer sensor making it possible to
measure all photometric measurement fast and easily. The
Light Inspector software makes fast and easy to make, save
and export measurement data.
System content
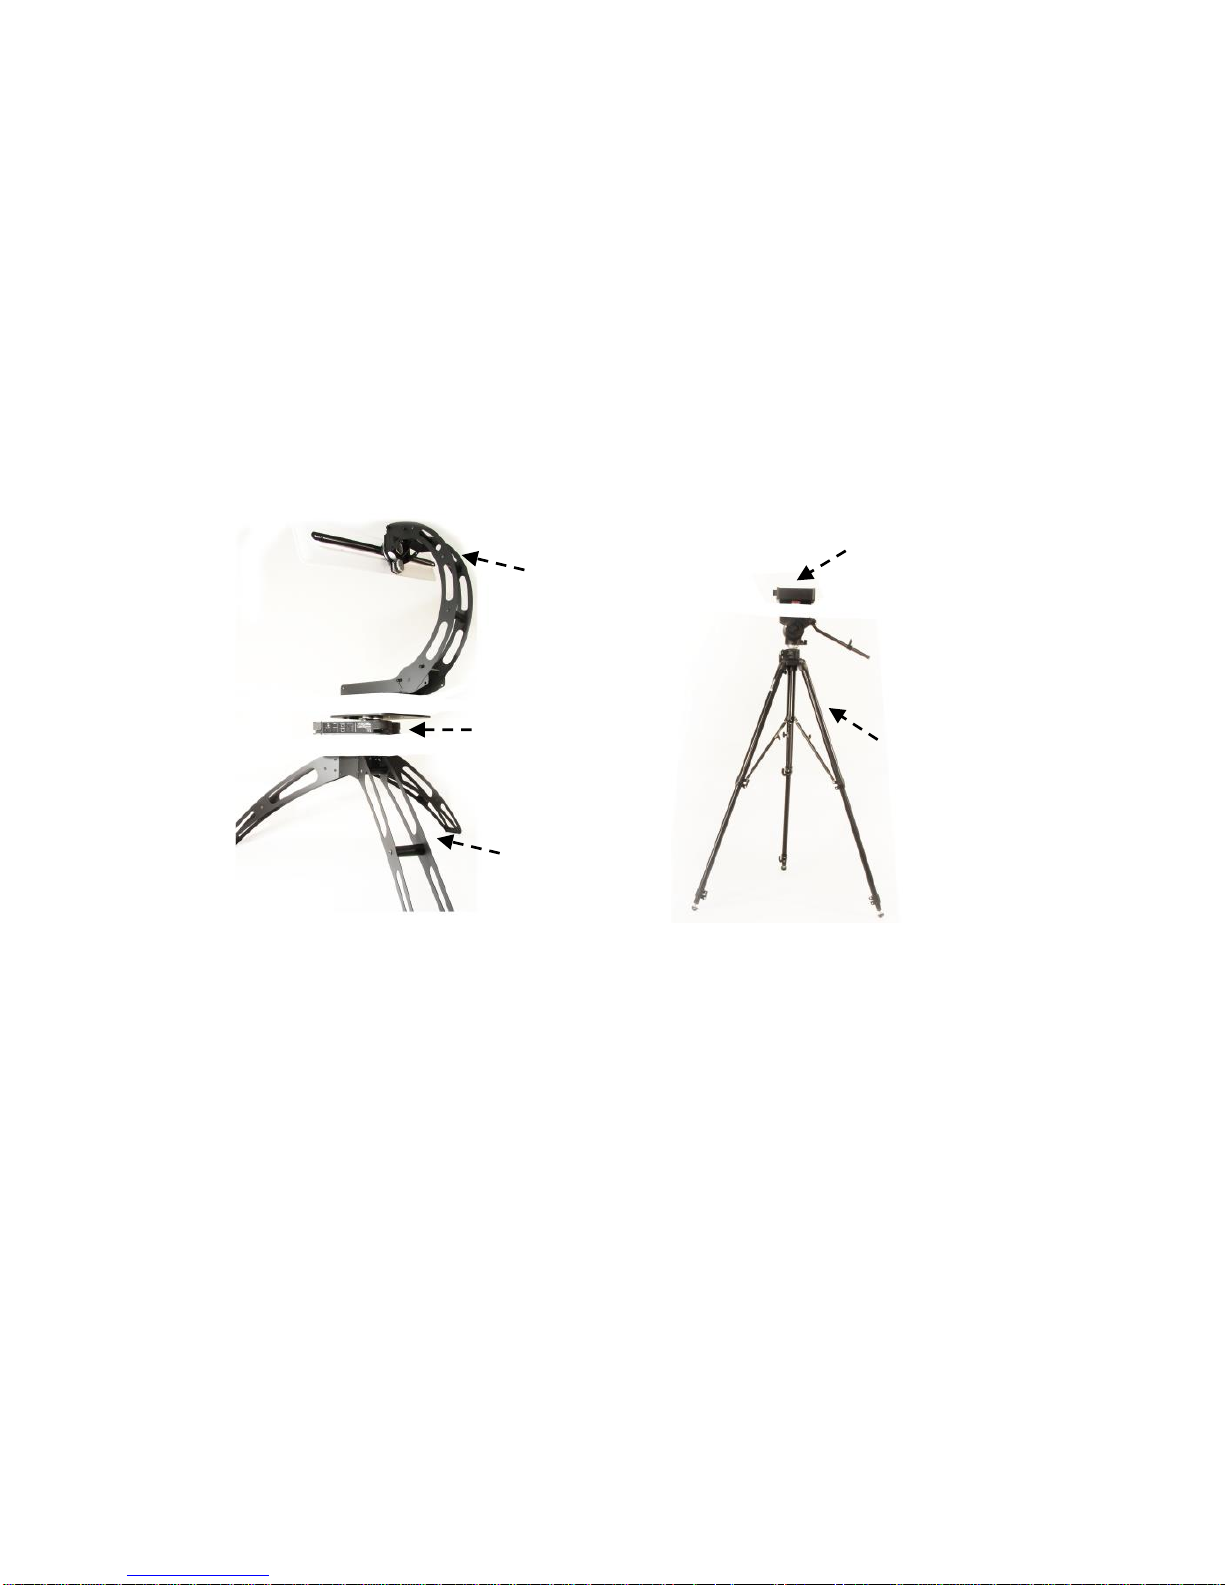
The LabSpion package contains the following items.
LabSpion goniomtere base
C-plane goiniometer with lamp bracket
3 point base table
LabSensor
Tripod for LabSensor
Light Inspector USB stick (Windows)
5 m IEC power cord
C-Plane goniomter with
lamp bracket
LabSpion base with all
gonio drivers, power
analyser integrated
3 point base table for
LabSpion base
LabSensor with
spectrometer sensor
and integrated laser for
distance measurement
to LabSpion.
Tripod for LabSensor.
Page 9

9 LabSpion user guide
5 m USB cable
20m RJ45 cat 5 for connection between LabSpion and
LabSensor
About this document
This guide describes how to install and use the LabSpion
controller, and how to make measurement of different light
sources.
Page 10
10 LabSpion user guide
Installation
Software installation
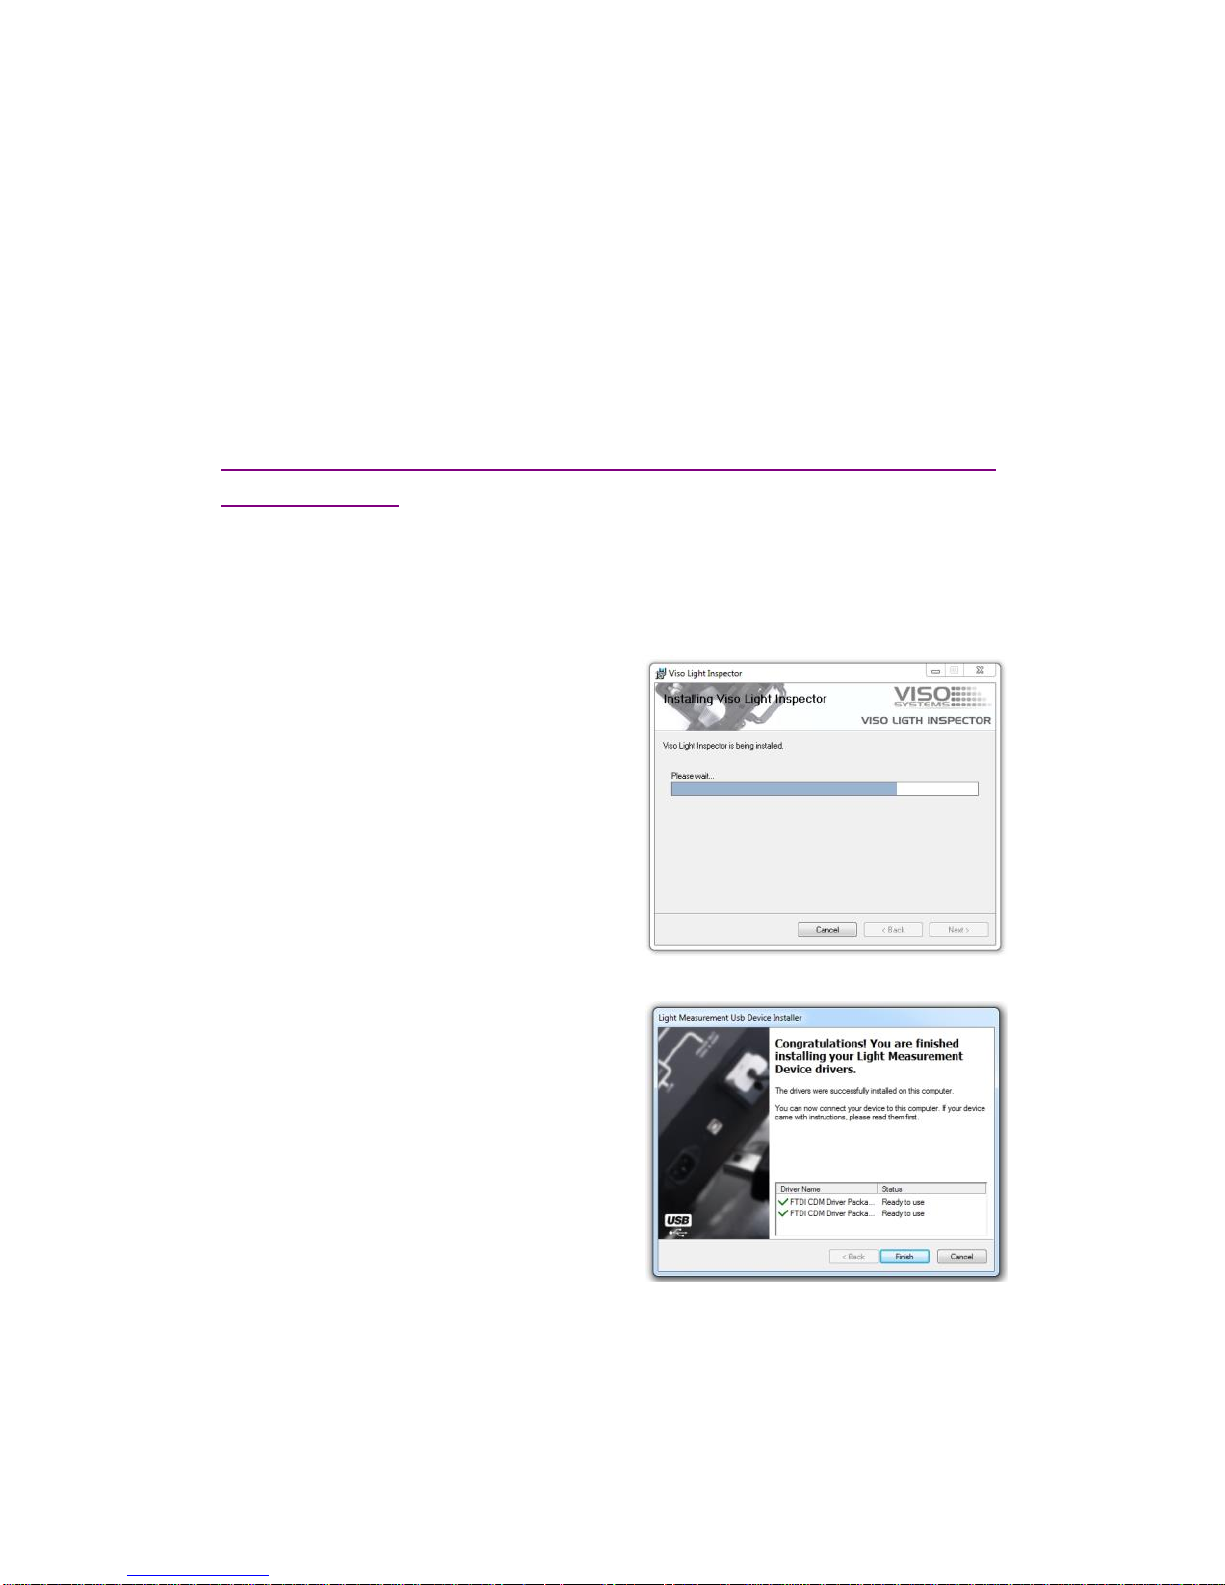
Before you can start using the LabSpion, the “Viso Light
Inspector” software must be installed. Supported on all
windows platforms.
Use the following link to download the latest version:
http://www.lightdataserver.com/software/Viso%20Systems/Ligh
tInspector.htm
Please make sure the LabSpion is not connected to the
computer during software installation.
Run the msi file and follow the
installation instruction.
USB drivers are automatically
installed.
Your measurements are not
lost, when installing newer versions or uninstalling. All
measurements always remain in your document folder.
Page 11
11 LabSpion user guide
Connecting power
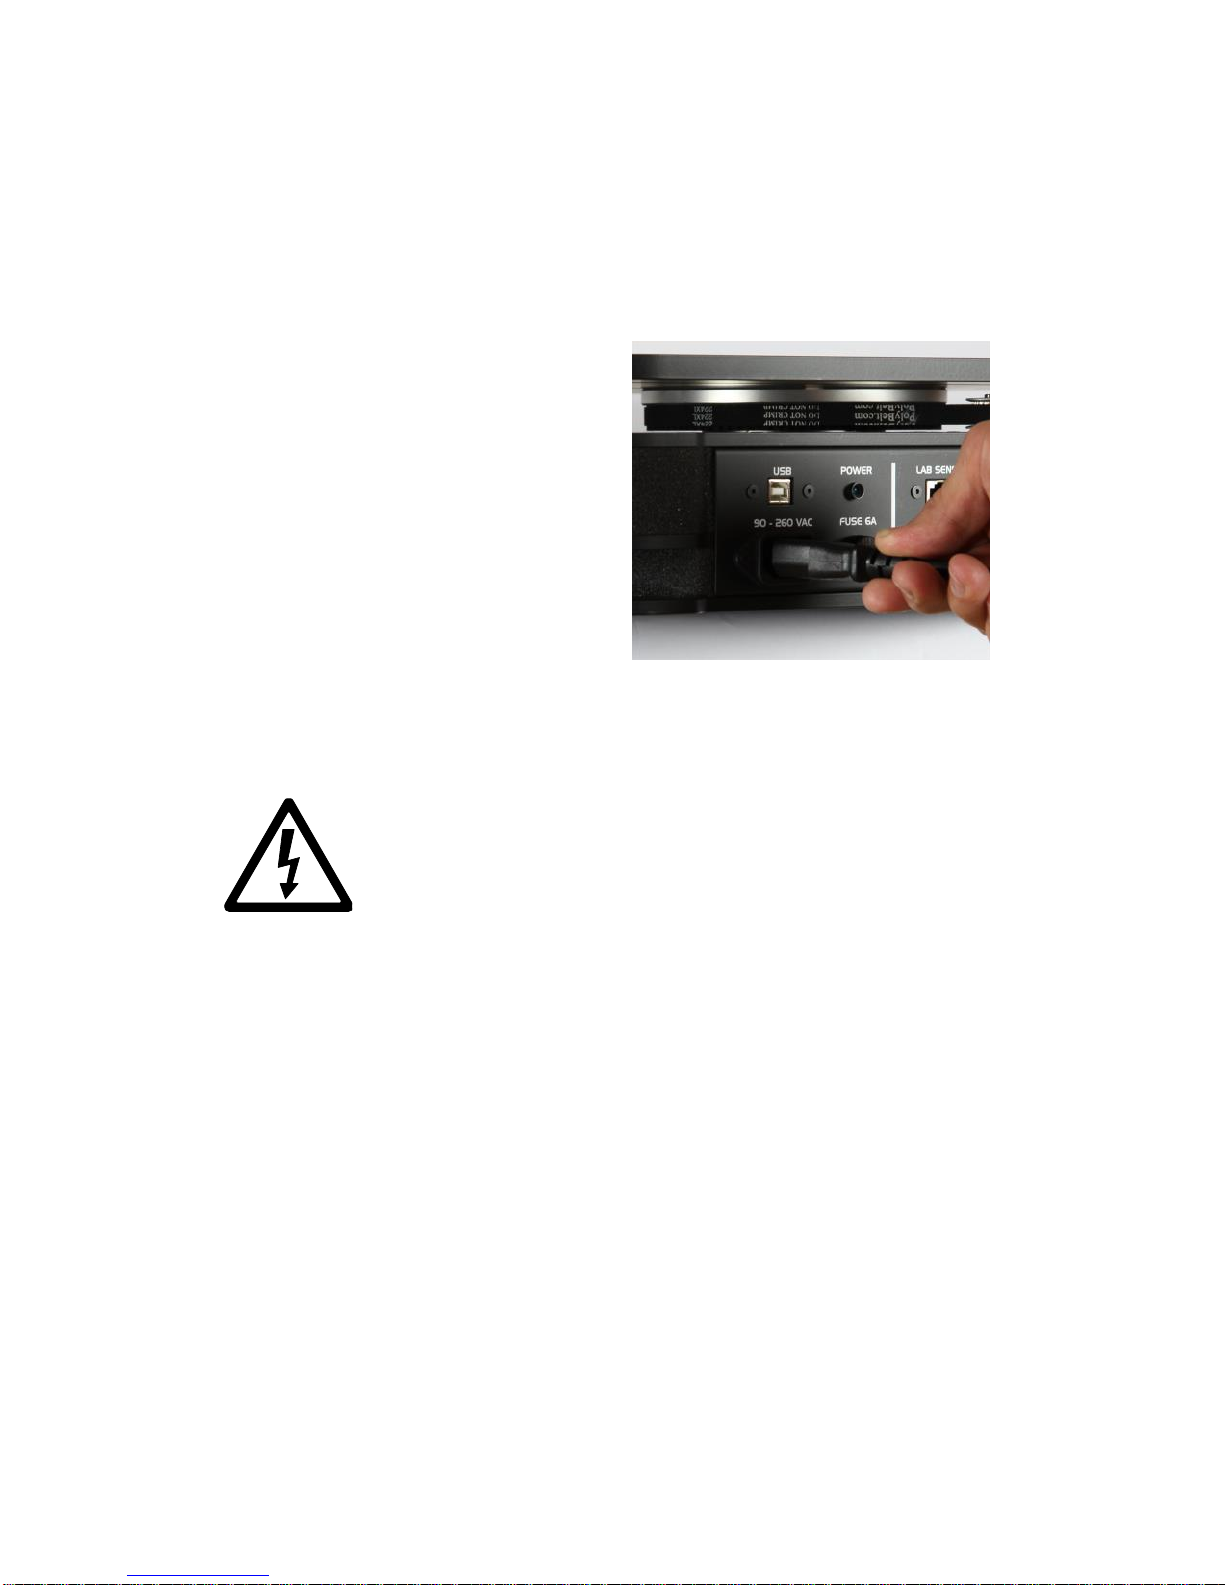
The LabSpion comes with a standard IEC power in
connector and with standard euro power cable, but any
power cable can be used as the LabSpion support any
outlet voltage from 90-260VAC.
The power in connector
supplies power to the
goniometer motor and to the
power analyser and
subsequent to the light
source to be measured,
meaning that power supplied
will be identical to power
supplied to the light source to
be measured.
AC power supply cable plug
Warning: Risk of electric shock! Plug
installation shall be performed by a qualified
electrician.
A grounding-type (earthed) power plug that fits the local
power outlet must be used which you can acquire an IEC
power cable with a suitable grounding-type plug from most
consumer electronics stores.
When installing the plug connect pins as follows:
yellow and green wire to ground (earth)
blue wire to neutral
brown wire to live
Page 12
12 LabSpion user guide
Connecting USB
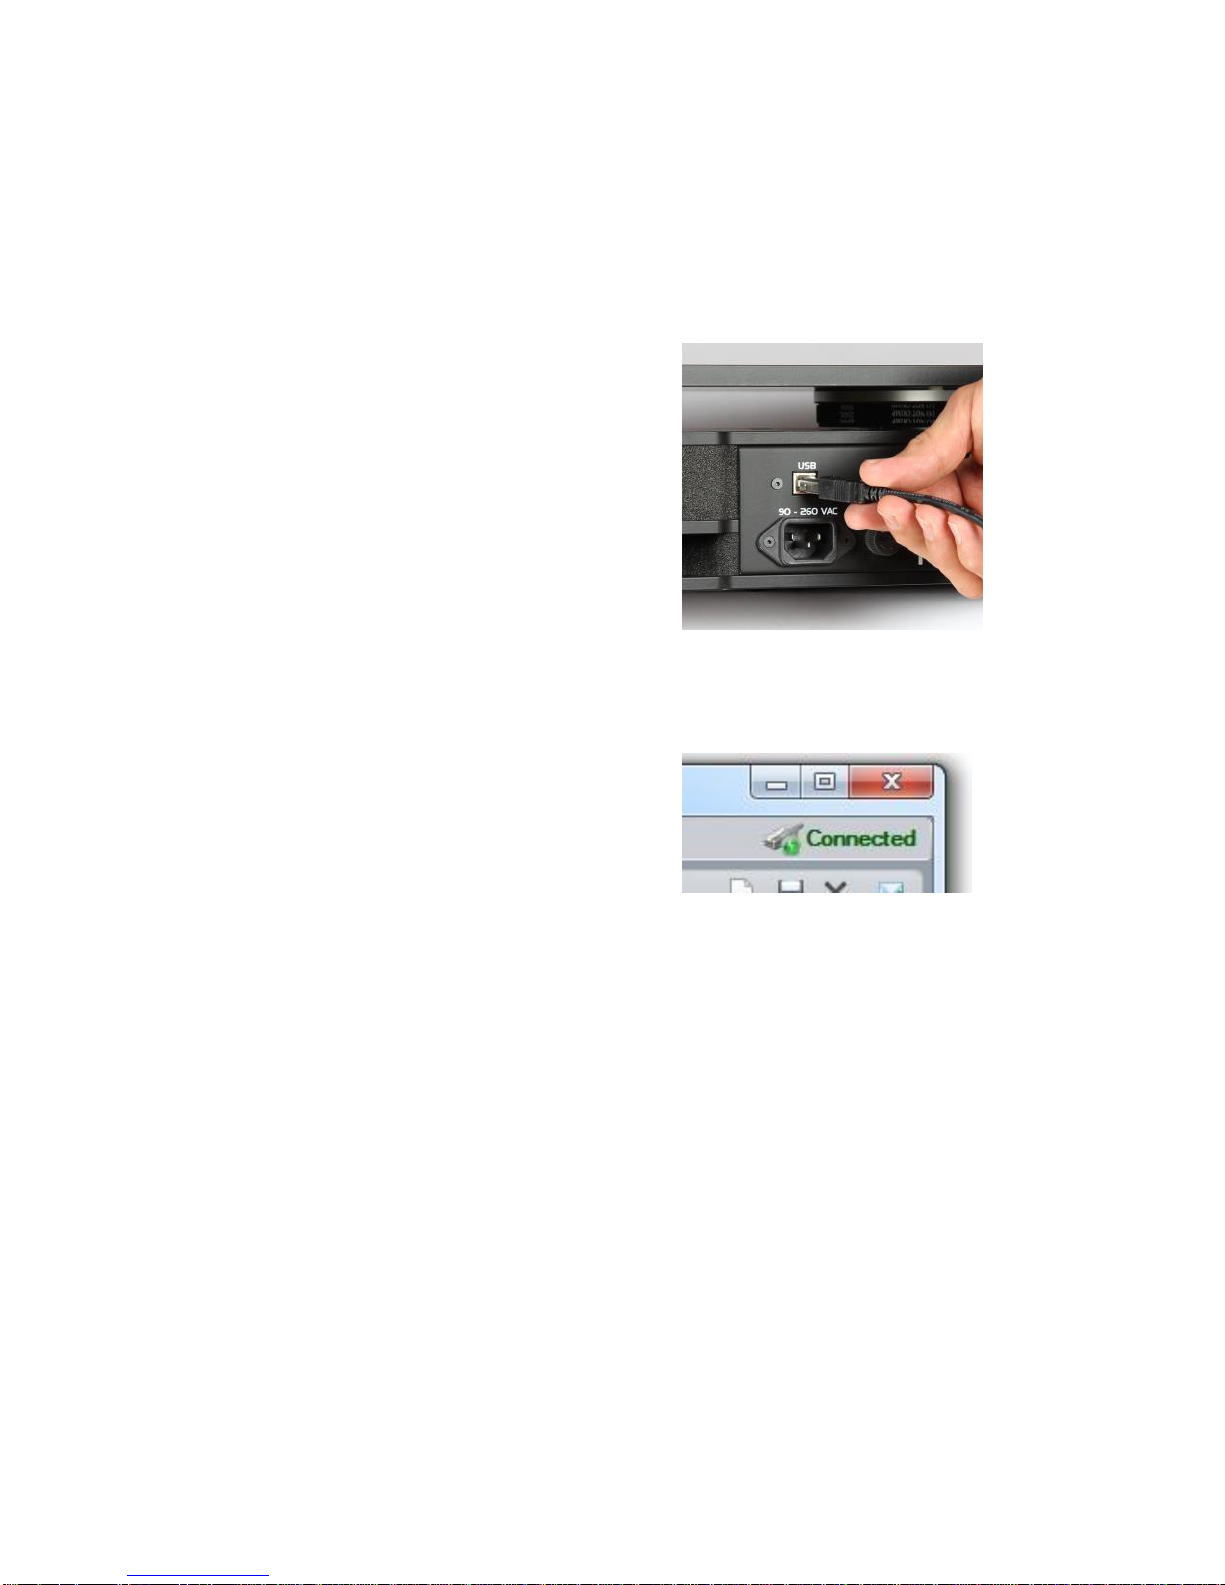
The LabSpion is connected to the computer using a USB
connector type B. A 2m USB cable type A to B is included
with the LabSpion but any USB cable supporting USB2.0
can be used.
The USB supplies
communication and power to the
LabSpion’s main board
processor, power analyser and
photo spectrometer, meaning
that the photo spectrometer can
be used only with USB
connected.
After connecting USB start the “Viso Light Inspector”
software and connection to the LabSpion will automatically
be established. A successful
connection is shown with a green
“Connected” icon in the upper
right corner of the “Viso Light
Inspector” software.
USB can be connected and disconnected without the need
of restarting the “Viso Light Inspector” software, as
connection always is established automatically as soon as
the USB connector is plugged in and vice versa.
Page 13
13 LabSpion user guide
Connecting LabSensor
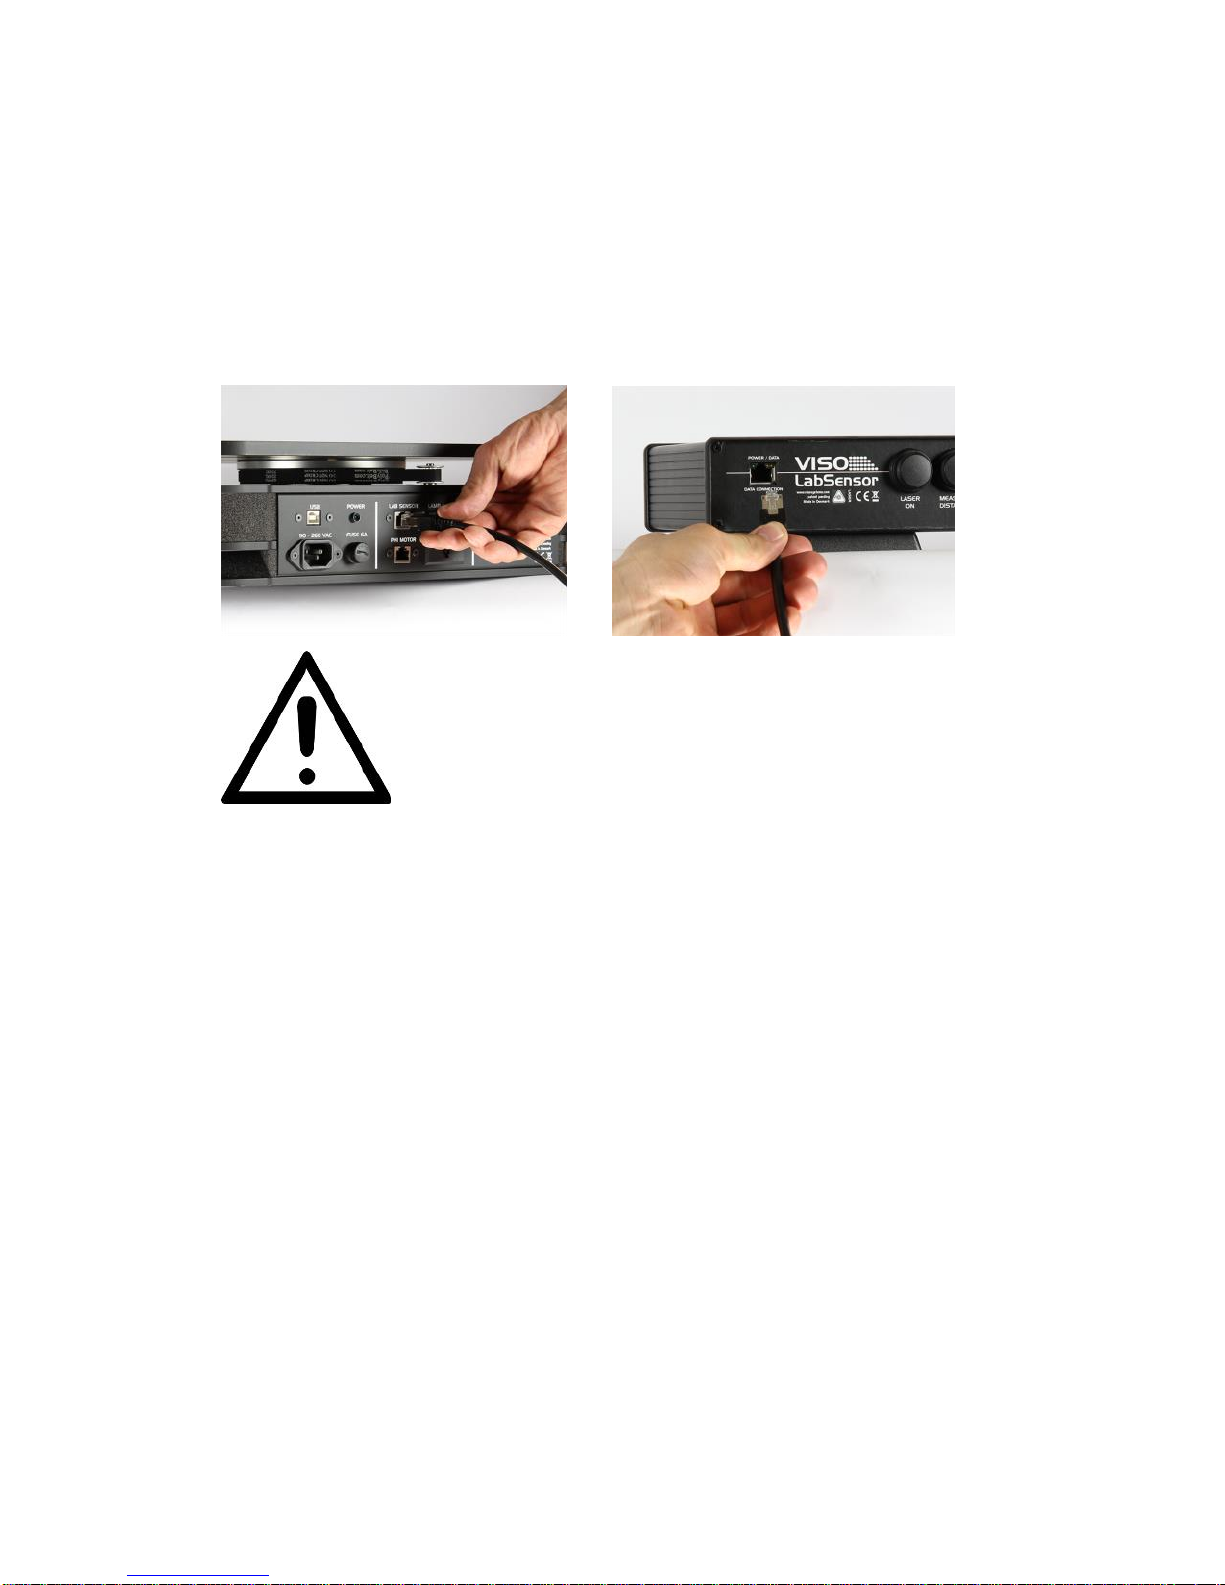
Connection to the LabSensor is done by using a RJ45
cable between the LabSpion base and the LabSensor. The
LabSpion supplies all power and data communications the
LabSensor via the RJ45 cable.
Warning do not connect the LabSensor to C-plane
motor connector, this could damage the LabSensor.
Page 14
14 LabSpion user guide
Connecting C-plane goniometer
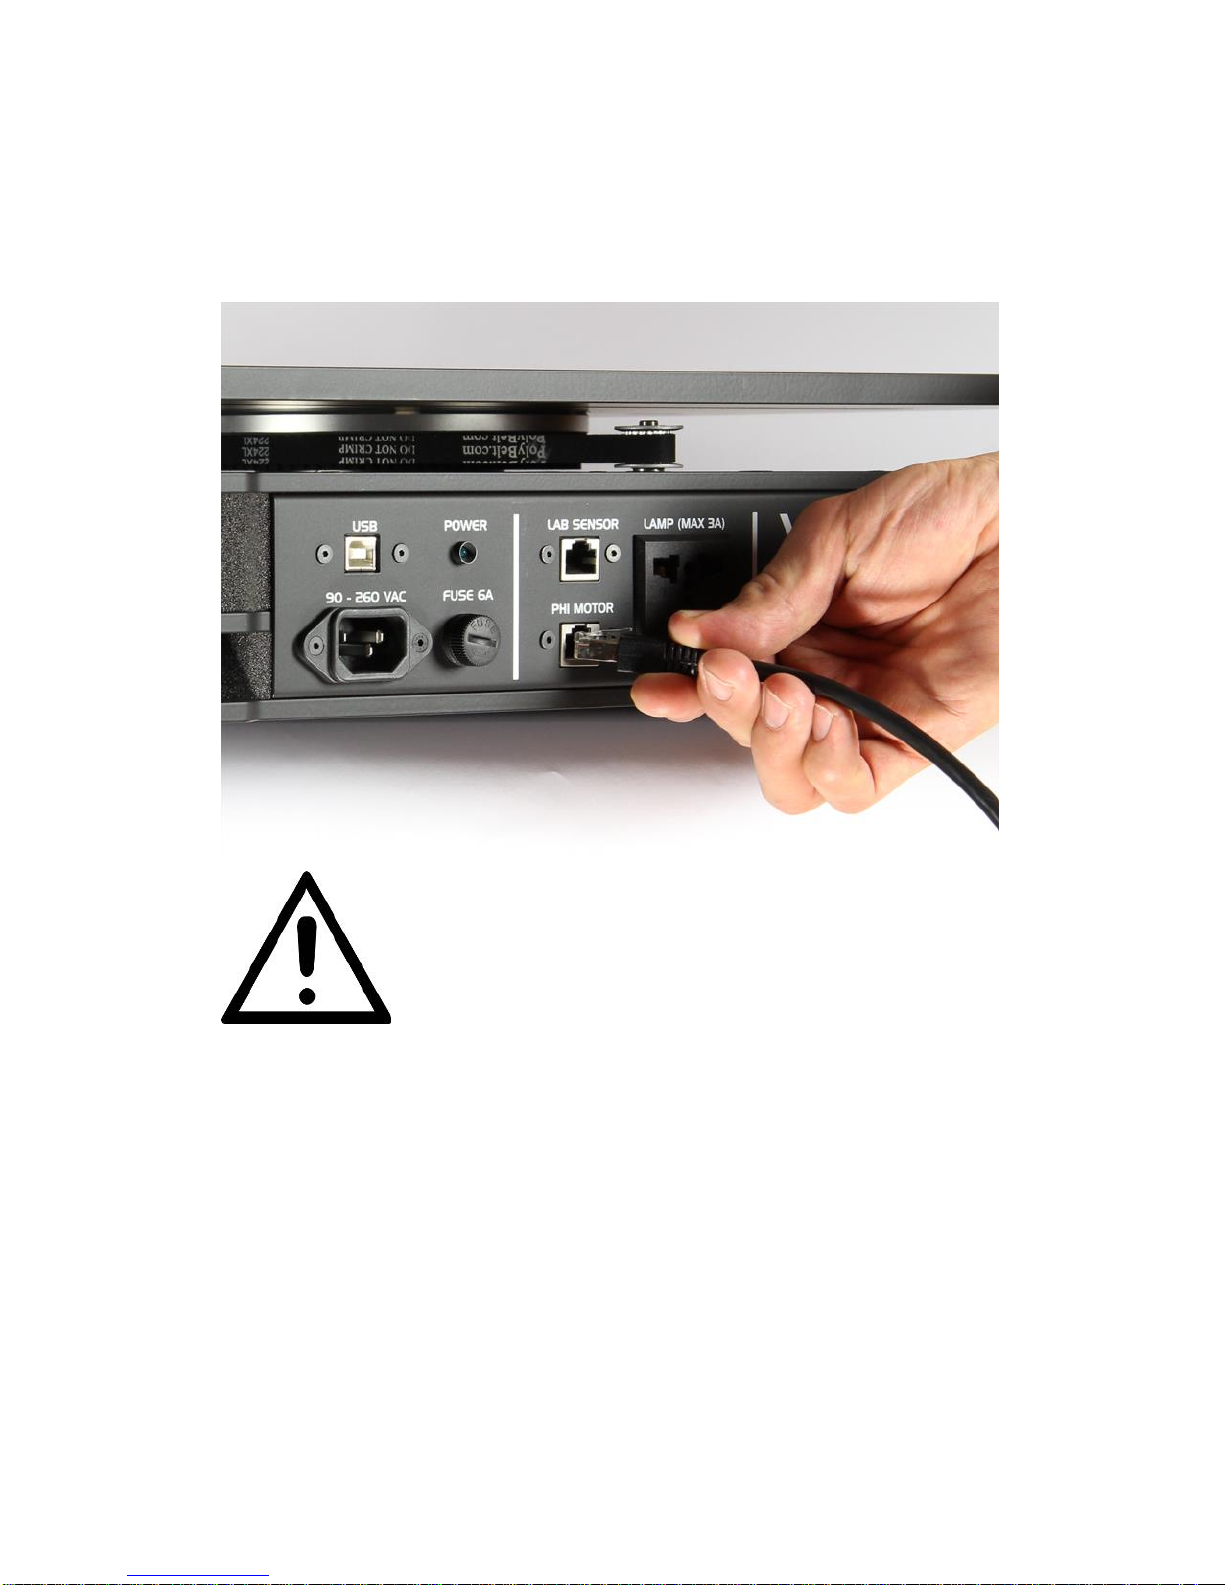
The C-plane goniometer is connect to the LabSpion base
via a RJ45 cable. The LabSpion will automatically detect
the C-plane goniometer.
Warning do not connect the C-plane motor to the
LabSensor connector, this could damage the LabSpion.
Page 15
15 LabSpion user guide
Connecting lamp power
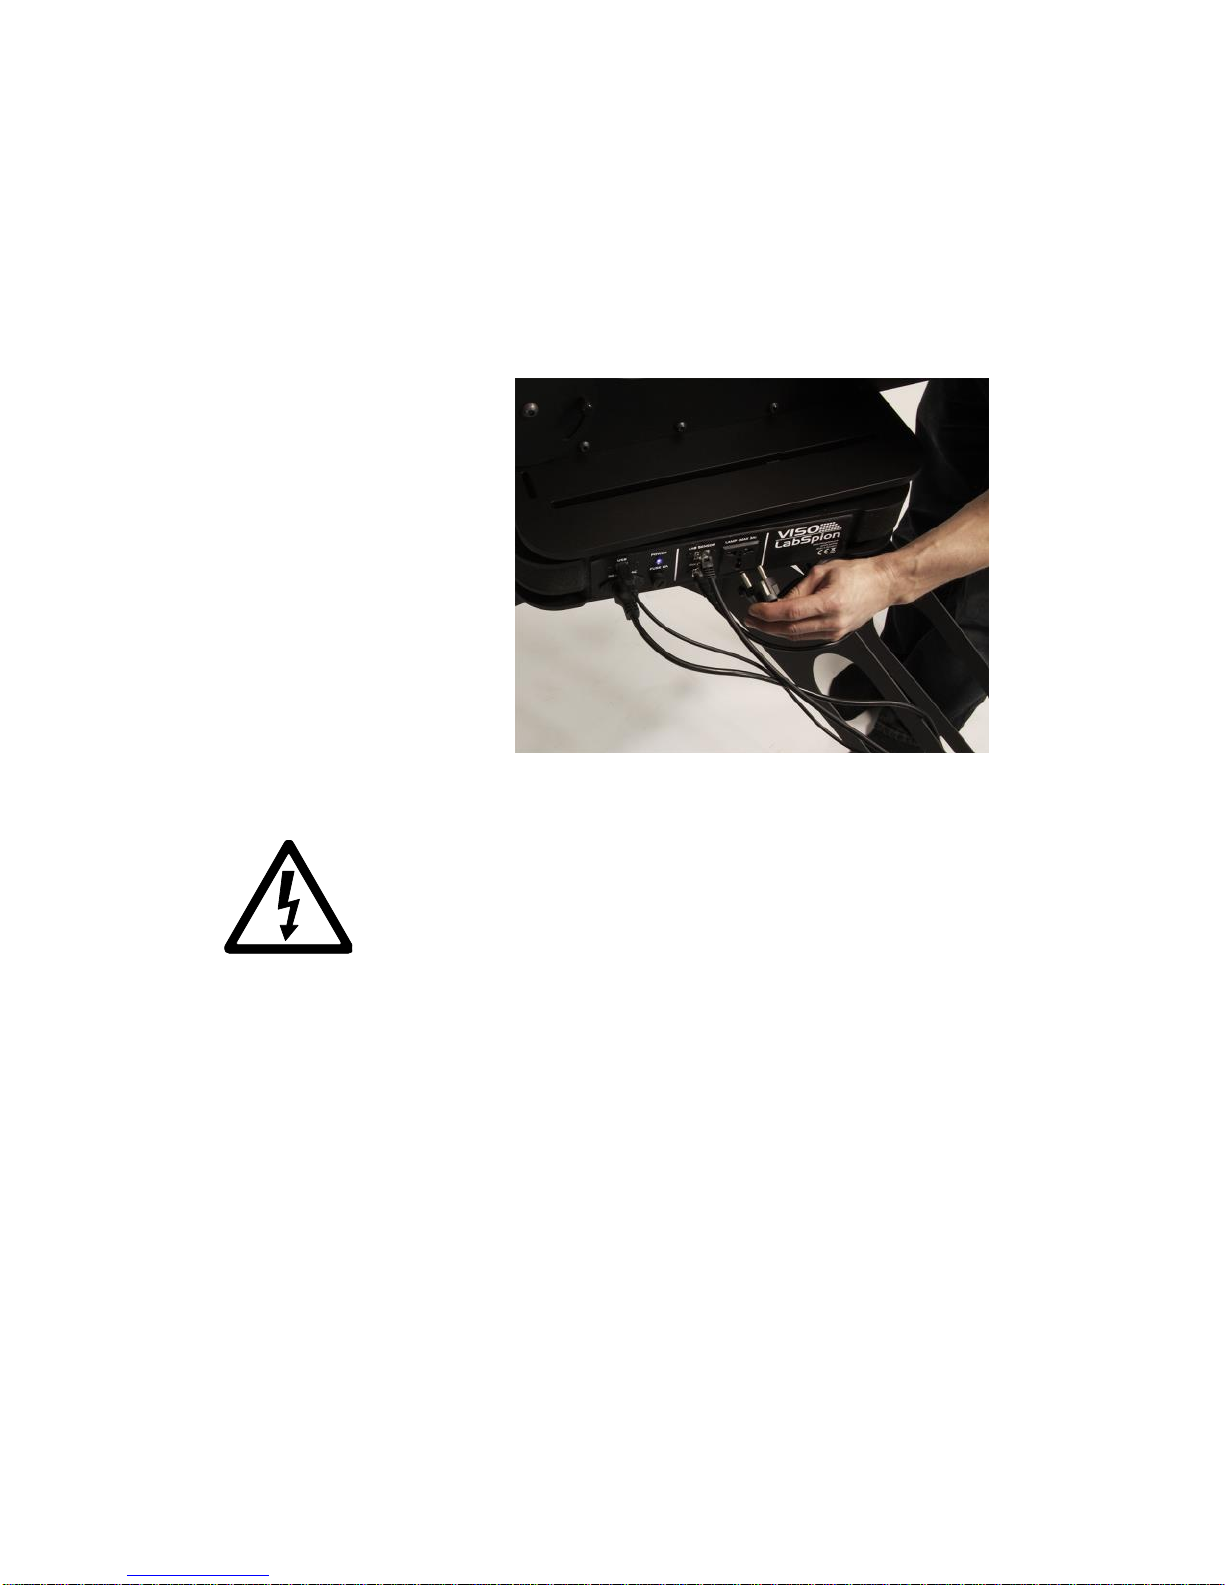
The LabSpion has a build in power analyser and power
switch. The power switch is used to switch of the lamp
before a measurement is made so the ambient light can be
measured and subtracted from the subsequent
measurement.
The maximum
supported lamp
current is 3A which
is 660W at 220VAC
and 330 at 110VAC.
AC power supply cable plug
Warning: Risk of electric shock! Plug
installation shall be performed by a qualified
electrician.
A grounding-type (earthed) power plug that fits the local
power outlet must be used which you can acquire an IEC
power cable with a suitable grounding-type plug from most
consumer electronics stores.
When installing the plug connect pins as follows:
yellow and green wire to ground (earth)
blue wire to neutral
brown wire to live
Page 16
16 LabSpion user guide
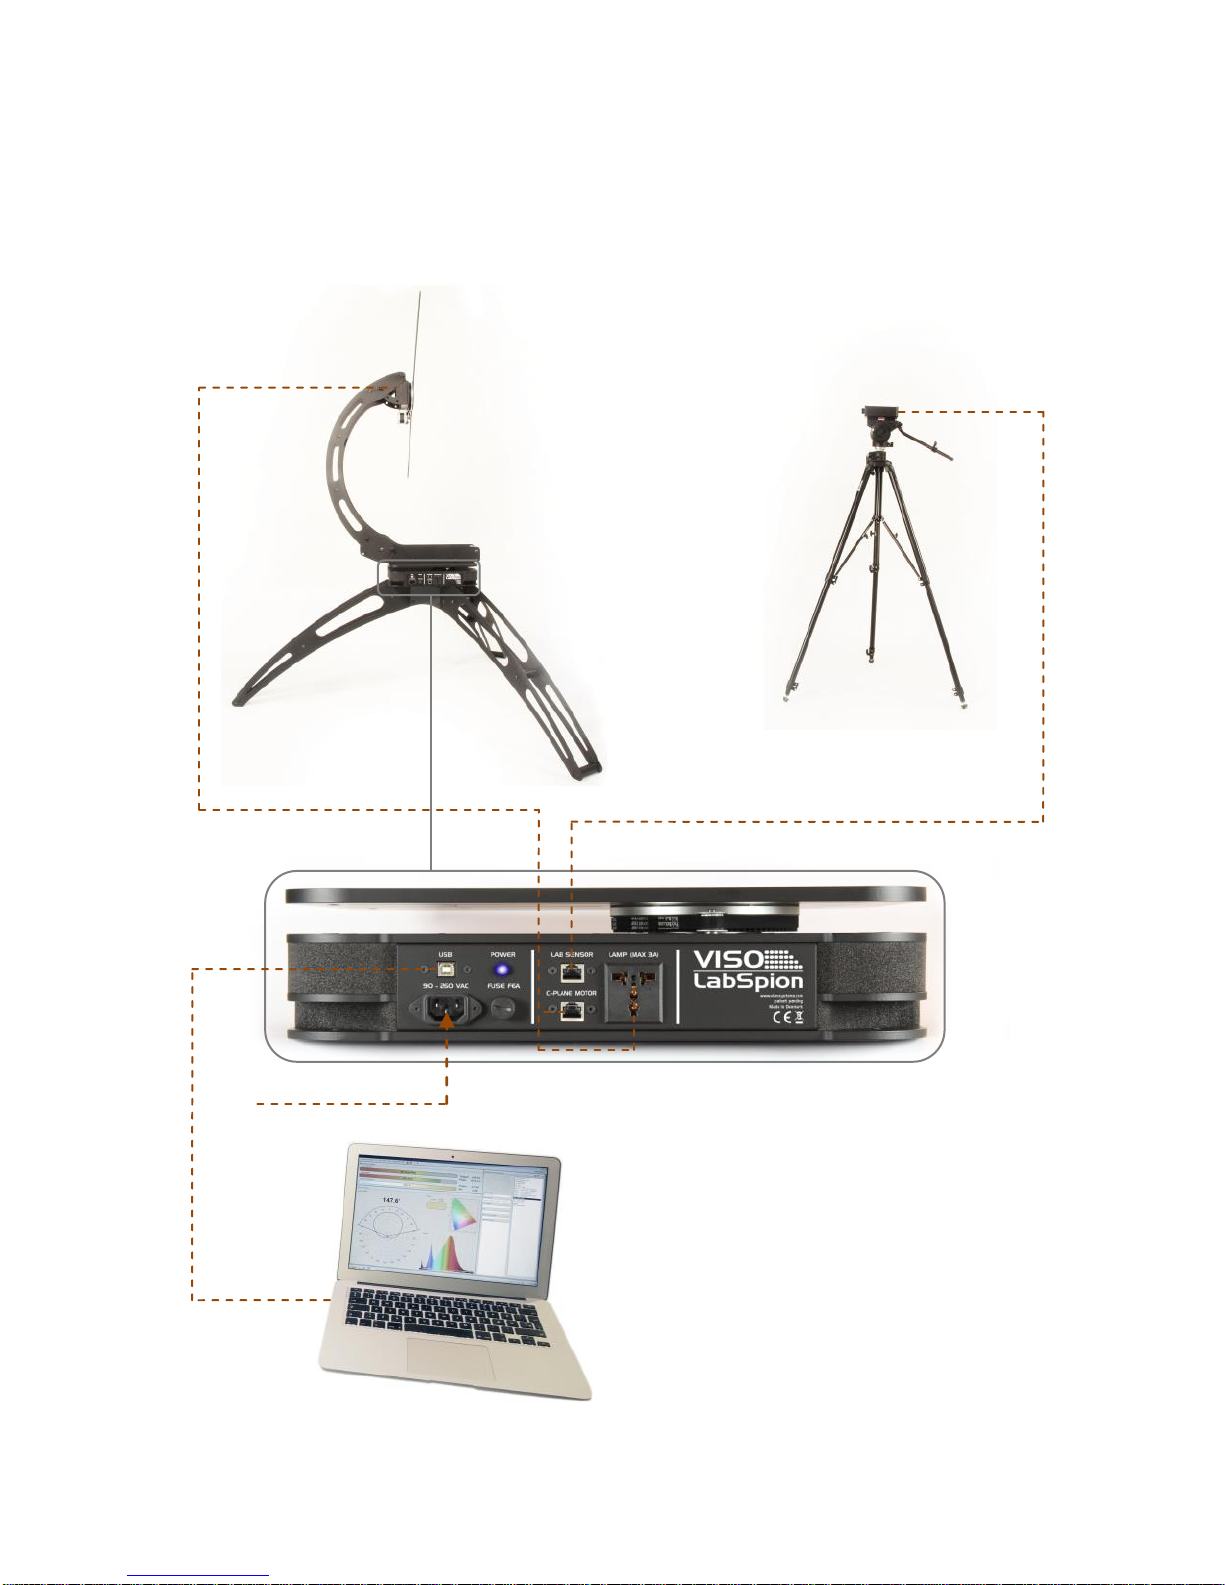
Connecting diagram
Below is a connection diagram showing the different
connection needed to make the system operational.
Mains IN
Page 17
17 LabSpion user guide
Making measurements
Alignment of sensor
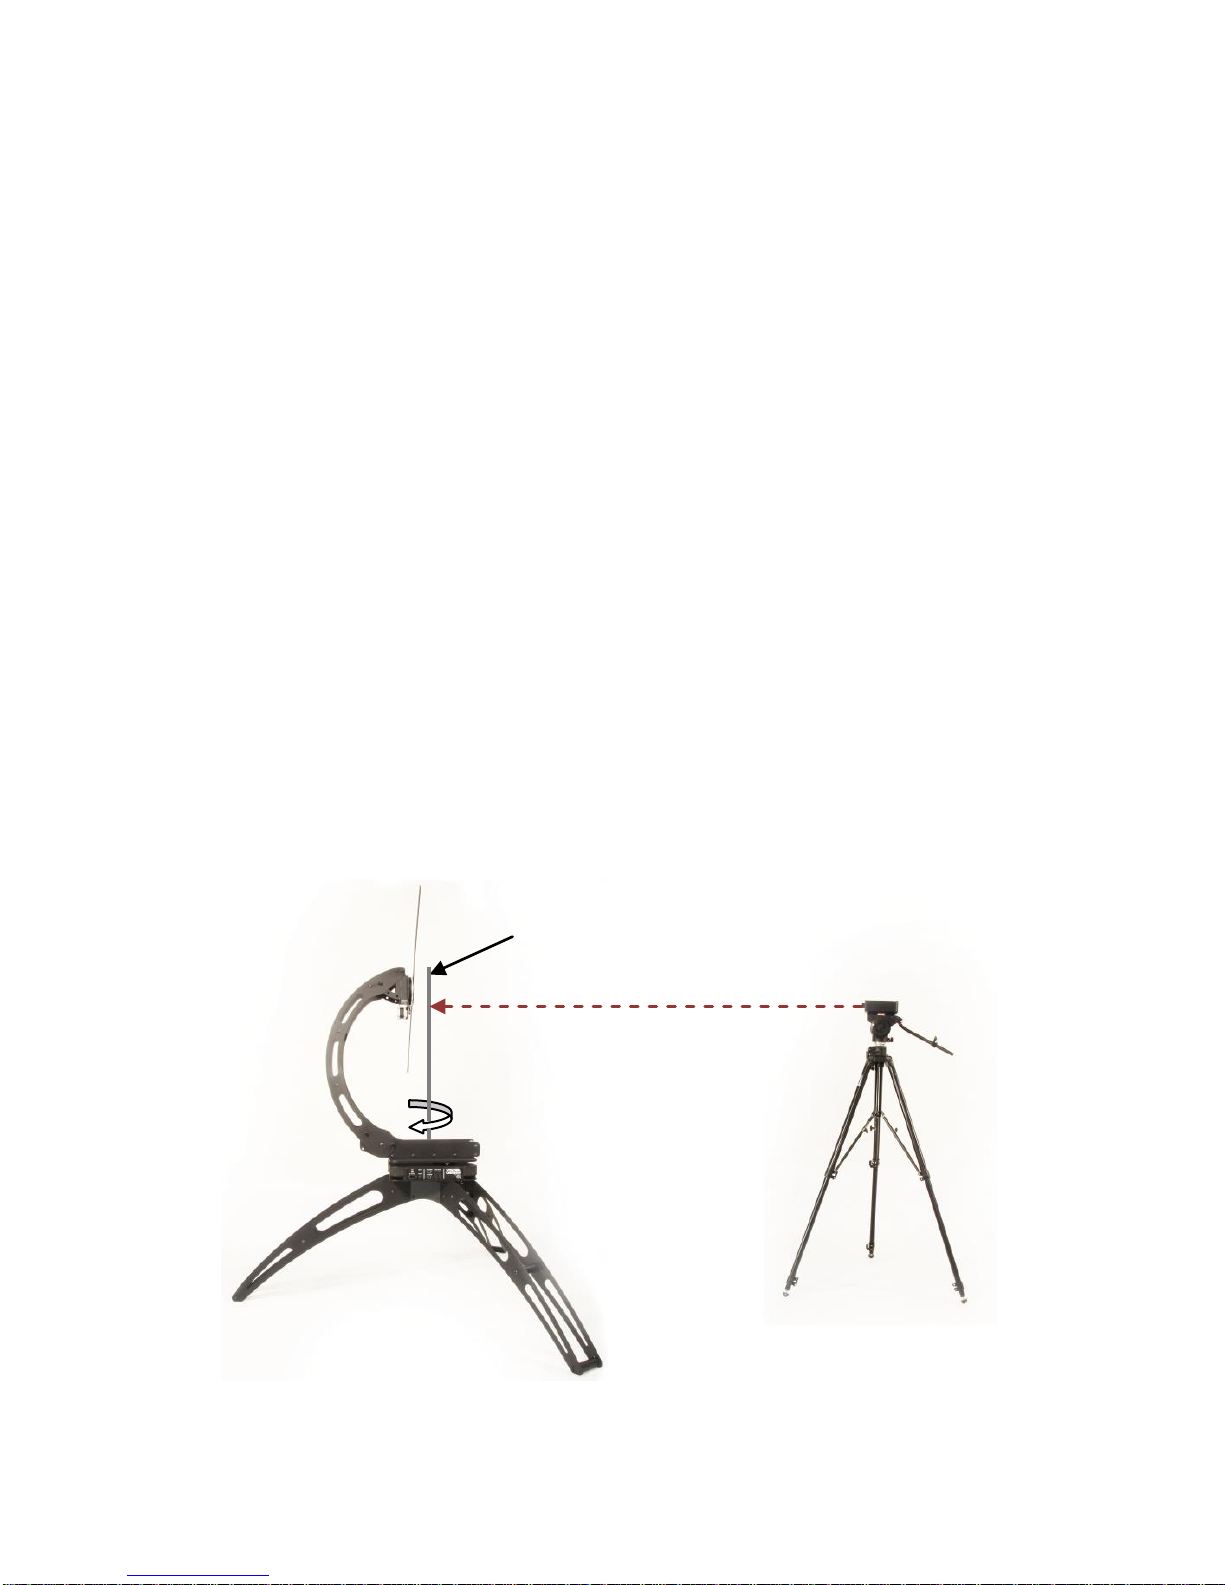
Before a measurement can be made is it important place
the sensor at the correct distance and align it correctly.
The LabSpion is a so called “Far Field” goniometer system
meaning the distance between the sensor and the lamp is
determined by the lamp size.
The recommended distance between the sensor and the
goniometer is 10 times the lamp length/diameter.
The distance can easily be measured using the build-in
laser in the LabSensor.
IMPORTANT !! The distance should be measured to the
centre of rotation of LabSpion base goniometer, use the
centre stick as laser target.
Use ”Alignment stick”
Centre of rotation
Laser Distance >= lamp length x10 (minimum x8)
Page 18
18 LabSpion user guide
Alignment of lamp
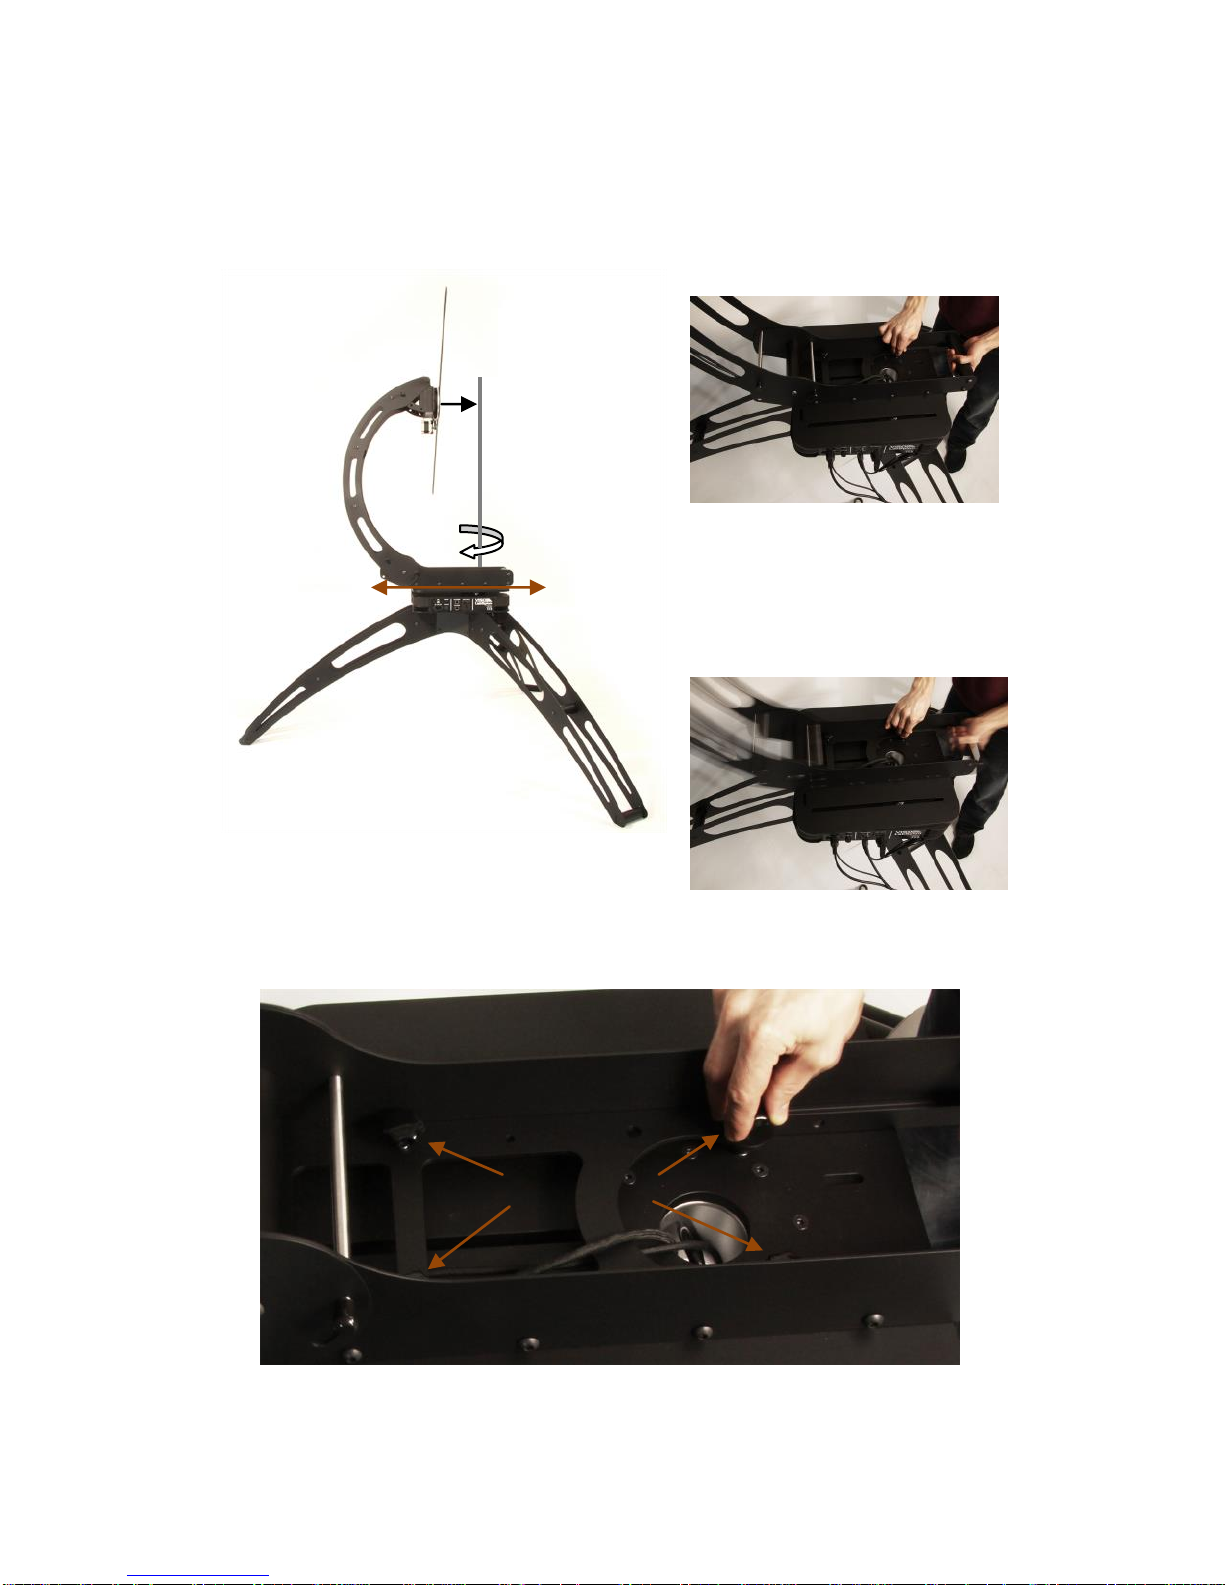
Before making a measurement is it necessary to align the
lamp to be measured to the centre of rotation.
By loosening the 4
screws on the C-Plane
goniometer can it be
slide to adjust the lamp
into the centre position.
The 4 finger screws are placed in pairs on each side of the
C-Plane goniometer as shown below.
Centre of
rotation
Finger screws
Page 19
19 LabSpion user guide
Quality selection
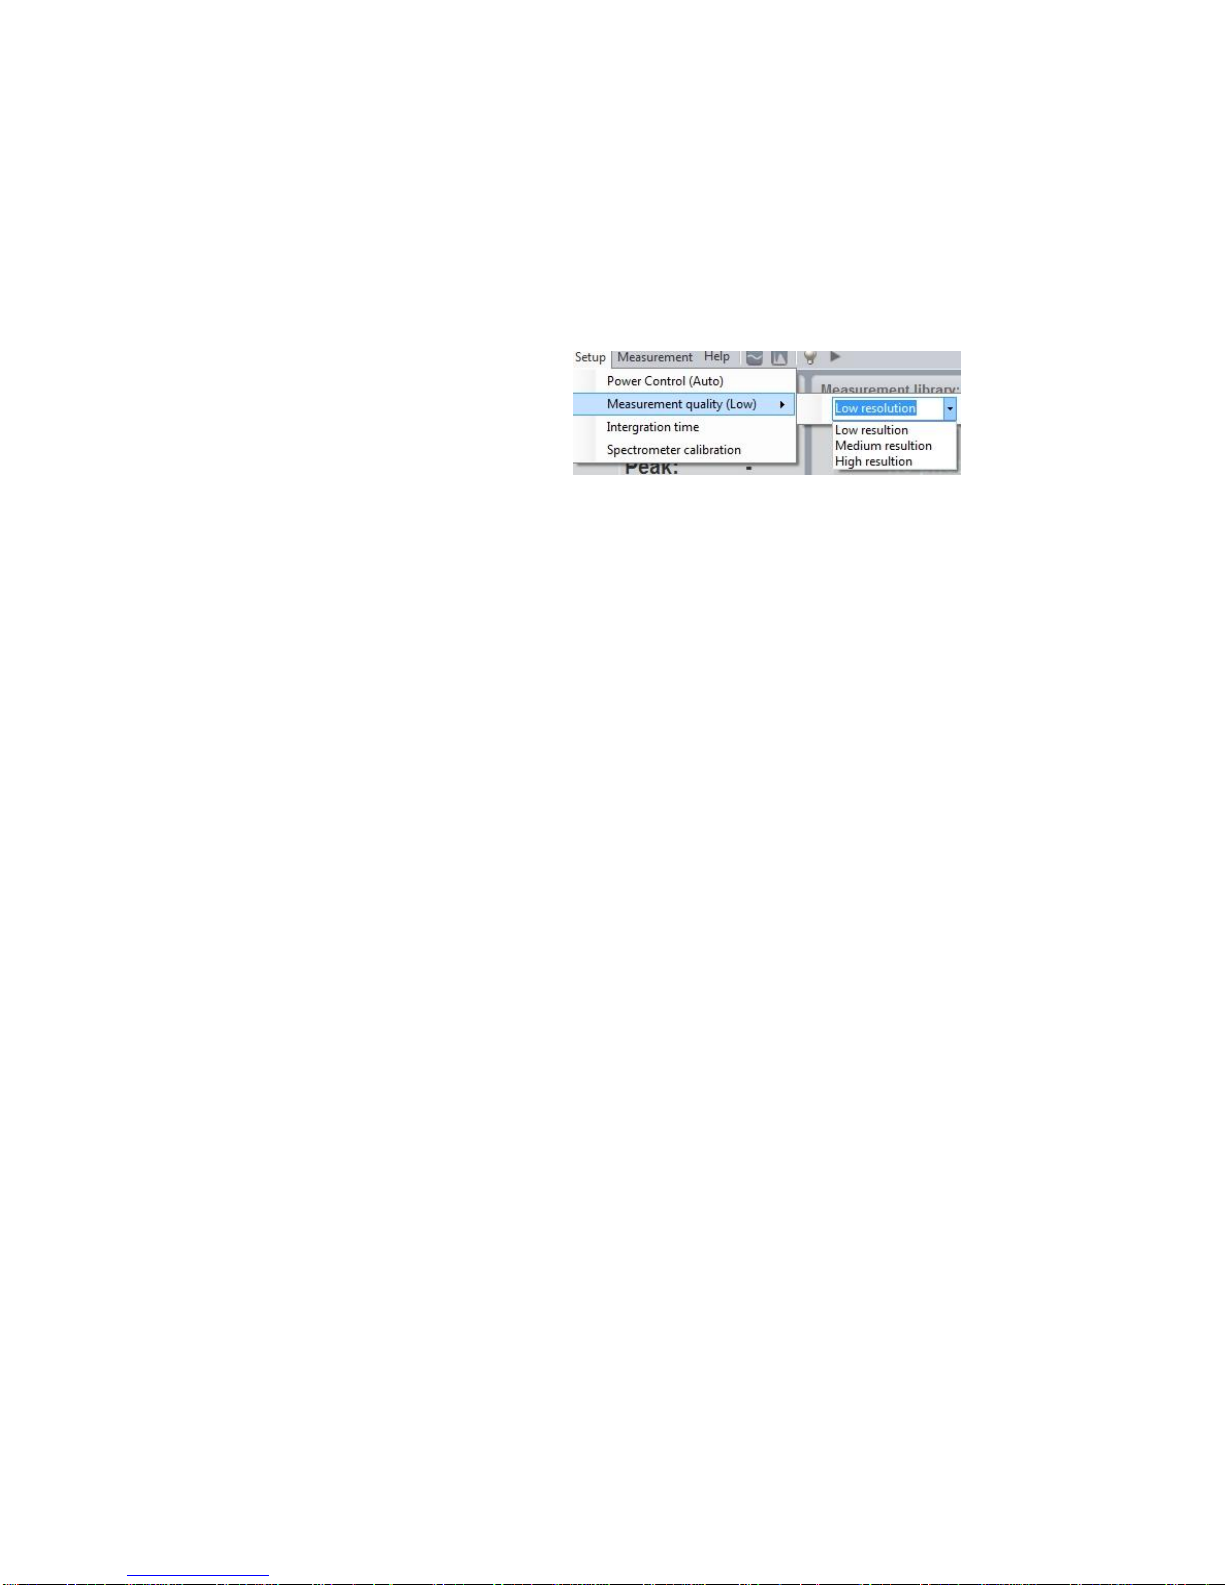
Before making a measurement is it possible to select the
measurement quality by clicking on Setup->Measurement
quality.
As default does the “Viso Light Inspector” use the “low
resolution”. It is possible
to select 3 levels: low,
medium and high. Each
quality level increases
the number
measurements made during goniometer measurements and
also increases the photo spectrometer integration time
lowering noise level of photo spectrometer measurements.
Increasing the quality results in substantial extended
measurement time.
Page 20
20 LabSpion user guide
Full automatic
By default does the “Viso Light Inspector” software make
full automatic measurement, meaning adjusting photo
spectrometer to the background light environment by
turning off the light source and measuring the background
light levels which subsequent is subtracted from
measurements so that measurements can be done even in
a lit room. The adjustment of the exposure time of the photo
spectrometer also known as integration time is also done
automatically.
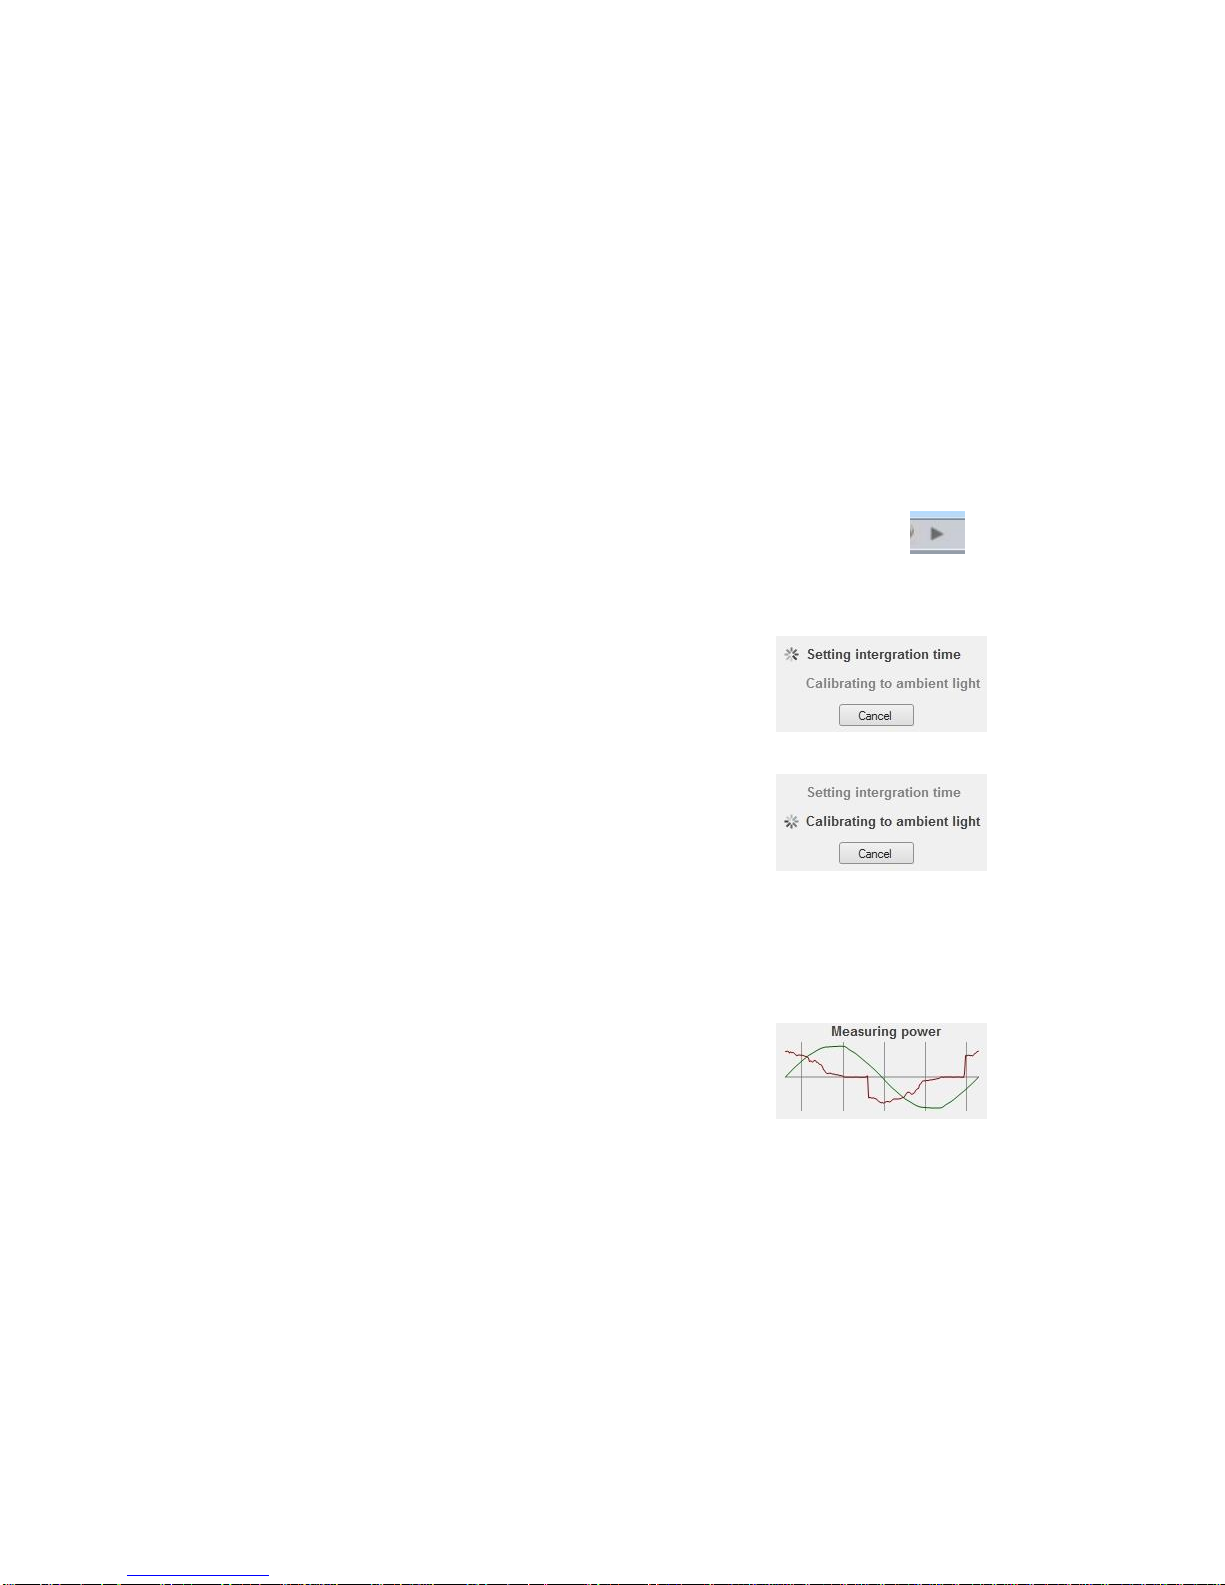
A measurement is simply started by clicking on the
play icon.
Then is integration time automatically
set.
Then is the ambient light level
automatically measured by turning off
the light source.
The light source is then turned 180 degrees to prepare for
measurement.
Power is then measured and stored.
Page 21
21 LabSpion user guide
Before detailed
auto re-scan
After detailed
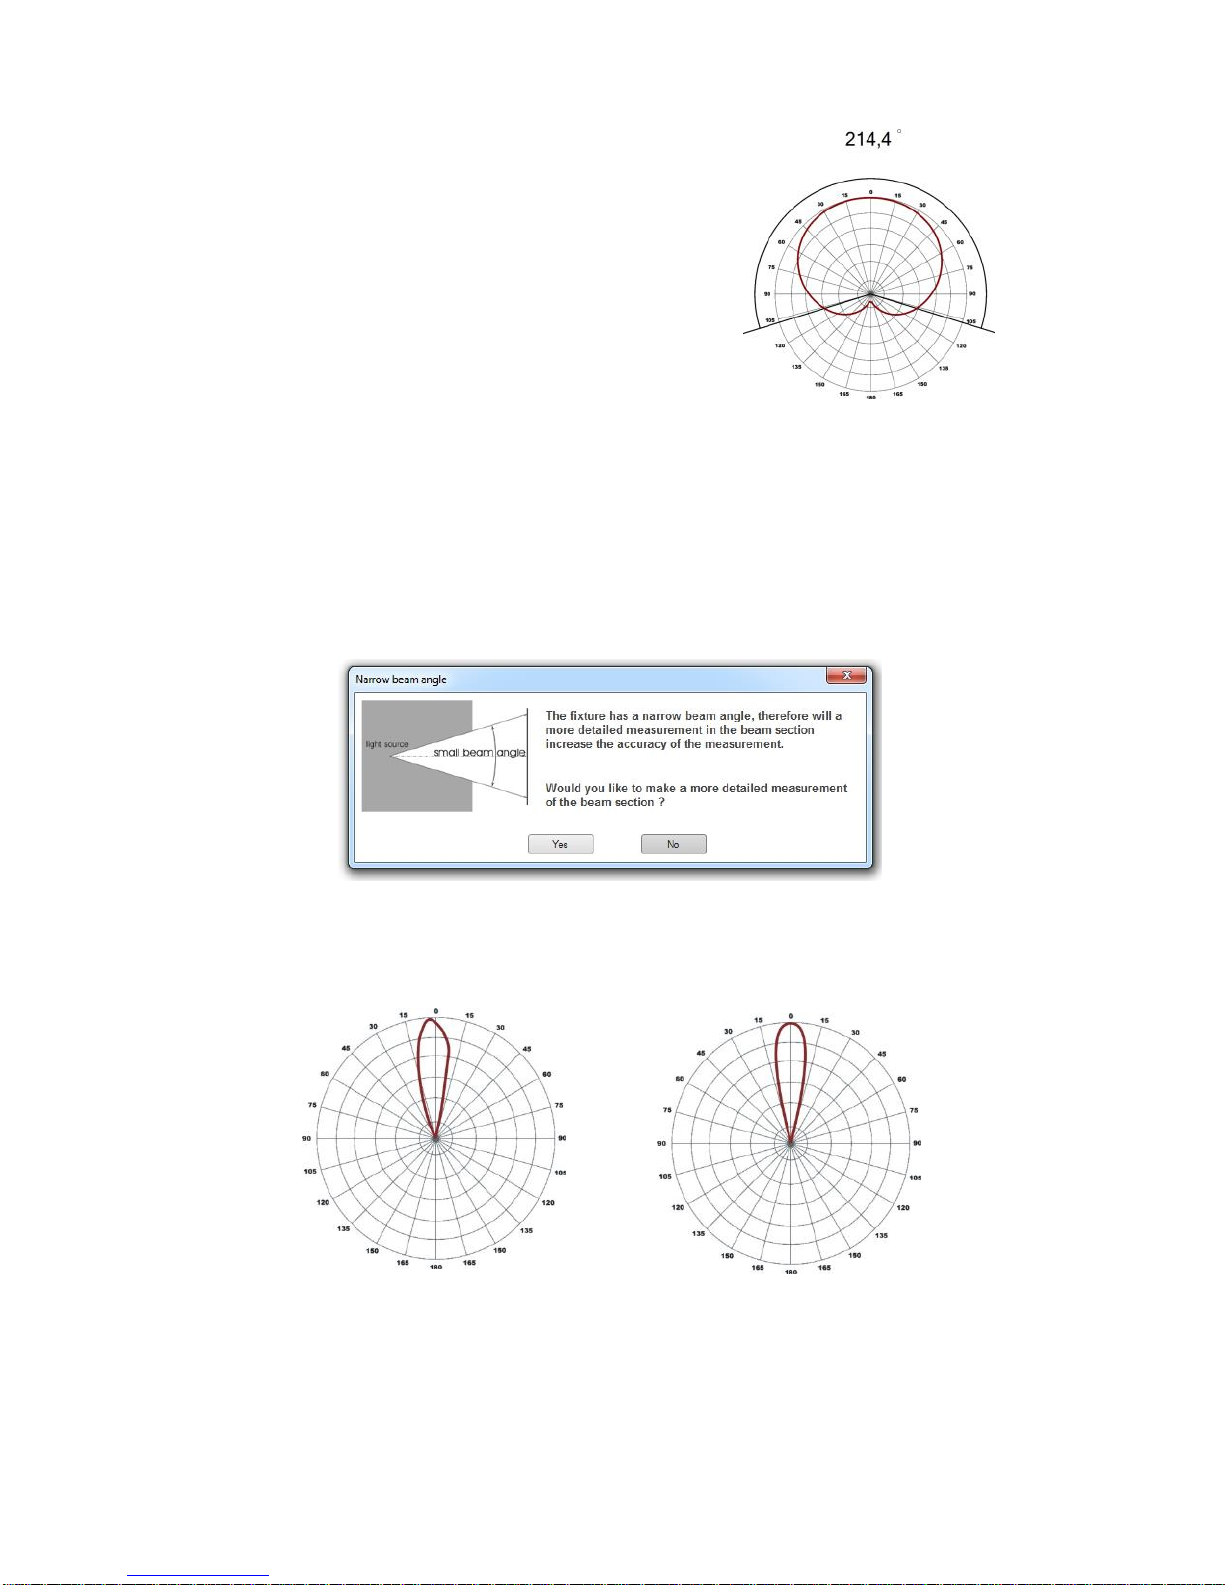
The complete 360 degrees angular
light field is then measured and the
beam angle is calculated.
Light sources having a narrow beam angle can result in the
number of measurements made in the beam section being
too few to generate an accurate measurement. In this case
will the “Viso Light Inspector” software automatically ask
you if you want to make a more detailed scan of the beam
section.
The increase in measurement quality after a detailed rescan of the narrow beam section can be seen below.
Page 22
22 LabSpion user guide
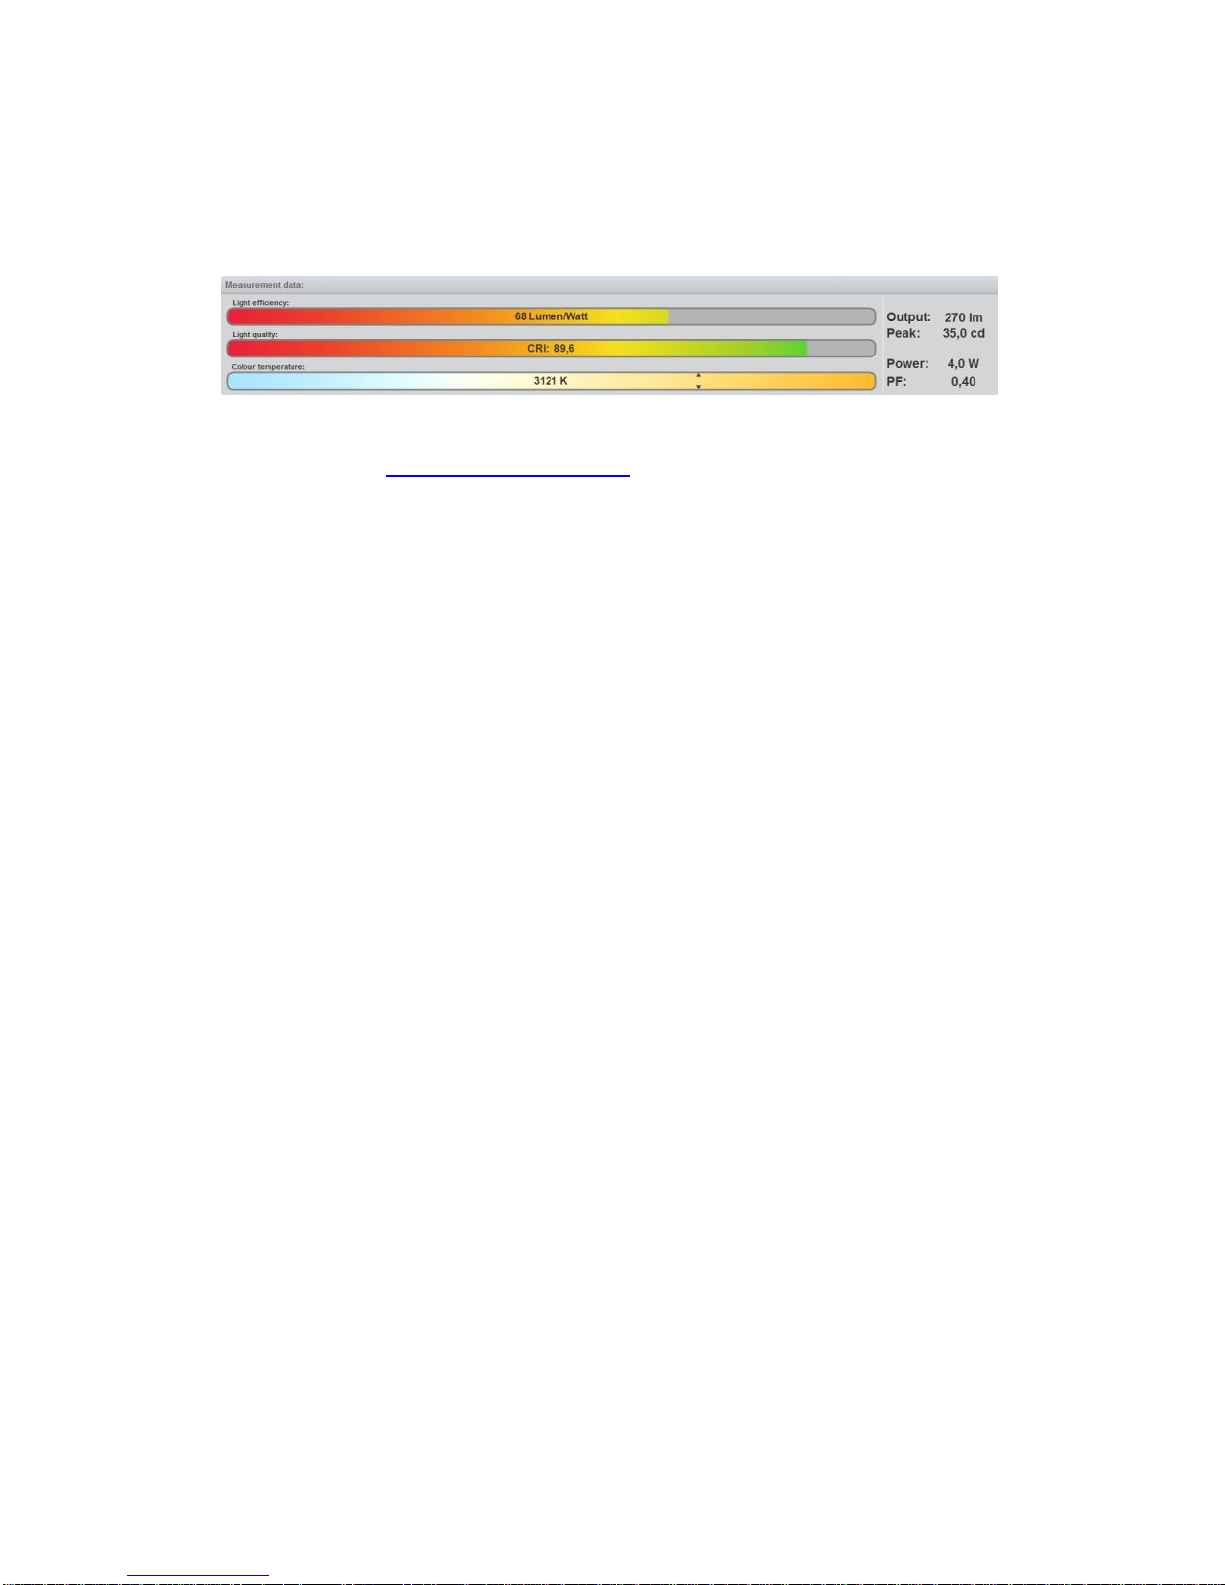
When the measurement is complete is the total luminous
flux is calculated in lumen and CRI, lumen/watt, peak light
output in candela, power and power factor, is also
calculated.
Further details about the measurement data can be found in
the chapter “Measurement data”.
Page 23
23 LabSpion user guide
Manual power control
It can in some cases be necessary to control the light
source power manually. Such a case could be when
measuring a flash light which is powered using batteries
where the LabSpion’s power analyser is unable to turn on
and off the light source automatically. Another case could
be when measuring a low voltage light source such as LED
chips with external power supply that has a low response
time when turned on and off and therefore would give an
inaccurate result of the ambient
light level.
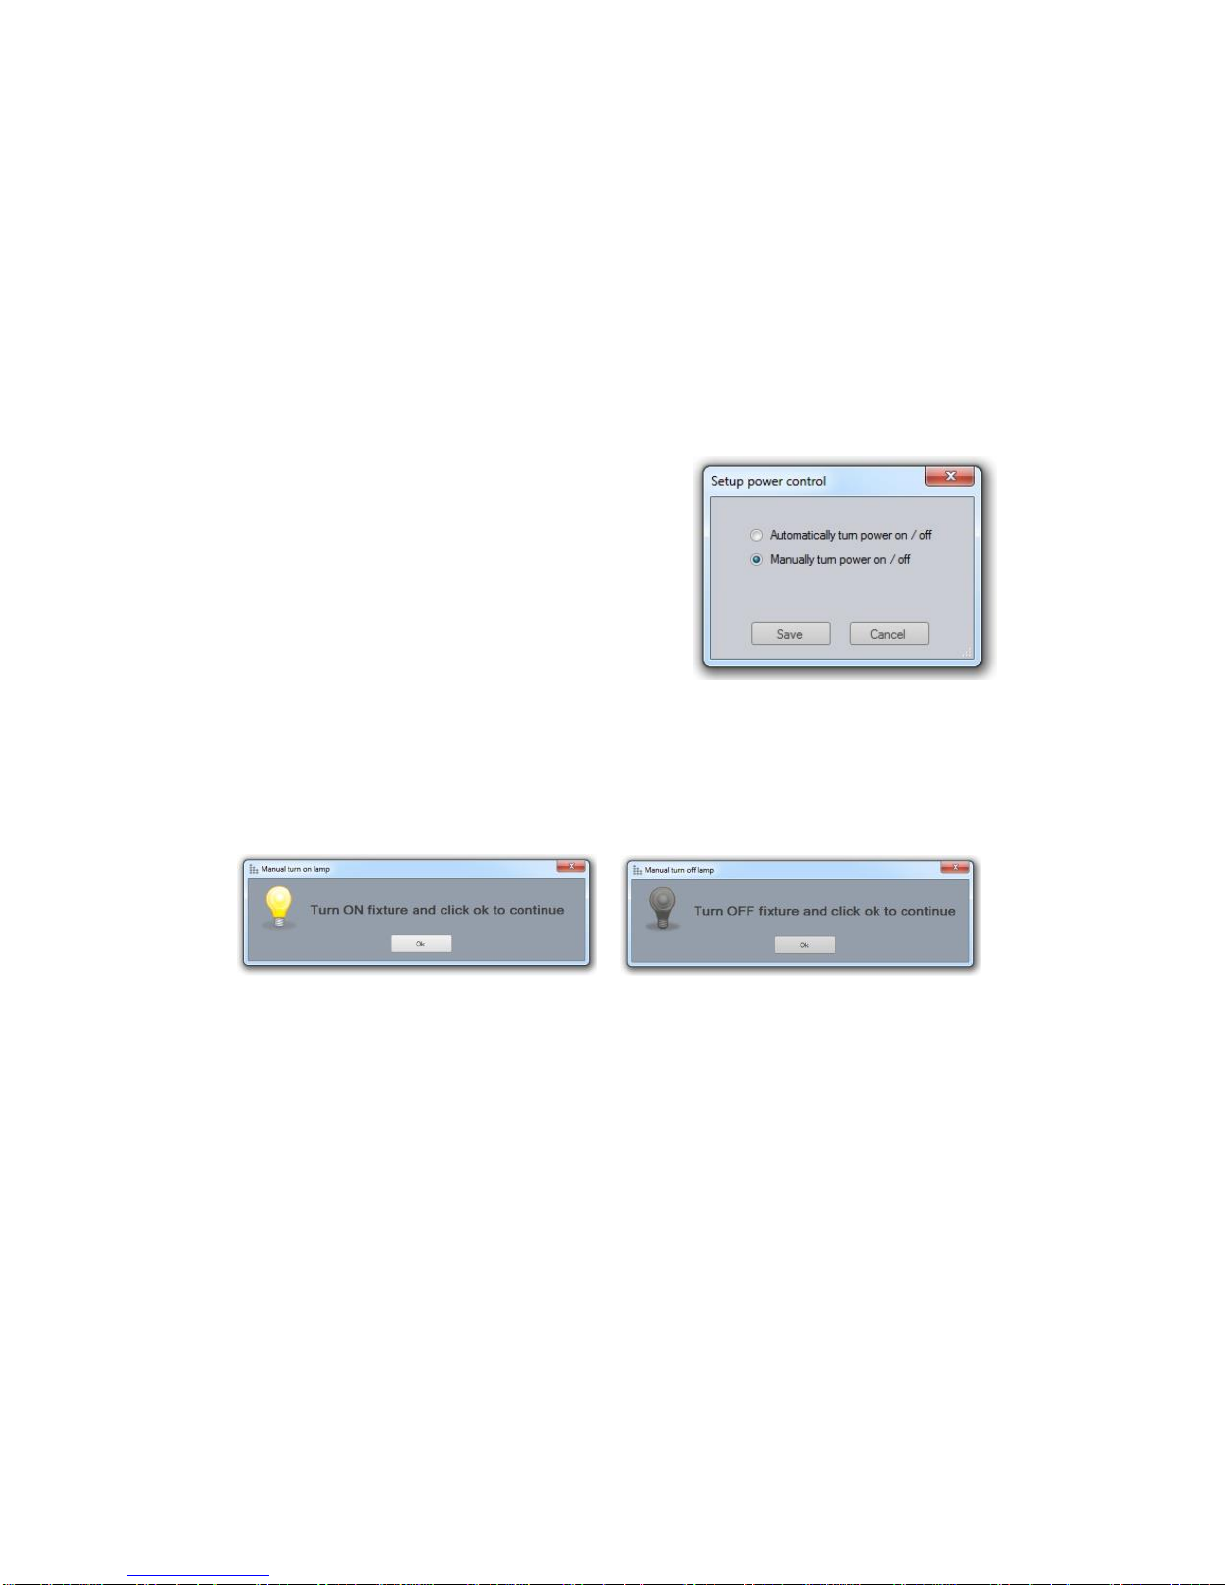
To enable manual power control
simply select Setup->Power
control and select manual power
control.
When manual power control has been selected will the
“Viso Light Inspector” ask you manually to turn on and off
the light source when necessary as shown below.
Page 24
24 LabSpion user guide
Manual integration time setup
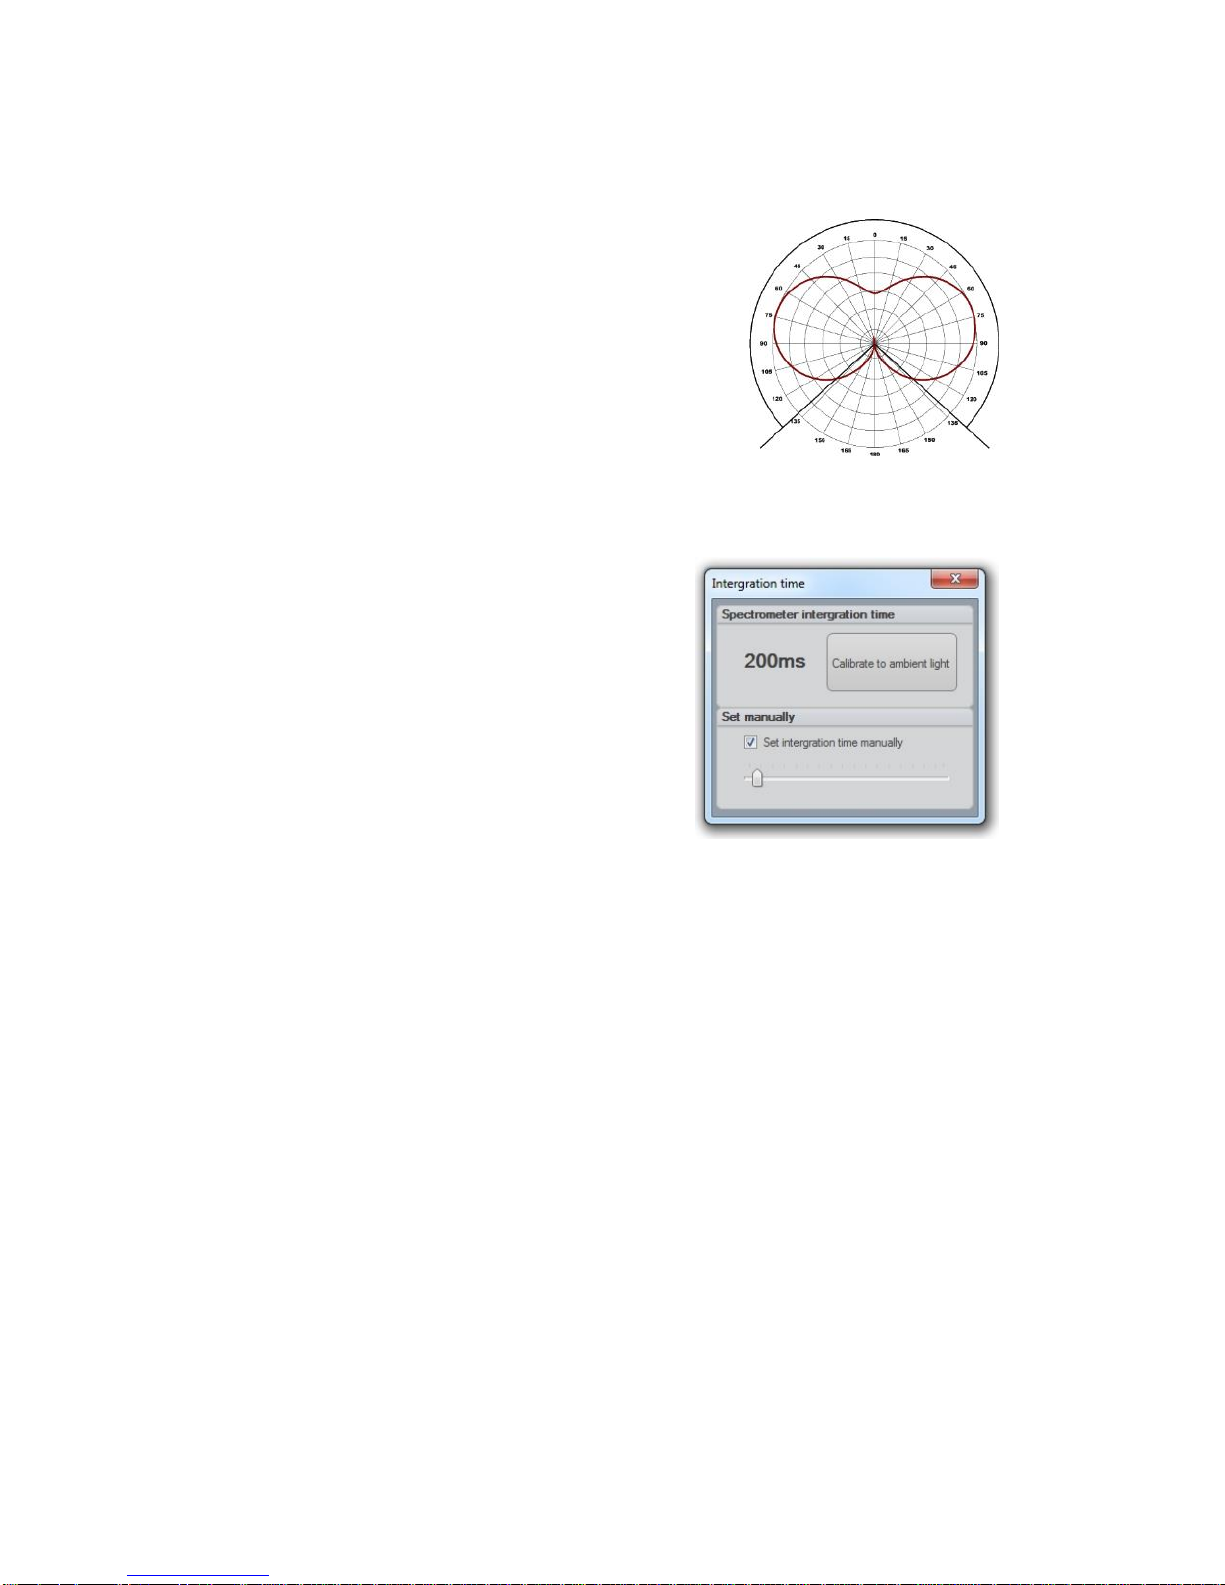
It can in some rear cases be desirable to setup the
integration time of the photo
spectrometer manually. One case
could be when measuring a light
source emitting most of the light to the
sides instead of in direction of centre.
As the automatic setup of integration
is done in the centre at 0 degrees
could the integration time be set to high, resulting in the
saturation of the photo spectrometer giving an inaccurate
measurement.
The integration time of the photo
spectrometer can be set manual
by selecting Setup->Integration
time.
Page 25
25 LabSpion user guide
Free running spectrometer
The photo spectrometer can also be used as free running to
test different light sources that might be too large for a
complete goniometer measurement or just to have a realtime update of how a light source behaves over time.
To start the photo spectrometer free run
simply click on the start spectra scan icon
During free run mode is light output in candela, CRI, and
colour temperature continuously updated.
The integration time can be changed during free run scan
as explained in previous chapter to ensure correct
resolution.
NOTE: After changing photo spectrometer integration time
should the spectra be “Calibrated to ambient light”.
Page 26
26 LabSpion user guide
Measurement data
After a goniometer measurement is complete will the
following results be displayed.
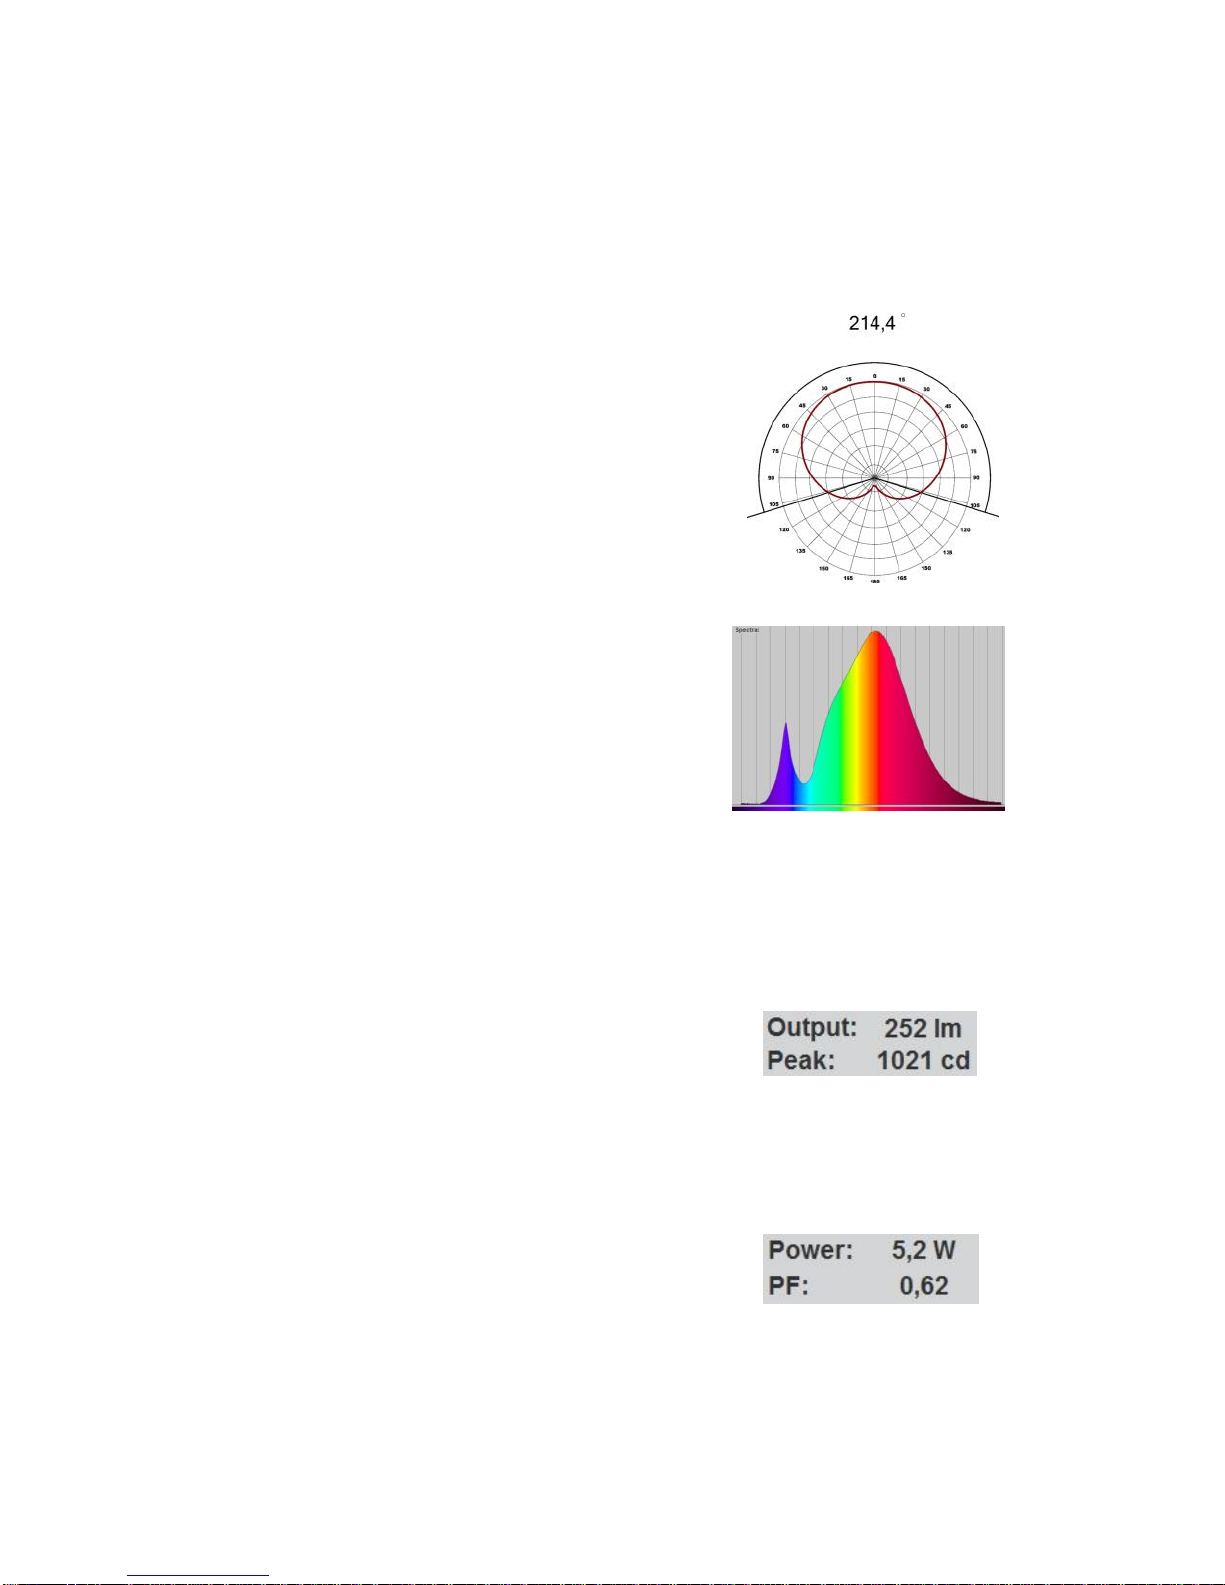
1. The angular light distribution shows
the amount of light of the non-rotation
symmetrical part of the light source.
This field distribution is used to
calculate the beam angle.
2. The complete integrated spherical
spectra is shown in the spectra
window. Integrated spherical spectra
means that it is a spectra that is
created based on all the radiated
spectra’s in all angular direction
measured, this means that the
displayed spectra will be equal to that measured using an
integrating sphere.
3. The complete integrated spherical spectra calculated in
step 2 is used to calculate the complete
luminous flux in lumens.
The peak output in candela is also
displayed, which is the highest level of light output
measured during goniometer measurement.
4. The power is measured by sampling
voltage and current at a rate of 50.000
samples per second to ensure high
resolution and thus high power precision.
Page 27
27 LabSpion user guide
The power factor (PF) which indicates the quality of power
consumption where 1.0 is the best normally achieved by a
pure resistive load such as a tungsten lamp and where 0.0
is the worst. The power factor (PF) value should be
between 1.0 - 0.5 to be within a satisfactory level. Please
refer to quality charter standards for different countries and
regions to acquirer power factor limits.
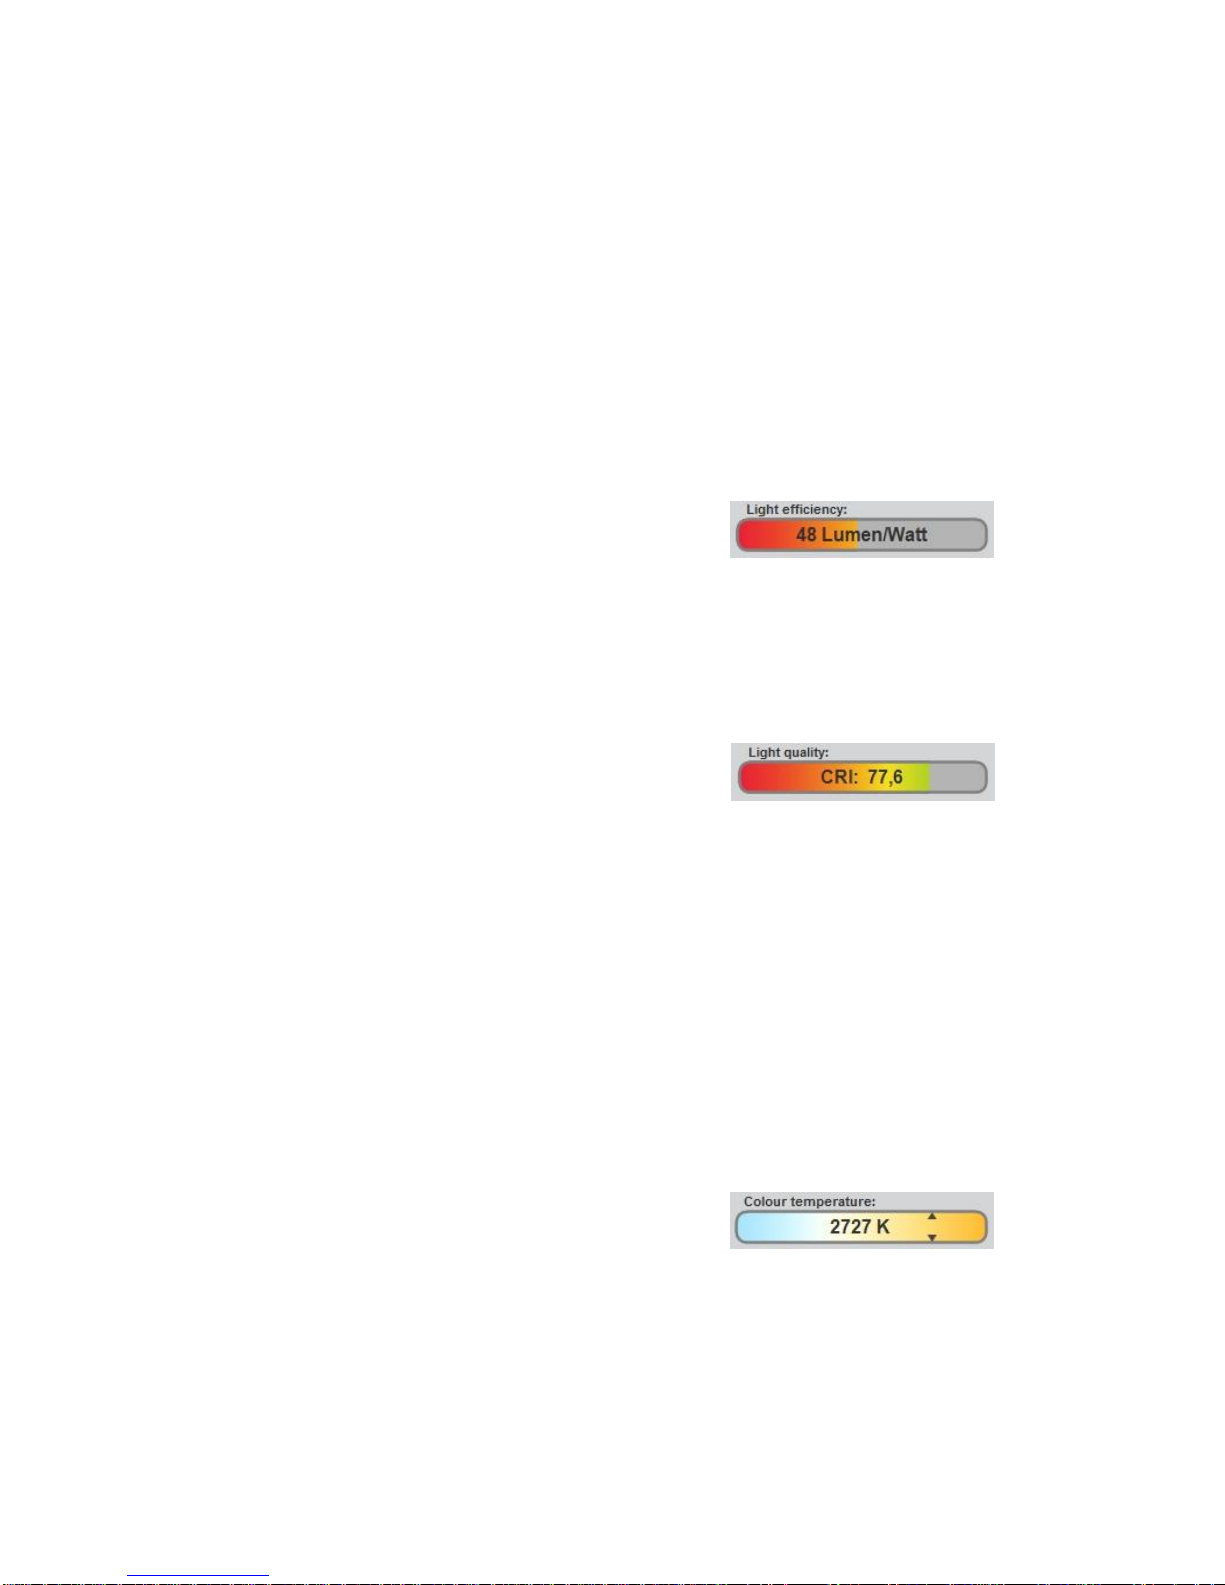
5. The efficiency in lumens per watt is calculated by dividing
lumens with power consumption. The result is display in the
efficiency bar where 100 lumen/watt
it displayed as most green. The
scientifically maximum value of 100% efficacy is 683
lumen/watt.
6. The CRI is calculated using 8 reflectance standard colors
to calculate the ability of the light to
reflect colors thus indicating the
quality of the light radiated. 0 being
the worst quality and 100 being the best quality equal to
that of the sun.
The CRI can only be used for white light, if CRI is not
displayed is indicating that the radiated light does not meet
the criteria for white light or that light levels are too low to be
measured.
7. The color temperature indicates the color of white light
and is displayed in kelvin. Where 6000K is observed as cold
and 2500K as warm. The kelvin
scale is derived from the temperature
of the tungsten filament thus explaining that high
temperature of the filament results in cold light and vice
versa. If color temperature is not displayed is indicating that
Page 28
28 LabSpion user guide
the radiated light does not meet the criteria for white light or
that light levels are too low to be measured.
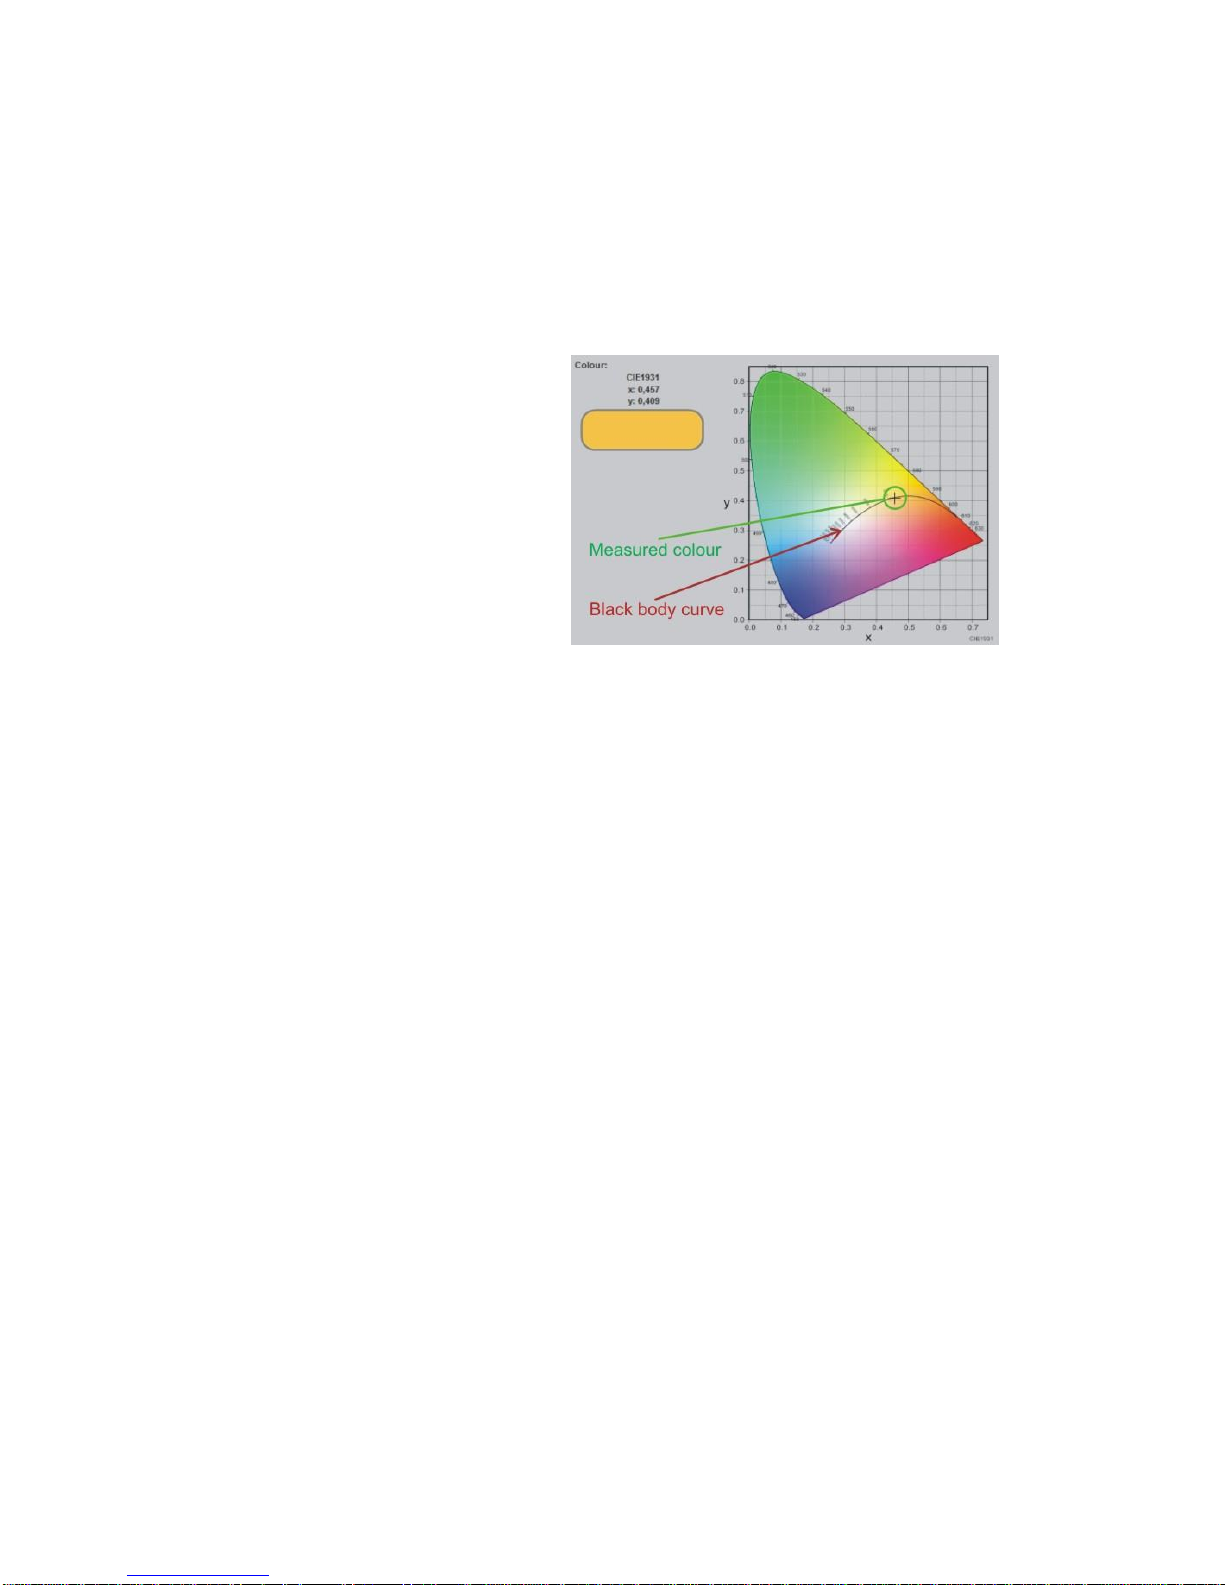
8. At maximized view is the color radiated shown as x,y
coordinates in a CIE1931 diagram. The CIE1931 diagram
illustrates all colors visible to the human eye, and is based
on experiment made in 1931 with a series of test persons to
find out how the human
eye observes colors.
The black line in
diagram is called the
black body curve and
illustrates all colors that
are defined as white
colors from warm to
cold. The point of the
measured color is shown with a black cross and can be
used to check the whiteness of a color, by checking how
close it is to the black body curve, the closer to the black
body curve the more accurate white is the color.
Page 29
29 LabSpion user guide
Power details
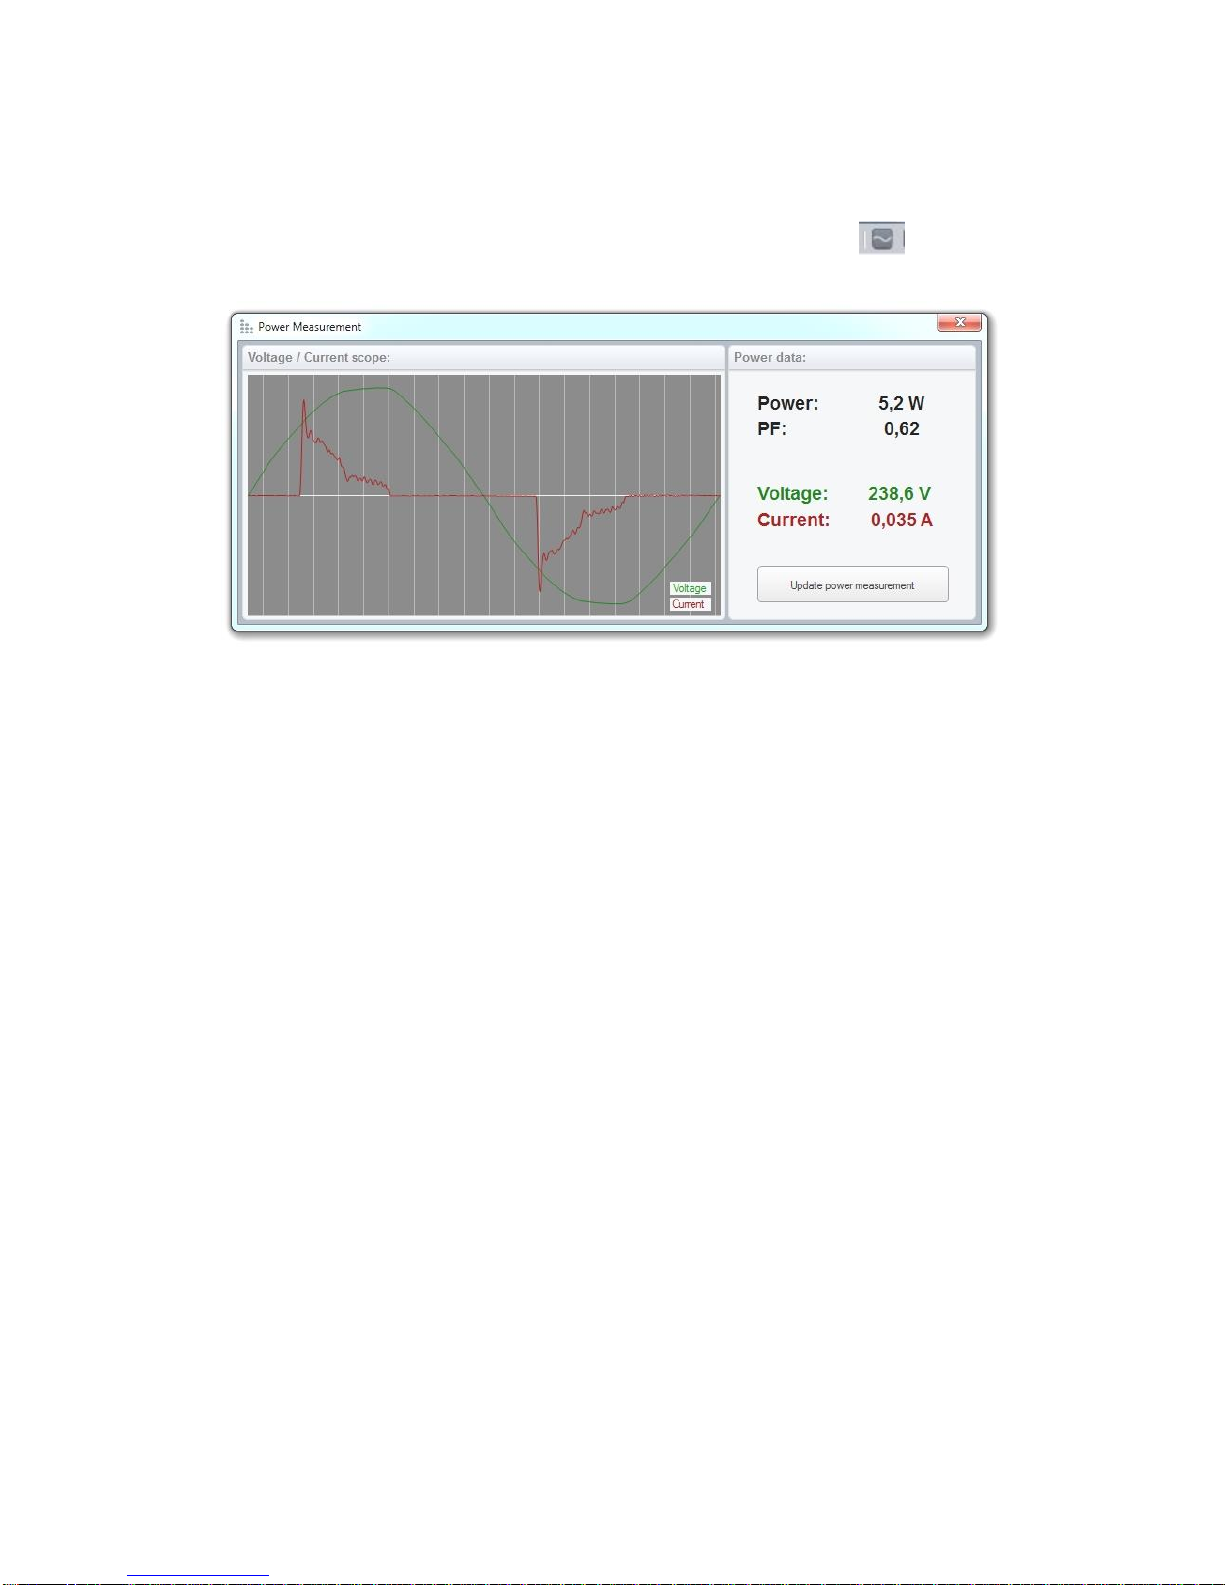
A detailed voltage and current scope can be viewed by
clicking on the scope button or selecting “View-
>Power details”
In the power details window can the time scope of the
voltage and current be seen where the green line illustrates
voltage scope which should be a sinus curve. The top of the
voltage sinus curve can in some cases have a flat top due
to distortion from the power grid. The current is illustrated
with a red line and displays how current is consumed by the
light source.
The power factor is an indication of how well the current is
consumed through a voltage period. The power factor is
calculated by taking real consumed power and divide it by
the product of the voltage and current independently as
shown here: PF = Power / (Voltage x Current) = 5,2 / (238,6
x 0,035) = 5,2 / 8,35 = 0,62.
When current is not consumed by the light source efficiently
will it consume more current than necessary and therefore
must the cabling in an installation be dimensioned
accordingly. Consuming more current will also increase the
loss of power due to heat in cables etc. A rule is that a 10W
light source of a power factor 0.5 must be connected to an
installation capable of supplying 20W, and can be
calculated like this. Installation W = Power / power factor.
Page 30
30 LabSpion user guide
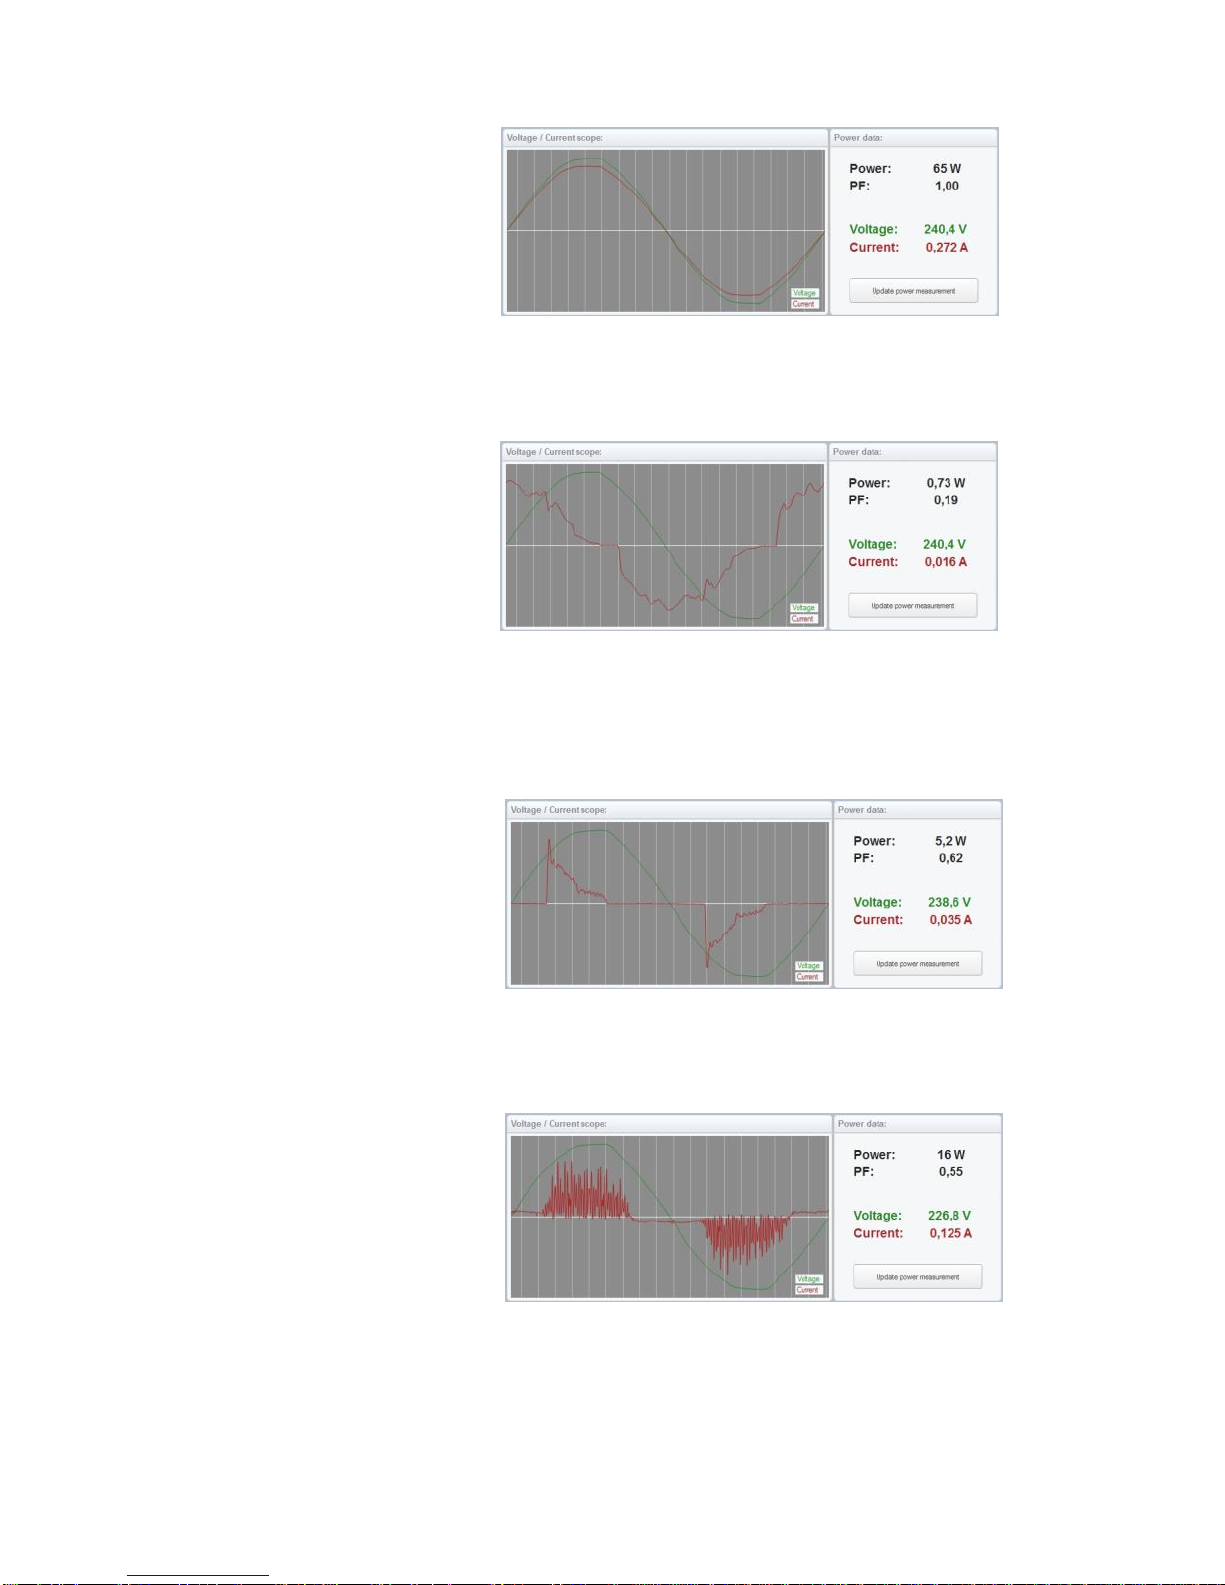
Example 1
Shows a standard
60W tungsten bulb
having a perfect
power factor of 1.0
with a current
shape that is identical to the voltage shape.
Example 2
Shows a LED bulb
that has passive
capacitive power
supply which
results in high
phase shift between current and voltage and thus resulting
in a very low power factor of 0.19.
Example 3
Shows a LED bulb
having a medium
quality switch-mode
driver with a high
capacity peak load
and thus a medium quality power factor of 0.62.
Example 4
Shows a LED bulb
having a switchmode driver with
very bad filtering
resulting in very
high noise level of the current. This level of noise would
probably not be able to pass EMC noise level requirements.
Page 31
31 LabSpion user guide
CRI details
The CRI describes the quality of white light also known as
the Color Rendering Index or Ra. The value describes how
full the spectra is, thus how good the light is to reflect colors
of an object being illuminated.
The CRI is calculated using test colors to test chromatic
adaptation of the light according to the test colors.
The test colors consist of 15 test colors but only the first 8
known as R1-R8 is used to calculated the CRI, the
remaining R9-R15 are not used. But LED lights can in some
cases be missing the red light component contained in R9
which is not included in the CRI measurement therefore has
it been common to measure the R9 component as well.
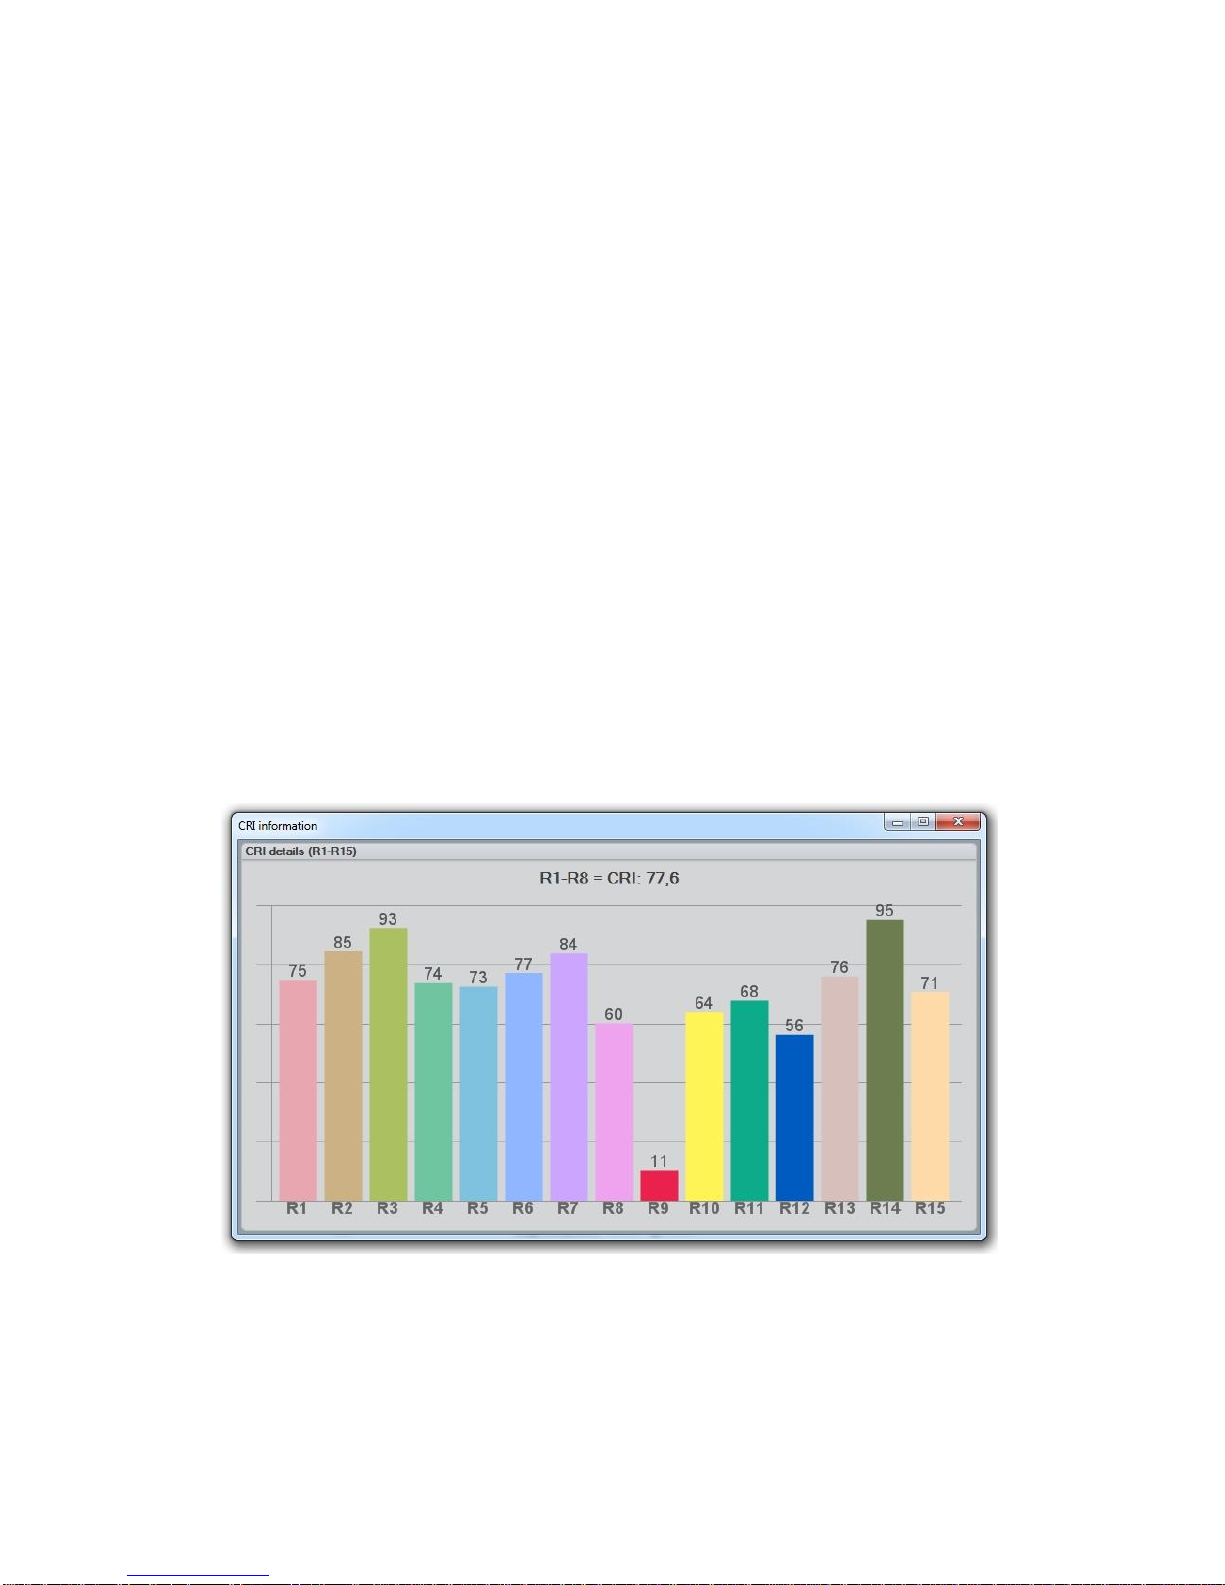
R9-R15 values can be view by opening the CRI details
window by clicking on the CRI bar or selecting View->CRI
details.
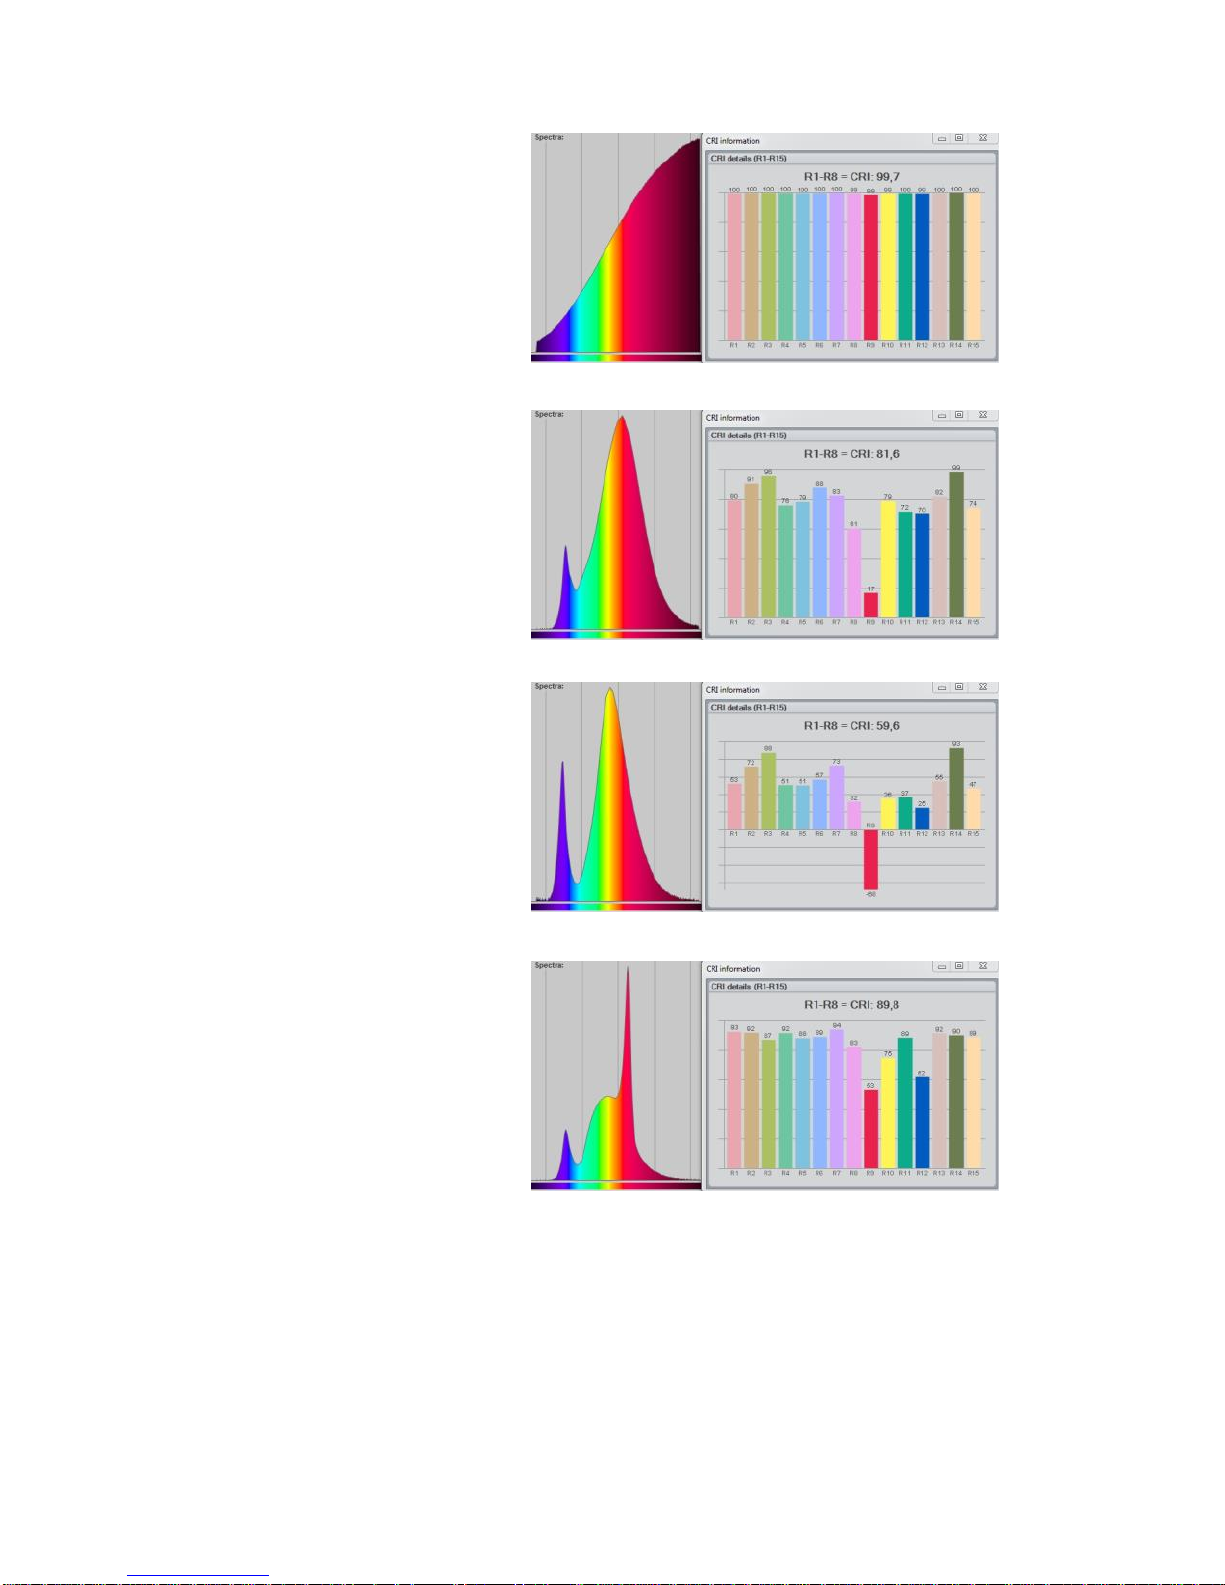
We can see from the CRI details above that the level of red
light R9 is quite low compared to the rest. R9 can in some
cases become negative due to very low levels of red light.
Page 32
32 LabSpion user guide
Example 1
Shows a standard
tungsten lamp having
a full high color
response on all test
colors.
Example 2
Shows a Philips LED
bulb having low red
R9 value.
Example 3
Shows a standard
LED bulb having a
negative red R9 value
due to the lack of red
light in the spectra.
Example 4
Shows a LED bulb
having red LED’s
added to boost the
red R9 to higher
levels.
Page 33
33 LabSpion user guide
Spherical limit
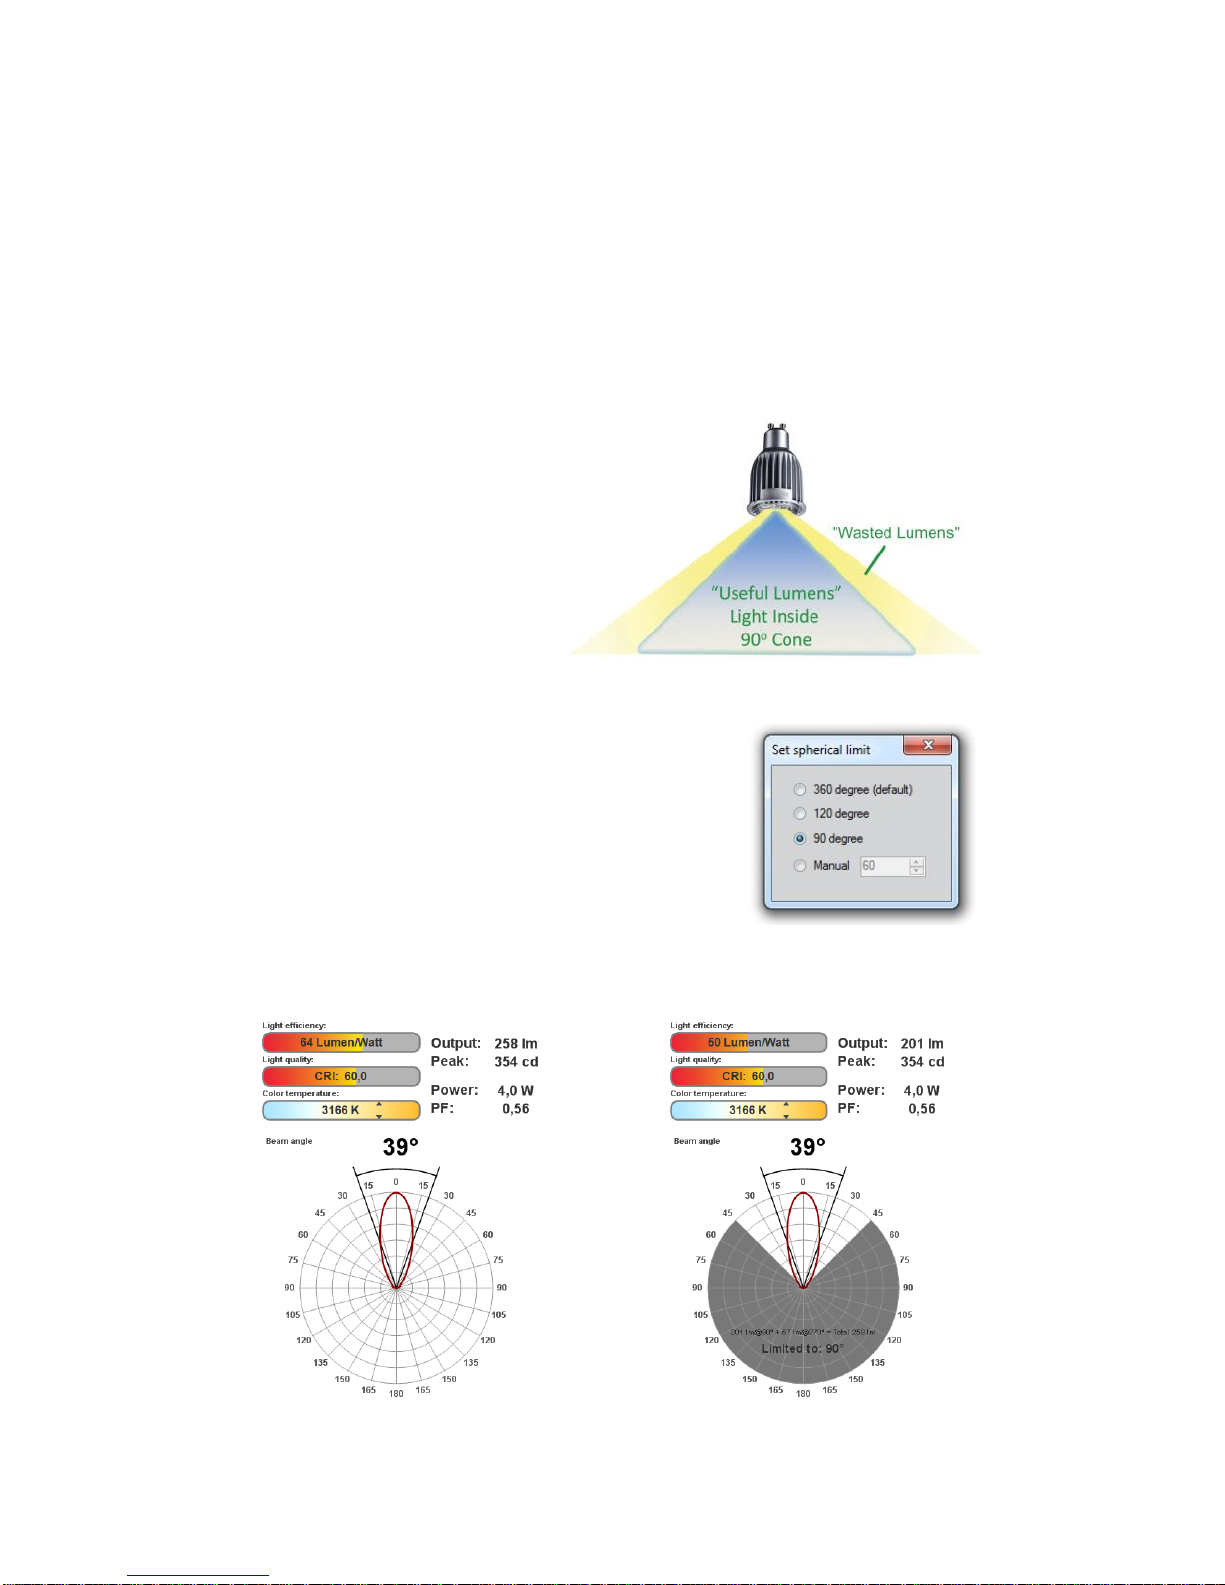
Spherical limit allows the user to limit area of lumen
integration, this is also known as measuring luminous flux in
a Φ cone.
Luminous flux measurement is normally done at full 360° in
all direction. But new EU regulations (EU No 1194/2012)
require that directional
lamps are measured in
a 90° or 120° cone,
meaning that only light
illuminated in the cone is
calculated efficient
luminous flux.
The spherical limitation can be set by
clicking Edit->Spherical limit.
Spherical limitation does not need to
be set before making a measurement
but can be set afterwards, also on
previous made full 360°
measurements. Below is an example of difference in lumen
at 90° cone, where 57 lm is wasted outside the 90° cone.
Page 34
34 LabSpion user guide
Attaching pictures
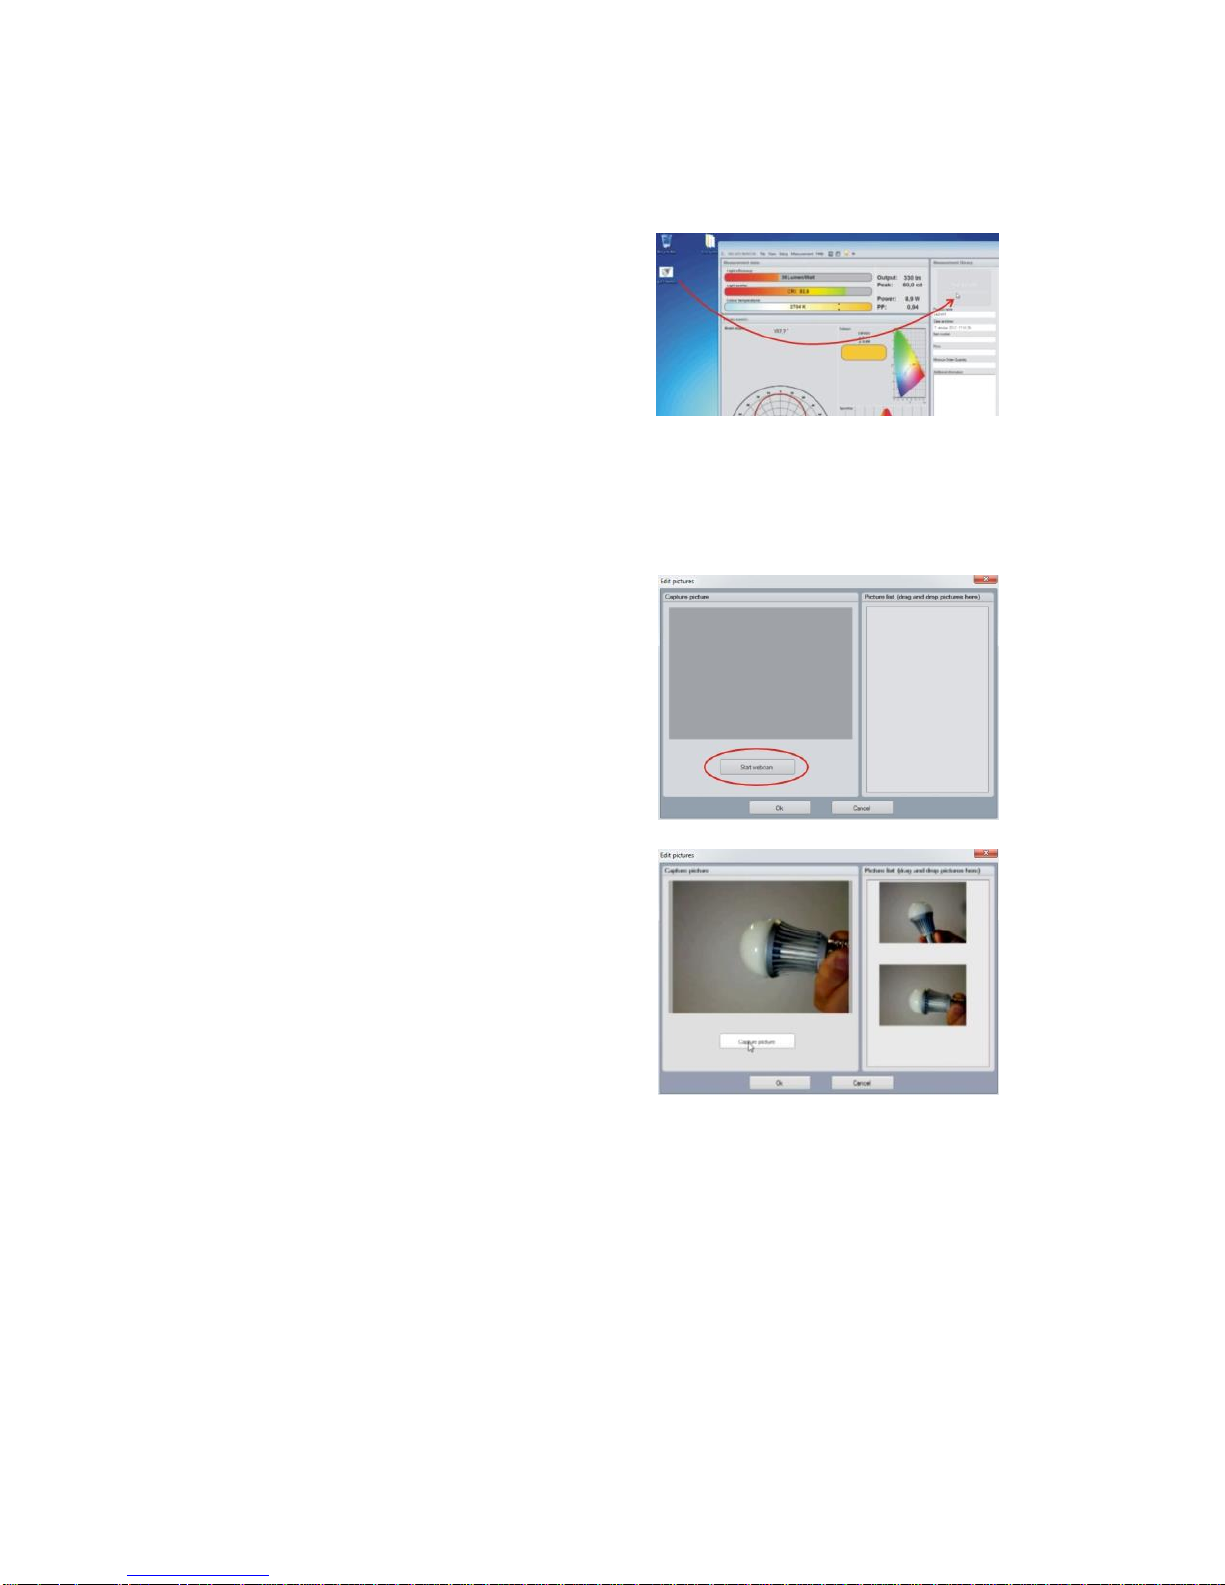
It is possible to attach pictures
to your measurement simply by
dragging and dropping a
picture to the picture frame.
It is also possible to use the webcam to quickly snap
pictures of the light source measured to have a quick
reference. To use the webcam
simple click on the picture
frame to open picture editor.
Then just click on the start
webcam button, the webcam
will then start and as many
pictures as desired can be
added. The first pictures in the
picture editor will be used as
primary picture which is shown
as default with the
measurement.
Pictures can be moved or
deleted by right clicking on
each pictures.
Page 35
35 LabSpion user guide
Saving measurement
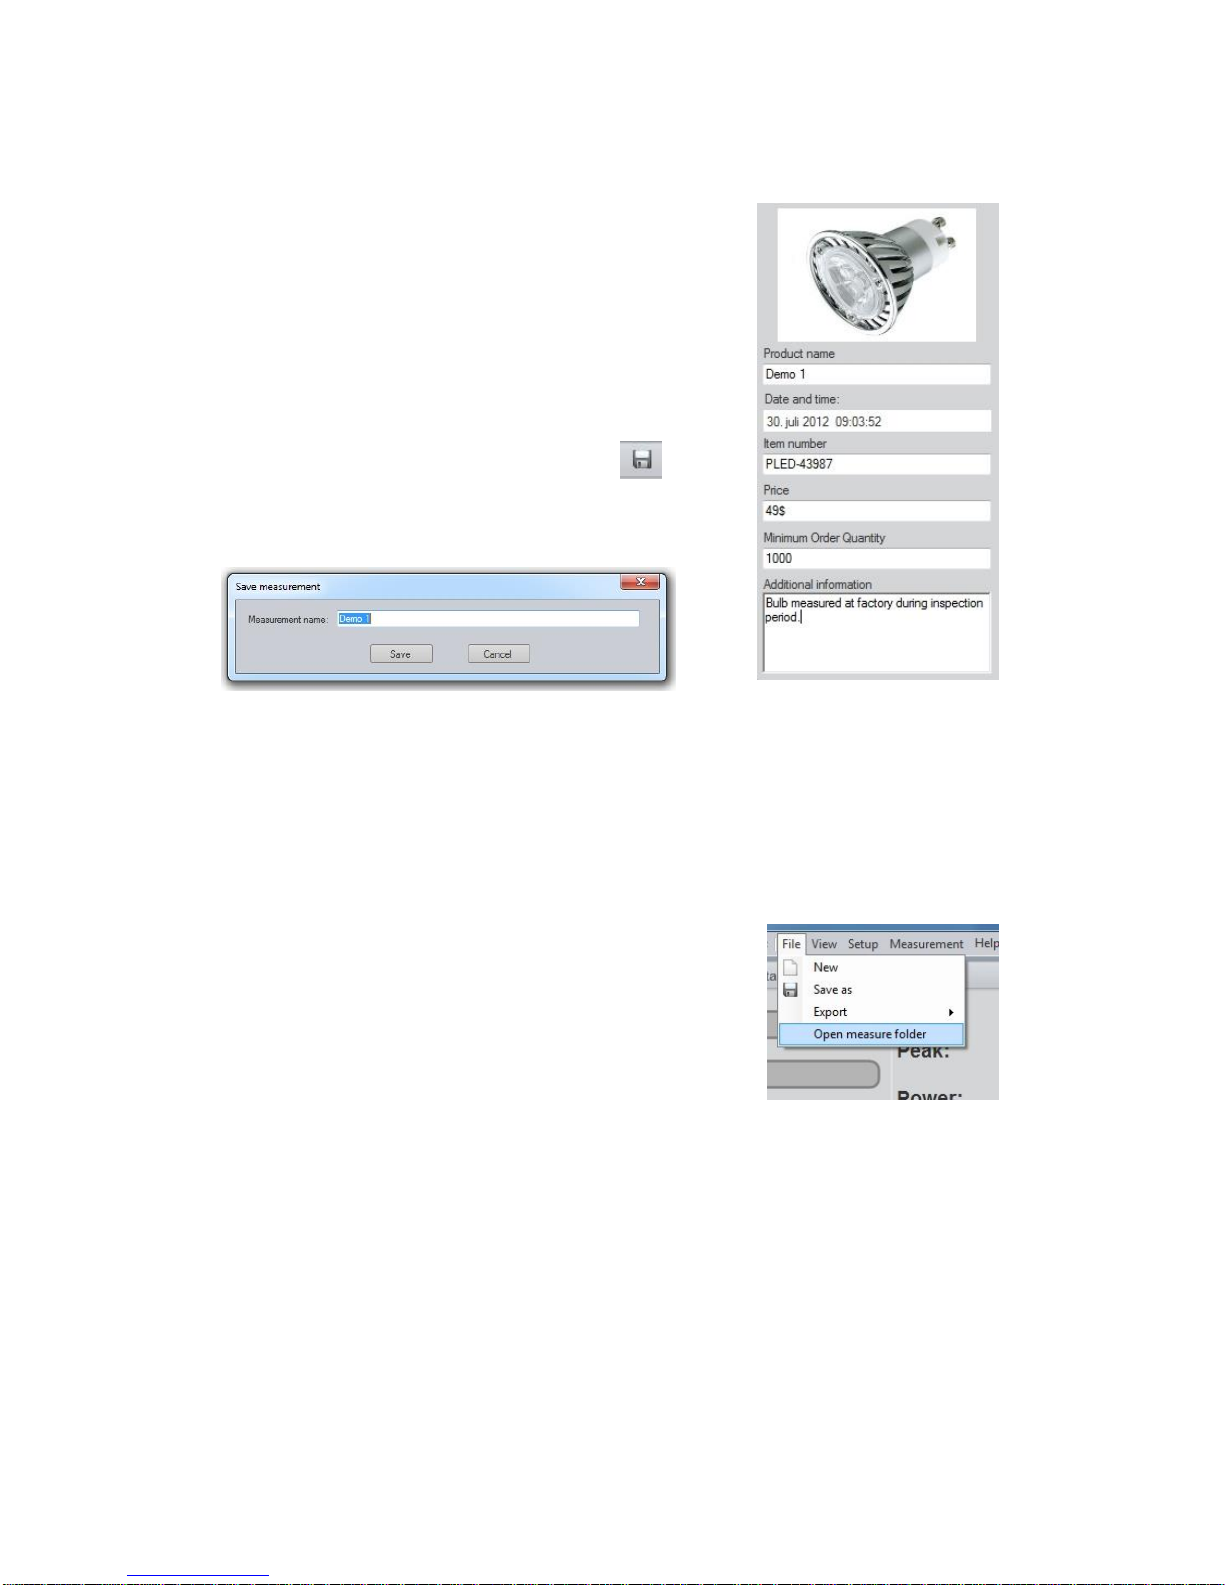
Before saving a measurement can
information about the measurement be
filled in to be stored along the
measurement as show.
To save the measurement simply click
on the save icon or select
File->Save as.
Measurement are stored in the Measurement library in
alphabetic order.
Measurements are physically stored in “My documents\Viso
Systems\Light Inspector\” as .fixture files.
The folder can also be opened selecting
file->Open measure folder. Files can be
copy and replaced as desired. If files
are added or removed must the
program be re-started before they
appear in the library explorer.
Page 36
36 LabSpion user guide
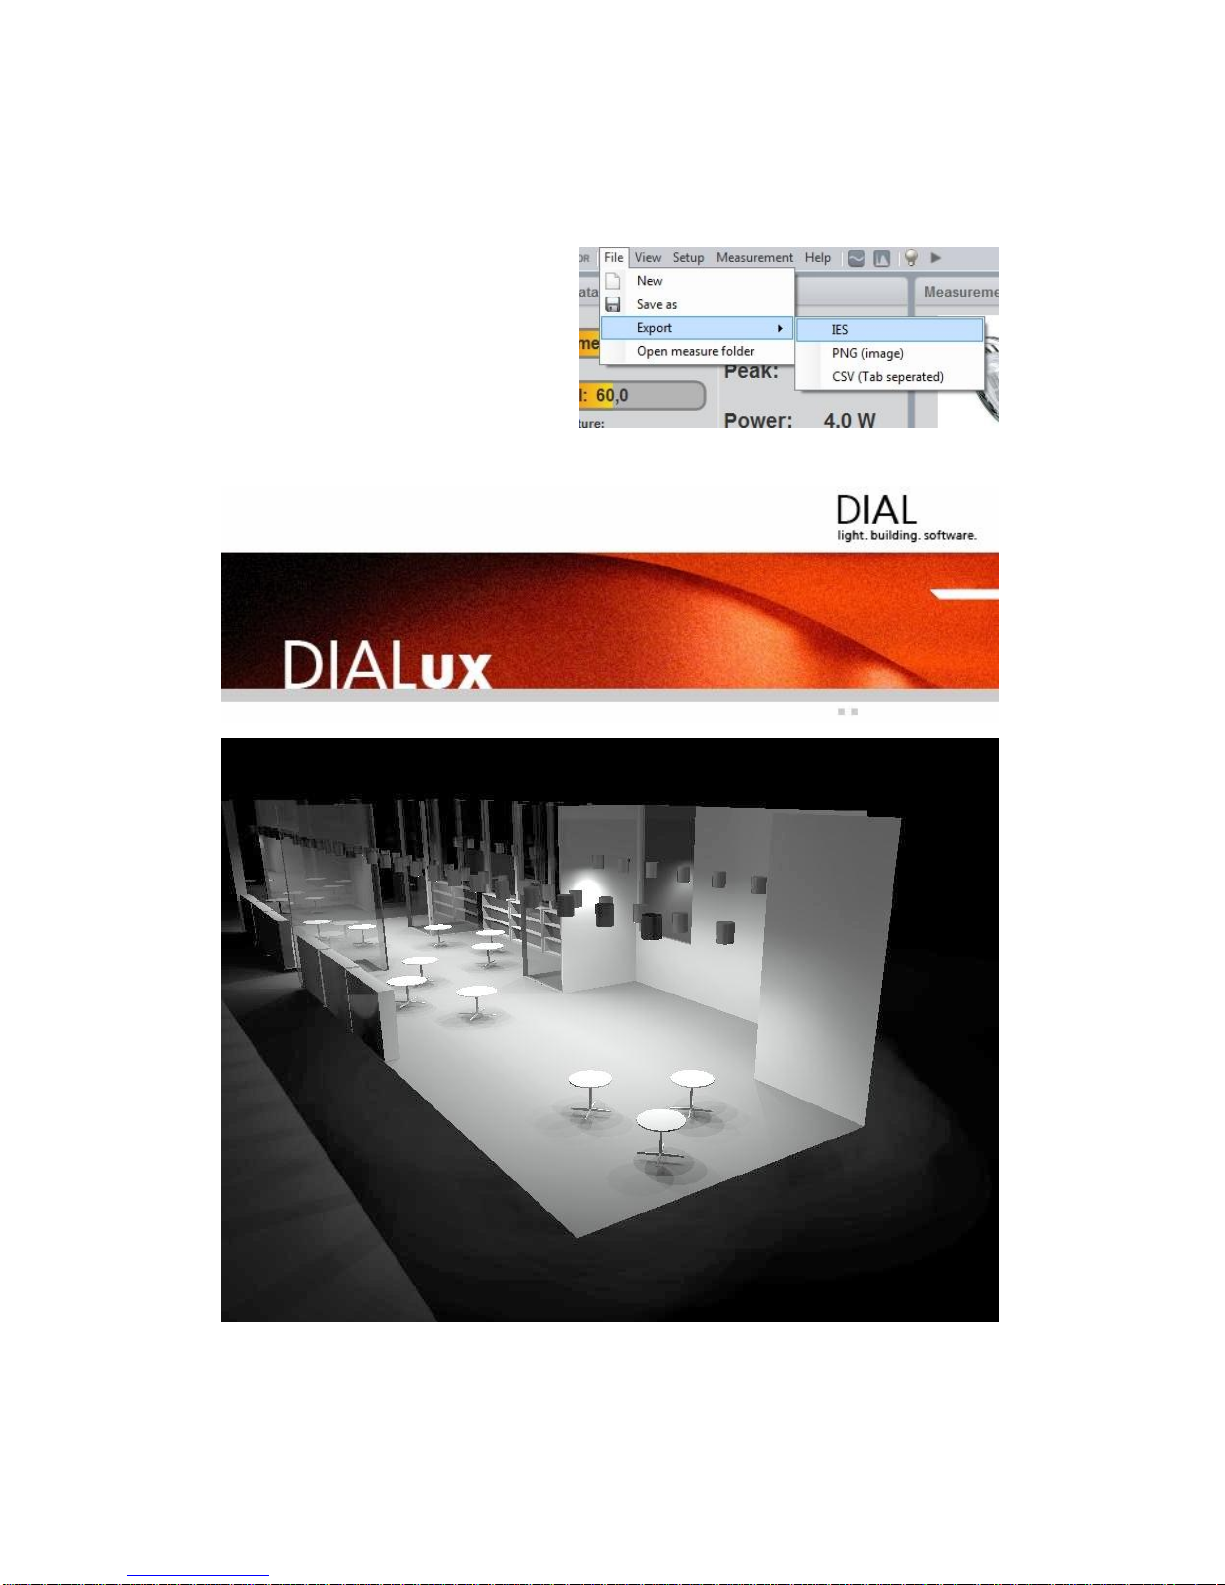
Exporting to IES/LDT
It is possible to export the measurement to IES or LDT
format to be used in
Dialux or other 3D
lighting design
application software. To
export to IES simply
select File->Export->IES
or LDT.
Page 37
37 LabSpion user guide
Exporting to PDF
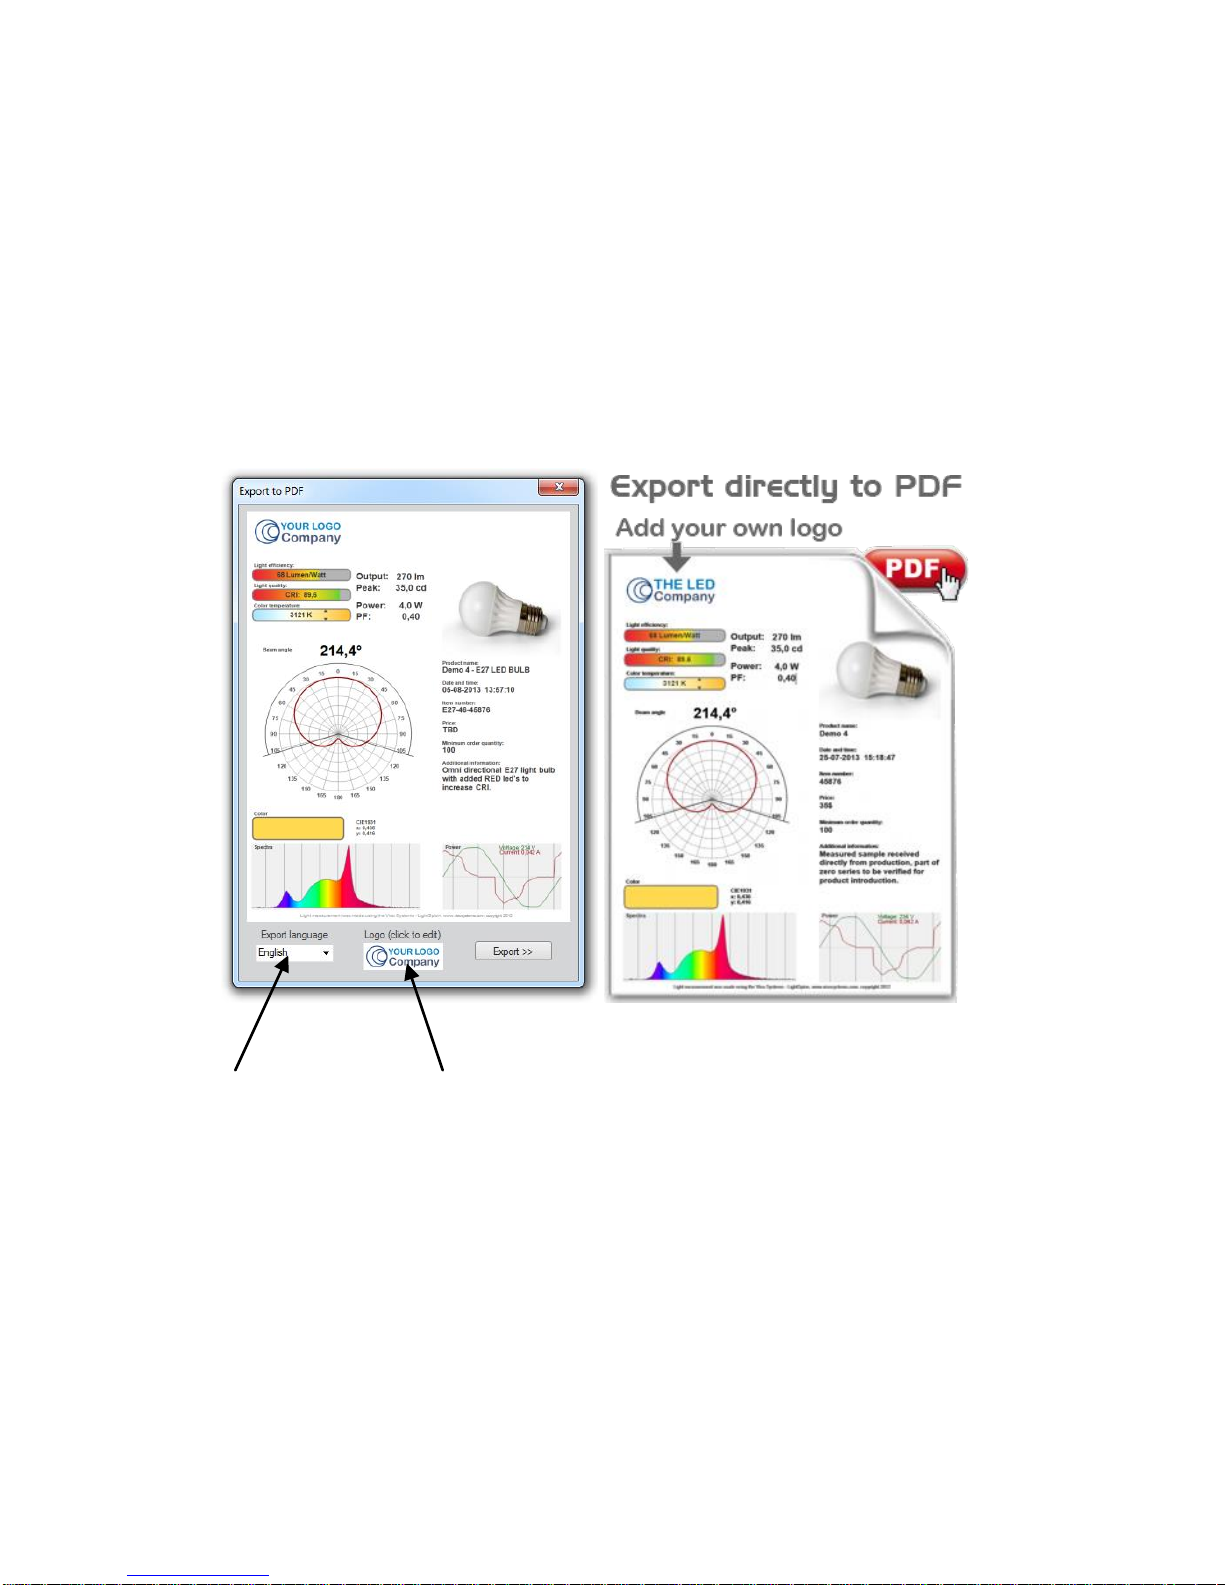
All measurements can be exported directly to a PDF
document just by selecting the measurement and then
clicking File->Export->PDF. It is also possible to implement
your own logo in the PDF, and export to different languages
such as English, German and Chinese. A typical export is
shown below.
Click and add logo
Select language
Page 38
38 LabSpion user guide
Exporting to PNG
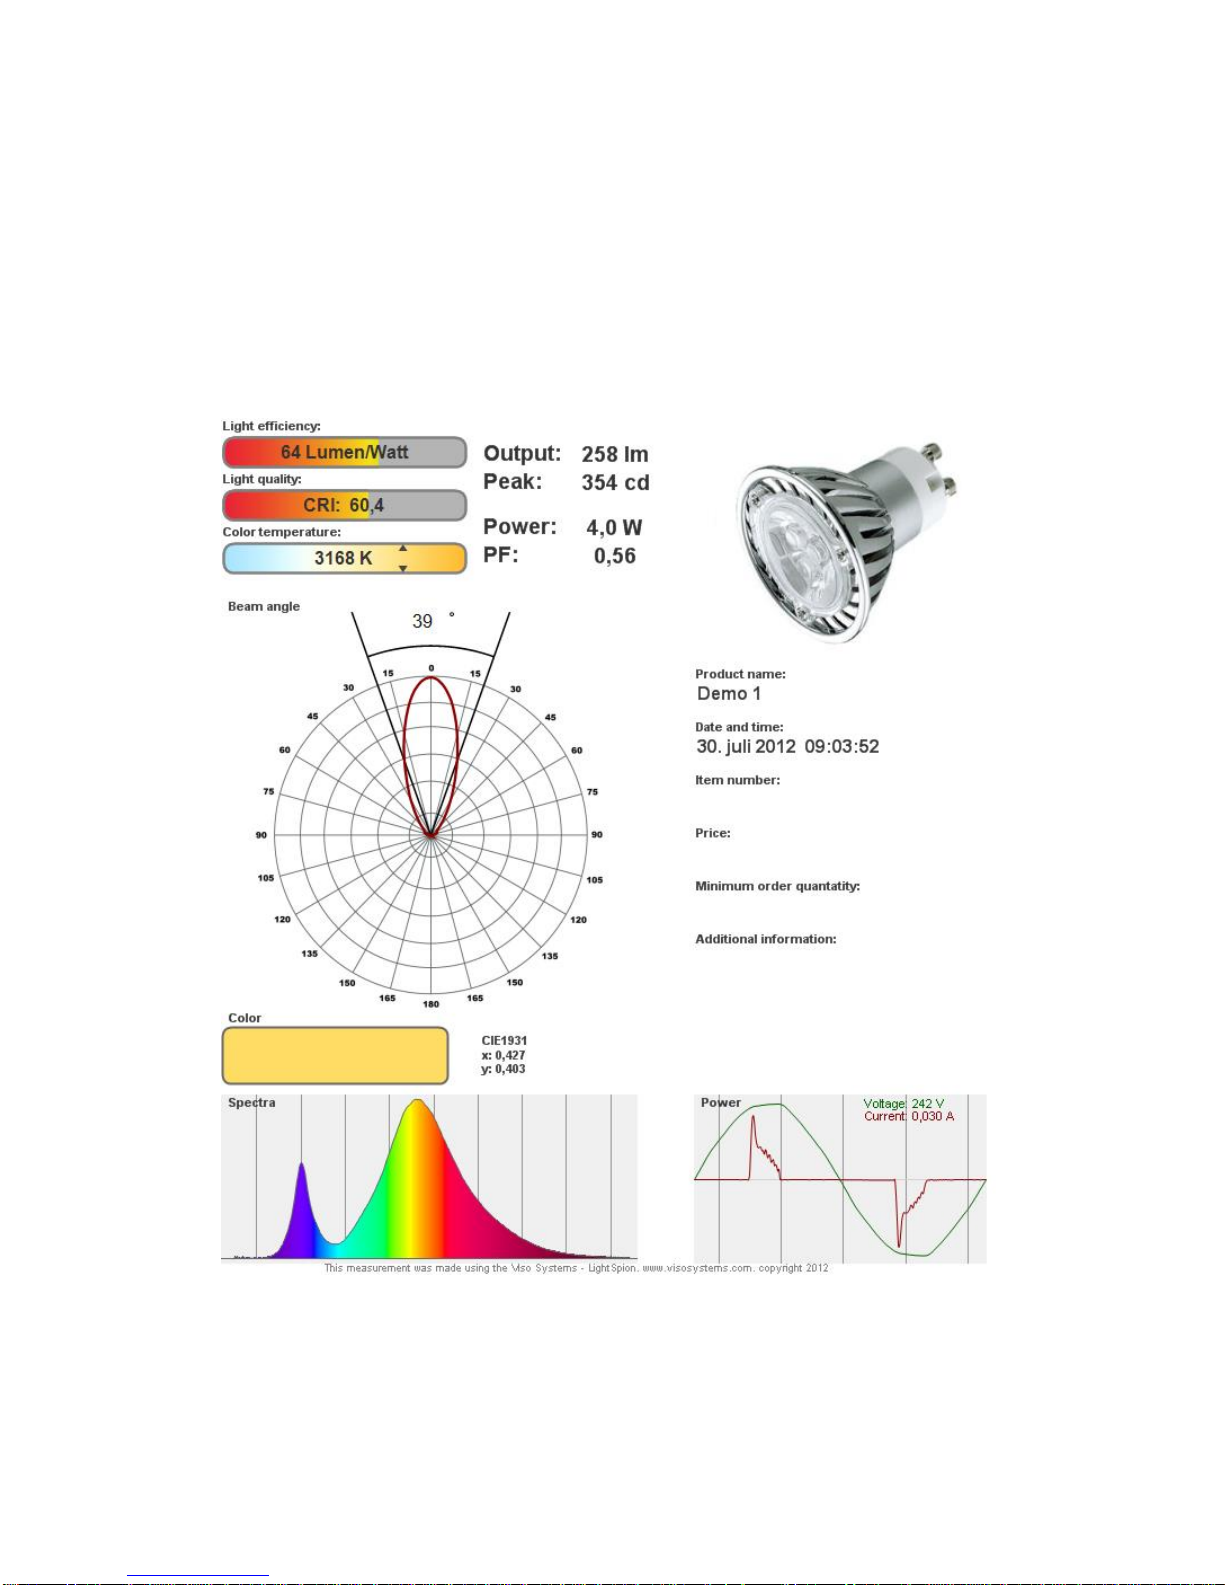
All measurements can be exported to PNG picture file for
use in reports, sales and marketing material. To export
simply select a measurement in your measurement library
and then select File->Export->PNG (Image). A typical
export is shown below.
Page 39
39 LabSpion user guide
Exporting to CSV
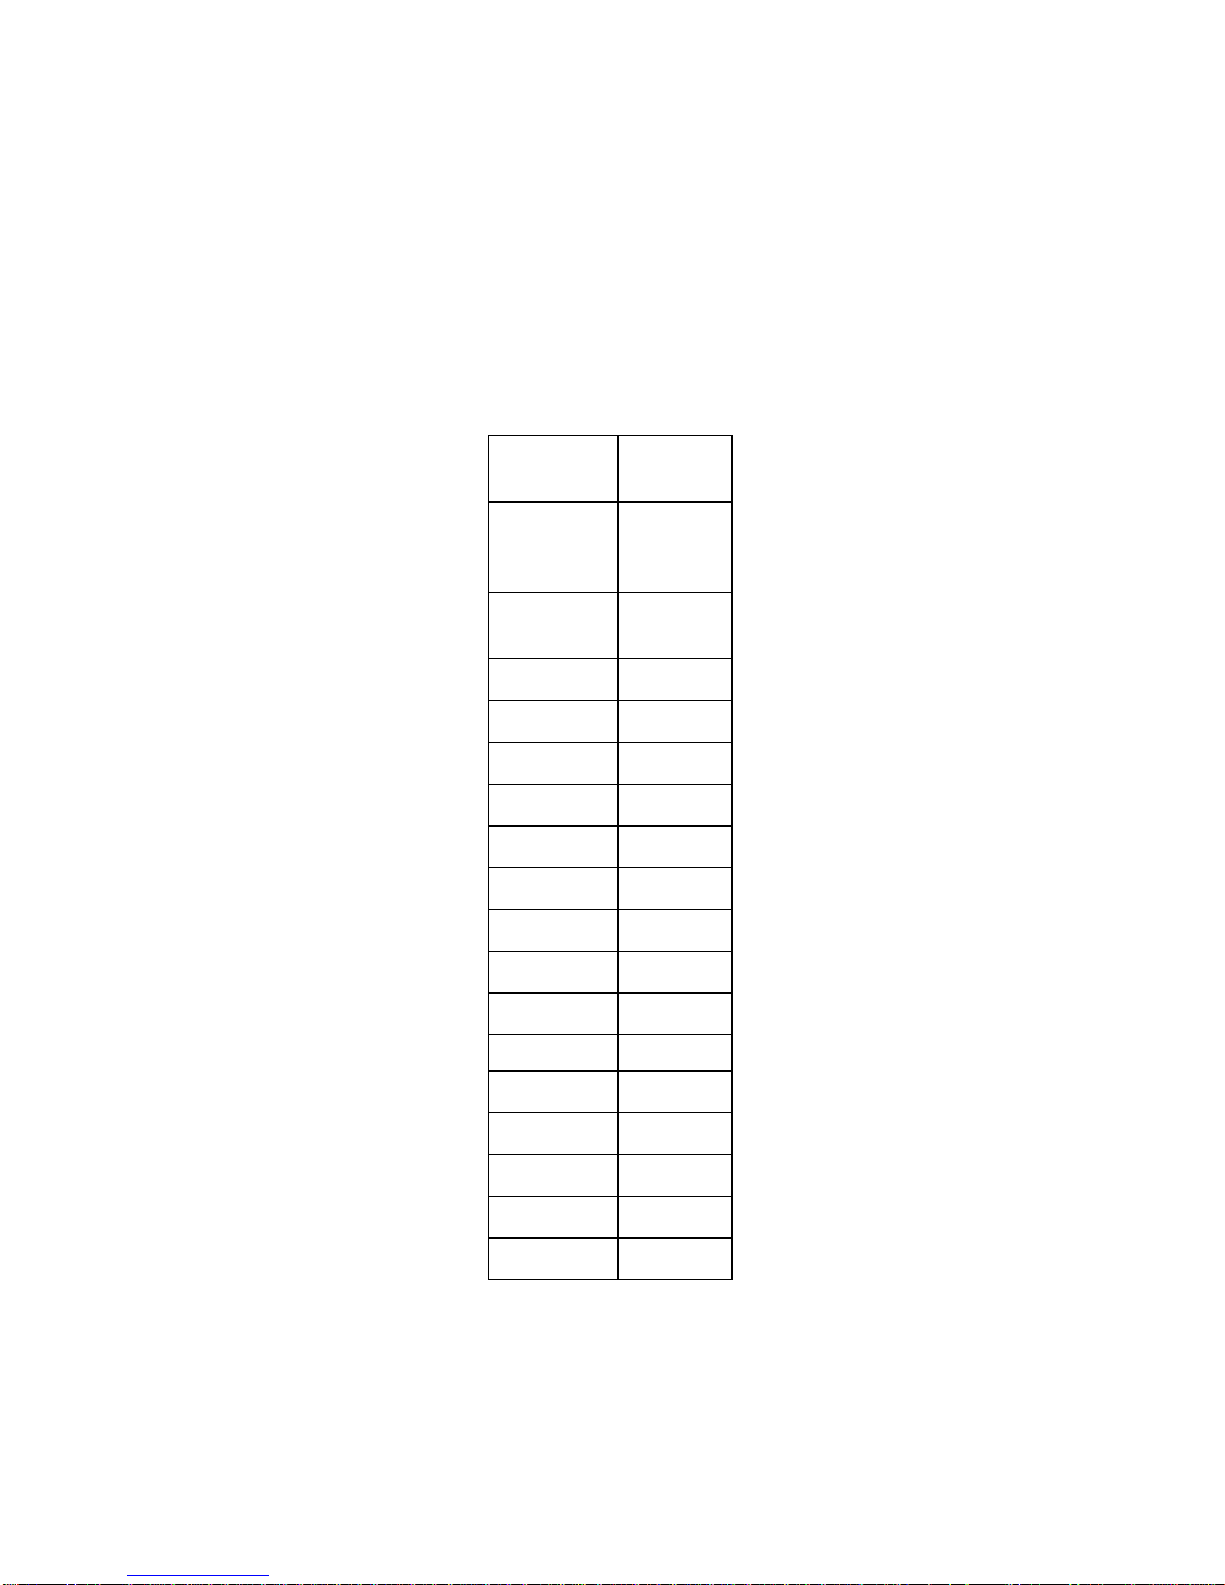
Measurements can be exported to a CSV tab separated file,
so that measurement data can be imported into excel or
other calculation software for further examinations. To
export to CVS simply click File->Export->CSV (Tab
separated)
The contents of the CVS file can be seen below:
Product
name
Demo 1
Date and
time
30. juli
2012
09:03:52
Item
number
Efficiency
64
CRI
60
CCT
3166
Lumens
257,9
Peak cd
353,75
Power
4,01
PF
0,56
CIE x
0,427
CIE y
0,403
Angle
Candela
-180
0,46
-179
0,43
-178
0,48
-177
0,47
Etc…
Page 40
40 LabSpion user guide
Emailing measurement
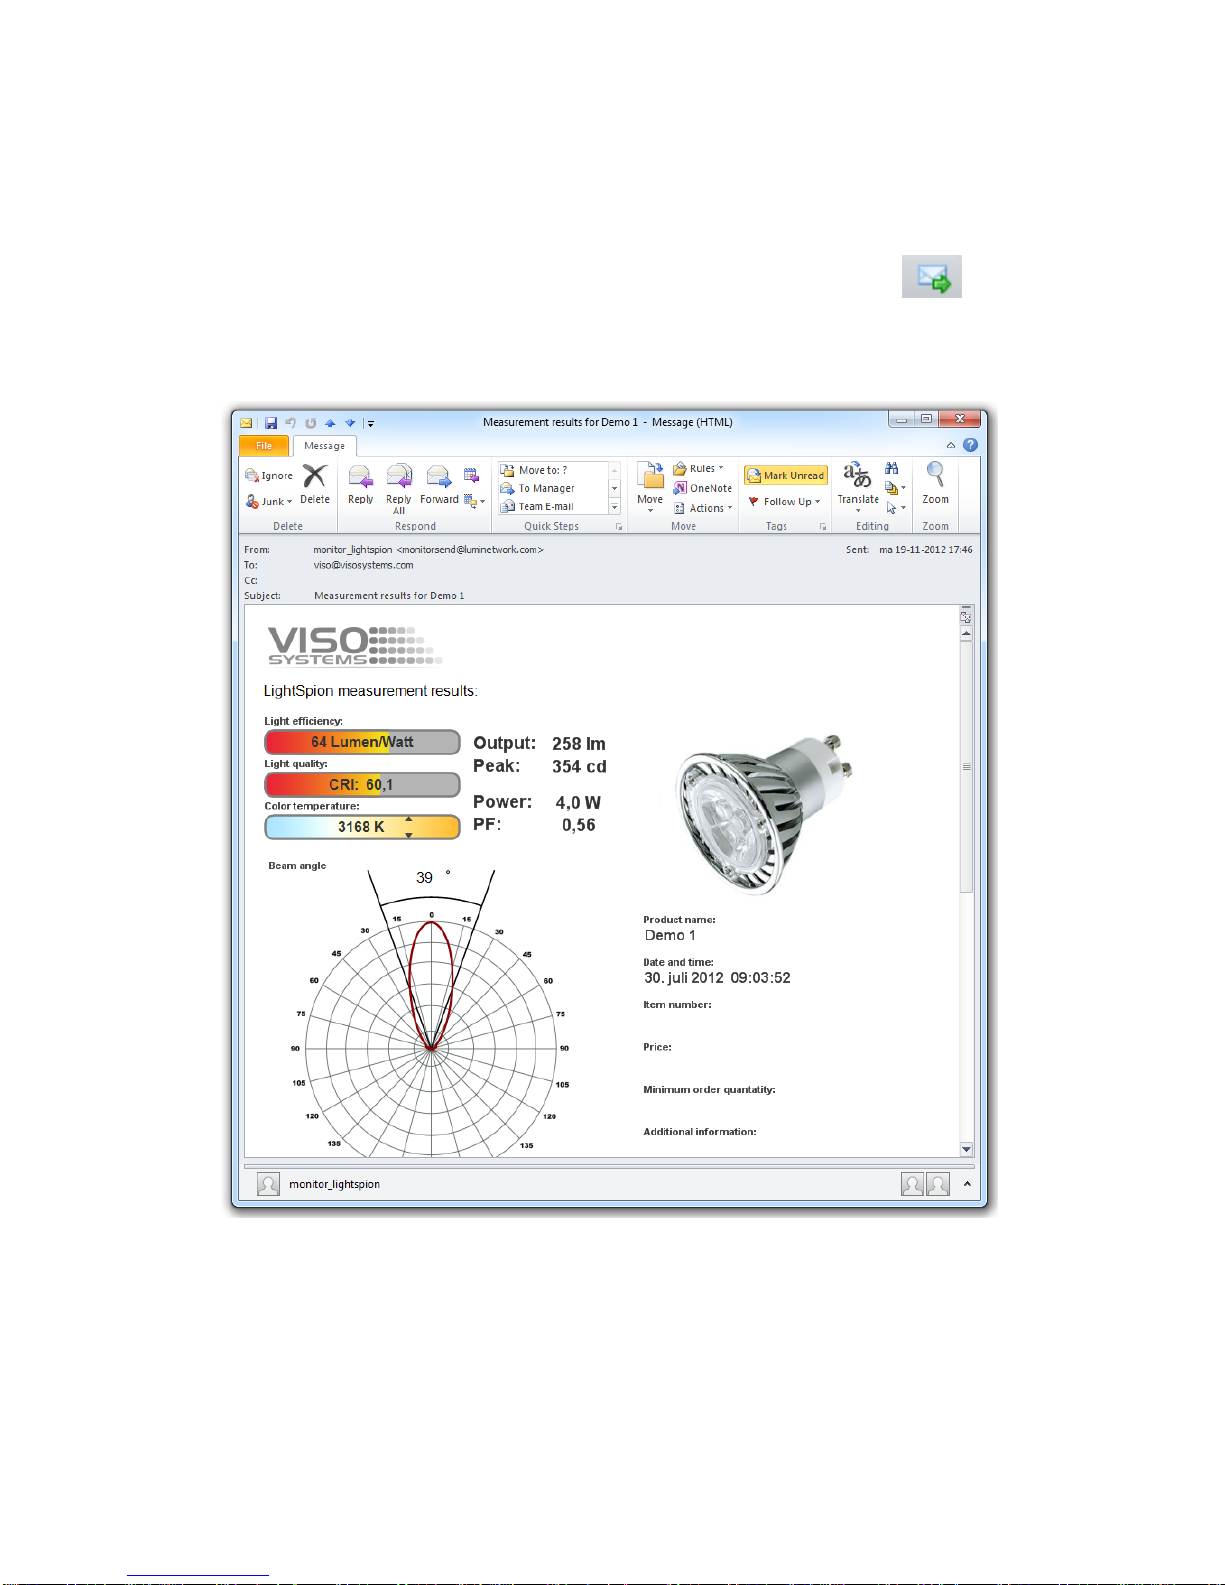
The “Viso Light Inspector” software is capable of
directly emailing measurements by clicking on the
email icon.
Page 41

41 LabSpion user guide
Specifications
Measurement method .................................................... Far Field
Physical
Shipping dimensions (L x W x H) ...... (See shipping dimensions)
Shipping weight ................................................................... 69 Kg
Dimensions (L x W x H) .................................... (See dimensions)
Weight ................................................................................. 63 Kg
Sensor distance ........................................................ 50m to 0.5m
....................................................................Sensor distance >= lamp length x10
Sensor distance setup ............. Laser range finder (build into sensor)
Lamp diameter............................ 0 – 1,5m at 2 axis (1 axis upto 6m)
Maximum lamp weight .......................................................... 25Kg
Electrical
Power supply input ............................... 90 to 260 VAC, 50/60 Hz
Power consumption ............................................ 60W (Idle 15 W)
USB current consumption ................................................ 200 mA
Power analyzer voltage range ............ 30VAC-400VAC <+/- 0.2V
Power analyzer current range .................0A-3A (Avg: +/- 0.1mA)
Power analyzer power range .......... 0W-300W (Avg: +/- 0.001W)
Power analyzer sample rate ......................... 70.000 samples/sec
Photometric
Lumen .............................................. typ 1 – 1.000.000 +/- 4.00%
Candela ............................................ typ 0,3 - 500.000 <+/- 2,5%
Color temperature ............................... 1.000K-10.000K <+/- 35K
Color rendering index (CRI) .................................. 0-100 <+/- 0,7
Angular resolution LOW MODE .......................... 3.6 degree step
Page 42

42 LabSpion user guide
................................................... (About 20 sec measurement time per C-plane)
Angular resolution HIGH MODE............................. 1 degree step
..................................................... (About 1 min measurement time per C-plane)
Spectrometer type ........................... Ibsen Photonics FREEDOM
............................................... Custom viso (high sensitive transmission grating)
Spectrometer range .............................. 360-830nm (1024 pixels)
Spectrometer detector ......................................... SONY ILX511B
Calibration ........................ Fully calibrated plug and play solution
Re-calibration ................................. Every 1 year (Maximum 2 years)
Control and interface
Control interface .............................................................. USB 2.0
Control connector .............................................................. USB-B
Connections
AC power in (power supply) .......................................... IEC 3-pin
AC power out lamp .............................................Universal socket
Light source adaptors ................................ E27, E14, B22, GU10
PC ...................................................................................... USB B
Approvals
Power supply ................................ cUL/UL, CE, CCC, TUV, FCC
Power analyzer - LabSensor ................................................... CE
Ordering information
LabSpion ............................................................. P/N LABSP001
 Loading...