

Page 1

VM 1000
Operator’s Guide
(Excerpts from the VM 1000 Installation, Maintenance, and Operations Manual)
1
Page 2

PURCHASER / USER AGREEMENT
The purchaser and/or user, by accepting this equipment, agrees to hold
VISION MICROSYSTEMS INCORPORATED, its owners, assigns, heirs and
employees, free and harmless from all loss, liability or damage resulting from claims
brought by any reason of alleged failure or defect of any parts supplied by
VISION MICROSYSTEMS INCORPORATED.
VISION MICROSYSTEMS INCORPORATED has made every effort to document
this product accurately and completely. However, VISION MICROSYSTEMS
INCORPORATED assumes no liability for errors or for damages that result
from the use of this manual or the equipment it accompanies. VISION
MICROSYSTEMS INCORPORATED reserves the right to make changes to this
manual and the product at any time without notice.
VISION MICROSYSTEMS INCORPORATED
4151 Mitchell Way
BELLINGHAM, WASHINGTON 98226
PHONE (360) 714-8203 FAX (360) 714-8253
www.visionmicrosystems.com
2
Page 3

TABLE OF CONTENTS
1.0 VM1000 QUICK REFERENCE……………..…………..... 4
1.1 TACHOMETER OPERATION………………………….… 5
1.2 MANIFOLD PRESSURE OPERATION……………..……5
1.3 OIL SYSTEM OPERATION…………………………..……6
1.4 FUEL COMPUTER SYSTEM OPERATION….……….... 6
1.5 ADDING FUEL TO THE FUEL COMPUTER…………... 7
1.6 FUEL COMPUTER NORMAL OPERATION MODES… 8
1.7 CYLINDER ANALYZER SYSTEM OPERATION…….... 8
1.8 ELECTRICAL MONITORING SYSTEM OPERATION…. 10
1.9 ‘AUTOTRACK’ ™ SYSTEM OPERATION……………... 10
1.10 FLIGHT DATA RECORDER SYSTEM OPERATION… 12
1.11 INDICATOR CARE AND MAINTENANCE…………….. 12
3
Page 4
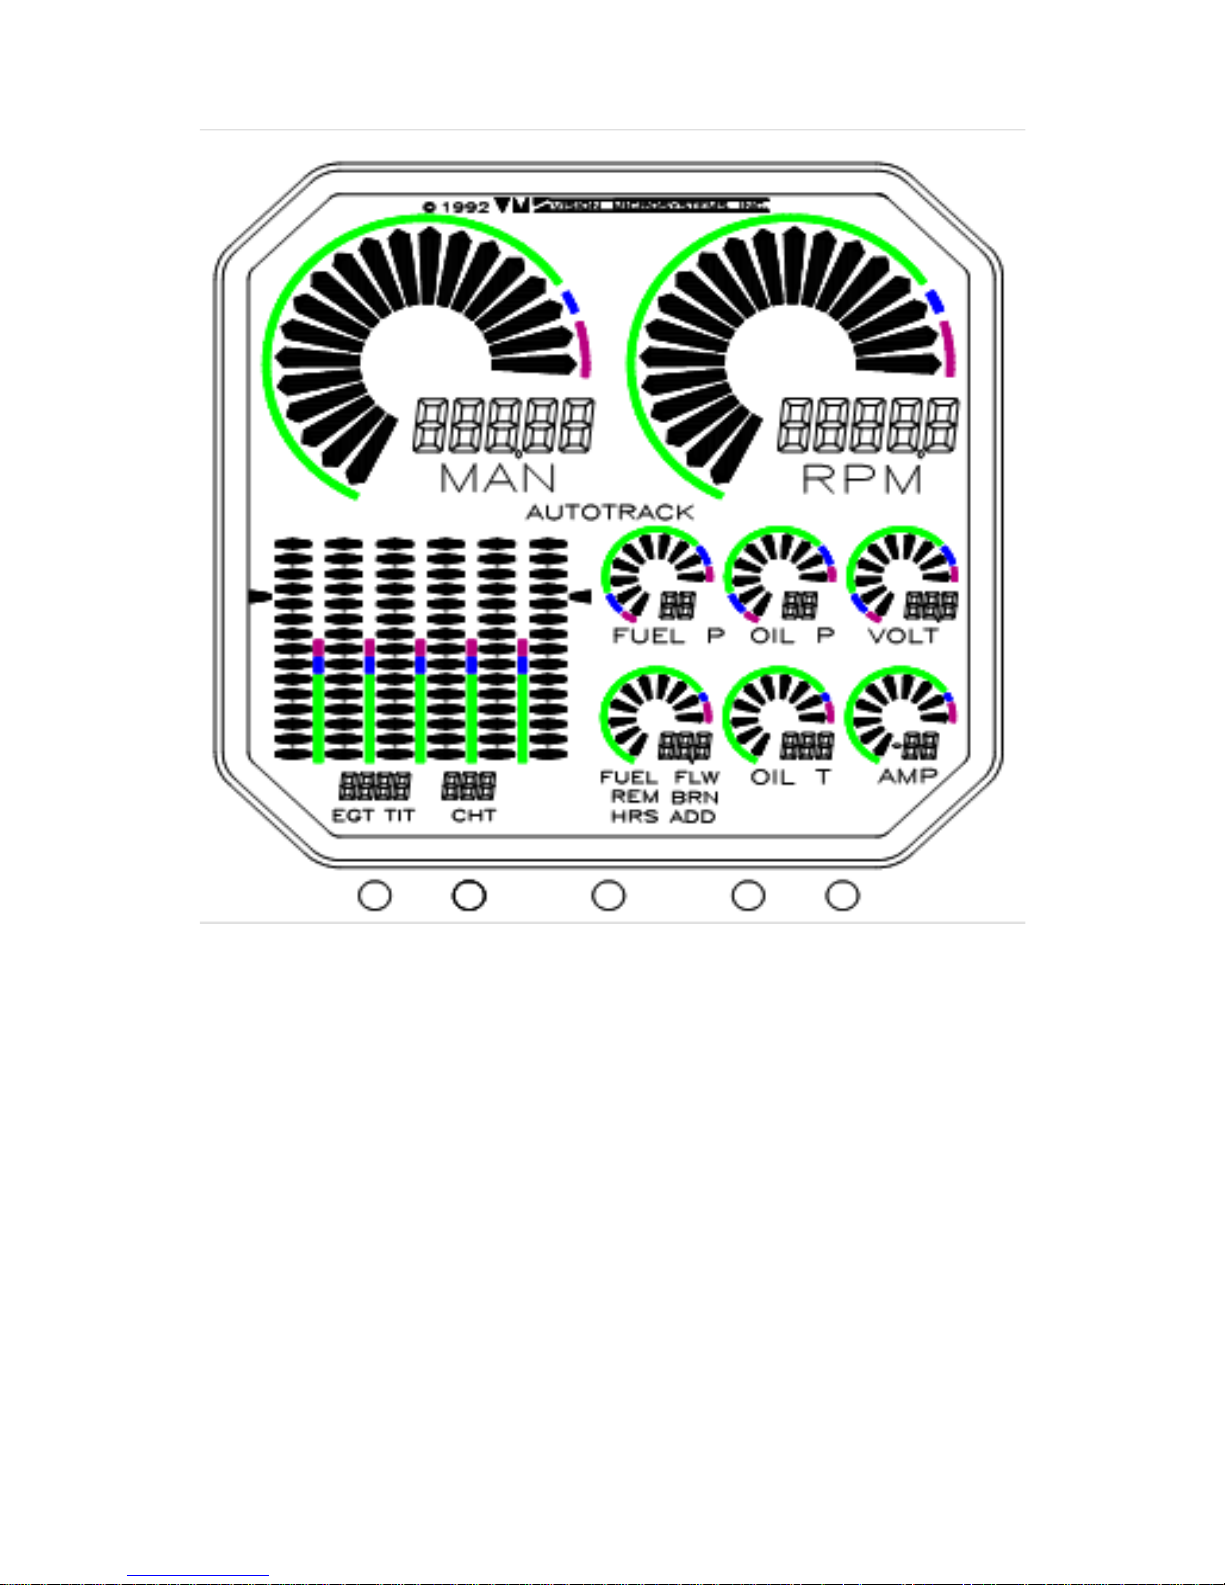
BUTTON 1: 'SELECT EGT/TIT GRAPHIC MODES'
1.0 FIGURE 1: VM1000 QUICK REFERENCE
1 2 3 4 5
BUTTON 2: 'SELECT EGT/TIT & CHT DIGITAL MODES'
BUTTON 3: 'SELECT AUTOTRACK ON / OFF'
BUTTON 4: 'SELECT FUEL COMPUTER MODES'
BUTTON 5: 'SELECT FLIGHT DATA RECORDER INFO'
4
Page 5

1.1 TACHOMETER OPERATION
The tachometer system provides both a full sweep graphic analog display and four place
digital display. When you start the engine you will see the analog graph rise in proportion
to the engine speed. Full color range marks provide you with a quick reference to monitor
normal, caution and red line engine RPM.
RPM:
The digital readout provides you with exact RPM information. The resolution (or
incremental steps) of the digital display is 10 RPM. For example, the display might read
'2400' and after you make a slight increase in power, it would read '2410'. This is a
definite advantage over other digital tachs that read in less than 10 RPM steps. They
change so frequently that it becomes very distracting and annoying to the pilot. We
recommend using the digital display for RPM checks and letting the engine stabilize for a
minimum of three seconds during the checks. The high accuracy of the tach will allow
you to follow long-term performance trends of your engine and prop, such as static
maximum rpm, carb heat effectiveness, and typical mag drops. These can be important
indicators of engine and accessory condition.
Engine Operating Hours:
Another feature is the 'engine hours counter'. When the engine is off, the digital display
reads the total accumulated engine hours to a maximum of '5999.9'. Engine hours are
accumulated any time RPM is greater than 1500.
RPM Alert:
A warning alert activates whenever the engines redline is reached. The RPM display will
flash until this condition is corrected.
1.2 MANIFOLD PRESSURE OPERATION
The manifold pressure system provides both a full sweep graphic analog display and
three place digital display.
The full sweep graphic display resolution is 1" IN. HG. The full color range marks provide
you with a quick reference to manifold pressure when m aking fast power changes.
The digital readout provides you with precise manifold pressure information. This allows
very precise power settings to be achieved.
You can, for example, in stabilized conditions, watch for small changes in pressure that
can indicate throttle creep or induction problems.
For new induction system designs, or modifications to existing designs, this repeatability
is extremely valuable to judge the performance of the design or design changes.
Manifold Pressure Alert:
A warning alert activates whenever the engines redline is reached (typically only for
turbocharged engines). The display will flash until this condition is corrected.
5
Page 6

1.3 OIL SYSTEM OPERATION
Both oil pressure and oil temperature are displayed continuously in two separate full
sweep graphic and digital areas.
Oil Pressure:
As oil pressure rises, the graph size increases proportionately. The full color range marks
let you see at a glance how close to red line oil pressure you are.
The digital display reads out in 1 PSI increments to a maximum of 99. This is very useful
for monitoring typical engine oil pressure trends. Because of the high accuracy and
repeatability of this system, the oil pressure can be closely monitored for unusual trends.
For example, if you are cruising in a stabilized condition, and the oil pressure starts to
count down, and oil temp is counting up, this could help you to identify impend ing o il-loss
or cooling problems.
Oil Pressure Alert:
A warning alert activates whenever the engines redline is reached. The display will flash
until this condition is corrected.
Oil Temperature:
Oil temperature is displayed both graphically and digitally. As oil temperature rises, the
graph size increases proportionately. This is consistent with the oil pressure display and
makes it very easy to determine relationships between the two parameters.
The full color range marks let you see at a glance how close to red line oil temperature
you are.
The digital display reads out in 1 degree Fahrenheit increments to a maximum of 300
degrees. This is very useful for monitoring typical engine oil cooling system performance.
For new engine installations, you can take advantage of the high accuracy and
repeatability for analyzing the engine oil cooler system efficiency. If the cooling does not
seem to be effective enough, you can make changes and repeat your tests with the
confidence that the next test data will reflect the results of your changes.
Oil Temperature Alert:
Your oil temp system also provides you with built-in warning annunciators. If the oil
temperature rises above redline, the system captures the event and the display is flashed
until the problem is corrected. This is a real advantage in the busy cockpit.
1.4 FUEL COMPUTER SYSTEM OPERATION
Fuel Pressure:
Fuel Pressure is displayed both digitally and graphically. As fuel pressure rises, the graph
rises proportionately. Full color operating range marks are provided that indicates the
normal operating range of fuel pressure for your engine at a glance. The digital display
allows you to see small variations and make notations of typical fuel pressure behavior.
6
Page 7

Fuel Pressure Alert:
The system has a built-in warning system and will flash should fuel pressure move
outside of the limits for your particular engine.
Fuel Flow:
Fuel Flow is displayed both digitally and graphically. As fuel flow increases, the graph
increases proportionately. The digital display provides tenth gallon resolution.
There are four additional features that the fuel computer provides:
'REM' - Fuel remaining onboard
'BRN' - Fuel burned since last power-up
'HRS' - Hours of fuel remaining
'ADD' - Add fuel to computer memory.
An exclusive feature of our fuel flow computer is its ability to 'damp out' the wide
variations in displayed fuel flow normally seen on other fuel flow digital readouts. Our
system will smooth these short term flow variations to give you a steady flow indication
with NO sacrifice in accuracy.
Fuel Remaining Alert:
Your fuel computer has a built-in 'Low Fuel Remaining' warning annunciator. W hen the
computed fuel total is less than a factory programmed amount (10 gallons standard), the
display will flash.
1.5 ADDING FUEL TO THE FUEL COMPUTER
***************************** WARNING *********************************
IMPROPER USE OF THIS FEATURE WILL GIVE YOU INCORRECT FUEL 'REM' AND
‘HRS’ INFORMATION. INSURE THAT YOU UNDERSTAND THE OPERATION OF
THIS SYSTEM BEFORE USING IT INFLIGHT. AFTER INSTALLATION AND
PERIODICALLY THEREAFTER, VERIFY THAT THE SYSTEMS ACCURACY IS
ACCEPTABLE FOR YOUR INTENDED USE .
****************************************************************************
Your fuel computer has a unique feature that allows you to 'ADD' fuel according to how
much has been pumped into the tank(s). You are not required to calculate the new total
fuel level after adding fuel, as on many other fuel computers. This system does it for you.
Follow the steps below to 'ADD' fuel to the computer, referring to 'Error! Reference
source not found.’:
STEP 1. Press 'BUTTON 4' until the 'ADD' indicator activates
STEP 1. Press 'BUTTON 3 to add tens and 'BUTTON 5' to add ones to match the fuel
that was pumped into the tank(s).
NOTE: To 'top off' the tank(s) just press 'BUTTON 3' to run up a number more
that your max capacity. The system will only add what is needed to 'fill' the
computers electronic tank to its max capacity as set up in 'Error! Refere nce
source not found.'.
7
Page 8

STEP 2. If you made a mistake just leave everything alone for more than 20 seconds
and the computer will automatically cancel the ‘ADD’ mode. If you are happy
with the entered value, then press 'BUTTON 4' and the new fuel will be
automatically added to the prior fuel ’REM’ total. Double check this new total
by pressing 'BUTTON 4' until the ‘REM’ fuel is shown.
NOTE: In the event you want to ‘zero’ the current fuel remaining value, press Button 4
until ‘REM’ is displayed and continue holding it in. Simultaneously press Button 3 and the
‘REM’ value will be cleared to zero.
1.6 FUEL COMPUTER NORMAL OPERATION MODE S
Press 'BUTTON 4' to select the desired fuel computer operating mode. The mode is
displayed below the permanent words 'FUEL FLW' on the display:
‘FUEL FLW’: Fuel Flow is the default mode after powering up. This mode displays the
fuel flow in the appropriate Units Per Hour both digitally and graphically. The digital
section provides 0.1 unit resolution. The graphic section provides you with a quick
reference of the current fuel flow.
‘REM’: This mode displays the current fuel total remaining in gallons. It is digitally
displayed in 0.1 gallon increments. This mode is ONLY usable, if you have kept the
computer's memory updated with fuel information corresponding to the actual aircraft
usable fuel and have always had the computer operational when fuel is being burned.
The graphic display is shut off as it has no relationship to this parameter.
‘HRS’: This mode displays the calculated hours of fuel remaining (sometimes referred
to as endurance), as a function of the current flow rate and current fuel total in the
computer's memory. It is digitally displayed in 0.1 hour increments. This mode is ONLY
usable, if you have kept the computer's memory updated with fuel information
corresponding to the actual aircraft usable fuel and have always had the computer
operational when fuel is being burned. The graphic display is shut off as it has no
relationship to this parameter.
‘BRN’: This mode displays the gallons of fuel burned in flight since system power up. It
is digitally displayed in 0.1 gallon increments. The graphic display is shut off as it has no
relationship to this parameter.
‘ADD’: This m od e allows you to add fuel to the fuel computers 'electronic tank' after fuel
has physically been added to the aircraft's tank(s). See section on 'ADDING FUEL TO
THE COMPUTER'.
1.7 CYLINDER ANALYZER SYSTEM OPERATION
The engine analyzer system displays all cylinder information both graphically and
digitally. Full color reference marks are provided for cylinder head green, yellow and
redline temperatures.
8
Page 9

‘DIAMOND GRAPH‘ DISPLAY MODES:
'GRAPHIC MODE 1' (ABSOLUTE EGT): Press 'BUTTON 1' once (if in GRAPHIC MODE
1) to activate. All four graphs in the upper area come on and display absolute EGT
temperature. This mode is most useful to spot plug / injector or valve problems. Each bar
equals +50 deg. F with the base beginning at 1300 deg. F.
'GRAPHIC MODE 2' (RE LATIVE E GT MODE) Press 'BUTTO N 1' again (if in G RAPHIC
MODE 2) to activate. All four graphs, plus two brackets, in the upper area come on and
display RELATIVE EGT temperatures. This mode is most useful to watch short-term
behavior of EGT to spot plug / injector or valve problems or when leaning to peak EGT.
Each bar equals +20 deg. F with the bases normalized when the mode was activated.
DIGITAL DISPLAY MODES:
The digital displays shows individual temperatures for EGT and CHT. Periodically
messages such as 'E1 C1' appear to show which probes you are viewing digitally
(ex.1: 'E1 C1' means 'E'GT 1 and 'C'HT 1 are in view; ex. 2: 'P1 H4' means 'P'eak
EGT 1 (hottest) and 'H'ottest CHT 4 are in view).
The digital display defaults to the hottest CHT. For example, if CHT 1 is the hottest, the
digital display will show H1 periodically. Pressing button 2 will cycle through each CHT
and the hottest and allow you to select a different CHT by choosing C1, C2 etc. After
the unit is turned on, the digital display defaults to show the hottest CHT. Temperature
is displayed in Fahrenheit units.
Additionally, warning messages are shown if a cylinder has reached 'red line'
temperature (ex: 'H2' for hot cylinder 2), or is being 'shock cooled' (ex: 'C3' for cold
cylinder 3).
You can select a digital view by successively pressing 'BUTTON 2' :
Digital Mode # Digital View Cyl. Numbers
1 Cyl. 1 EGT & CHT 'E1' 'C1'
2 Cyl. 2 EGT & CHT 'E2' 'C2'
3 Cyl. 3 EGT & CHT 'E3' 'C3'
4 Cyl. 4 EGT & CHT 'E4' 'C4'
5 Hottest EGT & CHT 'Pn' 'Hn'
After powering up the unit, the EGT digital display defaults to EGT 1 Periodically the
digital display will identify which EGT you are seeing by showing and E followed by the
EGT number, such as E1 for EGT 1. After you have successfully leaned the engine (as
an example, lets assume it was EGT 2), the digital readout is locked to that EGT and E1
will change to P2 signifying that it peaked on EGT 2. Tap button 2 to select a different
EGT by choosing E1, E2, E3 etc. (Note: not available when in the peak mode).
Temperature is displayed in Fahren heit unit s.
9
Page 10

LEANING YOUR ENGINE:
*************************** WARNING ******************************
REFER TO YOUR ENGINE OPERATING MANUAL FOR THE PROPER
TECHNIQUES, TEMPERATURE AND PRECAUTIONS FOR LEANING. STEPS
BELOW ARE SUGGESTED ONLY !
************************************************************************
STEP 1: STABILIZE; the aircraft engine temps, throttle, rpm and insure mixture is on
the rich (cooler) side temperature (approximately 100 Deg F cooler ) of max EGT.
To verify this, enrichen mixture to see that ALL EGT values decrease.
STEP 2: LEAN; the engine mixture smoothly to start the EGT bars cl imb ing ( abou t one
bar per 2 seconds). Lean so as not to exceed max EGT. (See your engine manual
for proper recommended operation). The digital readout should be showing either
'P1' or 'P2' indicating which EGT is hottest. Use this digital display to monitor and
fine tune the EGT temperature according to your engine operating manual.
1.8 ELECTRICAL MONITORING SYSTEM OPERATION
VOLTAGE is displayed both graphically and digitally. Full color range marks provide a
quick reference for fast analysis of voltage levels. As voltage rises, the graph size
increases proportio nat el y.
Additionally your system has a built-in warning system that flashes the graph when
system voltage is out of nominal range (either too low or too high) .
AMPERAGE is displayed both graphically and digitally. Full color range marks provide a
quick reference for fast analysis of amperage levels. As amperage rises, the graph size
increases proportio nat el y.
The digital readout displays amperage at 1 amp resolution. This is useful for
troubleshooting.
The amp system functions as an 'alternator load meter' displaying current flow FROM the
alternator TO the aircraft electrical system allowing you to see if a load (such as pitot
heat) is really drawing current when turned on. You should see an increase on the amp
display when you turn on a load, such as pitot heat for example. This tells you that the
pitot heater is drawing power and is probably OK. By verifying that voltage remains the
same, then it can be assumed that the alternator is supporting the additional load. A very
handy feature for in-flight testing / verification of electrical loads and the alternator
charging system.
Additionally your system has a built-in warning that flashes the graph and triggers the
audio/visual annunciator system (if installed) when the alternator does not produce power
for the electrical system. This occurs at low amperage levels of approximately less than 2
amps.
1.9 ‘AUTOTRACK’ ™ SYSTEM OPERATION
The 'Autotrack' system is a breakthrough in modern engine monitoring technology.
Designed to reduce the pilot's workload by assisting in the tedious and often overlooked
10
Page 11

job of monitoring engine parameters for deviations from one minute to the next,
'Autotrack' adds a new level of safety to engine management.
Subtle changes may occur in engine parameters that can precede major problems.
These changes are often missed by even the most attentive of pilots. 'Autotrack' alerts
you to these changes allowing you to analyze the situation and take appropriate action.
WHEN TO USE 'Autotrack':
• Climb - Activate during climb to alert you periodically as CHT increases and to a
decrease in manifold pr ess ur e.
• Cruise - Activate during cruise to alert you if any parameter begins to drift from your
selected starting point.
• Descent - Activate during descent to alert you to increasing manifold pressure and
rising EGT due to a leaning mixture.
HOW TO USE 'Autotrack':
STEP 1. STABILIZE the aircraft. Set up your desired power and mixture condition. Allow
the engine time to stabilize (i.e., engine temps and pressures, etc.).
STEP 2. Press 'BUTTON 3'. The 'Autotrack' indicator will activate in the display and the
system will begin tracking the engine's performance from this point.
The 'Autotrack' system is now armed and watching for engine deviation from the point you
picked. To cancel, simply press 'BUTTON 3' again to extinguish the 'Autotrack' indicator.
Re-arm again at any time.
NOTE: Any important alert condition, (i.e., low fuel pressure, high CHT, etc.)
automatically cancels 'Autotrack' mode.
'Autotrack' ALERT INDICATIONS:
If any engine parameter deviates beyond the initial set point, the system will flash the
corresponding graphic display and the 'AUTOTRACK' indicator.
If the deviation is large enough, a graphic pointer (circular sweep displays only) will
show where the parameter was before the deviation occurred. This gives you a chance
to evaluate the magnitude of the deviation and take the appropriate action.
To shut off the alert condition, return the parameter to its previous value (example:
adjusting manifold pressure due to a climb) or simply press 'BUTTON 3' to shut off the
'AUTOTRACK' system.
If optionally equipped, an audible and visual alert will activate in the EC100 caution
advisory system.
11
Page 12

1.10 FLIG HT DATA RECORDER SYSTEM OPERATION
The Flight Data Recorder System comes standard with your VM1000 and is designed to
allow you to review / record the performance of the engine and systems during each flight.
This is extremely valuable during initial flight testing and for subsequent trend analysis.
You may retrieve data using the Flight Data Recorder at any time during the flight or even
after the aircraft has been shut dow n for a pr olonged period of time.
Minimum and maximum values are automatically recorded during the flight and can be
reviewed at any time before the next flight. Taxi data is automatically omitted, as this info
is generally not important. Actual time of flight is also recorded.
HOW TO USE 'Flight Data Recorder':
STEP 1. Press 'BUTTON 5'. The first set of data are flight minimums encountered (i.e.,
lowest fuel pressure, lowest voltage, amperage, etc.). Also the RPM digital
display now shows the actual flight hours and tenths.
STEP 2. Press 'BUTTON 5' again. The next set of data are flight maximums encountered
(i.e., max CHT, max Oil Temp, max RPM, etc.).
STEP 3. Press 'BUTTON 5' again. The Flight Data Recorder is shut off. The recorder
data will automatically shut off in approximately 20 seconds if no button is
pressed.
1.11 INDICATOR CARE AND MAINTENANCE
The indicators require no scheduled care or maintenance. However, you probably will
want to clean them occasionally. We recommend the use of diaper flannel. NEVER use
paper towels or tissues, as they can have a high abrasive content.
To properly clean your indicator, remove surface dust and abrasives by blowing on the
indicator face or brushing with a soft bristle brush. Next, 'fog' the indicator with your
breath and gently rub the indicator. NEVER use any solvents or cleaning fluids on
the indicators.
12
 Loading...