

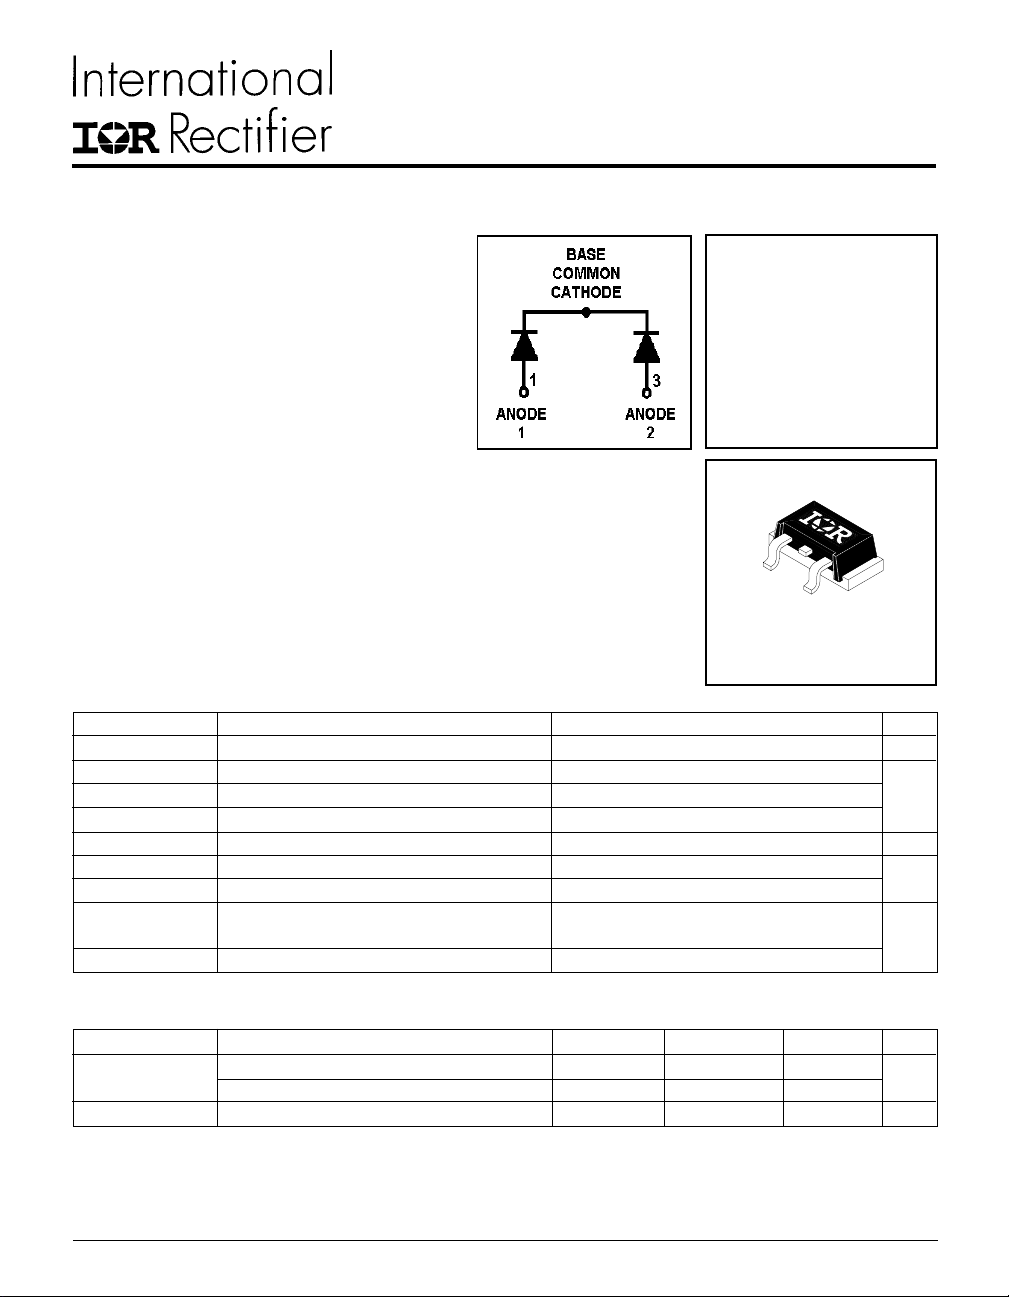
HEXFRED
PD -2.472 rev. B 01/99
HFA80NC40CSL
TM
Ultrafast, Soft Recovery Diode
Features
• Reduced RFI and EMI
• Reduced Snubbing
• Extensive Characterization of
Recovery Parameters
VR = 400V
VF(typ.) = 1V
I
= 80A
F(AV)
Qrr (typ.) = 200nC
I
(typ.) = 6A
RRM
trr(typ.) = 30ns
di
/dt (typ.) = 190A/µs
(rec)M
Description
HEXFREDTM diodes are optimized to reduce losses and EMI/RFI in high frequency
power conditioning systems. An extensive characterization of the recovery
behavior for different values of current, temperature and di/dt simplifies the
calculations of losses in the operating conditions. The softness of the recovery
eliminates the need for a snubber in most applications. These devices are ideally
suited for power converters, motors drives and other applications where
switching losses are significant portion of the total losses.
SLD-61-8
Absolute Maximum Ratings (per Leg)
Parameter Max. Units
V
R
IF @ TC = 25°C Continuous Forward Current 85
IF @ TC = 100°C Continuous Forward Current 42 A
I
FSM
E
AS
PD @ TC = 25°C Maximum Power Dissipation 150
PD @ TC = 100°C Maximum Power Dissipation 59
T
J
T
STG
Cathode-to-Anode Voltage 400 V
Single Pulse Forward Current 300
Non-Repetitive Avalanche Energy 1.4 mJ
Operating Junction and
Storage Temperature Range
Soldering Temperature, for 10 sec. 300 (0.063 in. (1.6mm) from case)
-55 to +150 °C
W
Thermal - Mechanical Characteristics
Parameter Min. Typ. Max. Units
R
thJC
Wt Weight –––– 4.3 (0.15) –––– g (oz)
Note: Limited by junction temperature
L = 100µH, duty cycle limited by max T
125°C
Junction-to-Case, Single Leg Conducting –––– –––– 0.85
Junction-to-Case, Both Legs Conducting –––– –––– 0.42
J
°C/W
K/W
1
HFA80NC40CSL
PD-2.472 rev. B 01/99
Electrical Characteristics (per Leg) @ TJ = 25°C (unless otherwise specified)
Parameter Min. Typ. Max. Units Test Conditions
V
BR
V
FM
I
RM
C
T
L
S
Dynamic Recovery Characteristics (per Leg) @ TJ = 25°C (unless otherwise specified)
t
rr
t
rr1
t
rr2
I
RRM1
I
RRM2
Q
rr1
Q
rr2
di
(rec)M
di
(rec)M
Cathode Anode Breakdown Voltage 400 ––– ––– V IR = 100µA
Max Forward Voltage ––– 1.1 1.3 IF = 40A
––– 1.3 1.5 V IF = 80A
––– 1.0 1.2 IF = 40A, TJ = 125°C
Max Reverse Leakage Current ––– 0.50 3.0 µA VR = VR Rated
––– 0.75 4.0 mA TJ = 125°C, VR = 320V
Junction Capacitance ––– 9 0 125 pF VR = 200V
Series Inductance ––– 5.5 – –– nH Lead to lead 5mm from package body
Parameter Min. Typ. Max. Units Test Conditions
Reverse Recovery Time ––– 30 ––– IF = 1.0A, dif/dt = 200A/µs, VR = 30V
––– 67 100 ns TJ = 25°C
––– 110 170 TJ = 125°C IF = 40A
Peak Recovery Current ––– 6. 0 11 TJ = 25°C
––– 9.0 16 TJ = 125°C VR = 200V
Reverse Recovery Charge ––– 2 00 540 TJ = 25°C
––– 500 1300 TJ = 125°C dif/dt = 200A/µs
/dt1 Peak Rate of Fall of Recovery Current ––– 240 ––– TJ = 25°C
/dt2 During t
b
––– 190 ––– TJ = 125°C
A
nC
A/µs
See Fig.
5
See Fig.
6
See Fig.
7
See Fig.
8
See Fig. 1
See Fig. 2
See Fig. 3
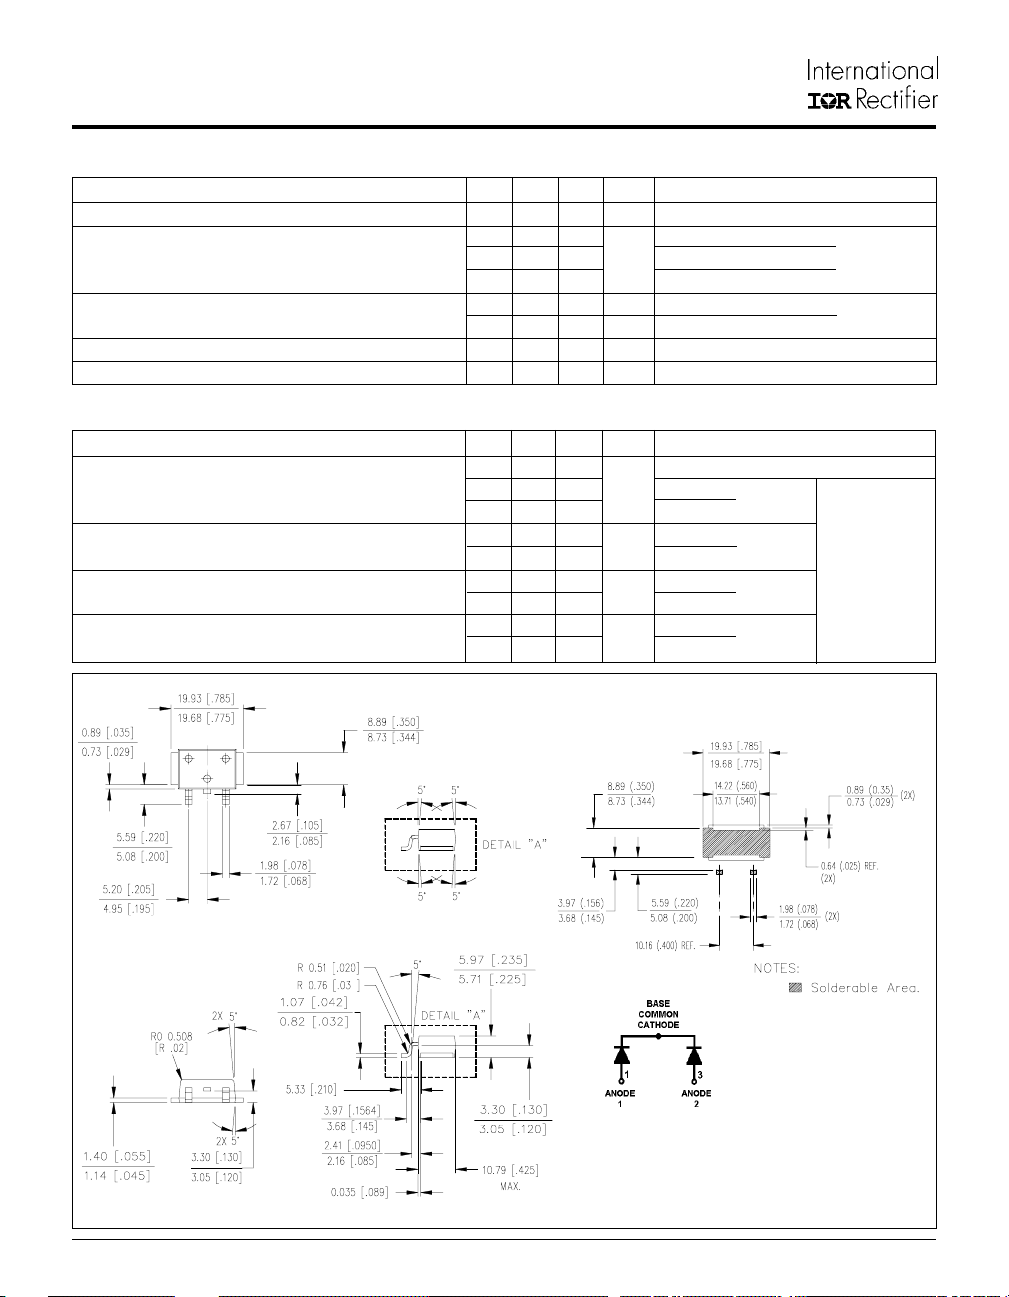
FOOT PRINT
Outline D 61- 8-SL
Dimensions in millimeters and (inches)
2

1000
10000
1000
R
100
HFA80NC40CSL
PD-2.472 rev. B 01/99
T = 150°C
J
T = 125°C
J
F
100
T = 150°C
J
T = 125°C
J
T = 25°C
10
J
Instantan eous Forw ard Current - I (A)
1
0.4 0.8 1.2 1.6 2.0
Forward Voltage Drop - V (V)
FM
Fig. 1 - Maximum Forward Voltage Drop
vs. Instantaneous Forward Current,
(per Leg)
1
10
1
T = 25°C
R ev e rs e C u rre n t - I (µ A)
0.1
J
0 100 200 300 400
Reverse Voltage - V (V )
R
Fig. 2 - Typical Reverse Current vs. Reverse
Voltage, (per Leg)
A
1000
T
100
10
Junction Ca pacita nce - C (p F)
1 10 100 1000
Reverse Voltage - V (V )
T = 25°C
J
R
Fig. 3 - Typical Junction Capacitance vs.
Reverse Voltage, (per Leg)
D = 0.50
D = 0.33
D = 0.25
thJC
D = 0 .17
D = 0.08
0.1
Single Pu lse
(The rm a l Re s ista nc e)
P
DM
t
1
t
2
Notes:
1. Duty fa c to r D = t / t
Thermal Impedance - Z (K/W)
0.01
0.0001 0.001 0.01 0.1 1 10 100
t , Rec tangular Pulse Duration (Seconds)
1
Fig. 4 - Maximum Thermal Impedance Z
2. P e a k T = P x Z + T
Characteristics, (per Leg)
thjc
J
DM
21
th JC
C
3

HFA80NC40CSL
PD-2.472 rev. B 01/99
160
V = 200V
R
T = 125°C
J
T = 25°C
140
120
J
100
V = 200V
R
T = 125°C
J
T = 25°C
J
I =100A
F
100
I = 100A
rr
t - (n s )
F
80
60
40
100 1000
I = 4 0A
F
di /dt - (A/µ s)
f
I = 20 A
F
Fig. 5 - Typical Reverse Recovery vs. dif/dt,
(per Leg)
2500
V = 200V
R
T = 125°C
J
T = 25°C
J
2000
Q - ( n C )
1500
RR
1000
500
I = 20A
F
I = 40A
F
I = 100A
F
10
IRRM
I - ( A )
1
100 1000
di /d t - (A/µ s )
f
I = 2 0A
F
I = 40A
F
Fig. 6 - Typical Recovery Current vs. dif/dt,
(per Leg)
10000
V = 200V
R
T = 125°C
J
T = 25°C
J
I = 20A
I = 4 0A
F
F
di(re c )M /d t - (A /µ s)
1000
I = 100A
F
0
100 1000
di /d t - (A/µ s)
f
Fig. 7 - Typical Stored Charge vs. dif/dt,
(per Leg)
4
100
100 1000
Fig. 8 - Typical di
di /d t - (A/µ s)
f
/dt vs. dif/dt,
(rec)M
(per Leg)

REVERSE RECOVERY CIRCUIT
V = 200V
R
Ω
0.01
L = 70µH
D.U.T.
dif/dt
ADJUST
G
D
IRFP250
S
HFA80NC40CSL
I
F
0
1
1. dif/dt - Rate of change of current
through zero crossing
2. I
- Peak reverse recovery current
RRM
3. trr - Reverse recovery time measured
from zero crossing point of negative
going IF to point where a line passing
through 0.75 I
extrapolated to zero current
RRM
and 0.50 I
di /dt
f
RRM
t
a
PD-2.472 rev. B 01/99
3
t
rr
t
b
4
Q
2
I
RRM
0.75
4. Qrr - Area under curve defined by t
and I
RRM
t
Qrr =
2
5. di
(rec)M
current during tb portion of t
rr
0.5
I
RRM
di(rec)M/dt
I
RRM
X I
rr
/dt - Peak rate of change of
5
rr
RRM
rr
Fig. 9 - Reverse Recovery Parameter Test
Circuit
L = 100µH
Fig. 10 - Reverse Recovery Waveform and
Definitions
I
L(PK)
HIG H-SPEED
DUT
Rg = 25 ohm
CURREN T
MONITOR
S W ITC H
FREE-WHEEL
D IOD E
Vd = 50V
+
DECAY
TIME
V
(AVAL)
V
R(RATED)
Fig. 11 - Avalanche Test Circuit and Waveforms
WORLD HEADQUARTERS:WORLD HEADQUARTERS:
WORLD HEADQUARTERS:
WORLD HEADQUARTERS:WORLD HEADQUARTERS:
EUROPEAN HEADQUARTERS:EUROPEAN HEADQUARTERS:
EUROPEAN HEADQUARTERS:
EUROPEAN HEADQUARTERS:EUROPEAN HEADQUARTERS:
IR SOUTHEAST ASIA:IR SOUTHEAST ASIA:
IR SOUTHEAST ASIA:
IR SOUTHEAST ASIA:IR SOUTHEAST ASIA:
IR CANADA:IR CANADA:
IR CANADA:
IR CANADA:IR CANADA:
IR GERMANY:IR GERMANY:
IR GERMANY:
IR GERMANY:IR GERMANY:
IR ITALY:IR ITALY:
IR ITALY:
IR ITALY:IR ITALY:
IR FAR EAST:IR FAR EAST:
IR FAR EAST:
IR FAR EAST:IR FAR EAST:
IR TAIWAN:IR TAIWAN:
IR TAIWAN:
IR TAIWAN:IR TAIWAN:
http://www.irf.com Fax-On-Demand: +44 1883 733420 Data and specifications subject to change without notice.
233 Kansas St., El Segundo, California 90245 U.S.A. Tel: (310) 322 3331. Fax: (310) 322 3332.
Hurst Green, Oxted, Surrey RH8 9BB, U.K. Tel: ++ 44 1883 732020. Fax: ++ 44 1883 733408.
15 Lincoln Court, Brampton, Markham, Ontario L6T3Z2. Tel: (905) 453 2200. Fax: (905) 475 8801.
Saalburgstrasse 157, 61350 Bad Homburg. Tel: ++ 49 6172 96590. Fax: ++ 49 6172 965933.
Via Liguria 49, 10071 Borgaro, Torino. Tel: ++ 39 11 4510111. Fax: ++ 39 11 4510220.
K&H Bldg., 2F, 30-4 Nishi-Ikebukuro 3-Chome, Toshima-Ku, Tokyo, Japan 171. Tel: 81 3 3983 0086.
1 Kim Seng Promenade, Great World City West Tower,13-11, Singapore 237994. Tel: ++ 65 838 4630.
16 Fl. Suite D.207, Sec. 2, Tun Haw South Road, Taipei, 10673, Taiwan. Tel: 886 2 2377 9936.
5
 Loading...