

Page 1

User manual
21554
Video touch screen 4,3in Full Flat.
Page 2

TABLE OF CONTENTS
1. The touch screen video ……………………………………………………………………………………… 1
2. Description ……………………………………………………………………………………………………… 2
3. Main menu ……………………………………………………………………………………………………… 2
Date and time …………………………………………………………………………………………………… 3
Display ……………………………………………………………………………………………………………… 4
Keys Tone …………………………………………………………………………………………………………… 4
Temperature Unit …………………………………………………………………………………………………… 4
Protection …………………………………………………………………………………………………………… 5
Video settings ……………………………………………………………………………………………………… 5
Temperature probe ………………………………………………………………………………………………… 6
Information …………………………………………………………………………………………………………… 6
4. Area management ……………………………………………………………………………………………… 7
4.1 Management monochrome and RGB lamps ……………………………………………………………… 9
4.2 HVAC Management ………………………………………………………………………………………… 12
5. Events Programs ……………………………………………………………………………………………… 15
6. Burglar alarm …………………………………………………………………………………………………… 19
7. Load control……………………………………………………………………………………………………… 22
8. Energy monitoring ……………………………………………………………………………………………… 24
8.1 Guide to navigating the screens …………………………………………………………………………… 24
8.2 Global consumption ………………………………………………………………………………………… 25
8.3 Energy consumption ……………………………………………………………………………………… 25
8.4 Energy flows ………………………………………………………………………………………………… 32
8.5 Single load consumption …………………………………………………………………………………… 34
8.6 Pulse counter ………………………………………………………………………………………………… 35
8.7 Settings ……………………………………………………………………………………………………… 37
9. Speaker System ………………………………………………………………………………………………… 45
9.1 Control for iPod, iPhone and auxiliary sources …………………………………………………………… 46
9.2 Control for RCA transmitter with IR interface …………………………………………………………… 50
10. Video door entry ……………………………………………………………………………………………… 51
11. Alarm clock …………………………………………………………………………………………………… 53
12. Screen saver …………………………………………………………………………………………………… 54
13. Cleaning of touch screen …………………………………………………………………………………… 54
14. Compliance with regulations ………………………………………………………………………………… 54
Table of Contents
Page 3
1
Table of Contents
1. THE TOUCH SCREEN VIDEO
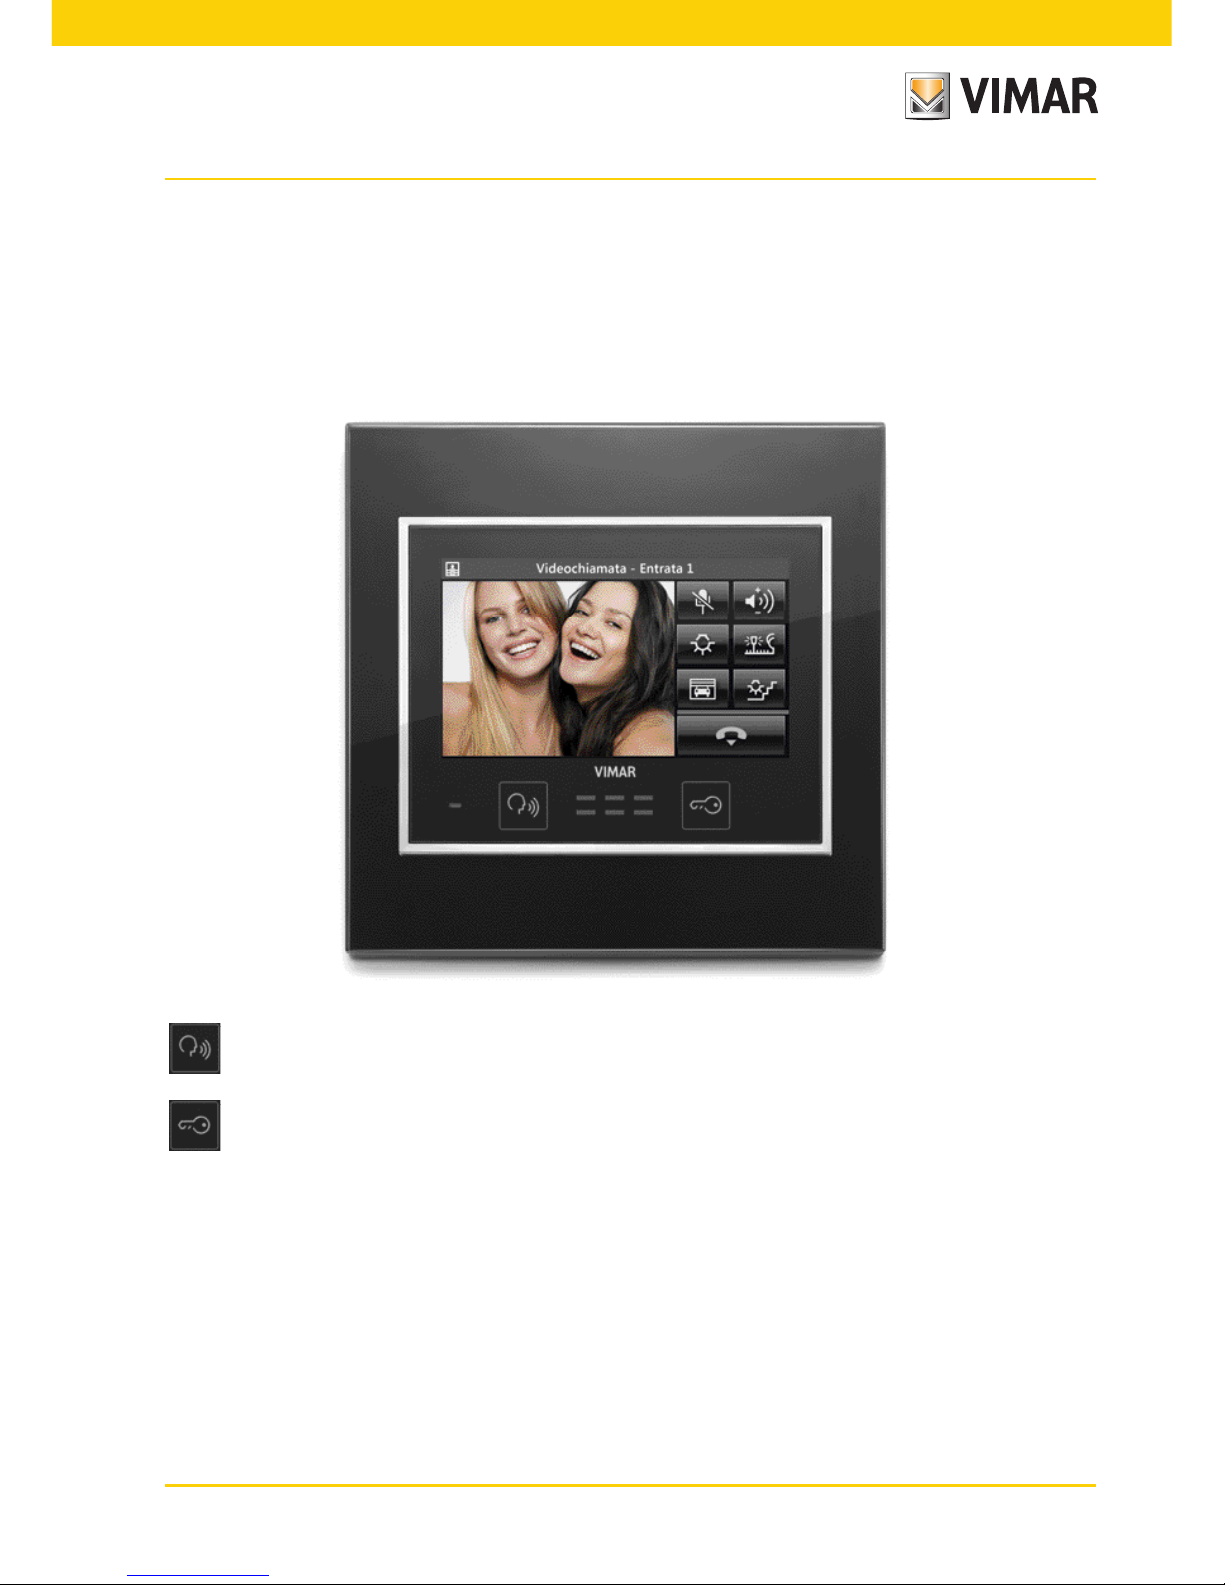
The 21554 is a touch screen device comprising a display through which, by the mere touch of the finger on the
icons displayed, you can select the home automation system management functions.
The device can also be used as a videophone and is provided with two front buttons that allow voice communication with the interlocutor and the opening of the gate electric.
: Hands-free answer button; press once to start the communication and press to end it.
: Lock command button; press to activate the electric lock that opens the gate.
IMPORTANT: When you enable it, start the video touch screen takes about 20 seconds.
Page 4

2
Description - Main menù
2. DESCRIPTION.
The touch screen include control of lights (on/off/adjustment), shutters, thermostats (traditional and for fan-coil)
and scenes; control and monitoring of burglar alarm devices (specially through ‘Partialisation’ menu it is possible
to display the state of partialisations; automatic monitoring and control of power consumption of appliances (overload prevention).
The touch screen can also be used as a videophone and manages all functions of the two wire video entry (plaque
and display images from cameras, voice communication with the external, intercoms and call buttons, electric
opening, intercom call, etc. .).
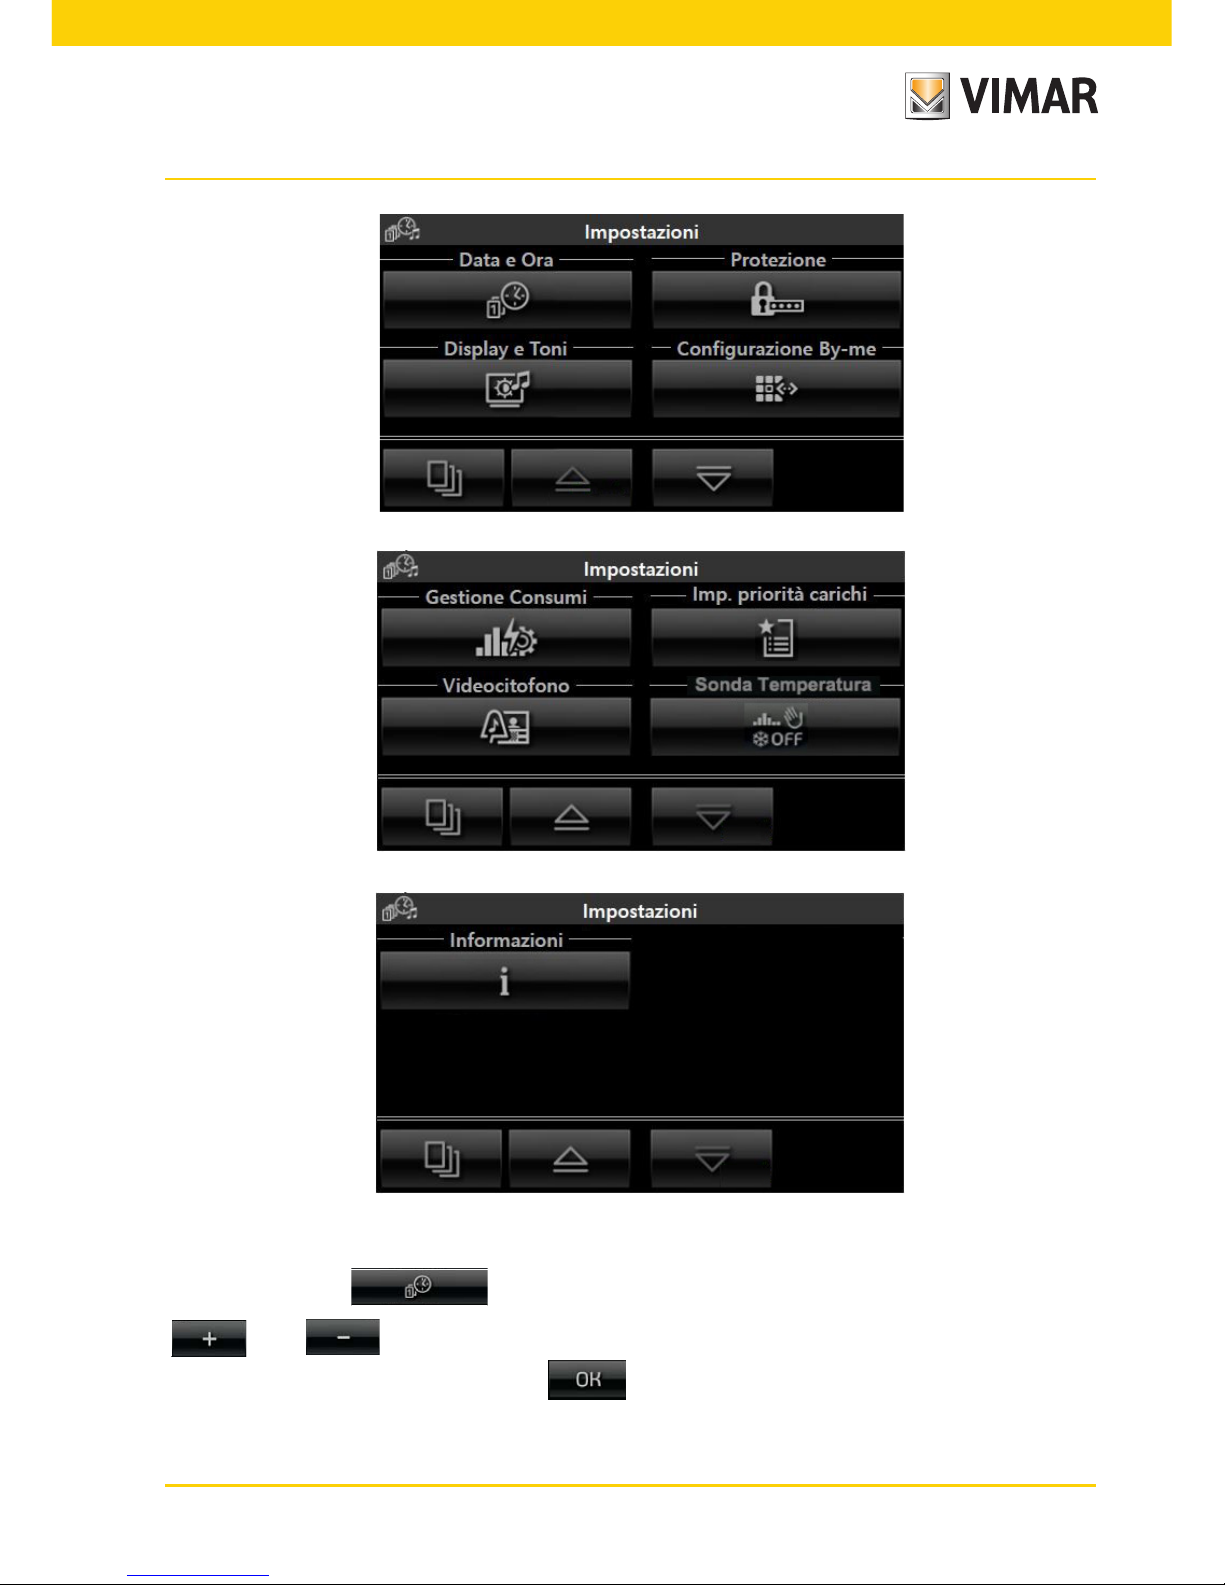
3. MAIN MENU.
Touching the icon gives access to the Settings menu.
Page 5
3
• Date and Time
By touching the icon it is possible to adjust the time and date displayed. With the icons
and set the blinking value until the desired day, month, year and time are shown.
The confirmation of transactions by touching .
Page 6
4
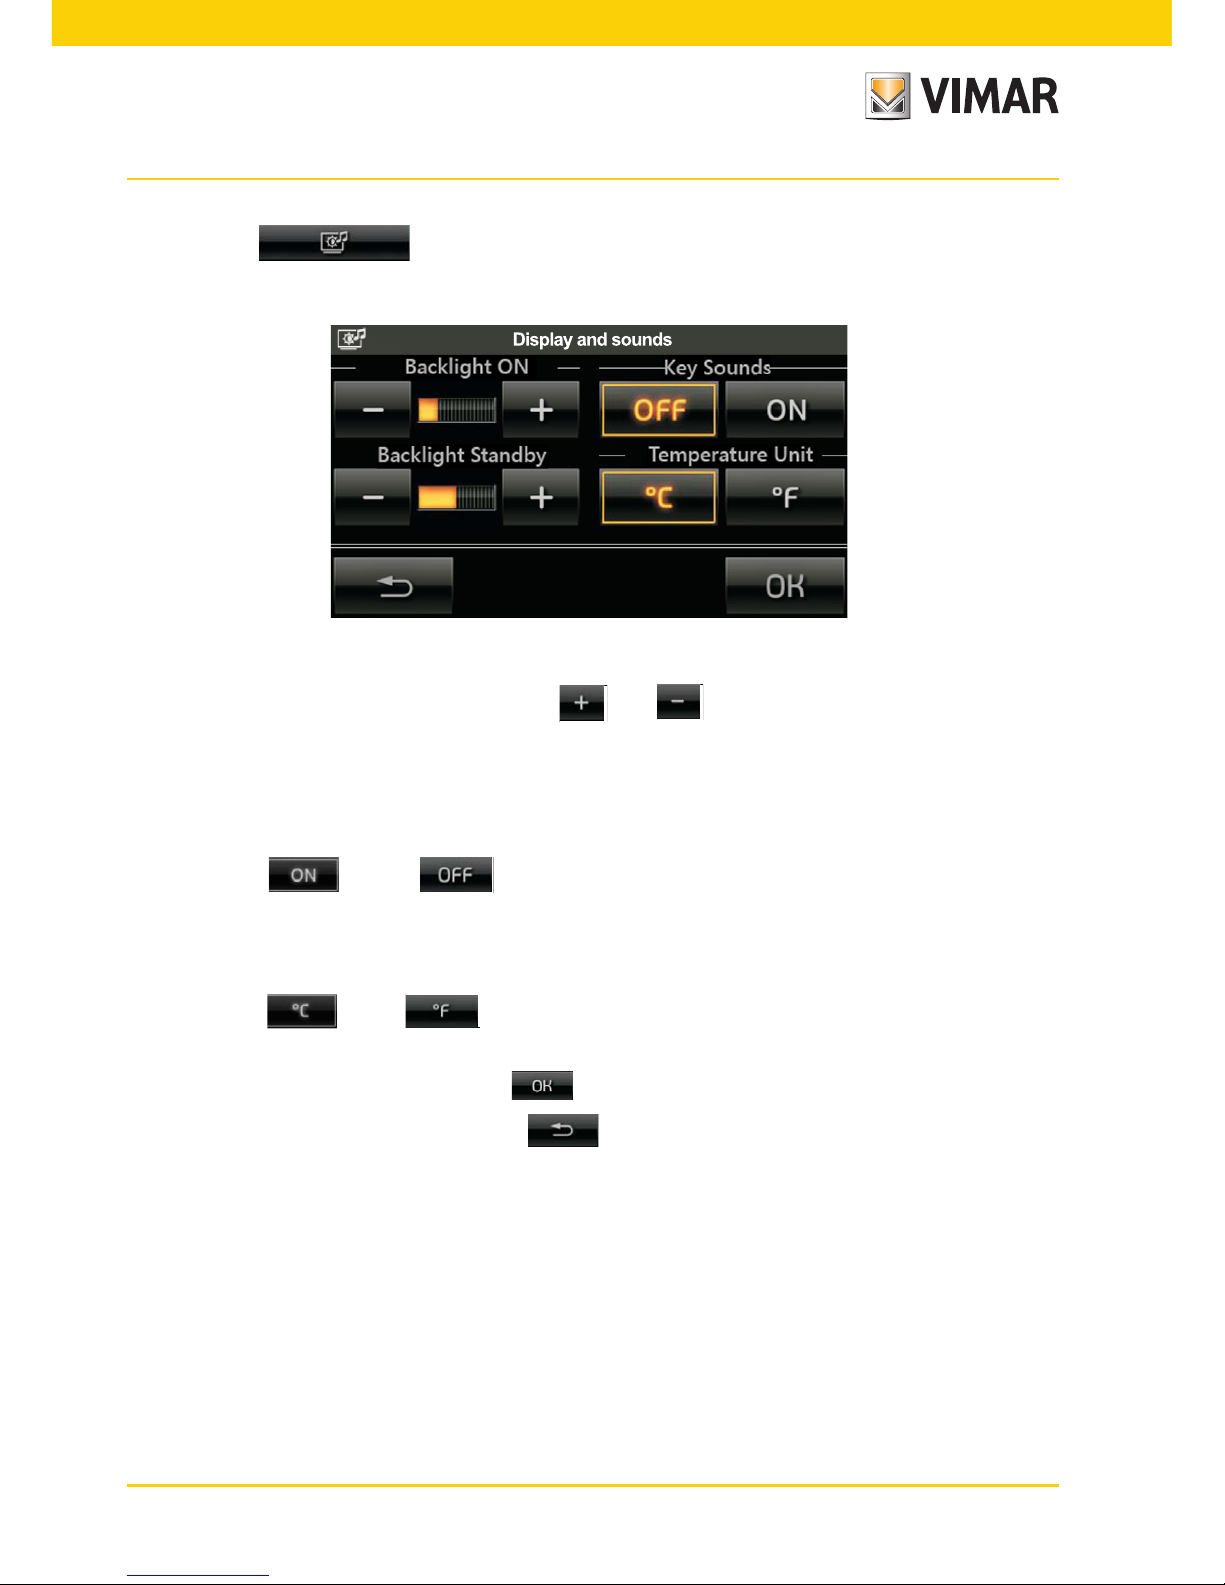
• Display
When the icon is touched the display shows the screen that allows you to adjust the back-
lighting and the contrast of the display.
Main menù
This is set by holding your finger on the icons until and the desired level is reached.
LED Life Time: 20.000 hours (at 25 °C)
The LED life time define as the estimated time to 50% degradation of initial luminous.
• Keys Tone
With the icons and it is possible to enable or disable the acoustic signal(beep) which
accompanies the touching of the icons displayed by the touch screen.
• Temperature Unit
With the icons and it is possible to select the unit of measurement with which the touch
screen will display the temperature in the various areas of the system.
To confirm the settings made, touch the icon .
To return to the previous screen touch the icon .
Page 7
5
Main menù
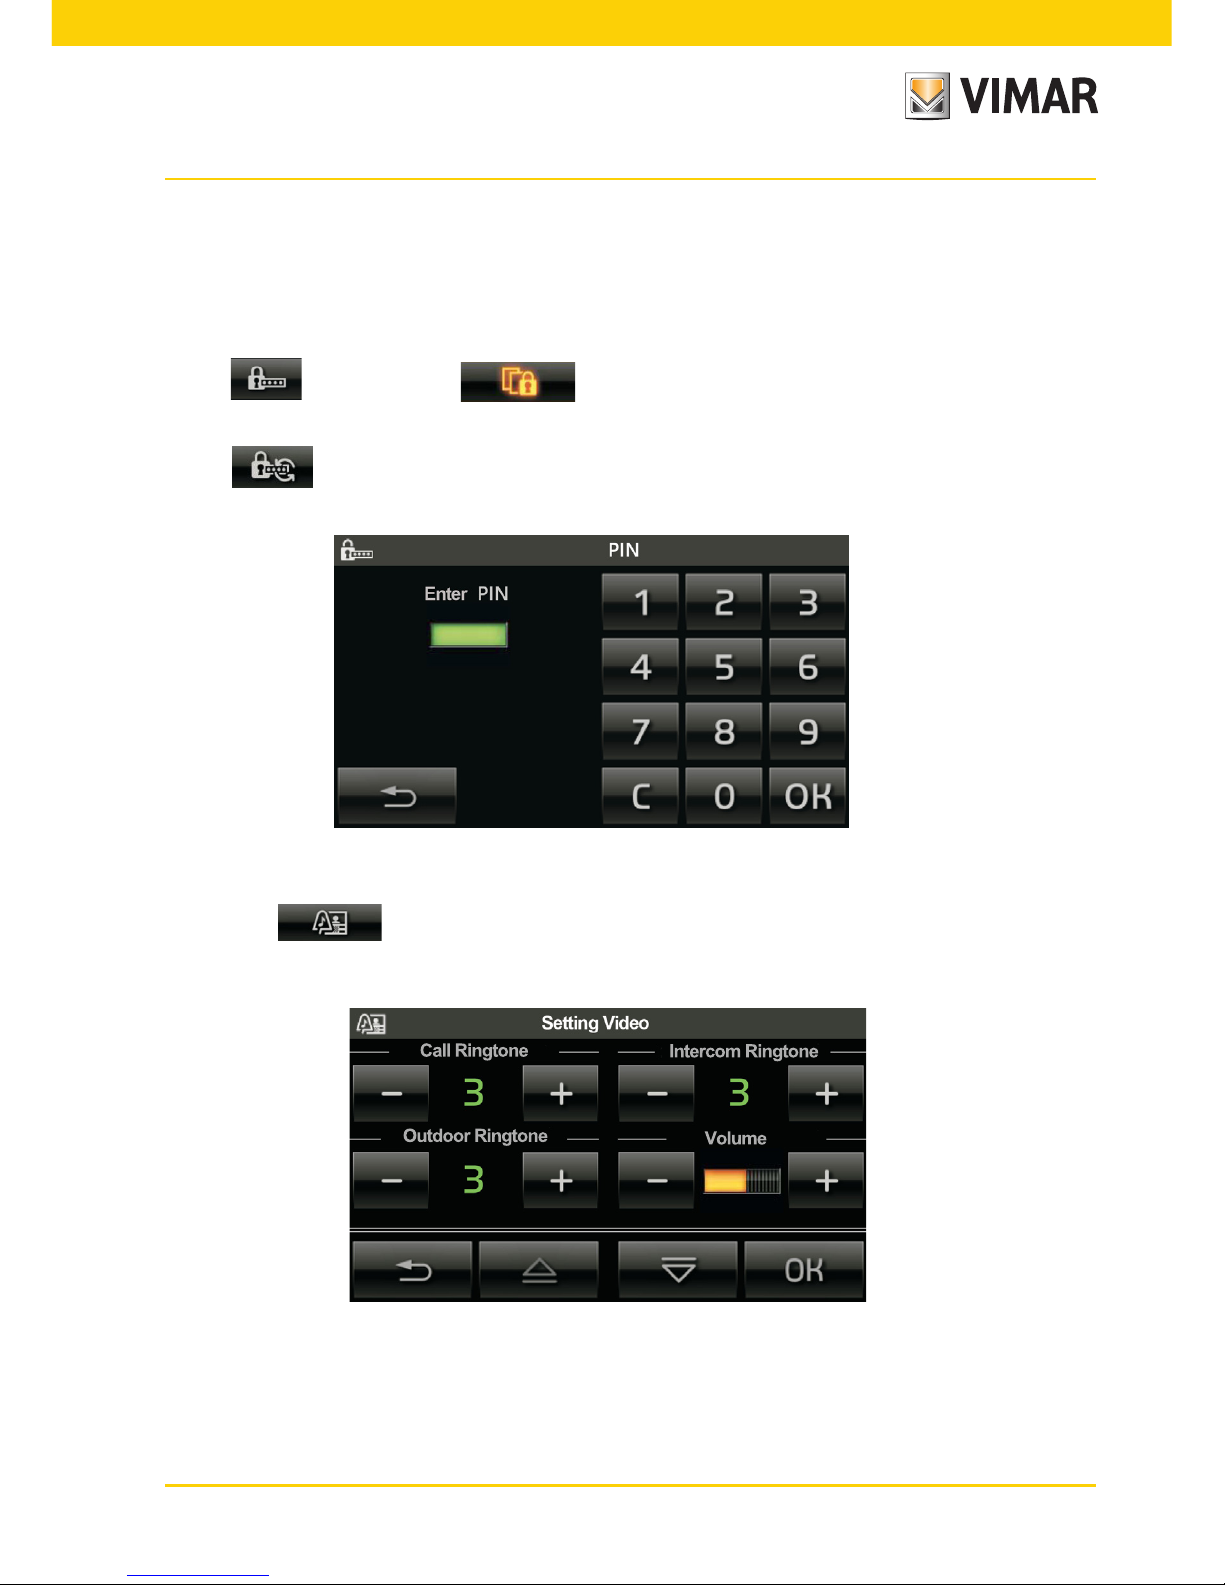
• Protection
With this option you set a password (from 4 to 6 digits) that inhibits displaying certain pages and therefore all the
controls associated with them. This application is useful, for example, to distinguish the use of the video touch
screen according to the current user.
Tap the icon and then the icon to display the page for setting the password (as shown on
the following page) and select the page to inhibit.
Tap the icon to edit a previously configured password.
• Video settings
Touching the screen appears that allows you to set the ring type to be combined with various types
of calls and adjust volume.
Page 8
6
Main menù
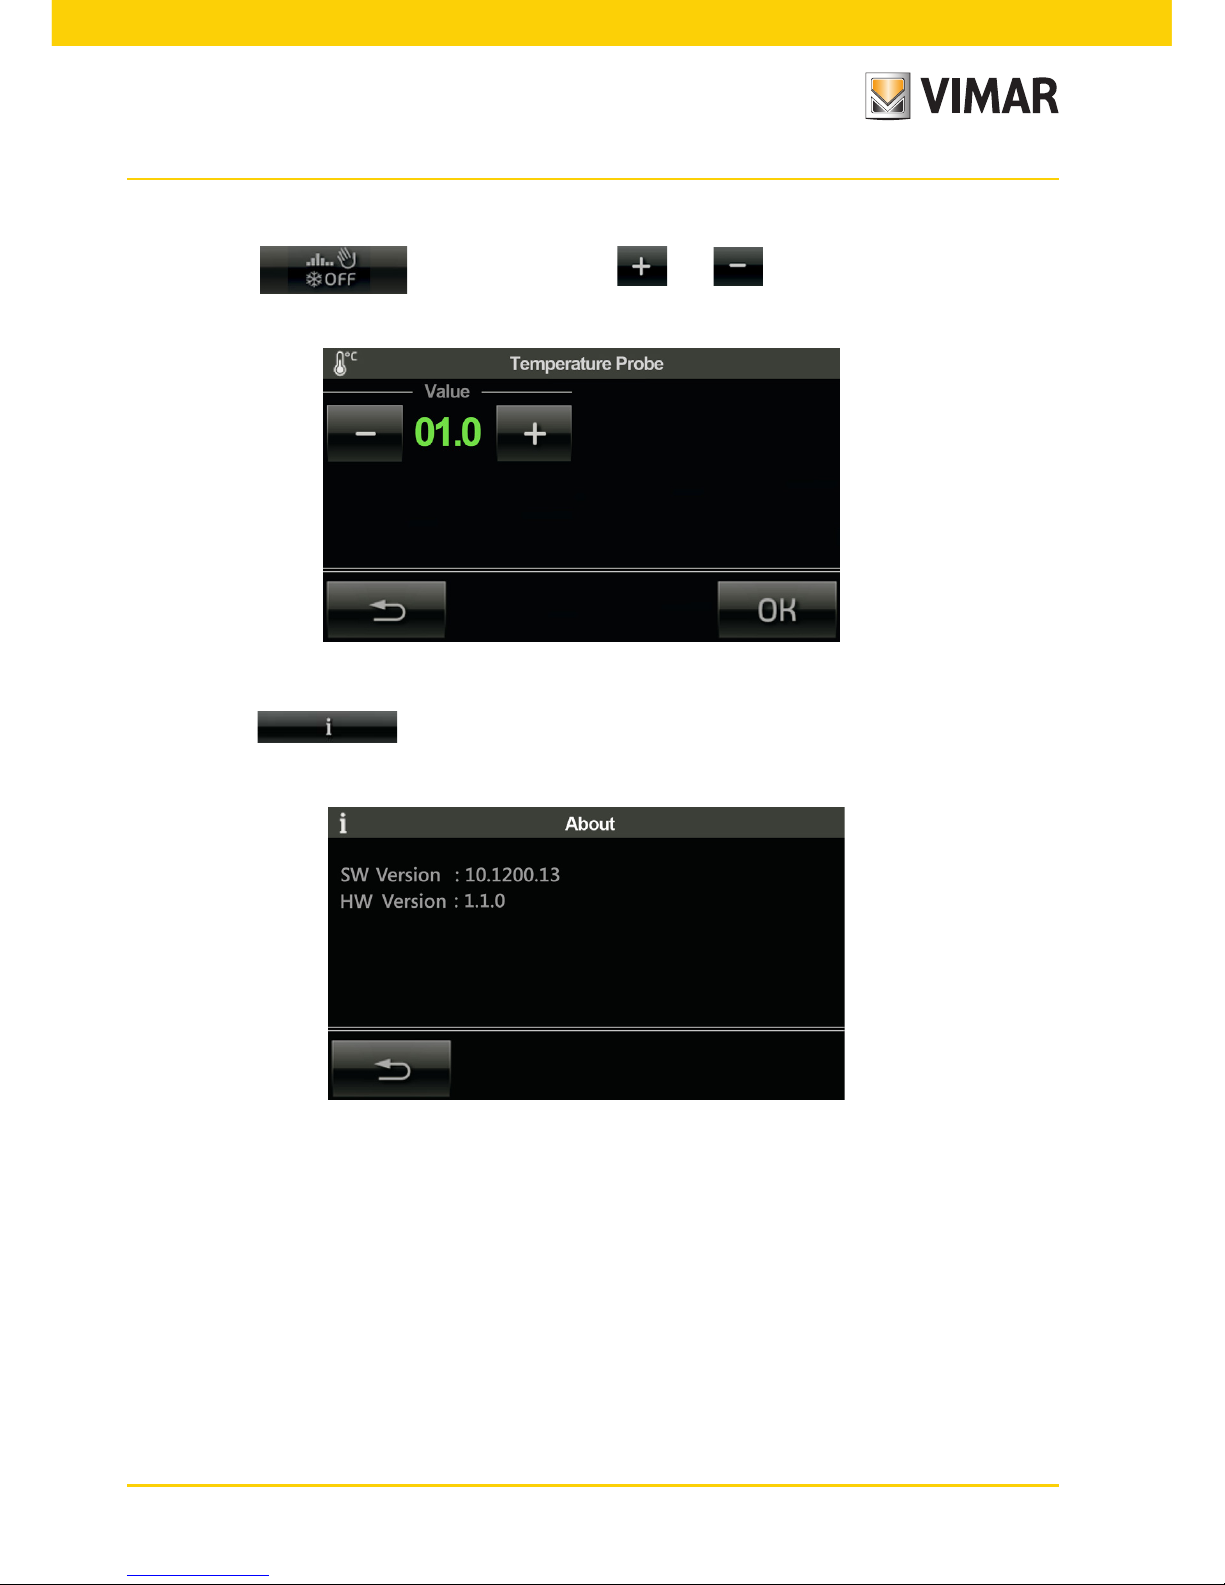
• Information
When the icon is touched the display is shown which gives the software release and the main
characteristics of the touch screen.
• Temperature probe
By tapping the icon you can, by using and , compensate for the value of the
temperature measured by the external probe (where applicable).
Page 9
7
Area management
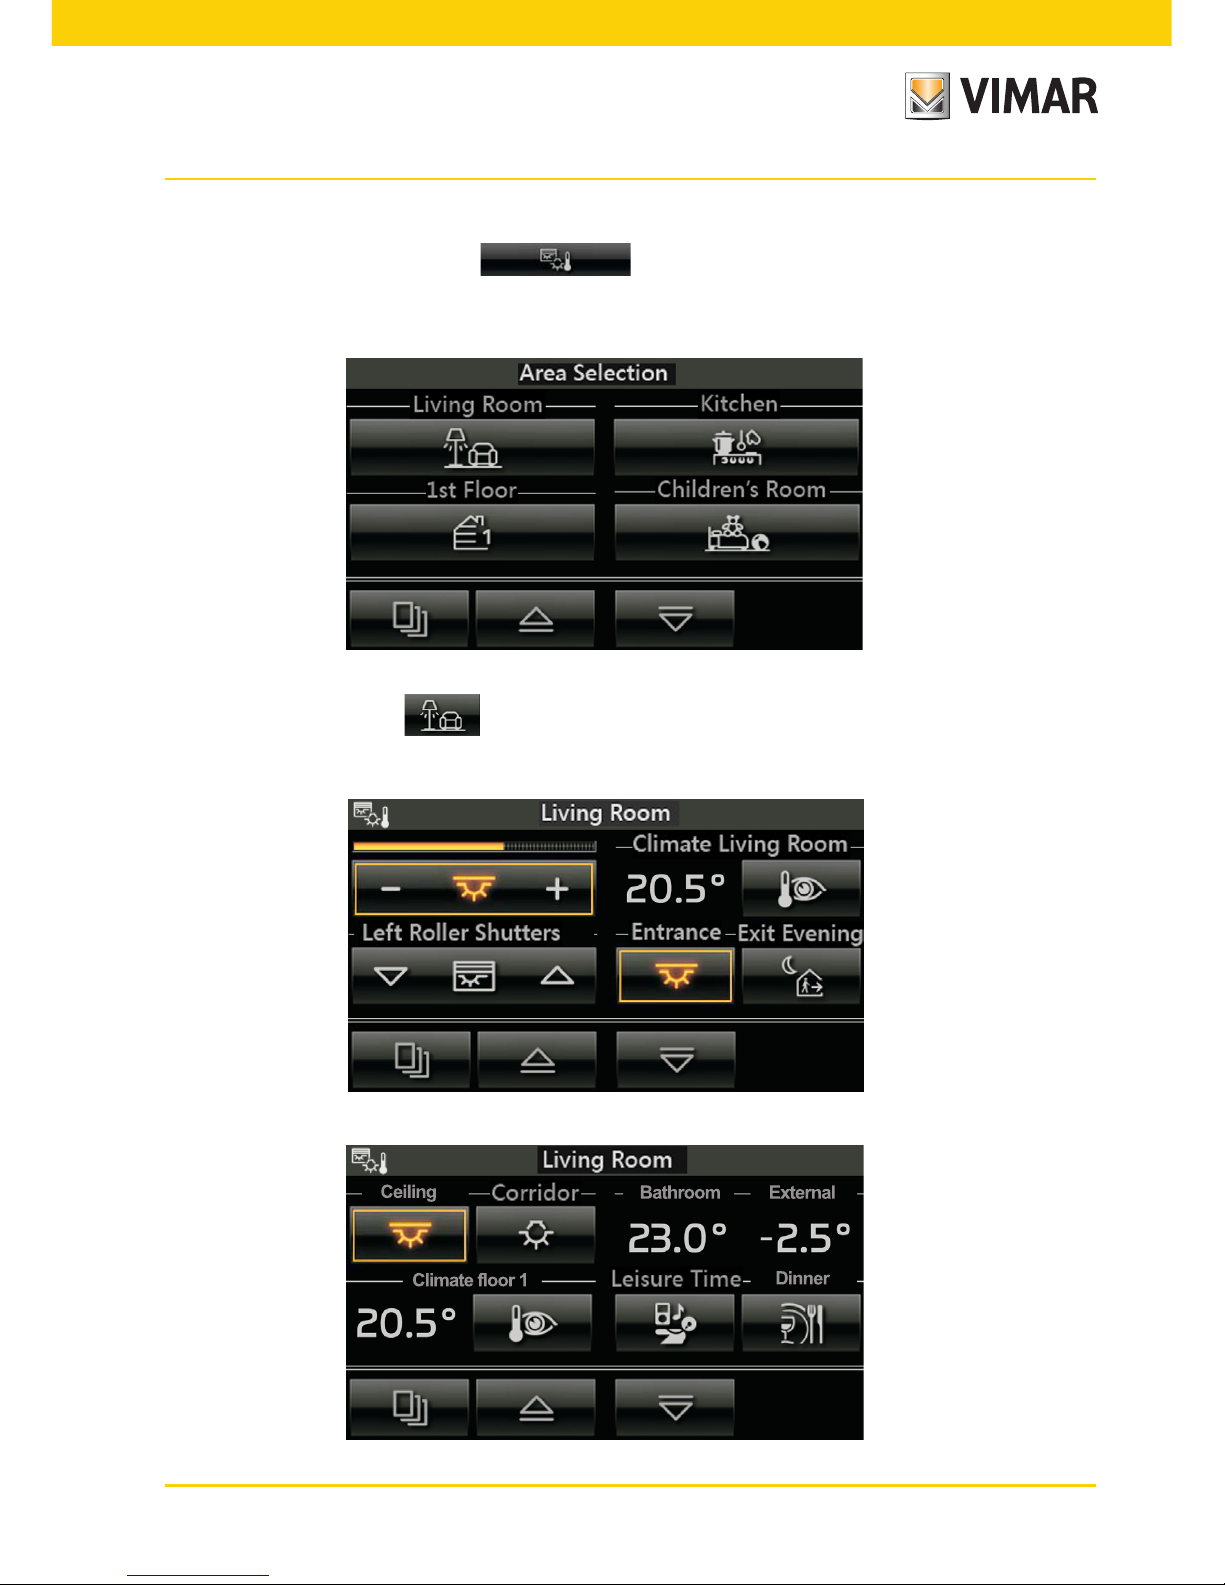
4. AREA MANAGEMENT.
From the main menu, when the icon , is touched the display is shown which allows you to
select the different areas of the system and to control the devices associated with them (lights, roller shutters,
climate, etc.).
For example, when the icon is touched that corresponds to the area called “Lounge”, the touch screen
displays the following screen:
Page 10

8
Area management
• Touching the icon switches on/off and adjusts the lighting called “Picture Light”.
• Touching the icon lifts and lowers the roller shutter called “Lounge left roller shutters”.
• Touching the icon gives access to the screen which allows you to adjust the temperature in the area
called “Lounge”.
• Touching the icon activates the scenario called “Entrance”; the same applies to all the other icons
associated with the different scenarios displayed.
• Touching the icons and scrolls through the whole screen for the groups and scenarios of the
selected area.
• Touching the icon gives access to the screens for all the other areas of the system.
• Touching the icon the screen that allows adjustment of the temperature of the environment called
"Living Room".
Touching the icon gives access to the screen for editing the automatic program.
Touching the , and , icons respectively increase and decrease the set
temperature and the speed of the fan-coil.
WARNING - Operation of the icons of activation of the scenarios:
• Short press: Activate the scenario.
• Long press (5 seconds): storage scenario (are stored and overwritten states of the groups involved in
the scenario being created).
Viewing the status of contact and relay interfaces.
If the rooms contain any contact interfaces used to control windows and/or doors and windows, the video touch
screen will enable monitoring their status.
For example, should a window have been left open, the icon for the contact interface associated with that window
will light up.
Page 11

9
Area management
4.1 MANAGING MONOCHROMATIC AND RGB LAMPS.
This lights management mode, which can only be used if the By-me home automation system is equipped
with dimmers, dedicated lamps and ballasts, by switching on/off and controlling brightness, provides efficient
lighting in the rooms while ensuring optimization of energy savings.
The new RGB functions (patented by Vimar) enable creating colour changes and elegant, sophisticated light
effects. You can also call up scenarios involving different functions in the home automation system such as, for
example, combinations of lights and colours matched to your favourite music to create a personalized, comfortable environment.
Managing monochromatic lamps
The monochromatic lamps are managed in the same way as for traditional lighting.
Tapping the icon switches on/off and adjusts the illumination of the associated monochromatic
lamps.
Managing RGB lamps
The video touch screen enables managing switching on/off, adjusting/changing the hue, saturation, and brightness of the RGB lamps and it will also be possible to activate/change the Fading-Show application
Depending on the operating mode, the adjustment icon will be displayed as follows:
• Lamp ON.
In this case the degree of illumination is constant (no adjustment)
and the colour is fixed.
• Lamp OFF.
As above but with the lamp off.
Page 12
10
Area management
- With and on Saturation you set the percentage of "vividness" of the colour.
- With and on Brightness you set the percentage of "contrast" of the colour.
- Tapping confirms the settings you have made.
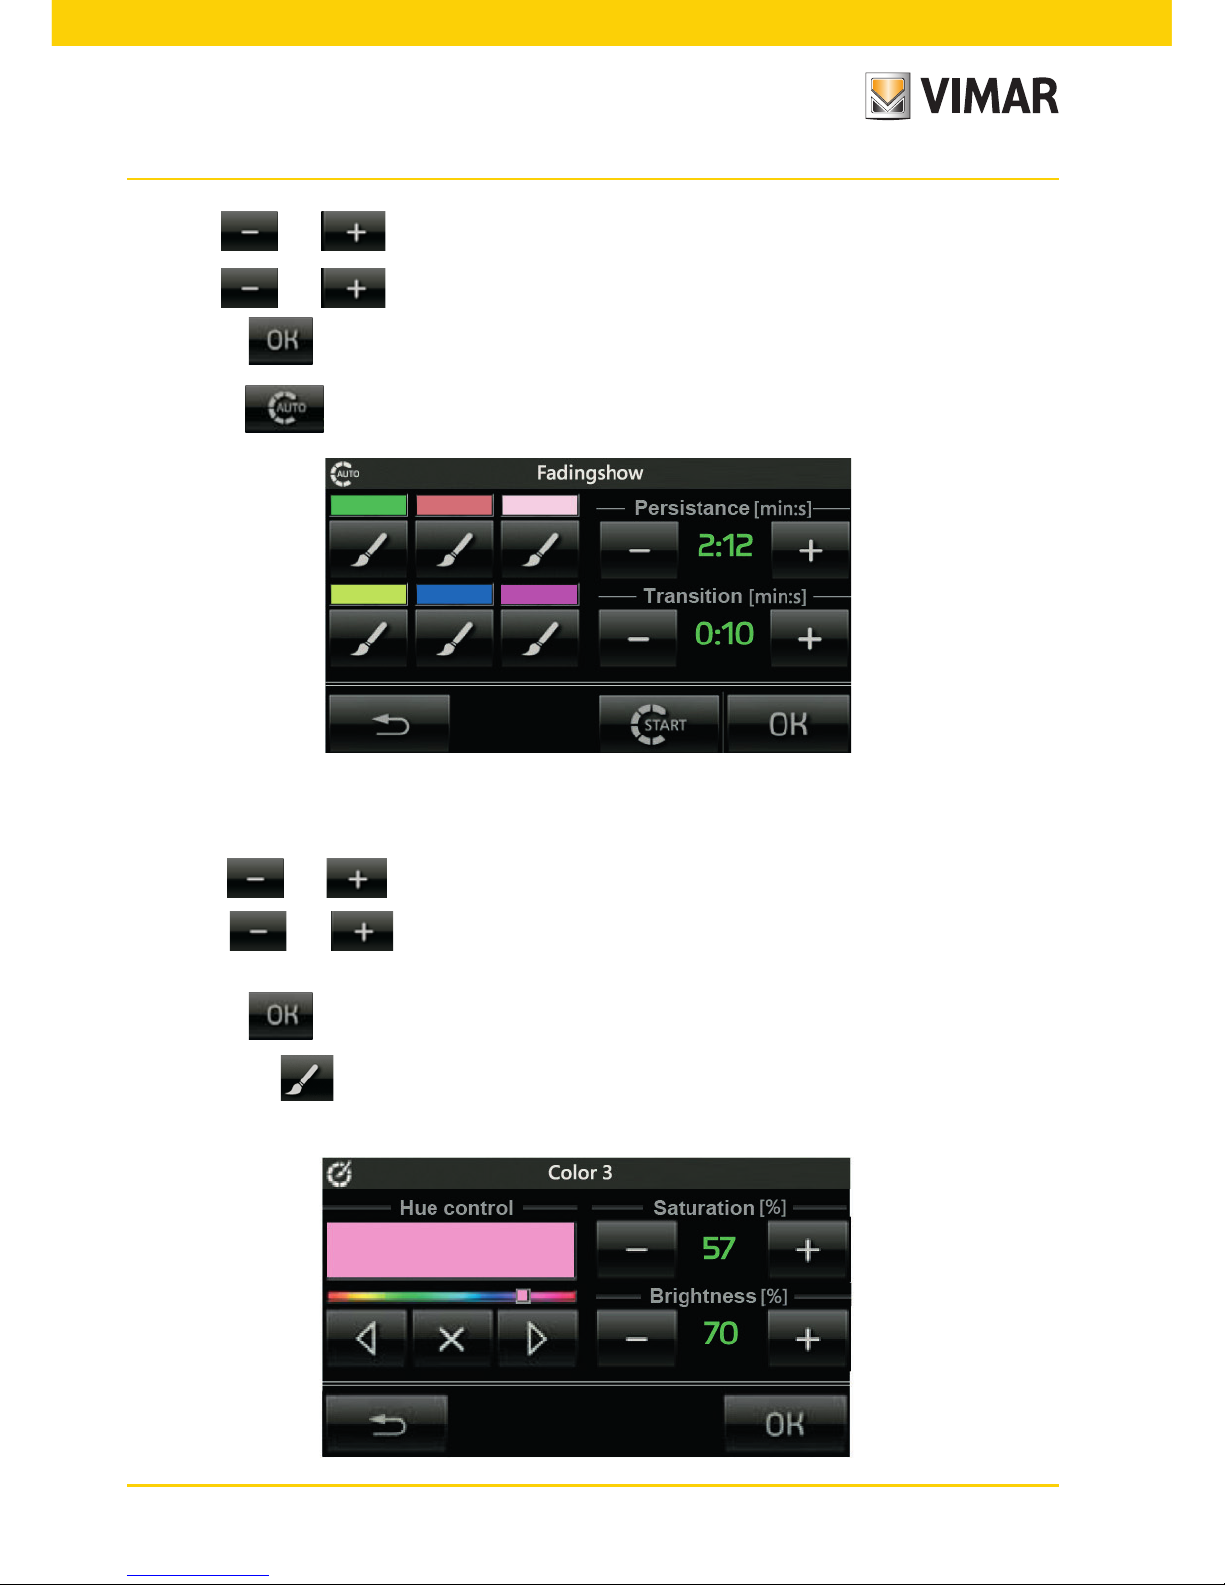
• Tapping the icon opens the screen where you make the Fading-Show settings.
The function of Fading-Show allows to set a cyclical sequence of colors (up to a maximum of 6) for color
changes and the play of light in the environments where the lamps are installed RGB.
- With and on Persistance you set the time during which each of the colors remains fixed.
- With and on Transition you set the time that elapses between the passage of a gradual
color to the next.
- Tapping confirms the settings you have made.
- Tapping the icon associated with each of the colors that make up the sequence is going to change
the color characteristics of that color; in fact will see the following screen:
Page 13
11
Area management
- With and you set the tone of color that will match the position of the cursor to the position
desired color.
- With and you set Saturation and Brightness.
- Tapping confirms the settings you have made.
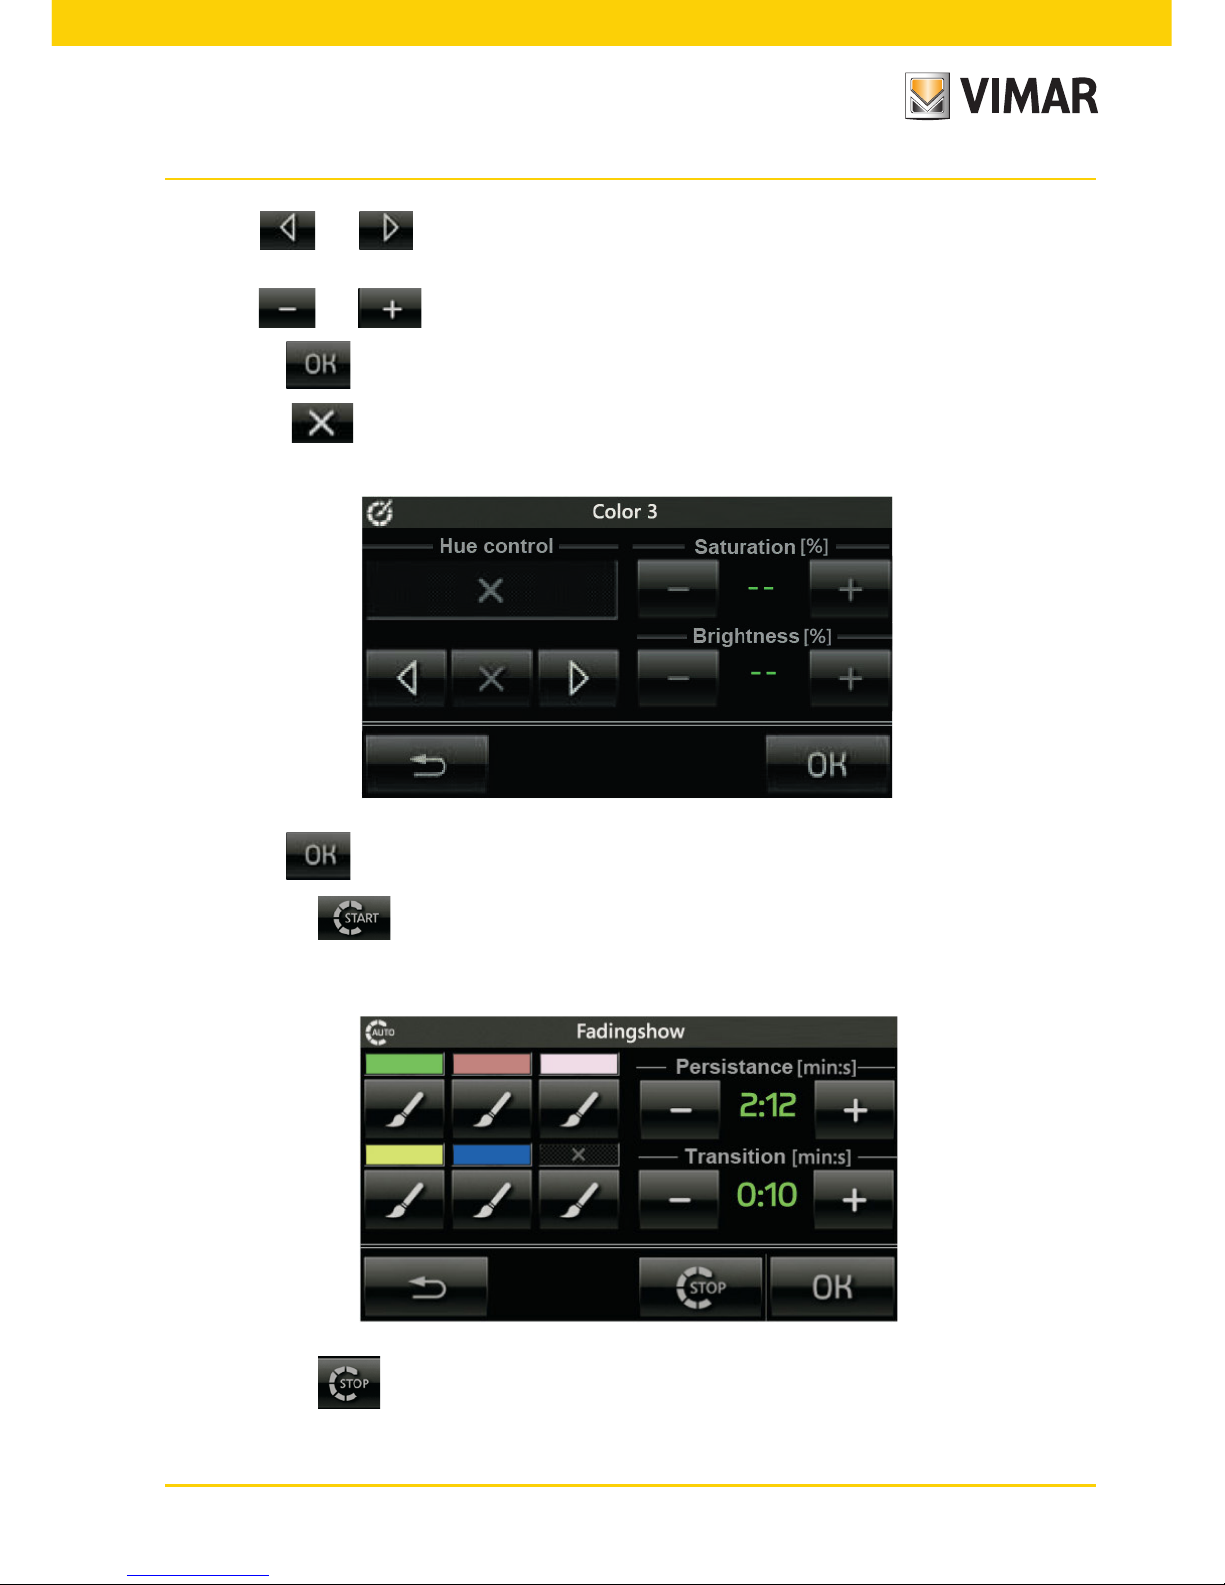
- Tapping you remove the color selected by the sequence of Fading-Show and the screen will
become as follows:
- Tapping confirms the settings you have made.
- Tapping the icon to activate the sequence Fading-Show just set.
When the sequence is active and you fall into the menu Fading-Show, the screen becomes the following:
- Tapping the icon will stop the sequence of Faing-Show set.
Page 14

12
4.2 HVAC MANAGEMENT.
With the touch screen it is possible to view the temperature measured by the various thermostats and to change
the typeof operation, the set temperature and the speed (from 1 to 3) of the fan coil.
Touching the icon displays the screen which allows you to set the operation (Manual, Automatic, etc.)
of the heating/air conditioning system for the area called “Lounge”.
Example for setting the Fading-Show with 4 colors.
- With the icon set the desired 4 colors; with remove the 2 colors that you want to include in the
sequence.
- With and set the Persistance and Transition (for example, 2 min and 15 s respectively).
- Tapping confirms the settings you have made.
- Tapping to activate the sequence Fading-Show just set.
In the case considered the color remains fixed for 2 minutes then if will start to change up to the next color within
15 seconds.
Area management
Page 15
13
Area management
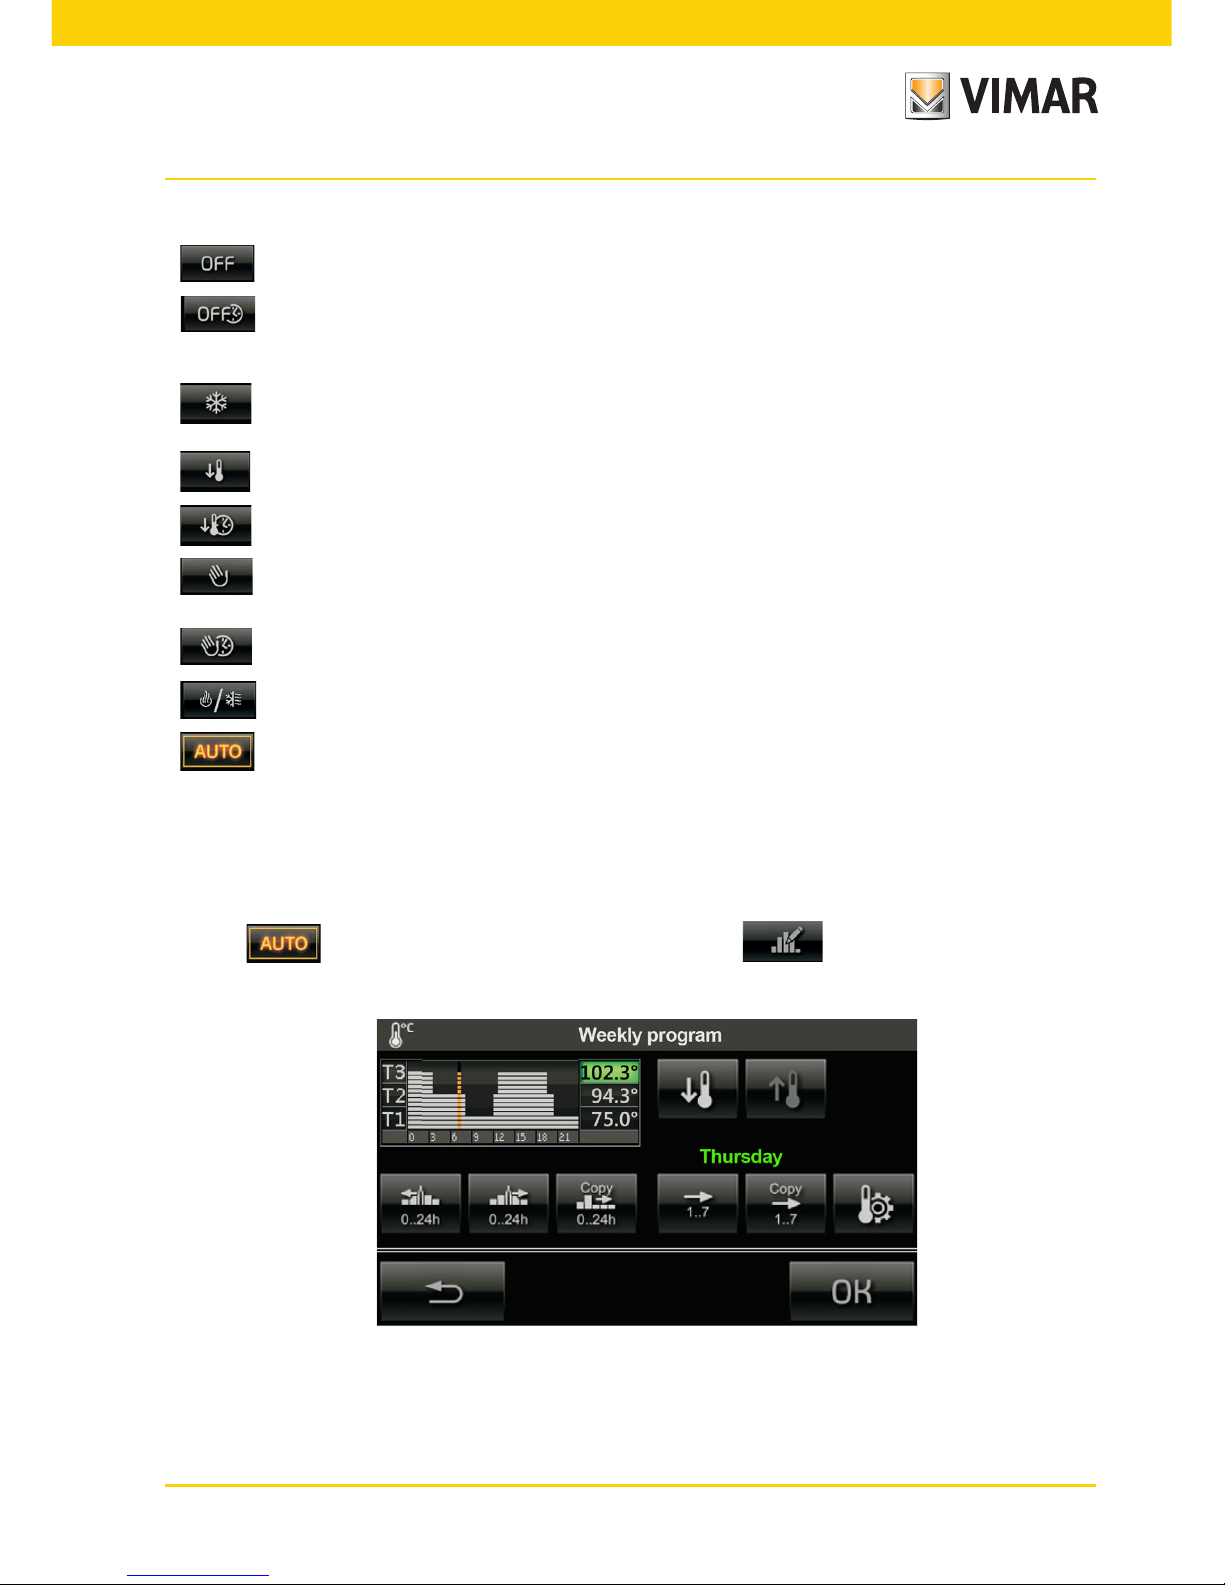
The icons are associated with the following modes of operation:
• = thermostat off.
• = thermostat off for a selectable number of hours (then it switches back on returning to the previous
operation).
• = the thermostat switches on in HEATING mode only if the ambient drops under the set antifreeze
temperature (e.g. 6°C).
• = manual temperature typically used at night (e.g. 15°C in winter).
• = as above, for a selectable number of hours (then it returns to the previous operation).
• = is the classic operation of traditional thermostats (the desired temperature is set manually with no
time limit).
• = as above, for a selectable number of hours (then it returns to the previous operation).
• = set the selected thermostat in SUMMER or WINTER mode respectively.
• = the weekly automatic program is activated.
As stated on the previous page, the touch screen enables changing the HVAC programs for automatic control of
the heating and air-conditioning previously configured on the control panel.
The personalization consists, for each day of the week, of setting the value of the temperature levels T1, T2 and
T3; in the heating and air-conditioning programs the values T1, T2 and T3 are differentiable.
Touching activates the automatic program; then touching brings up the screen for editing
the program.
Page 16
14
Area management
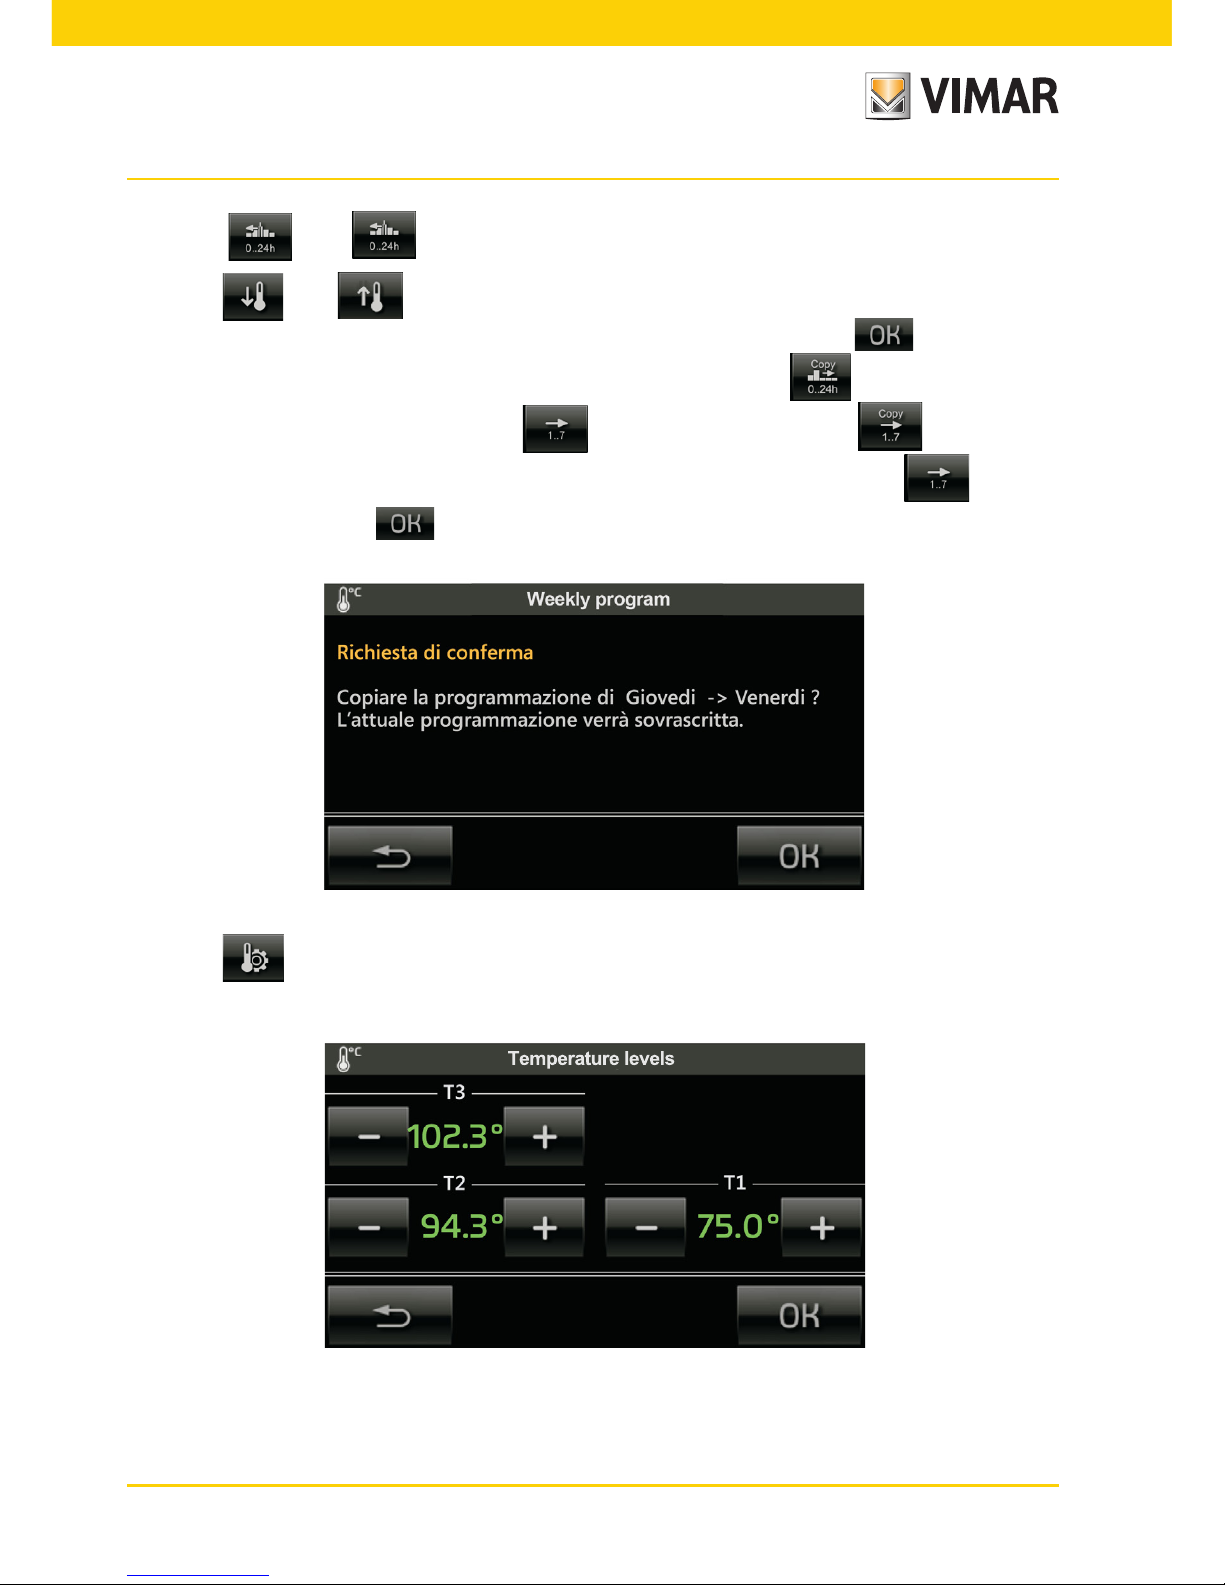
• Touching and selects the time slot for changing the temperature level.
• Touching and selects the desired temperature level; the histogram will be updated.
The procedure must be repeated for all the time slots to be changed, then confirm with .
• To copy the setting of the level of a time slot to another one/others, touch the icon.
• Select another day of the week by touching and proceed as above; using it is possible to
assign the day displayed with the program of any other day of the week; select by touching the day to
copy from and confirm with .
• Touching displays the screen used to change the value of the temperature levels T1, T2 and T3.
Page 17

15
Events Programs
5. EVENTS PROGRAMS.
From the main menu, touching the icon shows the screen that allows you to change the
automated functions previously configured on the control panel.
The Events Programs menu enables:
- stopping and restarting the selected event manually;
- changing the event on and/or off times.
• Touching stops the desired program and the icon is illuminated; to restart it simply touch the icon
again.
• Touching displays the screen that allows you to change the event on and/or off times.
The times can be changed according to the following time modes:
- Weekly clock;
- Period clock;
- Cyclical clock;
- Timing.
Page 18
16
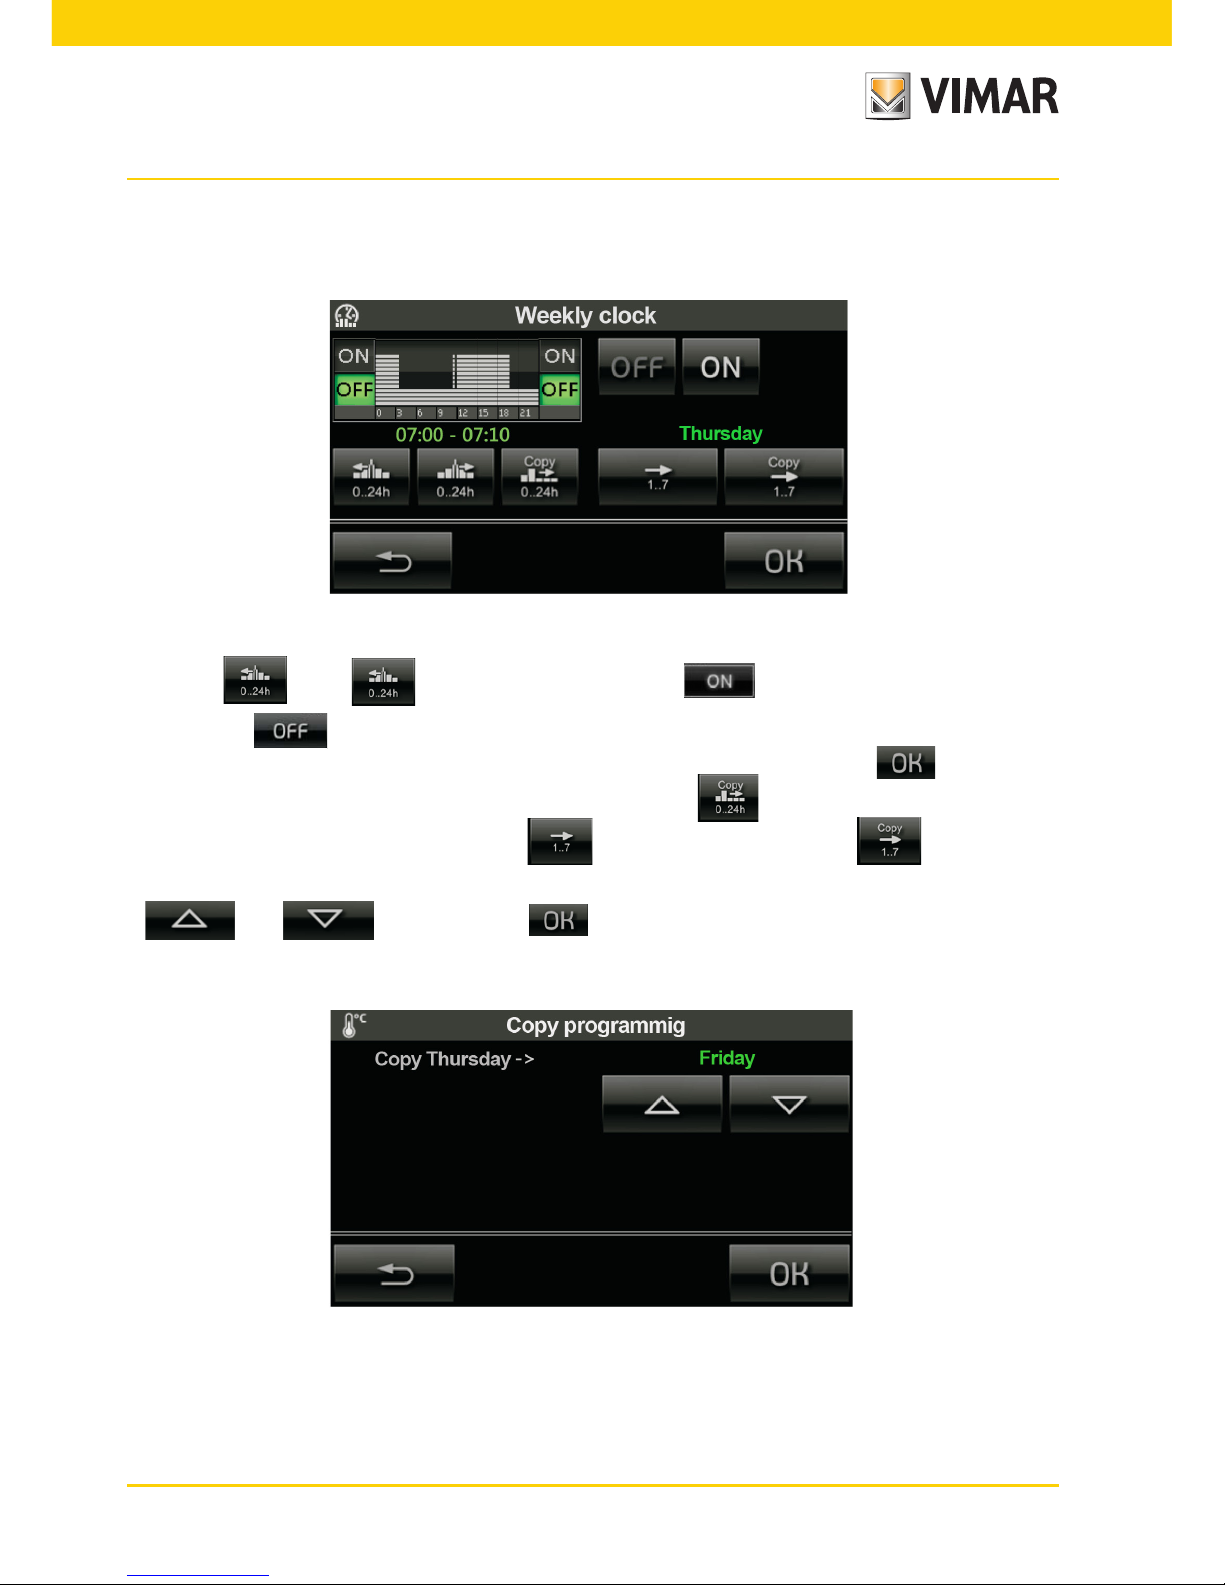
Weekly clock.
Enables, for every day of the week, setting activation of the event at intervals of 10 minutes (minimum time).
Touching and selects the desired range; the option activates the program for 10
minutes while deactivates it (the histogram will be updated).
The procedure must be repeated for all the ranges to be changed and lastly confirm with .
● To copy the setting of one range to another one/others, touch the icon.
• Select another day of the week by touching and proceed as above; using it is possible to
assign the day displayed with the weekly clock of any other day of the week; select the day to copy from with
and and confirm with .
Events Programs
Page 19

17
Events Programs
Period clock.
Enables activating and deactivating the event at most two times each day of the week setting the time in steps
of 1 minute.
Select the desired day of the week with the icon.
Touching and sets the beginning and end time of each of 2 events or of just one.
N.B. To delete an event, set the end time so it coincides with or is prior to its starting time. Deleting Event 1 also
deletes Event 2.
● The icon enables copying the program of a day that has already been set onto another one to set; the
procedure is similar to the one used for the weekly clock.
At the end, confirm the settings made by touching .
Cyclical clock.
Used to cyclically repeat the activation/deactivation (On-Off) of an event according to the set duration and
independently of the day, date and time.
Set the ON duration (h:min) with and .
Page 20

18
In similar manner, set the OFF duration (h:min).
At the end, confirm the settings made by touching .
Timing.
Used to set the duration of the program in hours and minutes.
This function must always be linked to 1 or 2 inputs and 1 or 2 output groups through an On-Off or Off-On type
message.
The control unit sends the first command when the event occurs and the second when the set time has elapsed.
Set the duration (h:min) with and .
At the end, confirm the settings made by touching .
Events Programs
Page 21

19
6. BURGLAR ALARM.
From the main menu, touching the icon displays the screen which allows you to view the status
of the burglar alarm system and to switch the system on/off. For example, the partialized active system screen (the
green colour represents active partialization) is of the type:
while the alarm system screen (the red colour represents the zones in alarm) will be of the type:
Burglar alarm
Page 22

20
Burglar alarm
The touch screen allows the burglar alarm system to be switched on/off with modes similar to those of the digital
keypad and therefore by typing in PIN codes; the screen is as follows:
Once the PIN code has been typed in, the touch screen will display the following screen:
• Touching the activates/deactivates all the functions associated with the PIN entered.
• Touching the gives access to screens allowing individual functions to be activated/deactivated.
• Touching the icon deactivates the acoustic signal of the current alarm.
Page 23

21
Burglar alarm
To include an area in partialization, it is sufficient to touch the corresponding icon and the edge of the latter will
become yellow in colour.
To confirm the settings made, touch the icon .
Page 24

22
Load control
7. LOAD CONTROL.
From the main MENU, tapping the icon takes you to the screen where you can view the status
of the controlled loads and the power consumption.
Indicator of consumption with respect
to the thresholds. If you have the
full-scale production changes dynamically, taking into account the energy
produced.
Dynamic Mode: Pressing the area that displays the instantaneous power for 2 min after the reading of the
will value every 2 s thus increasing the frequency of update of the data represented. At the end of 2 min, the
reading will repeat every 30 seconds until an eventual new pressure.
• Tapping displays the screen with which you can force the loads.
Page 25

23
Load control
• Tapping the icon corresponding to the desired load, forces that load.
The above icon is only displayed if the load can be forced. During configuration your installer will set which loads
can be forced and which cannot (see an example of the screen below).
Setting load priorities
This function lets you change the order in which the individual loads, previously set via the control unit during
configuration in the load control module, are cut off when necessary.
• Tap and to select the load whose priority you want to change and with and you
assign the new priority.
To confirm the settings made, tap .
Page 26
24
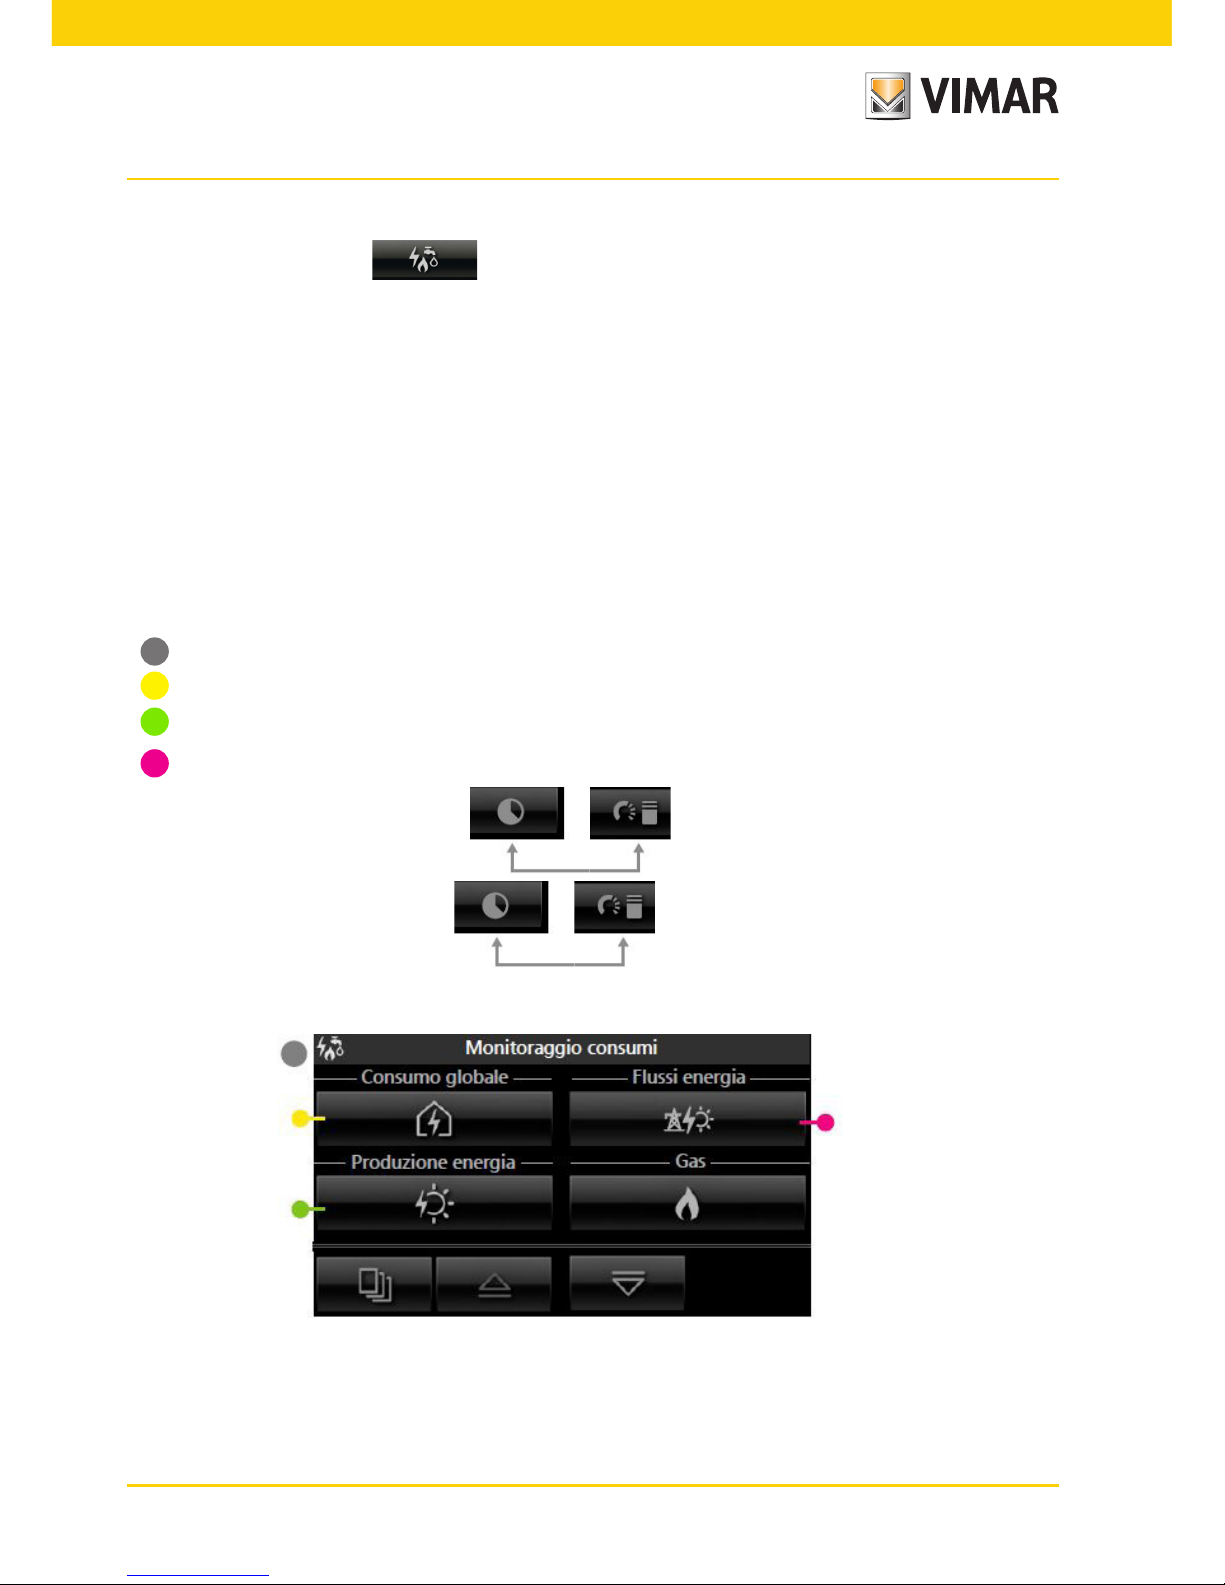
8. ENERGY MONITORING.
From the main menu, tap the icon and you access the menu that, depending on the structure of the
system, displays the following options:
• Global consumption (always present)
• Energy production (optional)
• Energy flows (optional)
• Pulse counter (optional) from 1 to 8 (for example cold water, gas, etc.)
• Single load (optional) from 1 to 8 (for example fridge, boiler, etc.)
8.1 GUIDE TO NAVIGATING THE SCREENS
The purpose of this section is to provide the user with a complete, intuitive graphical guide, which illustrates navigation among the screens of the touch screen dedicated to energy management.
The legend is as follows:
- : Main menu for Consumption Monitoring
- : Details of Global consumption
- : Details of the Production
- : Screen for the Energy flows
- On the screen for Global consumption : Estimated tap-off/self-consumption
- On the screen for Energy production : Estimated feed-in/self-consumption
Energy monitoring
Page 27
25
Energy monitoring
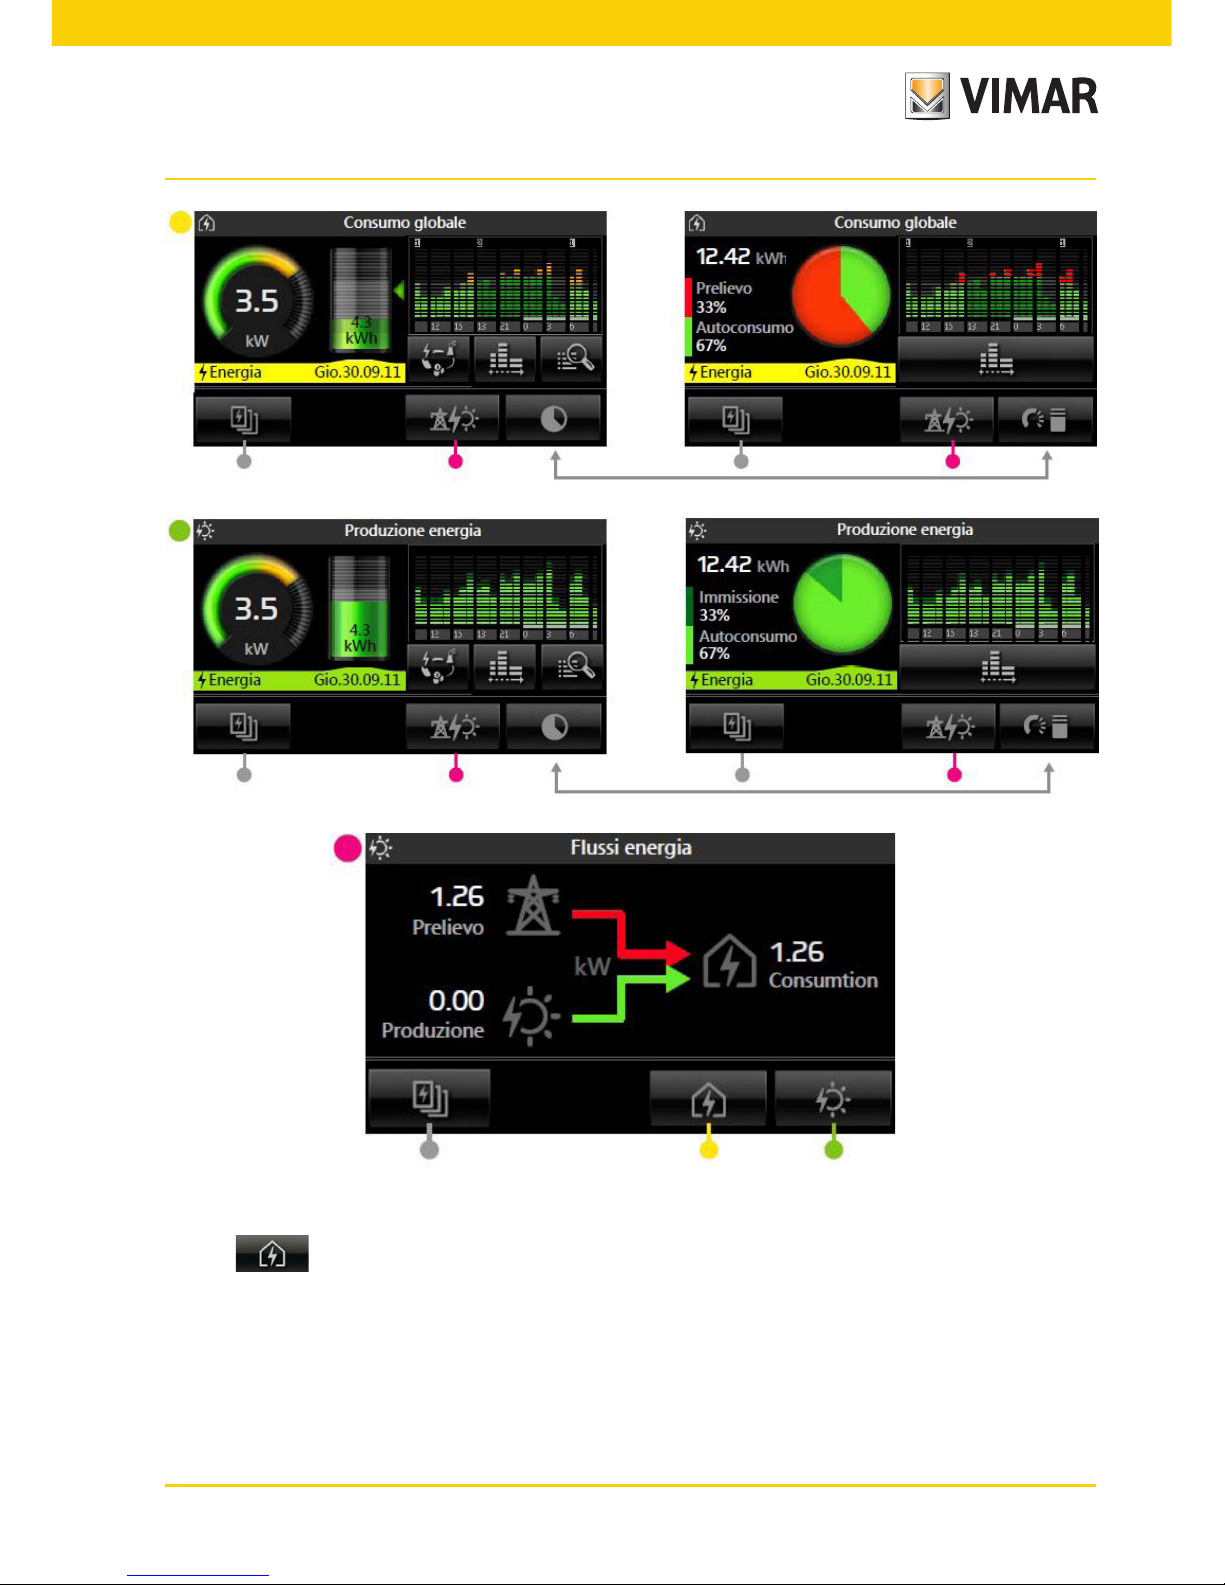
8.2 GLOBAL CONSUMPTION
Tapping brings up the screen for viewing and managing the energy consumption of the house (Energy
Guard) with:
- an indication of the instantaneous power in kW or CO
2
or cost in euro;
- an indication of the accumulated energy in kW/h or CO
2
or cost in euro;
- a bar chart of the accumulated energy in kW/h subdivided by day/week/month/year
Green indicates a value below the average, orange a value above the average and the grey background indicates
the average.
Page 28

26
Dynamic Mode: Pressing the area that displays the instantaneous power for 2 min after the reading of the
will value every 2 s thus increasing the frequency of update of the data represented. At the end of 2 min, the
reading will repeat every 30 seconds until an eventual new pressure.
IMPORTANT: The displayed value (in euro) is approximate: it is the equivalent in € of the energy consumed
and is not directly comparable to the total amount of the bill, which takes account of fixed costs, any
increases in energy prices during the two-month period and adjustments.
• Tapping the icon displays, sequentially and in a loop, the data for energy consumption (in kWh), emissions of greenhouse gases (if this feature has been enabled by the installer) and costs.
• Tapping the icon displays another screen that, by means of a pie chart and a series of histograms,
indicates the percentage of tapped-off energy and self-consumed energy of the total represented by the energy
consumed.
• Tapping the icon again displays the screen for Global consumption given at the beginning of the
page.
Energy monitoring
Consumption time slot
indicator
Instantaneous
consumption
Average quantitative
consumption
Estimated quantitative con-
sumption
Current quantitative consumption
Consumption histogram
Values displayed in the
consumption quantity icon
Page 29
27
• By tapping the icon you can change the reference time interval (daily, weekly, monthly and yearly) for the
bar chart of the production log.
The quantitative consumption displayed is:
- daily if the time scale set for the consumption histogram is in hours;
- weekly if the time scale set for the consumption histogram is in days;
- monthly if the time scale set for the consumption histogram is in weeks;
- yearly if the time scale set for the consumption histogram is in months.
The parts of the histogram highlighted at the bottom by a white line represent the values displayed in the quantitative consumption icon.
■ CONSUMPTION HISTOGRAM
The graphic representation of the consumption histogram varies depending on the type of contract made.
Time slot contract
- Average consumption: displayed in grey
- Actual consumption: displayed in green.
To represent the three possible time slots, different shades of green are used going from pale green for slot
1 to dark green for slot 3.
If the average consumption is exceeded, the histogram bar will turn yellow.
- If the set time scale is in hours, at the top left of the histogram a number is displayed that indicates the time slot.
Threshold contract
- Average consumption: displayed in grey.
This value represents the threshold of the expected consumption.
- Actual consumption: displayed in green (single shade).
The bar of the histogram turns yellow if the threshold is exceeded.
- Exceeding the monthly threshold is signalled by a small red icon that appears above the bars of the his-
togram (the icon is displayed from the moment when the threshold is exceeded until the end of the month).
■ QUANTITATIVE CONSUMPTION ICON
in this case, too, the graphic appearance of the icon varies according to the type of contract made.
Time slot contract
- Average consumption: displayed in grey
- Estimated consumption: green icon.
- Actual consumption: displayed in green.
To represent the three possible time slots, different shades of green are used going from pale green for slot
1 to dark green for slot 3.
If the average consumption is exceeded, the icon will turn yellow.
Threshold contract
- Average consumption: displayed in grey.
This value represents the threshold of the expected consumption.
Energy monitoring
Page 30
28
- Actual consumption: displayed in green (single shade).
The icon turns yellow if the threshold is exceeded.
- Exceeding the monthly threshold is signalled by a small red icon that appears above the icon
Quantitative consumption (this happens only if the monthly consumption is displayed).
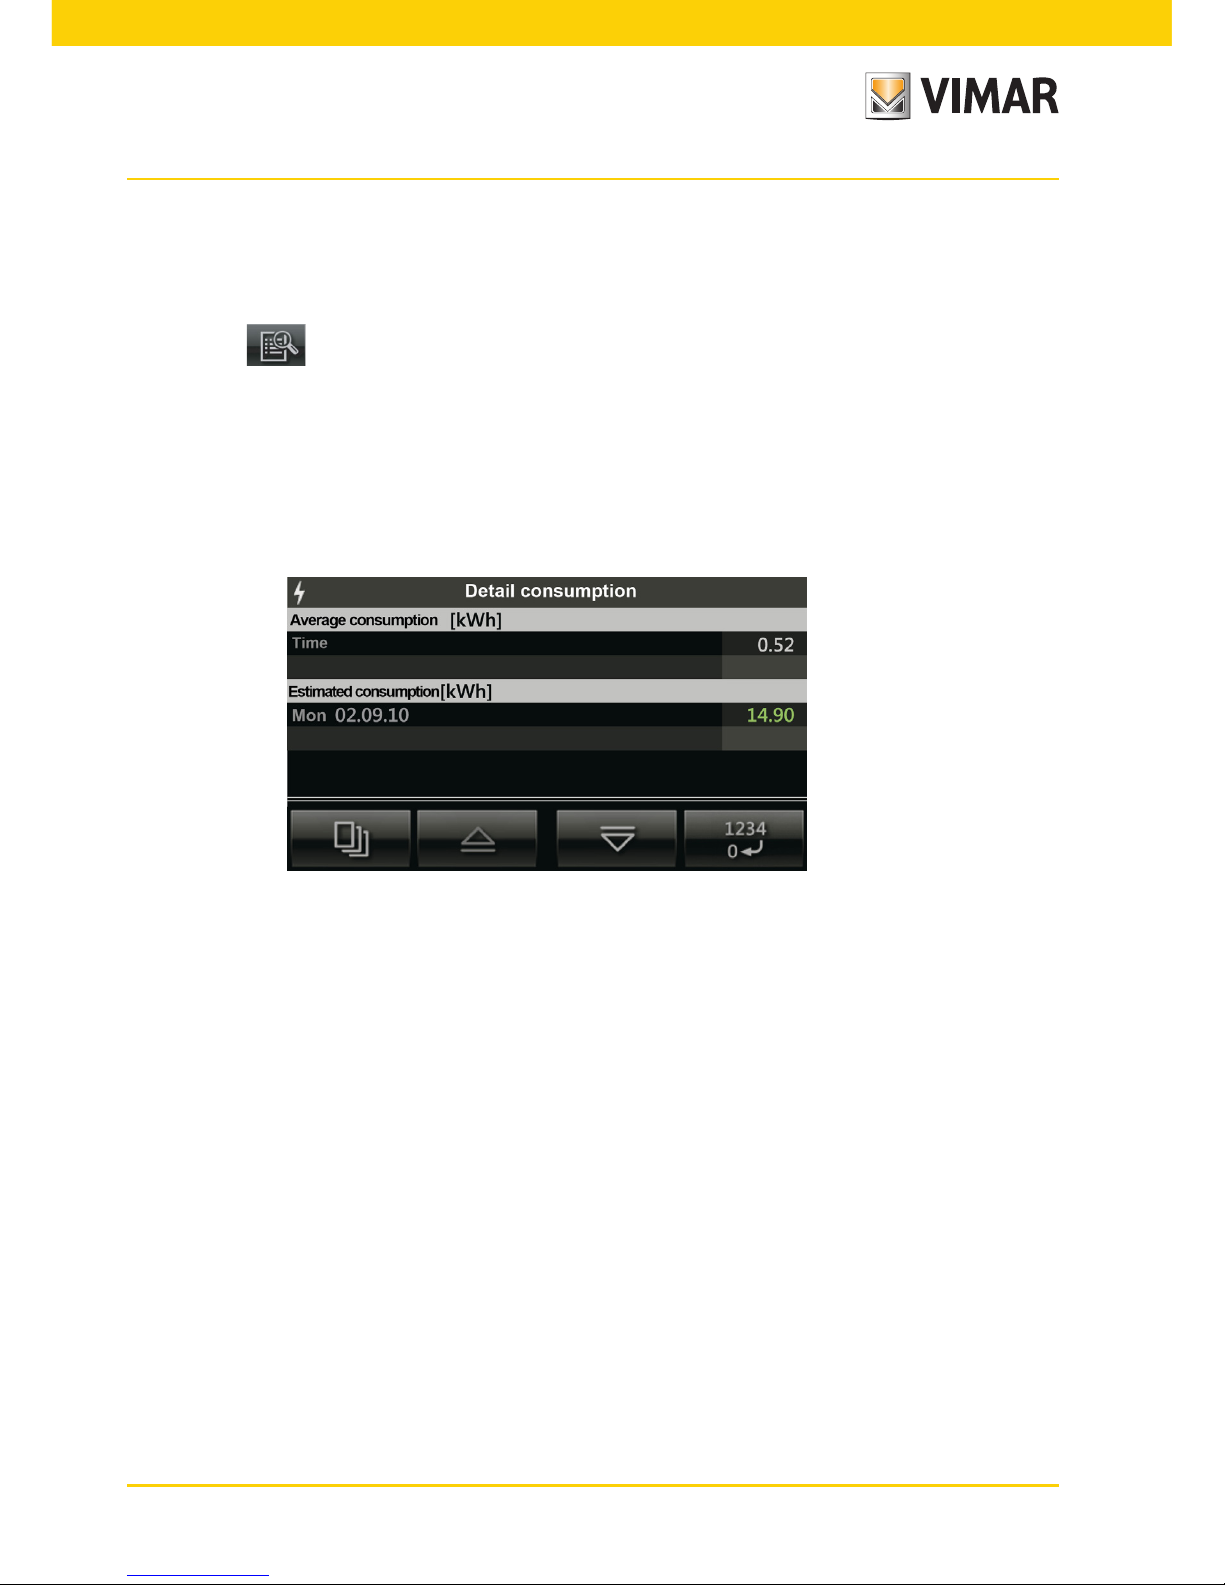
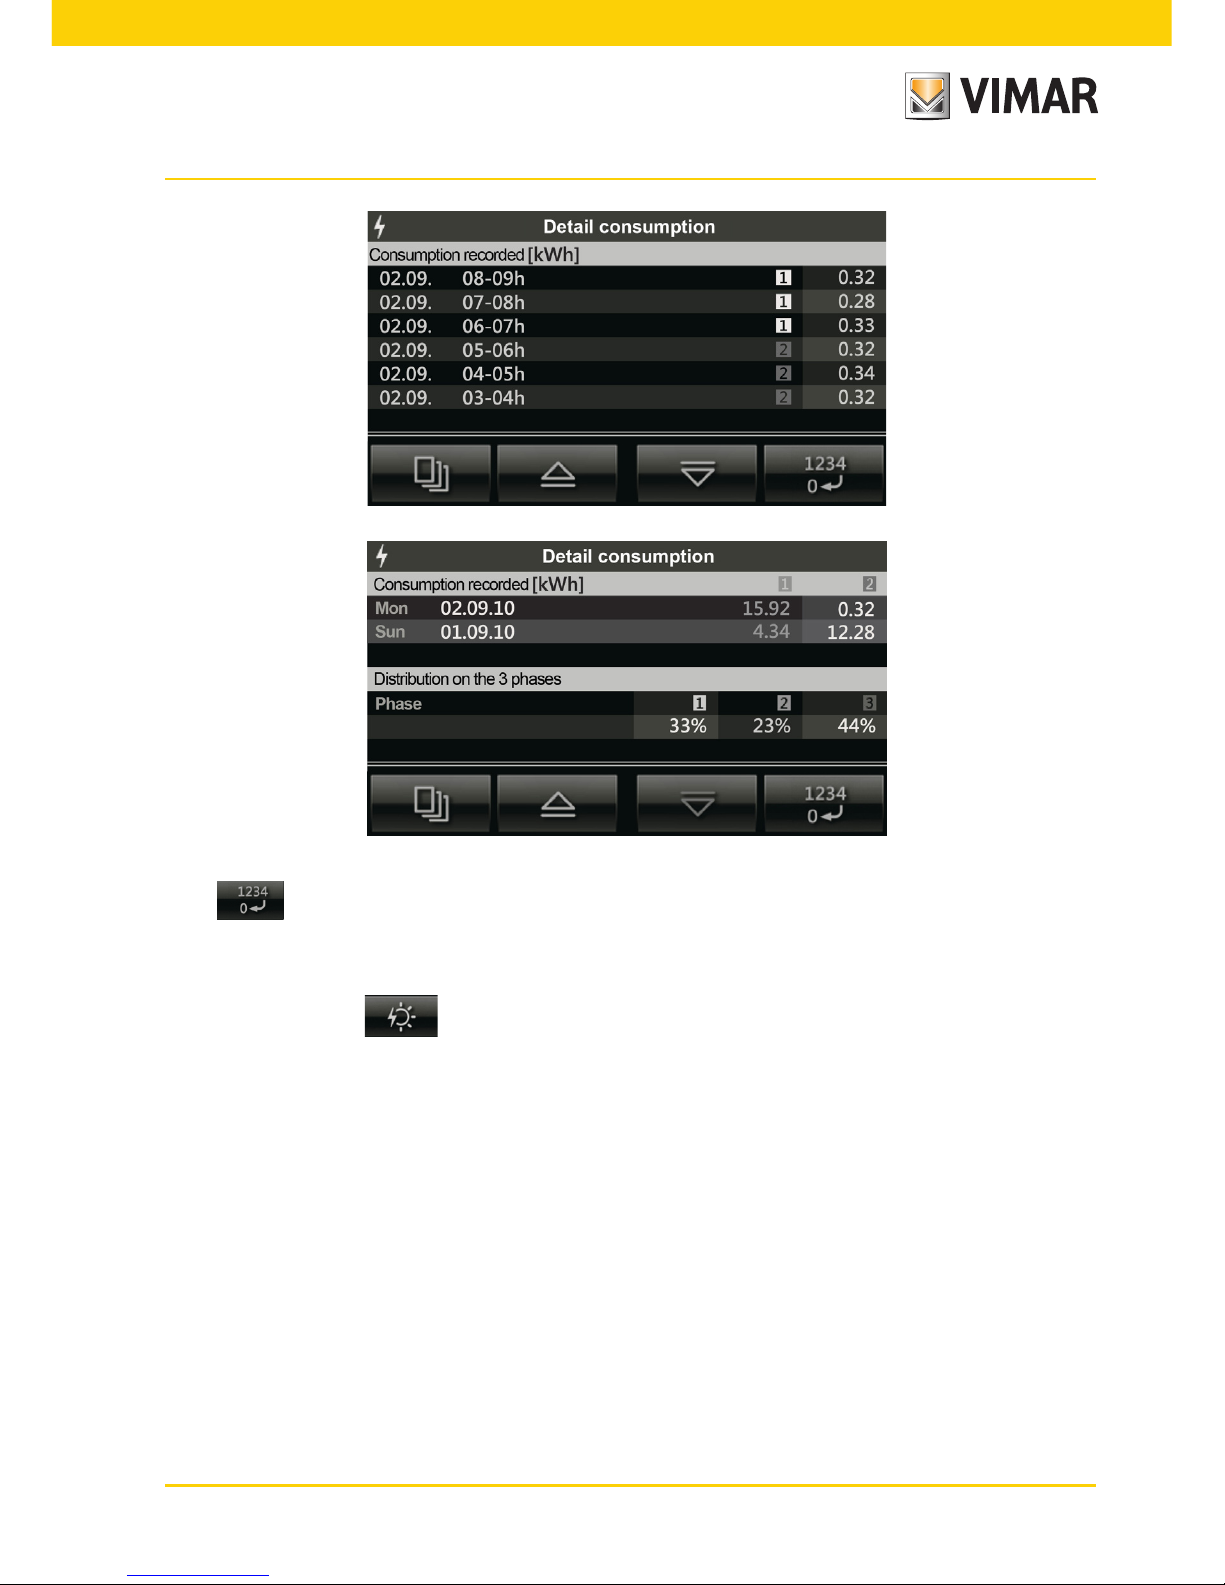
• Tapping the icon displays the detailed consumption screens according to the set unit of measurement
and time scale.
It is possible to manage electric power supply contracts with 1, 2 or 3 time slots or threshold contracts,
for which there is a monthly maximum of energy consumption (beyond which the cost of the energy
increases).
Finally, for three phase systems only, at the end of the third screen the percentage distribution of the energy
accumulated by each phase is displayed.
Energy monitoring
Page 31
29
• The icon is used to clear the data displayed on the screen.
8.3 ENERGY PRODUCTION
When present, tapping brings up the screen for viewing and managing the energy production of the
house with:
- an indication of the instantaneous power generated in kW or CO
2
or cost in euro;
- an indication of the accumulated energy generated in kW/h or CO
2
or cost in euro;
- a bar chart of the accumulated energy generated in kW/h or CO
2
or cost in euro subdivided by day/week/
month/year.
Dark green indicates the energy produced and light green indicates the auto-consumption.
N.B. Obviously, the value represented by light green will never be greater than that represented by dark green (at
most they can be equivalent).
Energy monitoring
Page 32

30
Dynamic Mode: Pressing the area that displays the instantaneous power for 2 min after the reading of the
will value every 2 s thus increasing the frequency of update of the data represented. At the end of 2 min, the
reading will repeat every 30 seconds until an eventual new pressure.
• Tapping the icon displays, sequentially and in a loop, the data for energy consumption (in kWh), emissions of greenhouse gases (if this feature has been enabled by the installer) and costs.
• Tapping the icon displays another screen that, by means of a pie chart and a series of histograms, indicates the percentage of fed-in energy and self-consumed energy of the total represented by the energy produced.
• Tapping the icon again displays the screen for Energy production given at the beginning of the page.
• By tapping the icon you can change the reference time interval (daily, weekly, monthly and yearly) for the
bar chart of the production log.
Energy monitoring
Instantaneous
production
Indication of average
production
Average quantitative production
Current quantitative production
Histogram of the
accumulated energy
Values displayed in the
production quantity icon
Page 33

31
The quantitative production displayed is:
- daily if the time scale set for the histogram is in hours;
- weekly if the time scale set for the histogram is in days;
- monthly if the time scale set for the histogram is in weeks;
- yearly if the time scale set for the histogram is in months.
• Tapping the icon displays the detailed production screens according to the set unit of measurement
and time scale.
The screens detailing the production of energy show:
- the average production, average hourly (or daily/weekly/monthly) auto-consumption in kW/h and the percentage
ratio of the former to the latter;
- the daily (or weekly/monthly/yearly) estimated production and auto-consumption in kW/h and the percentage
ratio of the former to the latter;
- the hourly (or daily/weekly/monthly) production and auto-consumption in kW/h,
• The icon is used to clear the data displayed on the screen.
Energy monitoring
Page 34

32
Energy monitoring
8.4 ENERGY FLOWS
The energy flow screens quickly and intuitively show the energy exchanges in progress and let you at any time see
the state of your consumption, production and any tapping off from or feeding in to the power grid.
The direction of the arrows indicates the direction of the energy while their colour indicates respectively:
- : Energy fed in
- : Energy self-consumed
- : Energy tapped off
- : No energy exchange
If both are present, "tap-off" and "feed-in" are displayed alternately according to the direction of energy.
The following are some of the screens that appear most frequently:
Page 35

33
Energy monitoring
Conversely, the following screens illustrate situations that are shown less frequently:
Page 36

34
8.5 SINGLE LOAD CONSUMPTION
From the consumption monitoring menu (chapter 8), tapping the icon of the desired load (e.g. Fridge) brings
up the screen (quite similar to that for global consumption) for viewing and managing power consumption with:
- an indication of the instantaneous power in W or CO
2
or cost in euro;
- an indication of the accumulated energy in kW/h or CO
2
or cost in euro;
- a bar chart of the accumulated energy in kW/h subdivided by day/week/month/year.
Green indicates a value below the average, the intermediate green/orange indicates the last mark before reaching
the average value, orange a value above the average and the grey background indicates the average.
Energy monitoring
Consumption time slot
indicator
Instantaneous
consumption
Average quantitative
consumption
Estimated quantitative
consumption
Current
quantitative
consumption
Consumption histogram
Values displayed in the
consumption quantity icon
Page 37

35
Energy monitoring
Dynamic Mode: Pressing the area that displays the instantaneous power for 2 min after the reading of the
will value every 2 s thus increasing the frequency of update of the data represented. At the end of 2 min, the
reading will repeat every 30 seconds until an eventual new pressure.
• By tapping the icon you can select the unit of measurement with which the touch screen will display the
load power consumption. The graph of the consumption will however always be shown in kW.
• By tapping the icon you can set the time scale (hours, days, weeks, months) for measuring the consumption.
The quantitative consumption displayed is:
- daily if the time scale set for the consumption histogram is in hours;
- weekly if the time scale set for the consumption histogram is in days;
- monthly if the time scale set for the consumption histogram is in weeks;
- yearly if the time scale set for the consumption histogram is in months.
The parts of the histogram highlighted at the bottom by a white line represent the values displayed in the quantitative consumption icon.
• Tapping the icon displays the detailed consumption screens according to the set unit of measurement
and time scale.
The pages detailing single load consumption show:
- the average hourly consumption per time slot (in kW and percentage) with the relevant total;
- the estimated total daily consumption subdivided by time slot (in kW and percentage) with the relevant total;
- the hourly consumption (daily/weekly/monthly) measured in kW with an indication of the time slot.
• The icon is used to clear the data displayed on the screen.
8.6 PULSE COUNTER
From the consumption monitoring menu (chapter 8), tapping the Pulse Counter icon takes you to the screen for
viewing and managing the consumption of utilities such as Water, Gas, etc. with:
- an indication of the overall consumption;
- a bar chart of the consumption or cost in euro subdivided by day/week/month/year;
Green indicates a value below the average, the intermediate green/orange indicates the last mark before reaching
the average value, orange a value above the average and the grey background indicates the average.
Indication of average
consumption
Total
consumption
Consumption histogram
Values displayed in the
consumption quantity
Page 38

36
Energy monitoring
• By tapping the icon you can set the type of measurement with which the touch screen shows the data
(consumption in m3, cost in euro);
• By tapping the icon you can set the time scale (hours, days, weeks, months) for measuring the con-
sumption.
The quantitative consumption displayed is:
- daily if the time scale set for the histogram is in hours;
- weekly if the time scale set for the histogram is in days;
- monthly if the time scale set for the histogram is in weeks;
- yearly if the time scale set for the histogram is in months.
• Tapping the icon displays the detailed consumption screens according to the set unit of measurement
and time scale.
The detail pages show:
- the average hourly (or daily/weekly/monthly) consumption;
- the estimated daily (or weekly/monthly/yearly) consumption in m
3
;
- the hourly (or daily/weekly/monthly) consumption in m
3.
• The icon is used to clear the data displayed on the screen.
Page 39
37
Energy monitoring
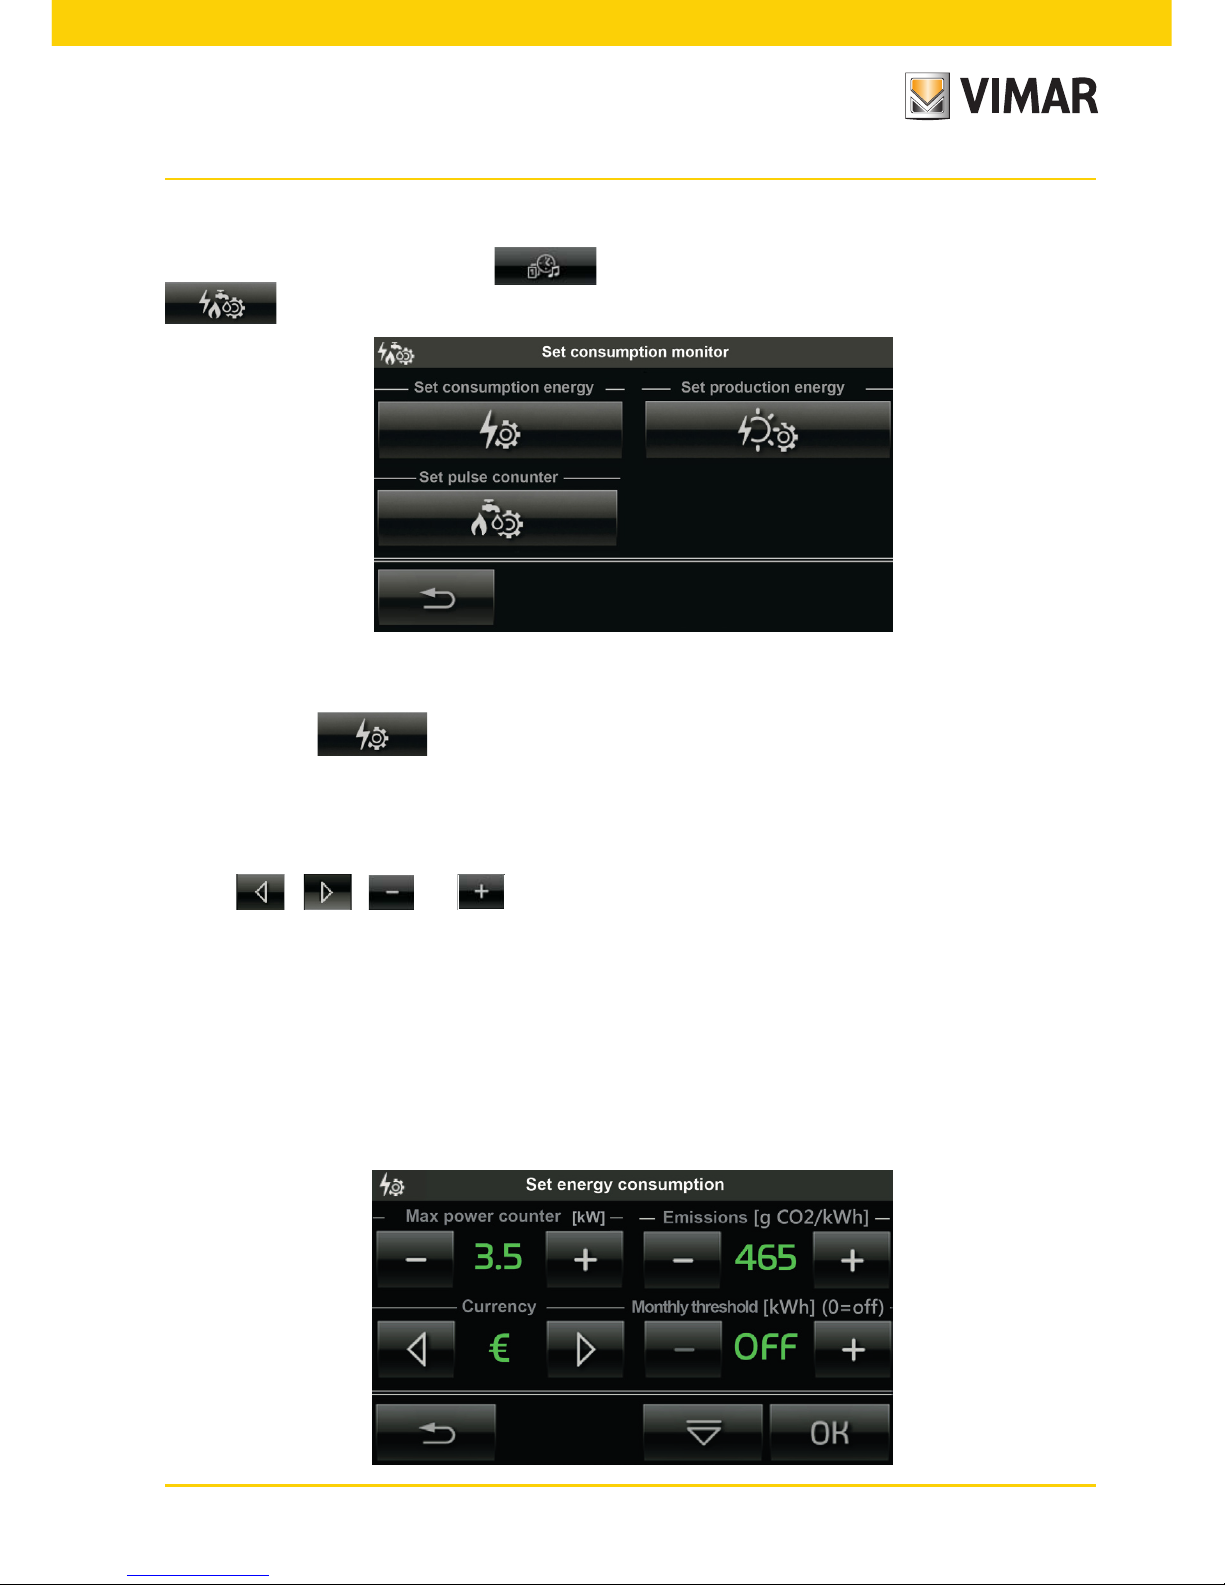
8.7 SETTINGS
From the main menu, by tapping the icon you access the Settings menu; then by tapping the
icon you access the menu for selecting the parameters related to the type of consumption/pro-
duction.
8.7.1 POWER CONSUMPTION SETTINGS
• By tapping the icon you access the screens for selecting the parameters related to the type of
contract used (the number and type of settings varies depending on the type of contract).
■ CONTRACT WITH ONE TIME SLOT
In the case of a contract with only one time slot, there are two setting screens, the parameters that can be entered
with the , , and icons are:
- Maximum meter power (kW)
- Emissions of carbon dioxide (g CO2/kWh)
- The currency for the calculation of the cost
- Monthly threshold (set in OFF)
- Amount/kWh Time Slot 1 (to be set)
- Amount/kWh Time Slot 2 (to be set in OFF)
- Amount/kWh Time Slot 3 (to be set in OFF)
Page 40

38
■ CONTRACT WITH TWO TIME SLOTS
In the case of a contract with two time slots, the screens are similar to those of the contract with 1 time slot. They
are then followed by those for assigning the time slots to the days of the week. The parameters that can be entered
with the , , and icons are:
- Maximum meter power (kW)
- Emissions of carbon dioxide (g CO2/kWh)
- The currency for the calculation of the cost
- Monthly threshold (set in OFF)
- Amount/kWh Time Slot 1 (to be set)
- Amount/kWh Time Slot 2 (to be set)
- Amount/kWh Time Slot 3 (to be set in OFF)
Energy monitoring
• Tap the icon and, using and , set the currency and cost of the electric energy in Time Slot 1.
Page 41

39
Energy monitoring
The screen for setting the monthly threshold must be disabled.
• Tap the icon and, using and , set the currency and cost of the electric energy in Time Slot
1 and in Time Slot 2.
• Tap the icon to set the weekdays/holidays according to the time slots.
Tapping the and icons scrolls through the days while with and you set the selected day
as a weekday or holiday.
At this stage, using the icon, set the time slots associated with the weekdays (treated all together) and with
the holidays (treated independently of the others).
Page 42
40
Energy monitoring
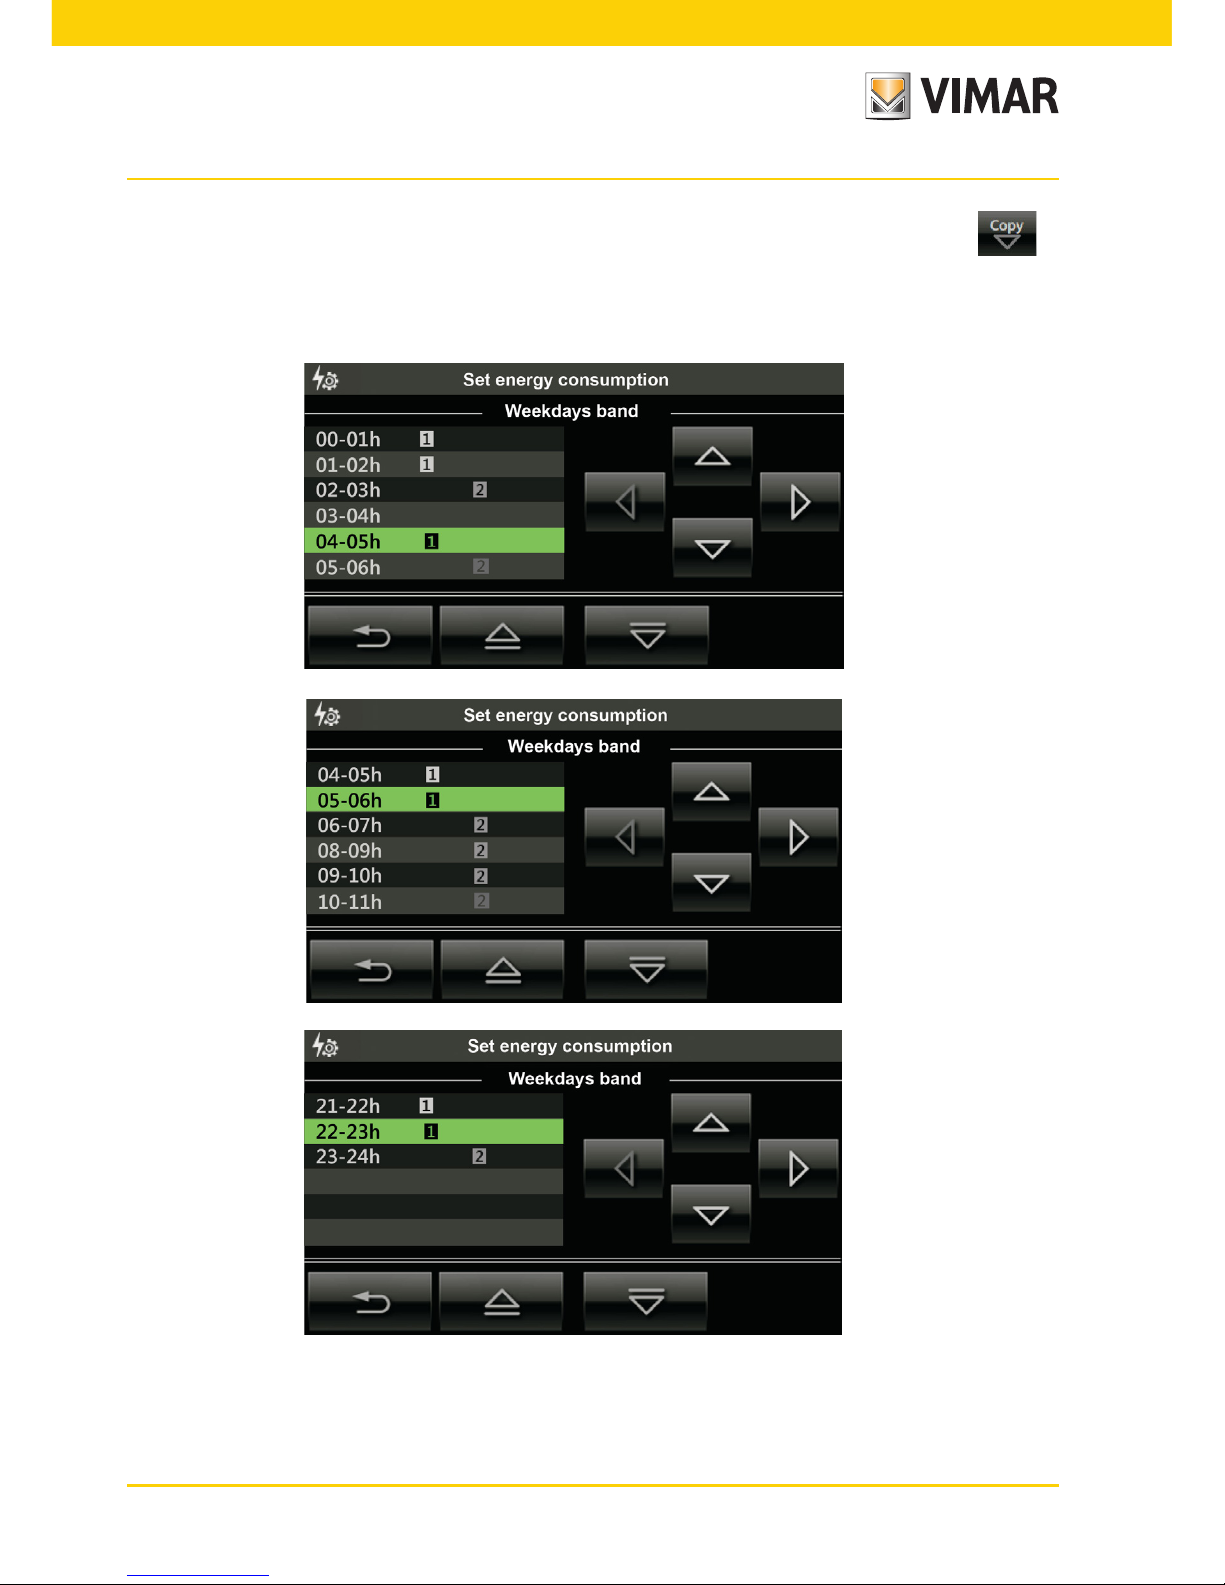
When setting the weekdays and holidays associated with the relevant time slots it is also possible with to
copy/paste the time slots as illustrated in the following example.
Example.
The following screens illustrate the association of the time slots related to the days of Friday and Sunday.
Page 43
41
Tapping the and icons scrolls through the hours while with and you set the relevant
time slot.
With the icon you can copy the current time slot (highlighted with green) to the following hour.
■ CONTRACT WITH THREE TIME SLOTS
The operations to carry out are absolutely identical to those illustrated for the contract with two time slots; in this
case, obviously, it will be necessary to set also the cost of the electric energy for Time Slot 3.
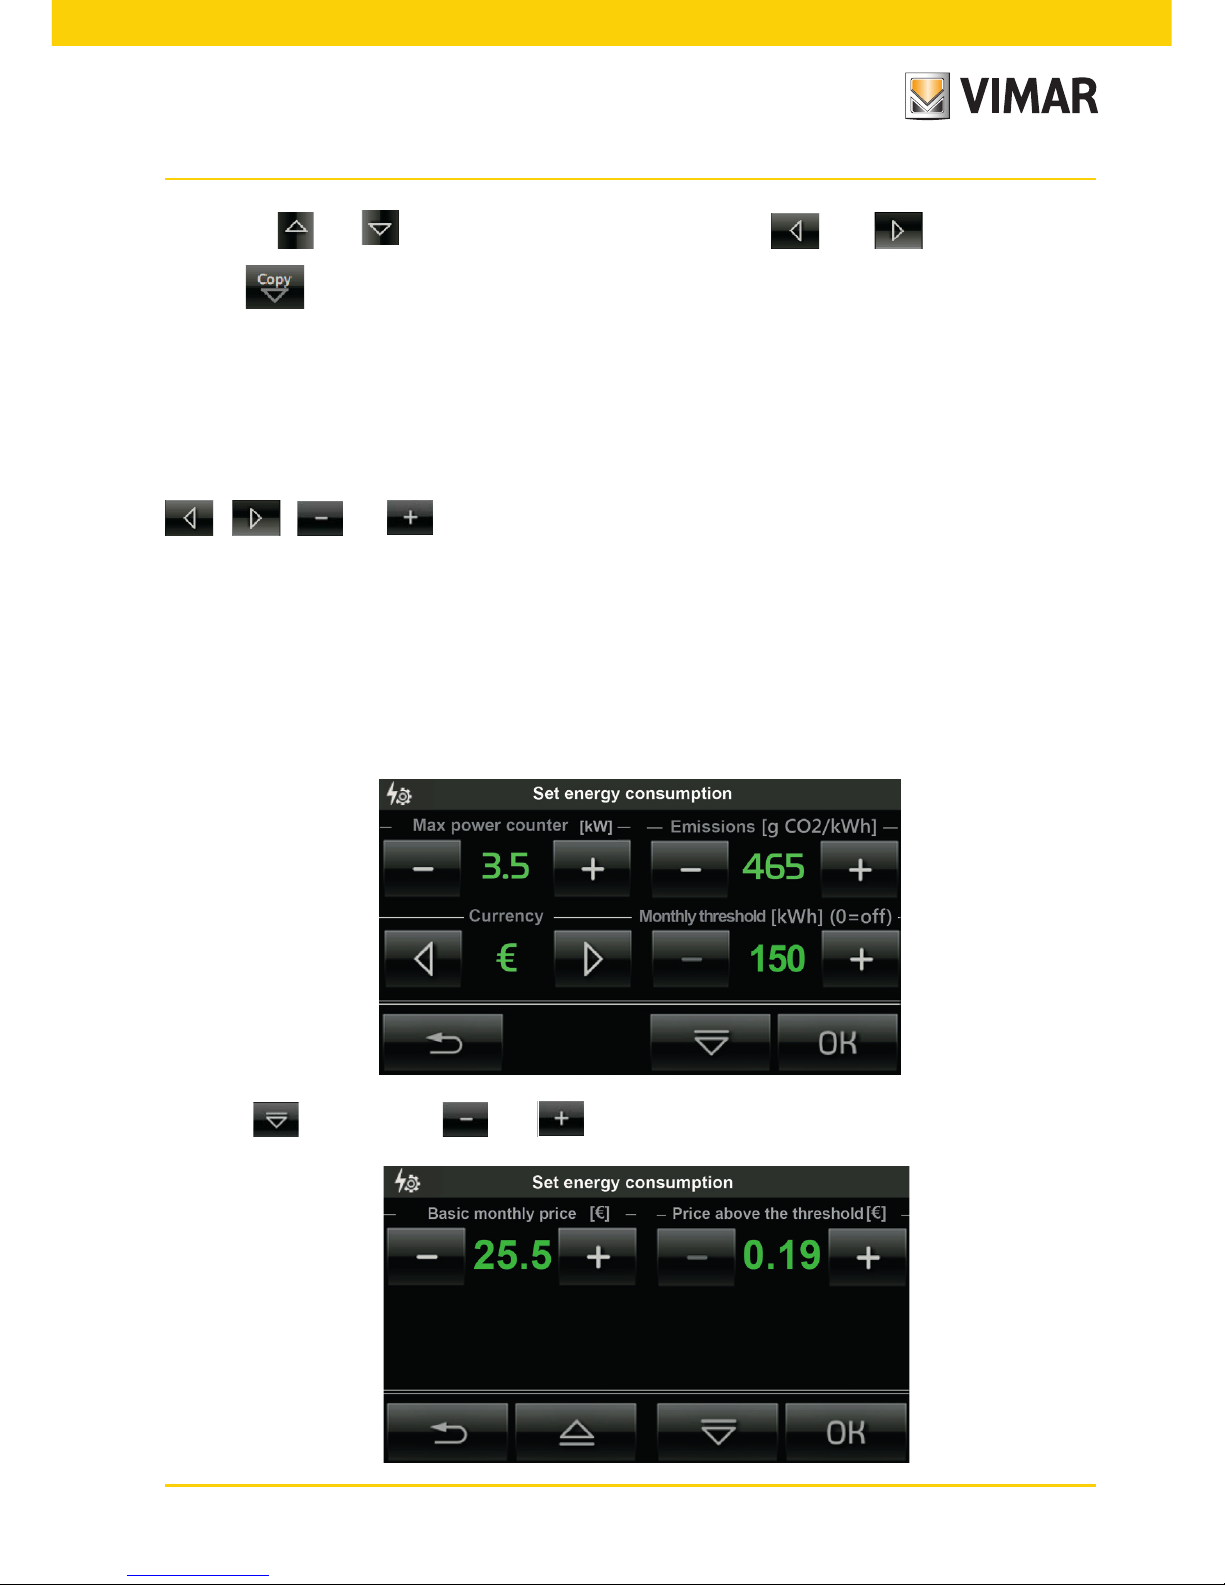
■ THRESHOLD CONTRACT
In the case of a threshold contract, there are two setting screens, the parameters that can be entered with the
, , and icons are:
- Maximum meter power (kW)
- Emissions of carbon dioxide (g CO2/kWh)
- The currency for the calculation of the cost
- Monthly threshold (set kWh)
- Basic monthly price (€)
- Price above the threshold (€/kWh)
• Tap the icon and, using and , set the basic price and the price above the threshold.
Energy monitoring
Page 44

42
8.7.2 POWER GENERATION SETTINGS
• By tapping the icon you access the screens for selecting the parameters related to the power
generated by the system and delivered over the network.
The parameters that can be entered with the and icons are:
- Maximum production in kW
- Tariff for the energy introduced in €/kWh
- Tariff for the auto-consumed energy in €/kWh
Energy monitoring
Page 45

43
8.7.3 PULSE COUNTER SETTINGS
• By tapping the icon you access the screens for selecting the parameters related to the consumption
of utilities such as, for example, Water, Gas, etc.
The parameters you can enter with the and icons, which depend on the service controlled each time,
may be the following:
- Tariff for the consumption of water or gas in €/m
3
- Emissions of gCO2 linked to the consumption of water or gas in €/m
3
- Tariff for the consumption of gas in €/KJ
- Tariff for the consumption of gas in gCO
2
/KJ
• By tapping you can set the meter to a desired value
Energy monitoring
Page 46

44
• Tapping confirms the setting and takes you back to the home screen of the power consumption menu.
Energy monitoring
Page 47

45
Speaker System
9. SPEAKER SYSTEM.
If the By-me system contains the speaker system and an audio zone is included on a page of the touchscreen,
the screen displayed will be similar to the one shown below.
This screen is used to control switching the audio zone on/off and adjusting the volume.
• Touching the icons in , , and is performed respectively: the decrease of the volume,
turn off and the increase in the volume of the audio signal in the area associated
• Touching changes the channel for listening to the speaker system (changing the audio source).
• The icon displays the type of source being listened to (in this case the transmitter 01900).
• Touching displays the control screen of the active source.
The FM radio control screen for the speaker system is the following:
Page 48
46
Speaker System
The screen displays all the relevant information on the tuned frequency, at the level of signal reception, and any
RDS text broadcast by the station you are listening to.
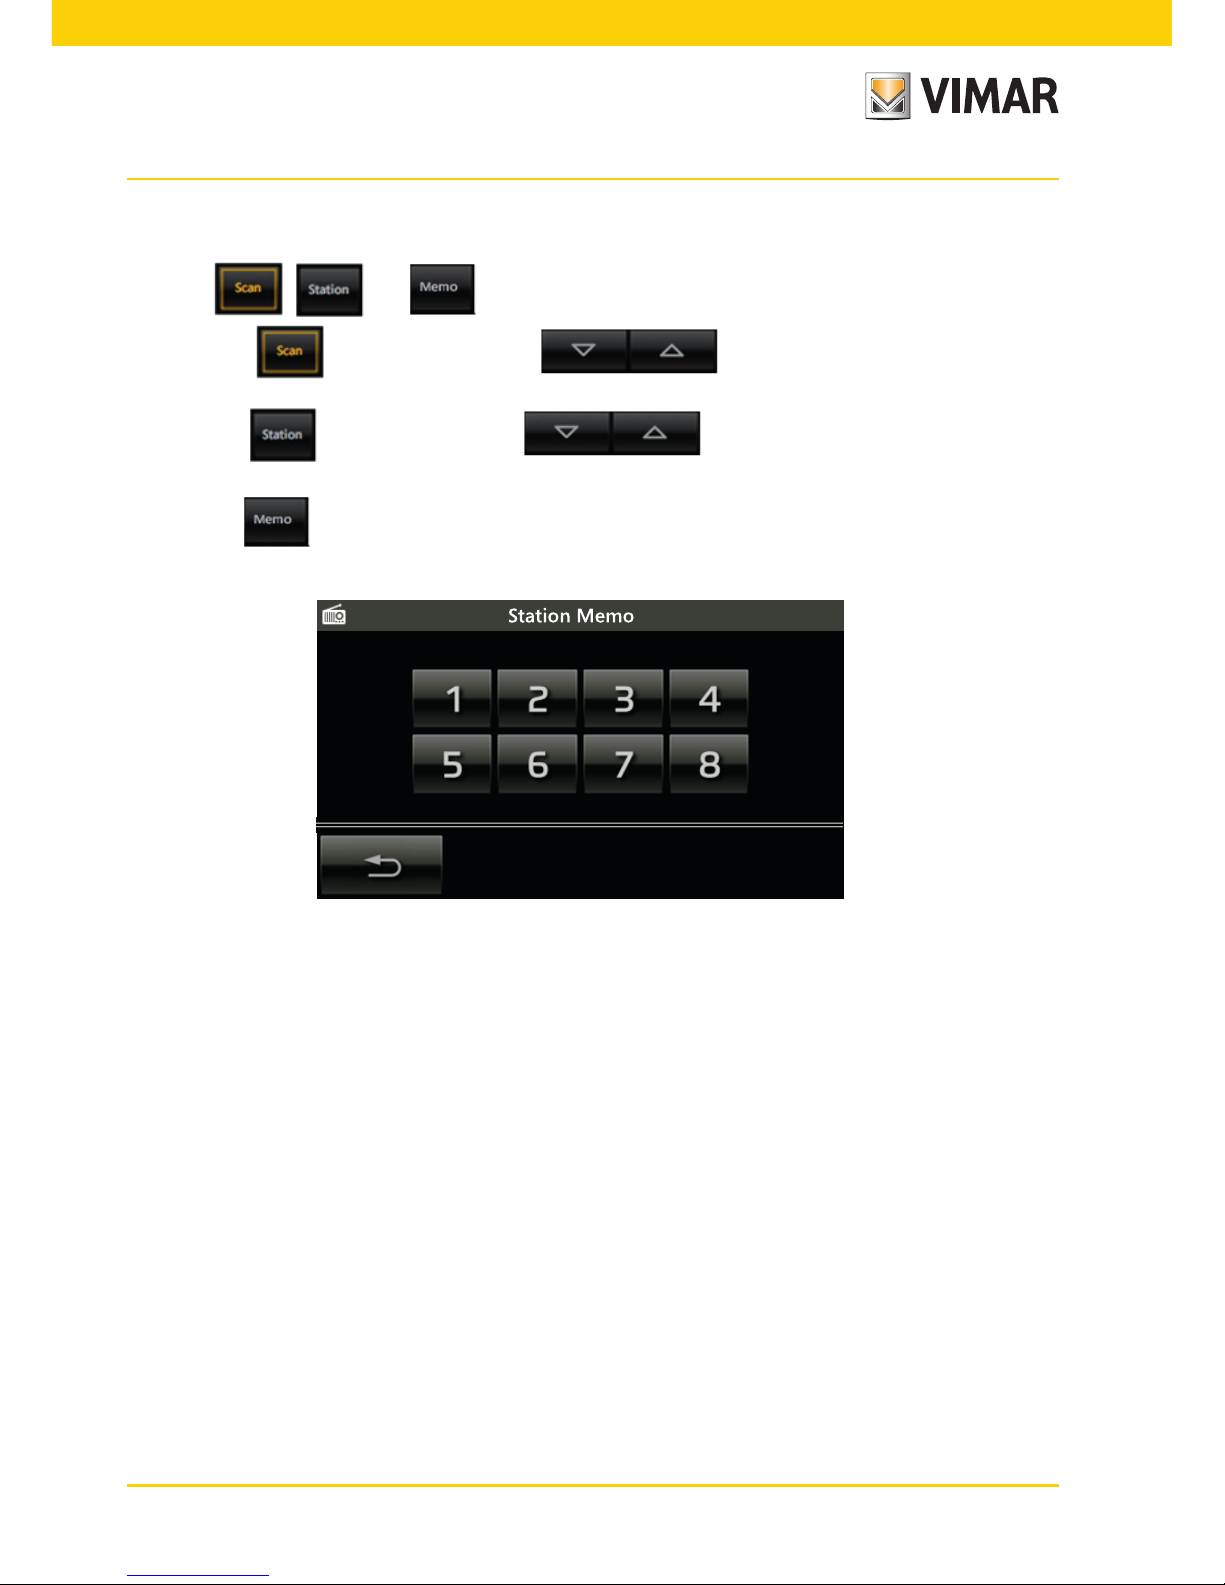
The icons , and enable setting the method of selecting the station you want to listen to:
• By touching it is possible to use the icons to find the previous station or the
next one that the radio is able to receive.
• By touching it is possible to use the icons to select the previous or next station
saved on the radio (it is in fact possible to save up to 8 different stations).
• By touching it is possible to display the screen for saving the active broadcaster to one of the 8 stations
that can be saved:
On this screen, by touching one of the 8 icons, it is possible to save the active broadcaster to the corresponding
memory then automatically return to the previous screen.
9.1 CONTROL FOR iPOD, iPHONE AND AUXILIARY SOURCES
If the sound system includes a Docking Station, by using the touch screen you can control:
- Apple devices (iPod/iPhone);
- auxiliary stereo sources.
Auxiliary stereo sources are connected to the Docking Station with the jack on its base; this input takes priority
over any Apple device connected to the Docking Station and therefore the iPod/iPhone can only be controlled
when there is no auxiliary source.
When the Apple device is connected, the zone page displays the button to access Docking Station control (central
button, next to the icon representing the device) thus providing access to the Playback menu.
Page 49

47
Speaker System
■ PLAYBACK MENU
The Playback menu is displayed in two separate forms depending on whether the device is enabled for remote
control.
Playback menu with remote control enabled
In this case, on touching the Details button on the zone page, the touch screen will display the Playback menu
that provides information on the operating status of the Apple device and its control.
The three above screens illustrate respectively:
- the playback status of a track and the selection made for the shuffle or repeat option (in this case shuffle);
- the pause status in which the properties of the track being played are always visible;
- the stop playback status of the track.
The playback options, indicated with shuffle and repeat, can each have three different statuses:
- Shuffle.
Albums status: plays the albums in the playlist in random order
Tracks status: plays the tracks in the playlist in random order
Off status: Shuffle option not activated
- Repeat.
All Tracks status: repeats the playlist cyclically
One Track status: plays the track now playing continuously
Off status: Repeat option not activated
Page 50

48
Speaker System
With the playback menu it is therefore possible to:
• select track play/pause (icons and );
• shift playback to the previous track or the next one (icons and );
• cyclically vary the Shuffle and Repeat (icons and );
• access the device navigation menu (incon );
• exit the Playback menu and view the zone menu (icon ).
Playback menu with remote control disabled
When the remote control is not enabled, the display will no longer show:
- the words identifying the Artist, Album and Track;
- the Shuffle and Repeat options;
- access to the device navigation menu.
With the remote control disabled, it is possible to control only the play/pause status of the track now playing and
to control the skip forward and back.
■ NAVIGATION MENU
The navigation menu, accessible by touching the icon of the Playback menu, enables browsing the database of the device connected to the Docking Station and editing the playlist currently being used.
The navigation menu screens are generally composed of:
• up to four words corresponding to Playlist, Artist, Album and Track;
• four navigation buttons (icons , , and );
• one confirmation button (icon );
• one button to exit the navigation menu (icon ).
Browsing through the database enables selecting the category of Playlist or Artist on the following screens:
The current category is highlighted in green and, depending on the one selected, the only icons selected will be
the ones for making the correlated moves.
For example: on "Playlist" touch the icon to enter "Artist", then touching displays the list of artists
saved on the iPod/iPhone.
Page 51

49
Speaker System
Access from Playlist category
Browsing through this category enables selecting one of the playlists saved on the iPod/iPhone and selecting the
track in the playlist from where to start playing.
When accessing the Playlist category (left screen), the corresponding field will show the wording of the first item
in this category saved on the Apple device.
The dotted line indicates the possibility of continuing to browse within the Tracks category; the confirmation button
is enabled (icon ) to start playing the selected playlist, automatically returning to the playback menu.
On the screen with the Playlist category browsable, the button has different graphics and enables returning
to the category selection screen (Playlist, Artist).
The button is always active and enables returning to the playback menu without changing the current
track playback status.
Access from Artist category
Browsing through this category enables selecting one of the artists saved on the iPod/iPhone and then selecting
the album and the track (of the selected artist) from where to start playing.
When accessing the Artist category (left screen), the corresponding field will show the wording of the first item in
this category saved on the Apple device.
The dotted line indicates the possibility of continuing to browse within the Album and Tracks categories; the
confirmation button is enabled (icon ) to start playing the active selection, automatically returning to the
playback menu.
It is then possible to play all the content relating to a specific artist, to a specific album and lastly it is possible to
choose the track with which to begin playing the album.
On the screen with the Artist category browsable, the button has different graphics and enables returning
to the category selection screen (Playlist, Artist).
The button is always active and enables returning to the playback menu without changing the current
track playback status.
Page 52

50
Speaker System
9.2 CONTROL FOR RCA TRANSMITTER WITH IR INTERFACE
When a transmitter is configured together with an IR interface on an audio zone, it is possible to control the sound
source connected to the transmitter by means of its RCA input.
The screen relating to this zone will show the icon for accessing the Details page associated with the transmitter.
The screen for controlling the RCA transmitter associated with the IR interface is the following:
On this screen it is possible to:
• select the play/pause/stop status of the source playback (icons , and );
• shift playback to the track or to the previous or next one saved (icons and );
• cyclically vary the internal source of the controlled device (icon ).
For these controls to be usable it is necessary for the installer, in the programming phase, to have appropriately
configured them within the IR interface.
From the above screen it is always possible to return to the zone menu by touching or .
Page 53
51
Video door entry
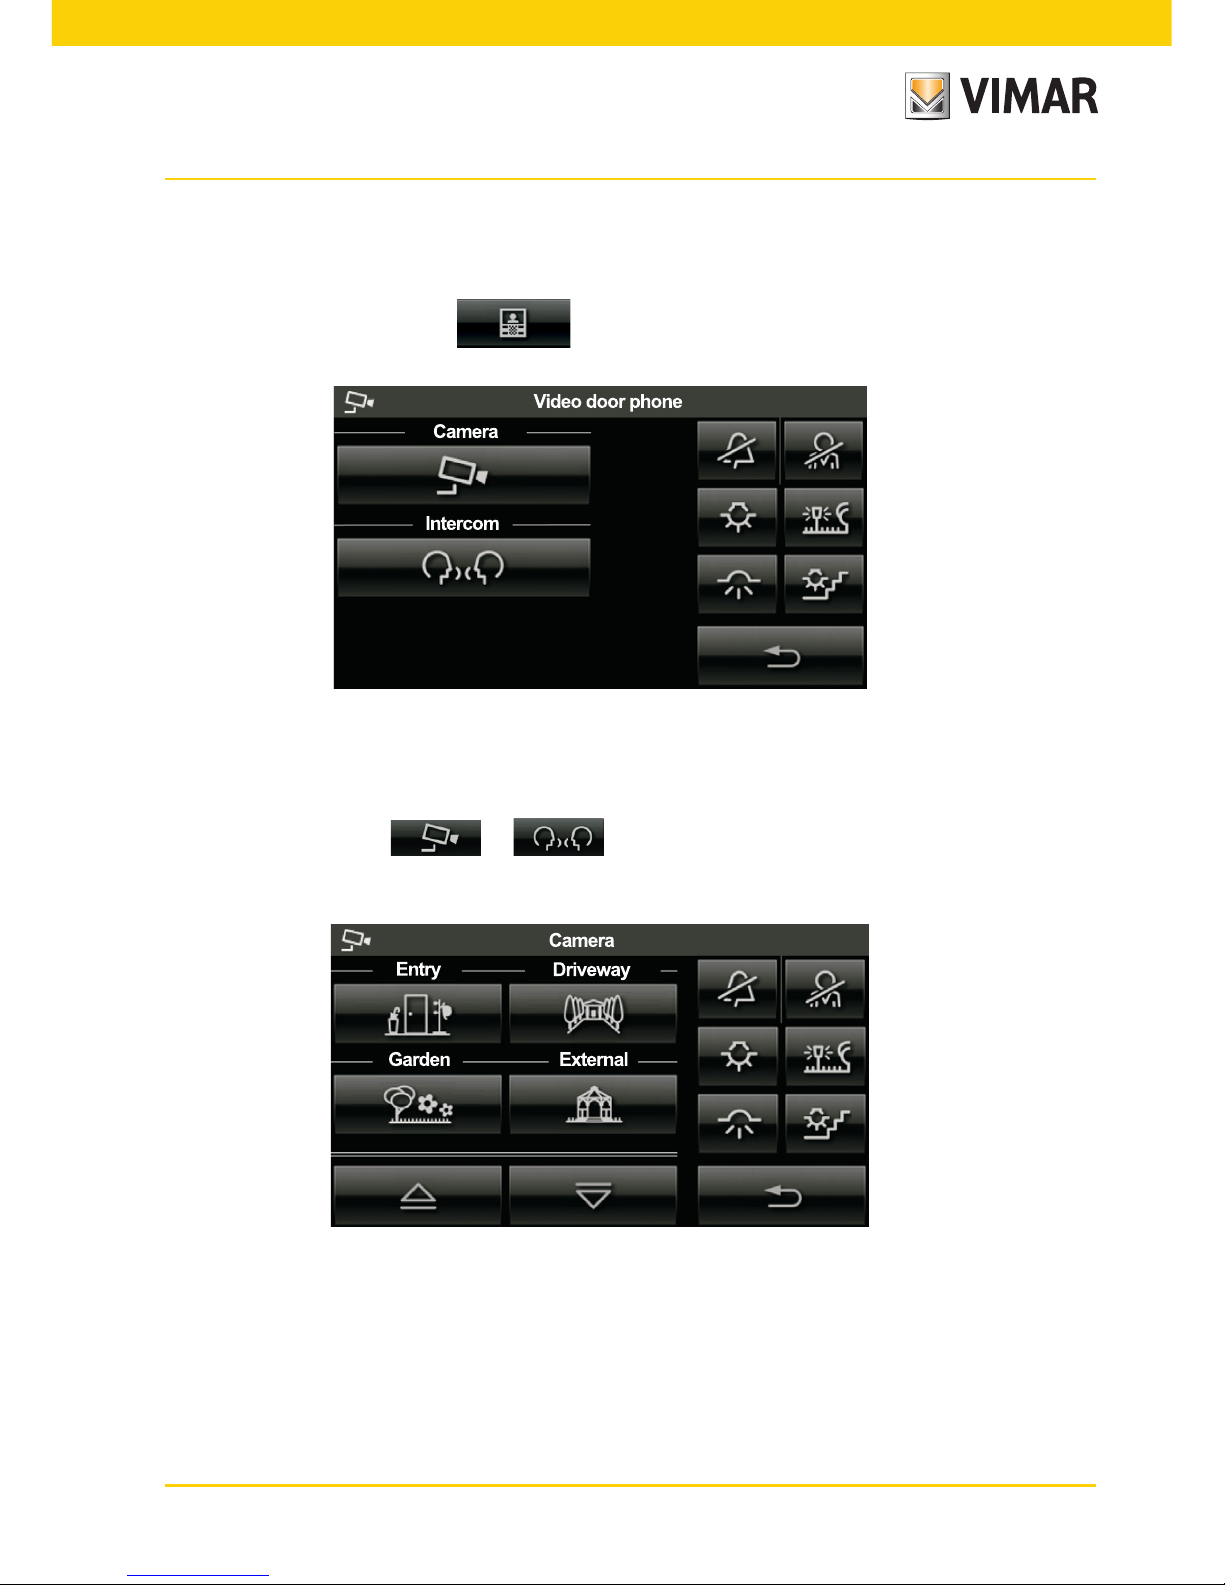
10. VIDEO DOOR ENTRY
In the case where the touch screen is also used as internal video (integrated in the By-me system or in the implant
only Two Wires) can be managed also all the functions of the video entry.
From the main menu by touching icon , you enter the screen management functions configured
video entry.
Through the screen Video door phone you can view and communicate with the person who made the call and
make an electric opening, the lights stairs, effuttuare intercom calls to other telephones and videophones, activate
autoaccensioni for environmental control, etc..
For example, touching the or icons screens will display dedicated to the management of
the selected function.
Page 54

52
Video door entry
In the event that a call arrives from the external, the video display touch the image of someone who made it to the right
and the icons will be placed management such as lights, volume, etc..
Page 55
53
Alarm clock
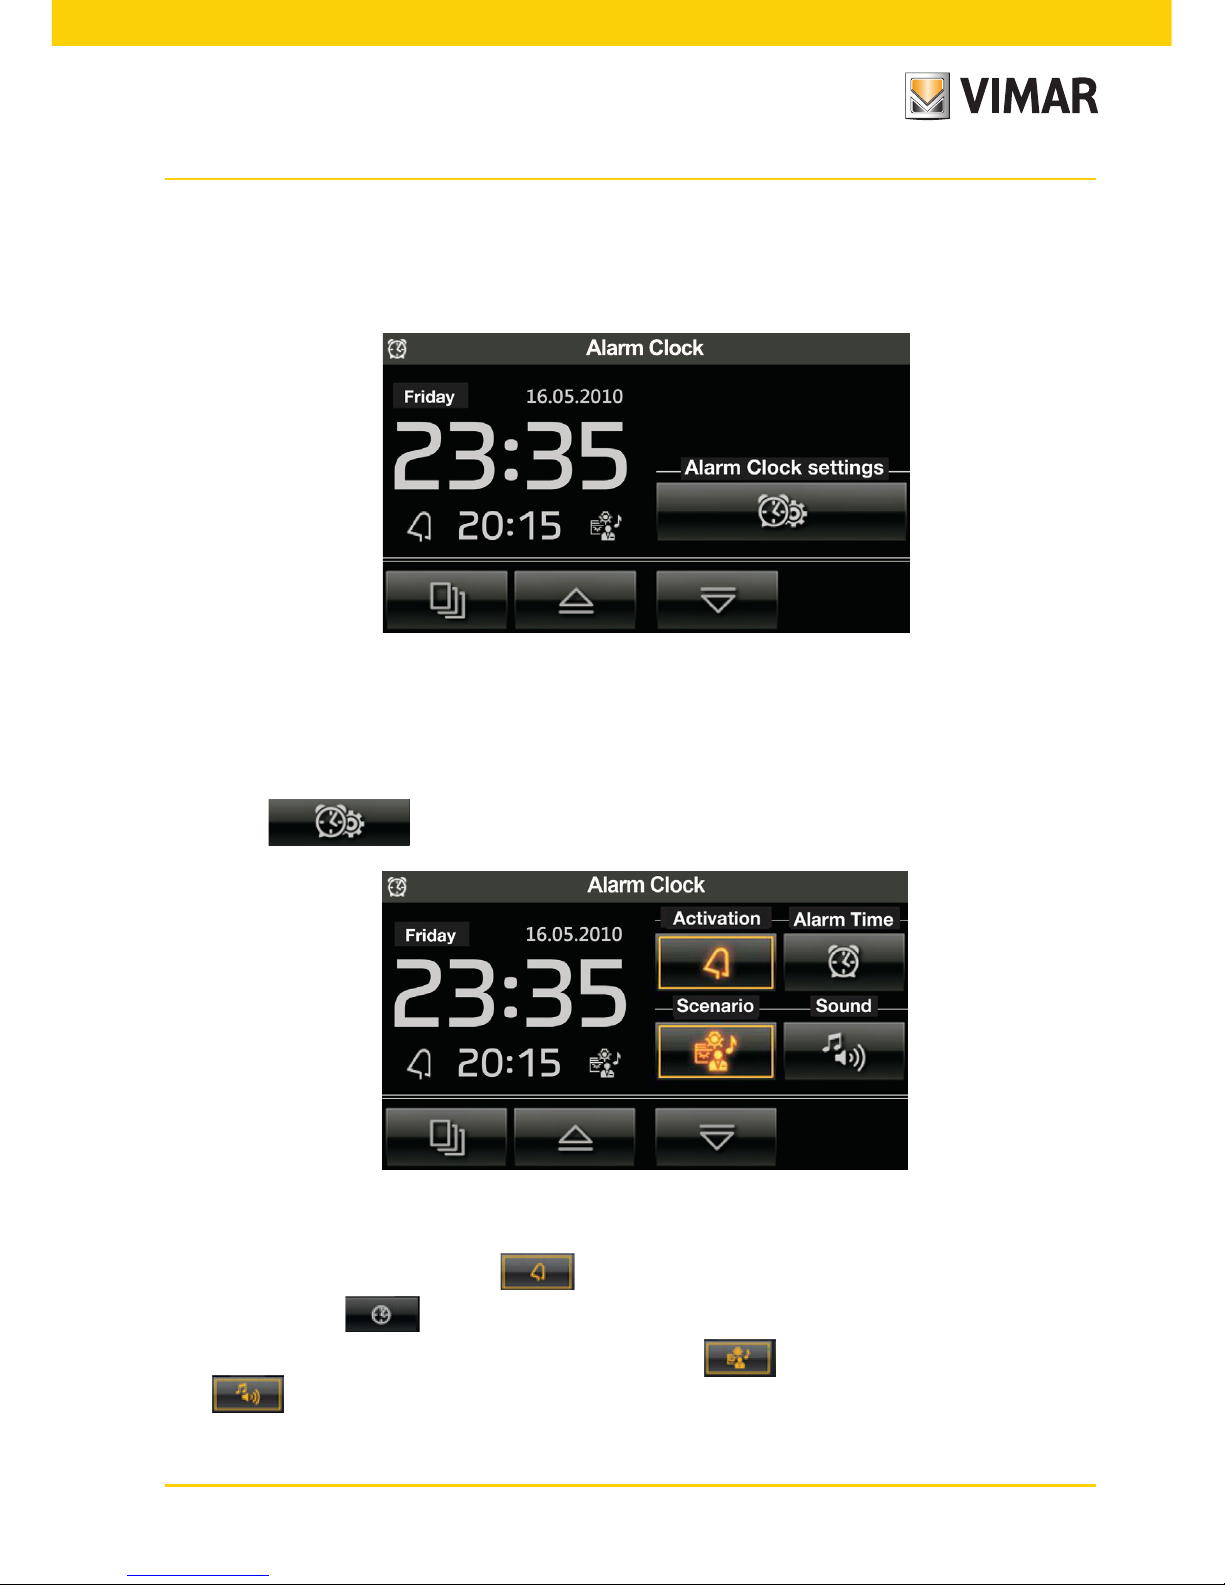
11. ALARM CLOCK
When combined with the speaker system, the touchscreen can also function as an alarm clock.
The alarm clock control/setting screen is the following:
The touchscreen displays the following alarm clock settings:
- alarm clock on/off;
- activation time;
- scenario actuation/audio zone actuation.
• Touching displays the alarm clock setting screen:
On this screen it is possible to:
• enable/disable the alarm clock via the icon;
• set the time via the icon;
• select whether the alarm clock will activate a scenario (icon ) or simply switch on the audio zone
(icon ).
Page 56

54
Alarm clock operation.
When the time of day coincides with the time set on the alarm clock, the touchscreen switches on to display the
relevant screen and the system activates the selected audio zone or scenario.
The Snooze function is available whenever the alarm clock is activated and it can only be used until the following
intervention of the screensaver; in this case, touching the touchscreen at any point temporarily deactivates the
audio zone associated with the alarm clock (even if the scenario output is selected) and will be reactivated after
8 minutes (this applies to each activation of the "Snooze" function).
If the "Snooze" function is not used, the alarm clock will not reactivate the audio zone (which can be switched
off with the normal By-me controls, with the touchscreen or with a scenario) but remains set to activate on the
following day at the same time.
12. SCREEN SAVER.
Tap and hold your finger on the icon representing the title of some pages such as, for example, the main menu, the
pages of the rooms, the main pages of the burglar alarm and those of load control, to view the screen that allows
you to choose whether to set the selected page as your favourite page or as a screensaver.
Once you see the screen that you want to set as your "favourite" and you tap and hold your finger on the title of
this page (e.g., "room selection"), you have the following options for selecting the screensaver:
• approximately 2 minutes after tapping the icon on "As Favourite Page" switches off the touch screen and displays the date and time.
• approximately a minute after tapping the icon on "As Screensaver" loads the favourite page, regardless of the
location in the menus, and lowers the backlighting of the touch screen to the value set as "Standby Backlighting".
Note: When present, the screensaver will display the local temperature measured by the probe and the value of
energy produced, total consumed and self-consumed.
13. CLEANING OF TOUCH SCREEN.
Clean periodically the touch screen with soft and dry cloth. Do not use solvents and detergents.
14. COMPLIANCE WITH REGULATIONS.
EMC directive. Standard EN 50428.
Screen Saver - Cleaning - Compliance with regulations
Page 57

55
Page 58
21554 user EN 03 1409
VIMAR - Marostica - Italy
Viale Vicenza, 14 - 36063 Marostica VI - Italy
Tel. +39 0424 488 600 - Fax (Italia) +39 0424 488 188
Fax (Export) +39 0424 488 709
www.vimar.com
 Loading...