

Page 1
Page 2

VIBRODIAG
www.viditech.eu sales@viditech.cz
Content
1 BASIC CHARACTERISTICS ....................................................................................................................... 2
1.1 VIBRATION MEASURING .............................................................................................................................. 2
1.2 GENERAL FUNCTIONS ................................................................................................................................. 2
2 SPECIFICATIONS ...................................................................................................................................... 3
2.1 EVALUATING UNIT ...................................................................................................................................... 3
2.2 ACCURACY ................................................................................................................................................. 3
2.3 SAMPLING PARAMETERS ............................................................................................................................. 3
2.4 ICP ACCELERATION SENSOR ........................................................................................................................... 4
3 INSTRUMENT DESCRIPTION .................................................................................................................. 5
3.1 INSTRUMENT ASSEMBLY ............................................................................................................................. 6
3.1.1 First run ............................................................................................................................................. 6
3.1.2 ICP sensors ......................................................................................................................................... 6
3.1.1 Revolution sensor .............................................................................................................................. 6
4 MENU STRUCTURE .................................................................................................................................. 7
5 MAIN MENU .............................................................................................................................................. 8
5.1 INSTRUMENT SETUP ................................................................................................................................... 9
5.2 SENSOR SETUP ......................................................................................................................................... 10
5.3 LIMITS SETUP .......................................................................................................................................... 10
6 DATABASE, ROUTES.............................................................................................................................. 11
6.1 MEASURING PLACES ................................................................................................................................. 11
6.2 ROUTES .................................................................................................................................................. 11
7 MEASURING ........................................................................................................................................... 13
7.1 ROUTE MEASURING .................................................................................................................................. 13
7.2 ANALYSIS ................................................................................................................................................ 14
7.2.1 Velocity analysis ............................................................................................................................... 14
7.2.2 Acceleration analysis ........................................................................................................................ 14
7.2.3 Optional analysis ............................................................................................................................. 14
7.2.4 Saved data ........................................................................................................................................ 14
7.3 RUN UP, COAST DOWN .............................................................................................................................. 16
7.4 BALANCING ............................................................................................................................................. 17
7.4.1 Balancing in single plane ................................................................................................................ 17
7.4.2 Dual plane balancing ........................................................................................................................ 18
7.4.3 Grinding wheels balancing ............................................................................................................... 20
7.4.4 Displaying saved balancing .............................................................................................................. 21
7.5 BEARING CONDITION ....................................................................................................................................... 23
8 RECORDER ............................................................................................................................................. 23
8.1 THRESHOLD RECORDER ............................................................................................................................ 23
8.2 PERIODICAL RECORDER ............................................................................................................................ 24
8.3 BROWSING SAVED DATA ........................................................................................................................... 24
Page 3

VIBRODIAG
www.viditech.eu sales@viditech.cz
BASIC CHARACTERISTICS
1.1 Vibration measuring
Two-channel portable instrument with input for ICP sensor
Range of measured accelerations up to ±60g
Range of measured velocities up to 200 m.s
-1
(using provided sensors)
RMS vibration measurement according to ISO 2373
Balancing wizard
Threshold recorder
Periodical recorder
ICP acceleration sensors
Option to attach sensors using a magnet
1.2 General functions
Integrated Li-pol battery 1100 mAh
Integrated charger
Battery state indicator
Touch display 3,4"
Data saving on SD card
Page 4
VIBRODIAG
www.viditech.eu sales@viditech.cz
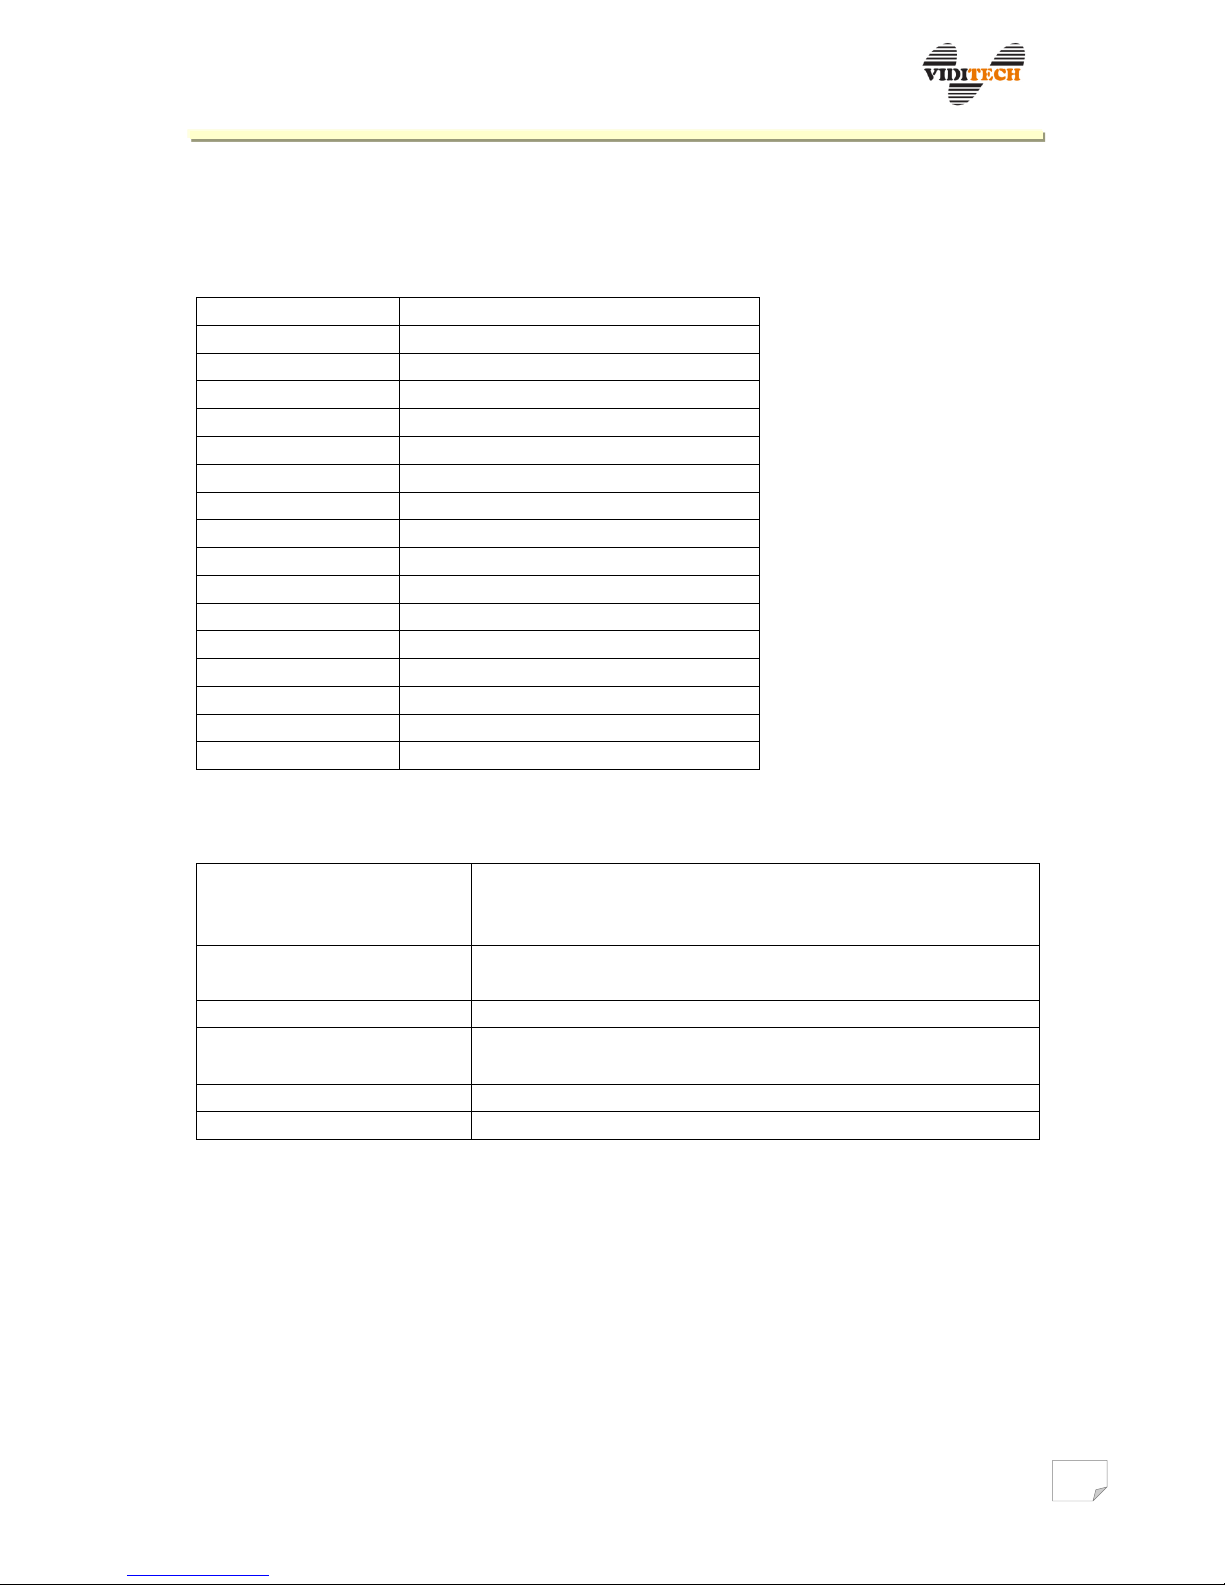
2 Specifications
2.1 Evaluating unit
Instrument type
portable, two-channel
Supply voltage
15V DC
Battery type
Li-pol, 1100 mAh, 3 hours of operation
Consumption
3,5W
norm
al operation
20 W
charging
Operation
0 to +65◦C
Protection
IP52 Chassis material
plastic
Dimensions
ca. 80 x 135 x 29 mm (
W x H x
D)
Weight
300 g
Sensor connectors
M8
circular connectors
Sensor type
ICP,
50 mV/g
– 4000
mV/g
Input
imp
edance
27 kΩ ± 10 %
(at 80 Hz)
Display type
colour touch TFT
Display diagonal
3,4" Memory card type
SD PC connection
USB 2.0
2.2 Accuracy
Total vibrations
at
80 Hz: ±2 % ±1
digit
within range 1… 5.000 Hz: ±10 % ±1 digit
at limit frequencies: +10 %… – 20 % ± 1 digit
Frequency characteristic
slope
40
dB/dec
high pass
slope
40
dB/dec
low pass
Revolutions
10… 12000 RPM, ±1 % ± 5
digit
FFT
analysis of total
vibrations
frequency indication within range 1… 5.000 Hz: ±1,8 H z (±0,5 Hz)
amplitude indication: +5 %… –20 %
FFT window type
Rectangle /
Hamming
FFT total noise
+5 % +5 digit
2.3 Sampling parameters
Velocity analysis sampling frequency: 2,5 kHz
Number of lines 4096 => freq. step: 2500 Hz/(2*4096) = 0,3 Hz
Acceleration analysis sampling frequency: 15 kHz
Number of lines 4096 => freq. step: 15000 Hz/(2*4096) = 1,8 Hz
Page 5
VIBRODIAG
www.viditech.eu sales@viditech.cz
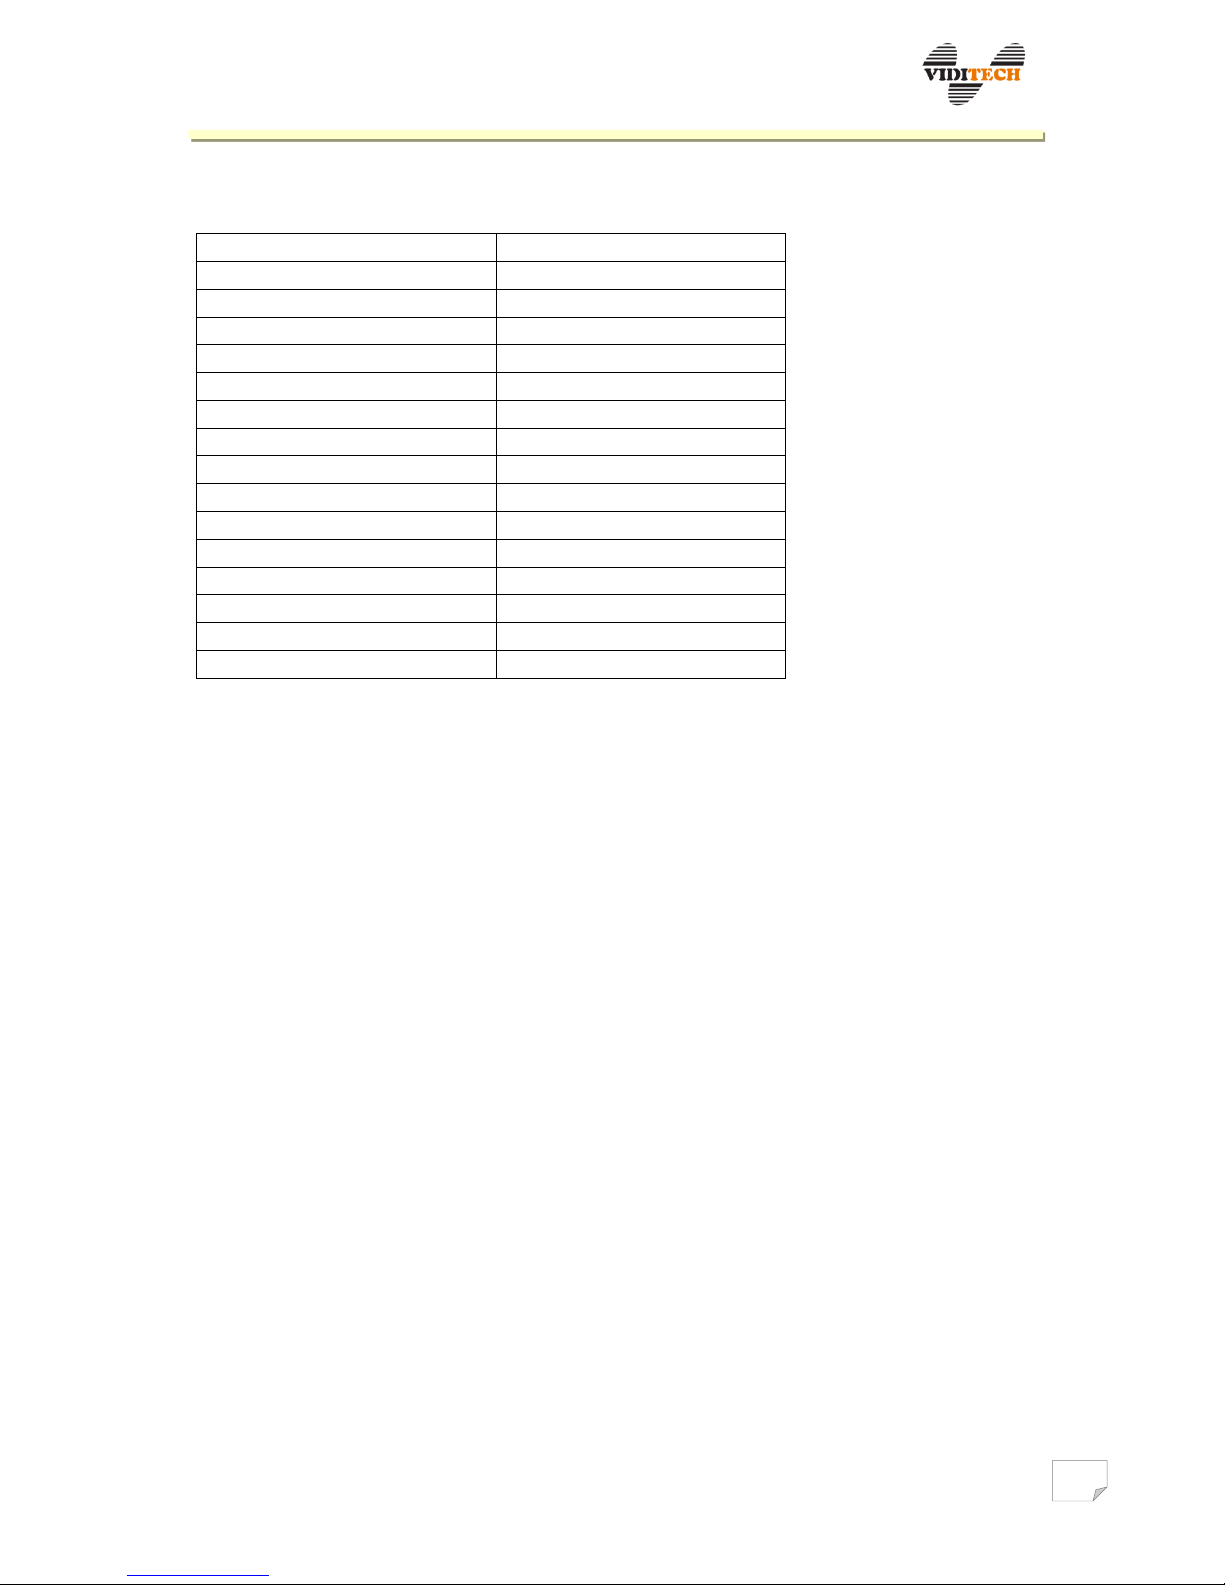
2.4 ICP acceleration sensor
Sensor type
piezo
electric
Frequency range of sensor
3dB
2 Hz – 10 kHz
Sensor sensitivity
100 mV/g ±20 %
Range of measured accelerations
±60 g
Protection
IP67 Chassis material
stainless steel
Dimensions
25x66 mm
(diameter, hei g h t)
Weight
125,6 g
Connector
M12
Attachment
outer thread
M8
Magnet weight
48 g
Magnet attachment
inner thread
M4
Adapter weight
32 g
Outer adapter thread
M5
Inner adapter thread
M8
Wrench
22
mm
Page 6
VIBRODIAG
www.viditech.eu sales@viditech.cz
3 Instrument description
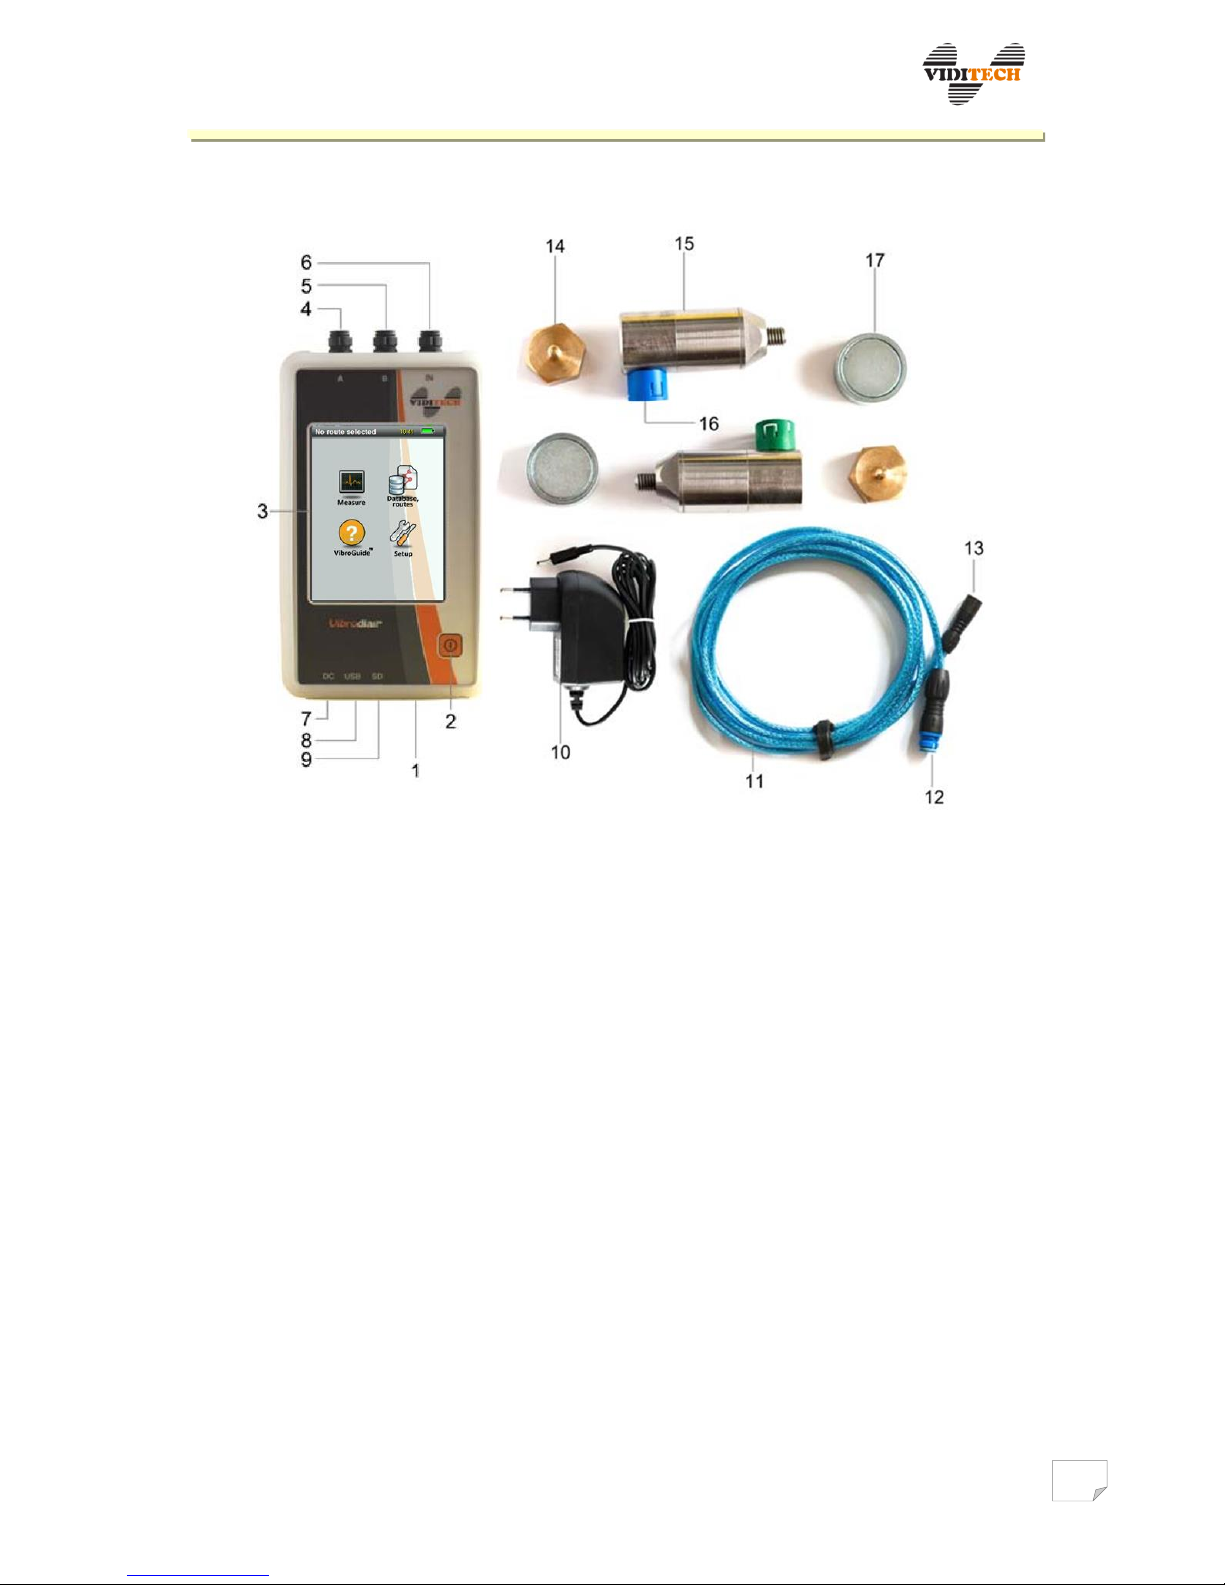
Fig. 1 Individual components with description
.
1 – Evaluating unit
2 – Power button
3 – Display after instrument start up
4 – Socket for ICP sensor - channel A
5 – Socket for ICP sensor - channel B
6 – Socket for revolution sensor
7 – Socket for supply connector
8 – Socket for USB connector
9 – SD card slot
10 – Power supply adapter 15 V, 1,6 A
11 – ICP sensor cable (2pcs.)
12 – M12 connector
13 – M8 connector
14 – Adapter for magnet attachment
15 – ICP acceleration sensor (2pcs.)
16 – ICP sensor connector
17 – Magnet (2pcs.)
Reset – 1,5 mm opening situated at the back side of the instrument
Page 7
VIBRODIAG
www.viditech.eu sales@viditech.cz
3.1 Instrument assembly
3.1.1 First run
Instrument is switched on by pressing button 2 (fig. 1) for at least 3 seconds, before the
message „Please wait…“ appears on the screen. Instrument is powered by the integrated
battery. If the battery is flat, or a longer measurement is to be performed, it is necessary
to connect the instrument to the power supply adapter (socket 7). There is possibility to
easily exchange the battery. After switching on the instrument, powered only by the
adapter, it is not possible to turn off the instrument. The instrument can be turned off
only after disconnecting the external power supply.
After switching on the instrument the filters are automatically stabilizing in the
background. This operation lasts approximately 22 s. If any measuring operation is
initiated during this period, the instrument waits, before the filters are stabilized.
During repeatedly initiated measurements, the instrument stabilizes the filters for only
2 s.
3.1.2 ICP sensors
ICP sensors are connected with the unit using shielded cables, with colour distinguished
connectors for each channel. The only and correct interconnection of the sensor cable
and the unit connector socket is marked by a white line, these lines must overlap, see
fig. 2. Cable with sensor designated for channel A measuring is connected using
connector 13 into socket 4 and analogically for channel B into socket 5. The revolution
sensor is connected likewise (socket 6).
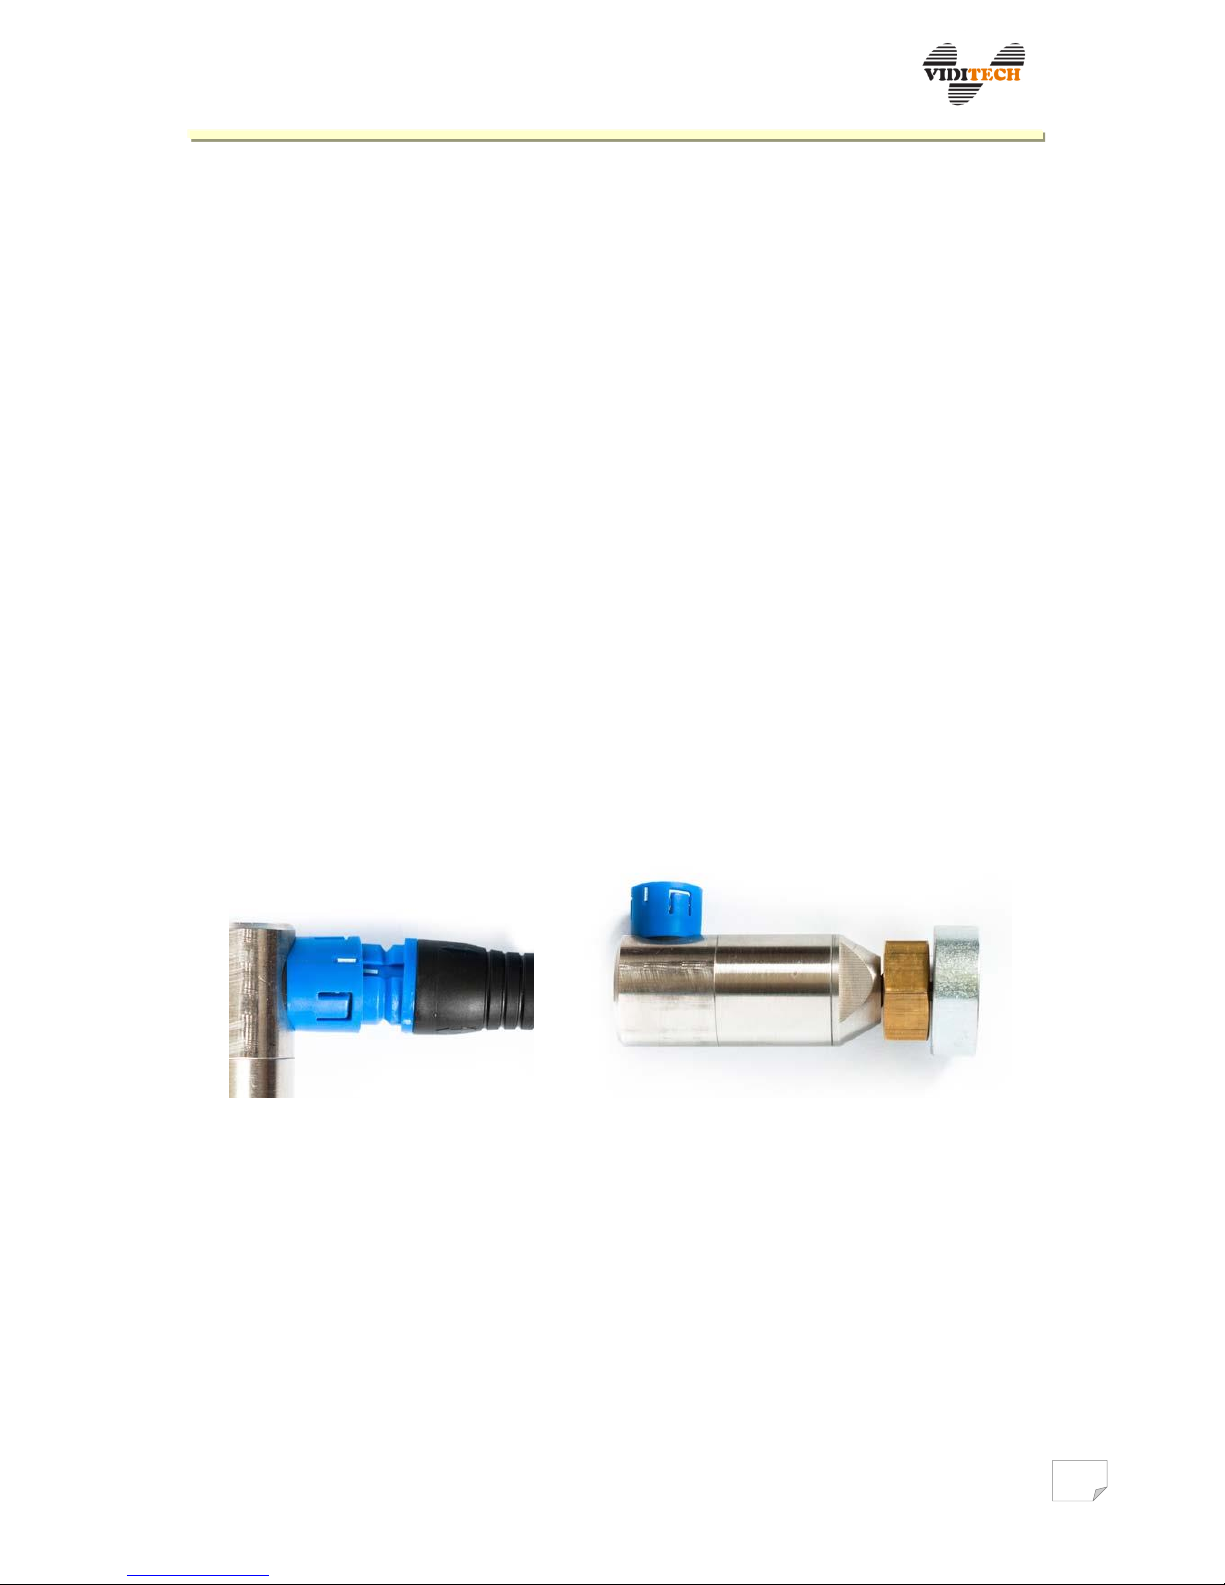
Fig. 2 Correct orientation of connectors. Fig. 3 ICP sensor with adapter and magnet.
Sensors are attached to the measured object using screw connection (M8), or it is possible
to use magnetic connection with the surface of the measured object (surface must be
ferromagnetic). A magnet and adapter are included for the magnetic connection, see fig. 3.
3.1.1 Revolution sensor
Instrument supports revolution sensors with NPN polarity (for instance type): LRK –
3031 – 302. It is suitable to place this sensor minimally 150 mm from the reflective sign
on the shaft. Maximal distance indicated by the manufacturer is up to 2 000 mm.
Page 8
VIBRODIAG
www.viditech.eu sales@viditech.cz
4 Menu structure
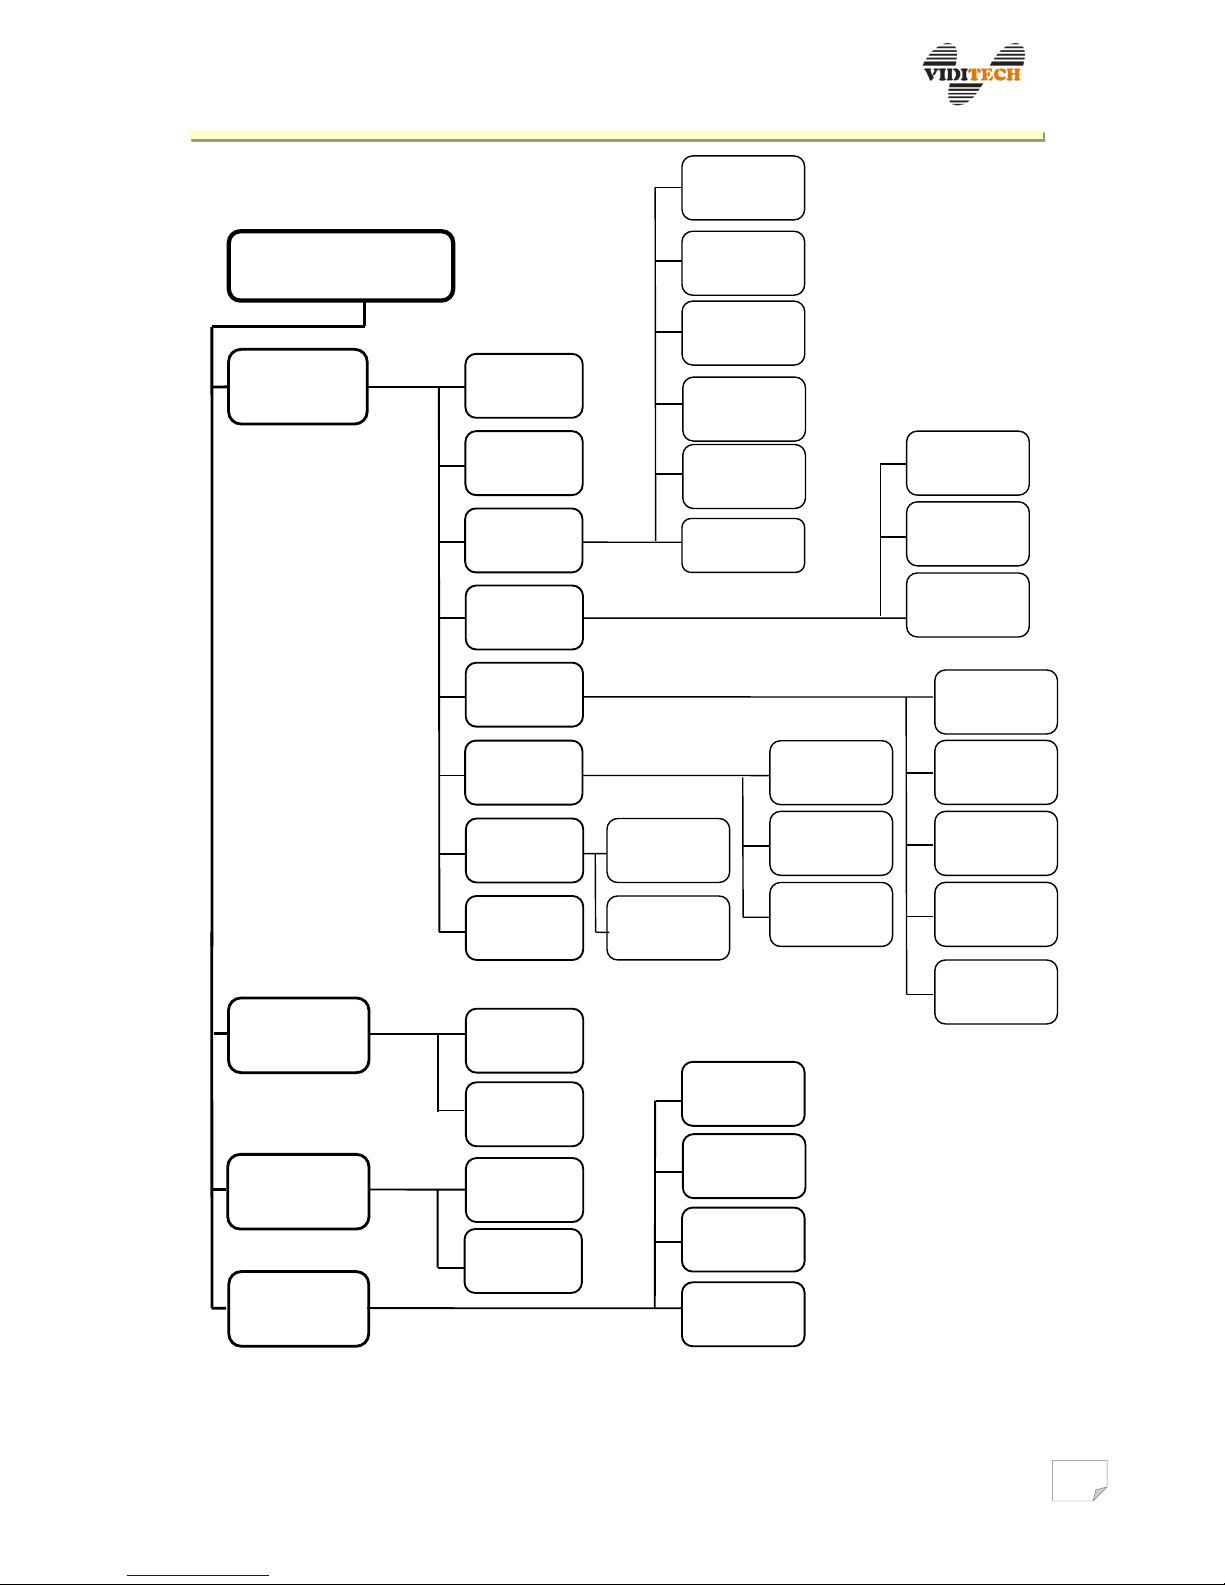
Fig. 4 Schematically represented i nstrument M e n u .
Main menu
Measure
Database,
routes
VibroGuid
Setup
Route
measuring
Waveform
Analysis
Balancing
Recorder
VibroGuide
Order
1 Hz – 1 kHz
velocity
500Hz – 5kHz
acceleration
Custom
Saved
Run up,
coast down
Run up
Coast down
Saved
data
Single plane
Dual plane
N planes
Saved
data
Threshold
Periodic
Saved
data
Measuring
places
Routes
Help
Vibro
calculator
General
Sensor
Limits
Information
ISO velocity
Grinding
wheels
Bearing
condition
Bearing
condition
Saved
data
Page 9
VIBRODIAG
www.viditech.eu sales@viditech.cz
5 Main menu
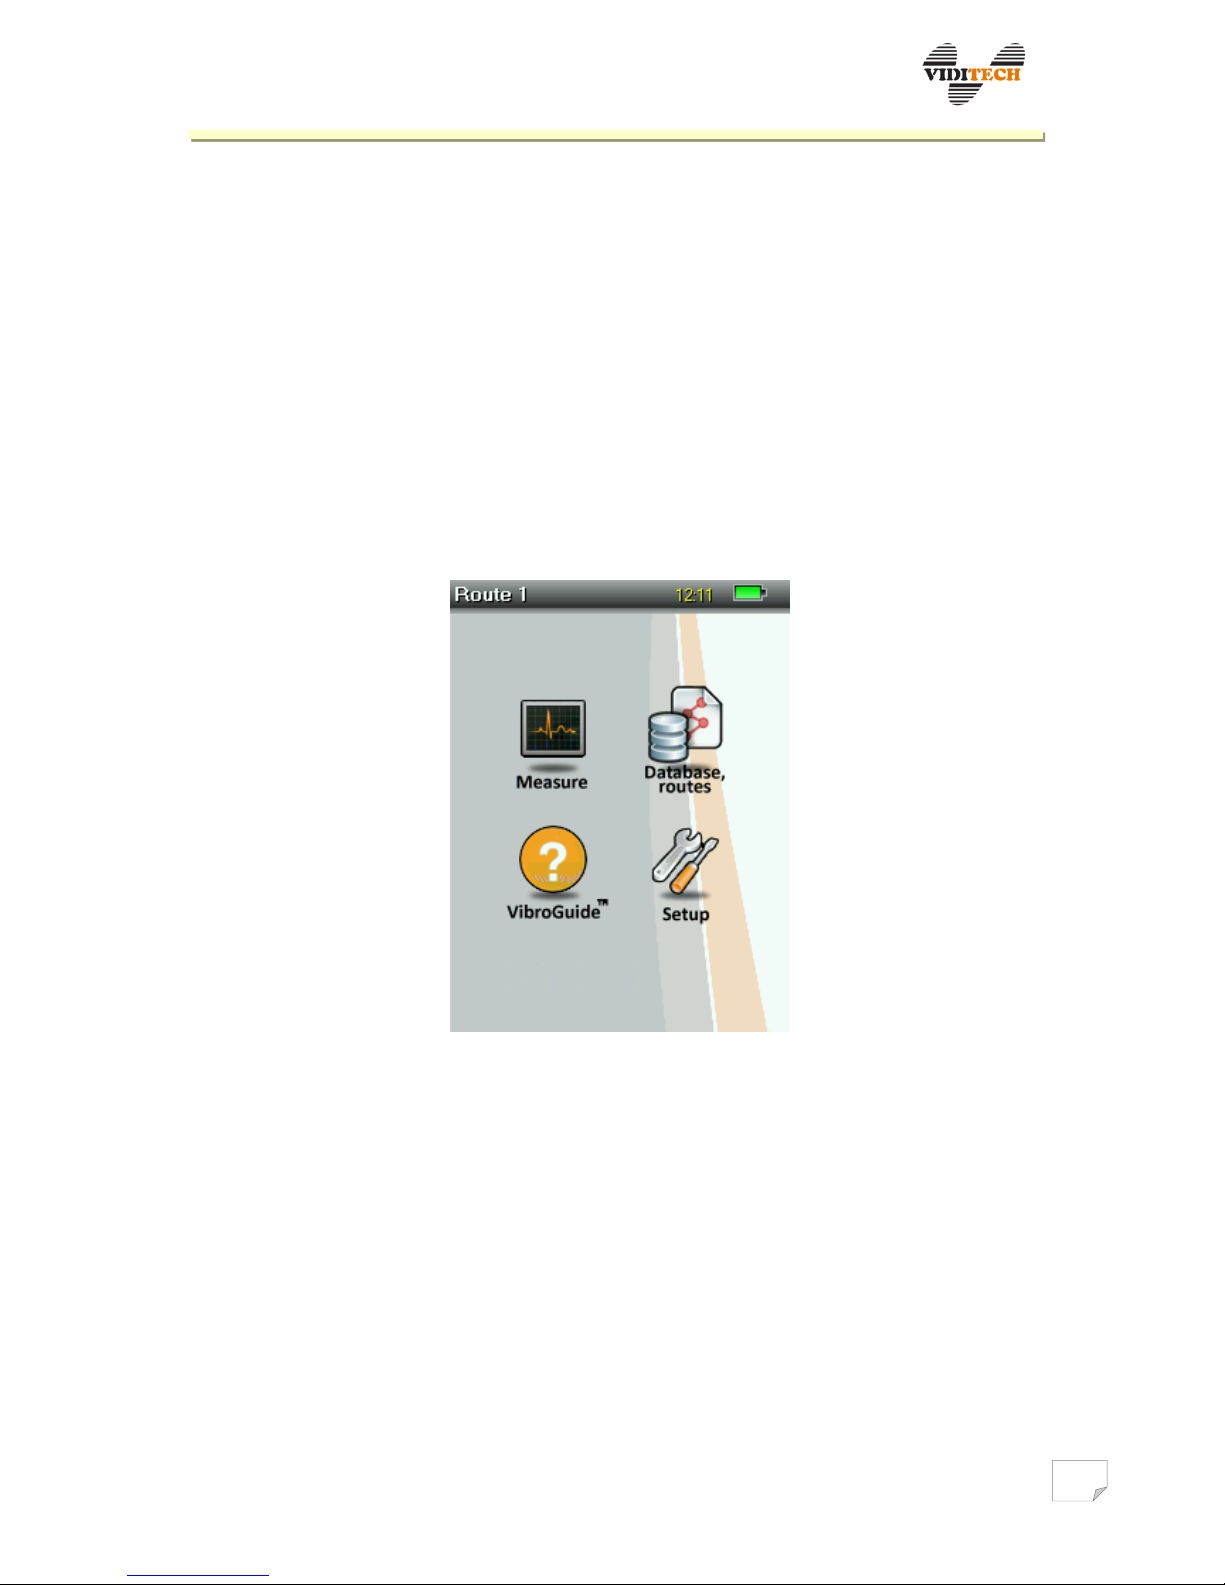
The instrument main menu contains four main items: Measure; Database, routes;
VibroGuide and Setup.
It is necessary to set/check the Setup item before further instrument use.
It is necessary to define the measured places in detail in the Database, routes item, before
measuring, and to create/choose a route for these places. Subsequently it is possible to
save individual measurements, which point to the selected places/routes.
Item Measuring contains all options of measuring allowed by the purchased licences (see
Setup – i).
VibroGuide in production version will contain the instrument Help and Vibro calculator.
Fig. 5 Instrument main menu.
In the headline of the instrument screen a description of the selected route and measuring
place is stated, changing in 10 s intervals, in case no route is selected, Route not selected is
noted.
Current time and battery status are displayed in the instrument screen headline.
Page 10
VIBRODIAG
www.viditech.eu sales@viditech.cz
5.1 Instrument setup
Main menu Setup Instrument
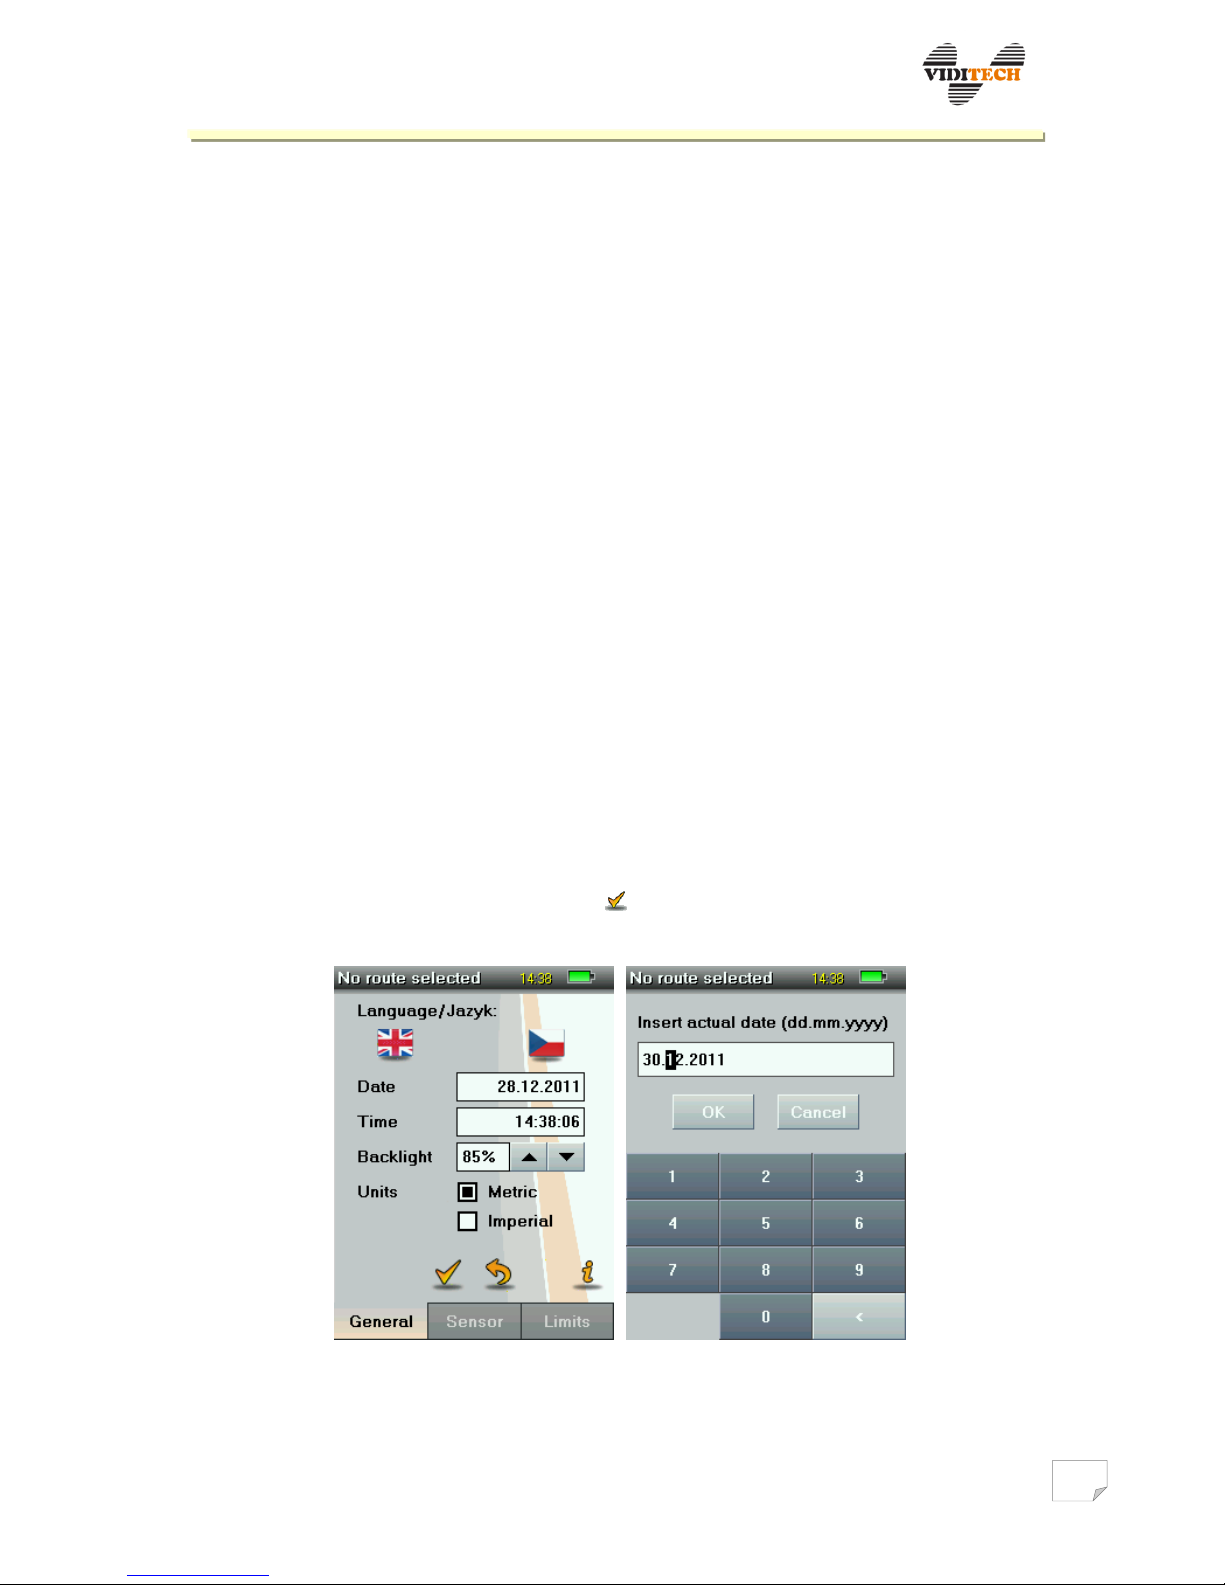
Language setup
It is possible to choose from languages: Czech and English. The instrument will be
supplied with German in the next update. Language selection is performed by tapping on
the flag symbol.
Date and time setup
Date and time change is performed by tapping on the field with date respectively time.
Using the numerical keyboard, current values are entered (date and time). In case of total
battery discharge (long term instrument non-use), there is a danger of set date and time
loss. After power resupply (in form of charged battery, or connected charger) random
date and time are set, and is therefore necessary to update them.
Brightness setup
Brightness can be changed in range 10–100 % using arrows up and down. After a longer
time of inactivity (operating on battery), brightness of the display is automatically
switched to standby mode.
Unit setup
Values of velocity and acceleration can be displayed in metric or imperial system.
Selection is made by tapping on the box in front of the desired unit system.
All changes need to be confirmed by the symbol. The instrument switches to main
menu after confirmation.
Fig. 6 Instrument setup.
Page 11
VIBRODIAG
www.viditech.eu sales@viditech.cz
5.2 Sensor setup
Main menu Instrument setup Sensor
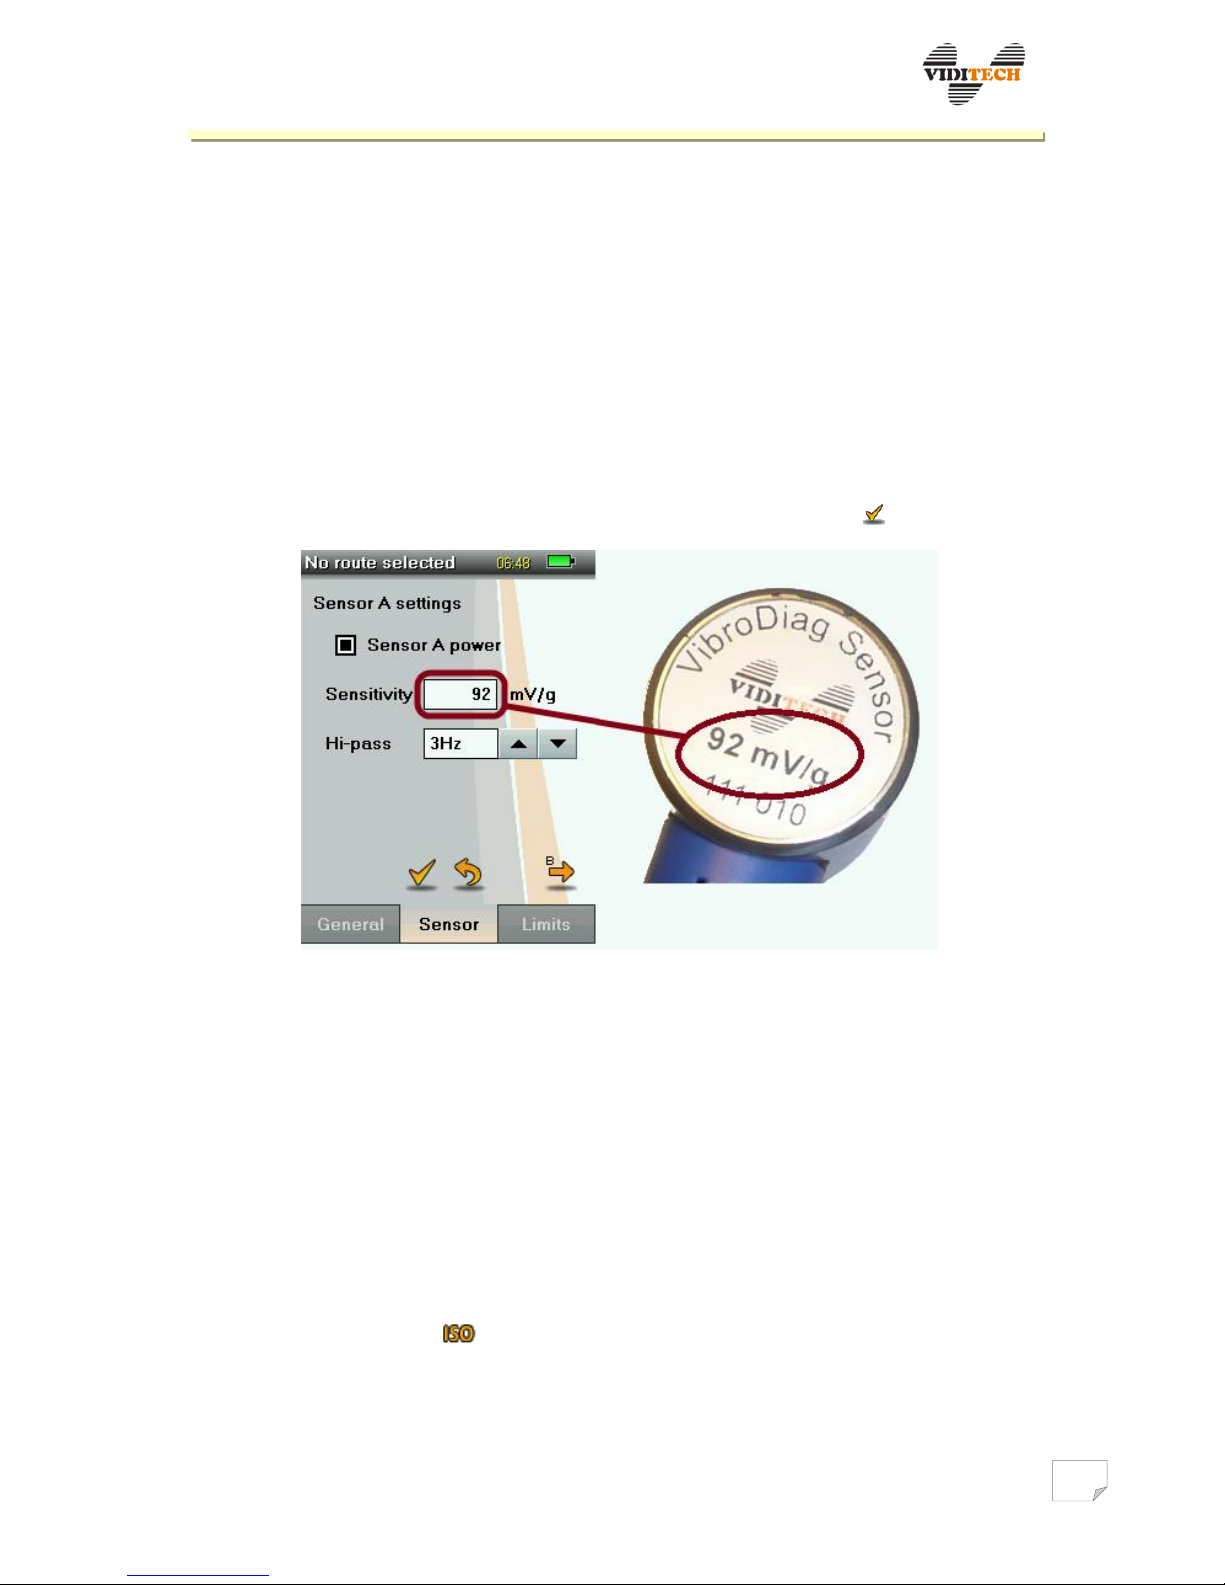
After preparing the instrument for measuring, it is suitable to enter (or check) the
corresponding sensitivities of ICP sensors for both channels (A and B). Sensitivity of each
sensor is marked on its upper part and is entered into relevant boxes, see fig. 5. For each
channel, it is also possible to select a high pass filter with values 1 Hz, 3 Hz, or 10 Hz.
The instrument setup also enables to switch on or off the sensor power supply. This is
done by checking/unchecking the box, separately for channel A and channel B. If the box
is empty, power supply is turned off and vice versa.
In case of required setup changes, these changes are confirmed by the symbol.
Fig. 7 ICP sensor sensitivity and high pass filter setup.
5.3 Limits setup
Main menu Setup Limits
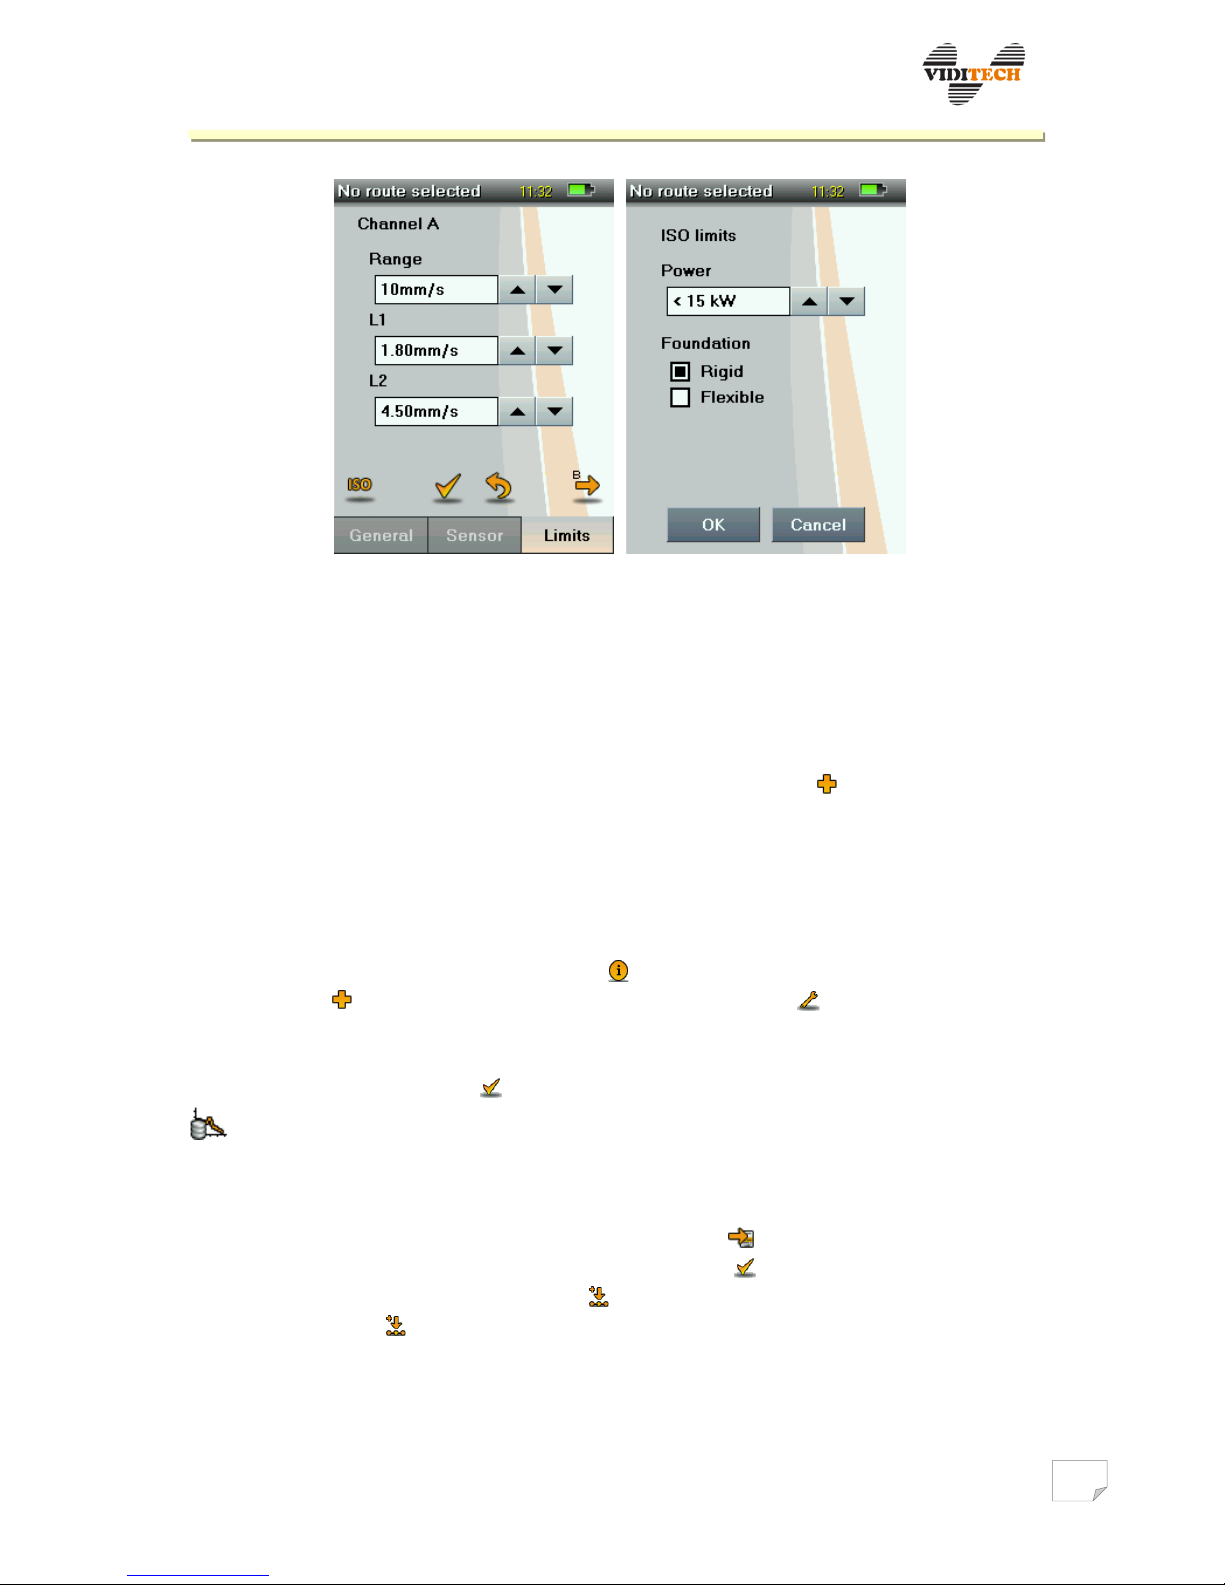
Limits are used to advise of detected increased values of vibration velocity on the
diagnosed object. These increased vibrations refer to the current machine state. Limits
are displayed in bar graphs (chapter 7.1) and are distinguished by colour. Range
determines the maximal value of the bar graph, item L1 determines the value, from which
the bar graph will colour yellow, item L2 determines the value, from which the bar graph
will colour red. Changes of limit values for signalization of increased levels of vibration
velocity can be done manually using arrows (up, down). Or it is possible to use table
values for the given machine type (sorted by machine power). Automatic tuning is
available using the icon , subsequently after selecting machine power and setup
confirmation, signal limits are automatically tuned. Automatic limits are set
simultaneously for channel A and channel B. Using manual limit setup, switching among
channels is performed in the Limits menu, via the right arrow.
Page 12
VIBRODIAG
www.viditech.eu sales@viditech.cz
Fig. 8 Limits setup for channel A and B.
6 Database, routes
Main menu Database, routes
6.1 Measuring places
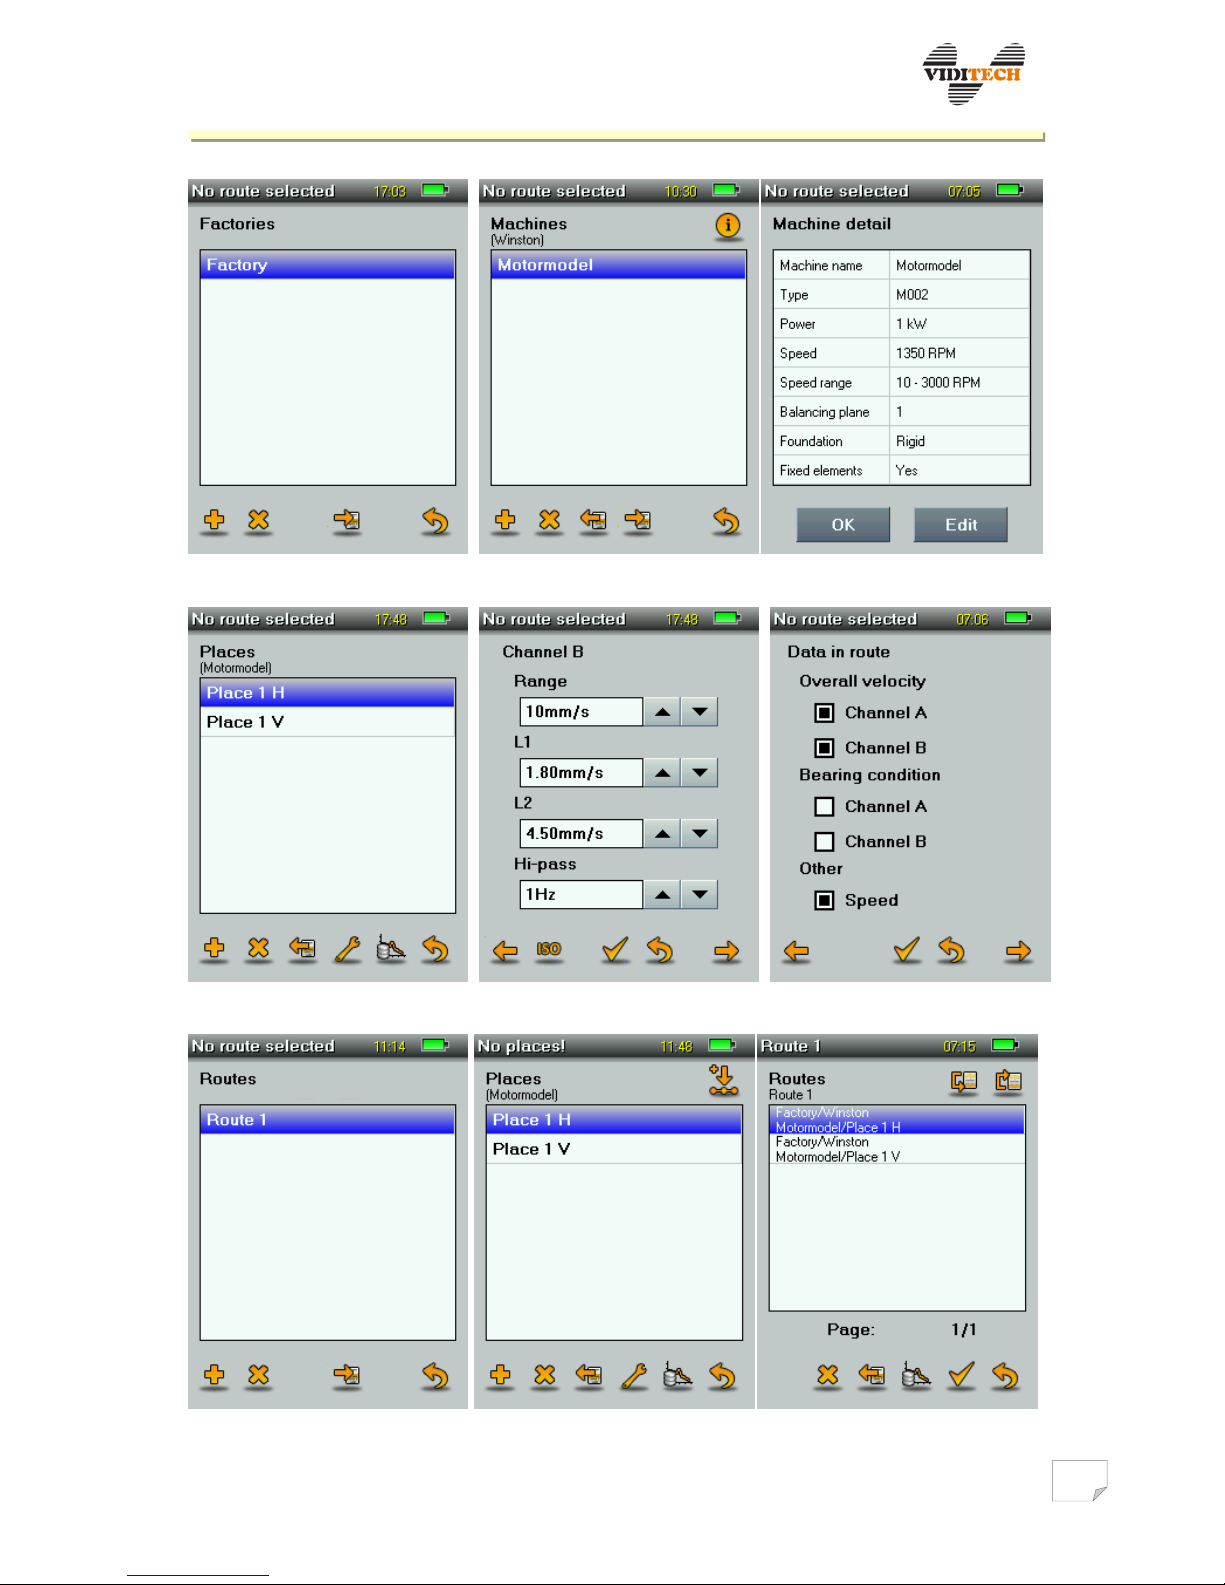
The instrument requires the following to be defined in order: Factory – Building –
Machine – Place. Entering a new item is done by tapping on , deleting an item by
selecting the cross icon. The structure of the defined place can be browsed using arrows.
Using the arrow, in the bottom right corner at any time, it is possible to return to the
Database, routes item.
While defining a machine, individual descriptions and parameters are selected: Machine
title, Type, Power, and additional. After successfully defining a machine a preview of the
selected parameters is displayed under the icon (fig. 9). Followed by place definition of
Machine using icon, and place parameters setup, using icon , with switching screens
left/right, see fig. 10. Here it is possible to set parameters of channel A and B and
predefined options of section Measuring – Route measuring. All performed changes need
to be finally approved by the symbol. Displaying measured data is possible using the
icon, with subsequent data type selection.
6.2 Routes
After setting measuring places, it is necessary to move to the item Routes, here it is
possible to create a new route and enter it using the symbol. To add places to the
route, the process is as follows: activate the route using , open Measuring places, in the
top right corner of the screen the symbol appears (Fig. 11b). By gradual place selection
and tapping on the symbol, the place is added to the activated route (Place added!).
Places are displayed in the activated route in fig. 11c, and it is possible to move them
freely among each other.
Page 13
VIBRODIAG
www.viditech.eu sales@viditech.cz
Fig. 9 a) Factory definition b) Machine definition c) Machine information
Fig. 10 a) Place definition b) Place setup c) Place setup
Fig. 11 a) Route definition b) Adding place to route c) Display of places in route
Page 14
VIBRODIAG
www.viditech.eu sales@viditech.cz
7 Measuring
After measuring initiation, the filters will stabilize (ca. 5 s), if the measuring request is
initiated immediately after turning on the instrument, then this time can extend to 22 s
(the filters are stabilizing during this period). Filter stabilization is always performed in
case a different route/place is chosen, with its own setup (range, limits, high pass).
7.1 Route measuring
Main menu Route measuring
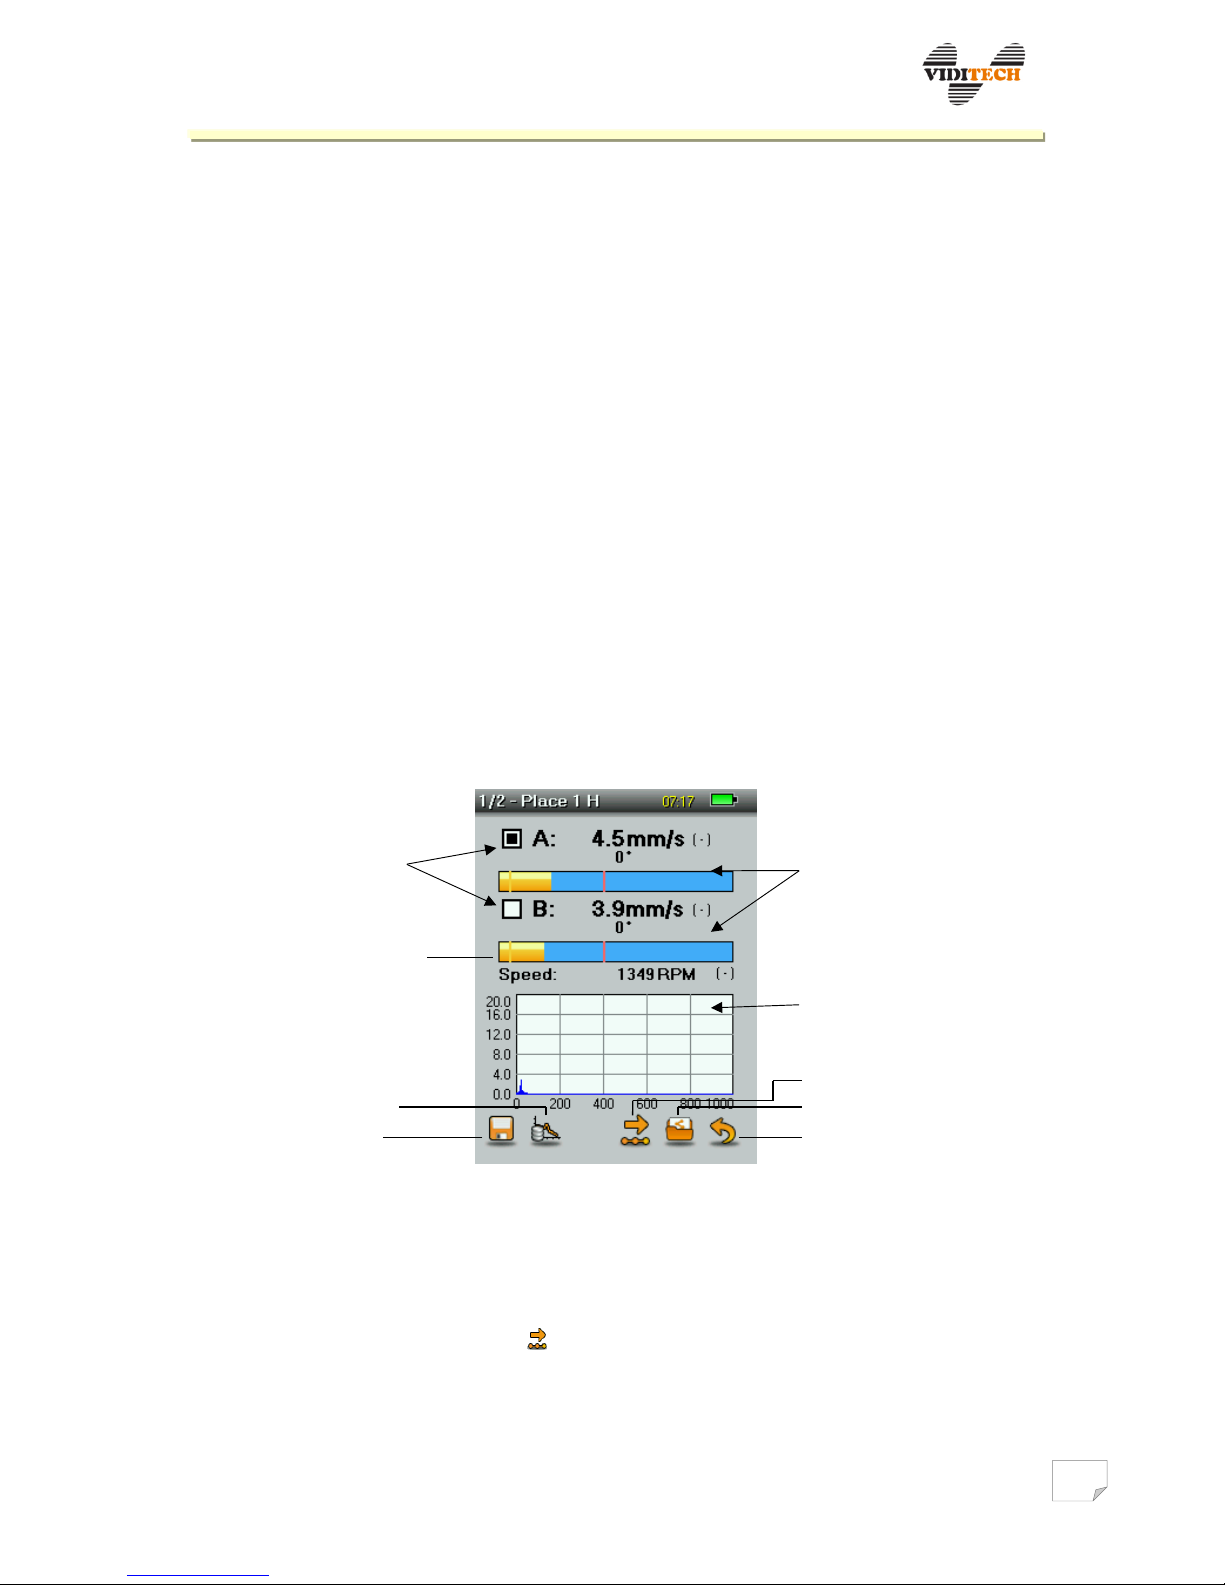
This type of record provides summary measurements containing current values of
vibration velocity, velocity of rotation, frequency analysis of velocity and acceleration in
both channels.
In this mode, two bar graphs showing RMS velocity for individual channels are displayed
(according to ISO 2373) and underneath them, the monitoring of current revolutions is
situated. Frequency spectrum of velocity of the current channel is displayed in the bottom
part of the window. Change of the selected channel is performed by tapping on the box
next to the relevant channel. Bar graphs change colour according to the level of signal in
reference to the set limits (L1, L2). If RMS velocity exceeds threshold L1, bar graph
changes colour to yellow, if it exceeds threshold L2, colour changes to red.
Fig. 12 Measuring current velocity with frequency analysis – route measuring.
After defining measuring places in the Database, routes section, and choosing Routes
with these places, the measuring options extend to saving (diskette icon) predefined
parameters (vibration velocity, revolutions, velocity and acceleration analysis). Browsing
saved data is under the graph icon. Browsing between selected measuring places of the
route is done by the right arrow , or left arrow (during switching the filters might
stabilize! – ca. 20 s). Saved data for the given place (in route) can be displayed only in this
route. As mentioned before, current measuring place and route are displayed in the
heading of the instrument screen.
spectrum
selection for
display
bar graphs
(coloured according to
limits)
rotation velocity
frequency spectrum
(preview)
another measuring place
different route
back
show data
save data
Page 15
VIBRODIAG
www.viditech.eu sales@viditech.cz
7.2 Analysis
7.2.1 Velocity analysis
Main menu Measuring Analysis 1 Hz – 1 kHz velocity
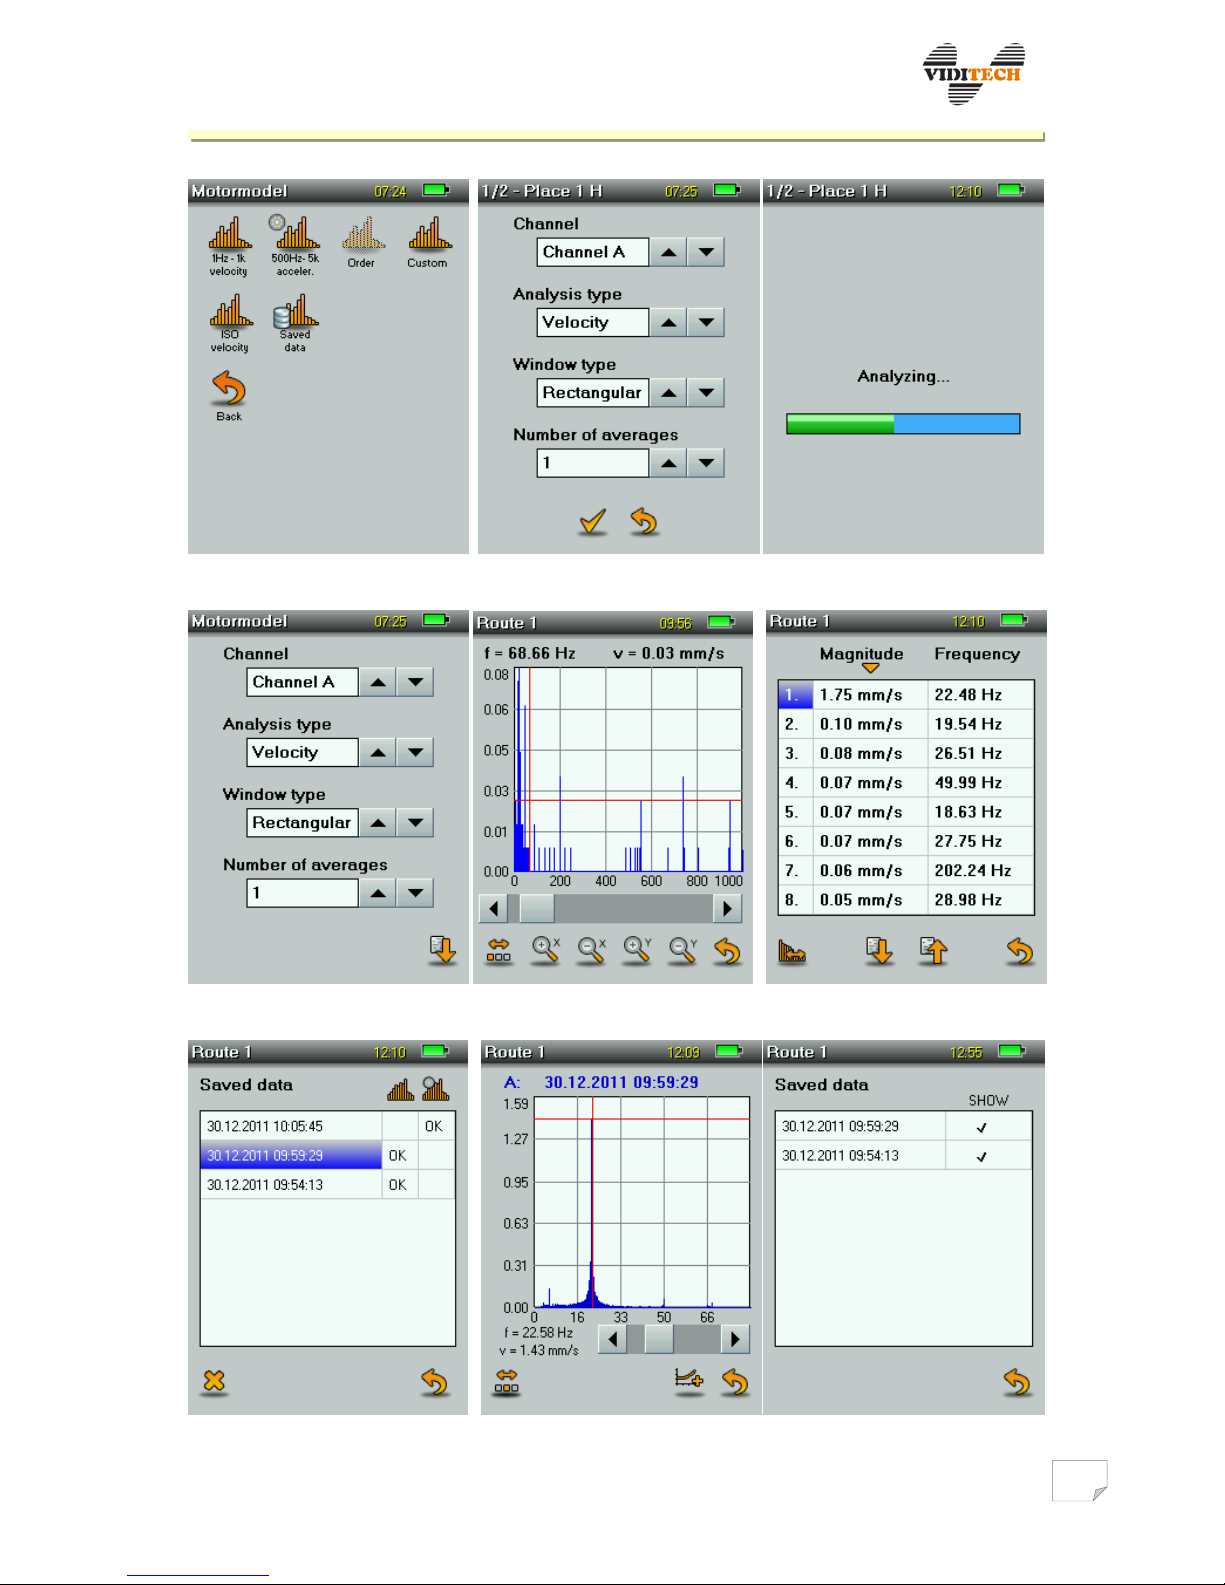
For each velocity analysis it is possible to use only one channel, see fig. 13b. After channel
selection, the input signal is analysed, see fig. 13c. After process completion, the velocity
frequency spectrum is displayed (fig. 14a). Under the graph, zooming options for axis X
and Y are shown. In the bottom left part a button for advanced options is displayed .
After selecting this a second option appears – rotate graph to landscape and table .
For precise frequency values and relevant amplitude values, the cursor is used. Using the
cursor it is possible to browse the graph (frequency and amplitude values are displayed
above the graph), the movement is executed by a scroll bar under the graph. Zoom in the
X axis is done dynamically in reference to the cursor position.
A convenient accessory is the table display, which contains a list of the 20 largest spectral
components sorted from the maximal sensed value (sorting can be ascending/descending
according to frequency and amplitude , see fig. 14b). After specifying the relevant value
in the table row, the setting will change back to graph and mark the selected point using a
cursor. Values in the table and graph are not calculated using the same method. Values in
the table are an average of sum of effective values of three neighbouring spectral lines.
Values in the table are according to their character superior to values in the graphical
display.
The third, advanced option of display, enables saving the record into the selected
round/place, and switching a place in the selected route .
7.2.2 Acceleration analysis
Main menu Measuring Analysis 500 Hz – 5 kHz acceleration
Acceleration analysis is analogical to velocity analysis.
7.2.3 Optional analysis
Main menu Measuring Analysis Optional
Optional analysis allows a detailed setup of the monitored frequency range. For Velocity
analysis the limit of frequency component is restricted by the parameters of the place
setup, maximal frequency is 1000 Hz. For Acceleration analysis the maximal range is (500
– 5000) Hz.
7.2.4 Saved data
Main menu Measuring Analysis Saved data
Analysis selection is shown in fig. 15a. It is possible to add other analyses in the graphical
display , sensed under the same conditions (channel, analysis type, range), see fig. 15c.
Page 16
VIBRODIAG
www.viditech.eu sales@viditech.cz
Fig. 13 a) Analysis selection. b) Channel selection. c) Running analysis.
Fig. 14 a) Analysis display. b) Table of values. c) Optional analysis.
Fig. 15 a) Saved analyses. b) Saved analysis. c) Adding new analysis to graph.
Page 17
VIBRODIAG
www.viditech.eu sales@viditech.cz
7.3 Run up, coast down
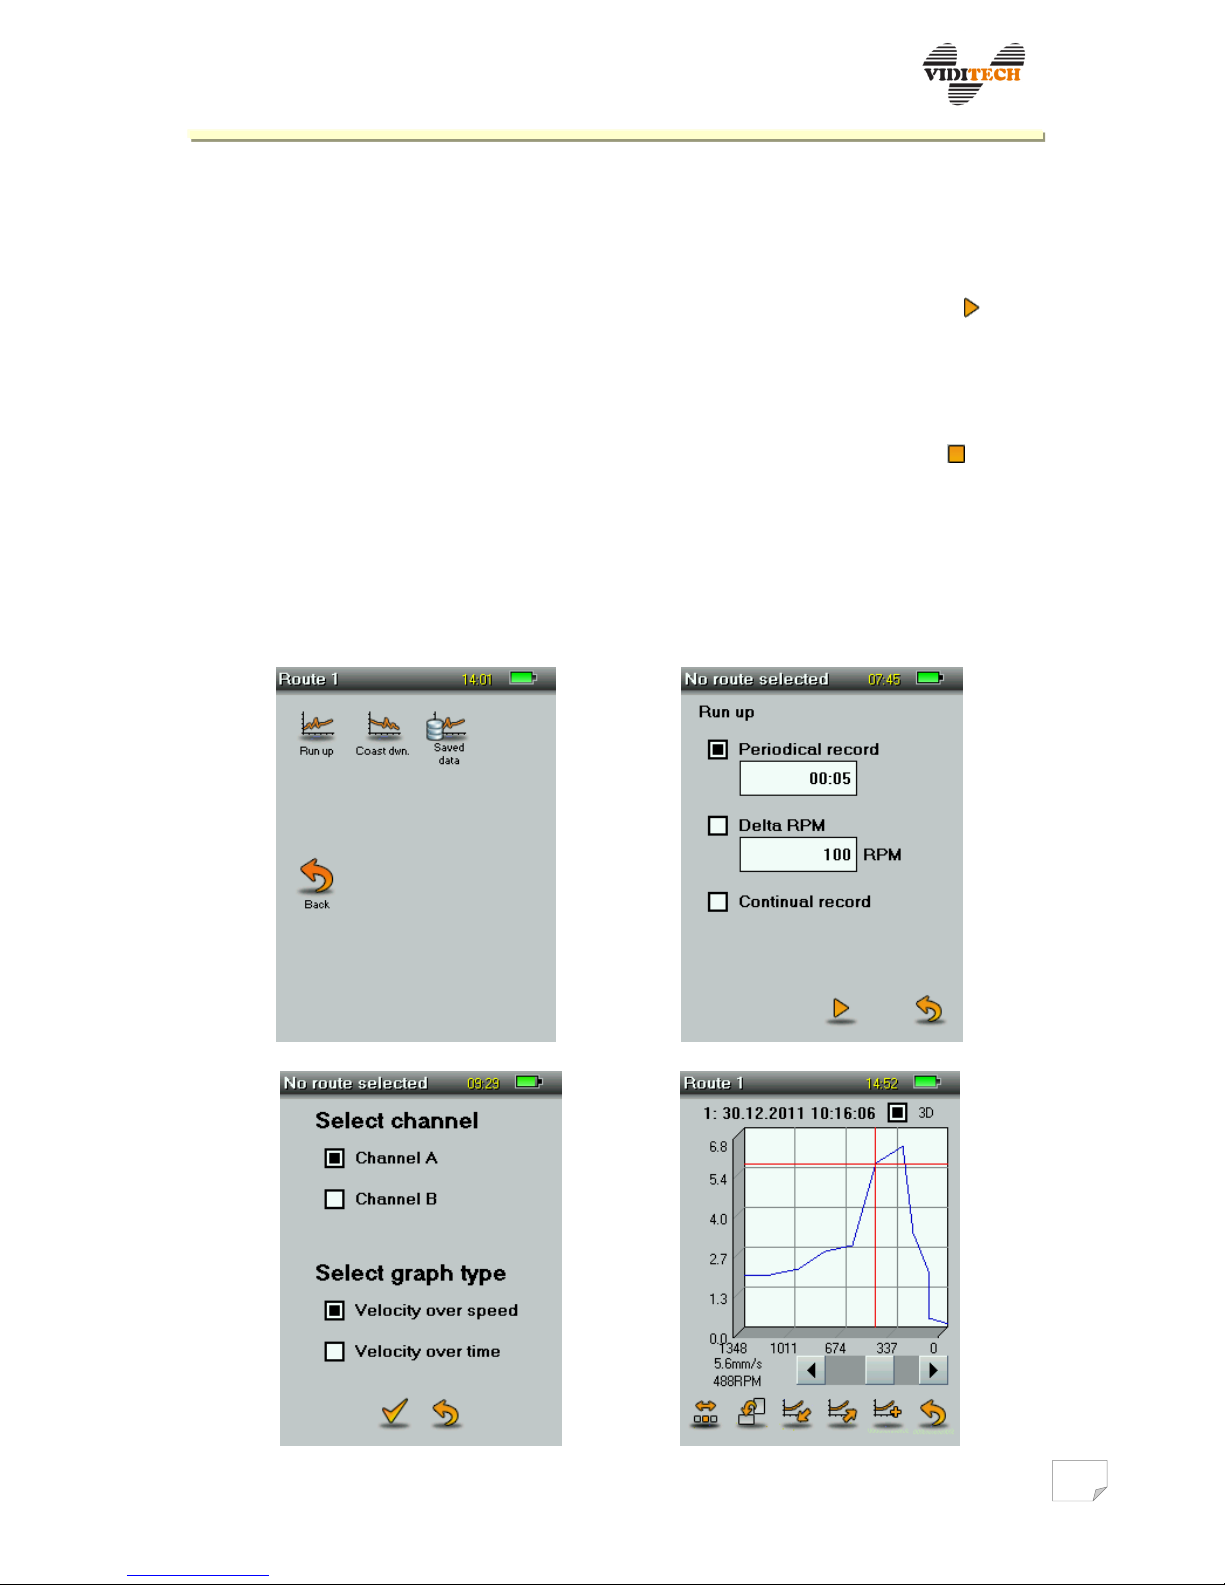
Main menu Measuring Run up, coast down Run up/Coast down/Saved data
For recording vibration velocity during run up and coast down of the machine, the
revolution sensor must be connected. Start of the test is performed by pressing , in this
moment the instrument records the current values (revolutions, amplitude). Another
record is performed after a detection of revolutions change and the instrument records in
the set period. Current revolutions together with the current vibration velocity values are
displayed in the bottom part of the screen. After revolutions set in final state (run up to
maximum/coast down to minimum) it is necessary to end the recording using icon, the
last value is saved while pressing end.
Correctly recorded values for Delta RPM are dependent on gradient of changes of
revolutions during run up/coast down of the machine. The instrument can record two
following values maximally in a 0,2 s interval. If a larger gradient occurs within the 0,2
s, than the set step Delta RPM, the step value in the record will not correspond to the set
step, but will be equal to the smallest possible value of RPM.
Fig. 16 a) Run up, coast down. b) Period selection.
Page 18

VIBRODIAG
www.viditech.eu sales@viditech.cz
Fig. 16 c) Graph options. d) Coast down display.
Saved records can be displayed using Saved data (fig. 16a). After this selection, two
columns are added to the saved items (ranged by sensing time – from the newest). The
first column is for data sensed during run up and the second column during machine coast
down. Tapping on the required box shows channel options and graph type options. Graph
control is analogical to the previous cases, see fig. 16c. It is possible to add new records
into the graph and to compare them among each other.
7.4 Balancing
For correct and secure instrument balancing, minimally the following instructions must
be followed:
a) Place on the machine only weights specified by the manufacturer, into spots that
are explicitly designated for this purpose – balancing axis (cutting, thread holes,
places for welding and other)
b) During the weight placement selection, safety and health of the operating
personnel must be taken into account, against weight detachment due to
centrifugal force.
c) A larger weight, than the one already placed on the machine, should not be used.
Rather choose a larger number of lighter weights, and repeat the measurement.
d) Personnel without appropriate practice should not conduct these measurements!
7.4.1 Balancing in single plane
Main menu Measuring Balancing Single plane
This option is used for balancing thin rotating wheels on short shafts of rotating
machines. For correct function, the speed sensor must be connected. Further, it is
necessary to label the zero degree on the circular (angular) scale of the rotating wheel
with a reflective band. From this reference position (0°), the following runs are calculated.
After executing the process, screen with selection of previously saved machine coefficient
appears. You can choose the coefficients from database (balancing without the test run)
or do the measuring without choosing the coefficient from database (balancing with the
test run). After initiation the wizard is displayed, it asks to enter the machine rotation
direction and then to enter the position of the accelerometer towards the speed sensor.
The position is then noted in the balancing results.
The wizard in this case is informative and used for better orientation. The balancing
result using the test weight does not depend on the wizard setup. It is possible to skip the
wizard using Skip wizard and further the balancing continues as follows:
First run: Tapping on the forward arrow button, vibration analysis of rotating
wheel is initiated. For the analysis to be performed, the flywheel must be steady-state
Page 19
VIBRODIAG
www.viditech.eu sales@viditech.cz
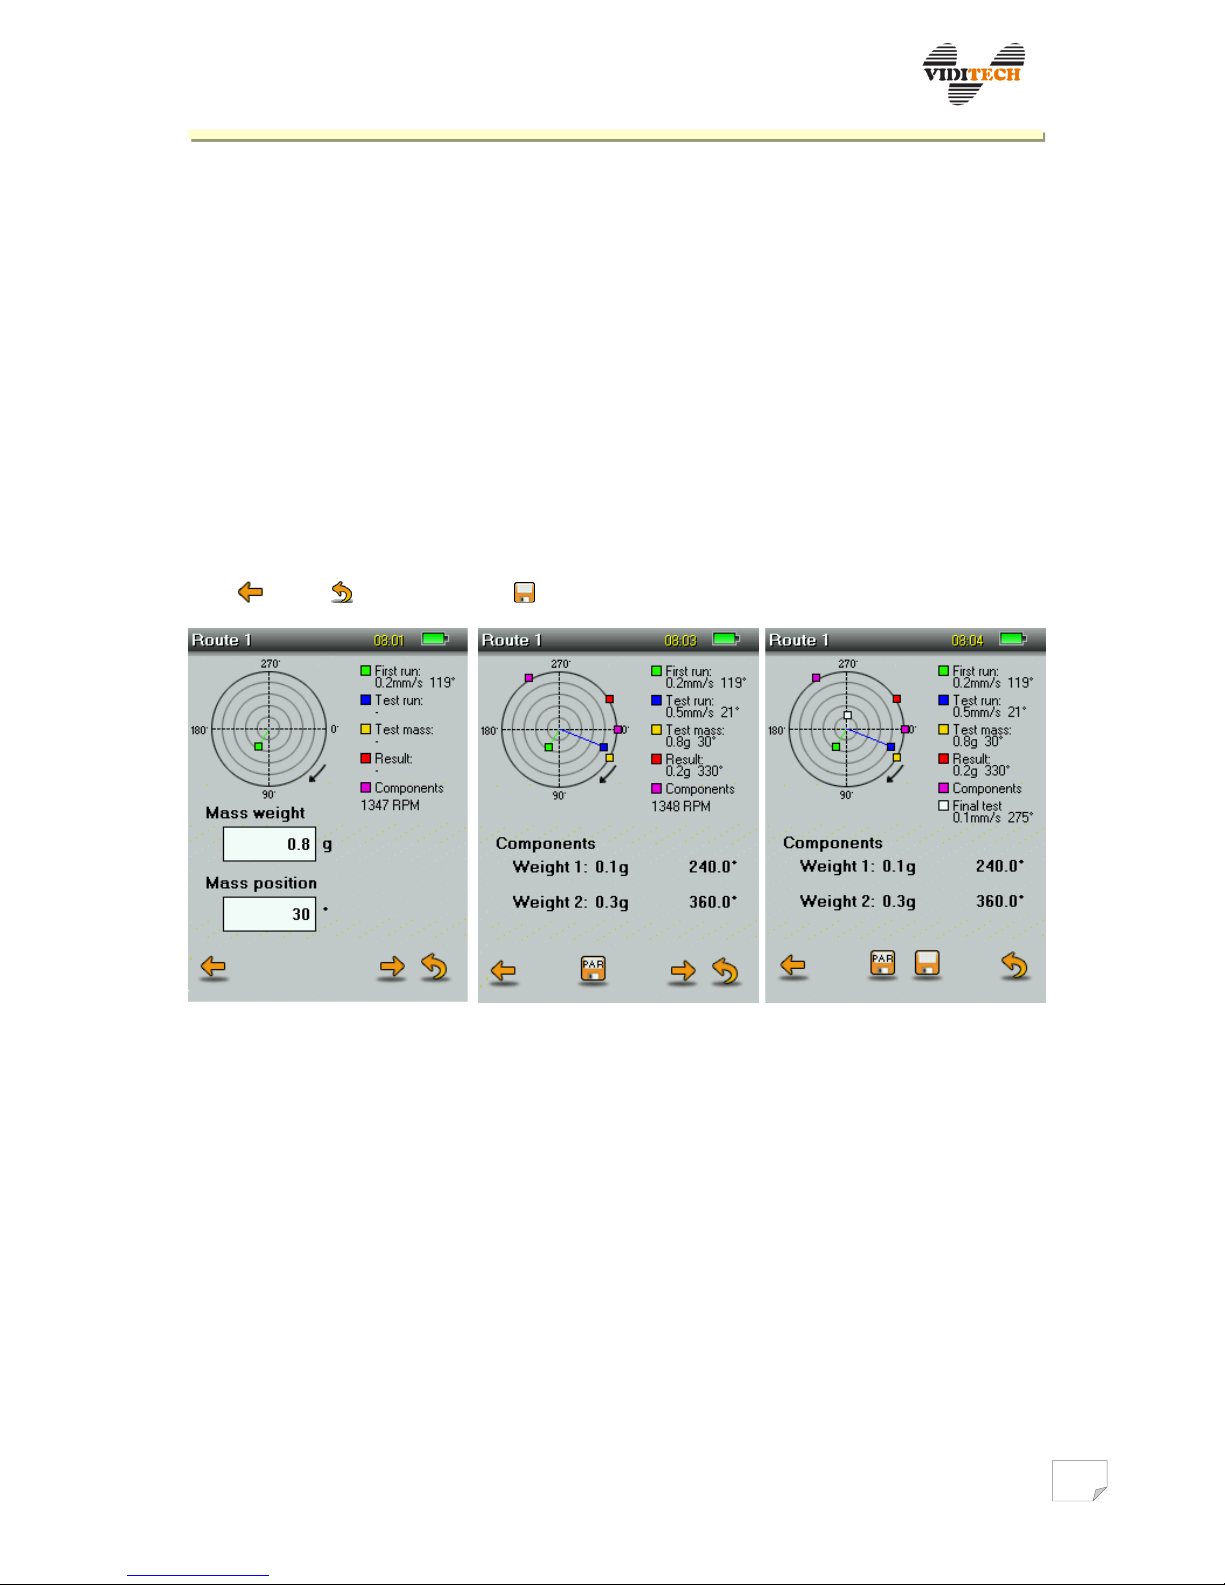
rotating. Unless this state is achieved, Please wait is displayed on the screen. After the
analysis is performed, the value of vibration velocity and the position of the heavy place is
displayed, see fig. 17a. Vibration velocity value is relative to the maximal amplitude of one
dominant component in the spectrum – in this sense it is the revolution frequency.
Test run: To determine the size of the balancing weight, a run with the test weight
must be performed. A test weight is attached to the balanced wheel, it is necessary to
enter its weight and position into relevant boxes (fig. 17a). Test run is initiated by tapping
on Continue.
Result: After evaluating the previous two steps the size and position of the
balancing weight is calculated. If only a limited amount of attachment spots (Components)
is available, it is possible to re-count the size of the weight for two positions, see fig. 17b.
Before placing the final balancing weights, it is necessary to remove the test weight.
A control may be done by performing a new balancing. It is possible to return by one step
back , leave and save result in the balancing process.
Fig. 17 a) First run. b) Components. c) Balancing saving.
7.4.2 Dual plane balancing
Main menu Measuring Balancing Dual plane
This option is used for dynamic balancing of two rotating wheels on short shafts of rotating
machines. For correct function, the speed sensor must be connected. Further, it is
necessary to label the zero degree on the circular (angular) scale of the rotating wheel
with a reflective band. From this reference position (0°), the following runs are calculated.
After executing the process, screen with selection of previously saved machine coefficient
appears. You can choose the coefficients from database (balancing without the test run)
or do the measuring without choosing the coefficient from database (balancing with the
test run). After initiation the wizard is displayed, and asks to enter the machine rotation
direction and then to enter the position of the accelerometer towards the speed sensor.
The position is then noted in the balancing results.
Page 20
VIBRODIAG
www.viditech.eu sales@viditech.cz
The wizard in this case is informative and used for better orientation. The balancing
result using the test weight does not depend on the wizard setup. It is possible to skip the
wizard using Skip wizard and further the balancing continues as follows:
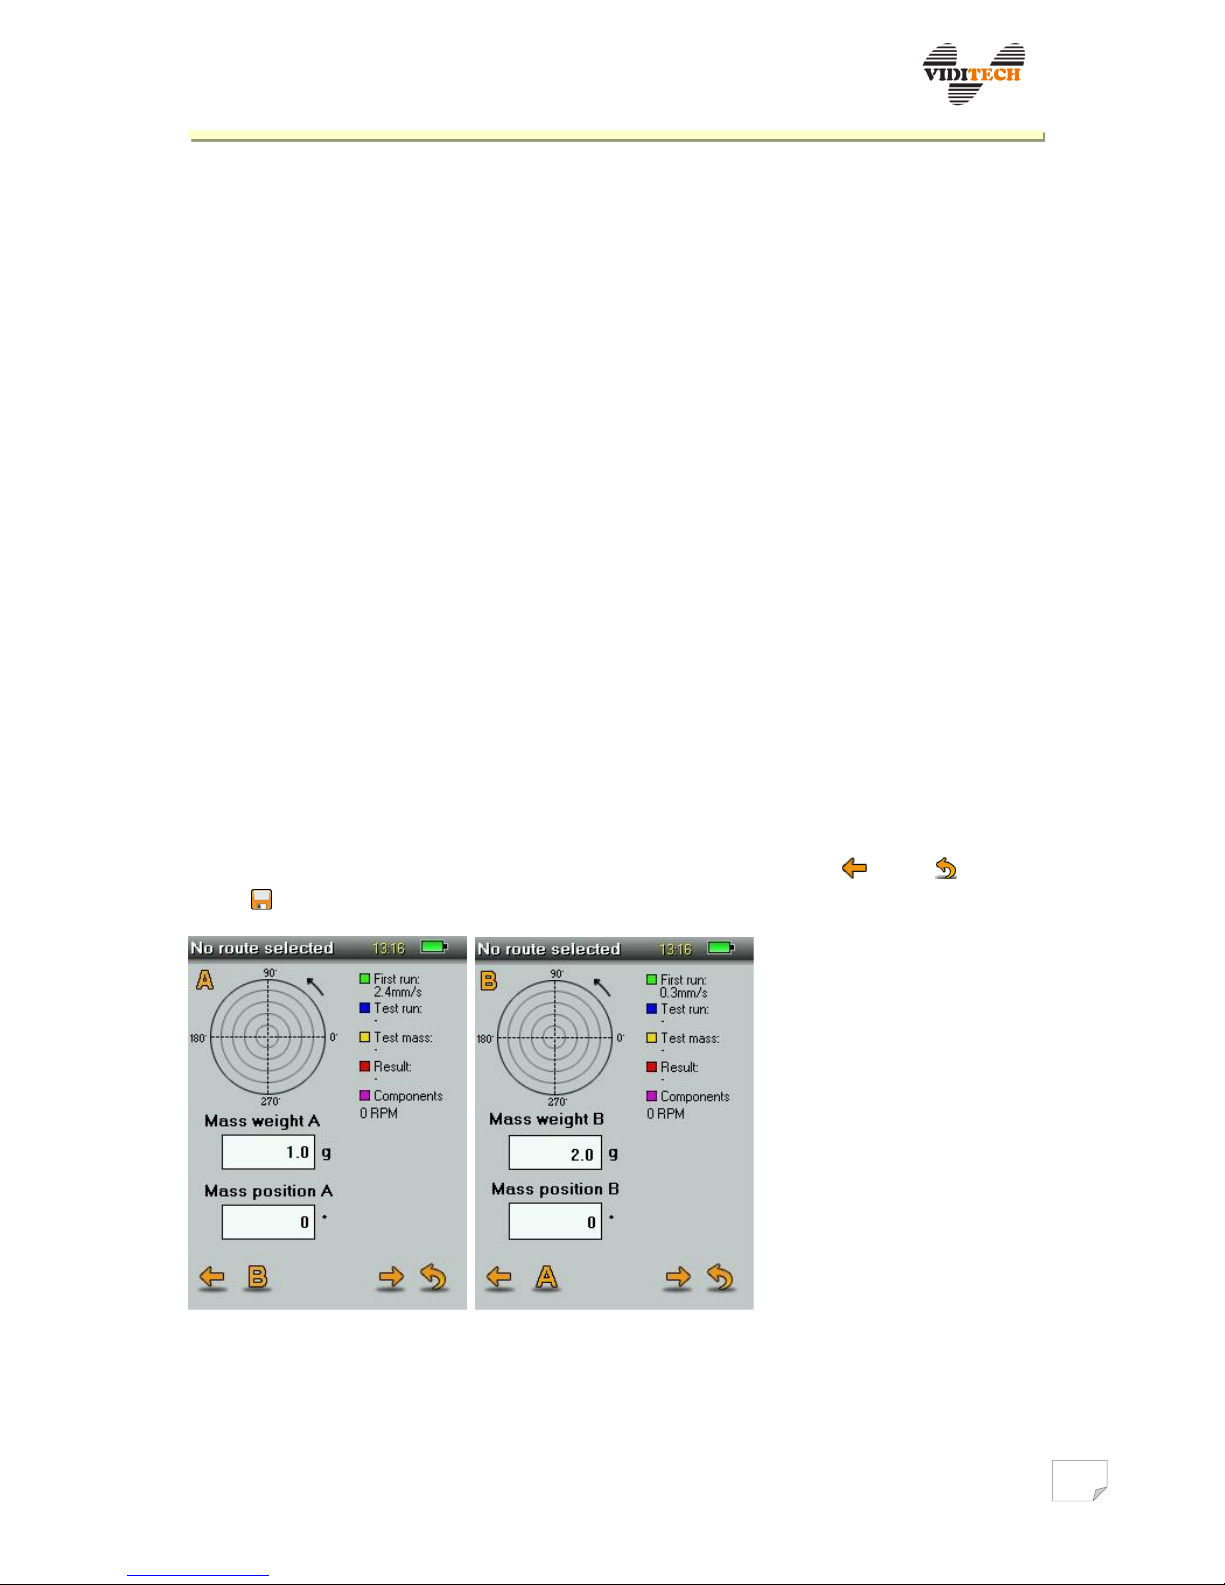
First run: By selecting measurements and clicking on the forward arrow starts the
rotating wheel vibration analysis in both channels. To support the analysis the flywheel must
spin at a steady speed. Until this stage is reached, the screen is greyed out and the arrow for
proceeding is inactive. After the analysis, vibration velocity in channel A will be displayed,
after another click the same for channel B, see Figure 18a and 18b. Vibration velocity value is
relative to the maximal amplitude of one dominant component in the spectrum – in this
sense it is the revolution frequency.
Test Run: Sizing counterweight must be performed with a running test weight. Test
weights are attached to balancing wheels, the weight and the position must be entered in the
appropriate boxes ( Fig. 18a ) . The selection is first performed for channel A and after
finishing follows the same step for channel B. Before starting the test run for channel B it is
necessary to remove the test weight from channel A. The test run is started by clicking on the
forward arrow button.
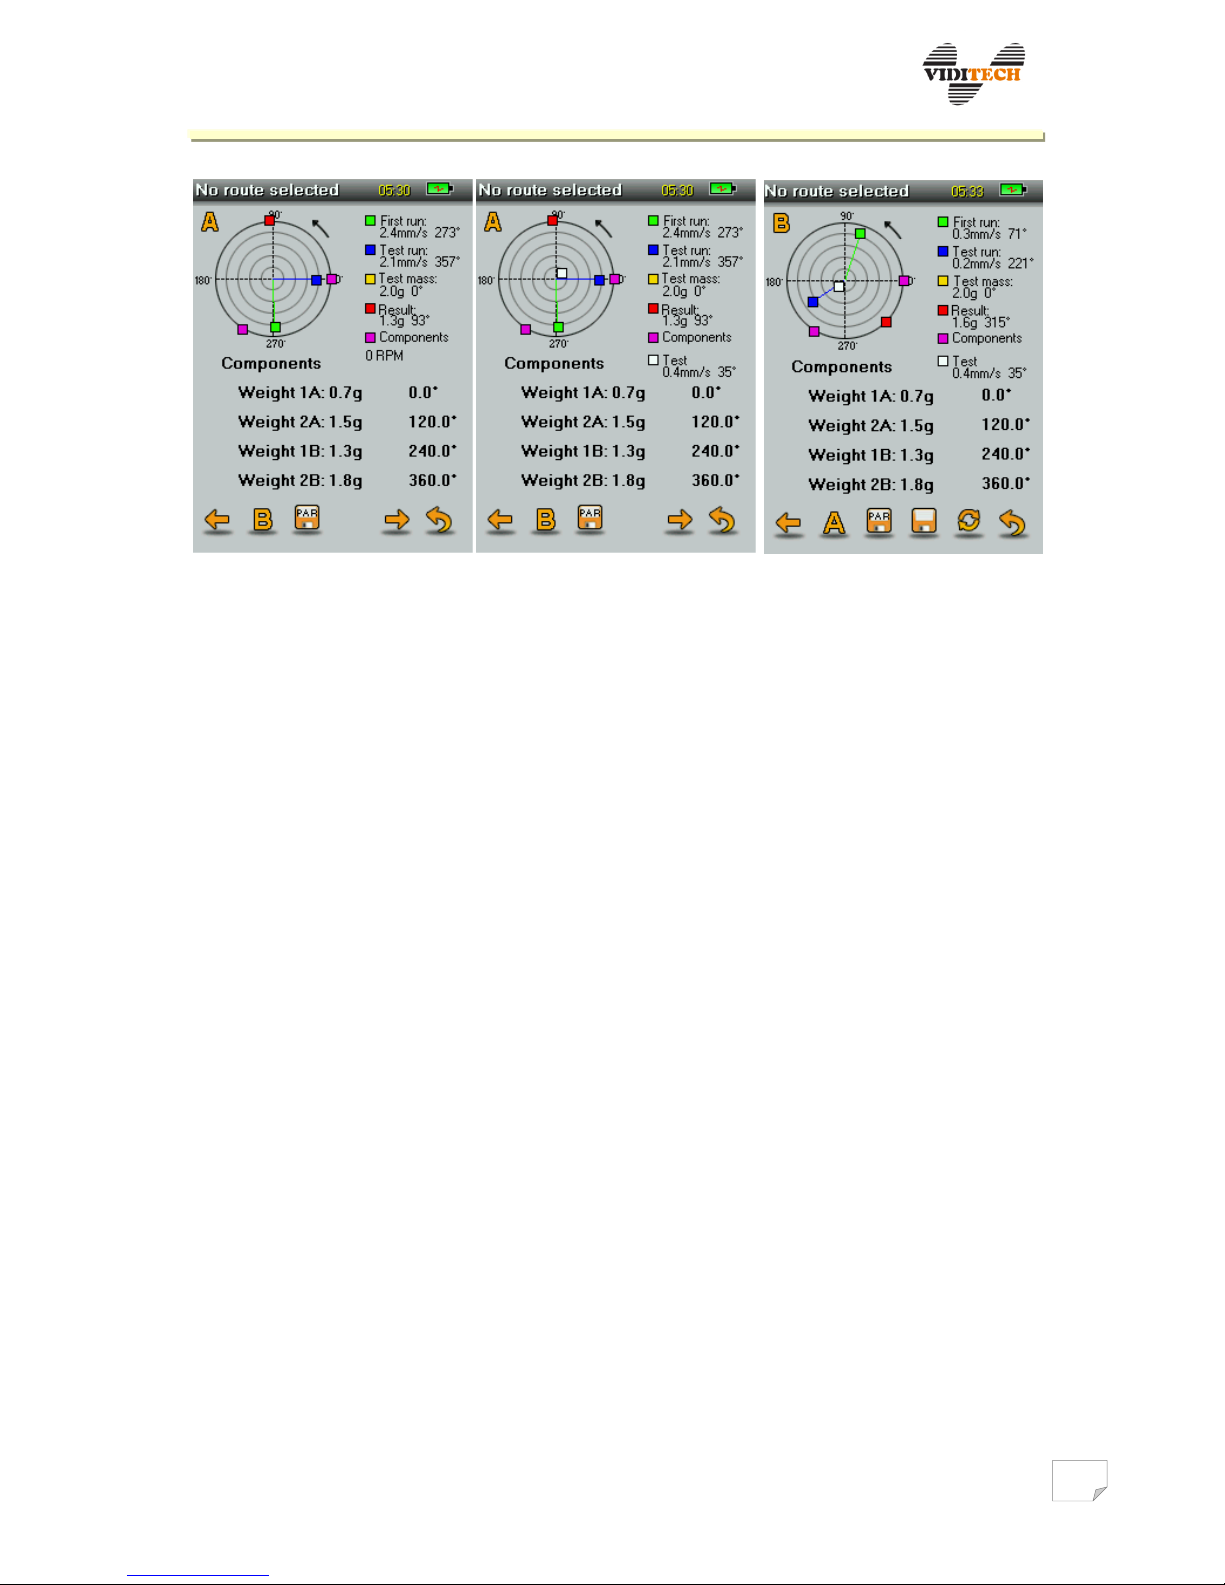
Result: After evaluating the previous two steps, the size and position of the balancing
weights are computed. If there is only a limited number of fastening points (components), it is
possible to recalculate the size of the weights according to their number, see Figure 18c. Before
placing the final balancing weights, it is necessary to remove the test weight. A control may be
done by performing a new balancing. It is possible to return by one step , leave and save
result in the balancing process.
Fig.18 a) first run ch.A b) first run ch.B
Page 21
VIBRODIAG
www.viditech.eu sales@viditech.cz
c) calculated components d) the result of balancing ch. A e) the result of balancing ch. B
7.4.3 Grinding wheels balancing
Main menu Measuring Balancing Grinding wheels
This option is used for dynamic balancing of two rotating wheels on short shafts of rotating
machines. For correct function, the speed sensor must be connected. Further, it is
necessary to label the zero degree on the circular (angular) scale of the rotating wheel
with a reflective band. From this reference position (0°), the following runs are calculated.
After executing the process, screen with selection of previously saved machine coefficient
appears. You can choose the coefficients from database (balancing without the test run)
or do the measuring without choosing the coefficient from database (balancing with the
test run). After initiation the wizard is displayed, and asks to enter the machine rotation
direction and then to enter the position of the accelerometer towards the speed sensor.
The position is then noted in the balancing results.
3 weights of the same weight should be present on the grinding wheel, which are spaced apart
by 120 ° to position 0 °, 120 ° and 240 °, and therefore their influence on the balancing is
completely zeroed. Weights are placed permanently, and cannot be removed. All three weights
are used for the calculation.
First run: Balancing grinding wheel operates only with one channel, which is set by
default to channel A. Click the forward arrow to start vibration analysis of rotating blade. To
support the analysis, the flywheel must spin at a steady state. Until this stage is reached, the
screen is greyed out and the arrow for proceeding is inactive. After the analysis, the vibration
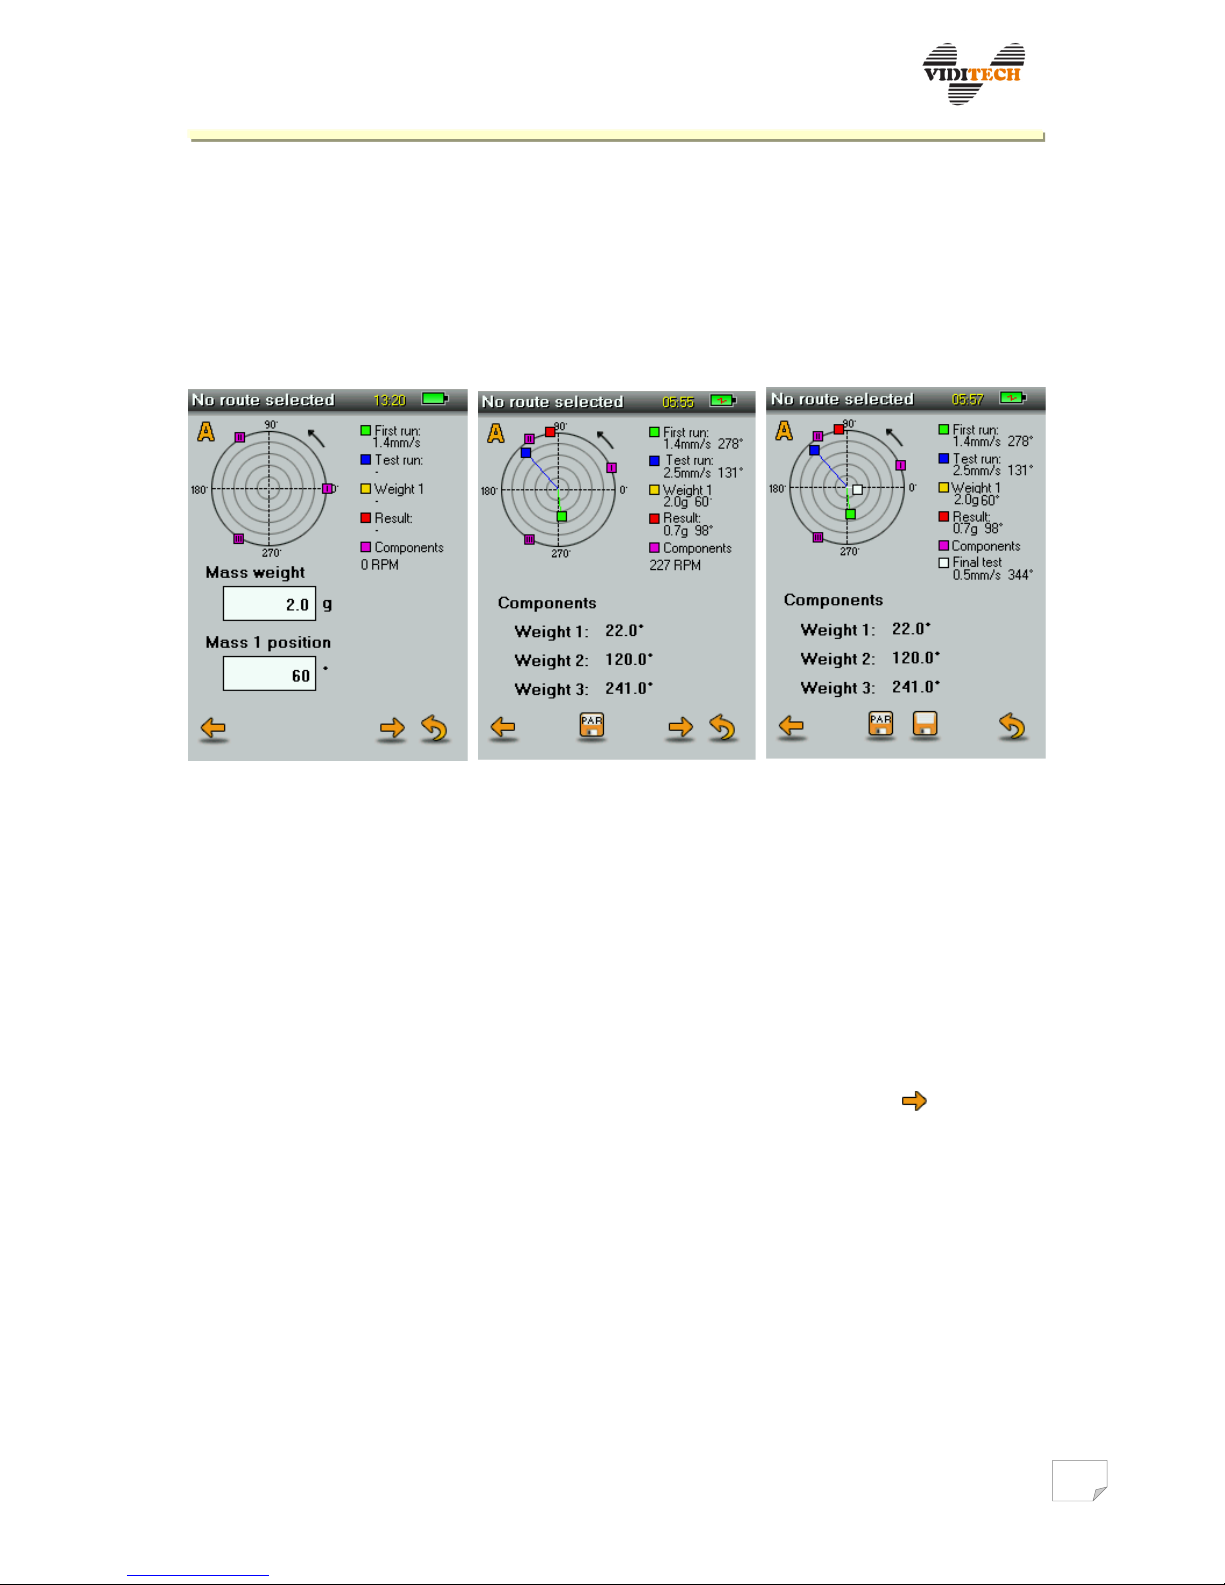
velocity will be shown, see Figure 19a. Vibration velocity value is relative to the maximal
amplitude of one dominant component in the spectrum – in this sense it is the revolution
frequency.
Test run: for determining the place of displacement of various weights, a run must be
performed with weight shifted to a certain position, which together with the weight must be
Page 22
VIBRODIAG
www.viditech.eu sales@viditech.cz
entered in the appropriate boxes (Fig. 19a). The test run is started by clicking on the forward
arrow button.
Result: After evaluating the previous two steps, the position displacement of individual
weights is calculated (Fig. 19b). Balancing process can return one step back, leave, save the
result and store parameters.
Fig. 19 a) first run b) the calculation of weights c) the result of balancing
7.4.4 Displaying saved balancing
Main menu Measure Balancing Saved data
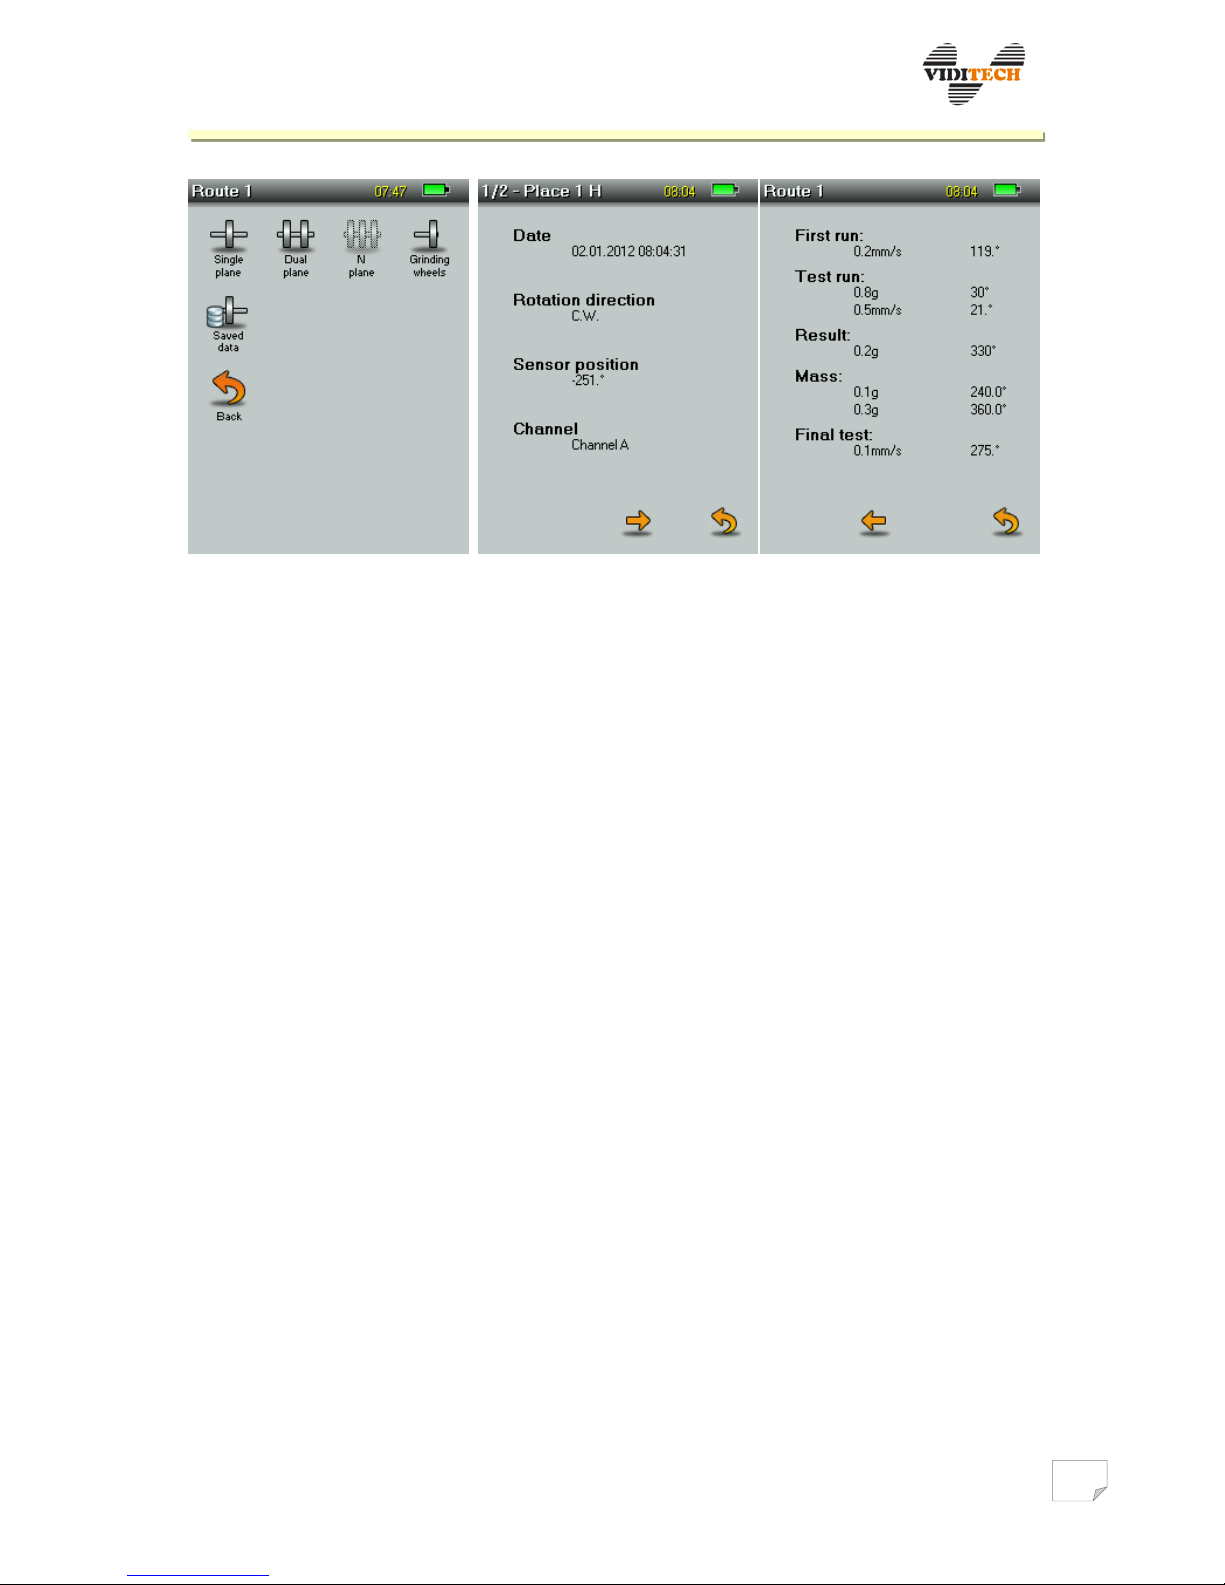
After saving balancing data, it is possible to display the results using Saved data, see fig.
18a. Data are displayed in two screens, among which can be switched by . Informative
data are displayed on the first screen, measured results are on the second screen
(fig. 18c).
Page 23
VIBRODIAG
www.viditech.eu sales@viditech.cz
Fig. 18 a) Saved data. b) Informative data. c) Measured results.
Page 24
VIBRODIAG
www.viditech.eu sales@viditech.cz
7.5 Bearing condition
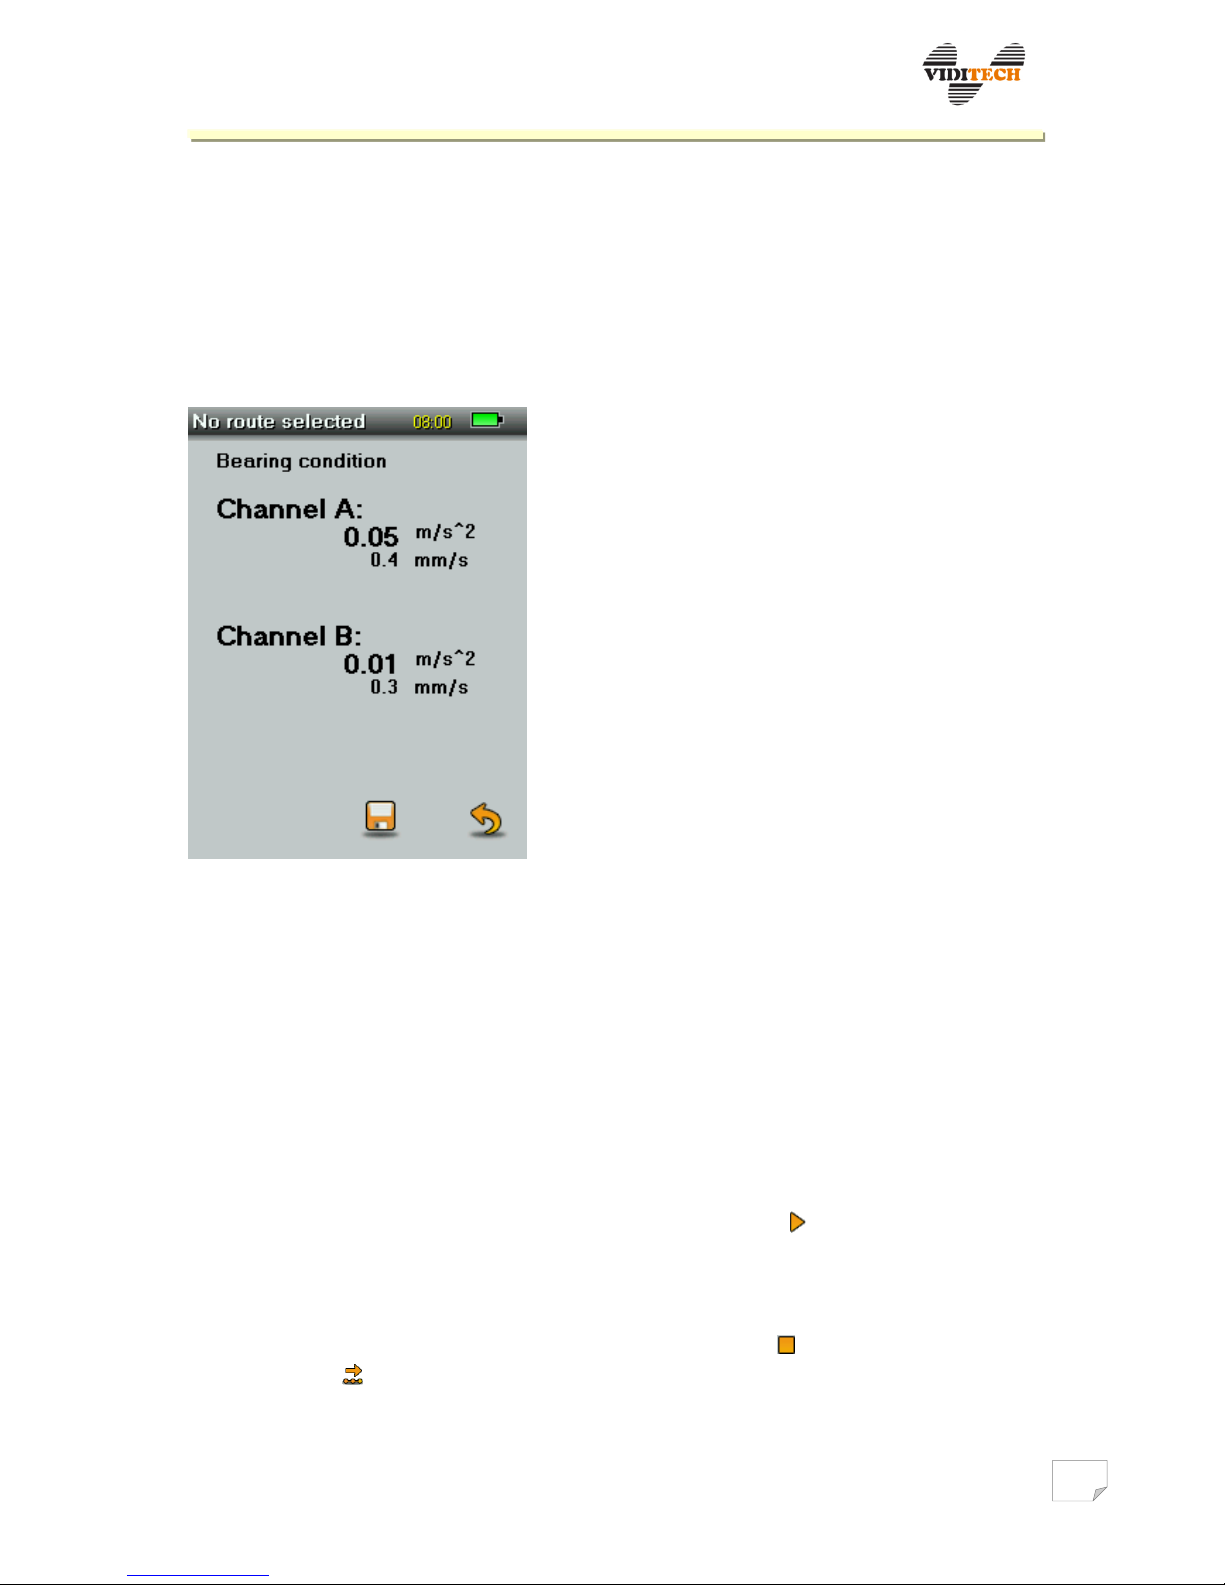
This function shows bearing condition in acceleration (plus additional information about
vibration velocity). It is possible to save data for future use.
There is implemented envelope method evaluation currently (measured in frequency band
500Hz...15kHz), but newer method (using concrete bearing fault frequencies evaluation) will
be implemented soon.
Fig. 19 Bearing condition
8 Recorder
8.1 Threshold recorder
Main menu Measuring Recorder Threshold
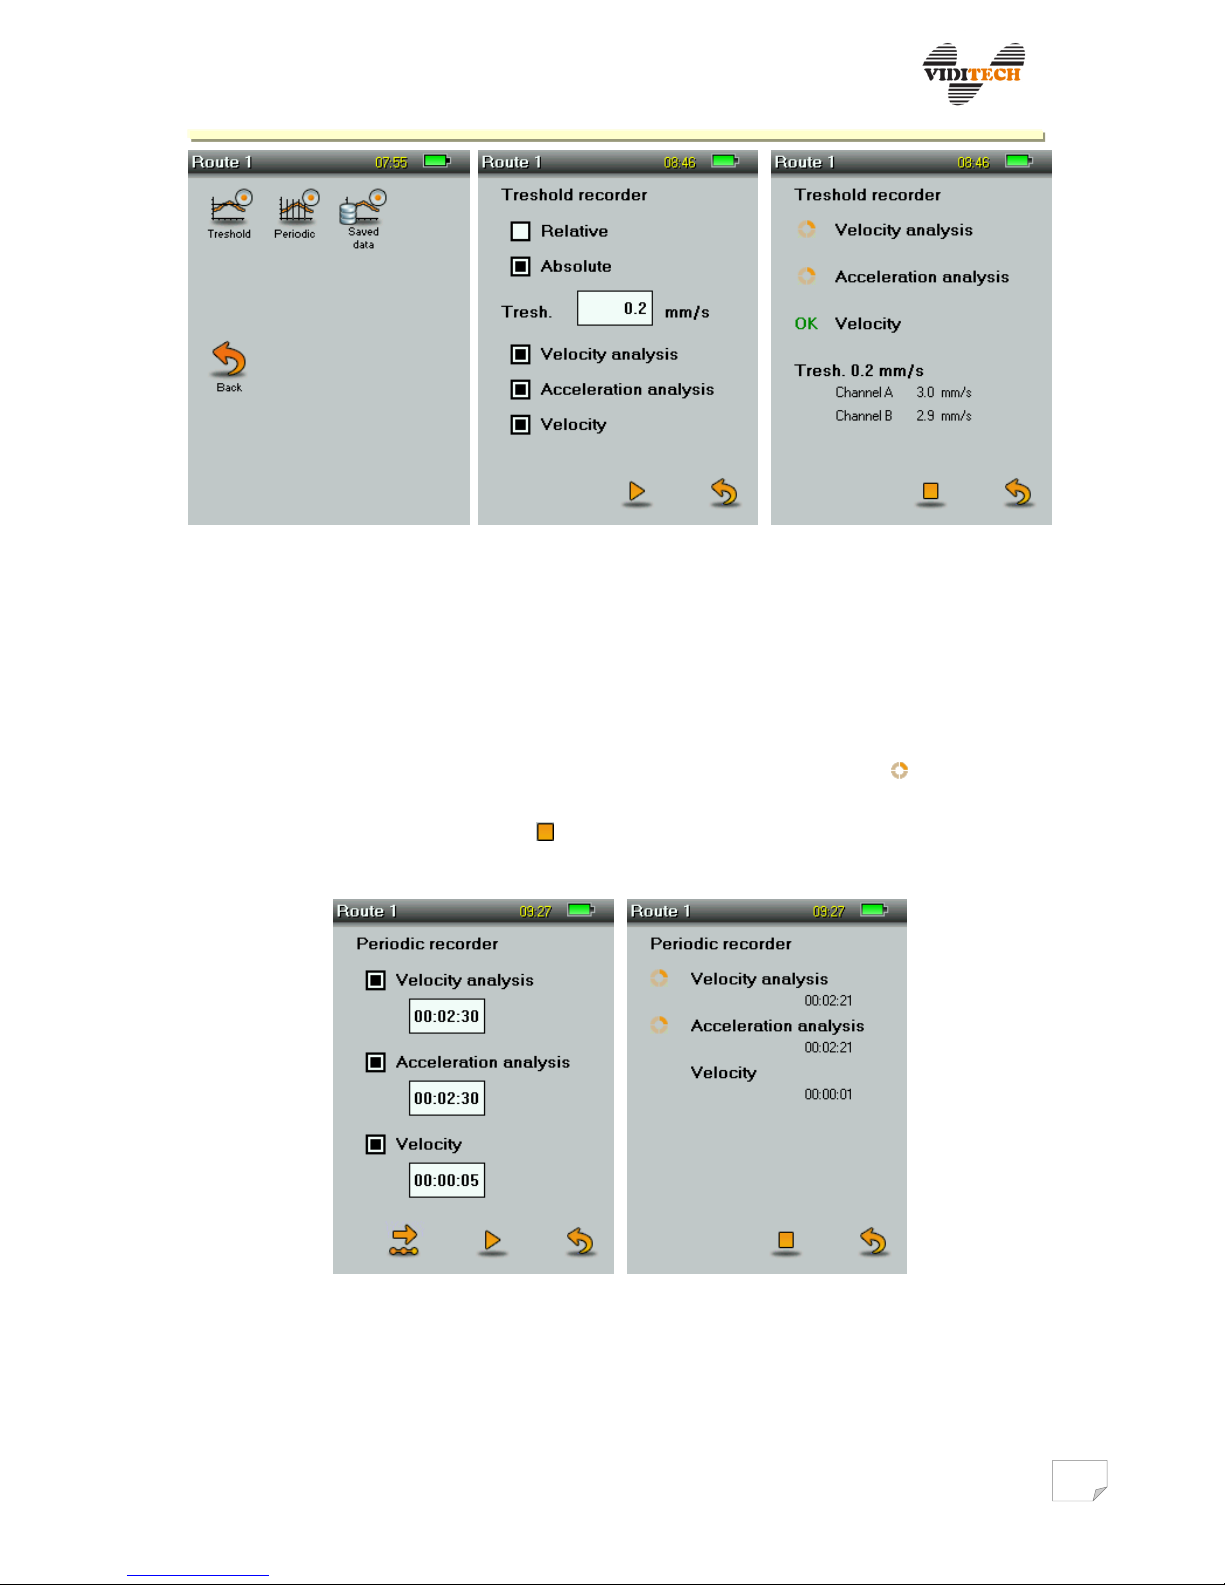
The recorder is initiated after exceeding the set RMS velocity threshold. It is possible to
set the threshold absolutely in mm/s, or relatively by entering percent of range. The
numerical value of threshold is entered by tapping on the box marked Threshold. It is
possible to record Velocity analysis, Acceleration analysis and Vibrations. After setting all
the above mentioned items, the recording is initiated by the icon, see fig. 20c. Unless
the set threshold is exceeded, the evaluation unit displays only the current RMS velocity.
Immediately after exceeding the threshold an analysis of the recorded signal is
performed. The computation ends when an OK window is displayed next to all measured
parameters. It is possible to halt the record by holding the icon. Route places can be
browsed using . After each change of place, the filters will stabilize (ca. 20 s). After
measuring, the records are available under Saved data.
Page 25
VIBRODIAG
www.viditech.eu sales@viditech.cz
Fig. 20 a) Recorder menu. b) Threshold recorder. c) Running recording.
8.2 Periodical recorder
Main menu Measuring Recorder Periodic recorder
In the periodical recorder it is possible to select, which analyses are to be performed and
in which period. The smallest step for analyses is 00:02:30 and for Vibration 00:00:02 (fig.
21a). After analysis initiation the following are displayed: time till end of one period and
saving of first and subsequently the following record. If the symbol is in front of
velocity analysis or acceleration analysis, the analysis is being performed (fig. 21b). The
recording is stopped by holding the icon. If an analysis is being performed, then a delay
with the recorder halt can occur.
Fig. 21 a) Recorder setup. b) Recorder initiation.
8.3 Browsing saved data
Main menu Measure Recorder Saved data
Page 26
VIBRODIAG
www.viditech.eu sales@viditech.cz
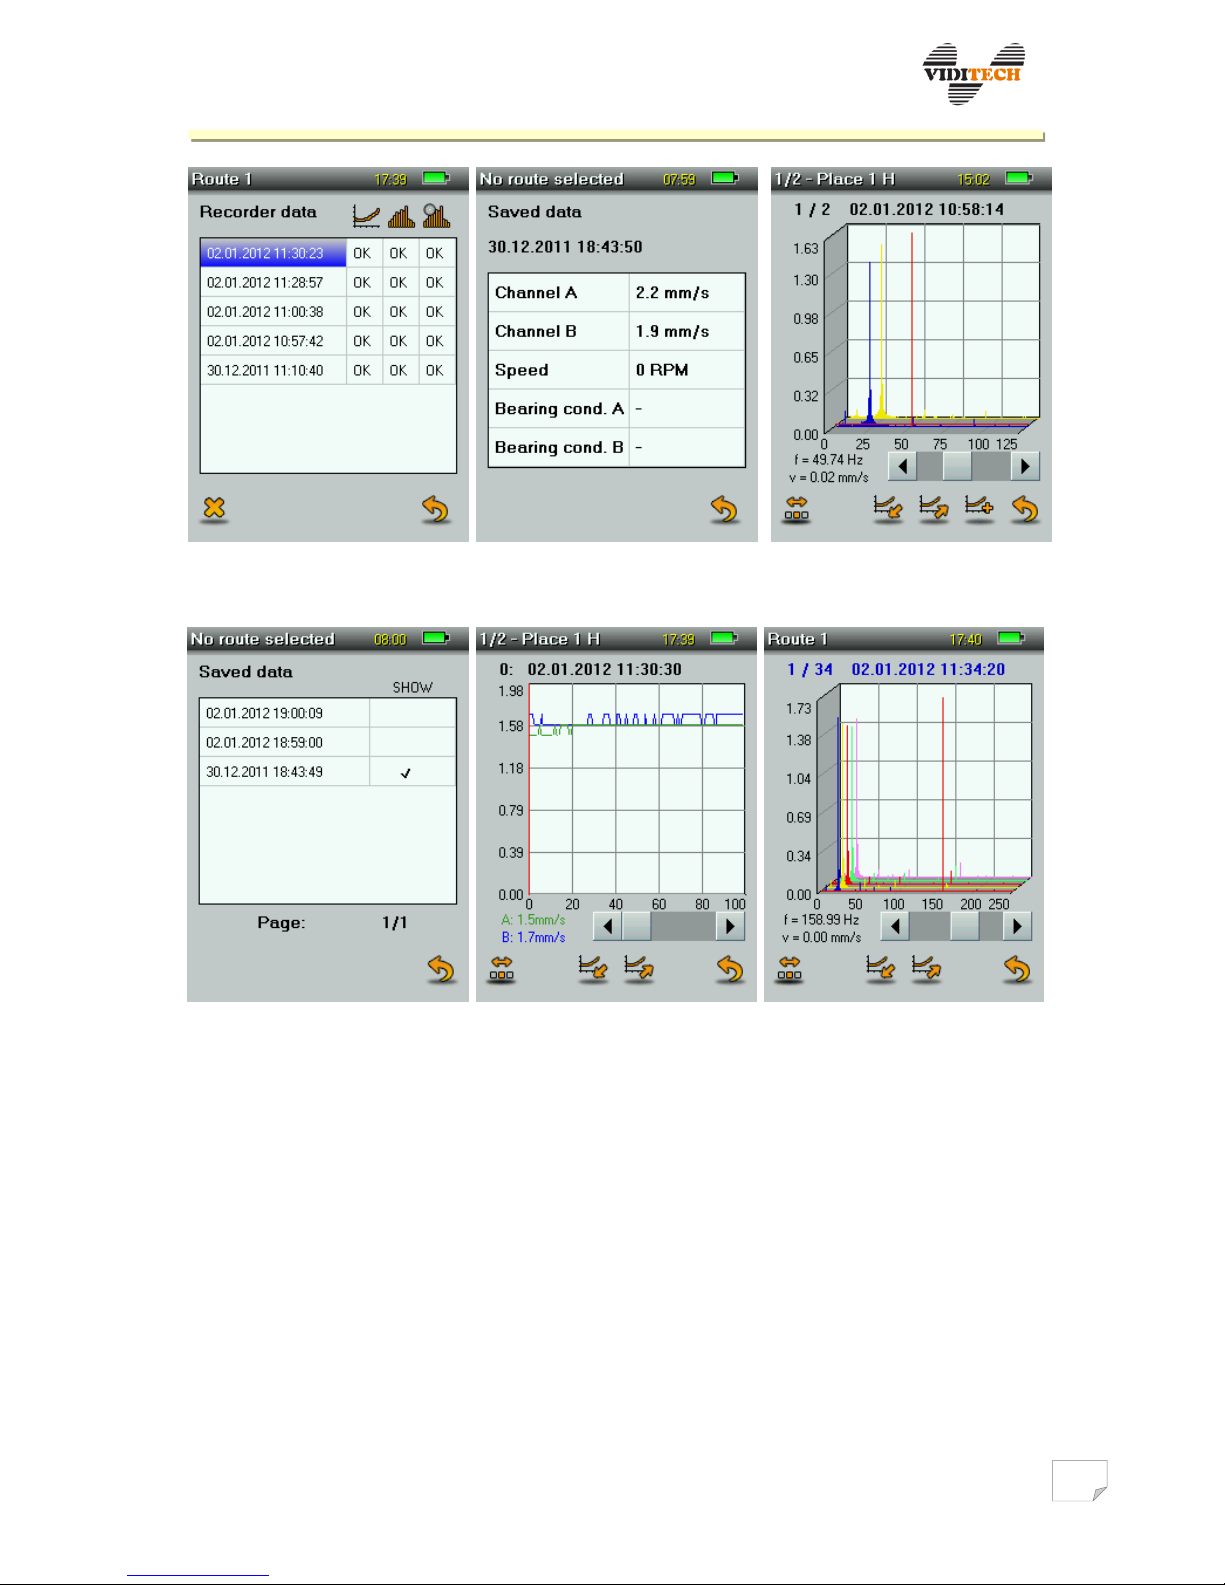
Saved files are displayed in the Data card. In the first column from the left, date and time
of the measurement are stated. In other columns the following are available, RMS
vibrations , velocity analysis and acceleration analysis versus time. Tapping on
the joining of row and column (item OK) the desired record is displayed graphically.
Table Recorder data includes only data saved for the selected Route/place and
simultaneously measurements from the threshold and periodical recorder are stated.
In case of the threshold recorder for RMS vibrations a table containing values of
vibrations velocity and current revolutions is plotted – if they are sensed (fig. 22b). For
velocity and acceleration analysis a frequency spectrum graph is displayed. Using icon
from advanced options, it is possible to add additional analyses to the graph (fig. 23a). In
comparative comparing in one graphical display, only data saved from the same
measuring place and with the same parameters setup and channel sensing are preset.
Maximal number of analyses, that can be loaded for the threshold recorder is 10, only 5 of
them are displayed in the graph. Information about the current selected analysis are
shown in the graph heading. Each analysis can be browsed using the scroll bar. Using the
second selection of advanced options, retrieved analyses can be browsed , the
current analysis is always displayed as first in the graph and the previous analyses are
hidden. Third selection of advanced options enables turning the graph to longitudinal
view and showing table values for the currently selected spectrum.
In case of periodical recorder for RMS vibrations the graphical dependence of
vibrations velocity on position is plotted. Position in this case represents the current
point from the total number of saved points (position 20 of axis X using step 2 s matches
actual 40 s).
Number of analyses of the periodical recorder is limited by the capacity of the SD card,
while one analysis occupies 16 kB. It is possible to browse the analyses, the current is
always shown as first, its description is stated in the graph heading.
Files can be deleted by tapping on the item in the first column (date and time) and tapping
on the symbol.
Page 27
VIBRODIAG
www.viditech.eu sales@viditech.cz
Fig. 22 a) Saved data from rec. b) Threshold rec. vibrations. c) Threshold rec. analyses.
Fig. 23 a) Adding another analysis. b) Periodical rec. vibrations. c) Periodical rec. analyses.
 Loading...