

Page 1

SDN Controller Test
Performance Benchmarking
Version 1.4
User Guide
Part Number: T/UG–PKTBLASTER-SDN-CTR-PERF-1.4–1015/1.1
Page 2

Page 3

Copyright ©Veryx Technologies Pvt. Ltd. All rights reserved.
Veryx™ and PktBlaster™ are trademarks of Veryx Technologies Pvt. Ltd. All other
trademarks of respective owners are acknowledged.
This document may not be copied either in whole or in part by any means or media
without the permission of Veryx Technologies Pvt. Ltd.
THE PROGRAMS FURNISHED ARE PROVIDED ON AN "AS IS" BASIS, WITHOUT ANY
WARRANTIES OR REPRESENTATIONS EXPRESS, IMPLIED, OR STATUTORY; INCLUDING,
WITHOUT LIMITATION, WARRANTIES OF QUALITY, PERFORMANCE,
NONINFRINGEMENT, MERCHANTABILITY, OR FITNESS FOR A PARTICULAR PURPOSE.
NOR ARE THERE ANY WARRANTIES CREATED BY A COURSE OF DEALING, COURSE OF
PERFORMANCE, OR TRADE USAGE. LICENSOR DOES NOT WARRANT THAT THE
PRODUCTS WILL MEET LICENSEE'S NEEDS OR BE FREE FROM ERRORS, OR THAT THE
OPERATION OF THE PRODUCTS WILL BE UNINTERRUPTED.
Page 4

Table of Contents
1 About Pkt Blaster SDN Controller Test ..................................................... 1
Key Features .......................................................................................................................... 2
Working with PktBlaster SDN Controller Test ........................................................................ 2
User Interface ................................................................................................................. 2
Troubleshooting .............................................................................................................. 2
Reporting ........................................................................................................................ 3
SDN Controller Test Process Flow......................................................................................... 4
Intended Audience for this Guide ........................................................................................... 5
2 Getting Started ............................................................................................ 7
Log in to PktBlaster SDN Controller Test ............................................................................... 7
About the Home Screen ......................................................................................................... 8
Log out of PktBlaster SDN Controller Test ............................................................................. 9
3 Configuring an SDN Controller ................................................................ 11
Add SDN Controllers ............................................................................................................ 12
View Available SDN Controllers ........................................................................................... 14
Key features to Customize Controller View .................................................................. 15
Edit SDN Controller Details .................................................................................................. 17
Delete SDN Controller .......................................................................................................... 19
4 Configuring a Traffic Profile .................................................................... 21
Add a New Traffic Profile ...................................................................................................... 22
Type–IPV4 .................................................................................................................... 28
Type-Custom ................................................................................................................ 30
View Traffic Profiles .............................................................................................................. 31
Modify a Traffic Profile .......................................................................................................... 32
Delete a Traffic Profile .......................................................................................................... 33
5 Performance Tests .................................................................................... 35
Types of Tests ...................................................................................................................... 35
Performance Throughput ..................................................................................................... 35
Performance Latency ........................................................................................................... 35
Performance Robustness ..................................................................................................... 35
Testing Modes ...................................................................................................................... 36
Throughput Test in Normal Mode......................................................................................... 37
Throughput Test in Incremental Switch Mode ...................................................................... 37
Latency Test in Normal Mode .............................................................................................. 37
Latency Test in Incremental Switch Mode ........................................................................... 38
Configure Test Parameters .................................................................................................. 38
Step 1: Select Controller ............................................................................................... 39
Step 2: Network Configuration ...................................................................................... 40
Show Advanced Configuration ..................................................................................... 41
Step 3: Test Configuration ............................................................................................ 43
6 Test Execution Details .............................................................................. 47
View a Test in Progress ....................................................................................................... 47
View Test Results ................................................................................................................. 48
Re-execute a Test ................................................................................................................ 50
Test Fails to Complete ......................................................................................................... 51
7 Executing Throughput Tests ................................................................... 53
Throughput Test in Normal Mode......................................................................................... 53
View Test Result ........................................................................................................... 56
Page 5

Throughput Test in Incremental Switch Mode ...................................................................... 59
View Test Result ........................................................................................................... 61
8 Executing Latency Tests ......................................................................... 65
Latency Test in Normal Mode ............................................................................................... 65
View Test Result ........................................................................................................... 68
Latency Test in Incremental Switch Mode ............................................................................ 69
View Test Result ........................................................................................................... 72
9 Executing Robustness Tests ................................................................... 75
View Test Result ........................................................................................................... 78
10 Viewing and Generating Reports ............................................................ 81
View the Dashboard ............................................................................................................. 81
View Bookmarks ................................................................................................................... 82
View Throughput Report ....................................................................................................... 83
View Latency Report ............................................................................................................ 85
View Robustness Report ...................................................................................................... 87
View Individual Test Execution Report ......................................................................... 88
Search for a Report .............................................................................................................. 91
Download Report in PDF Format ......................................................................................... 93
Glossary ......................................................................................................... 95
Index ............................................................................................................... 97
Table of Figures
Figure 1: PktBlaster SDN Controller Test-Performance Benchmarking Deployment .................. 3
Figure 2: PktBlaster SDN Controller Test Login Screen .............................................................. 7
Figure 3: Home Screen ................................................................................................................ 7
Figure 4: PktBlaster SDN Controller Test Logout Screen ............................................................ 9
Figure 5: Logout Confirmation Dialog Box ................................................................................... 9
Figure 6: Controller Screen ........................................................................................................ 11
Figure 7: Add a new Controller ................................................................................................... 12
Figure 8: New Controller Added ................................................................................................. 14
Figure 9: Available Controllers ................................................................................................... 15
Figure 10: Controller Configuration Screen ................................................................................ 16
Figure 11: Controller Configuration-Customize Display ............................................................. 17
Figure 12: Controller Details ....................................................................................................... 18
Figure 13: Modify Controller Details ........................................................................................... 18
Figure 14: Delete Confirmation Dialog Box ................................................................................ 19
Figure 15: Traffic Profile Screen ................................................................................................. 21
Figure 16: Add a New Traffic Profile........................................................................................... 22
Figure 17: Traffic Profile-Type IPV4 ........................................................................................... 28
Figure 18: Traffic Profile-TCP/UDP ............................................................................................ 29
Figure 19: Traffic Profile-L3 Custom........................................................................................... 30
Figure 20: Traffic Profile-Ether Type Custom ............................................................................. 31
Figure 21: View Traffic Profile .................................................................................................... 32
Figure 22: Edit a Traffic Profile ................................................................................................... 33
Figure 23: Traffic Profile Details ................................................................................................. 34
Figure 24: Delete Confirmation Dialog Box ................................................................................ 34
Figure 25: Performance Screen ................................................................................................. 39
Figure 26: Select Controller Pane .............................................................................................. 39
Page 6

Figure 27: Network Configuration Pane ..................................................................................... 40
Figure 28: Advanced Configuration ............................................................................................ 42
Figure 29: Switch Capabilities OF Version 1.0 and 1.3 ............................................................. 42
Figure 30: Test Configuration Pane ........................................................................................... 43
Figure 31: Test Execution in Progress (Upper) .......................................................................... 47
Figure 32: Test Execution in Progress (Lower) .......................................................................... 48
Figure 33: Test Results-Configuration Details ........................................................................... 49
Figure 34: Test Results-Graph ................................................................................................... 49
Figure 35: Test Results-Table .................................................................................................... 50
Figure 36: Re-execute Test ........................................................................................................ 51
Figure 37: Test Configuration-Throughput Test Mode ............................................................... 54
Figure 38: Throughput Normal Mode (Upper) ............................................................................ 55
Figure 39: Throughput Normal Mode (Lower) ............................................................................ 56
Figure 40: Throughput Normal Result-Graph ............................................................................. 57
Figure 41: Throughput Normal Result-Table .............................................................................. 58
Figure 42: Test Configuration- Throughput Incremental Switch Mode ...................................... 59
Figure 43: Throughput Incremental Switch Mode (Upper) ......................................................... 60
Figure 44: Throughput Incremental Switch Mode (Lower) ......................................................... 61
Figure 45: Throughput Incremental Switch Result-Graph .......................................................... 62
Figure 46: Throughput Incremental Switch Result-Table ........................................................... 63
Figure 47: Test Configuration-Latency Normal Mode ................................................................ 66
Figure 48: Latency Normal Mode (Upper) .................................................................................. 67
Figure 49: Latency Normal Mode (Lower) .................................................................................. 67
Figure 50: Latency Normal Result .............................................................................................. 68
Figure 51: Latency Normal Table Report ................................................................................... 69
Figure 52: Test Configuration-Latency Incremental Switch Mode ............................................. 70
Figure 53: Latency Incremental Switch Mode (Upper) ............................................................... 71
Figure 54: Latency Incremental Switch Mode (Lower) ............................................................... 72
Figure 55: Latency Incremental Switch Result ........................................................................... 72
Figure 56: Latency Incremental Switch Table Result ................................................................. 73
Figure 57: Robustness Flow Mod Test Configuration ................................................................ 76
Figure 58: Robustness Flow Mod Result Report (Upper) .......................................................... 77
Figure 59: Robustness Flow Mod Result Report (Lower) .......................................................... 78
Figure 60: Robustness Flow Mod Graph Result ........................................................................ 78
Figure 61: Result Table Report .................................................................................................. 79
Figure 62: Dashboard ................................................................................................................. 81
Figure 63: Bookmarks Pane ....................................................................................................... 82
Figure 64: Execution History Pane ............................................................................................. 83
Figure 65: Throughput Summary Report (Upper) ...................................................................... 84
Figure 66: Throughput Summary Report (Lower) ...................................................................... 84
Figure 67: Execution History Pane ............................................................................................. 85
Figure 68: Latency Summary Report (Upper) ............................................................................ 86
Figure 69: Latency Summary Report (Lower) ............................................................................ 86
Figure 70: Execution History Pane ............................................................................................. 87
Figure 71: Robustness Summary Report (Upper) ..................................................................... 88
Figure 72: Robustness Summary Report (Lower) ..................................................................... 88
Figure 73: Execution History-Individual Test Results ................................................................ 89
Figure 74: Test Execution Results (Upper) ................................................................................ 90
Figure 75: Test Execution Results (Lower) ................................................................................ 90
Figure 76: Reports Screen ......................................................................................................... 91
Figure 77: Search Options ......................................................................................................... 92
Figure 78: Report-Specific Period .............................................................................................. 92
Figure 79: Download Report ...................................................................................................... 93
Figure 80: PDF Report ............................................................................................................... 94
Page 7

Page 8

Copyright © Veryx Technologies Pvt. Ltd.
1
1 ABOUT PKT BLASTER SDN
CONTROLLER TEST
PktBlaster SDN Controller Test is the industry’s first integrated test solution for
benchmarking the performance of an SDN controller as well as emulating SDN
networks in a single box. It supports a number of real-world application traffic for
performance testing and emulation. It runs either on a Veryx hardware platform or
on suitable commodity servers.
PktBlaster SDN Controller Test solution consists of two product components that
are licensed separately:
Network Emulator and
Performance Benchmarking
PktBlaster SDN Controller Test-Performance Benchmarking simulates up-to one
thousand switches and millions of nodes and thereby significantly reduces
dependency on large-scale physical network infrastructure for testing and
benchmarking SDN controllers.
Some of the performance benchmarking capabilities include:
Throughput and Robustness measurement – per second
Latency measurement – in milliseconds
Detailed Tx/Rx statistics of switch group network per iteration
Comprehensive reporting and analysis
PktBlaster SDN Controller Test – Network Emulator is available separately and it
supports real-time emulation of large-scale SDN networks. Some of the emulation
capabilities supported include:
Emulation of upto 100 SDN devices and upto 100 endpoints with millions of
flows
Generation of multiple traffic flows from a single simulated port.
Supports network flow path tracing and network failure simulation.
Detailed traffic and flow statistics.
P a g e | 11
Page 9

2
PktBlaster SDN Controller Test-Performance Benchmarking User Guide
Copyright © Veryx Technologies Pvt. Ltd.
For more details, please refer to the PktBlaster SDN Controller Test Network
Emulator User Guide.
Key Features
The following are some of the key features of PktBlaster SDN Controller Test for
performance benchmarking:
Measurement of Performance Throughput, Latency and Robustness:
For OpenFlow versions 1.0, 1.3 or both
Uses TCP connection mode
Programmatic Support (REST API)
Comprehensive Reporting and Analysis
Working with PktBlaster SDN Controller Test
PktBlaster SDN Controller Test runs either on Veryx Hardware or on standard
commodity servers. The platform allows easy configuration of controllers and
supports easy web-based access.
User Interface
PktBlaster SDN Controller Test supports user friendly GUI for configuration and
testing. Also, PktBlaster SDN Controller GUI supports creation of various real-world
application data for testing the performance and functionality.
Troubleshooting
PktBlaster SDN Controller Test provides extensive debugging options at multiple
levels. It provides detailed statistics of the requests and responses for a test run for
quick identification of problem root cause.
Page 10
3
Copyright © Veryx Technologies Pvt. Ltd.
About Pkt Blaster SDN Controller Test
Reporting
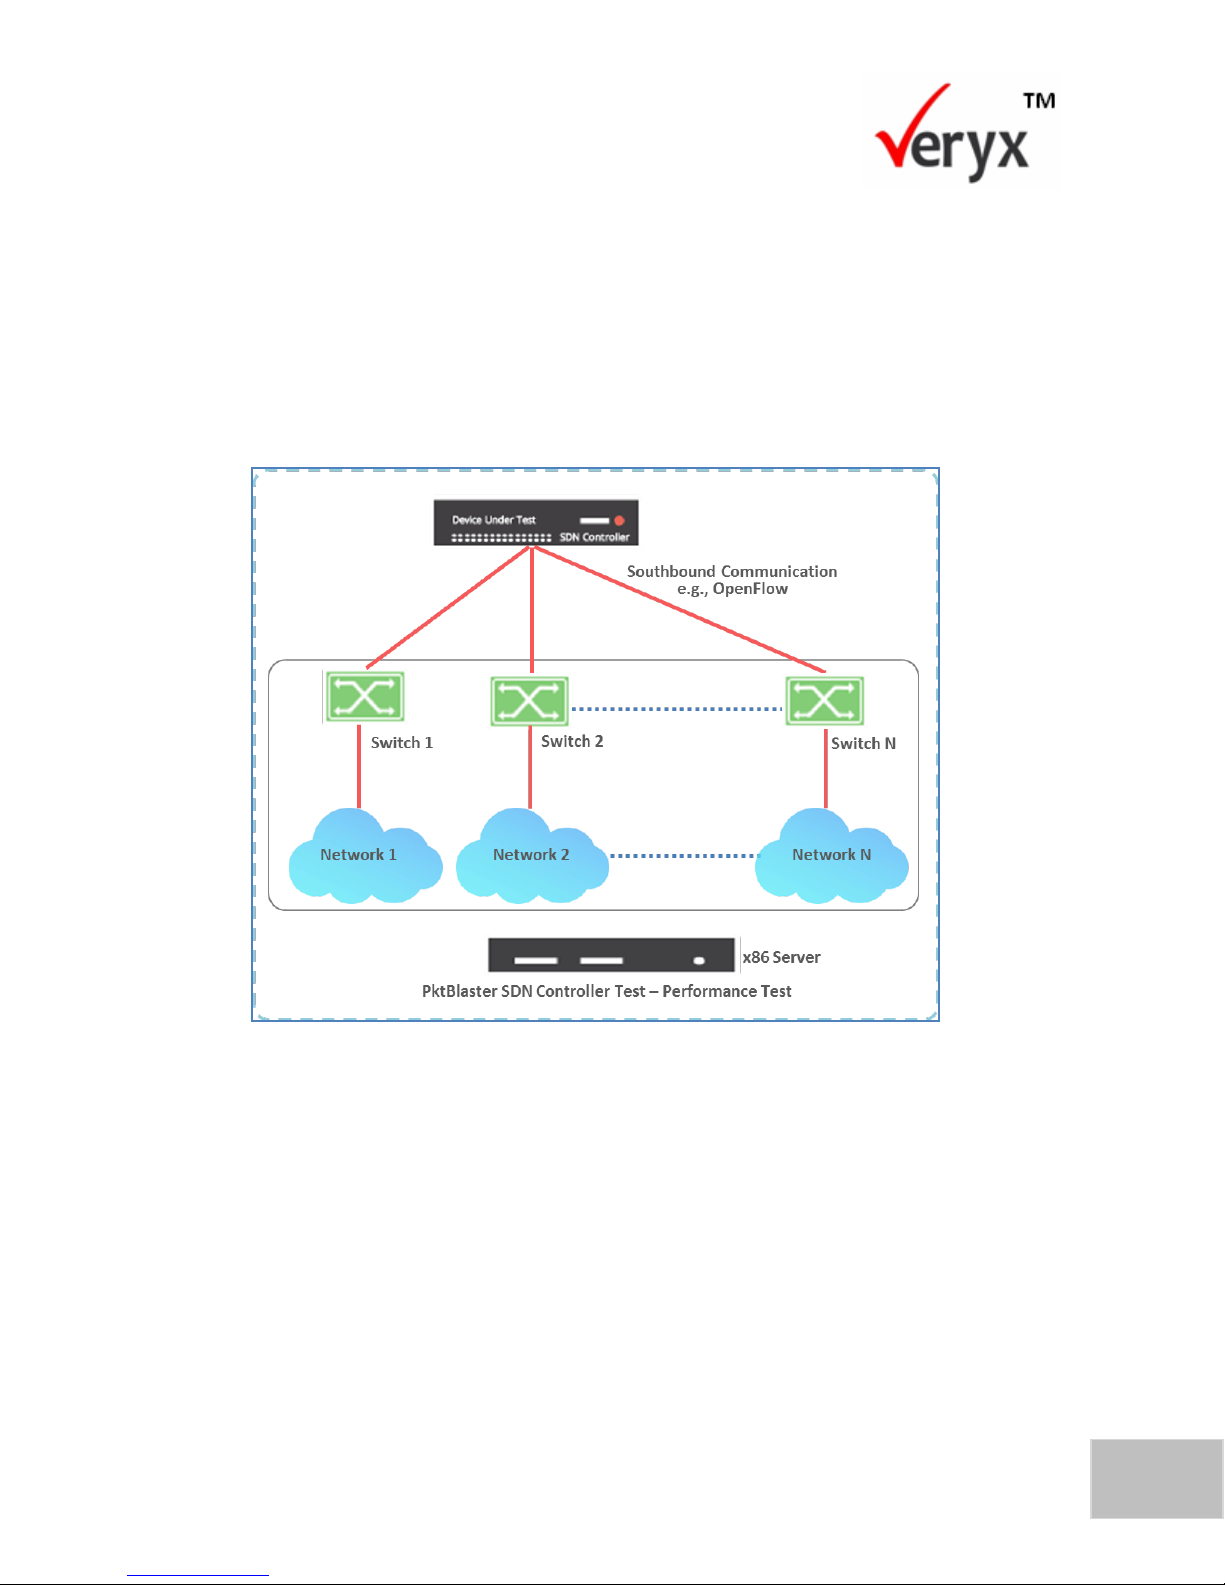
PktBlaster SDN Controller Test report provides comprehensive insight on controller
metrics such as flow set-up rate and flow set-up time in the form of graphs.
The individual test report provides OF connection time and detailed statistics of
switch group network.
Figure 1: PktBlaster SDN Controller Test-Performance Benchmarking Deployment
Page 11
4
PktBlaster SDN Controller Test-Performance Benchmarking User Guide
Copyright © Veryx Technologies Pvt. Ltd.
SDN Controller Test Process Flow
This user guide enables users to:
Configure controllers and test parameters in PktBlaster SDN Controller Test
Execute tests to measure the performance of controllers
The process flow to configure and execute performance tests is depicted in the
following diagrams.
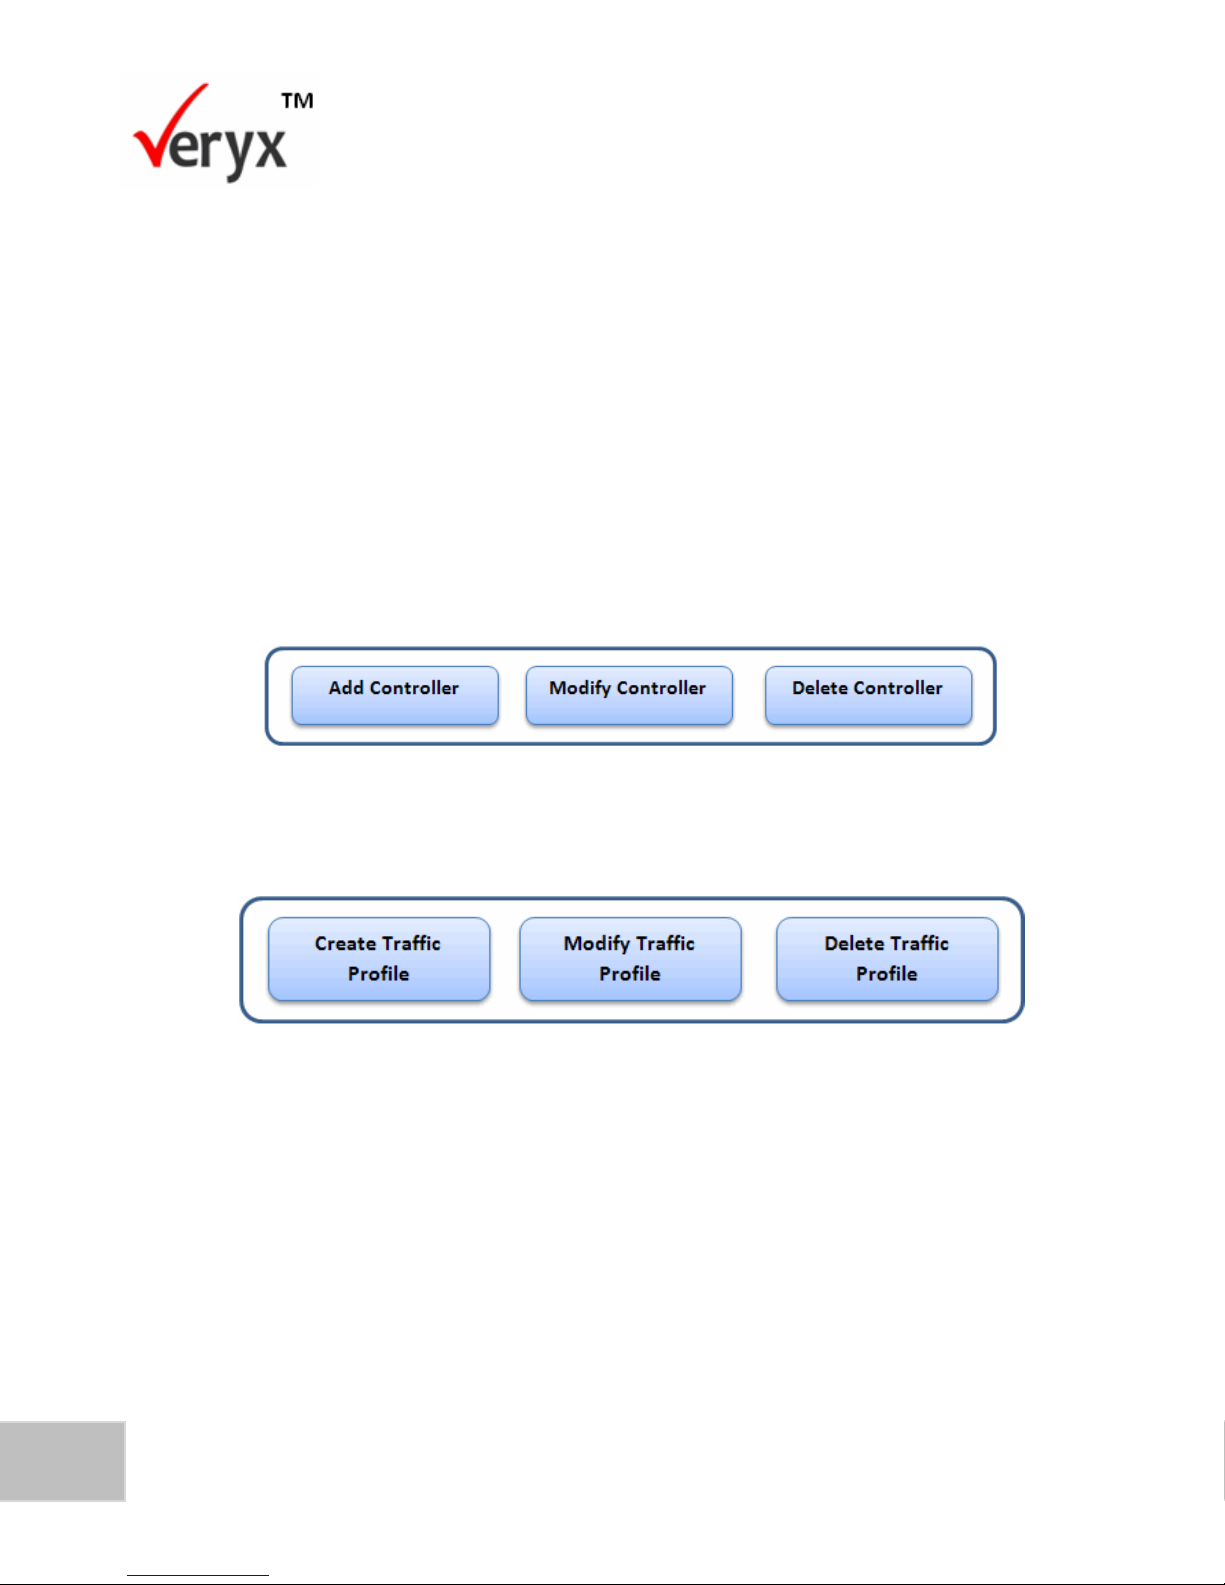
Configure Controller
It is possible to add, modify, and delete a controller when needed.
Configure Traffic Profile
It is possible to create, modify, and delete a traffic profile when needed.
Page 12
5
Copyright © Veryx Technologies Pvt. Ltd.
About Pkt Blaster SDN Controller Test
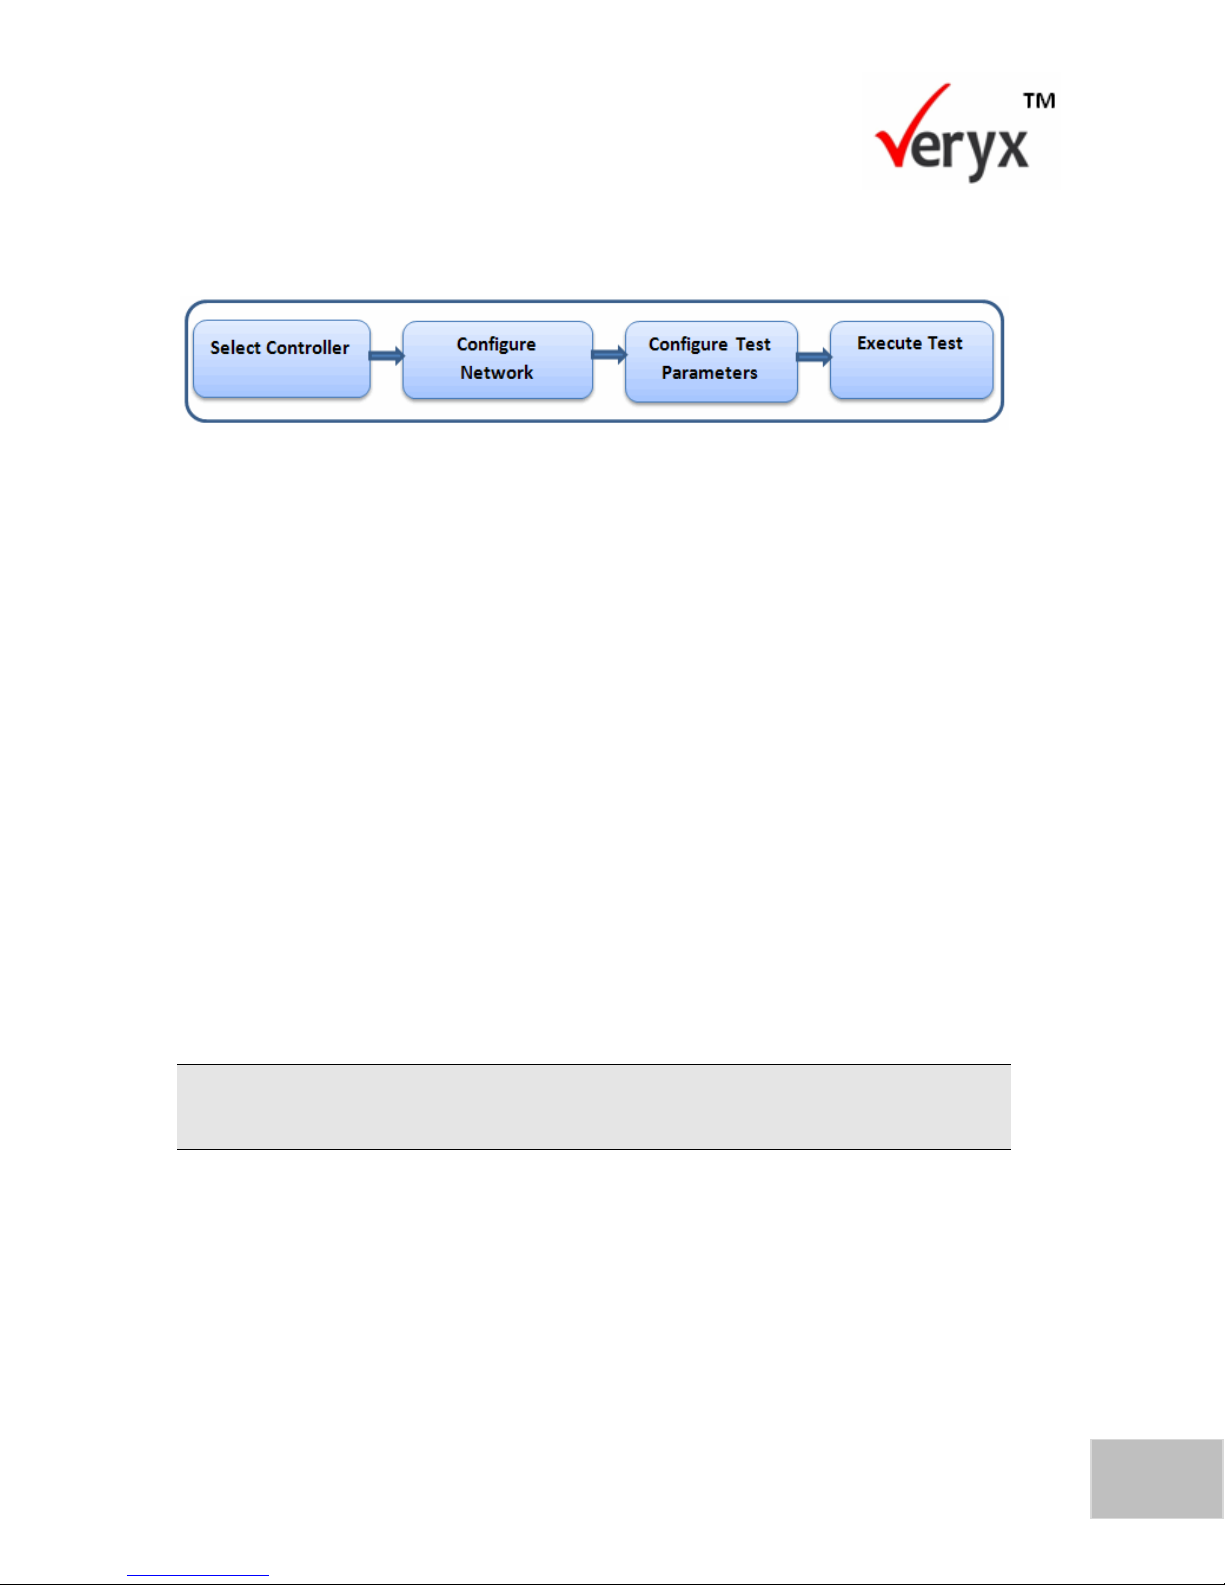
Execute Test
The procedure to execute a test involves the following phases.
Intended Audience for this Guide
This guide is intended to help the following categories of users who need to perform
testing of SDN Controllers.
Equipment Vendors
Development Testing
QA Testing
Service Providers
Proof of Concept
Acceptance Testing
Enterprise IT
Piloting
Benchmarking
A user can configure multiple controllers. However, the current version only allows one
controller to be tested at a time.
Page 13

6
PktBlaster SDN Controller Test-Performance Benchmarking User Guide
Copyright © Veryx Technologies Pvt. Ltd.
This page has been intentionally left blank.
Page 14
Copyright © Veryx Technologies Pvt. Ltd.
7
2 GETTING STARTED
This chapter describes how to log in to PktBlaster SDN Controller Test and access the
features.
Log in to PktBlaster SDN Controller Test
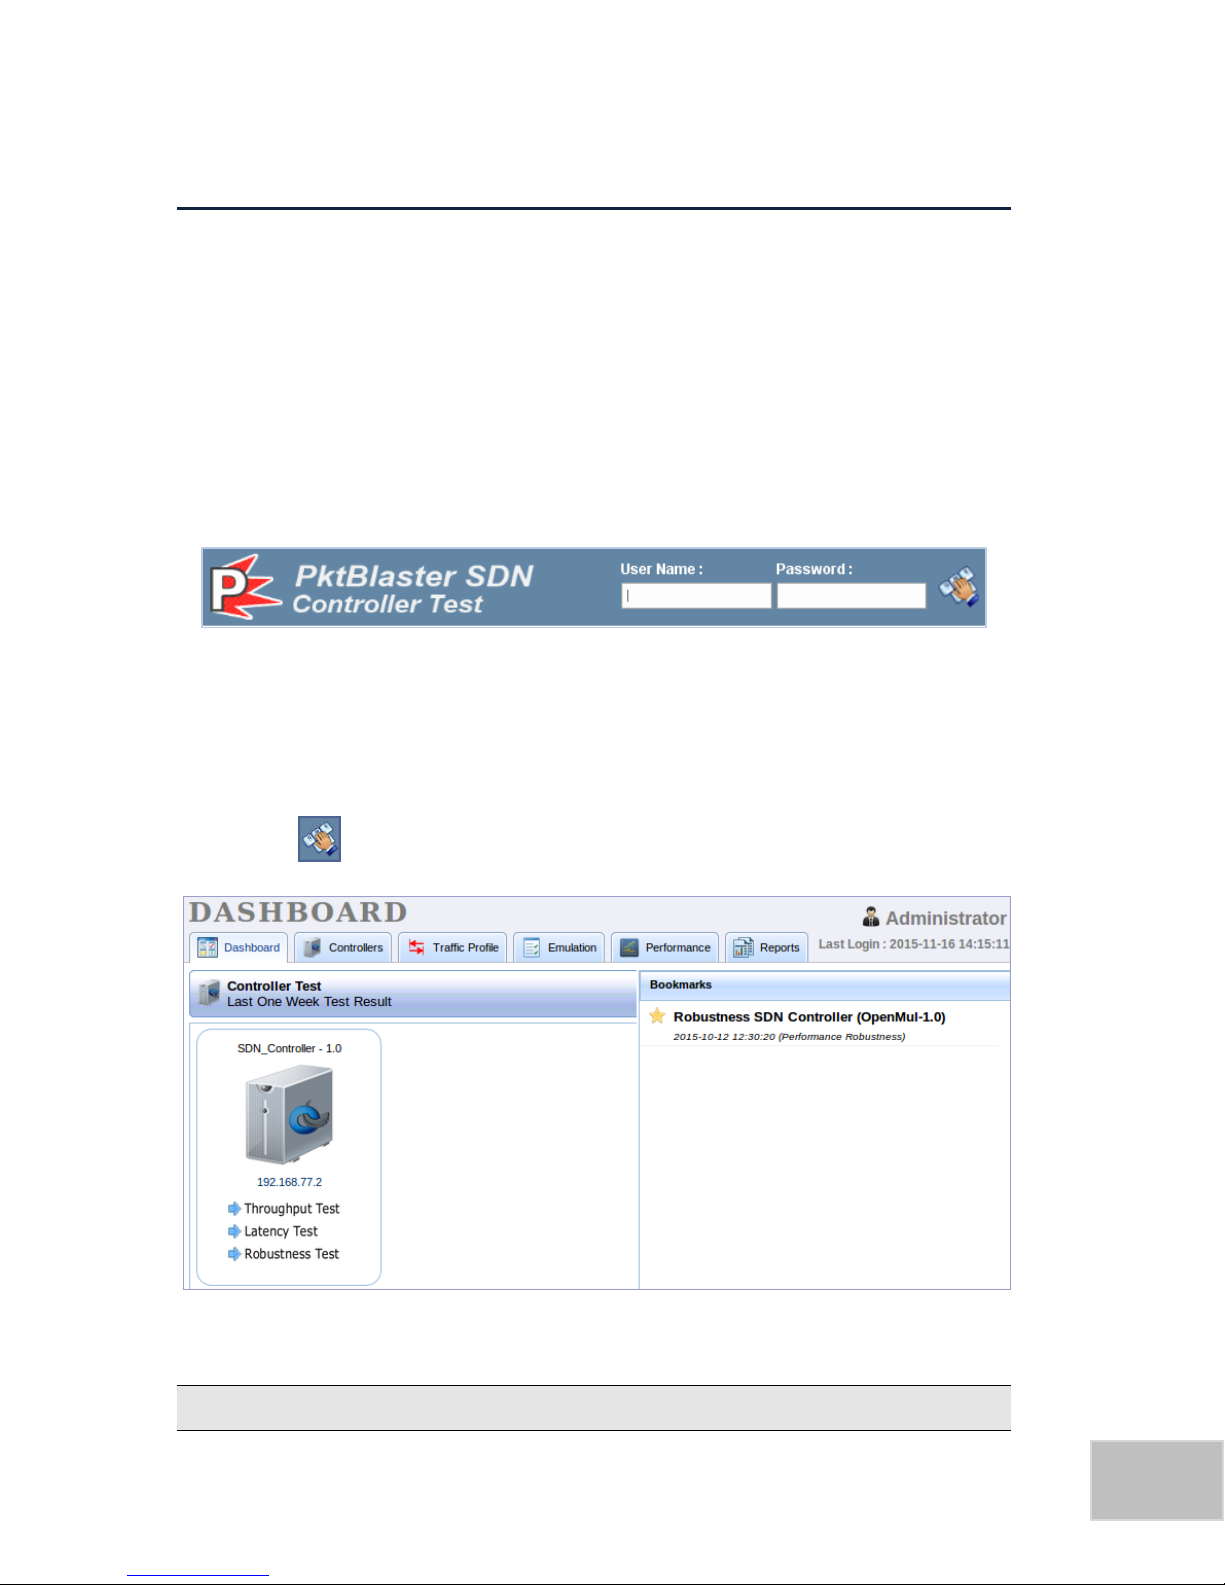
To log in to PktBlaster SDN Controller Test,
1. Type the PktBlaster SDN Controller Test IP address in the address bar of the
browser. The PktBlaster SDN Controller Test Login screen is displayed.
Figure 2: PktBlaster SDN Controller Test Login Screen
2. Enter the user name in the User Name text box.
3. Enter the password in the Password text box.
4. Click . On successful authentication, the Home screen is displayed.
In a new installation, the default User Name is admin and the Password is admin.
P a g e | 77
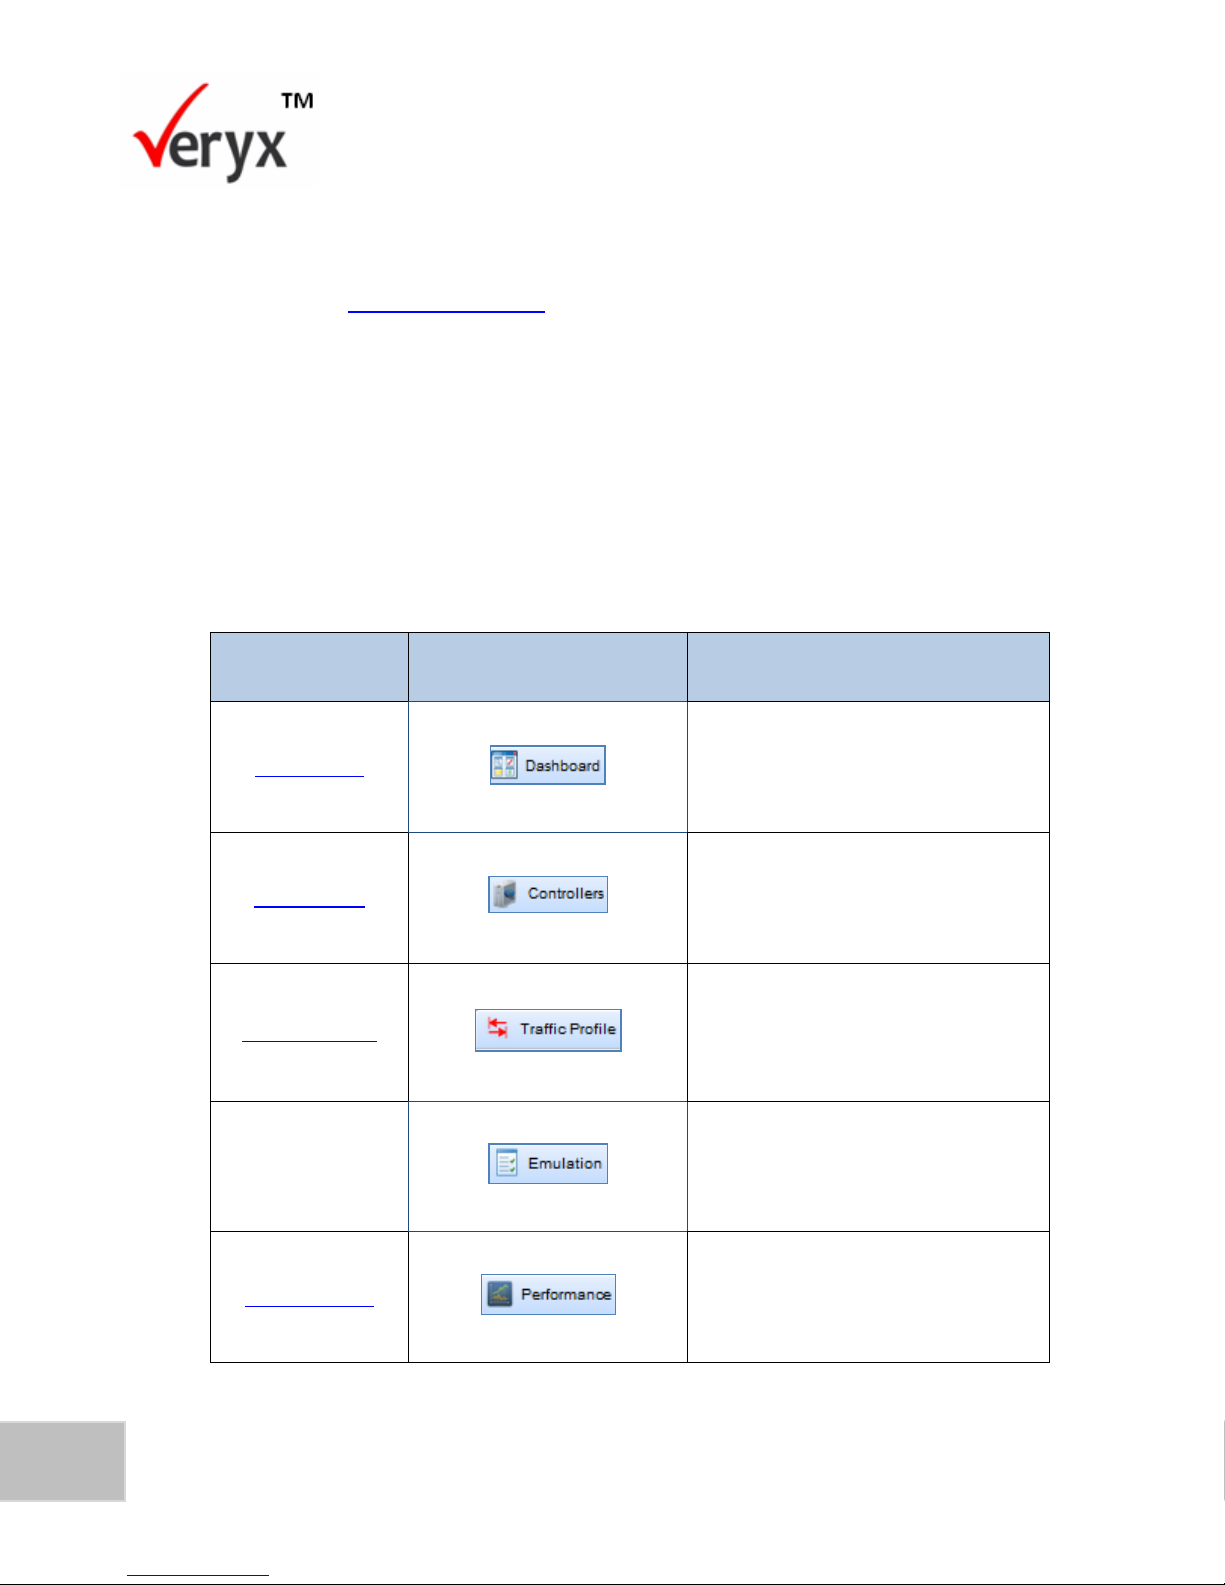
Figure 3: Home Screen
Page 15
8
PktBlaster SDN Controller Test-Performance Benchmarking User Guide
Copyright © Veryx Technologies Pvt. Ltd.
MODULE
TAB
THIS WHERE YOU CAN
Dashboard
View the status of controller tests
that were performed in the
previous week.
Controllers
Add new controller information.
Modify and delete existing
controller information.
Traffic Profile
Add a new traffic profile.
Modify and delete an existing
traffic profile.
Emulation
Execute Emulation tests.
Performance
Configure and execute
Performance tests.
In a new installation, no data is displayed in the Dashboard. After the tool has been
used to test controllers, a dashboard showing the results of testing is displayed (as
shown in the View the Dashboard section).
About the Home Screen
The tabs in the PktBlaster SDN Controller Test allow testers to configure and
perform tasks related to setting up and executing tests. The following table shows
the tabs that you will see in the Home screen (Figure 3). To learn more about a
module, click on the corresponding link.
Table 1: Home Screen Tabs
Page 16
9
Copyright © Veryx Technologies Pvt. Ltd.
Getting Started
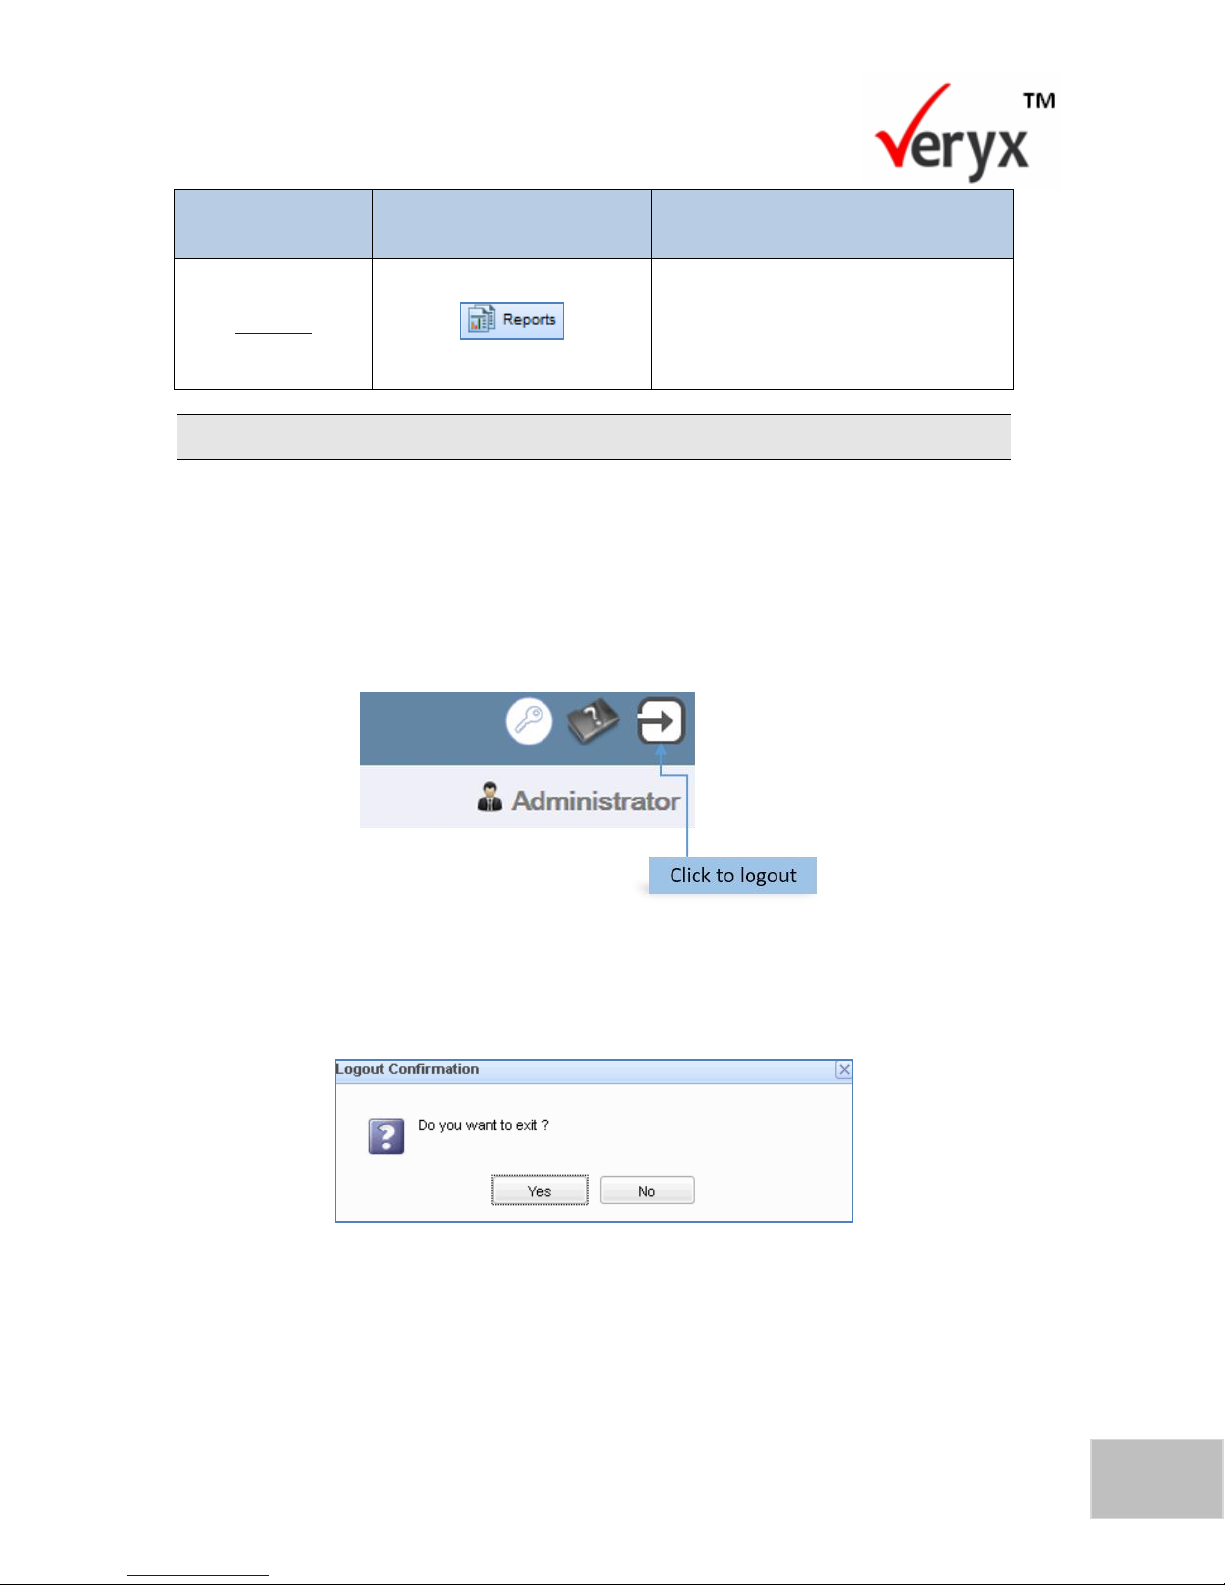
MODULE
TAB
THIS WHERE YOU CAN
Reports
View reports of selected tests and
generate reports for a specific
period.
The Emulation tab is disabled if the Emulation Test feature has not been installed.
Log out of PktBlaster SDN Controller Test
To exit from PktBlaster SDN Controller Test:
1. Click the Logout icon that is displayed above the user information as shown
in the PktBlaster SDN Controller Test-Logout screen.
Figure 4: PktBlaster SDN Controller Test Logout Screen
The Logout Confirmation dialog box is now displayed.
Figure 5: Logout Confirmation Dialog Box
2. Click Yes to log out of PktBlaster SDN Controller Test.
Page 17

10
PktBlaster SDN Controller Test-Performance Benchmarking User Guide
Copyright © Veryx Technologies Pvt. Ltd.
This page has been intentionally left blank.
Page 18
Copyright © Veryx Technologies Pvt. Ltd.
11
3 CONFIGURING AN SDN CONTROLLER
This chapter describes how you can configure a SDN controller in PktBlaster SDN
Controller Test.
An SDN controller can be tested for performance throughput, latency and
robustness. To perform these tests, you need to add the controller to the tool and
the controller parameters need to be configured.
To test the performance of a controller,
The controller needs to be connected to the network
The controller should be reachable through the port of the tool
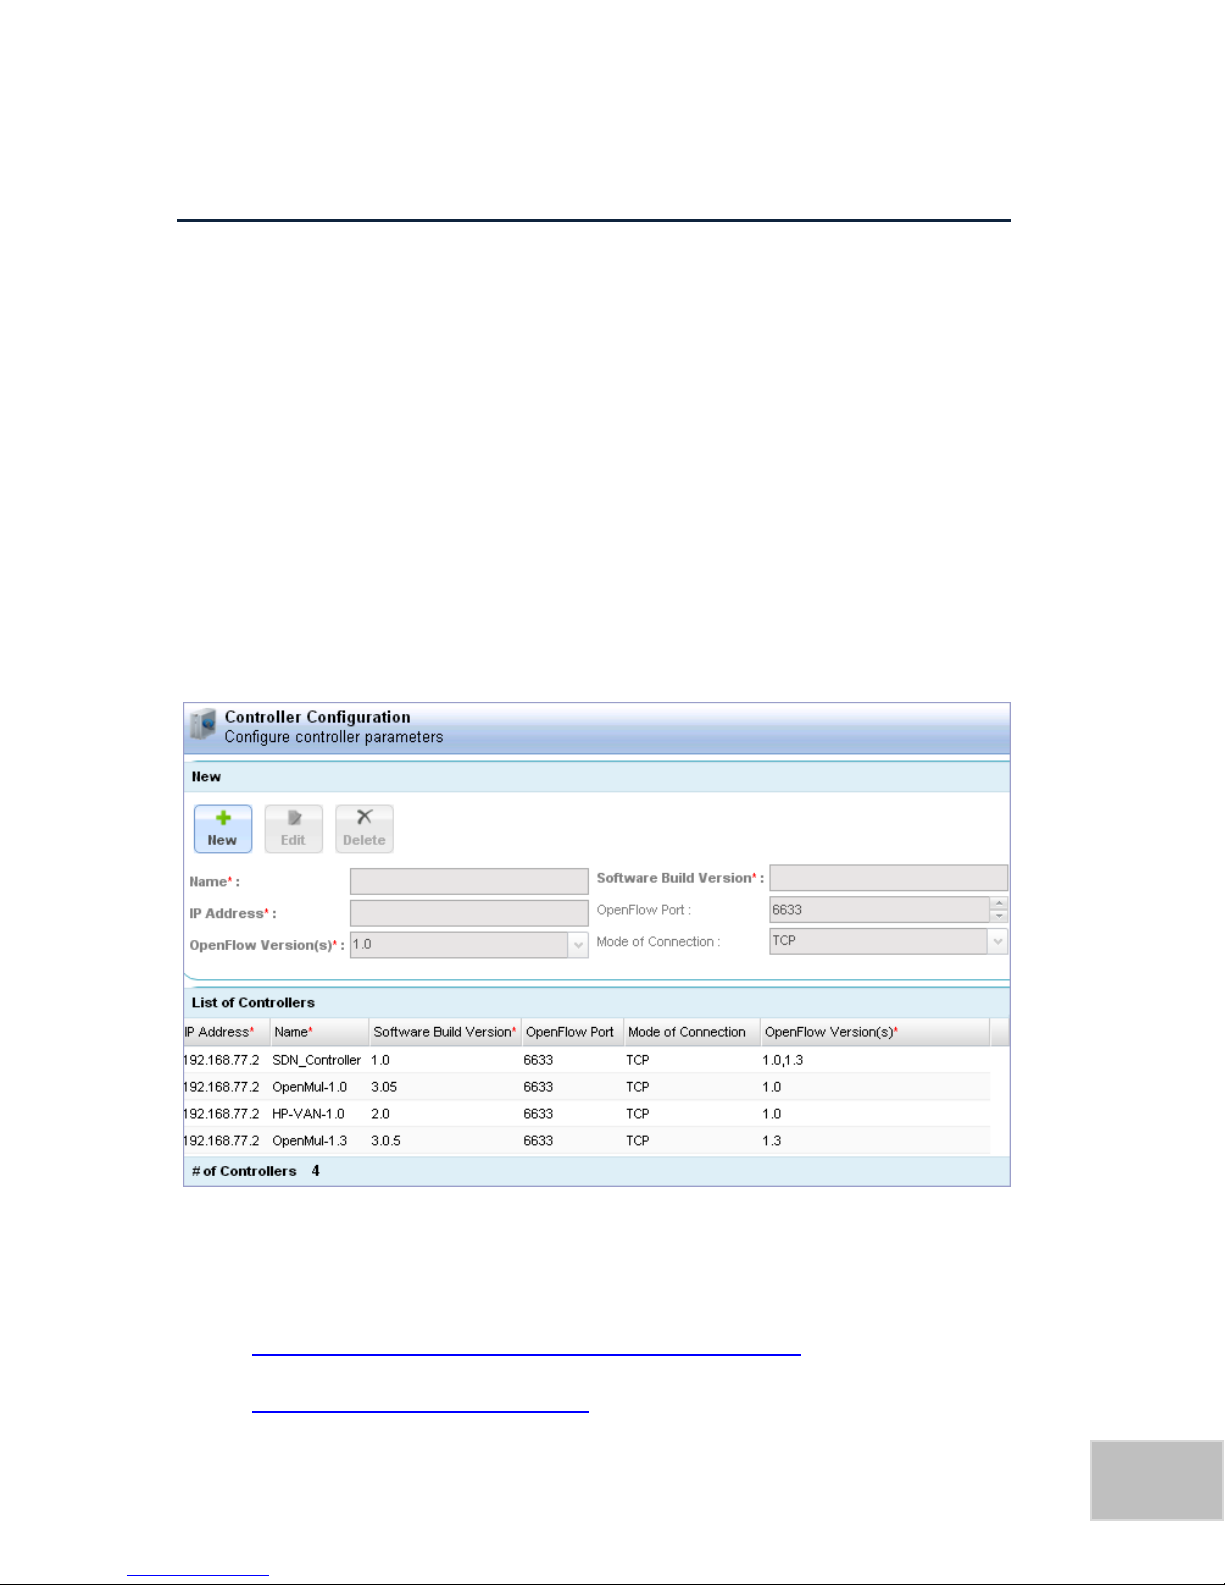
To configure the parameters of a controller, click the Controllers tab. The
Controllers screen is now displayed.
In the Controllers screen, you can:
View the details of the controllers that have been added
Add the profile of a new controller
P a g e | 1111
Figure 6: Controller Screen
Page 19

12
PktBlaster SDN Controller Test-Performance Benchmarking User Guide
Copyright © Veryx Technologies Pvt. Ltd.
Modify the parameters of an existing controller
Remove a controller
Add SDN Controllers
To add a new test controller,
1. In the Controllers screen, click . The Add a New Controller screen
(Figure 7) is now displayed.
Figure 7: Add a new Controller
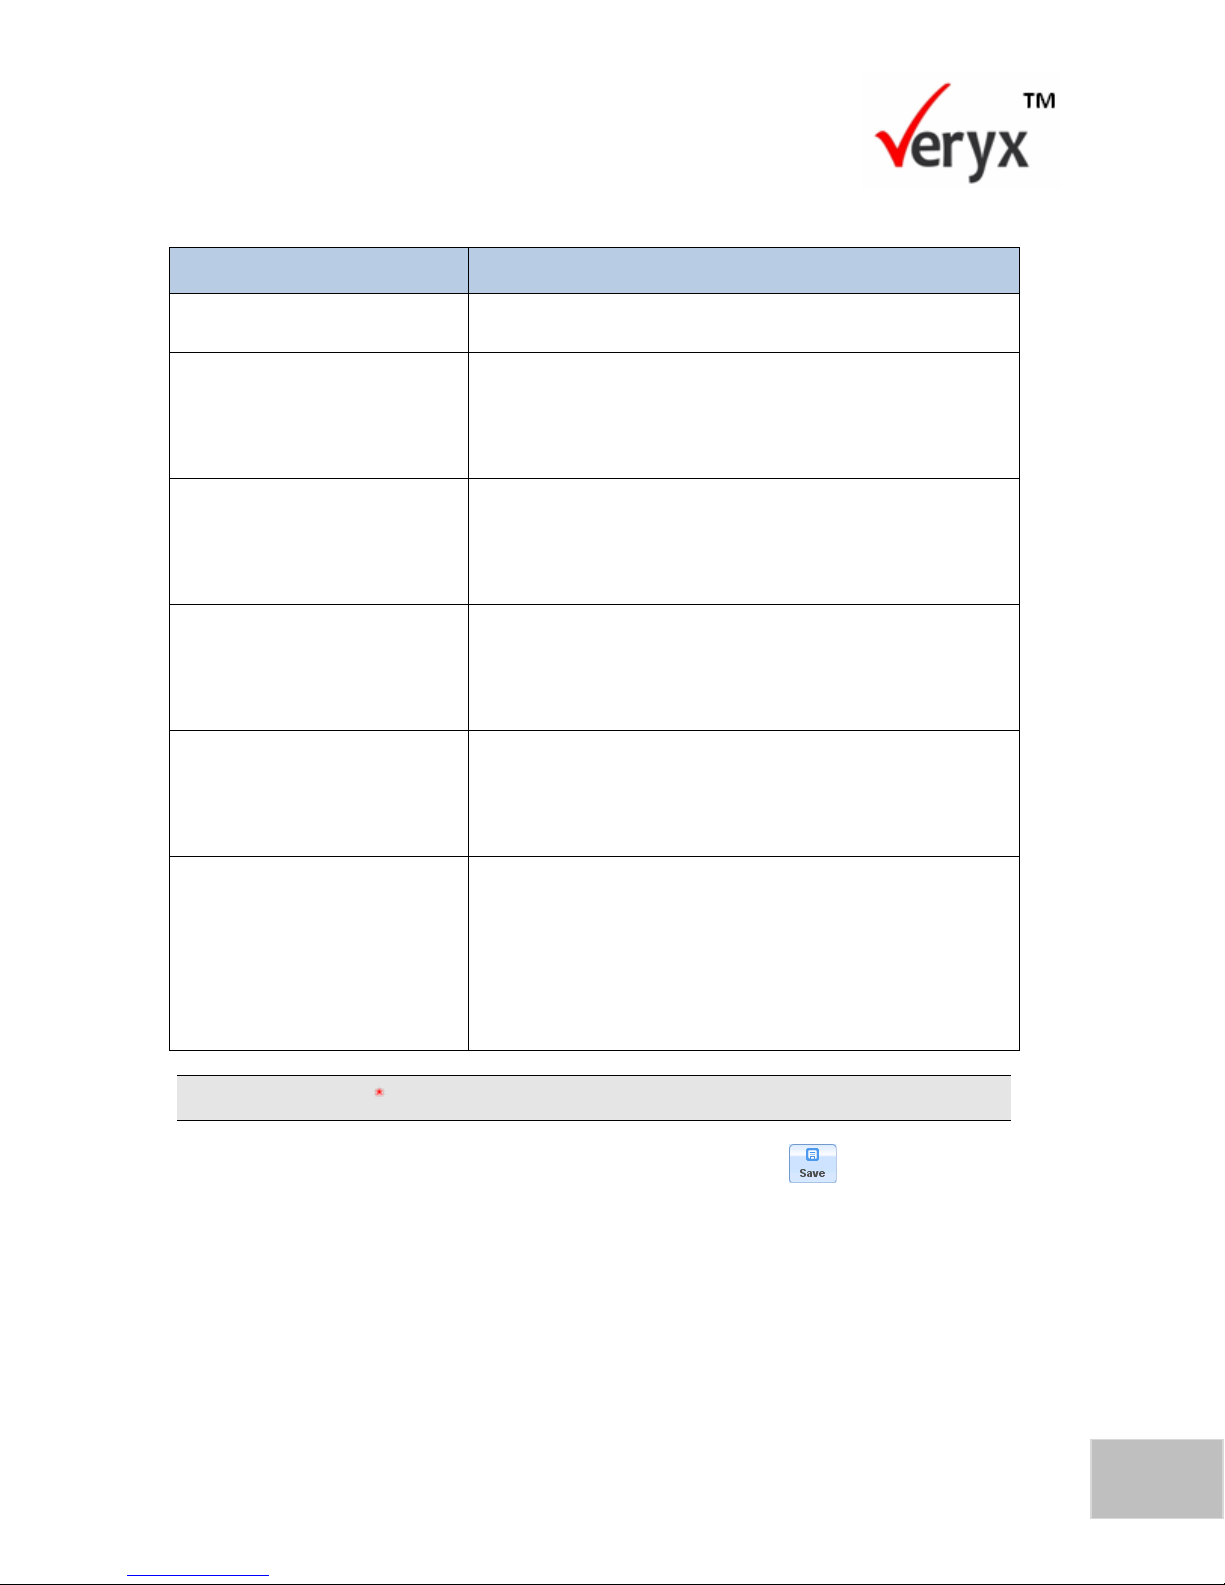
The fields in the Add a New Controller screen are described in the following table.
Page 20
Configuring an SDN Controller
13
Copyright © Veryx Technologies Pvt. Ltd.
FIELD NAME
DESCRIPTION
Name
Controller name
Software Build Version
The version number that relates to the date and time
of the build (in this case the build version of the
controller that is tested).
IP Address
The IP Address of the server where the controller is
installed (the controller runs its applications on this
server).
Controller Port
The port number at which the controller listens. The
default port number is 6633. This can be set to a
maximum value of 65535.
Mode of Connection
The mode of connectivity between the switches and
the controller. The TCP connection mode is
supported.
Open Flow Version
The version number of the OpenFlow protocol
(protocol used by the SDN controller to communicate
with the switches) that is supported by the controller.
The protocol versions supported are 1.0, 1.3 and both
versions (1.0, 1.3).
Table 2: Add a New Controller Fields
All fields that have an beside them are mandatory.
2. After you have entered the relevant information, click to save the
controller details
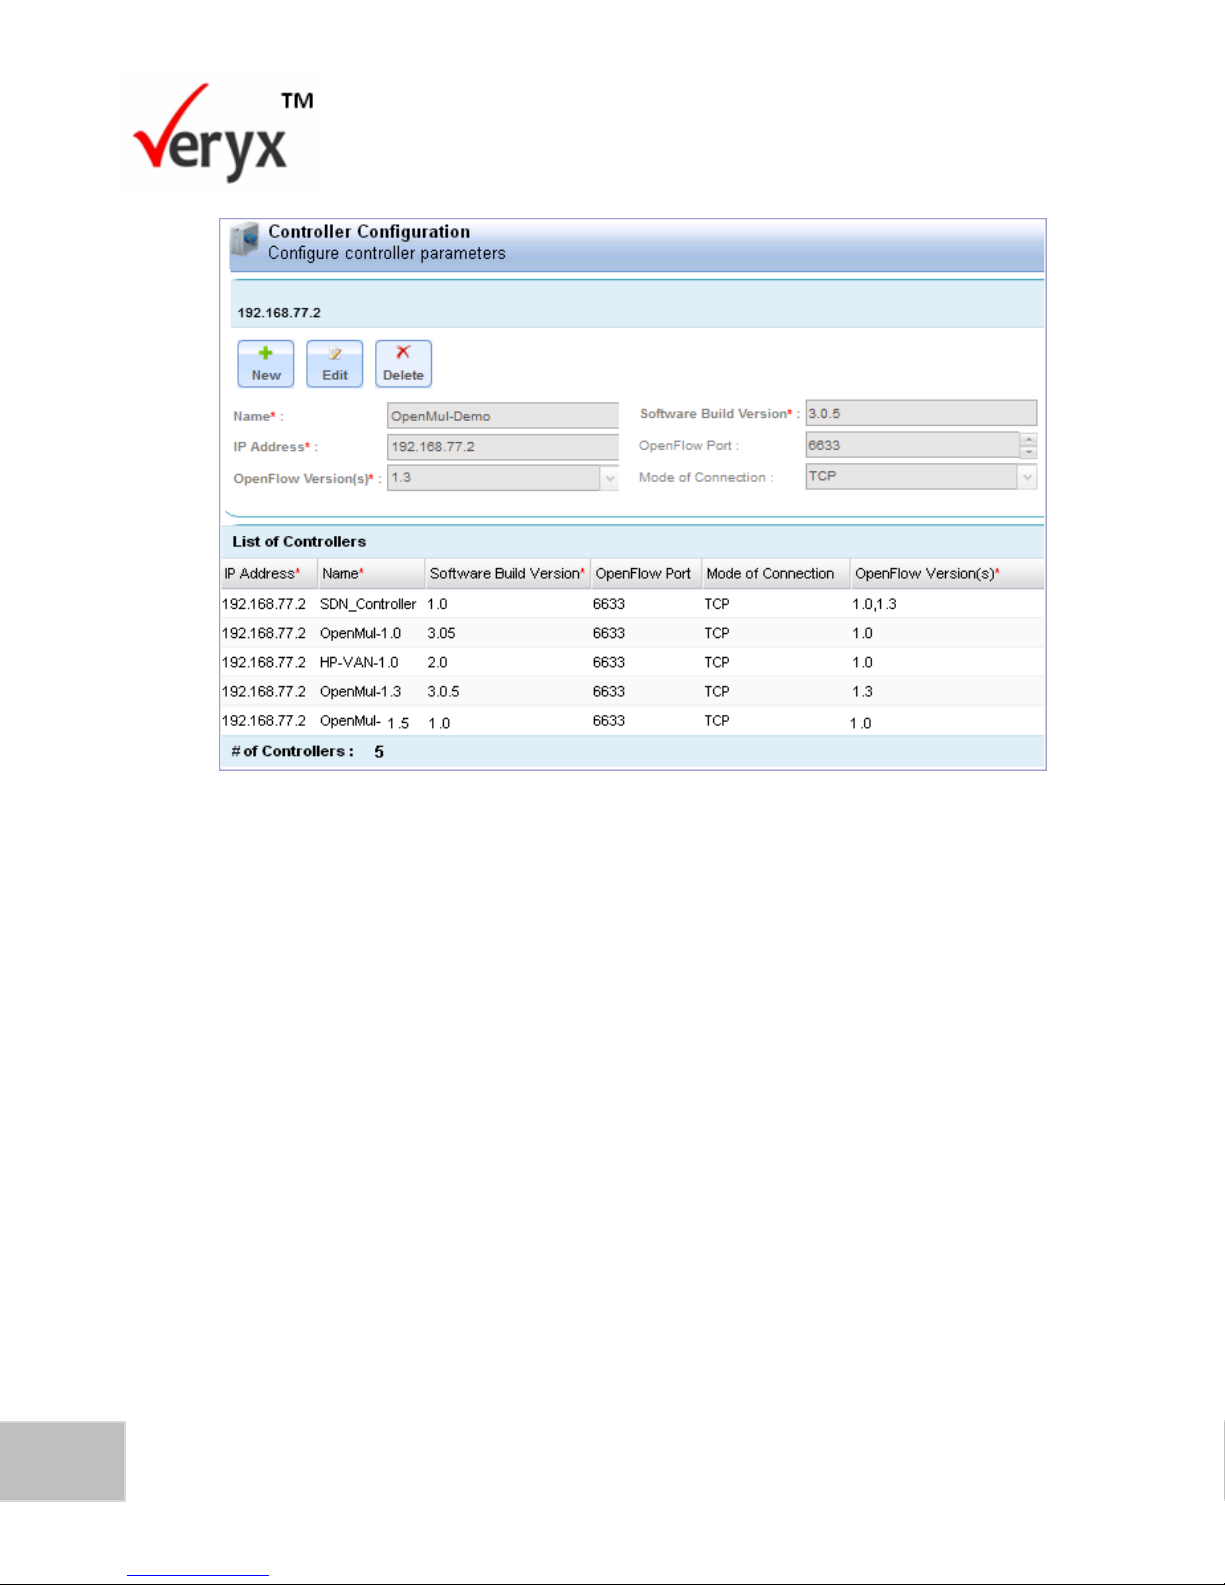
The new controller is now added to the tool as shown in Figure 8.
Page 21
14
PktBlaster SDN Controller Test-Performance Benchmarking User Guide
Copyright © Veryx Technologies Pvt. Ltd.
Figure 8: New Controller Added
View Available SDN Controllers
To view a list of available controllers, in the Home screen, click the Controllers tab.
The Available Controllers screen is now displayed.
Page 22
Configuring an SDN Controller
15
Copyright © Veryx Technologies Pvt. Ltd.
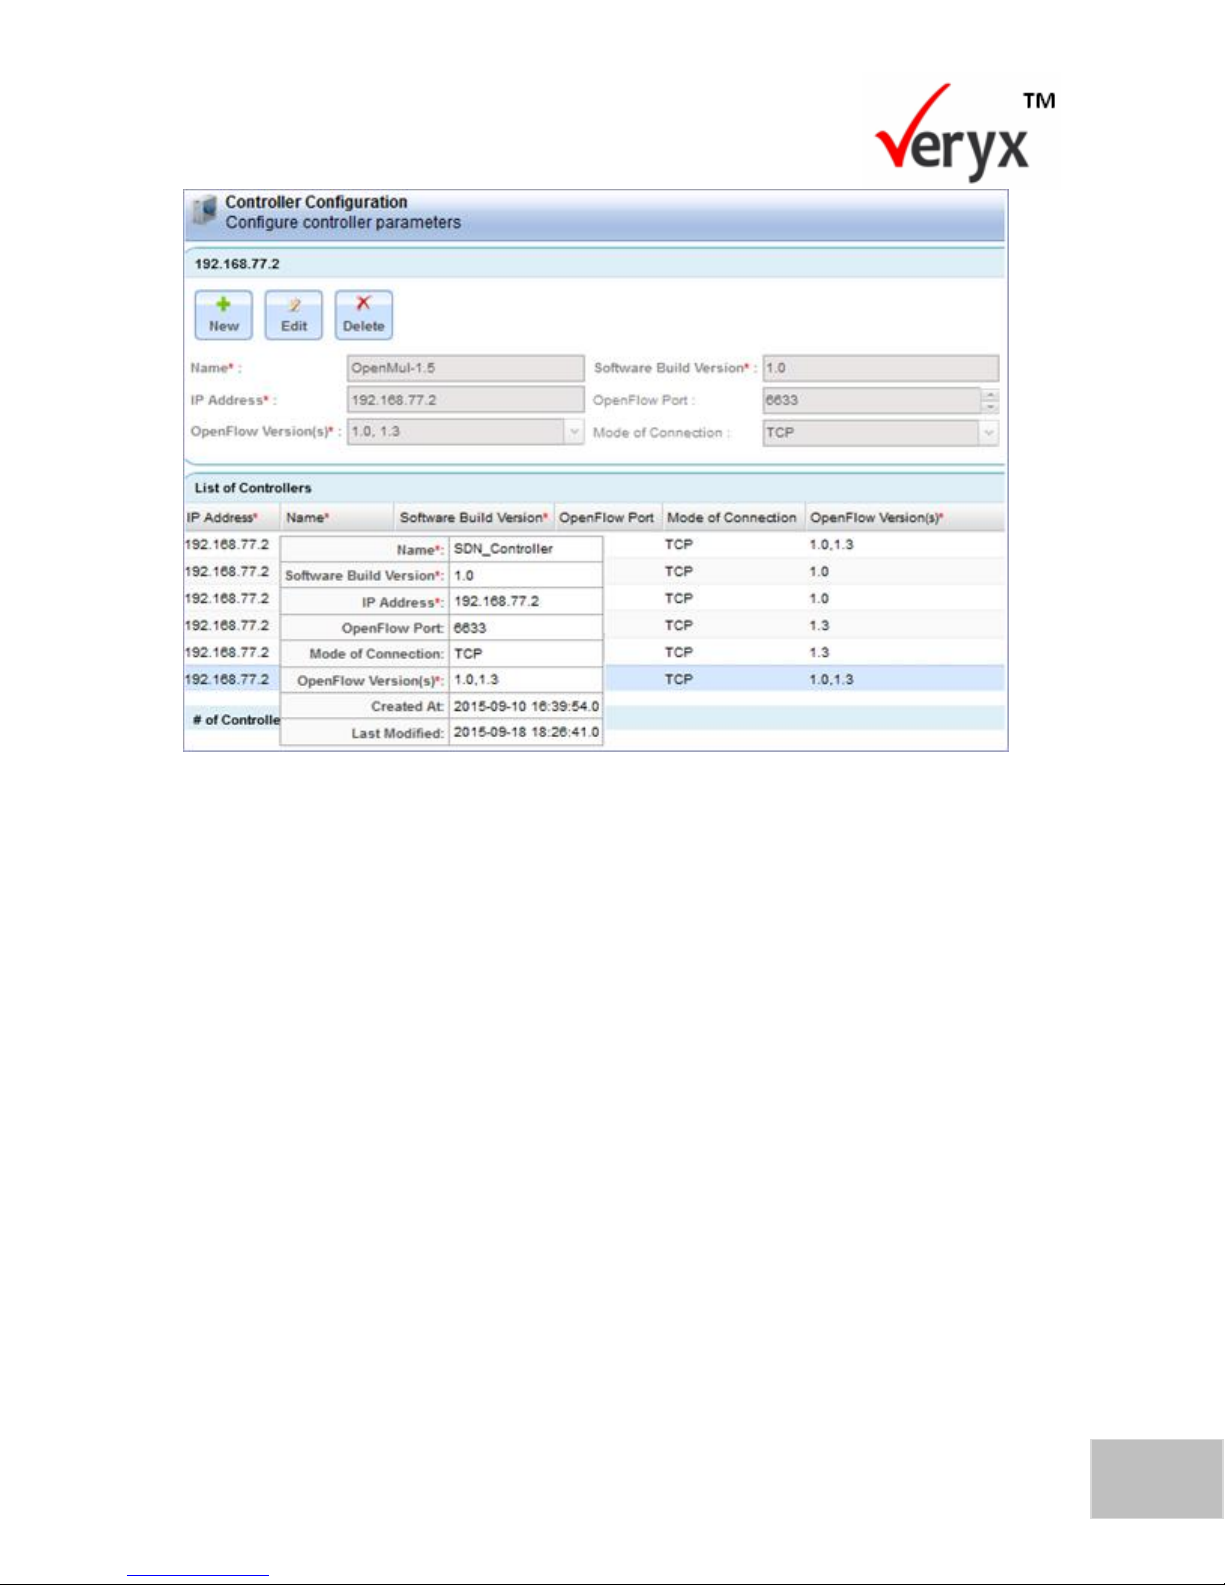
Figure 9: Available Controllers
To view the details of a controller, point to the controller with your cursor. The
details of the controller are now displayed in a pop-up as shown in the Available
Controllers screen (Figure 9).
Key features to Customize Controller View
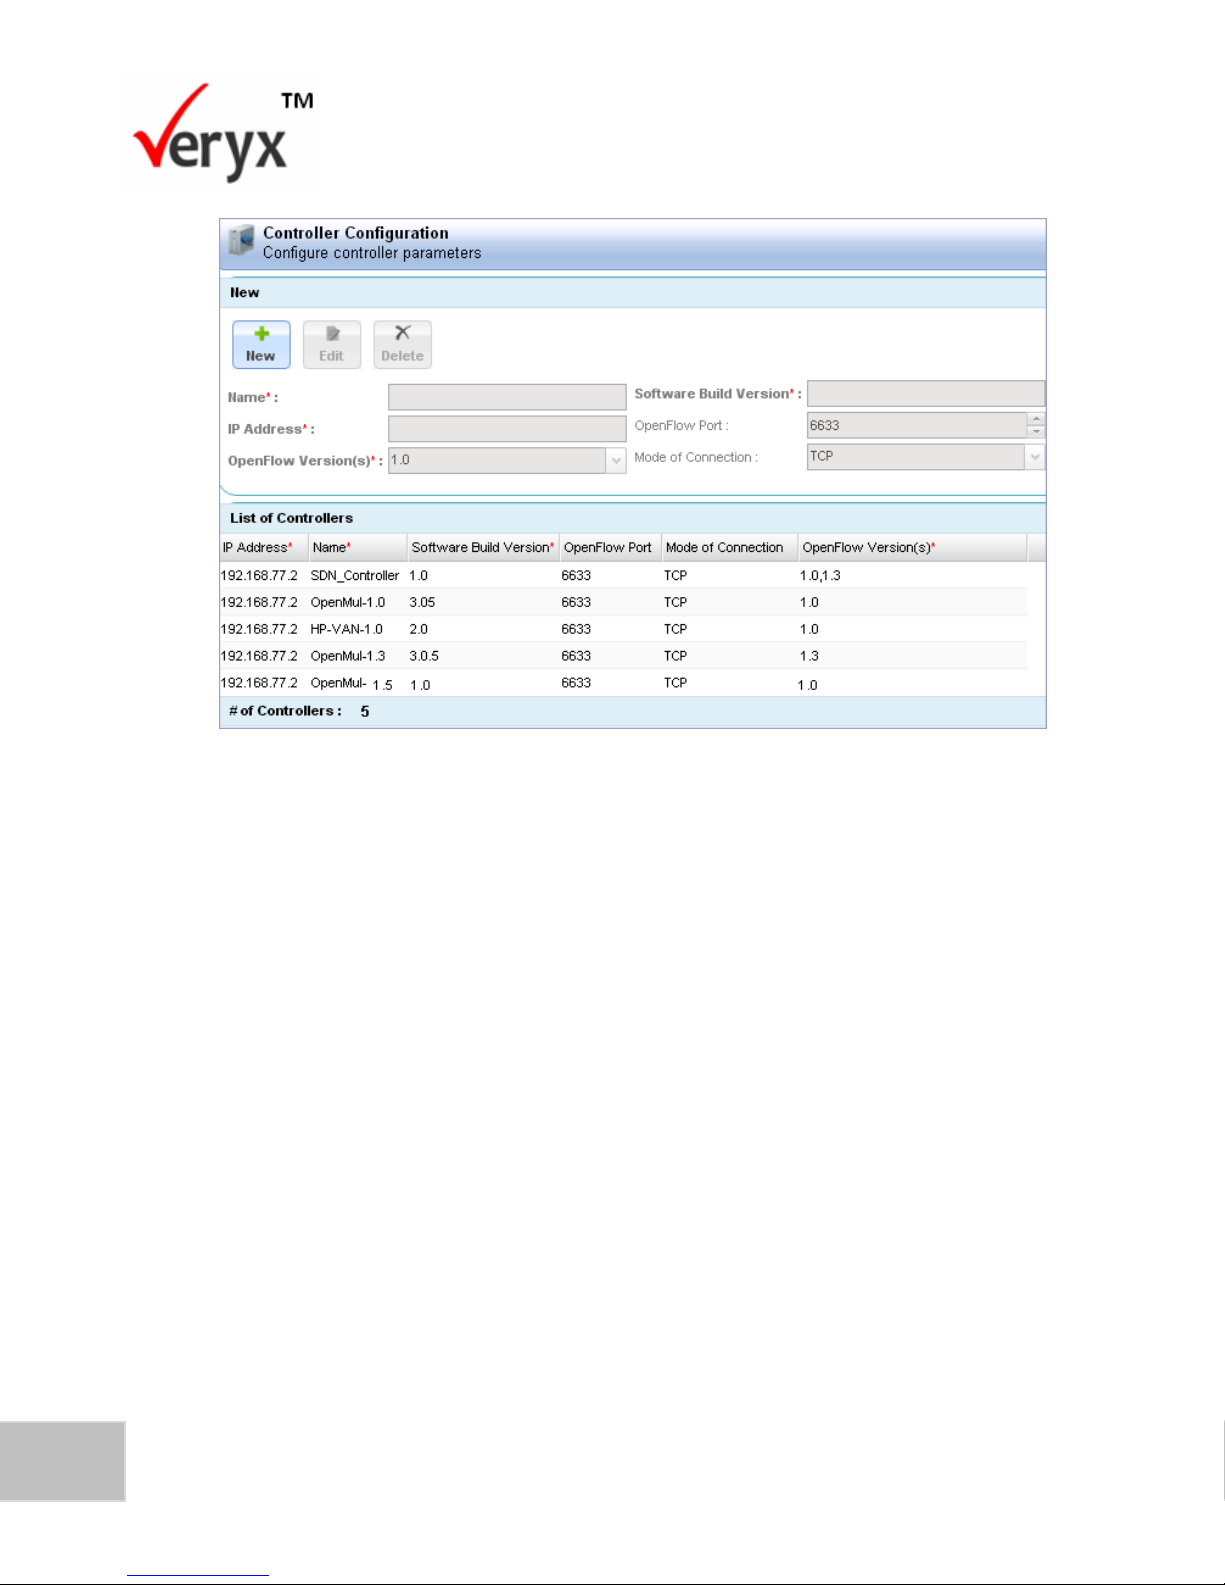
The tabular information relating to controller configuration is displayed as shown in
the Controller Configuration Screen.
Page 23
16
PktBlaster SDN Controller Test-Performance Benchmarking User Guide
Copyright © Veryx Technologies Pvt. Ltd.
Figure 10: Controller Configuration Screen
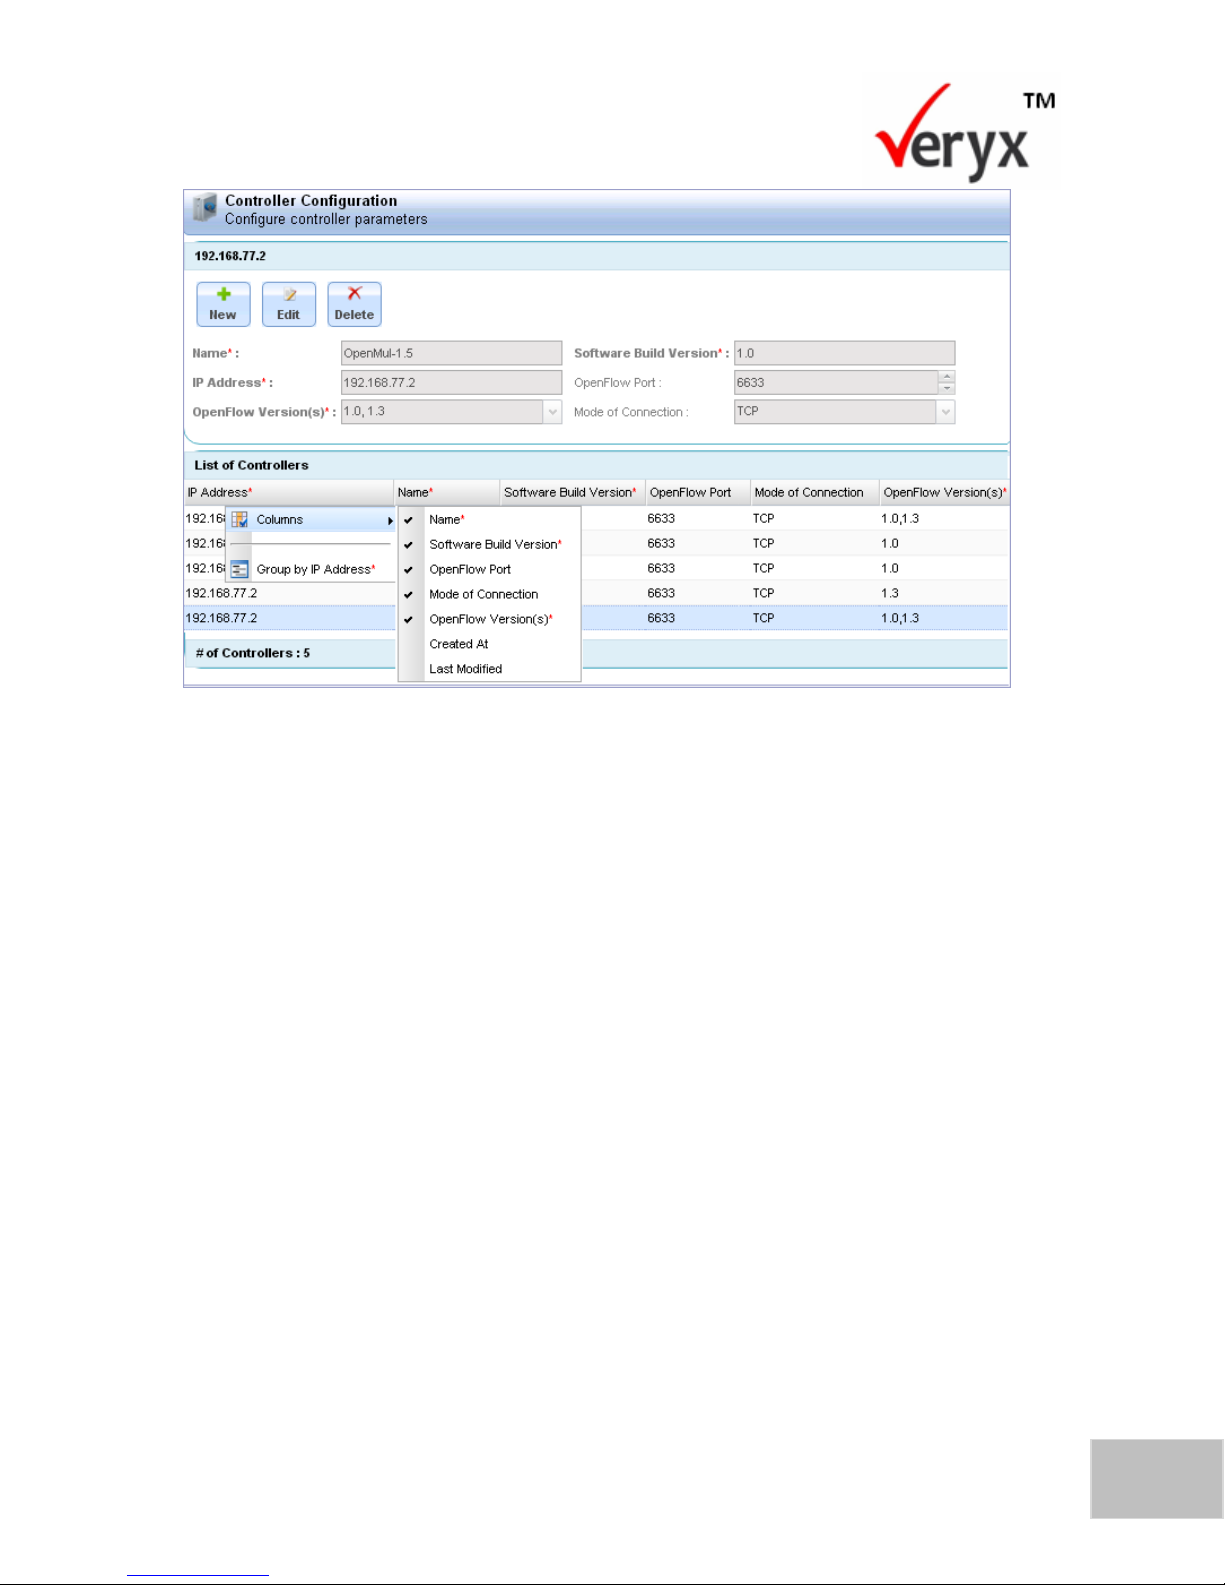
In the Controller Configuration screen, you can customize the information that is
displayed, using the features shown in the Controller Configuration-Customize
Display screen.
Page 24
Configuring an SDN Controller
17
Copyright © Veryx Technologies Pvt. Ltd.
Figure 11: Controller Configuration-Customize Display
The information can be customized based on the following:
Grouping: Enables you to group the information based on a specific field.
Customizable Columns: Enables you to select the fields that you want, to be
displayed.
Edit SDN Controller Details
To modify the parameters of a controller that has been added,
1. Click the Controllers tab to display the Available Controllers screen (Figure
9).
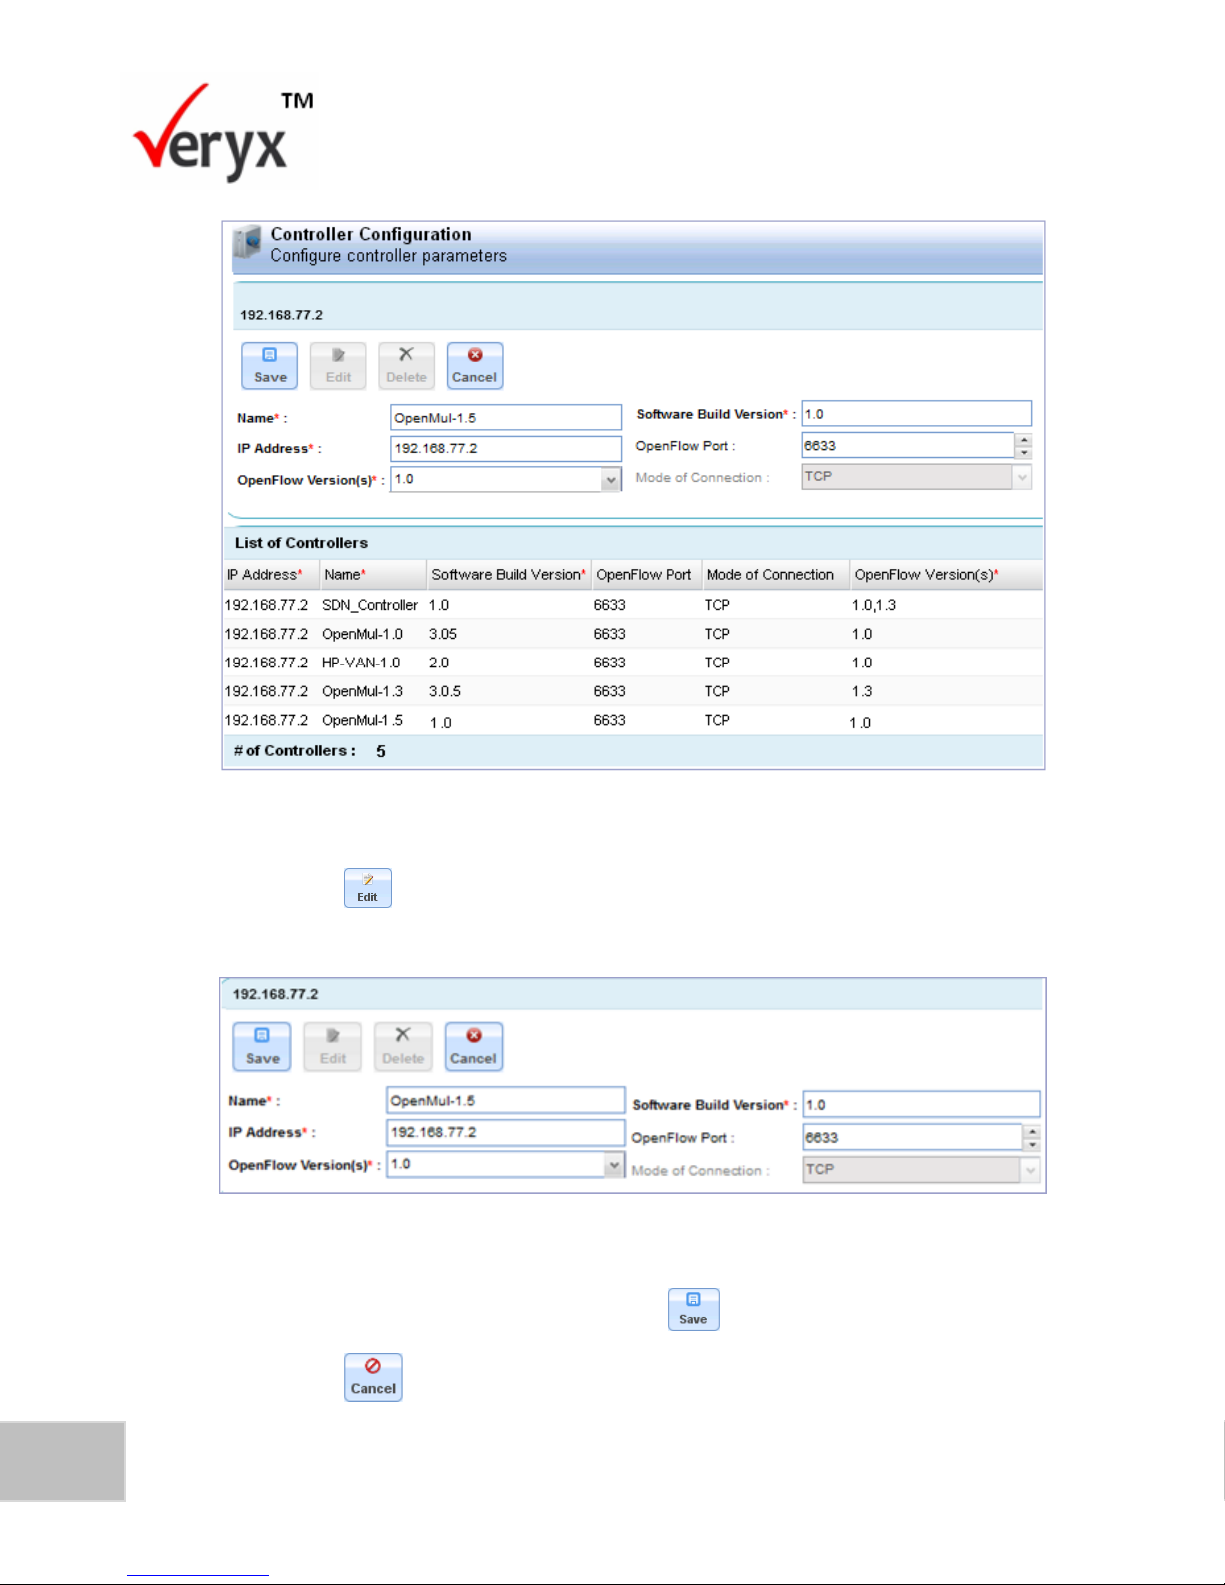
2. From the list of controllers that is displayed, select the controller that you
want to modify. The details of the selected controller are displayed in the
relevant fields as shown in the Controller Details screen (Figure 12).
Page 25
18
PktBlaster SDN Controller Test-Performance Benchmarking User Guide
Copyright © Veryx Technologies Pvt. Ltd.
Figure 12: Controller Details
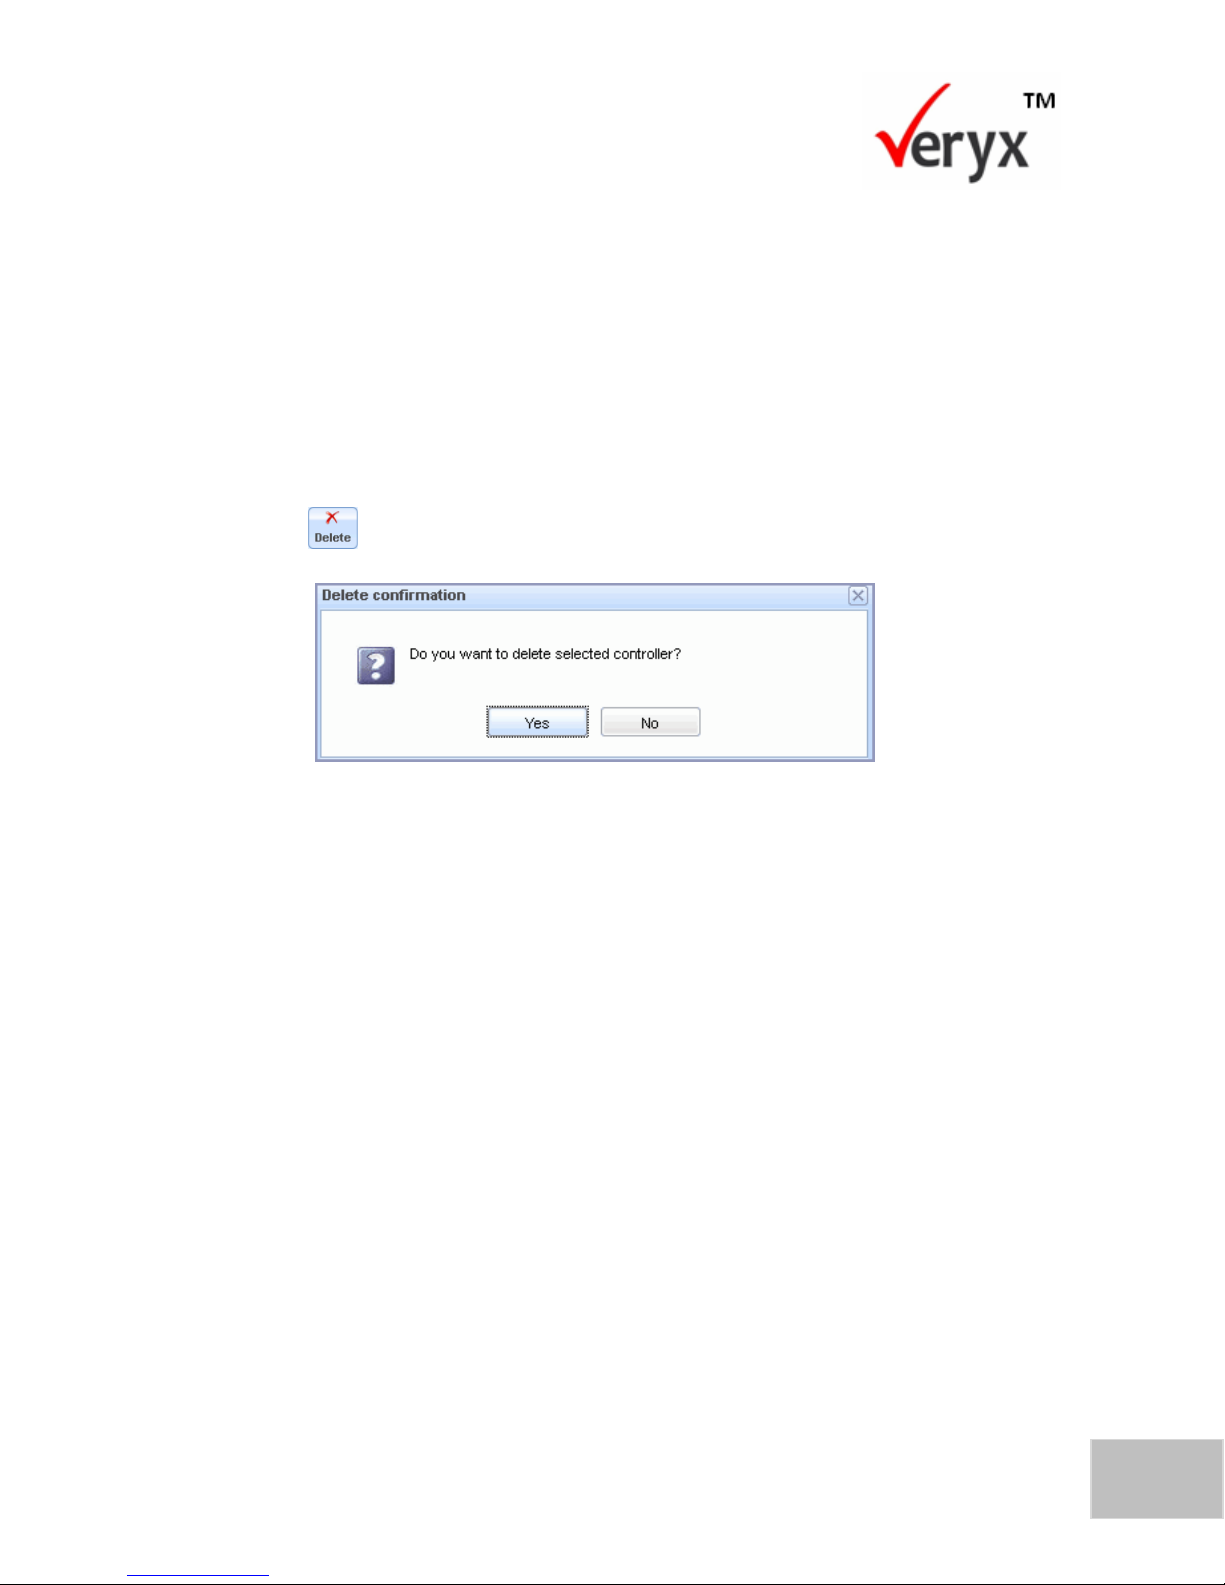
3. Click to display the fields in editable mode as shown in the Modify
Controller Details screen.
Figure 13: Modify Controller Details
4. Make the necessary changes and click to save the changes.
Click to discard the changes made to the controller details.
Page 26
Configuring an SDN Controller
19
Copyright © Veryx Technologies Pvt. Ltd.
Delete SDN Controller
You can only delete a controller that has not been tested.
To delete a controller,
1. Click the Controllers tab to display the Controllers screen (Figure 6).
2. From the list of controllers that is displayed, select the controller that you
want to delete. The details of the selected controller are displayed in the
relevant fields as shown in the Controller Details screen (Figure 12).
3. Click . The Delete Confirmation dialog box is now displayed.
Figure 14: Delete Confirmation Dialog Box
4. In the Delete Confirmation dialog box, click Yes to delete the controller.
Click No to stop deleting the controller.
Page 27

20
PktBlaster SDN Controller Test-Performance Benchmarking User Guide
Copyright © Veryx Technologies Pvt. Ltd.
This page has been intentionally left blank.
Page 28
Copyright © Veryx Technologies Pvt. Ltd.
21
4 CONFIGURING A TRAFFIC PROFILE
This chapter describes how you can configure the type of traffic that needs to be
sent to the controller. Predefined traffic types such as ARP_Reply, ARP_Request,
TCP, and UDP are available in Traffic profile module. It is possible to select or modify
the existing traffic types and create new traffic types.
These traffic types are used for the packet-in messages that are sent to the
controller. After a traffic profile is created, it can be used to test the performance of
a controller.
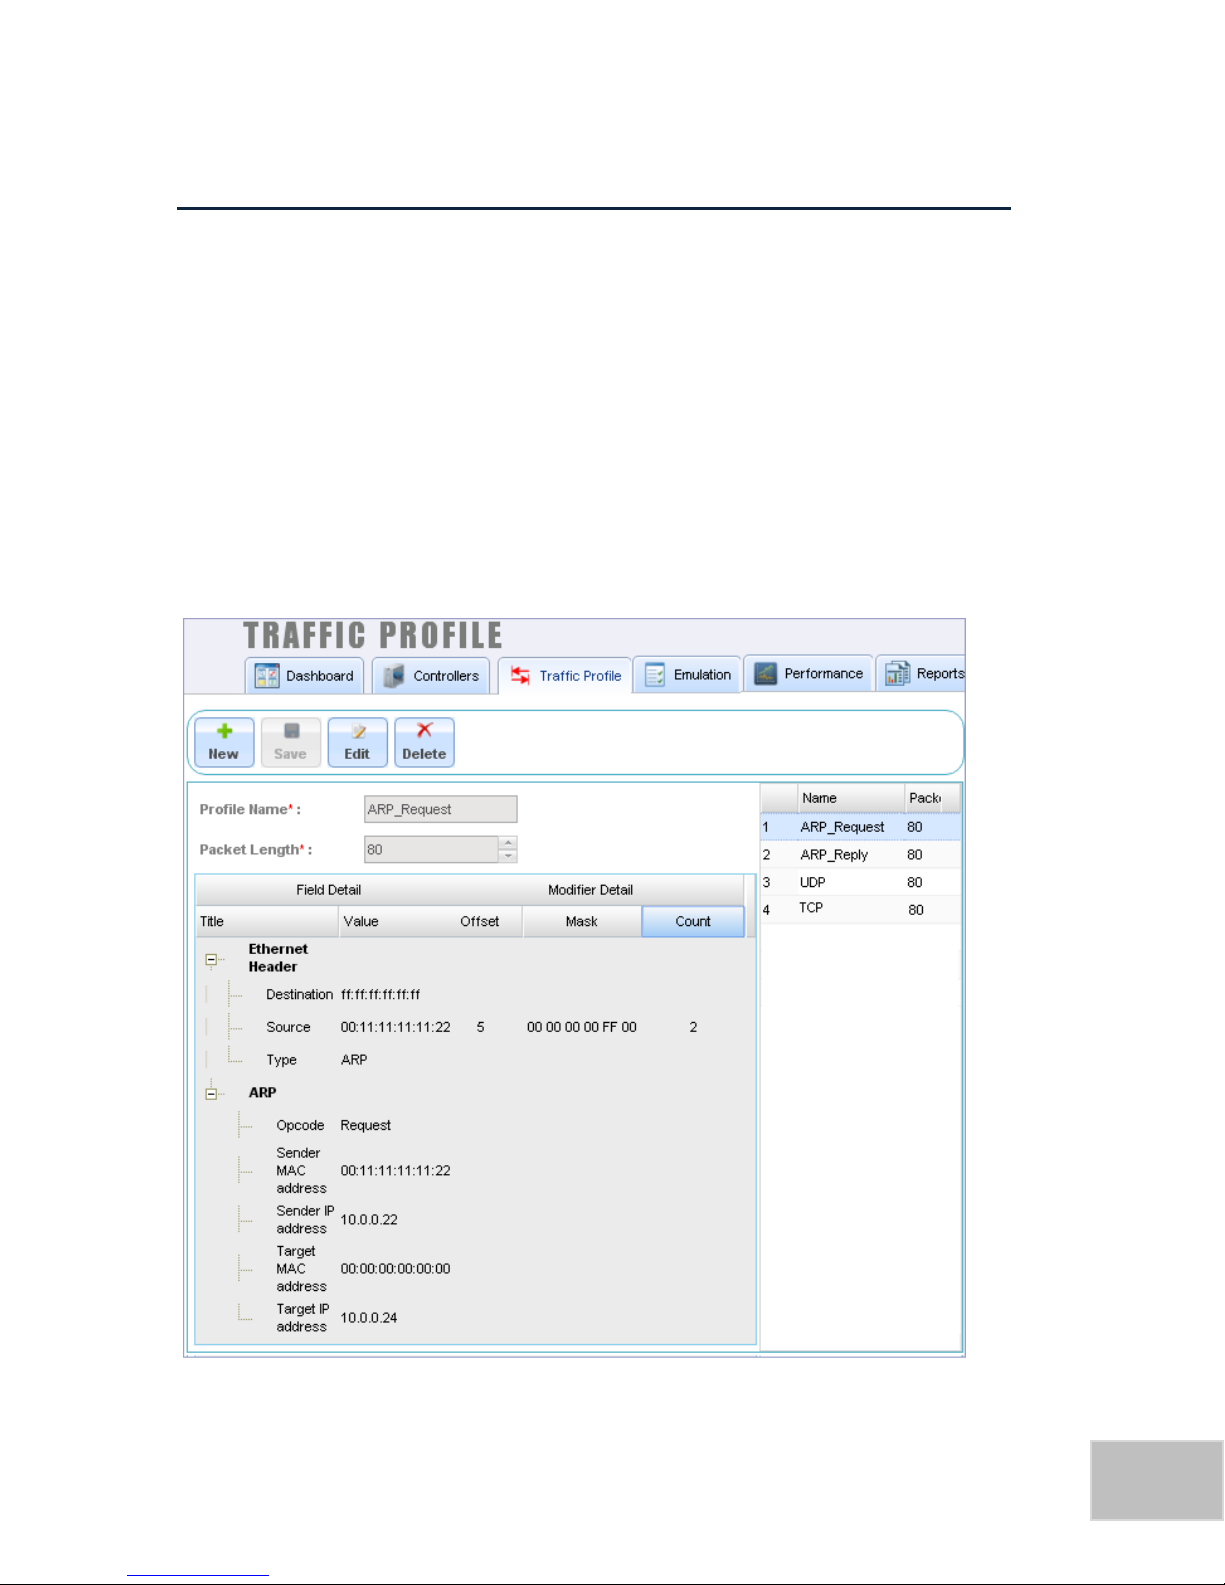
To configure the traffic that needs to be generated, click the Traffic Profile tab. The
Traffic Profile Screen displays the predefined traffic types ARP_Reply, ARP_Request,
TCP and UDP.
Figure 15: Traffic Profile Screen
P a g e | 2121
Page 29
22
PktBlaster SDN Controller Test-Performance Benchmarking User Guide
Copyright © Veryx Technologies Pvt. Ltd.
In the Traffic Profile screen, you can view the existing profiles that have been
defined. When you click on a traffic profile, you can view the field details and the
modifier details for that profile.
In the Traffic Profile screen, you can:
Add a new traffic profile
View traffic profiles
Modify an existing traffic profile
Delete a traffic profile
Add a New Traffic Profile
To define a new traffic profile:
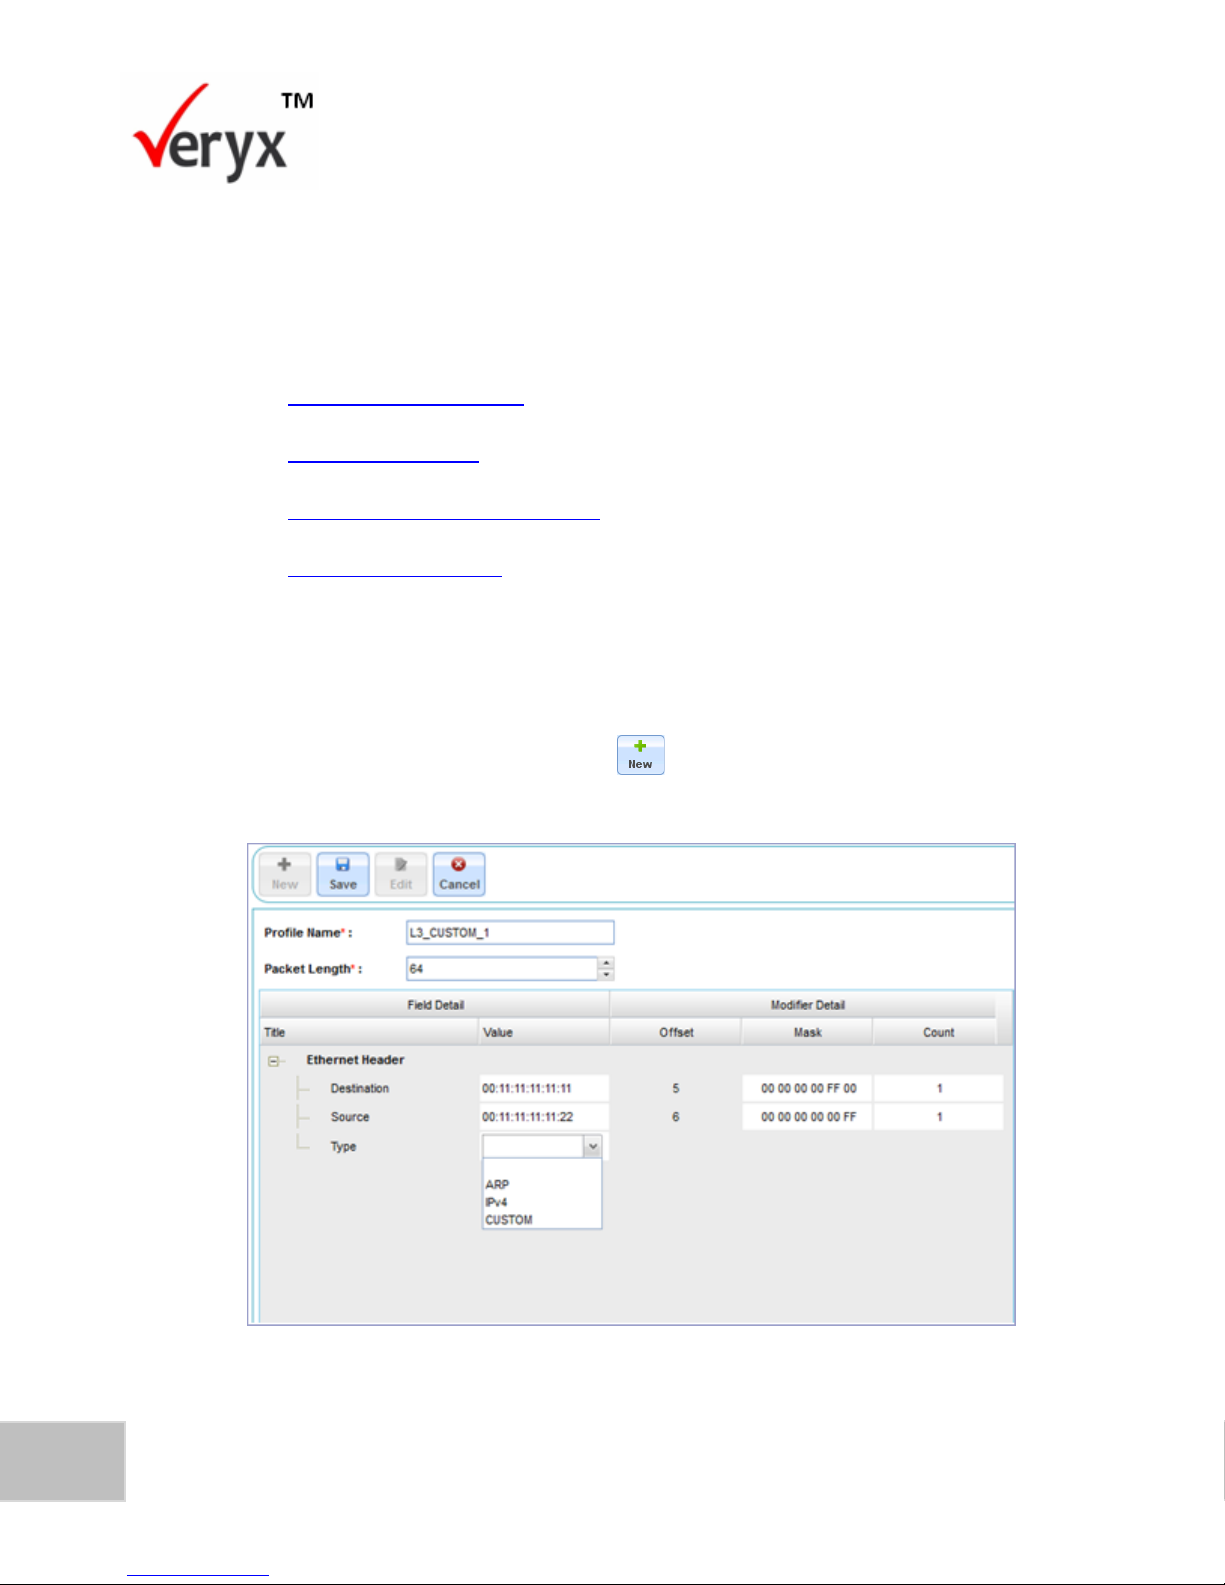
1. In the Traffic Profile screen, click . The Add a New Traffic Profile screen
is now displayed.
Figure 16: Add a New Traffic Profile
Page 30
23
Copyright © Veryx Technologies Pvt. Ltd.
Configuring a Traffic Profile
PARAMETER
DESCRIPTION
Offset
The starting position in the field from which the mask is applied. This
indicates the position (starting from 1) from which the modifier is
applied.
Mask
The value corresponding to the number of byte(s) that are modified and
the offset at which the modifier is applied. For example, when 1 byte of
a field (of length 4 bytes) is modified, the mask value that is applied
from an offset position 3 is 00 00 ff 00.
Count
The number of combinations that are generated with a specified mask
value. For example, when 1 byte of a field is modified, the maximum
number of unique values that will be generated is 255.
In the Add a New Traffic Profile screen, you can view the following:
The field details for the packets.
The modifier information for the relevant fields.
In the Add a New Traffic Profile, screen (Figure 16):
1. In the Profile Name text box, enter a suitable name that uniquely identifies
the traffic type associated with the profile. For example, to define a Layer 3
custom traffic, you could use a profile name such as L3_CUSTOM_1.
2. In the Packet Length box, type or select the length of each packet in the
traffic profile. The length of a packet (includes the header and data parts) can
vary from a minimum of 64 bytes to a maximum of 512 bytes.
In the Field Details section:
The values in the fields can be modified by means of the parameters shown in the
following table.
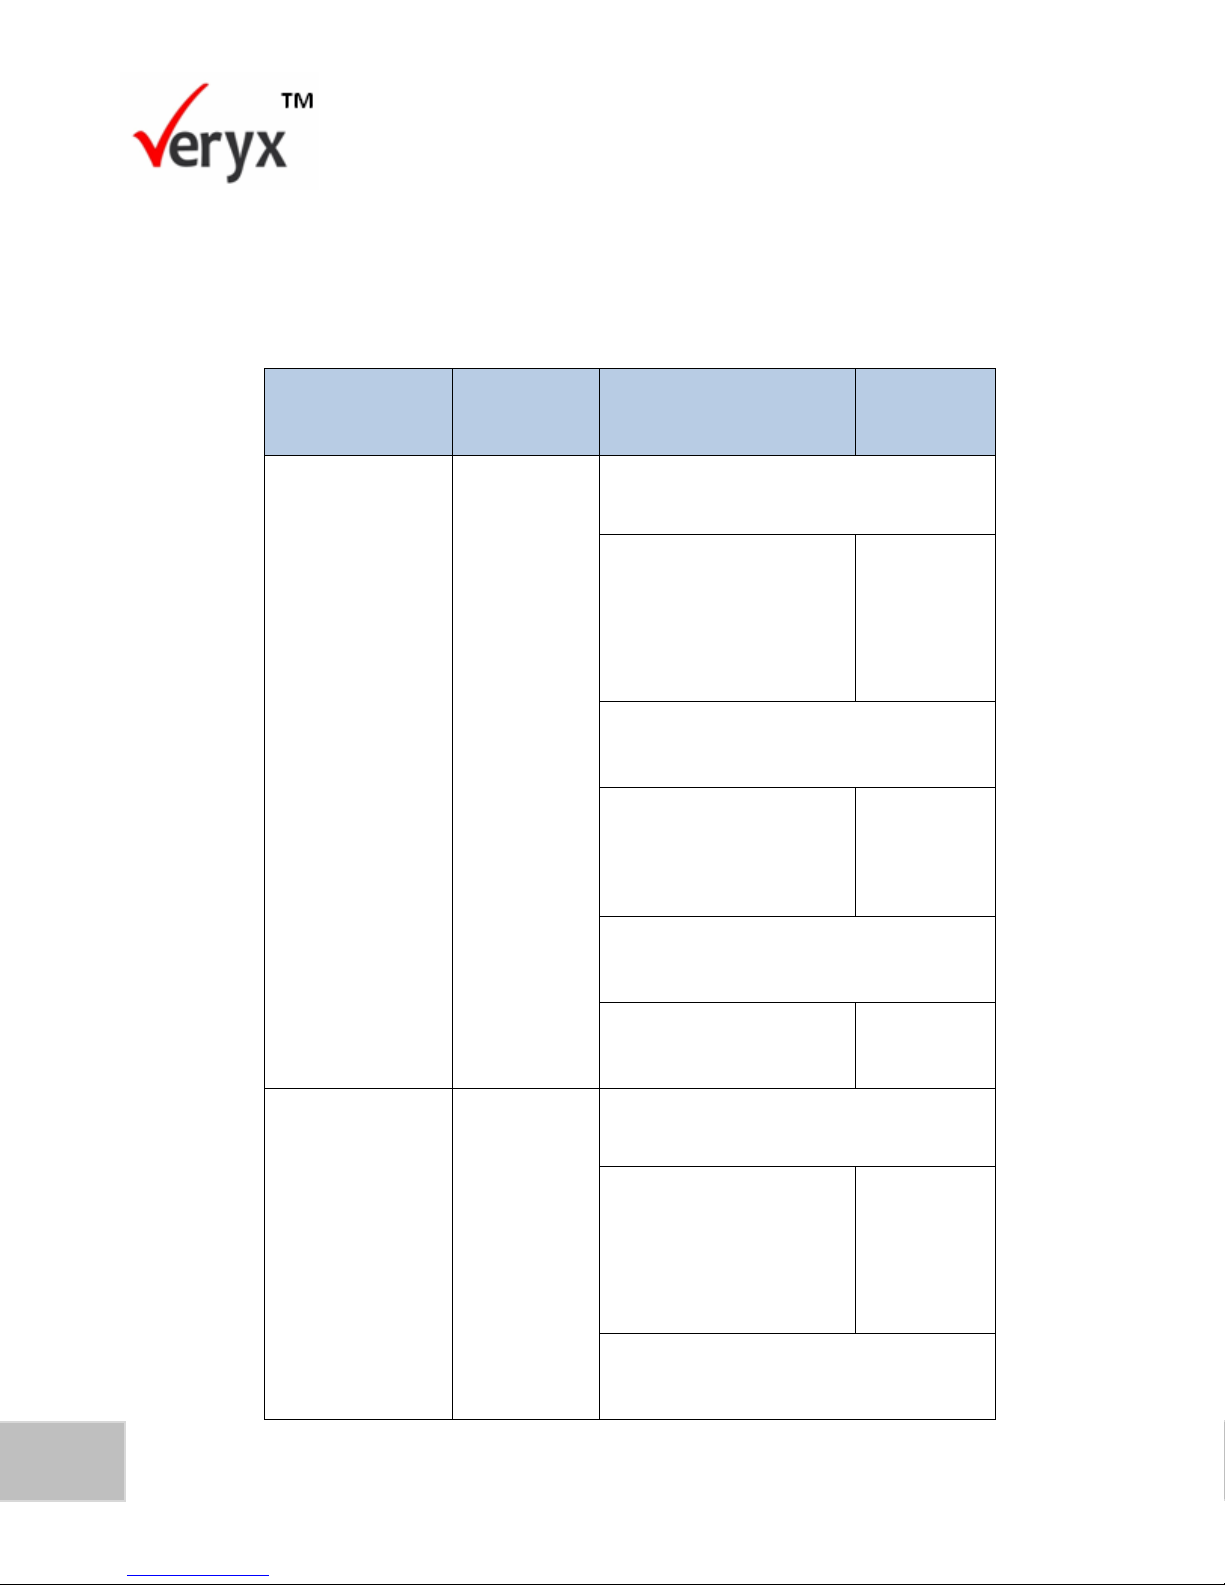
Table 3: Fields and Associated Modifiers
Page 31
24
PktBlaster SDN Controller Test-Performance Benchmarking User Guide
Copyright © Veryx Technologies Pvt. Ltd.
FIELD
BYTES
ALLOWED TO
BE MODIFIED
MASK
OFFSET
Source MAC
Address
Last 3 bytes
1 byte modified-maximum count value is
255
00 00 00 00 00 ff
00 00 00 00 ff 00
00 00 00 ff 00 00
00 00 ff 00 00 00
6
5
4
3
2 bytes modified- maximum count value
is 65535 (2^16)
00 00 00 00 ff ff
00 00 00 ff ff 00
00 00 ff ff 00 00
5
4
3
3 bytes modified-maximum count value is
1000000
00 00 00 ff ff ff
4
Destination MAC
Address
Last 4 bytes
1 byte modified-maximum count value is
255
00 00 00 00 00 ff
00 00 00 00 ff 00
00 00 00 ff 00 00
00 00 ff 00 00 00
6
5
4
3
2 bytes modified- maximum count value
is 65535 (2^16)
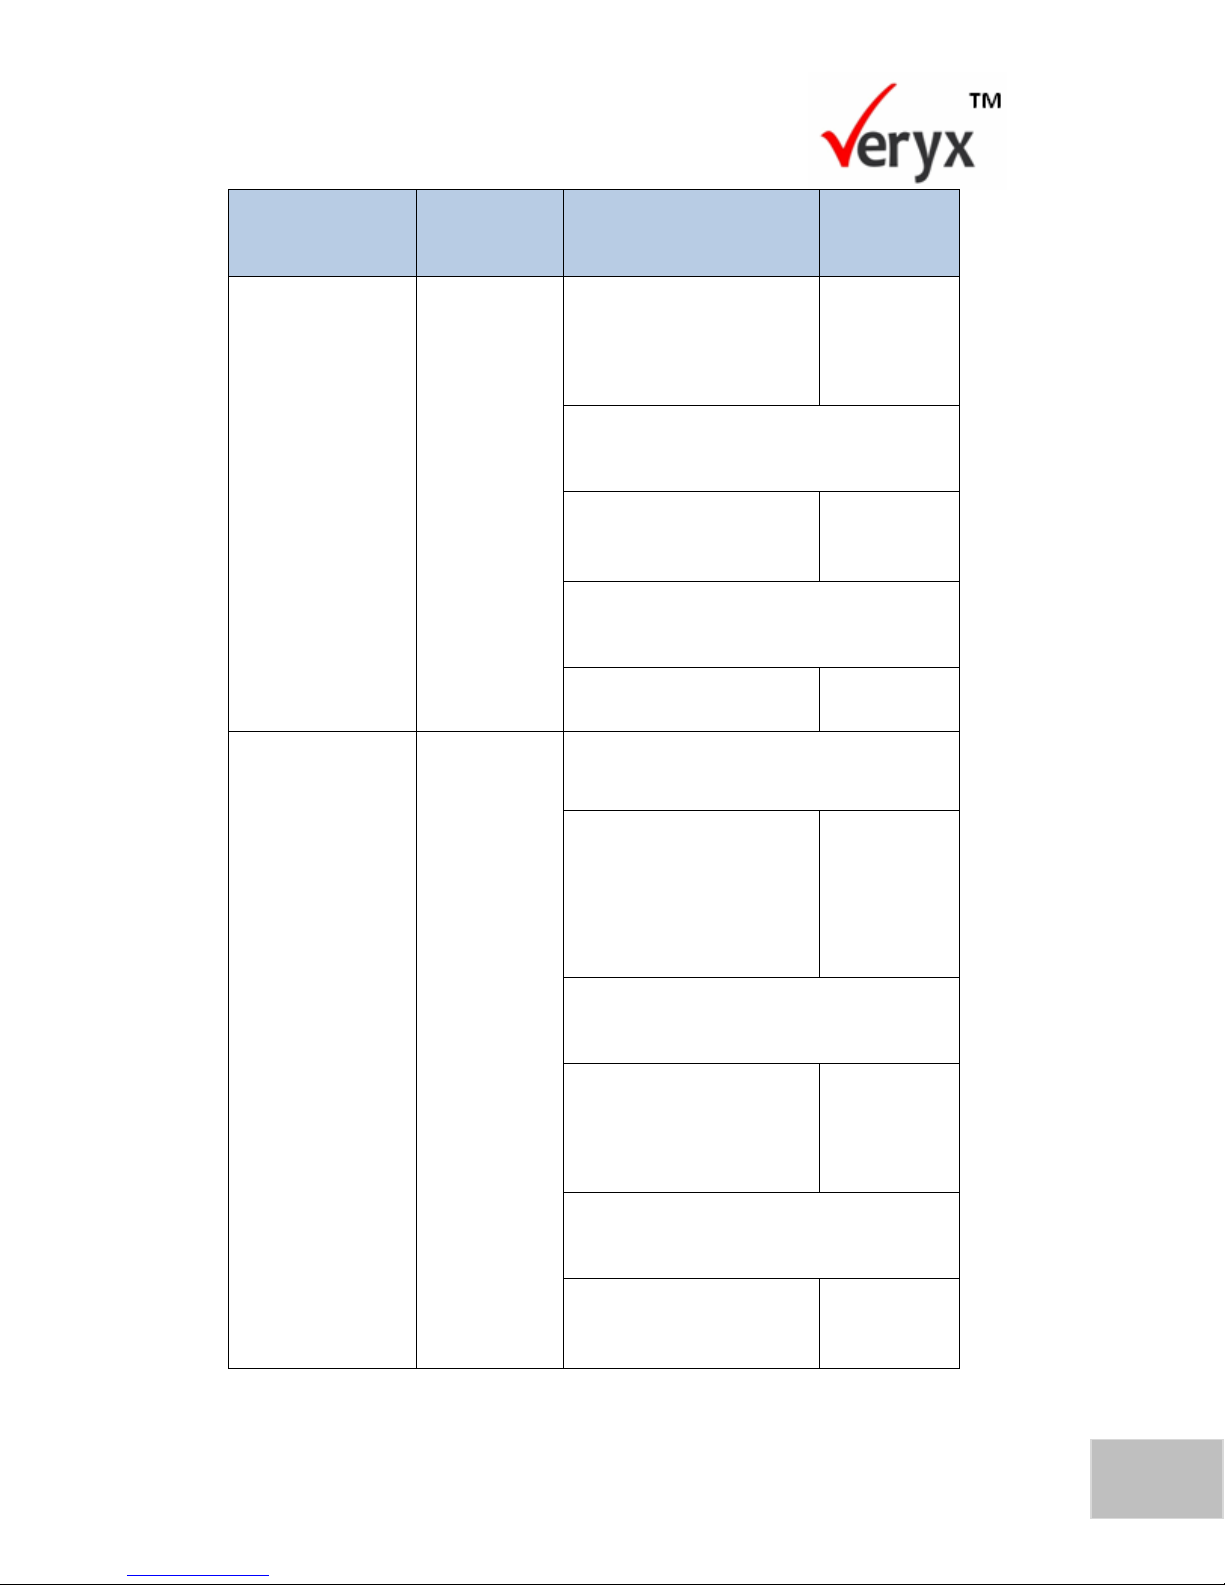
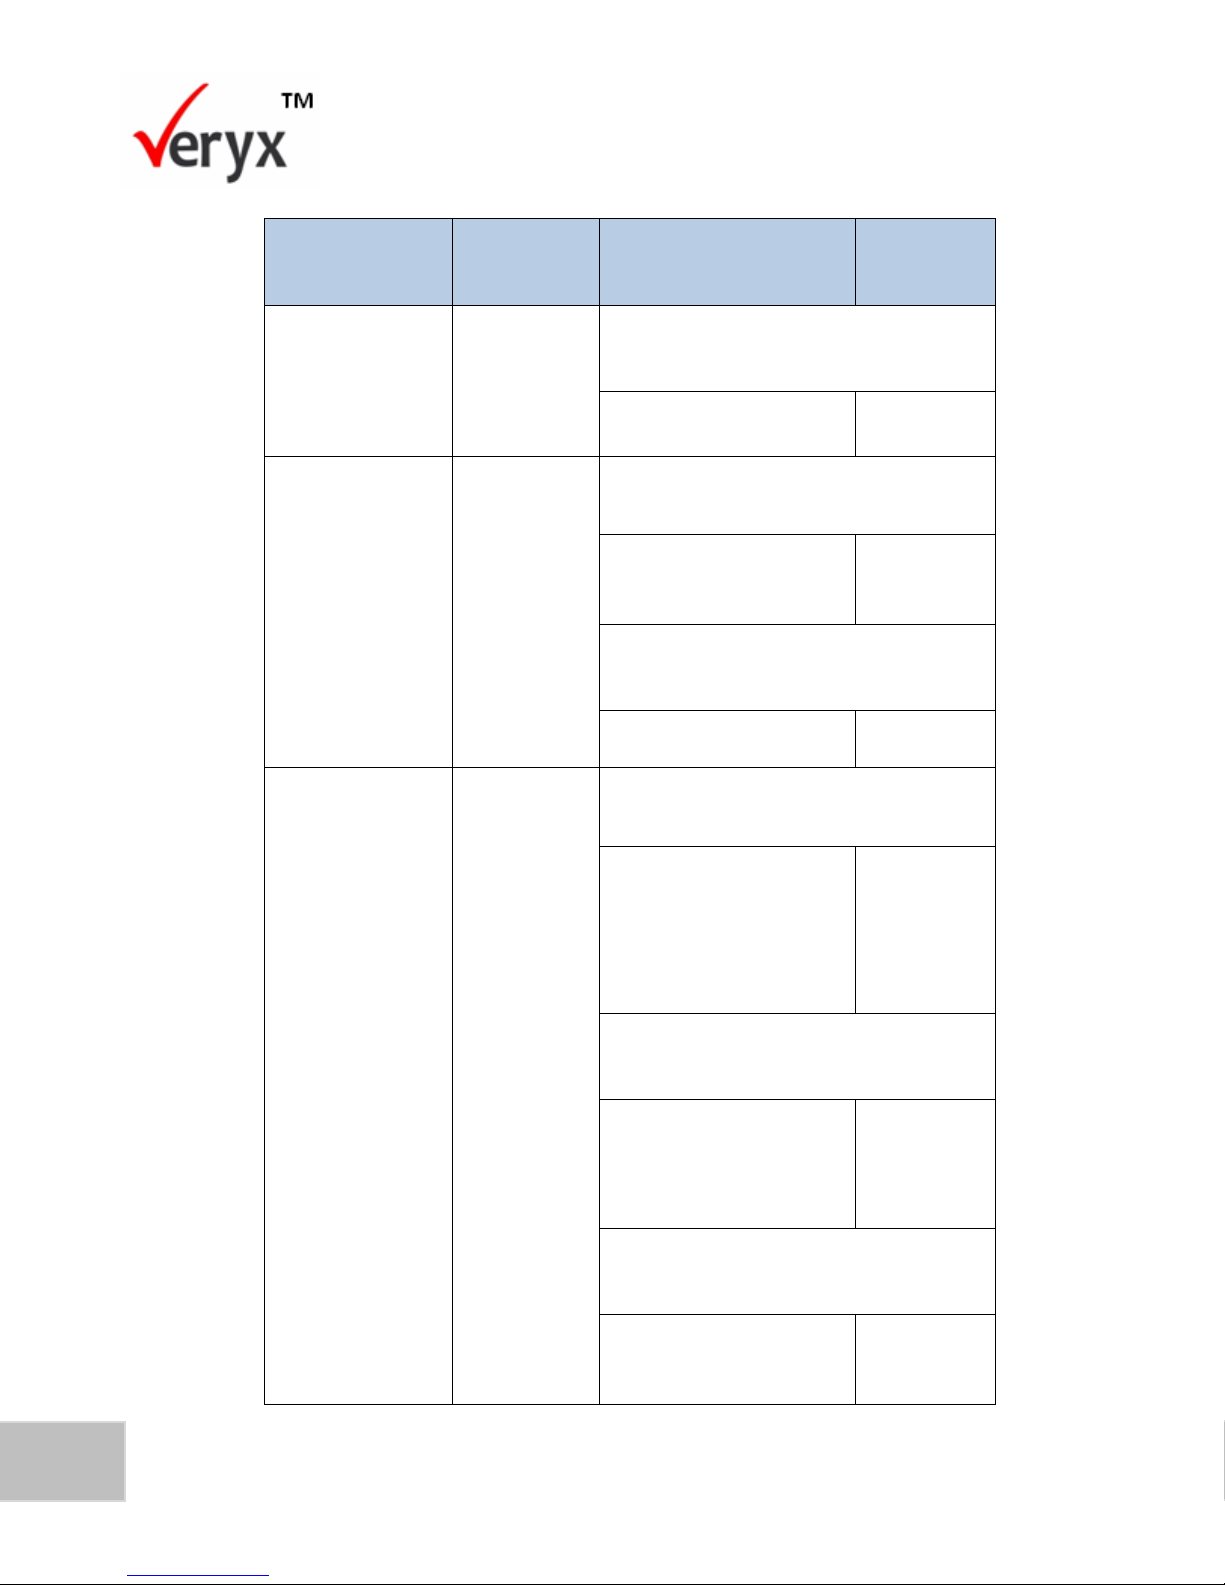
The modifier information for the different fields in the Traffic Profile module is
shown in the following table.
Table 4: Modifier Information
Page 32
25
Copyright © Veryx Technologies Pvt. Ltd.
Configuring a Traffic Profile
FIELD
BYTES
ALLOWED TO
BE MODIFIED
MASK
OFFSET
00 00 00 00 ff ff
00 00 00 ff ff 00
00 00 ff ff 00 00
5
4
3
3 bytes modified-maximum count value is
1000000
00 00 00 ff ff ff
00 00 ff ff ff 00
4
3
4 bytes modified-maximum count value is
1000000
00 00 ff ff ff ff
3
Source IP
Address,
Destination IP
Address
All (4) bytes
1 byte modified-maximum count value is
255
00 00 00 ff
00 00 ff 00
00 ff 00 00
ff 00 00 00
4
3
2
1
2 bytes modified- maximum count value
is 65535 (2^16)
00 00 ff ff
00 ff ff 00
ff ff 00 00
3
2
1
3 bytes modified-maximum count value is
1000000
00 ff ff ff
ff ff ff 00
2
1
Page 33
26
PktBlaster SDN Controller Test-Performance Benchmarking User Guide
Copyright © Veryx Technologies Pvt. Ltd.
FIELD
BYTES
ALLOWED TO
BE MODIFIED
MASK
OFFSET
4 bytes modified-maximum count value is
1000000
ff ff ff ff
1
Source Port,
Destination Port
All (2) bytes
1 byte modified-maximum count value is
255
00 ff
ff 00
2
1
2 bytes modified- maximum count value
is 65535 (2^16)
ff ff
1
Custom
4 bytes
1 byte modified-maximum count value is
255
00 00 00 ff
00 00 ff 00
00 ff 00 00
ff 00 00 00
4
3
2
1
2 bytes modified- maximum count value
is 65535 (2^16)
00 00 ff ff
00 ff ff 00
ff ff 00 00
3
2
1
3 bytes modified-maximum count value is
1000000
00 ff ff ff
ff ff ff 00
2
1
Page 34
27
Copyright © Veryx Technologies Pvt. Ltd.
Configuring a Traffic Profile
FIELD
BYTES
ALLOWED TO
BE MODIFIED
MASK
OFFSET
4 bytes modified-maximum count value is
1000000
ff ff ff ff
1
TYPE
TRAFFIC
ARP
ARP_Reply, ARP_Request
IPV4
TCP, UDP, Custom TCP, Custom UDP
CUSTOM
L2 custom
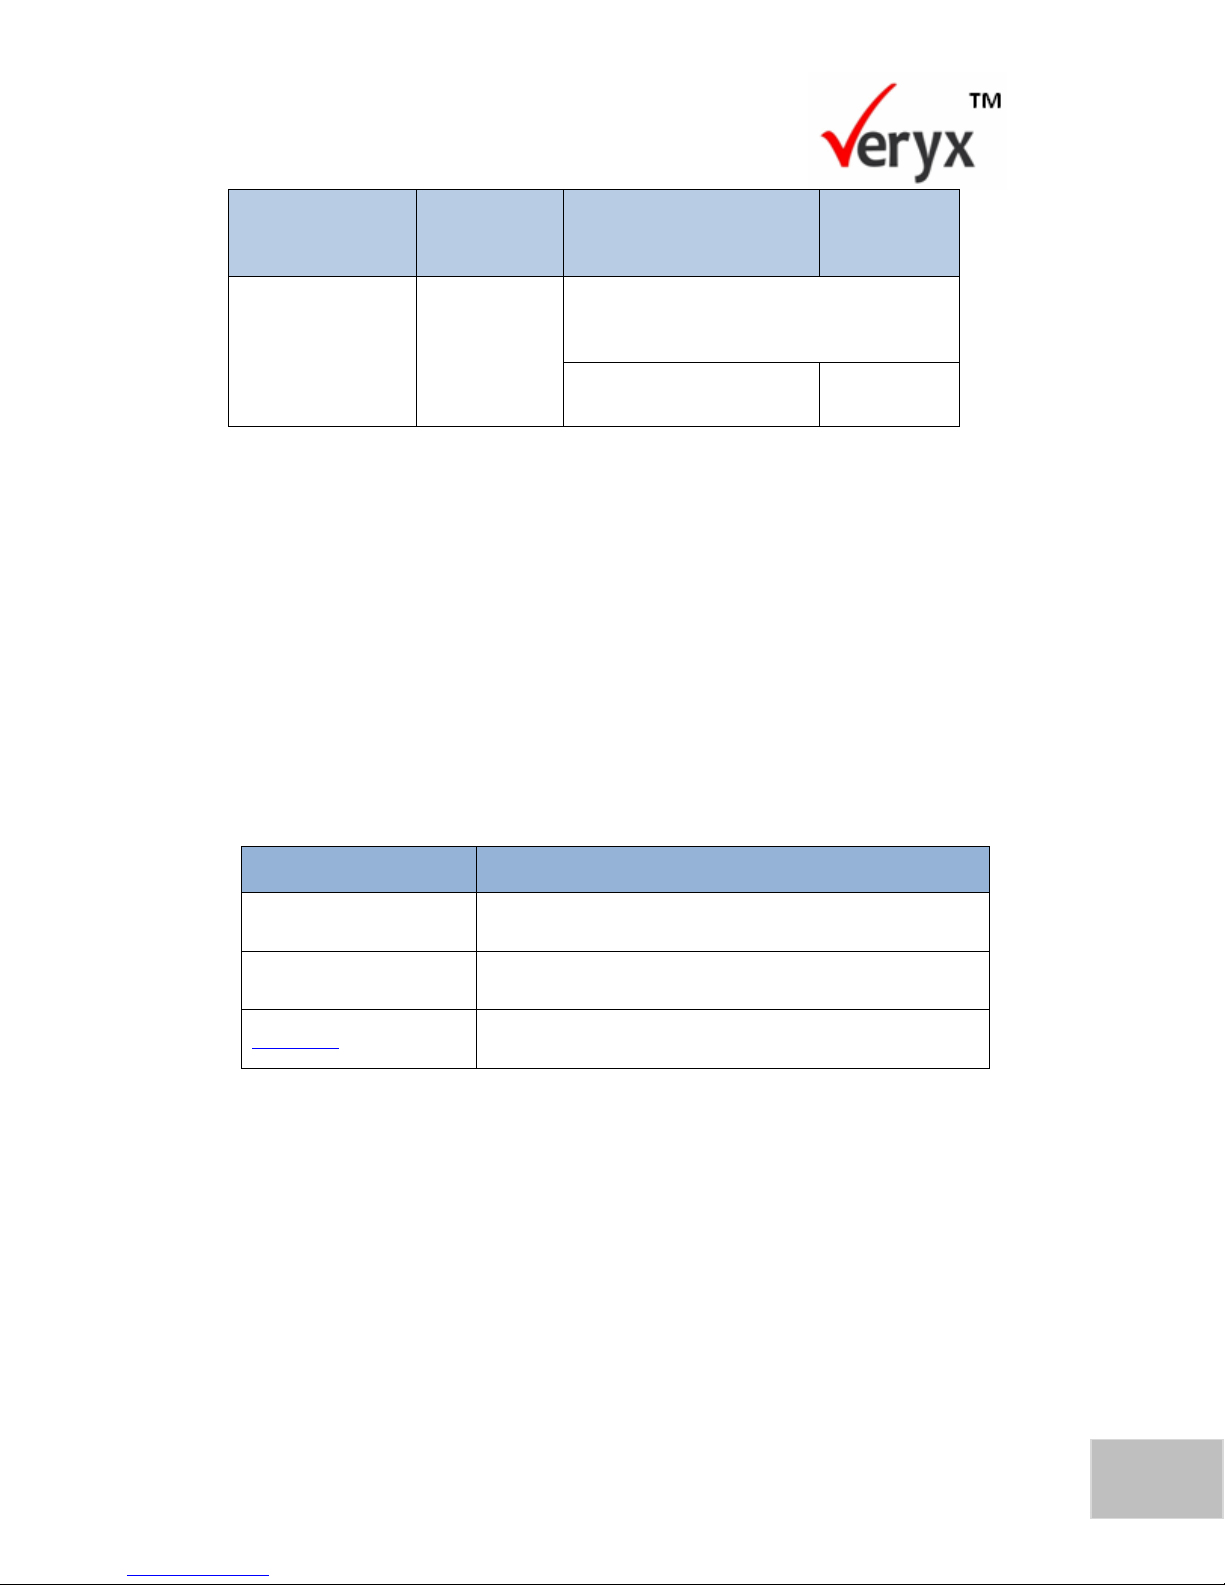
3. In the Destination text box, the default physical address of the packet
destination is displayed. This is a 6-byte address where you can modify the
last 4 bytes.
4. In the Source text box, the default physical address of the packet’s source is
displayed. This is a 6-byte address where you can modify the last 3 bytes.
Although you are allowed to modify only the last 3 bytes in the Source field,
the module allows you to apply a modifier from the third offset. However,
when the traffic profile with such a modifier is saved, a warning is displayed.
From the Type drop-down list, select the protocol that is used to transmit the
packets in this traffic profile. Select the suitable Type for traffic that needs to
be generated:
The following sections explain the fields that are required to be set when the
Type is IPV4 or L2 custom traffic.
Page 35
28
PktBlaster SDN Controller Test-Performance Benchmarking User Guide
Copyright © Veryx Technologies Pvt. Ltd.
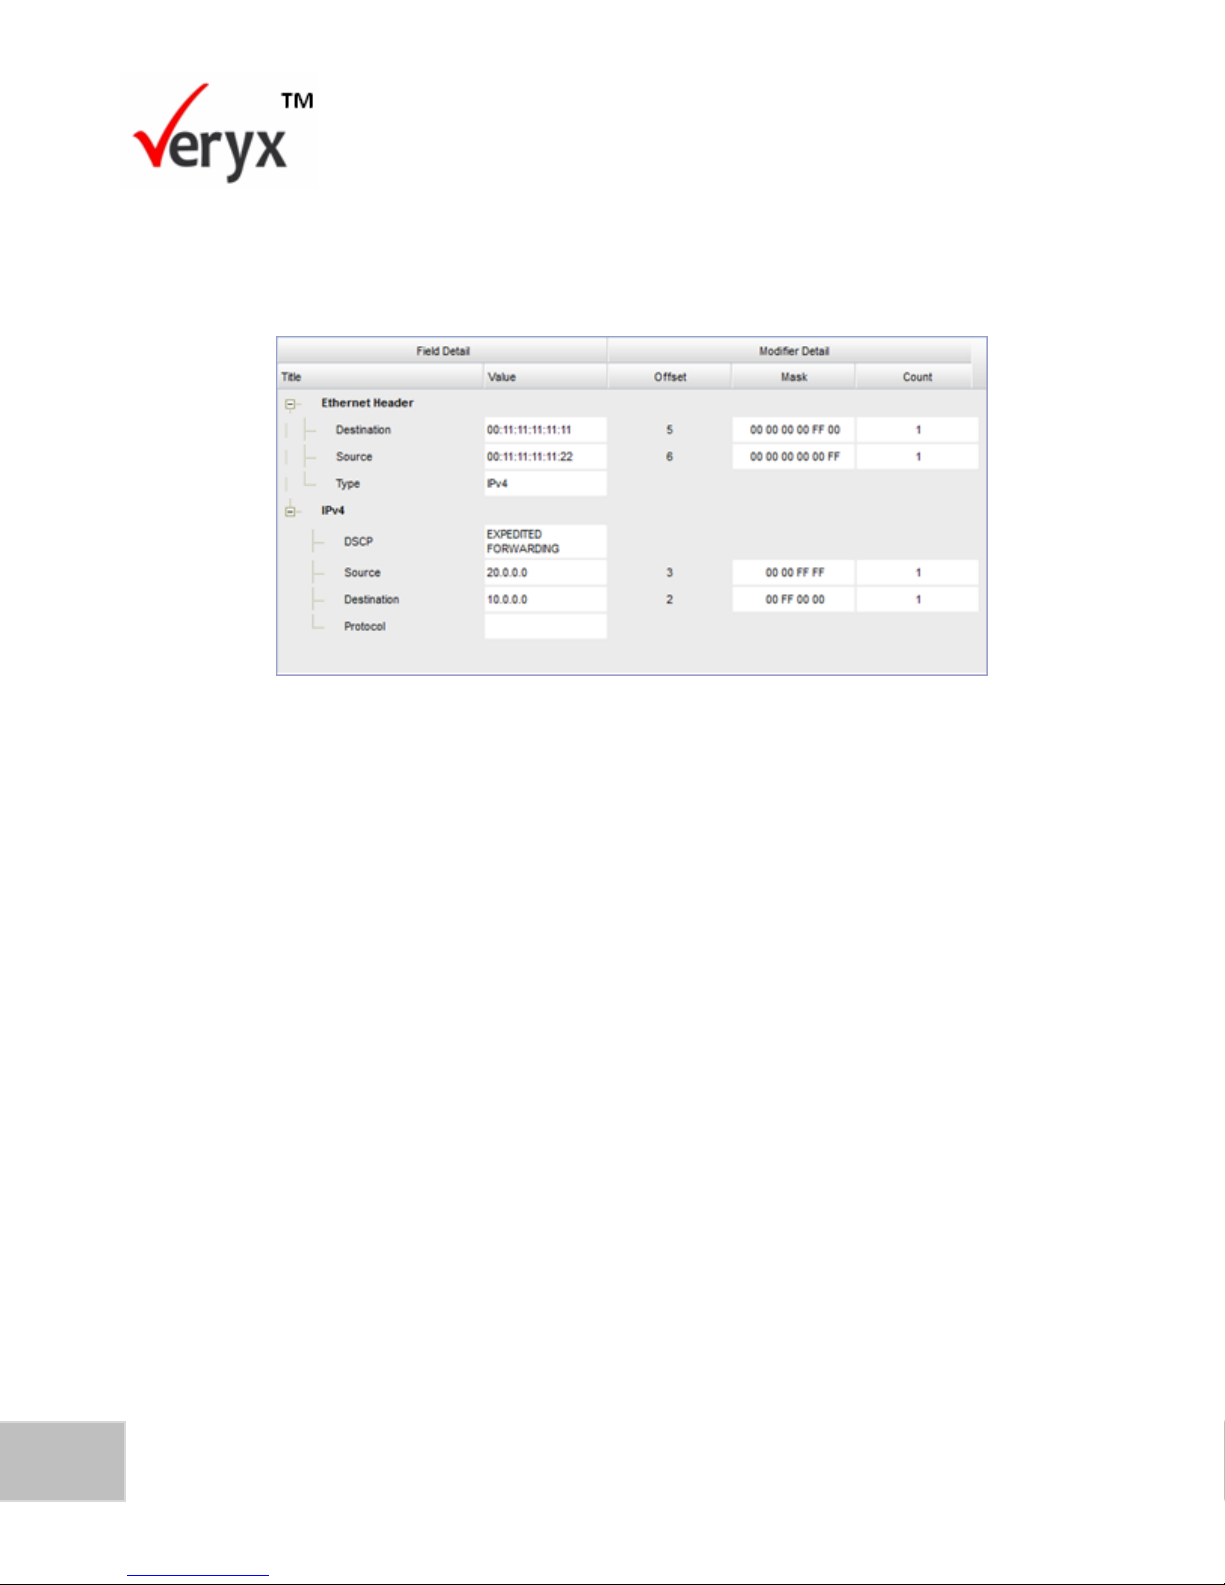
Type–IPV4
When the Type is set to IPV4, the Traffic Profile-Type IPV4 screen is displayed.
Figure 17: Traffic Profile-Type IPV4
To specify the details for an IPV4 type:
1. In the Destination textbox, the default IP address to which the packet is
destined. You can modify all the 4 bytes of the destination IP address.
2. In the Source textbox, the default IP address from where the packet
originates is displayed. You can modify all the 4 bytes of the source IP
address.
3. From the DSCP (Differentiated Services Code Point) drop-down list, select the
level of service that needs to be associated with the packets generated in this
traffic profile.
4. From the Protocol drop down list, select the next level of protocol that is
used to carry the IP traffic. You can specify the next protocol for IPV4 as TCP,
UDP, Custom TCP or Custom UDP.
The following sections describe how you can provide the details for the next
protocol that you have selected.
Page 36
29
Copyright © Veryx Technologies Pvt. Ltd.
Configuring a Traffic Profile
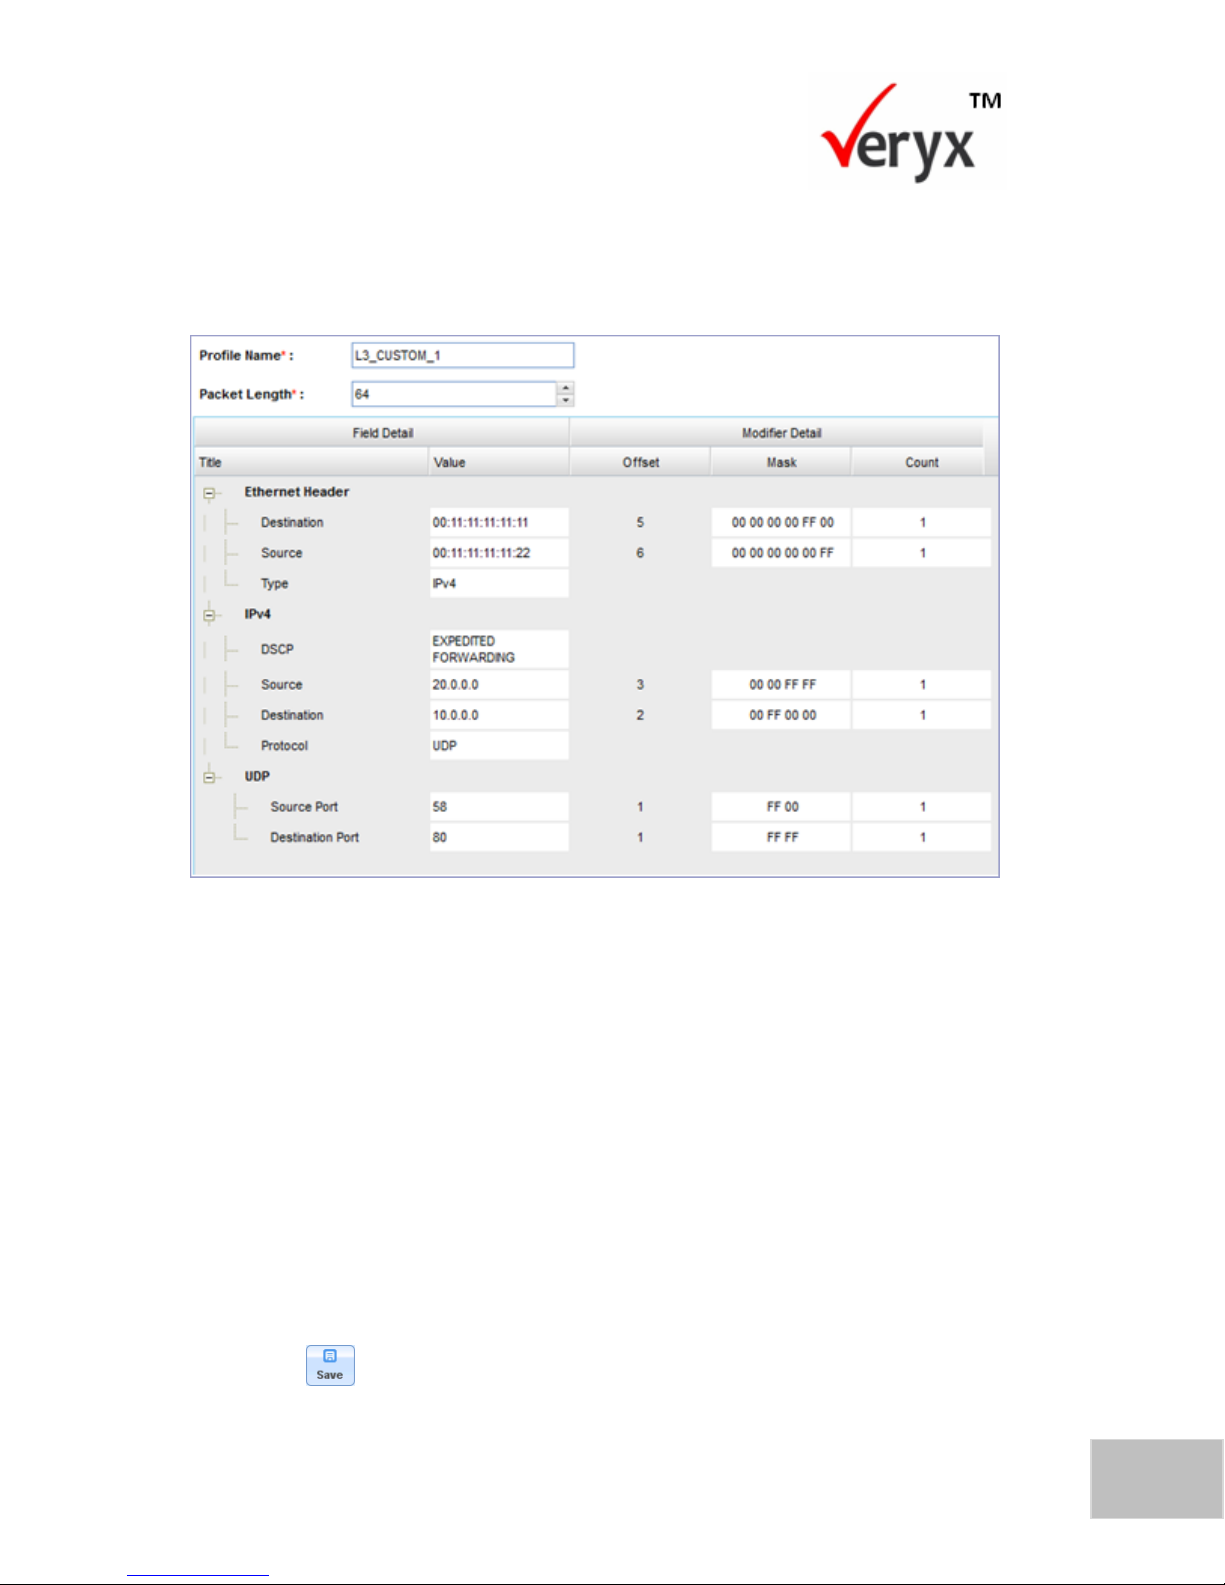
Protocol-TCP or UDP
When the next protocol of IPV4 is set to TCP or UDP, the Traffic Profile-TCP/UDP
screen is displayed.
Figure 18: Traffic Profile-TCP/UDP
To specify the ports for a TCP or UDP protocol:
1. In the Destination Port box, type or select the port number that identifies
the type of the packet. For example, a packet with port 80 is directed to be
processed by a Web server. This is 2 bytes long and you can modify all the
bytes of the destination port. The destination port number can be assigned a
value between 1 and 65535.
2. In the Source Port box, type or select the port number that is used in
responses after the packet has reached the destination port. This is 2 bytes
long and you can modify all the bytes of the source port number. The source
port number can be assigned a value between 1 and 65535.
3. Click to save the traffic profile.
Page 37

30
PktBlaster SDN Controller Test-Performance Benchmarking User Guide
Copyright © Veryx Technologies Pvt. Ltd.
Protocol-Custom TCP or Custom UDP
This is where you can specify custom payload for the packets in this profile.
When you select the next protocol as CUSTOM TCP or CUSTOM UDP, the Traffic
Profile-L3 Custom screen is displayed.
Figure 19: Traffic Profile-L3 Custom
1. In the Data text box, enter the data that will be used as the actual data to be
transmitted using this profile. You can modify the payload data up to a
maximum of 4 bytes.
2. Click to save the traffic profile.
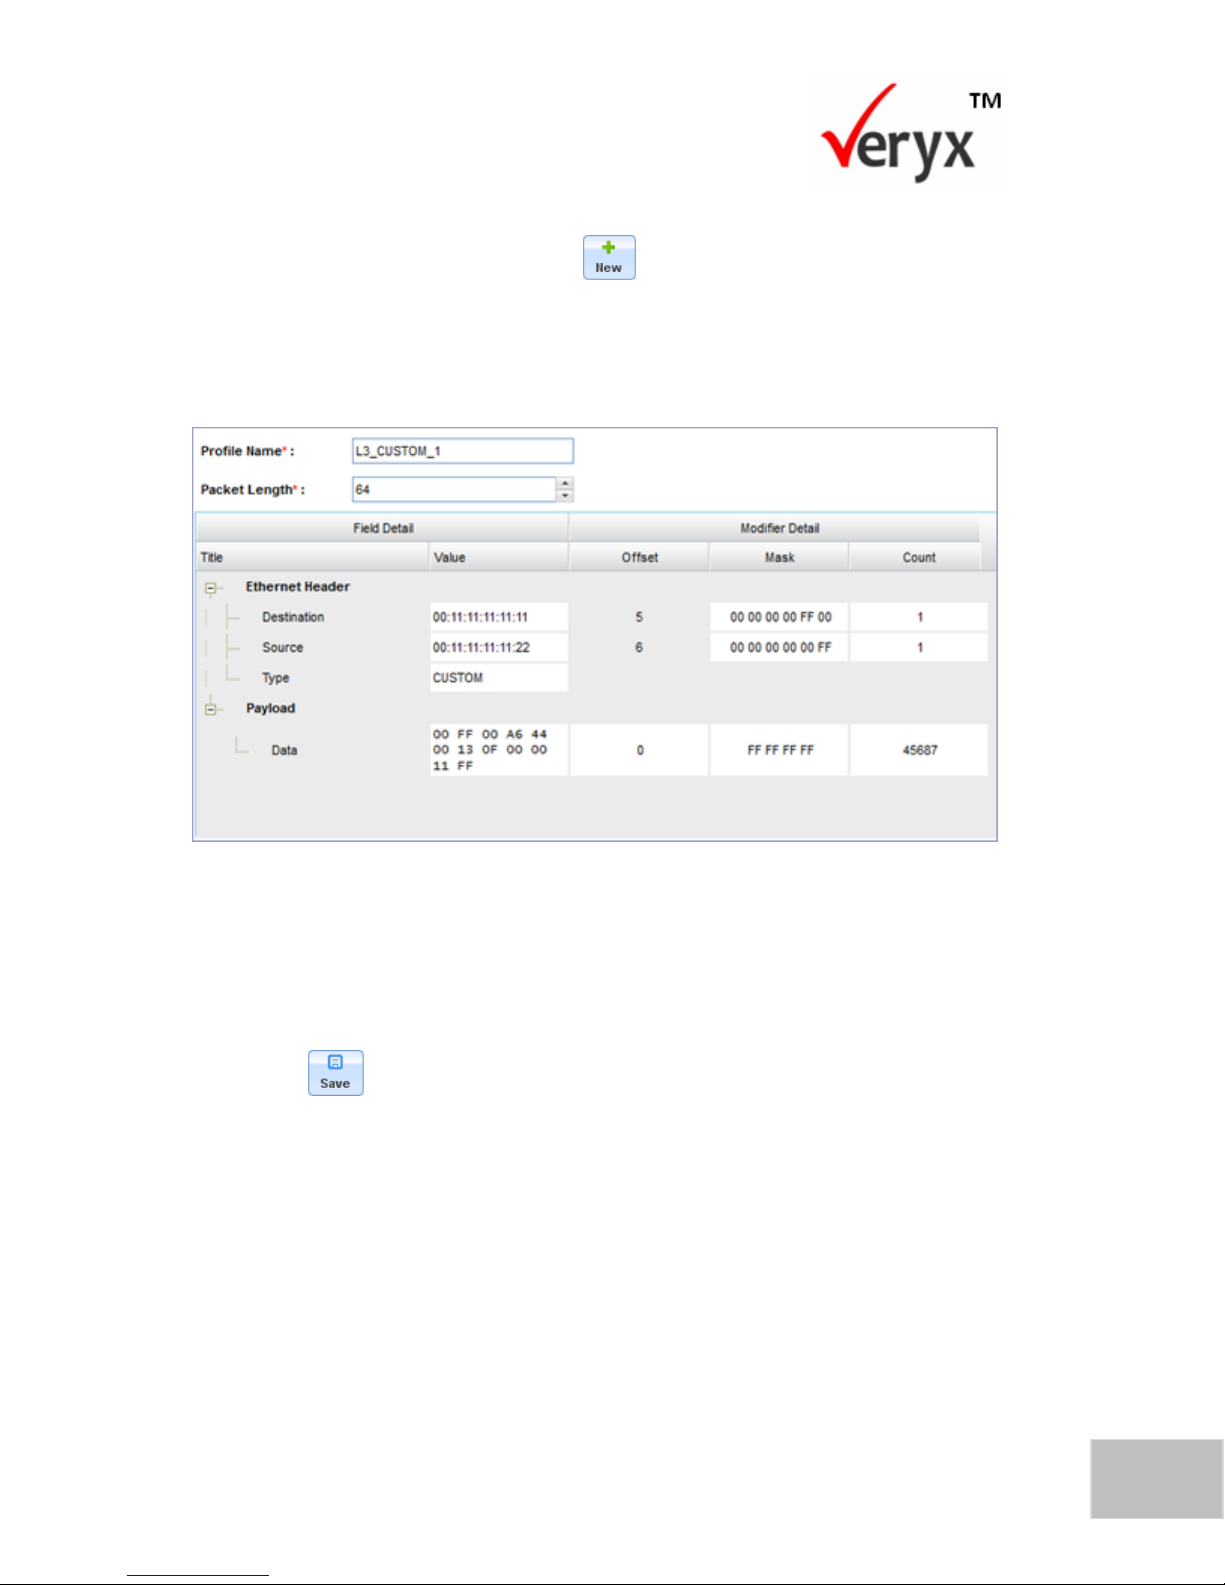
Type-Custom
When you want to create an L2 custom traffic profile, you need to set the type to
CUSTOM.
Page 38
31
Copyright © Veryx Technologies Pvt. Ltd.
Configuring a Traffic Profile
To create a L2 custom traffic profile:
1. In the Traffic Profile screen, click . The Add a New Traffic Profile
screen (Figure 16) is now displayed.
2. From the Type drop-down list, select CUSTOM. The Traffic Profile- Type
Custom screen is displayed.
Figure 20: Traffic Profile-Ether Type Custom
3. In the Data text box, enter the custom data for the packets in this traffic
profile. You can modify up to a maximum of 4 bytes of the payload data by
applying the modifiers.
4. Click to save the L2 custom traffic profile.
After a traffic profile has been created, it can be used to test the performance of a
controller.
View Traffic Profiles
To view existing traffic profiles and their details:
1. Click the Traffic Profile tab. The View Traffic Profile screen is displayed.
Page 39
32
PktBlaster SDN Controller Test-Performance Benchmarking User Guide
Copyright © Veryx Technologies Pvt. Ltd.
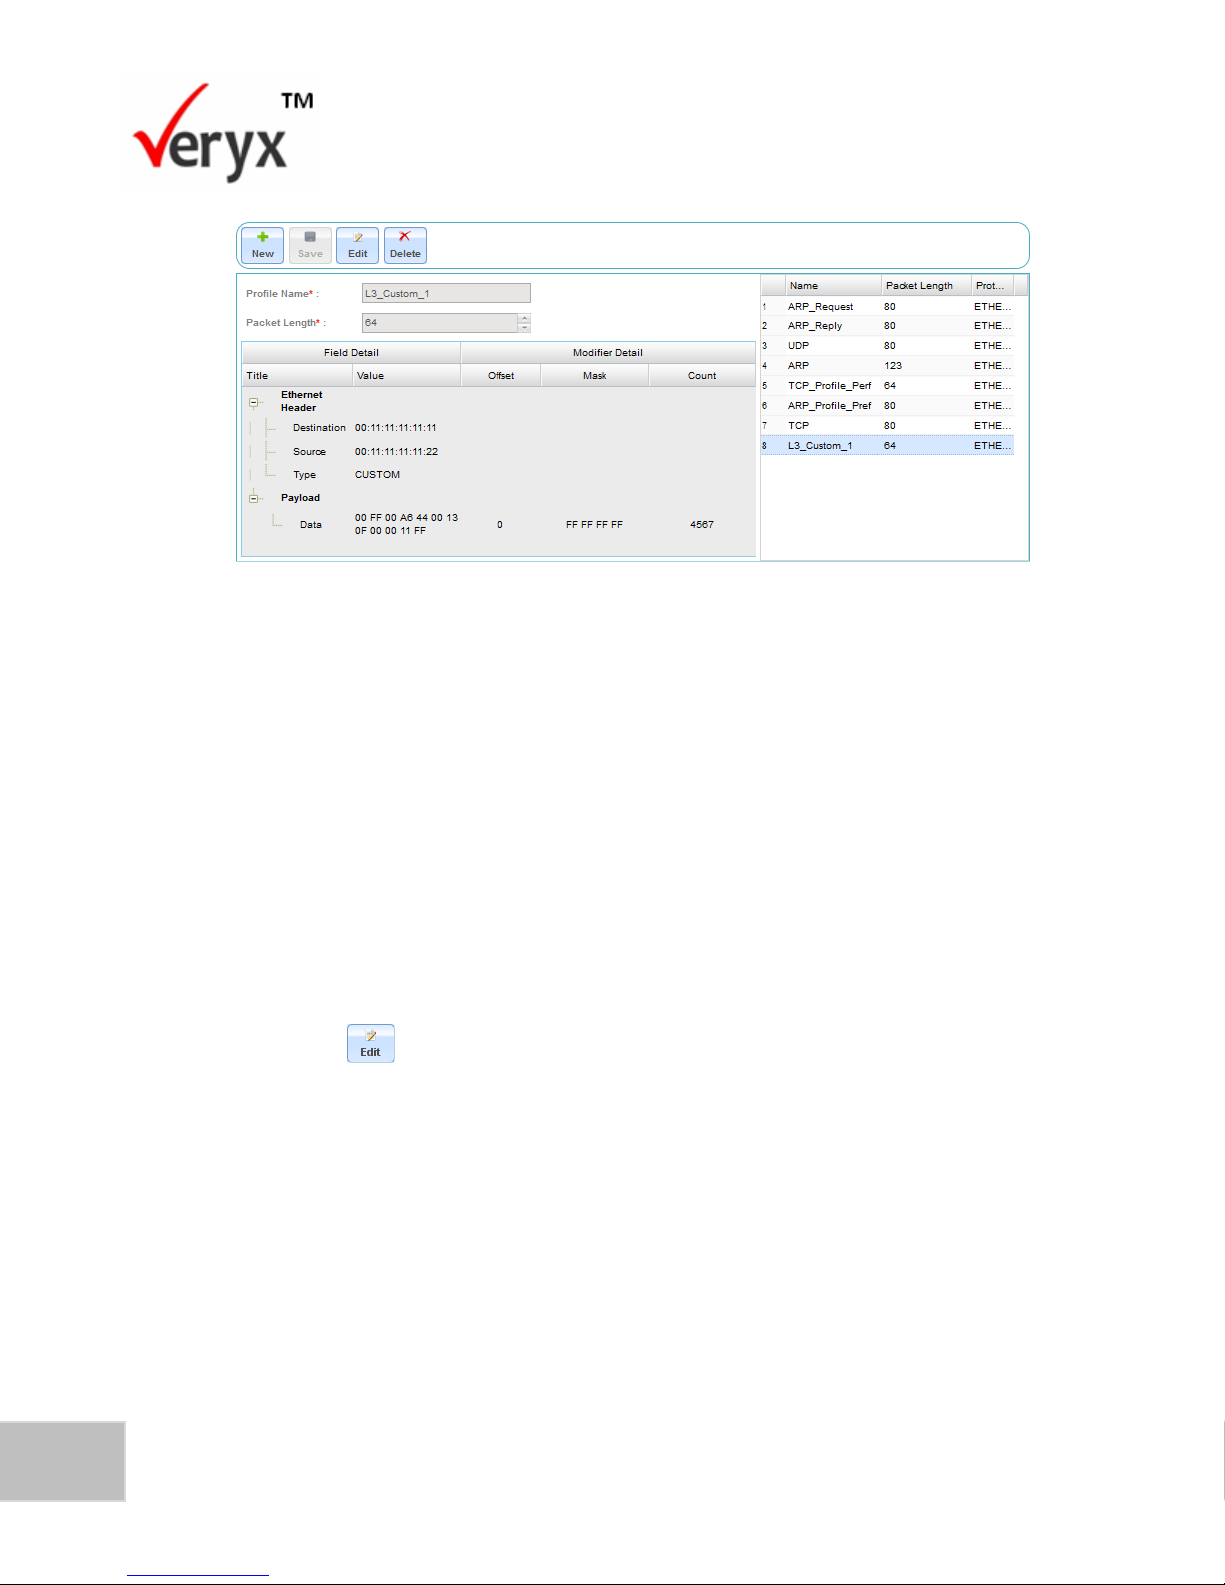
Figure 21: View Traffic Profile
The right pane displays all the traffic profiles that have been created along with the
predefined traffic types. When you click on a specific traffic profile, the details of the
traffic profile are displayed in the left pane.
Modify a Traffic Profile
To modify the information pertaining to a traffic profile:
Click the Traffic Profile tab. The Traffic Profile screen (Figure 15) is displayed.
2. In the right pane, click the traffic profile that you need to modify to display
the details in the left pane.
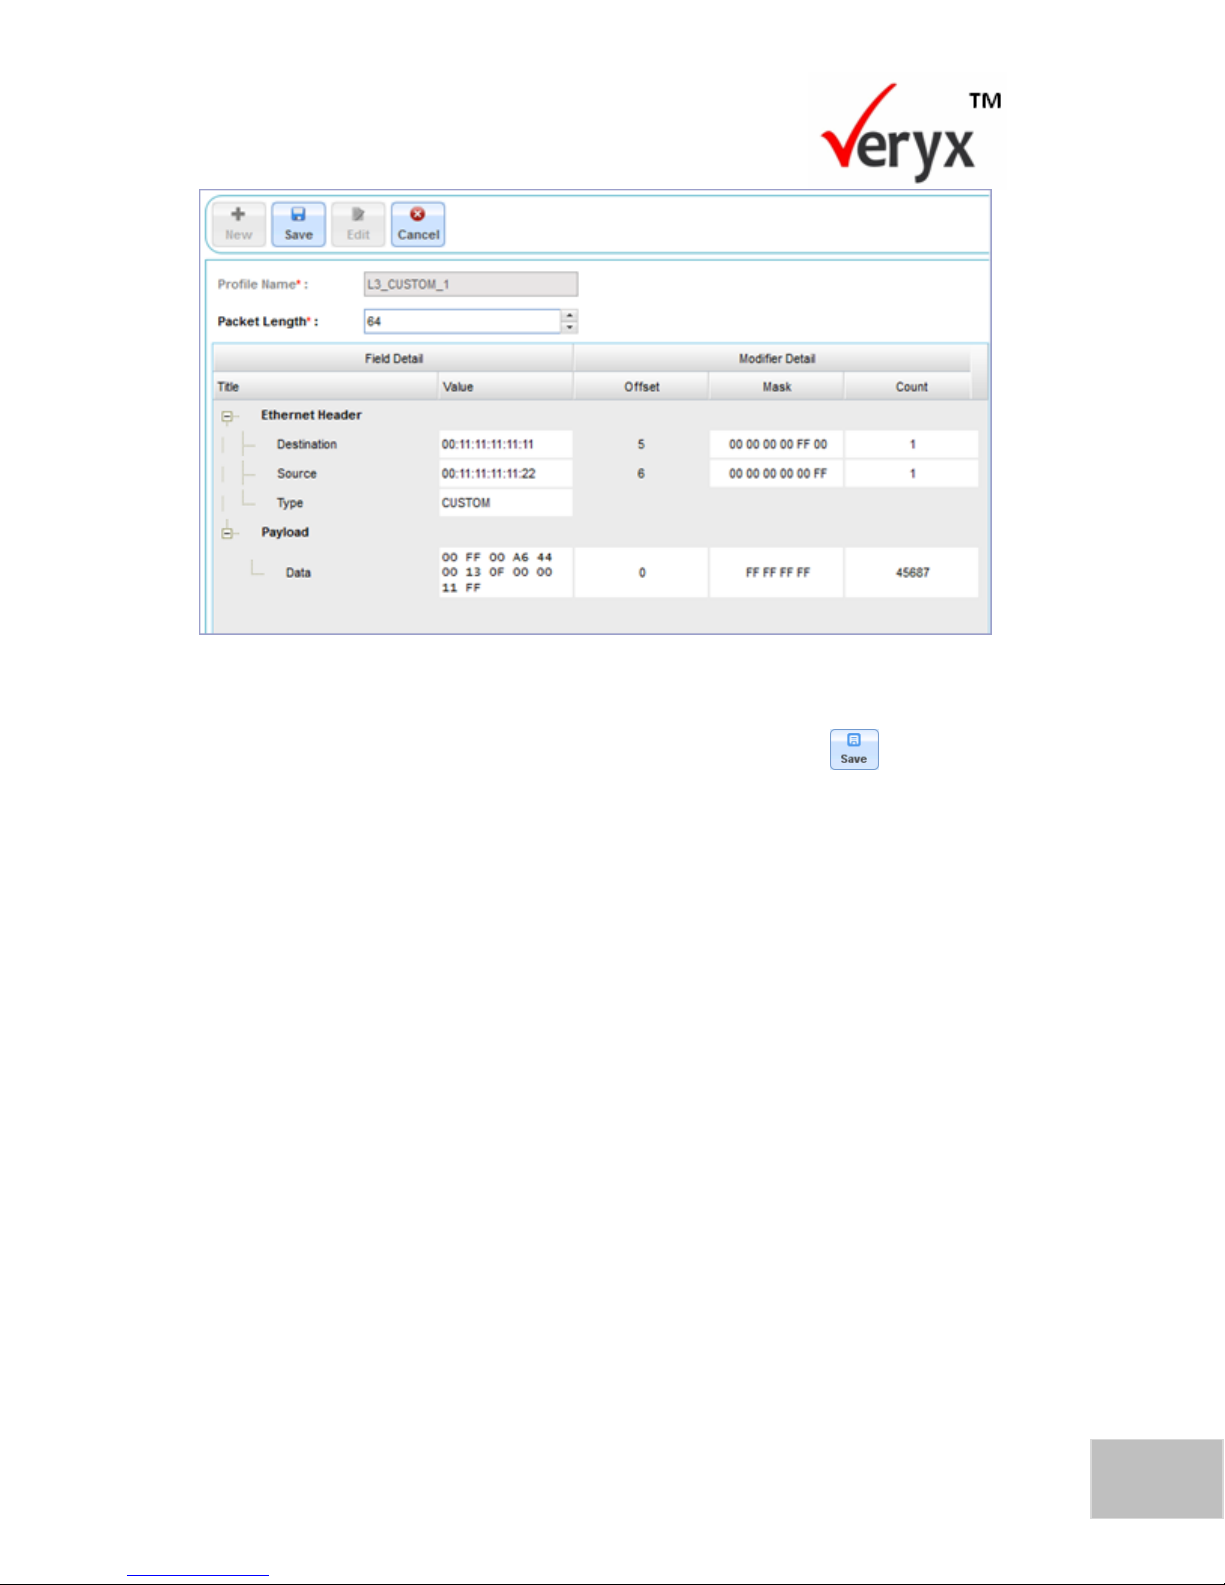
3. Click to display the details of the selected traffic profile in editable
mode as shown in the Edit a Traffic Profile screen.
Page 40
33
Copyright © Veryx Technologies Pvt. Ltd.
Configuring a Traffic Profile
Figure 22: Edit a Traffic Profile
4. Make the necessary changes to the traffic profile and click to save the
changes.
Delete a Traffic Profile
To delete a traffic profile:
1. Click the Traffic Profile tab. The Traffic Profile screen (Figure 15) is displayed.
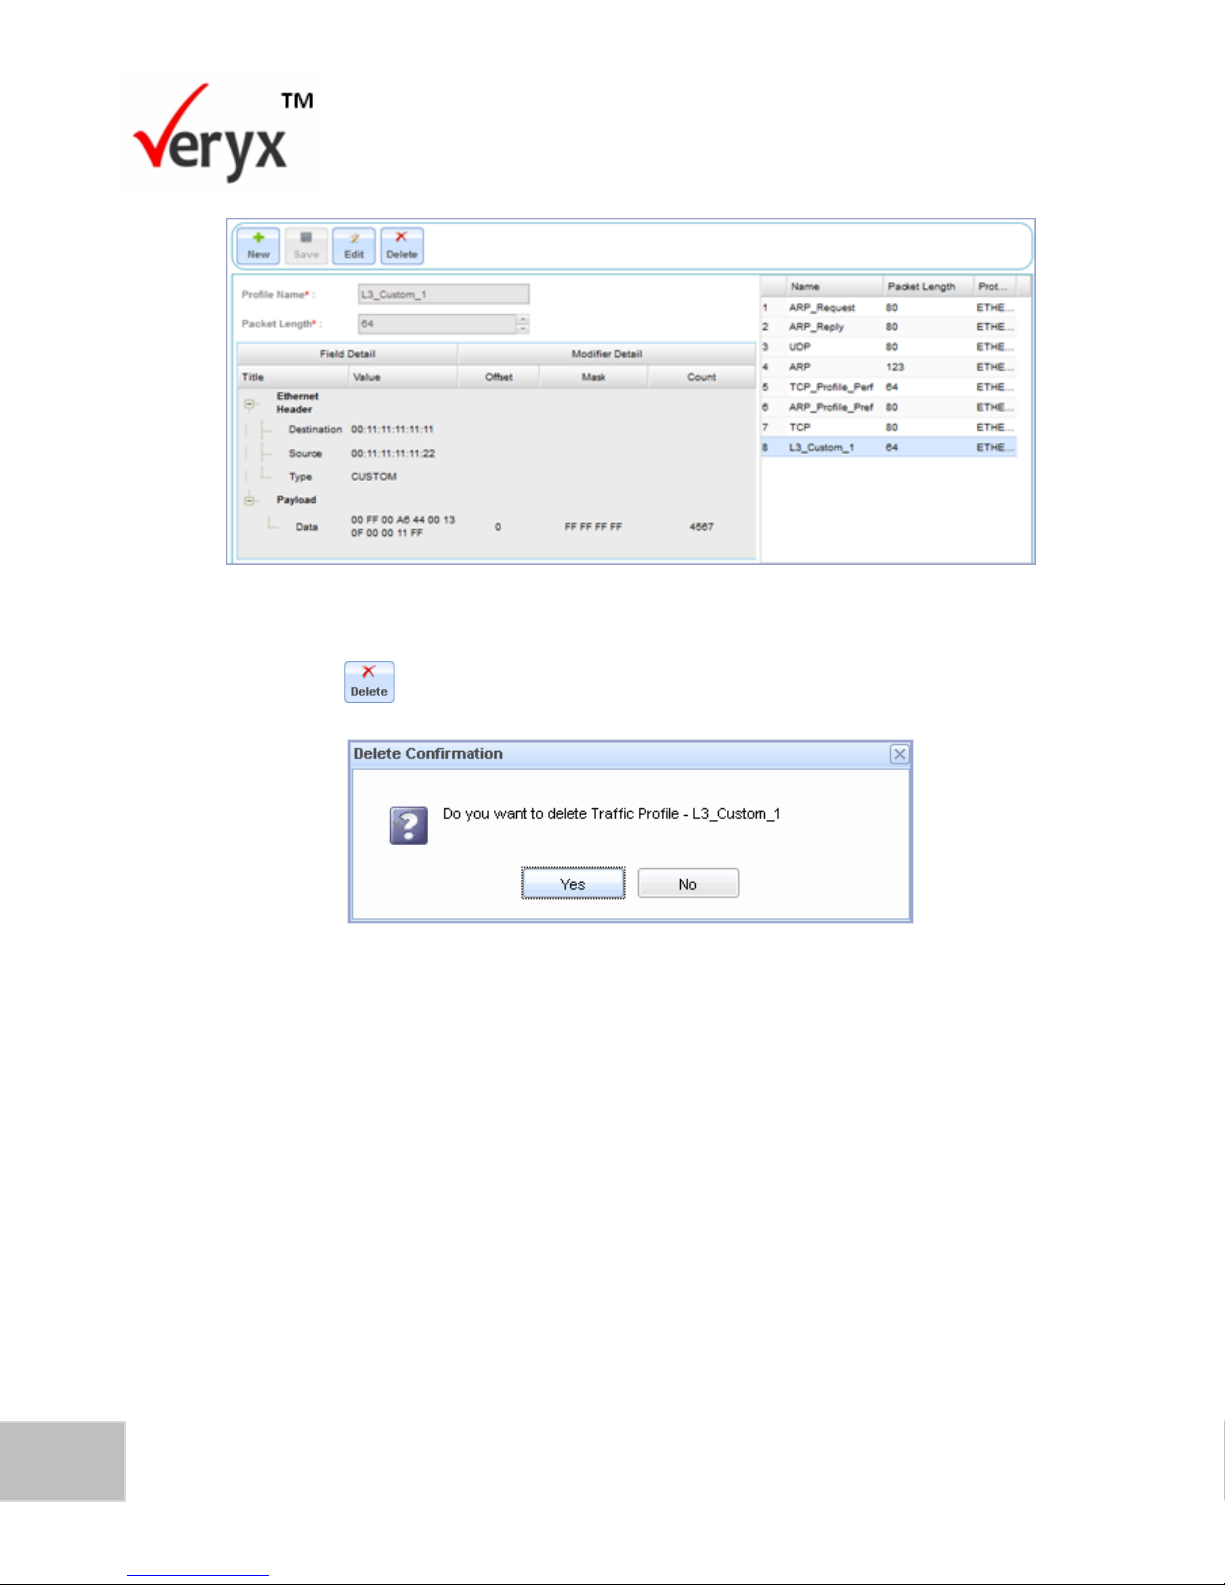
2. In the right pane, click the traffic profile that you want to delete. The details
of the selected profile are displayed in the left pane as shown in the Traffic
Profile Details screen.
Page 41
34
PktBlaster SDN Controller Test-Performance Benchmarking User Guide
Copyright © Veryx Technologies Pvt. Ltd.
Figure 23: Traffic Profile Details
3. Click . The Delete Confirmation dialog box is now displayed.
Figure 24: Delete Confirmation Dialog Box
Click Yes to delete the traffic profile.
Page 42

Copyright © Veryx Technologies Pvt. Ltd.
35
5 PERFORMANCE TESTS
This chapter describes the performance tests that can be executed on a controller. It
also describes how you can configure the test parameters to execute a test.
Types of Tests
When a controller is added and connected to the network, it can be tested for the
following:
Performance Throughput
Performance Latency
Performance Robustness
Performance Throughput
Throughput is the total number of flows generated per second by the controller or
the rate at which flows are generated by the controller.
To test the Performance Throughput of a controller, the switches of the participating
switch group network send out as many packet-in messages towards the controller
as possible, in a given duration.
The throughput is measured based on the Flow Measured by parameter that is
specified by the user. The user can choose to measure the Packet out messages or
Flow Mod messages that the controller sends back as a response to the switches.
The rate of flow insertion of this measurement is the throughput.
Performance Latency
This is the time taken by the controller to create a flow entry in the flow table. It is
also known as the Flow Insertion time. The Flow Insertion time can also be
described as the time taken to obtain a response from the controller.
Performance Robustness
To test performance robustness, valid packet-in messages are sent to the controller
along with malformed packet-in messages. The controller should handle and
P a g e | 3535
Page 43
36
PktBlaster SDN Controller Test-Performance Benchmarking User Guide
Copyright © Veryx Technologies Pvt. Ltd.
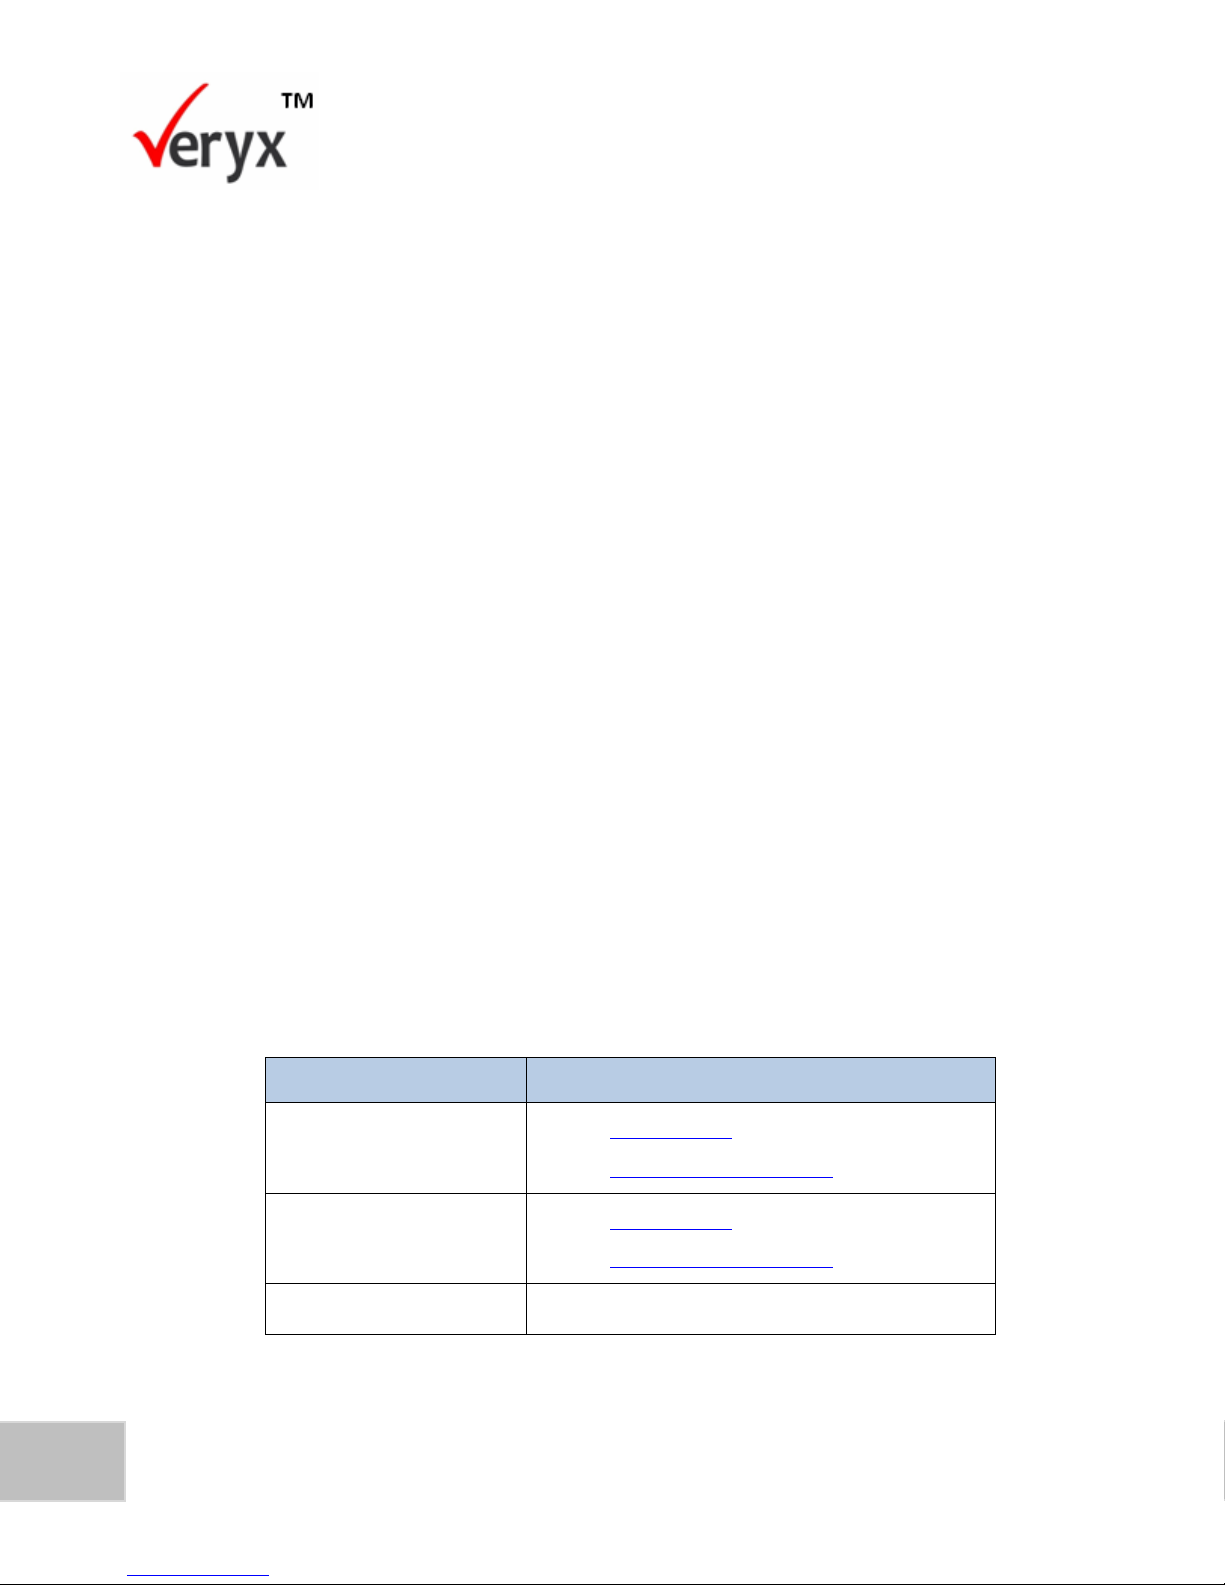
TEST TYPE
TESTING MODES
Throughput
Normal mode
Incremental Switch mode
Latency
Normal mode
Incremental Switch mode
Robustness
Not Applicable
respond to the valid packet-in messages and ignore the malformed packet-in
messages. Controller response is measured either in Packet out messages or in Flow
Mod messages.
The test is divided into 4 iterations:
For the first 25 % of the test duration, normal packet-in messages are sent as
test traffic to stabilize and baseline controller performance.
In the second 25% of the test duration, error packets are sent along with
normal packet-in messages and the percentage and the error value depend
on the test configuration.
In the third 25% of the test duration, the percentage and the error value of
the error packets is doubled in comparison with the second iteration.
In the fourth iteration, normal packet-in messages are sent to verify the
stability of the controller performance.
Testing Modes
The Throughput and Latency tests can be carried out in different modes as shown in
the following table. To know more about a testing mode, click on the corresponding
link in the table.
Table 5: Testing Modes
Page 44

37
Copyright © Veryx Technologies Pvt. Ltd.
Performance Tests
Throughput Test in Normal Mode
This test loads the controller to the maximum and measures the total number of
Packet out messages or flow mod messages that the controller is able to send back
to the switches.
The test will run for the configured switches of the participating switch group
network. OpenFlow channels are established for the configured number of switches.
The tool will generate packet-in messages for each switch, for the test duration that
is specified.
This process is repeated for the number of iterations that was configured. During the
test, packet-in messages are sent to the controller so that the TCP window is always
full.
Throughput Test in Incremental Switch Mode
This test measures how the controller handles load when it is generated in
increments. In this mode, only one switch group can participate.
The test is executed in four iterations. The first iteration is executed for 25% of the
configured number of switches. OpenFlow sessions are then established for the 25%
of the configured number of switches. For subsequent iterations, the number of
switches is incremented in steps of 25% and OpenFlow sessions are established for a
further 25% of the switches until the total number of configured switches has been
included in the testing.
Latency Test in Normal Mode
This mode measures the OpenFlow controller’s request processing time under lowload conditions.
To run the latency test in normal mode, at least one switch group network has to be
selected. OpenFlow sessions to the controller are established for the total number
of configured switches of the participating switch group network.
A packet-in message is sent from each simulated switch to the controller. The
switches wait for a response from the controller before sending the next packet.
Thus, each simulated switch ensures that only a single outstanding new packet-in
message is sent to the controller.
Page 45

38
PktBlaster SDN Controller Test-Performance Benchmarking User Guide
Copyright © Veryx Technologies Pvt. Ltd.
The simulated switch waits for a response (a Packet out message or a flow mod
message) before soliciting the next request. The total difference in milliseconds
between the time a packet-in message is sent and the response (Packet out or Flow
Mod message) is received. The latency computation is time stamp based. This test is
repeated for the number of iterations that have been configured.
Latency Test in Incremental Switch Mode
This mode measures the request processing time of an OpenFlow controller under
incremental switch load conditions. You can select only one switch group network
for a test.
The test is executed for four iterations. Each iteration, 25% of the switches
belonging to the participating switch group are added.
The first iteration is executed for 25% of the configured number of switches.
OpenFlow sessions are established for only 25% of the configured number of
switches. For subsequent iterations, the number of switches is incremented in steps
of 25% until the total number of configured switches has been included in the
testing.
Each simulated switch maintains exactly one outstanding new packet-in message,
waiting for a response before soliciting the next request. This process is repeated as
many times as possible within the configured test duration. The response (Packet
out message or Flow Mod message) received at the end of the time period is used to
compute the total difference in milliseconds that it takes for the controller to
process each packet-in message.
Configure Test Parameters
To execute a performance test on a controller, you need to configure the
parameters required for testing.
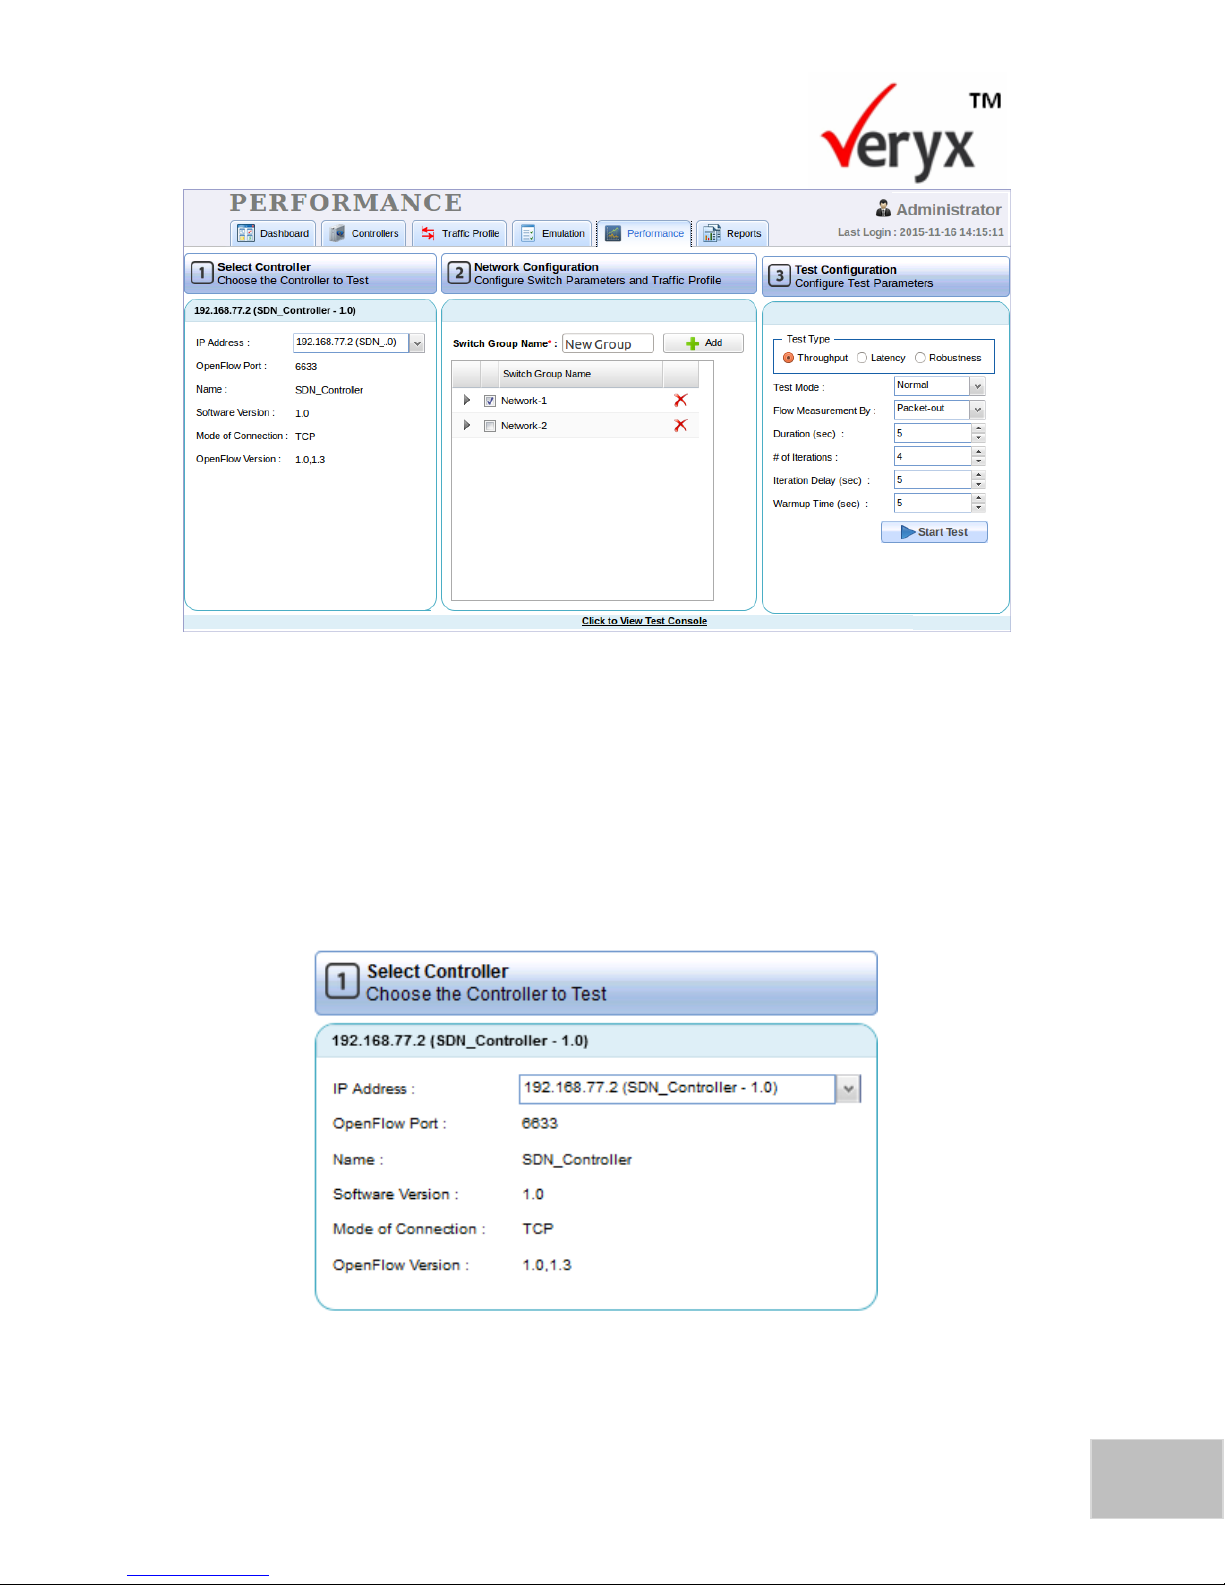
To configure and execute a test, click the Performance tab to display the
Performance screen.
Page 46
39
Copyright © Veryx Technologies Pvt. Ltd.
Performance Tests
Figure 25: Performance Screen
In the Performance screen, you can configure the parameters for test execution
through the following steps.
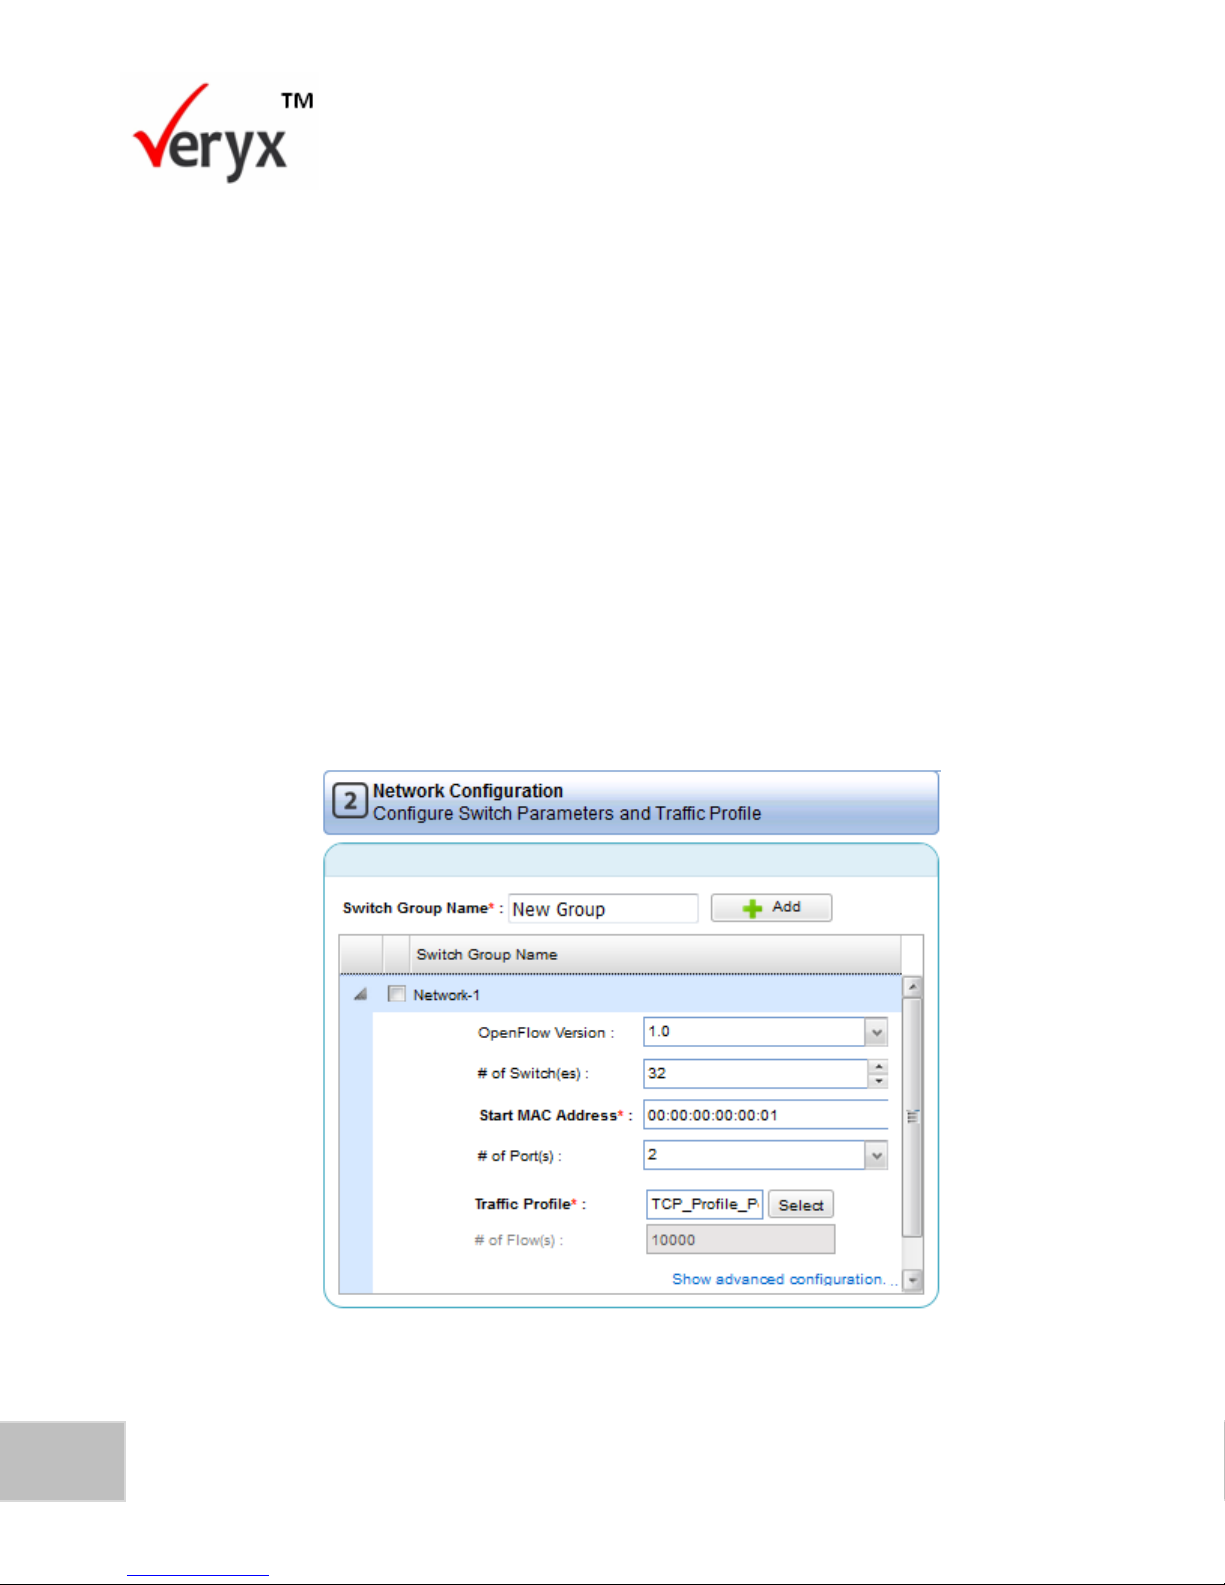
Step 1: Select Controller
In the Select Controller pane, you can specify the controller that needs to be tested.
Figure 26: Select Controller Pane
Page 47
40
PktBlaster SDN Controller Test-Performance Benchmarking User Guide
Copyright © Veryx Technologies Pvt. Ltd.
The IP Address drop-down list shows the controllers that have been added. You can
select the controller for which the test is to be performed from the list. To view the
port number at which the controller is listening and other details see the Select
Controller pane (Figure 26).
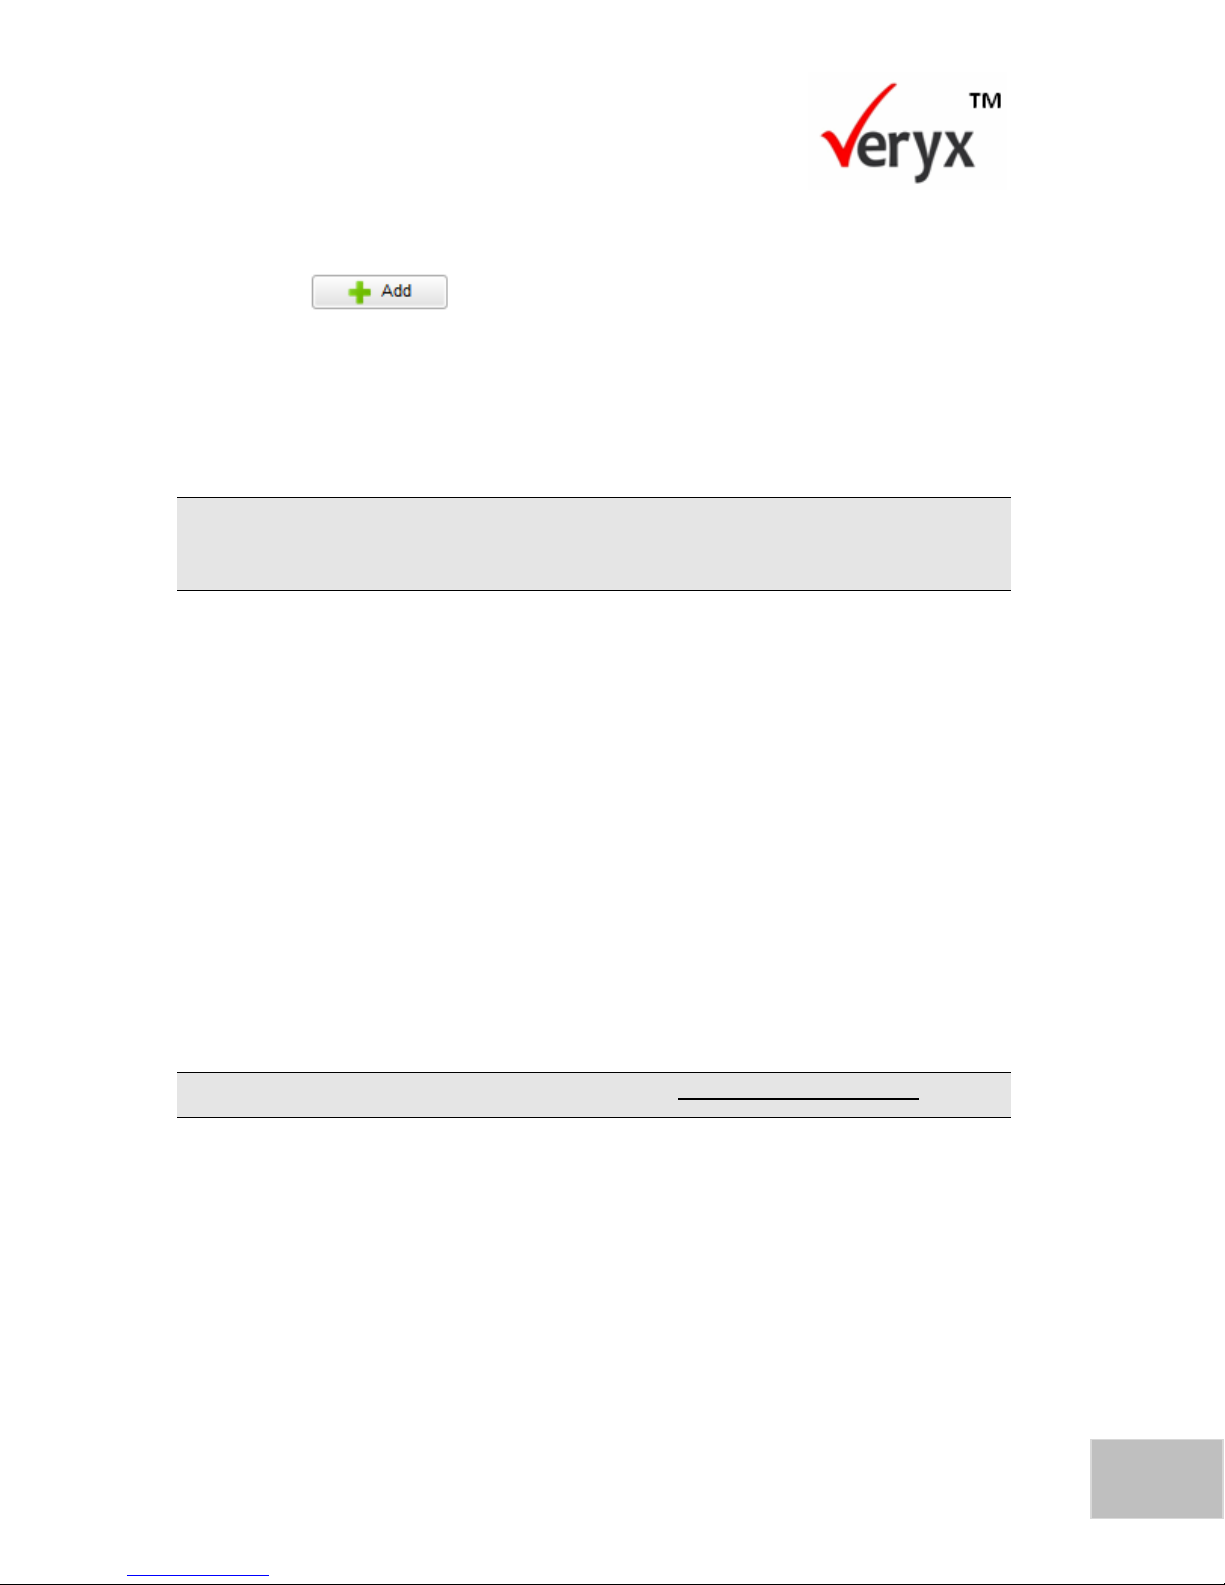
Step 2: Network Configuration
The Network Configuration enables you to do the following:
Create between 1 to 4 switch network configurations.
Each switch network configuration can have different versions of the
OpenFlow switch specification.
The maximum number of switches in all the switch group network
configurations put together can be 1000.
Figure 27: Network Configuration Pane
Page 48
41
Copyright © Veryx Technologies Pvt. Ltd.
Performance Tests
In the Network Configuration pane (Figure 27):
1. In Switch Group Name, specify the name of the simulated SDN network and
Click …
2. In OpenFlow Version, specify the version of the Open flow channel between
switches and controller.
3. In # of Switches, enter the number of OpenFlow switches that need to be
simulated.
For Throughput Tests and Latency Tests the maximum # of switches is 1000. For
Robustness Tests the maximum # of switches is 64.
4. In Start MAC address, specify the address of the first switch for each switch
group. For example:
If the MAC address of the first switch is 00:00:00:00:00:01 and consists of
10 switches in the first switch group, the first switch number of the 2nd
switch group Start MAC address will be 00:00:00:00:00:11.
If you specify a value less than 11 in the starting MAC address for the 2
nd
switch group, it will result in an error message.
5. In Number of Ports, specify the number of ports for each switch of the
simulated network.
6. In the Traffic Profile field, click Select beside the text box that allows you
select a suitable traffic profile carried by packet-in messages.
For details on how to create a Traffic Profile, refer to the Configuring a Traffic Profile chapter.
7. # of flows displays the number of hosts simulated in each switch.
Show Advanced Configuration
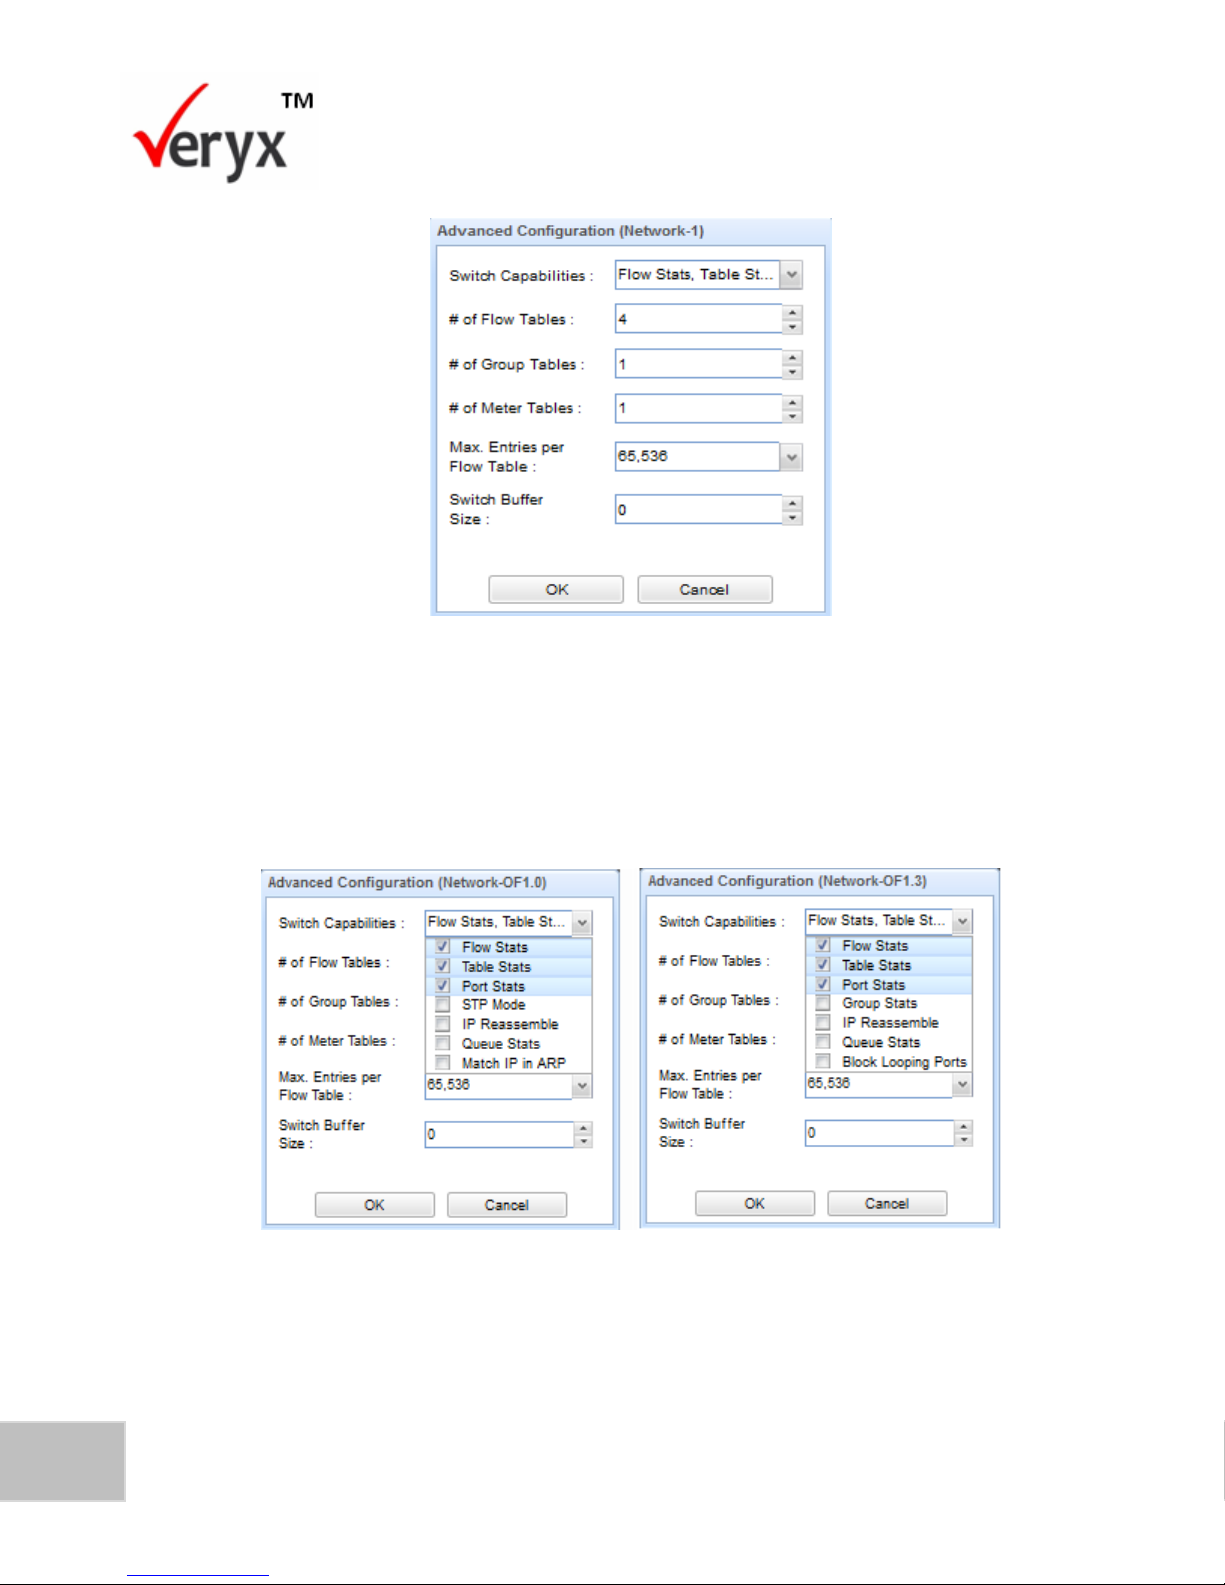
The components displayed in Figure 28 enable detailed configuration for each switch
in a switch group network. To view the range, let your cursor hover over the specific
field.
Page 49
42
PktBlaster SDN Controller Test-Performance Benchmarking User Guide
Copyright © Veryx Technologies Pvt. Ltd.
Figure 28: Advanced Configuration
Switch Capabilities: Used for feature_reply message as specified in the
OpenFlow specification. Switch Capabilities specification for OpenFlow
version 1.0 and 1.3 are displayed in Figure 29.
Figure 29: Switch Capabilities OF Version 1.0 and 1.3
#of Flow Tables: Specify the number of flow tables.
#of Group Tables: Specify the number of group tables.
Page 50
43
Copyright © Veryx Technologies Pvt. Ltd.
Performance Tests
#of Meter Tables: Specify the number of meter tables.
Max entries for Flow Table: Specify the number of entries in the flow table.
Switch Buffer Size: Configure the buffer size. Zero indicates there is no buffer
available.
Step 3: Test Configuration
In the Test Configuration pane, you can specify the type of test to be performed, the
testing mode and other test parameters.
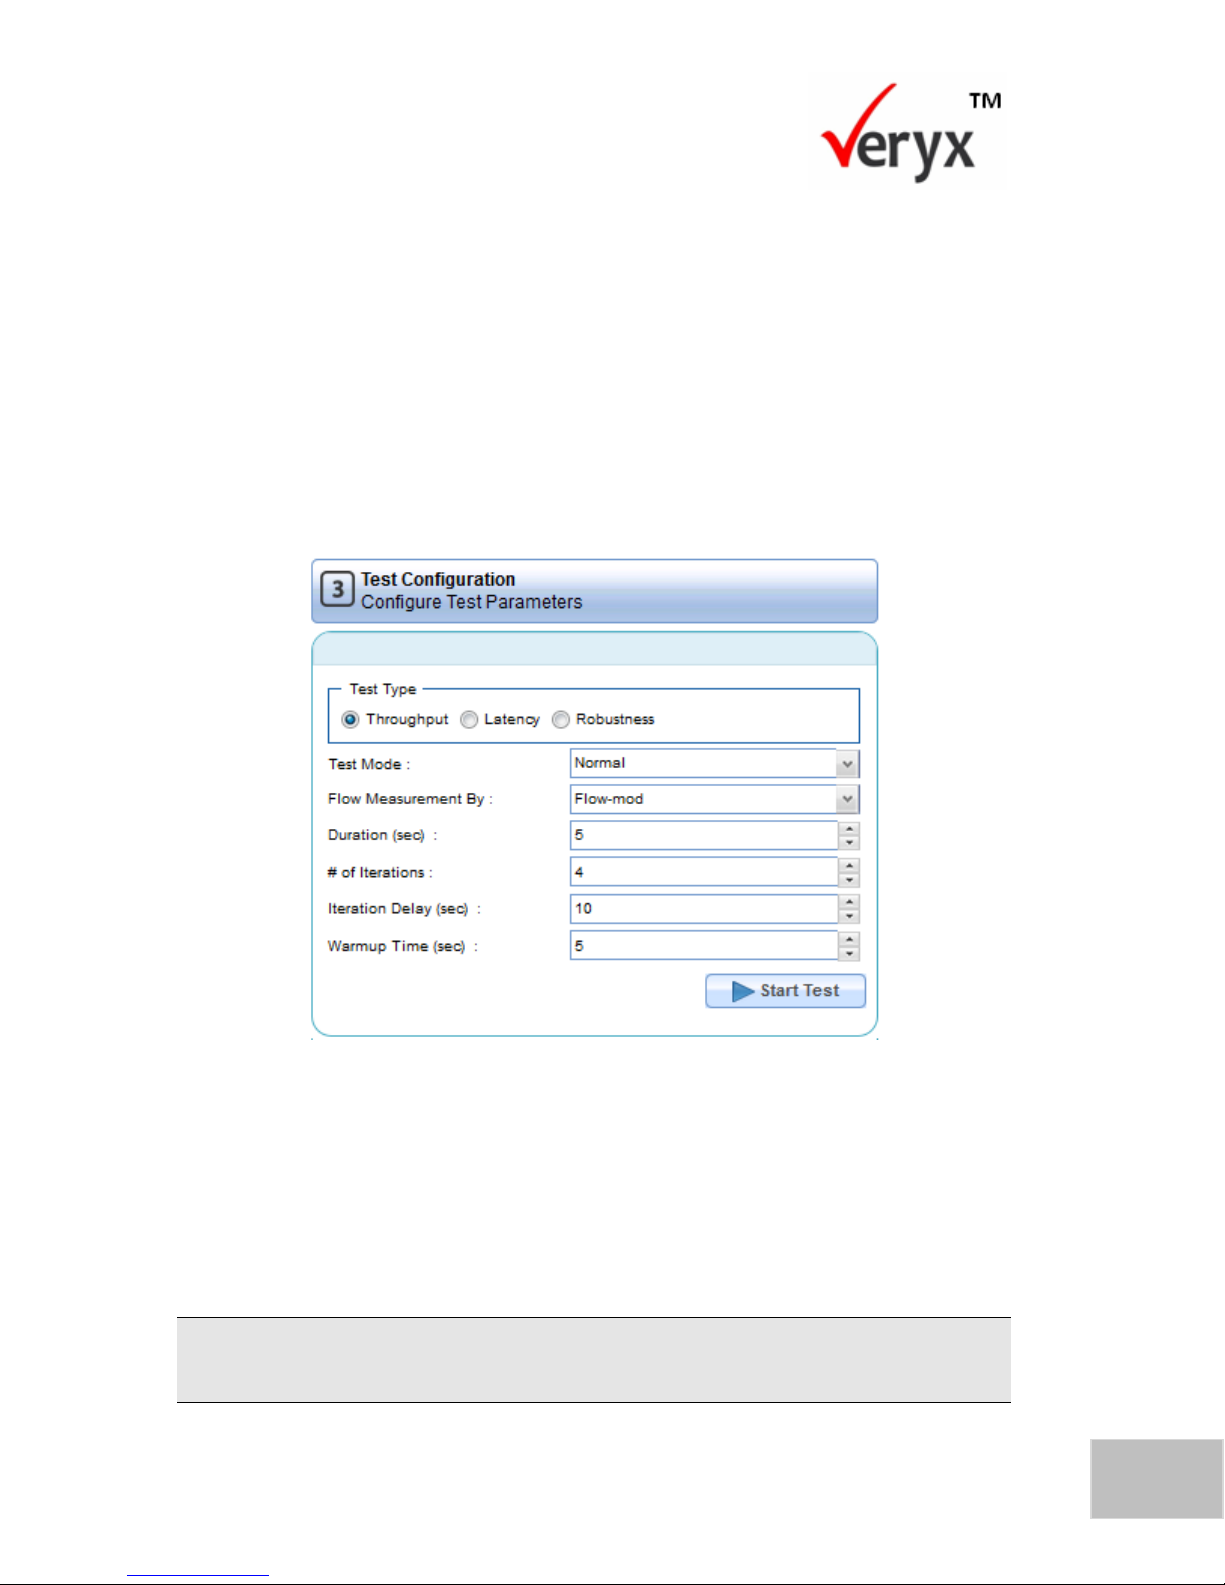
Figure 30: Test Configuration Pane
In the Test Configuration pane (Figure 30):
1. To specify the Test Type you want to perform, select Throughput, Latency or
Robustness as applicable.
2. From the Test Mode drop-down list, select the required mode of testing.
Refer to the Testing Modes section for more details on the different modes used in testing.
This is not applicable for Robustness Test.
Page 51

44
PktBlaster SDN Controller Test-Performance Benchmarking User Guide
Copyright © Veryx Technologies Pvt. Ltd.
3. In Flow Measurement By, select the response used to compute the
Throughput, Latency or Robustness of the controller. This could be Packet
out message or Flow Mod message.
4. The Duration box, displays the duration of the performance test in seconds.
5. In the # of Iterations box, type or select the number of times the test has to
be repeated.
For example, if the duration of the test is set to 5 seconds and the number of
iterations is 5, then there would be 5 executions of the test, each for 5
seconds.
You can set the Duration of the test to a maximum of 60 seconds. The maximum number of
iterations for a test is 60. For Incremental Mode Test, the number of iterations is set to 4.
This step is not applicable for Robustness Test.
6. In the Iteration Delay (sec) parameter, specify the number of seconds the
test should pause before the next iteration starts.
7. In the Warmup Time (sec) parameter, specify the number of seconds the test
should wait before sending the test traffic to the controller.
8. In the Malform Field, you can select the packet-in messages fields that can
be malformed.
OF Version: OF version in the header.
OF Header Length: Total length of the packet-in message in the OF
header.
OF Message Type: Type of message in the OF header.
9. In Malform Pkts%, specify the percentage of malformed packet-in messages
that will be sent along with normal packet-in messages. The error value
depends on the Malform field.
Malform Field and Malform Pkts % parameters are applicable only for Robustness Test.
Page 52
45
Copyright © Veryx Technologies Pvt. Ltd.
Performance Tests
10. After you have configured the parameters, from the Network Configuration
pane select the switch group network for running the test and click
to execute the test.
For Throughput, Latency and Robustness tests, the minimum number of switches for the
Incremental Mode test must be 4. For more details about the different tests that can be
executed, refer to Chapter 7, Chapter 8 and Chapter 9.
Page 53

46
PktBlaster SDN Controller Test-Performance Benchmarking User Guide
Copyright © Veryx Technologies Pvt. Ltd.
This page has been intentionally left blank.
Page 54
47
Copyright © Veryx Technologies Pvt. Ltd.
Test Execution Details
6 TEST EXECUTION DETAILS
This chapter describes the results of a test execution and the procedure to reexecute a test. The details explained in this chapter apply to Throughput tests,
Latency tests and Robustness tests.
Refer to Chapter 7: Executing Throughput Tests, Chapter 8: Executing Latency Tests and
Chapter 9: Executing Robustness Tests for details specific to these test executions.
After you have configured all the parameters and started the execution of the
required test, you can view the progress of the test execution.
View a Test in Progress
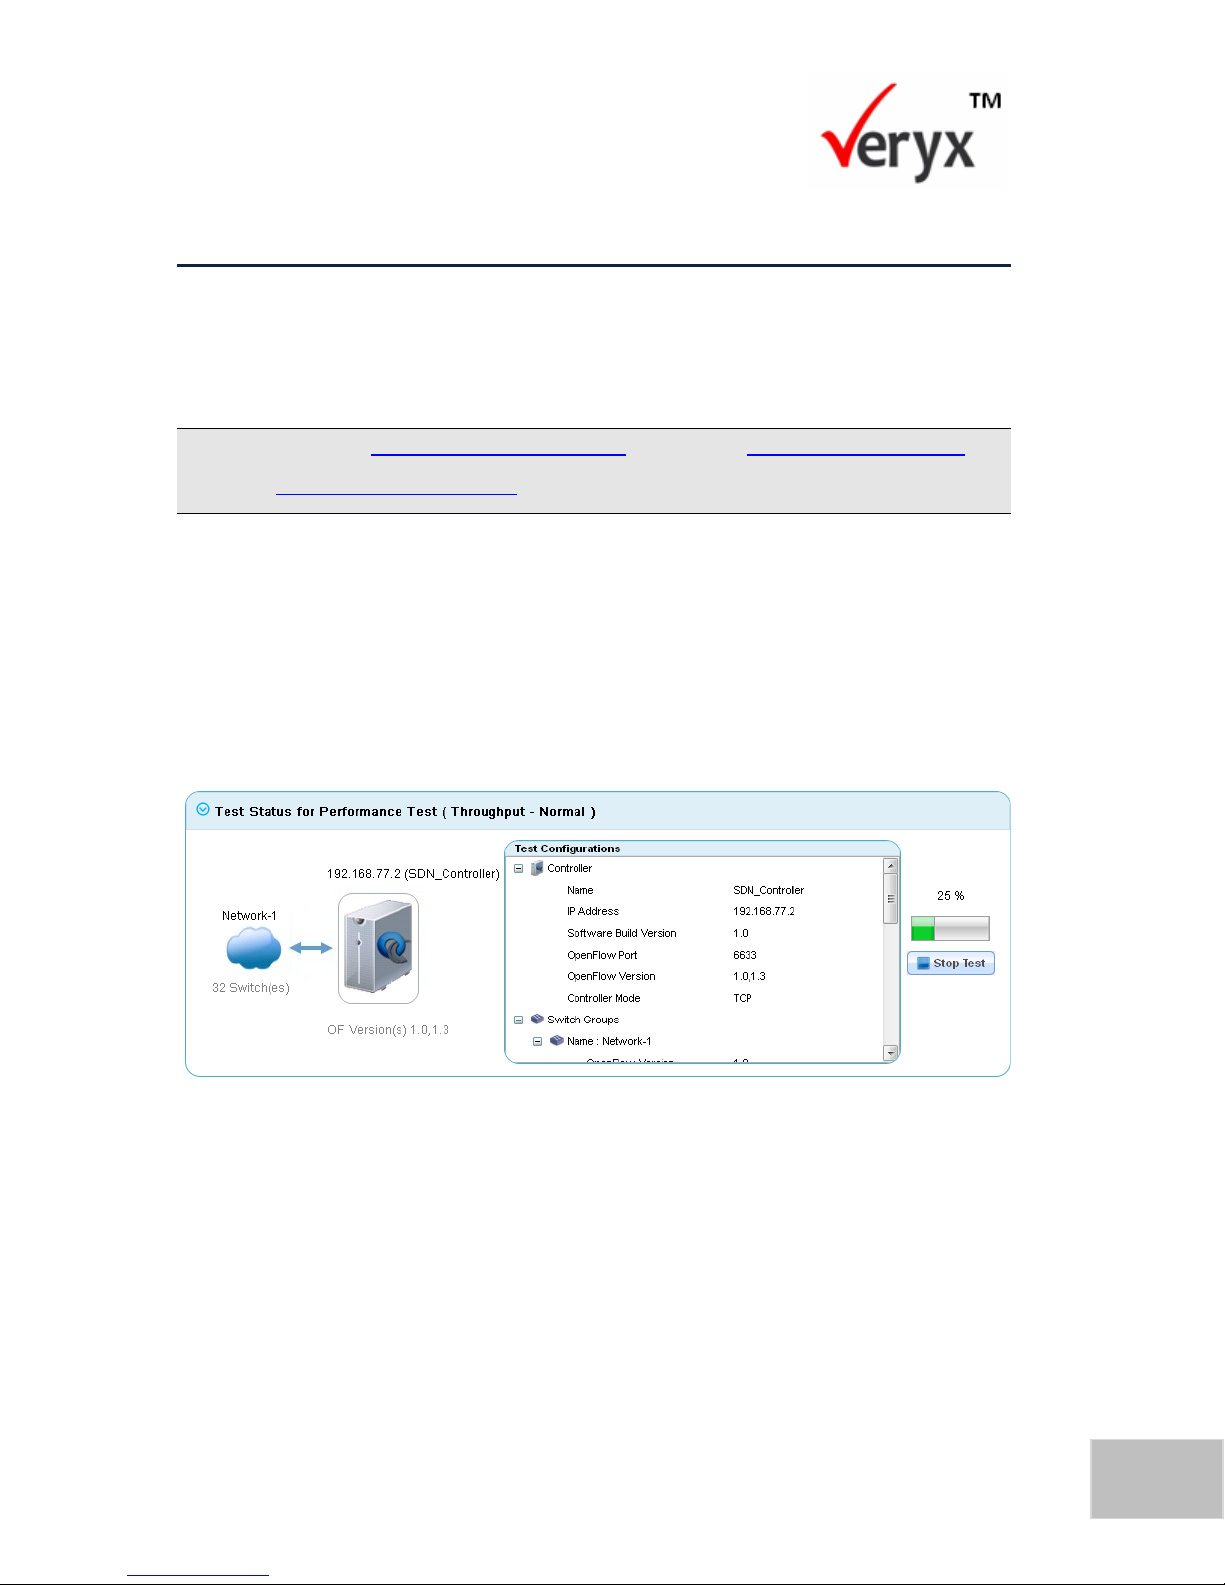
The progress of Test Execution for a Throughput test in Normal mode are displayed
in the Test Execution in Progress (Upper and Lower) screens.
Figure 31: Test Execution in Progress (Upper)
Page 55
48
PktBlaster SDN Controller Test-Performance Benchmarking User Guide
Copyright © Veryx Technologies Pvt. Ltd.
Figure 32: Test Execution in Progress (Lower)
View Test Results
When a test execution completes successfully, the response of the controller is
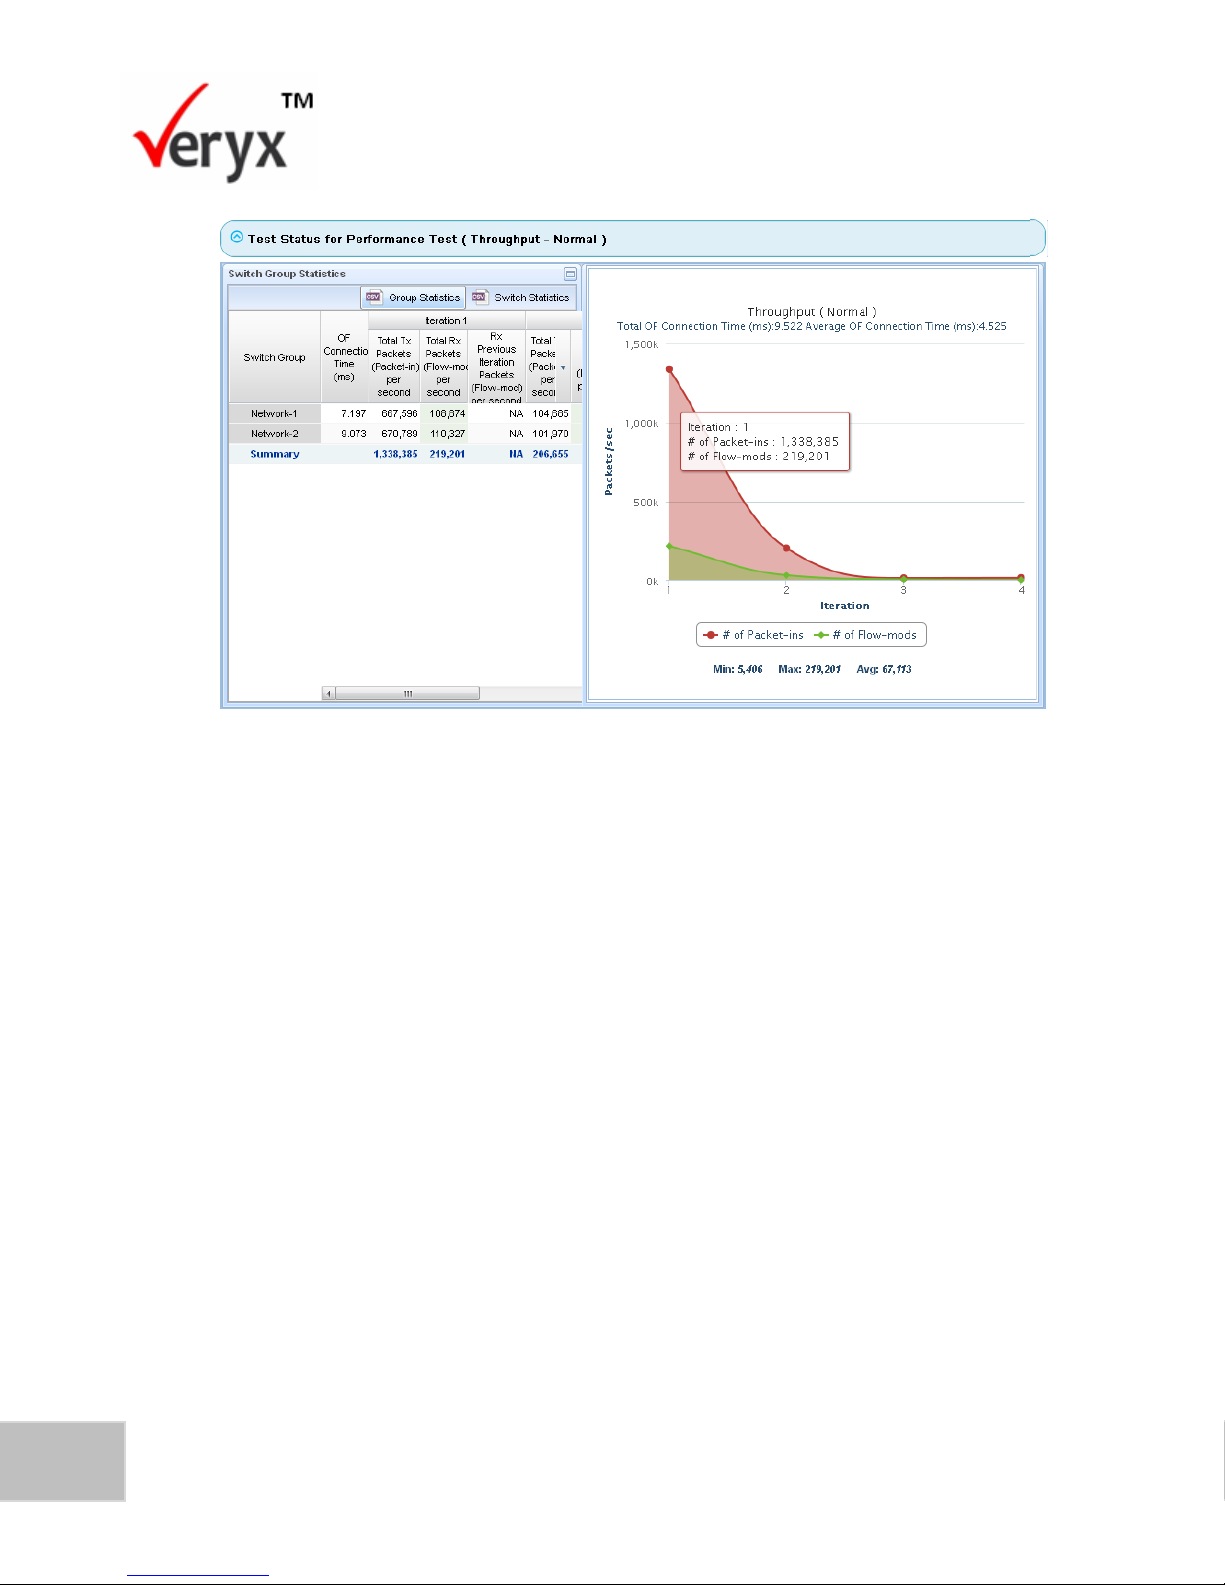
captured and plotted in a graph and in a table. The test results display the following
information about the test that was performed:
The configuration details for the test that was executed
A graph that shows the output trend
A table that shows precise details
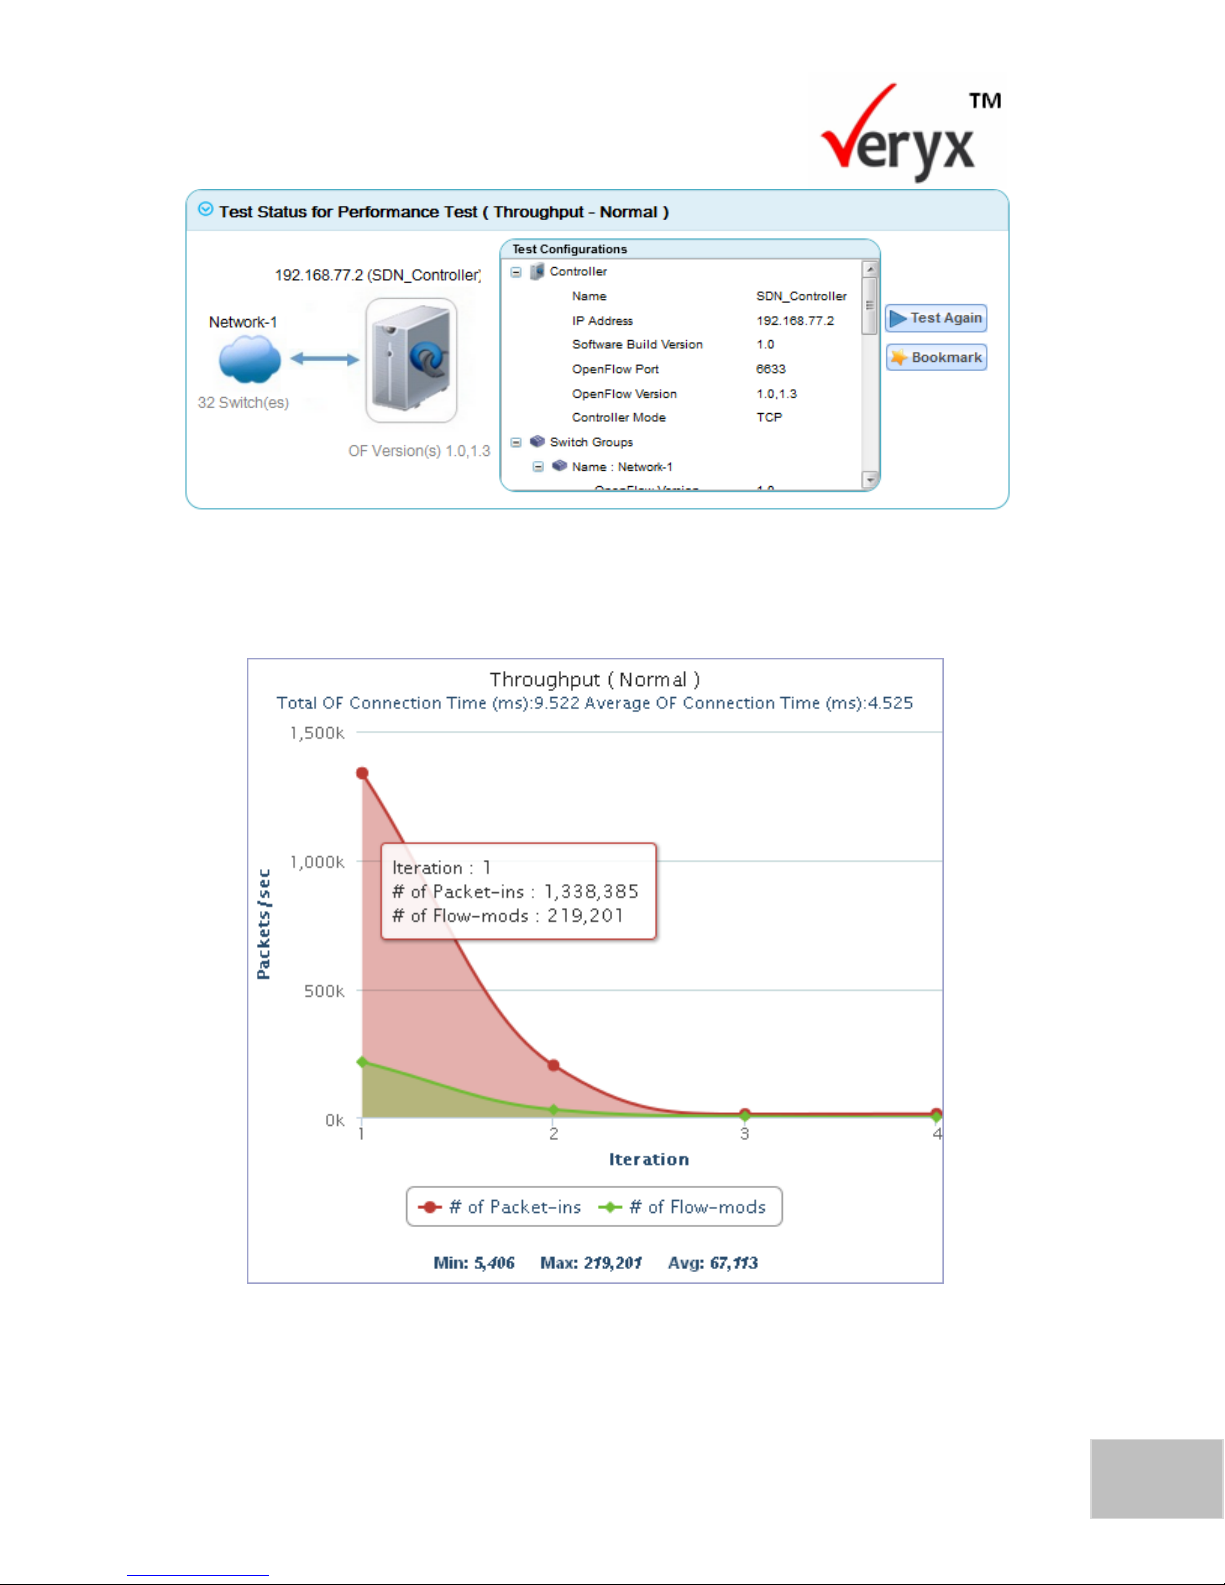
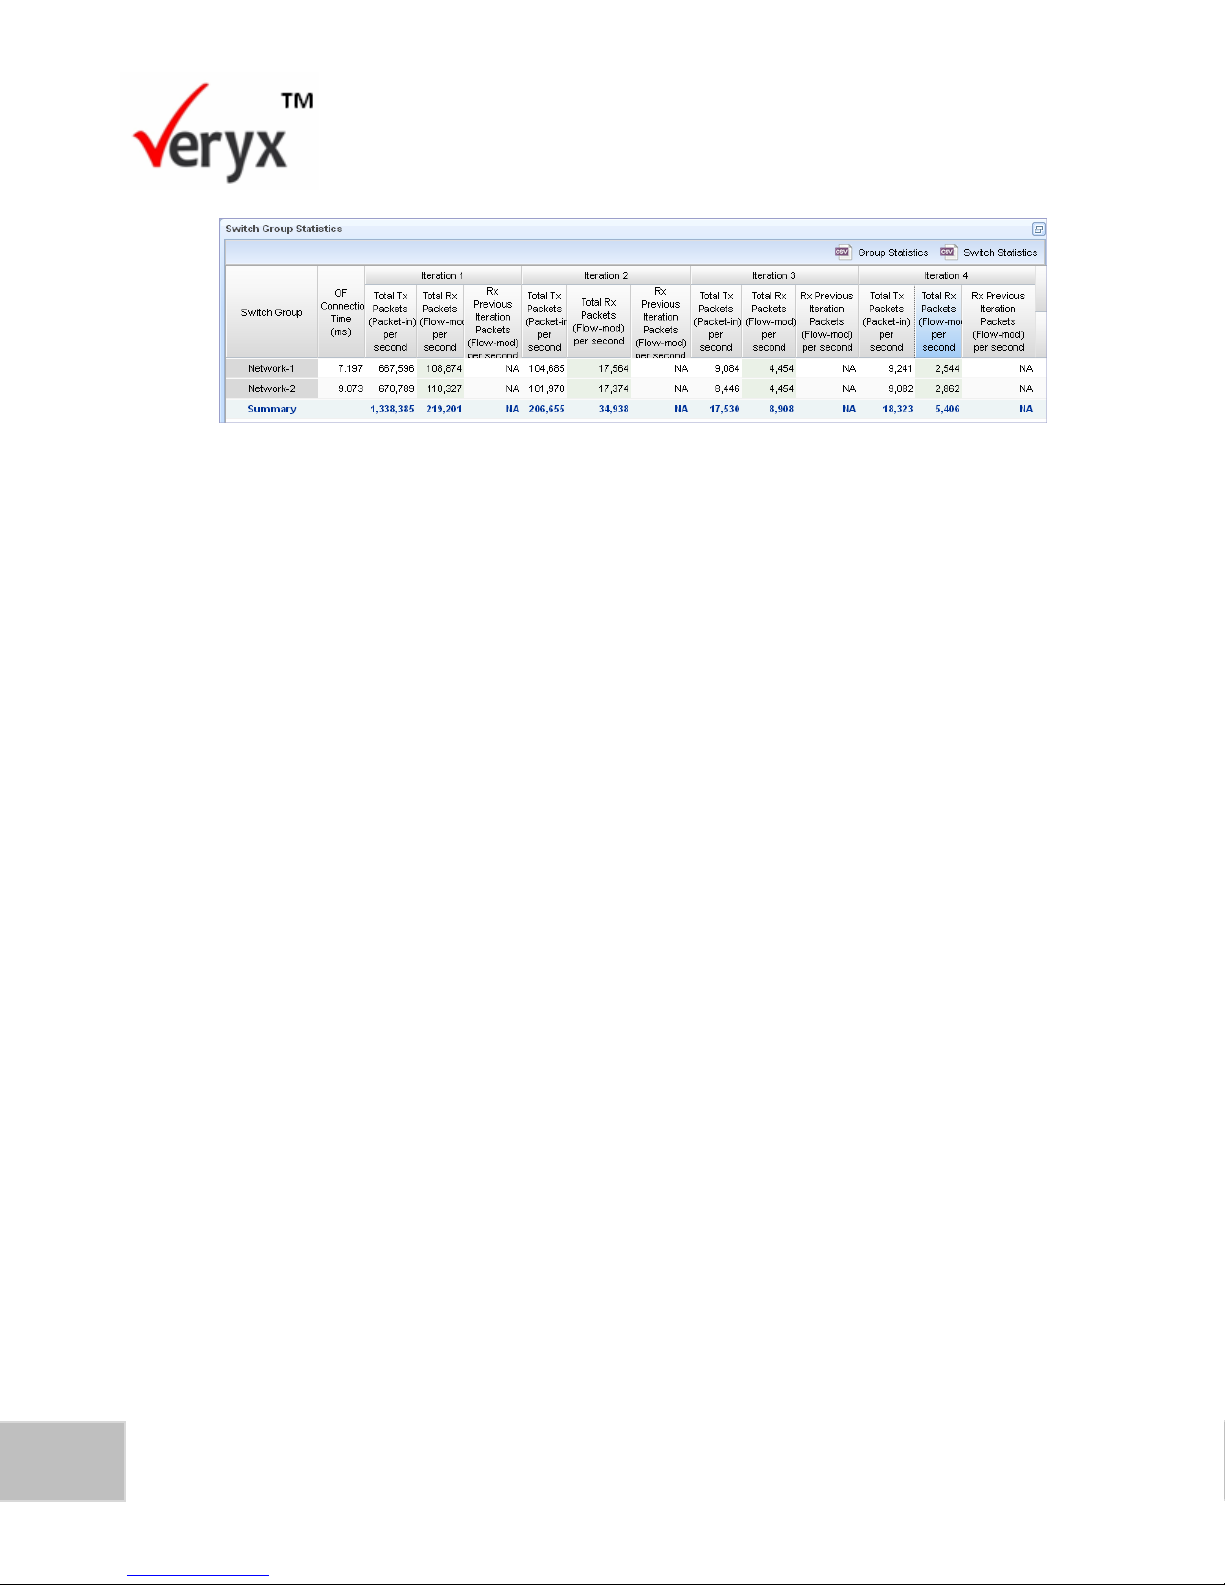
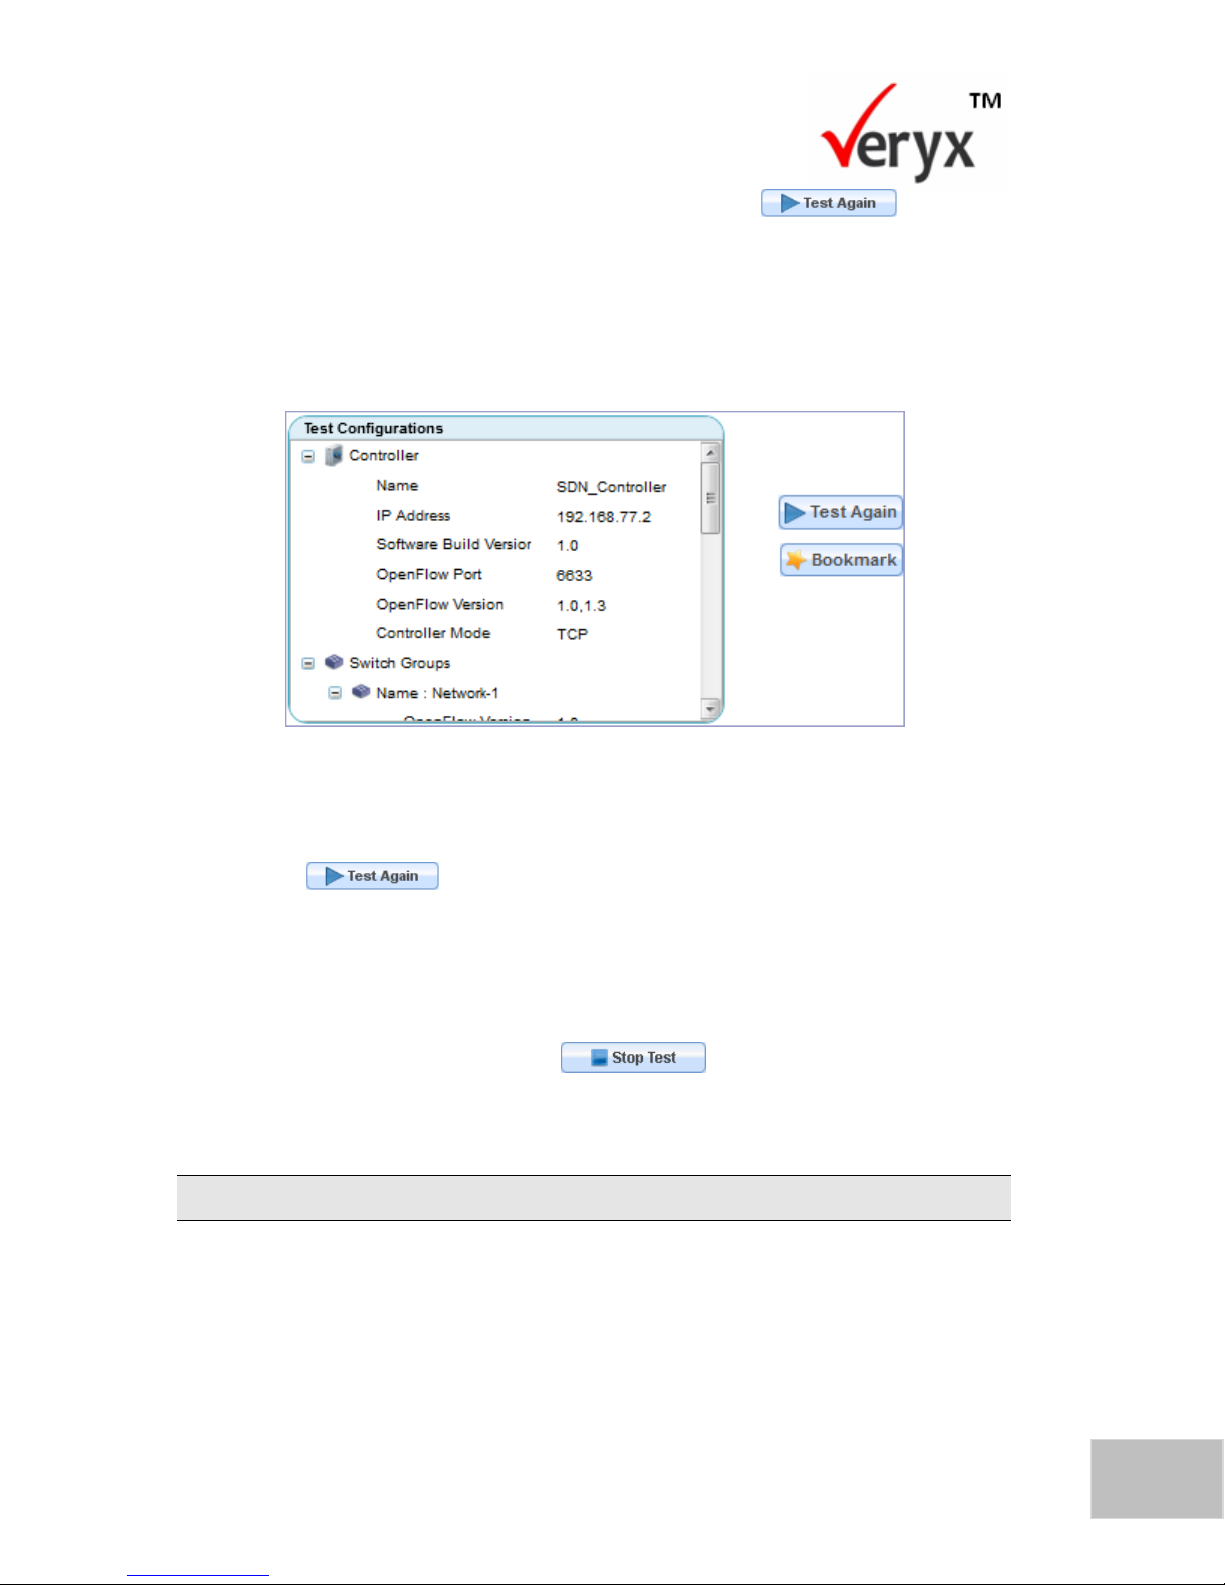
This information is represented in the figures that follow. (Figure 33 to Figure 35)
Page 56
49
Copyright © Veryx Technologies Pvt. Ltd.
Test Execution Details
Figure 33: Test Results-Configuration Details
Figure 34: Test Results-Graph
Page 57
50
PktBlaster SDN Controller Test-Performance Benchmarking User Guide
Copyright © Veryx Technologies Pvt. Ltd.
Figure 35: Test Results-Table
The test result screens (Figure 33 to Figure 35) shows the throughput of the
controller over the configured number of iterations and highlight the following
information about the test execution:
For each iteration, the flow insertion rate is generated for the number of
responses received per second from all switches belonging to the switch
group network(s) is plotted.
A comparative plotting of the number of packet-in messages and the number
of responses generated by the controller per second.
The maximum, minimum, and average number of flow responses generated
by the controller per second for all the configured switches.
The table shows a comparison of the number of packet in messages and the
number of responses generated per second for all the switches belonging to
switch group network(s) that has been simulated.
Re-execute a Test
A test can be re-executed with any of the following:
Existing configuration
Modified test parameters
Page 58
51
Copyright © Veryx Technologies Pvt. Ltd.
Test Execution Details
To re-execute the test with the existing configuration, click in the Test
Results-Configuration Details screen (Figure 33).
To re-execute the test with modified parameters:
1. Select Click to view Test Console to toggle between the configuration screen
and the test console as shown in the Re-execute Test screen.
Figure 36: Re-execute Test
You can now change the test parameters as required.
2. Click to re-execute the test.
Test Fails to Complete
A test will fail to complete successfully when:
It is interrupted when you click during test execution.
The controller is unable to handle repeated testing requests.
When a test fails, the text in the Execution History pane is displayed in red.
Page 59

52
PktBlaster SDN Controller Test-Performance Benchmarking User Guide
Copyright © Veryx Technologies Pvt. Ltd.
This page has been intentionally left blank.
Page 60

Copyright © Veryx Technologies Pvt. Ltd.
53
7 EXECUTING THROUGHPUT TESTS
In a throughput test, the flow insertion rate of the Packet out messages or Flow Mod
messages are sent by the controller over a specified duration is measured. The
Packet out messages or Flow Mod messages (depending on the mode of
measurement specified by the user) are the response of the controller to the packetin messages sent from the simulated switches.
The values shown in the test executions are hypothetical and are used for the purposes of
explanation.
Throughput test can be executed in two modes:
Normal
Incremental Switch
Throughput Test in Normal Mode
This mode of testing loads the controller with the maximum number of packet-in
messages for a given time. The total number of Packet out messages or Flow Mod
messages that the controller is able to send back to the switches is then measured.
This process is repeated for the number of iterations that was configured.
To run a throughput test in the Normal mode:
1. Click the Performance tab to display the Performance screen (Figure 25).
2. Configure the Select Controller pane and Network Configuration pane
(Figure 27).
For details of how to configure the panes, refer to Configure Test Parameters section in the
Performance Tests chapter.
P a g e | 5353
Page 61
54
PktBlaster SDN Controller Test-Performance Benchmarking User Guide
Copyright © Veryx Technologies Pvt. Ltd.
To continue configuring the test parameters, go to the Test Configuration pane.
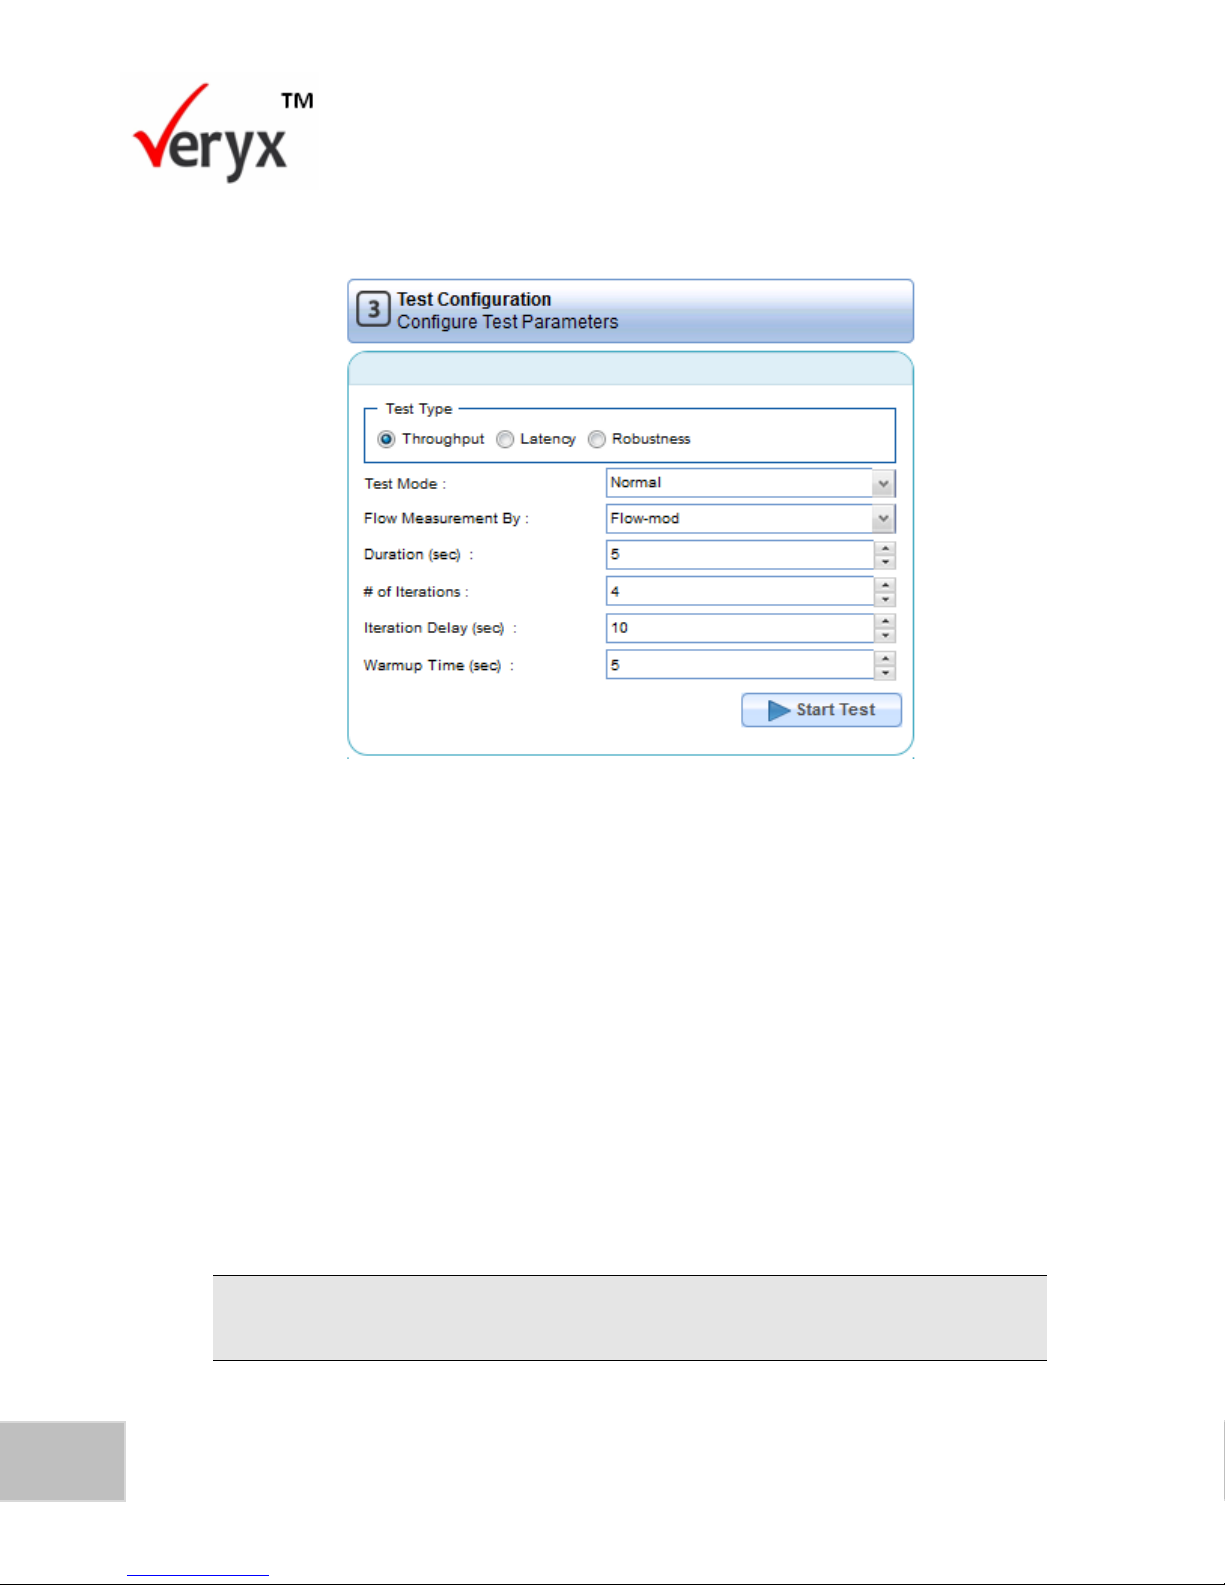
Figure 37: Test Configuration-Throughput Test Mode
4. To specify the Test Type, select Throughput.
5. From the Test Mode drop-down list, select Normal.
6. In the Flow measurement by, the response sent by the controller can be
Packet out or Flow Mod message.
7. In Duration, specify the duration of the test measured in seconds.
8. In the # of Iterations box, type or enter the number of times the test is to be
repeated. Here, the number of iterations is set to 5.
For example, if the duration of the test is set to 5 seconds and the number of
iterations is 5, then there would be 5 executions of the test, each for 5
seconds.
You can set the duration of the test to a maximum of 60 seconds. The maximum number of
iterations for a test is 60.
Page 62
55
Copyright © Veryx Technologies Pvt. Ltd.
Executing Throughput Tests
9. In Iteration Delay (sec), specify the time for the test to pause before starting
the next iteration.
10. In Warmup Time (sec), specify the number of seconds the test will wait after
the handshake with the controller is completed.
11. Click to run the test.
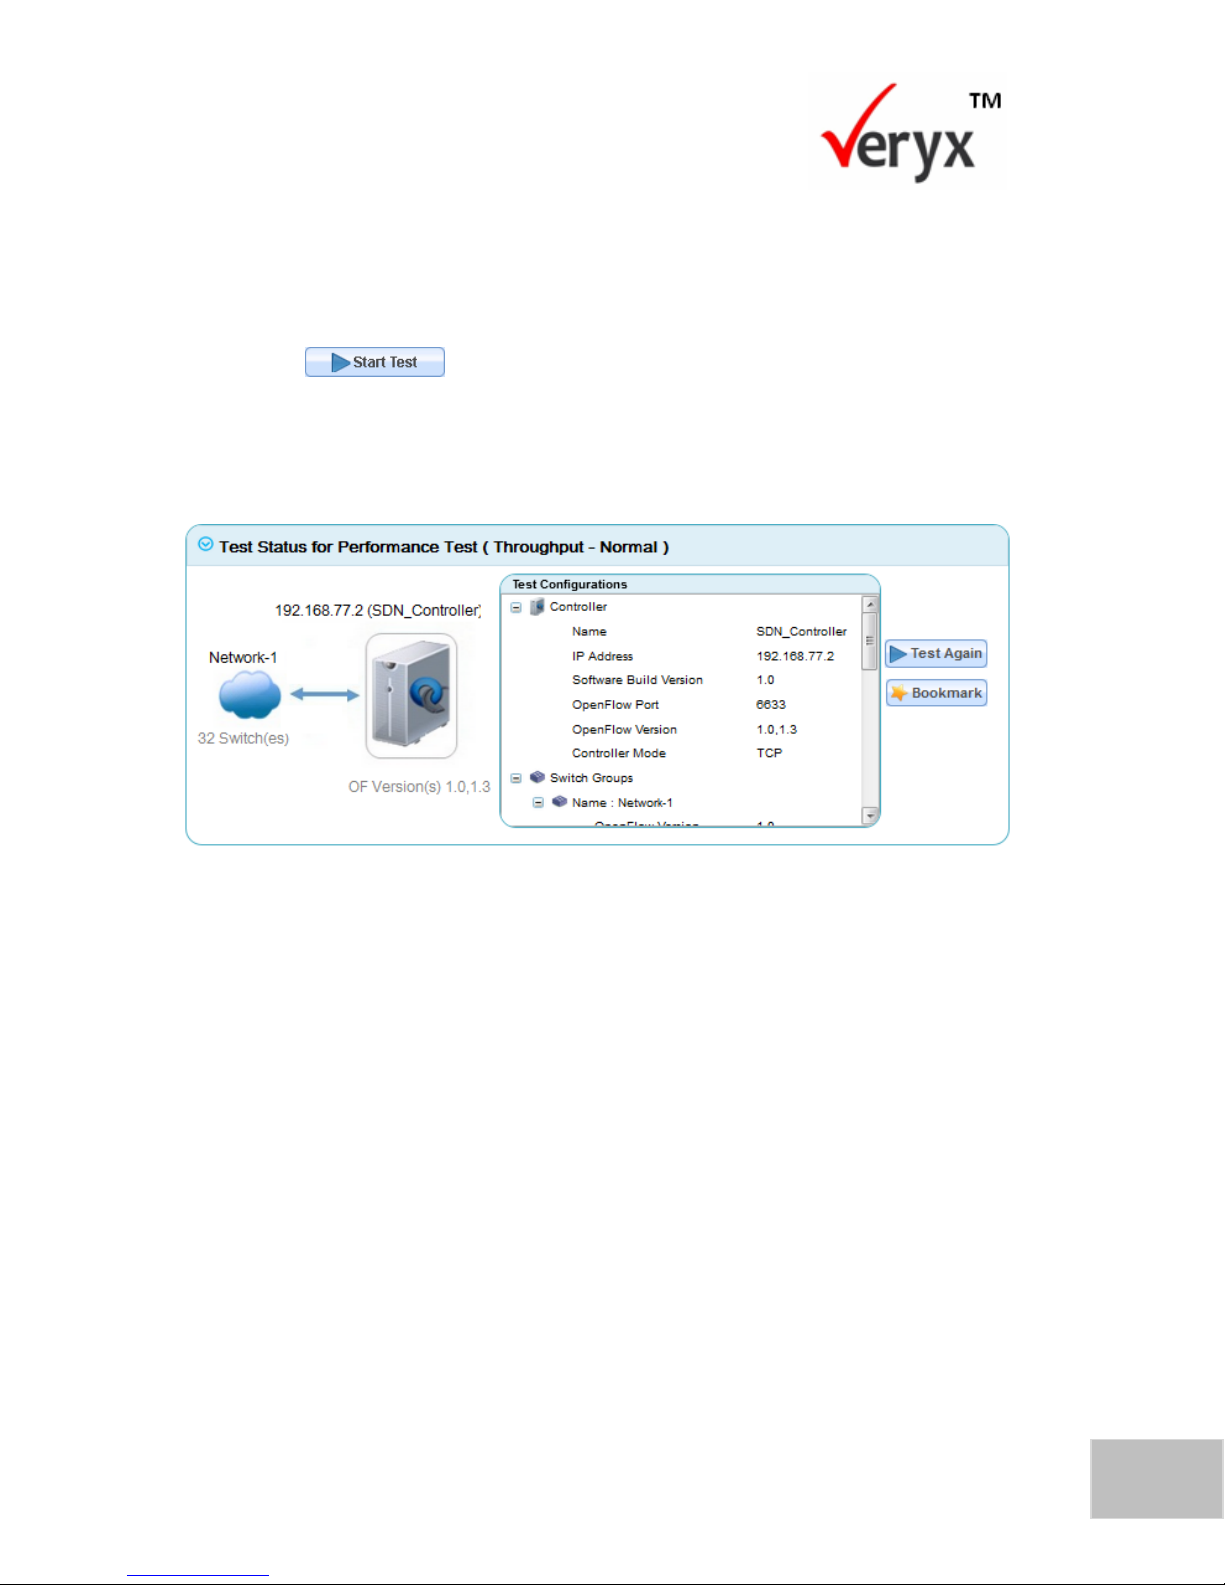
The Test Status for Performance Test-Throughput Normal Mode (Upper and
Lower) screens (Figure 38 and Figure 39) shows test execution in Normal mode. The
results are measured based on Flow Mod messages.
Figure 38: Throughput Normal Mode (Upper)
Page 63
56
PktBlaster SDN Controller Test-Performance Benchmarking User Guide
Copyright © Veryx Technologies Pvt. Ltd.
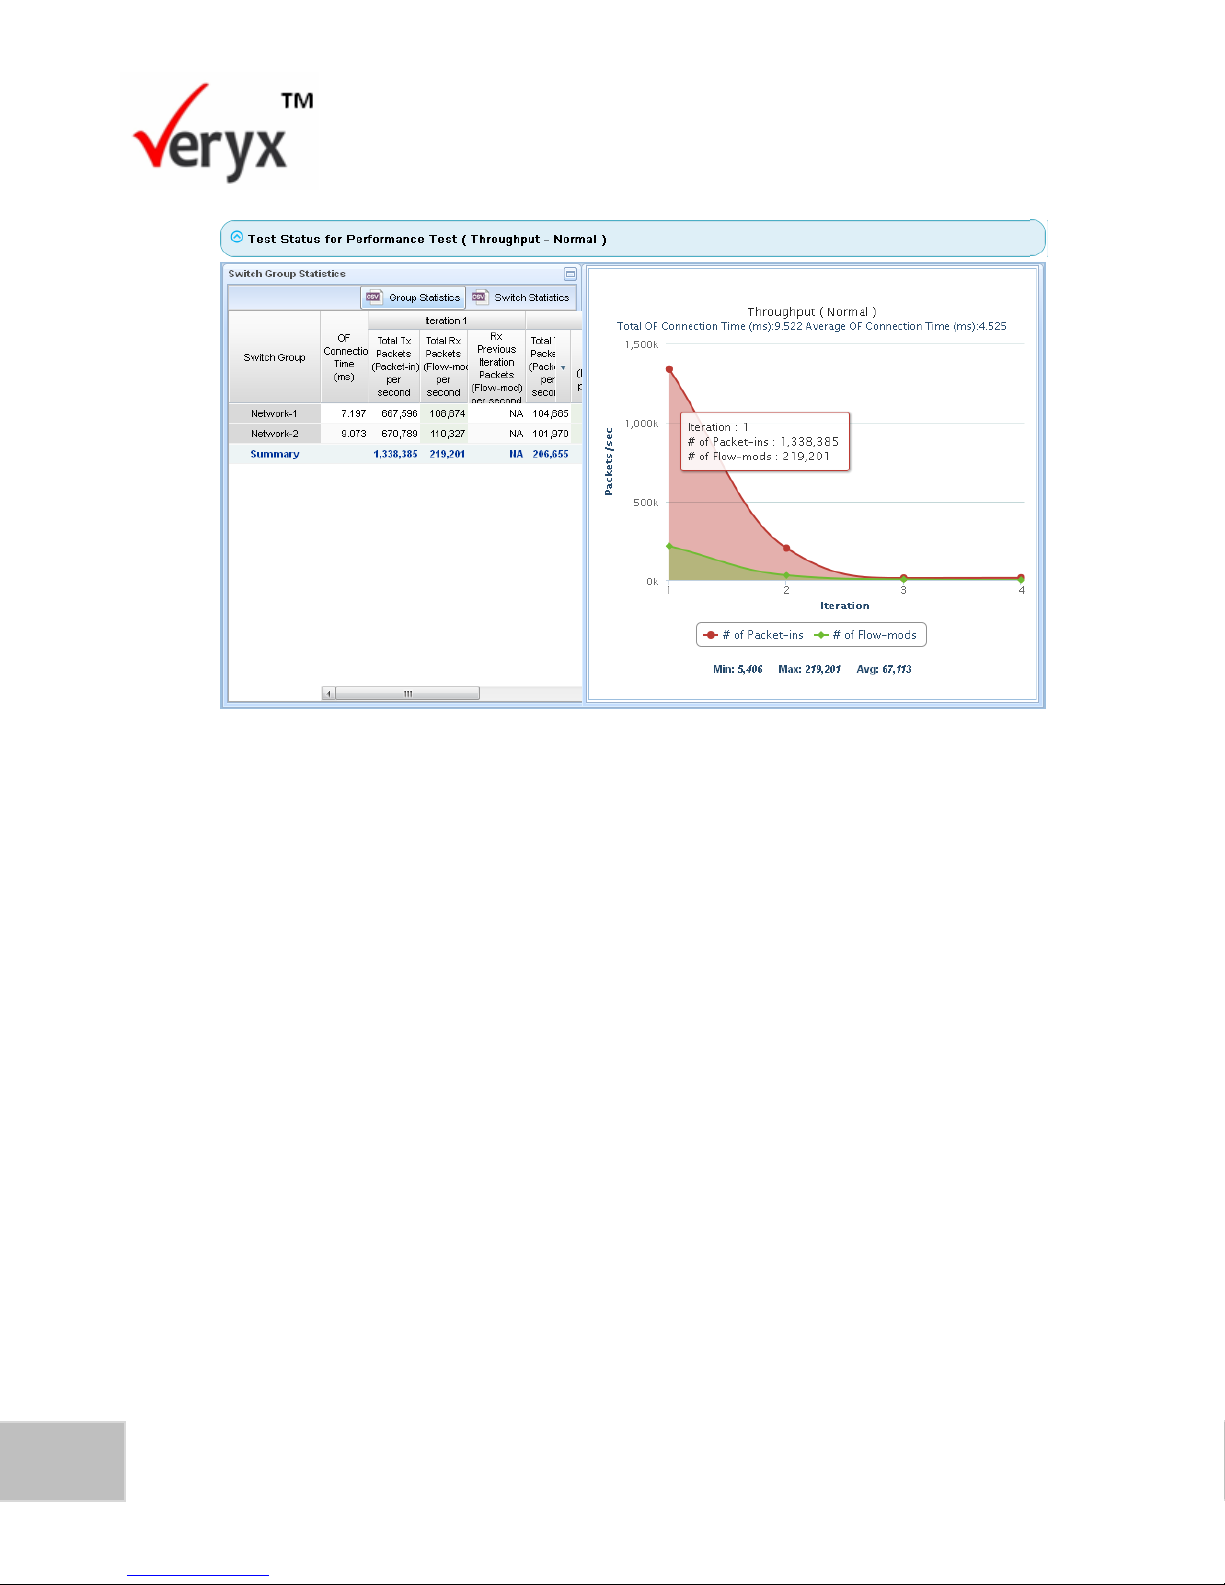
Figure 39: Throughput Normal Mode (Lower)
View Test Result
The result for this test execution is displayed as shown in the Throughput Normal
Result-Graph screen (Figure 40) and Throughput Normal Result-Table screen
(Figure 41).
Page 64
57
Copyright © Veryx Technologies Pvt. Ltd.
Executing Throughput Tests
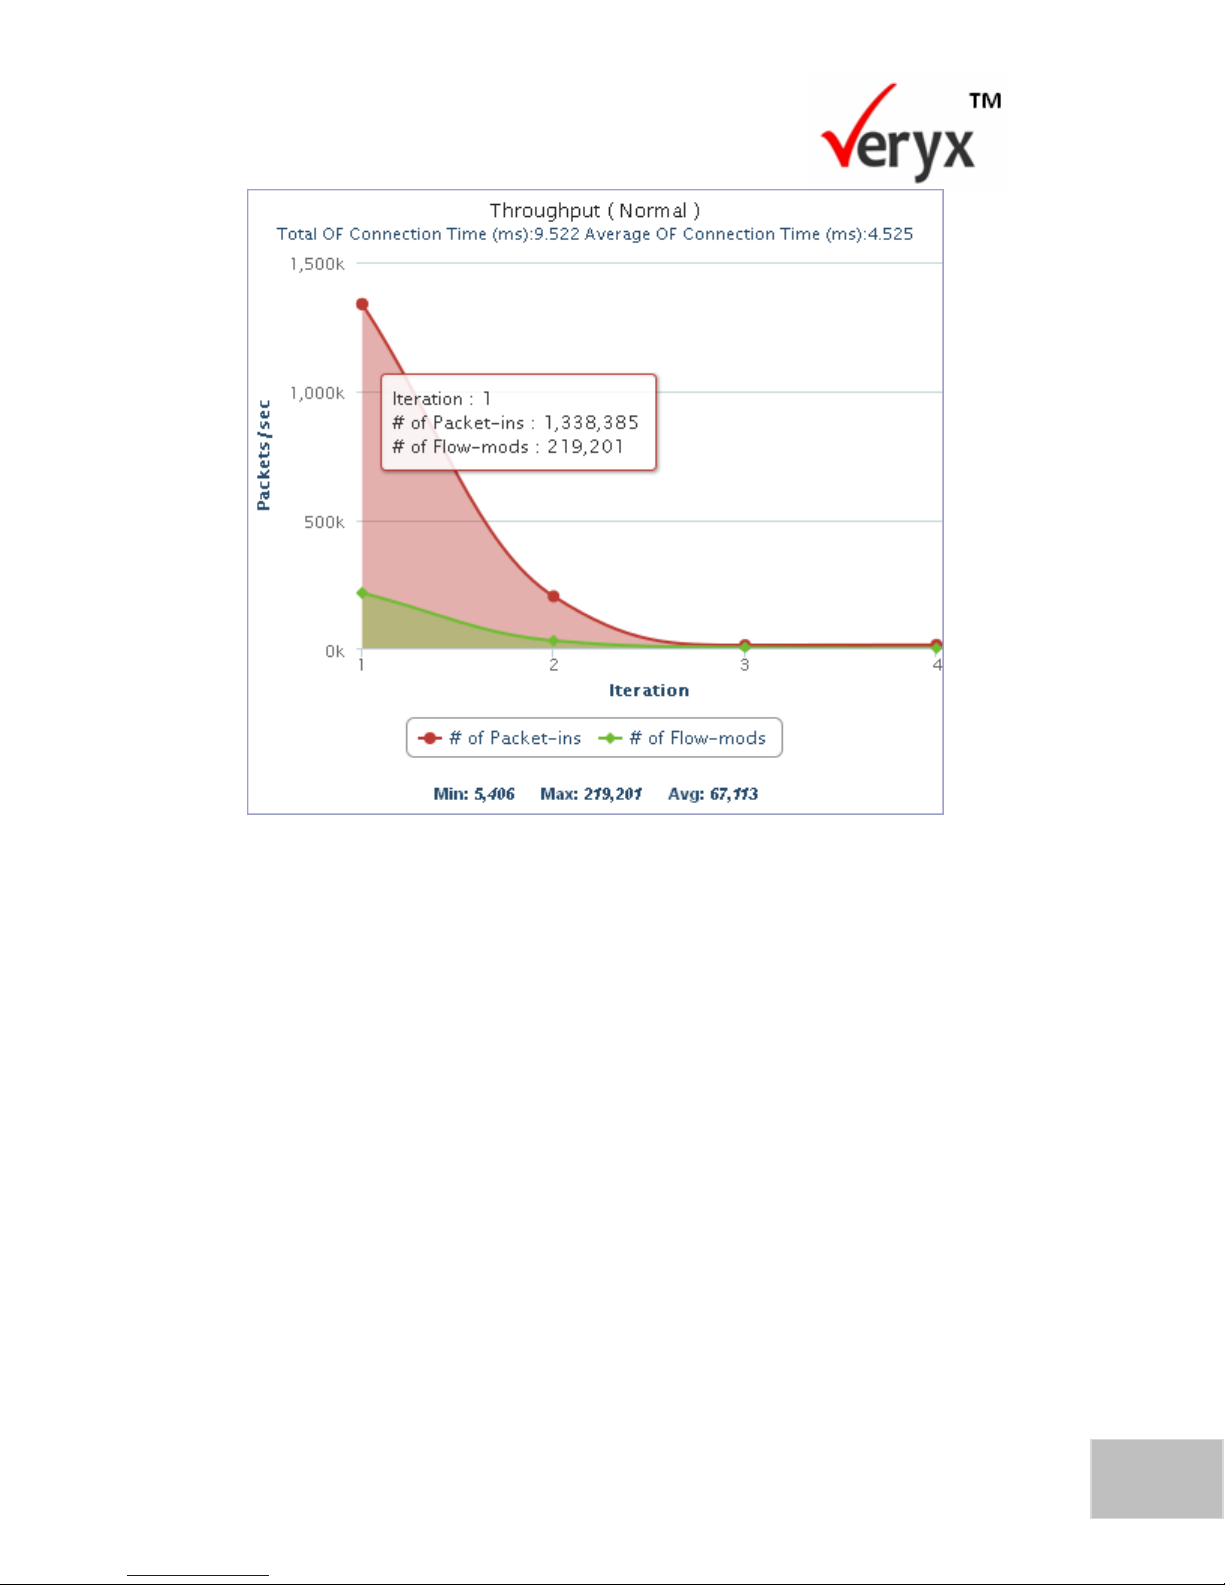
Figure 40: Throughput Normal Result-Graph
The test result screens display the following information about the test that was
executed.
1. The X-axis in Figure 40 represents the number of iterations specified in the
test configuration parameter.
2. The Y-axis represents the number of Flow Mod messages generated per
second in response to the packet-in messages sent by the switches.
3. The graph shows the flow insertion rate for the number of Flow Mod
messages generated per second by the participating switch group network
for a single iteration.
Total OF Connection Time (ms): Time taken by all the switches to establish a
connection with the controller and complete the handshake.
Page 65
58
PktBlaster SDN Controller Test-Performance Benchmarking User Guide
Copyright © Veryx Technologies Pvt. Ltd.
Average OF Connection Time (ms): Average open flow connection time
taken for all the switches to establish a connection with the controller and
complete the handshake.
4. A comparative plot of the number of responses generated per second and
the number of packet-in messages. This highlights the performance trend of
the controller with respect to the number of response received.
5. The minimum, maximum, and average number of responses generated per
second is displayed.
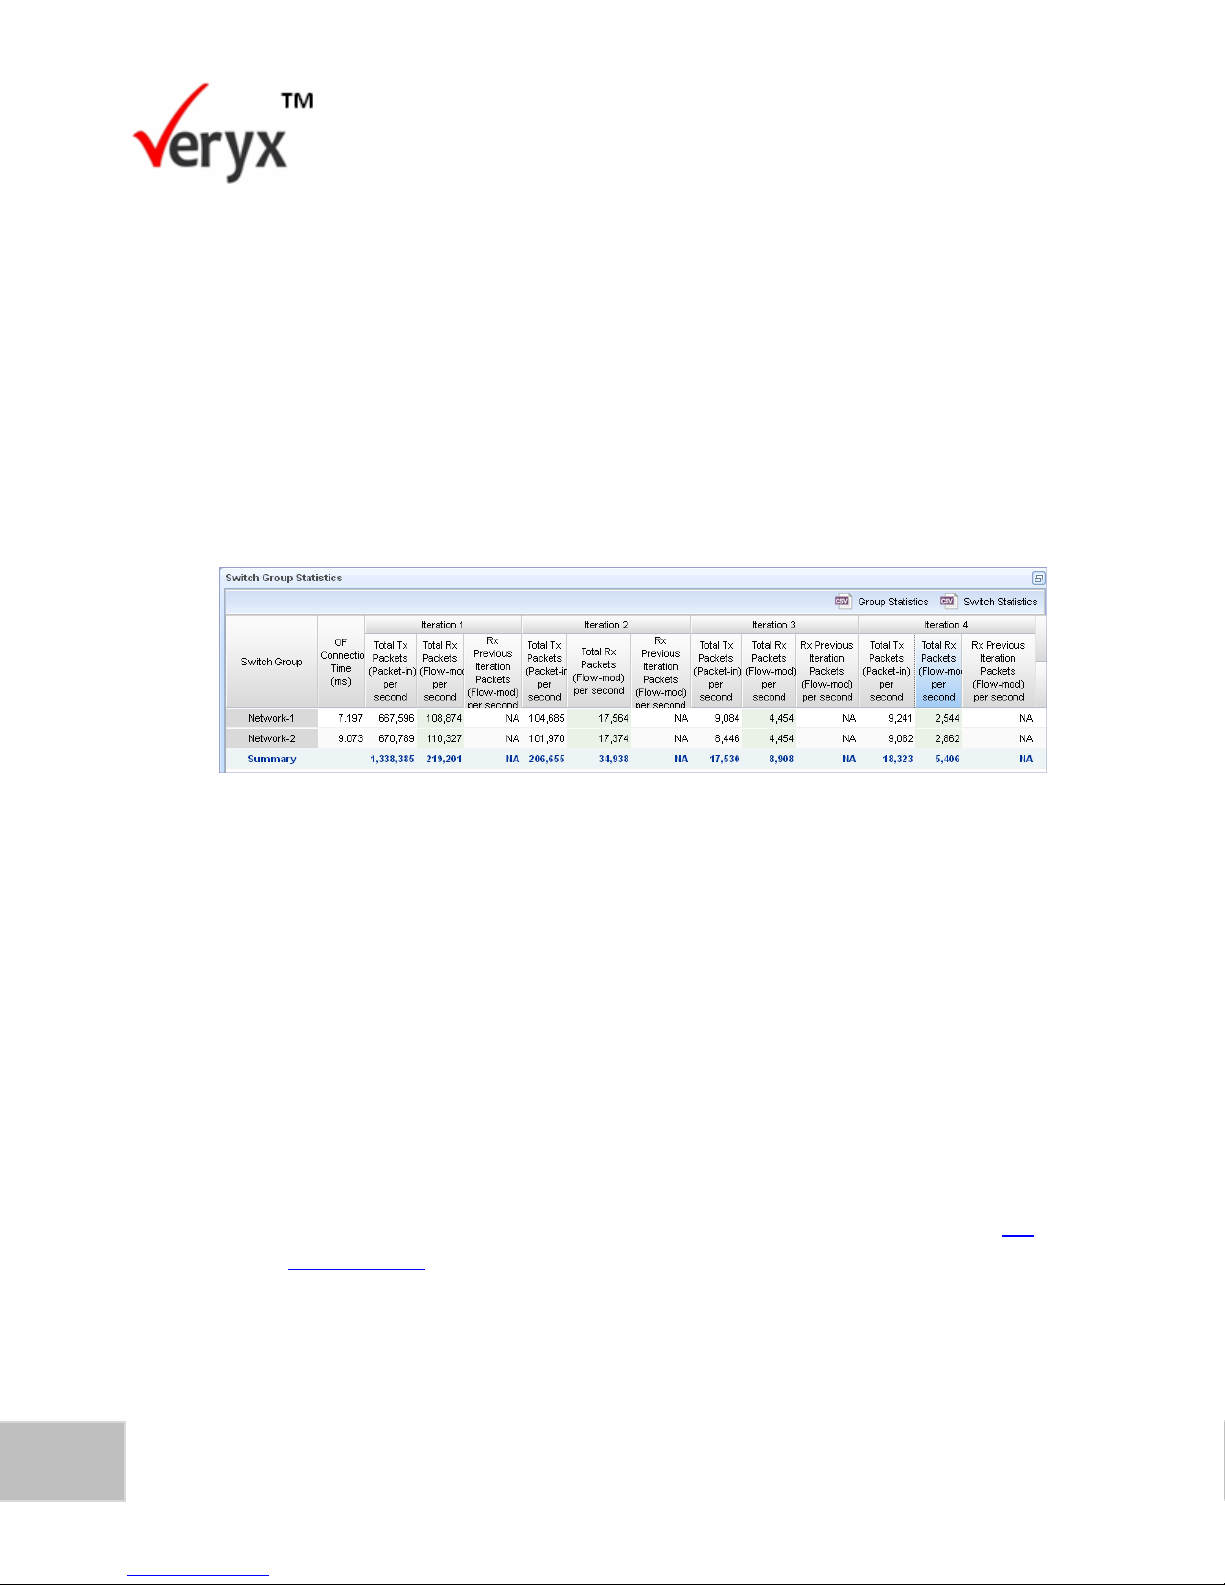
Figure 41: Throughput Normal Result-Table
6. The table (Figure 41) shows a comparison of the number of packet-in
messages and the number of responses generated per second for all the
simulated switches of an individual switch group network for iteration 1. The
total OF connection time is also shown.
To download the test performance results displayed in the Switch Group
Statistics table, click CSV Group Statistics.
To download the details of test performance results for all switches in the
switch group network, click CSV Switch Statistics.
The test can be repeated with the same configuration or with a modified
configuration. For more information on executing the test again, refer to Re-
execute a test in the Test Execution Details chapter.
Page 66
59
Copyright © Veryx Technologies Pvt. Ltd.
Executing Throughput Tests
Throughput Test in Incremental Switch Mode
In this mode of throughput testing, OpenFlow packet-in messages are first sent to
the controller from 25% of the configured number of switches belonging to a single
switch group network. This test is repeated in increments of 25% until all the
configured switches have sent packet-in messages to the controller. This would
require 4 iterations. It is not possible to change the number of iterations in the test.
To run a throughput test in the Incremental Switch mode:
1. Click the Performance tab to display the Performance screen (Figure 25).
2. Configure the Select Controller pane and Network Configuration pane
(Figure 27).
For details of how to configure the panes, refer to Configure Test Parameters section in the
Performance Tests chapter.
To continue configuring the test parameters, go to the Test Configuration pane.
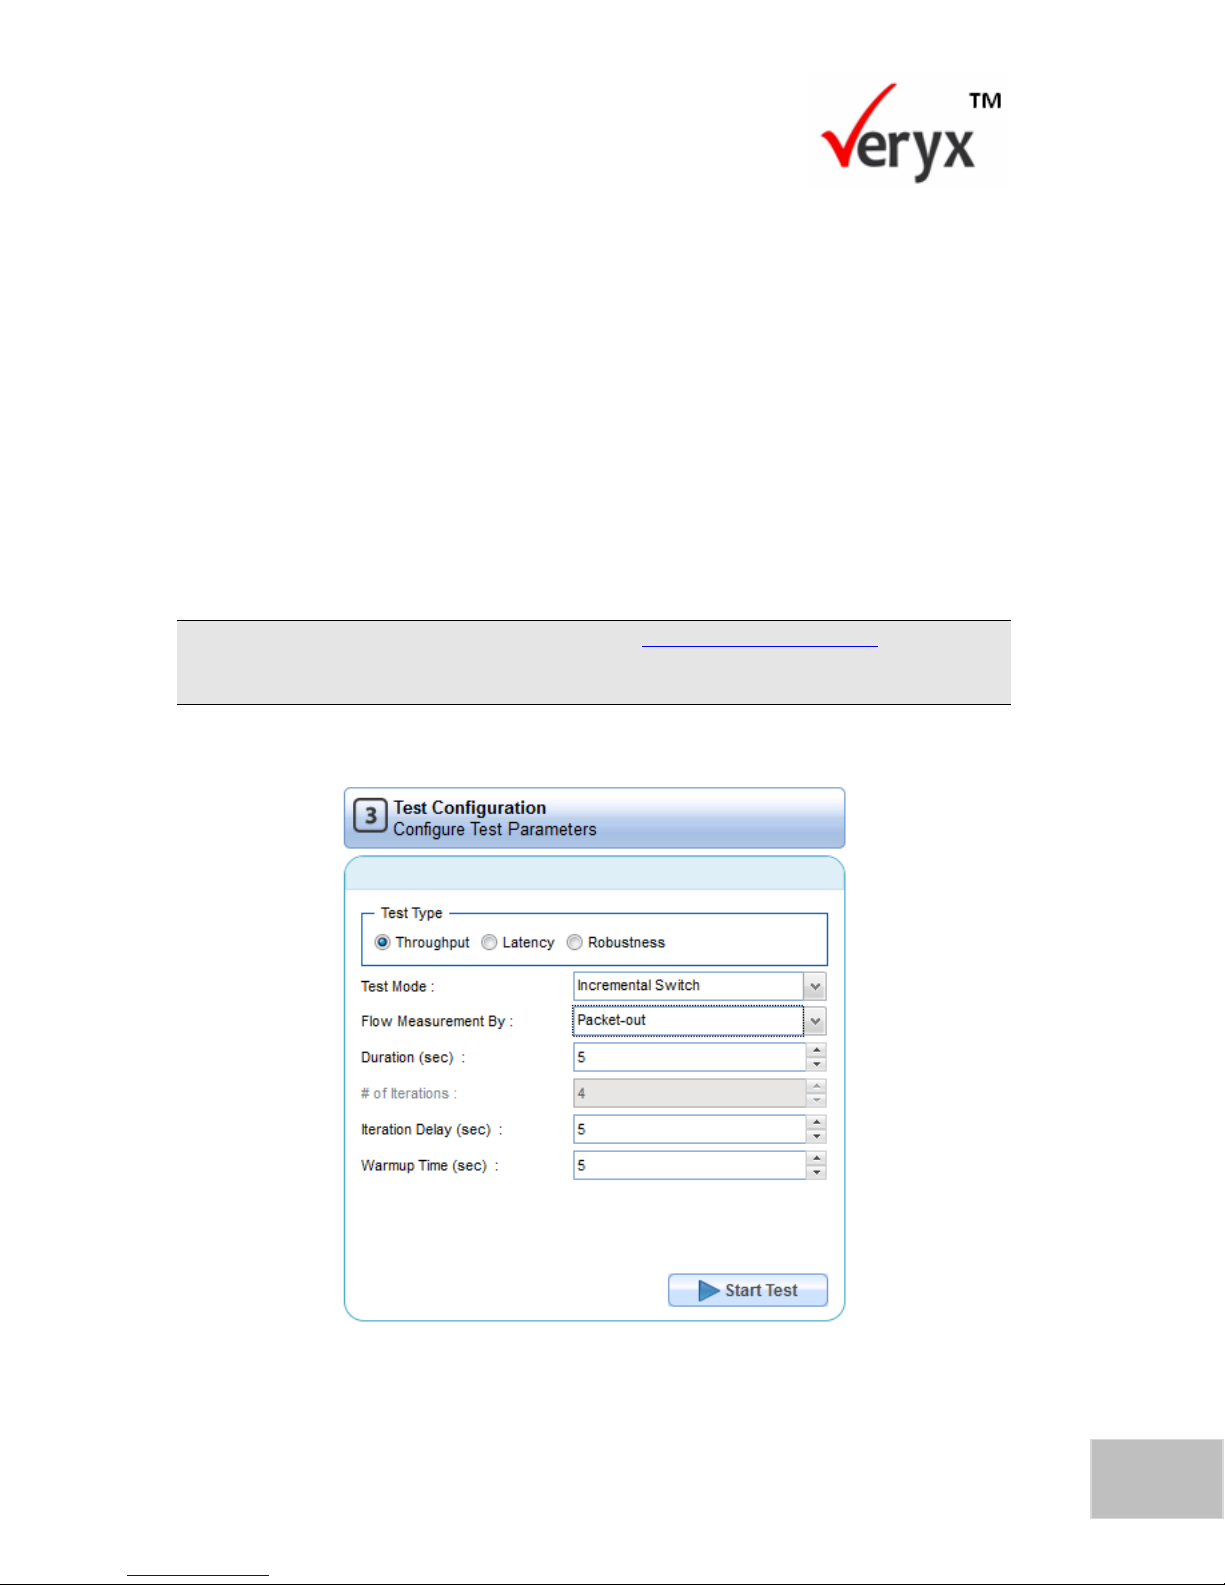
Figure 42: Test Configuration- Throughput Incremental Switch Mode
Page 67
60
PktBlaster SDN Controller Test-Performance Benchmarking User Guide
Copyright © Veryx Technologies Pvt. Ltd.
3. To specify the Test Type, select Throughput.
4. From the Test Mode drop-down list, select Incremental Switch.
5. In Flow Measurement By, select the response used to compute the
Throughput, Latency or Robustness of the controller. This could be Packet
out message or Flow Mod message.
6. In the Duration (sec) box, type or select the test duration. Here, the test
duration is set to 5 seconds.
The # of Iterations box is disabled in this mode as the test is set to repeat for 4 iterations.
7. In Iteration Delay (sec), specify the time for the test to pause before starting
the next iteration.
8. In Warmup Time (sec), specify the number of seconds the test will wait after
the handshake with the controller is completed.
9. Click to run the test.
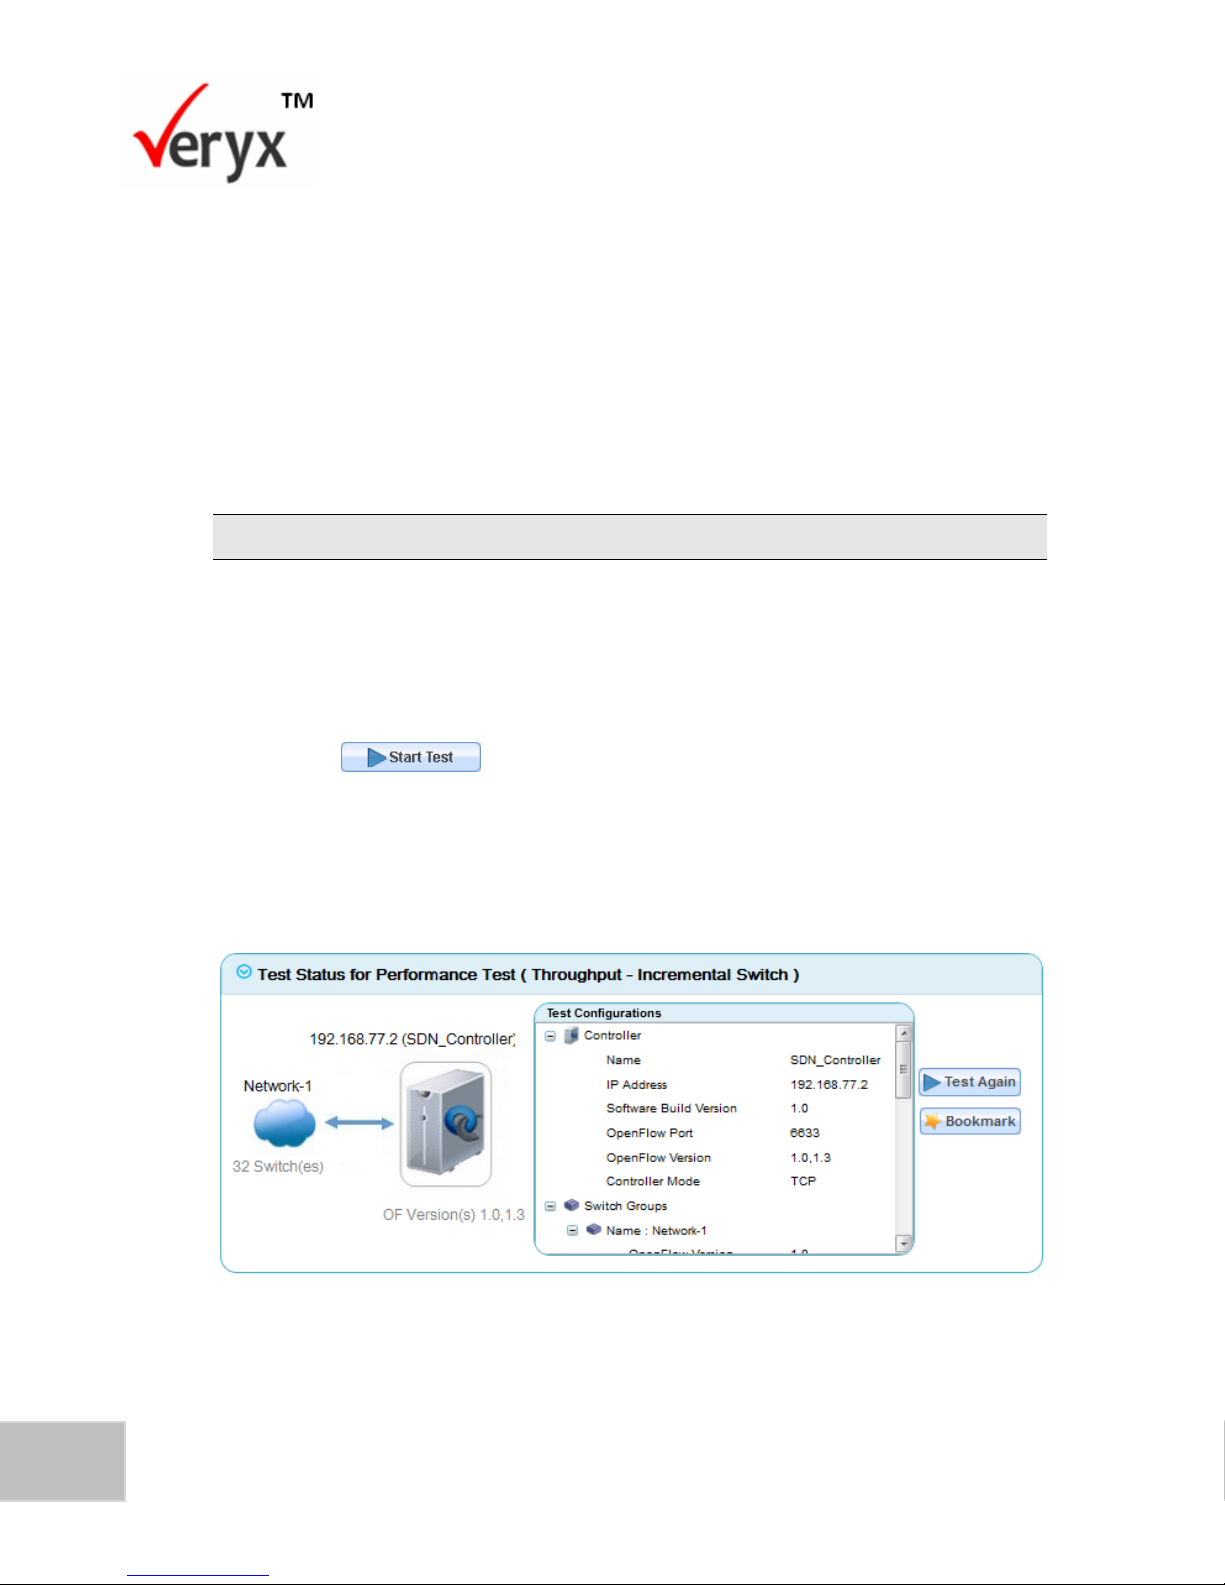
The Test Status for Performance Test-Throughput Incremental Switch Mode
(Upper and Lower) screens (Figure 43 and Figure 44) shows the test execution
progress for a throughput test in Incremental Switch mode. The performance is
measured based on Packet out messages.
Figure 43: Throughput Incremental Switch Mode (Upper)
Page 68
61
Copyright © Veryx Technologies Pvt. Ltd.
Executing Throughput Tests
Figure 44: Throughput Incremental Switch Mode (Lower)
View Test Result
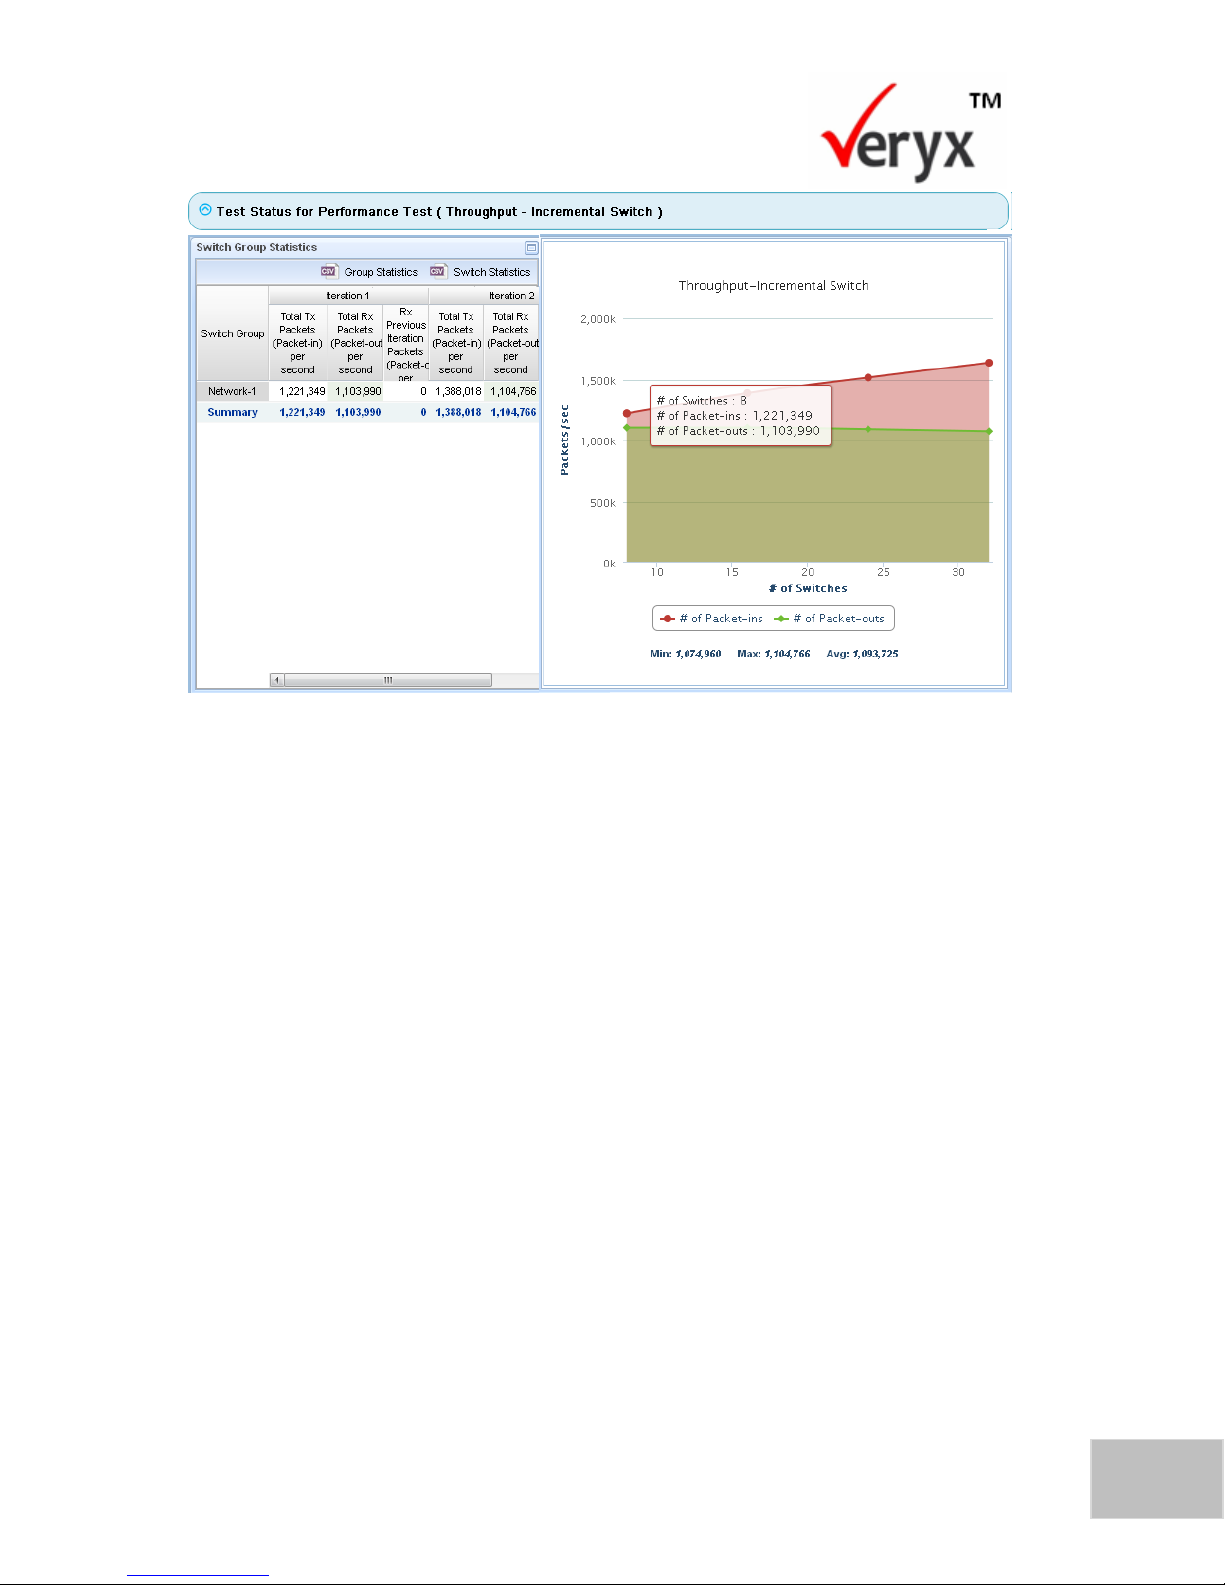
The result for this test execution is displayed as shown in Throughput Incremental
Switch Result-Graph screen (Figure 45) and Throughput Incremental Switch ResultTable screen (Figure 46).
Page 69
62
PktBlaster SDN Controller Test-Performance Benchmarking User Guide
Copyright © Veryx Technologies Pvt. Ltd.
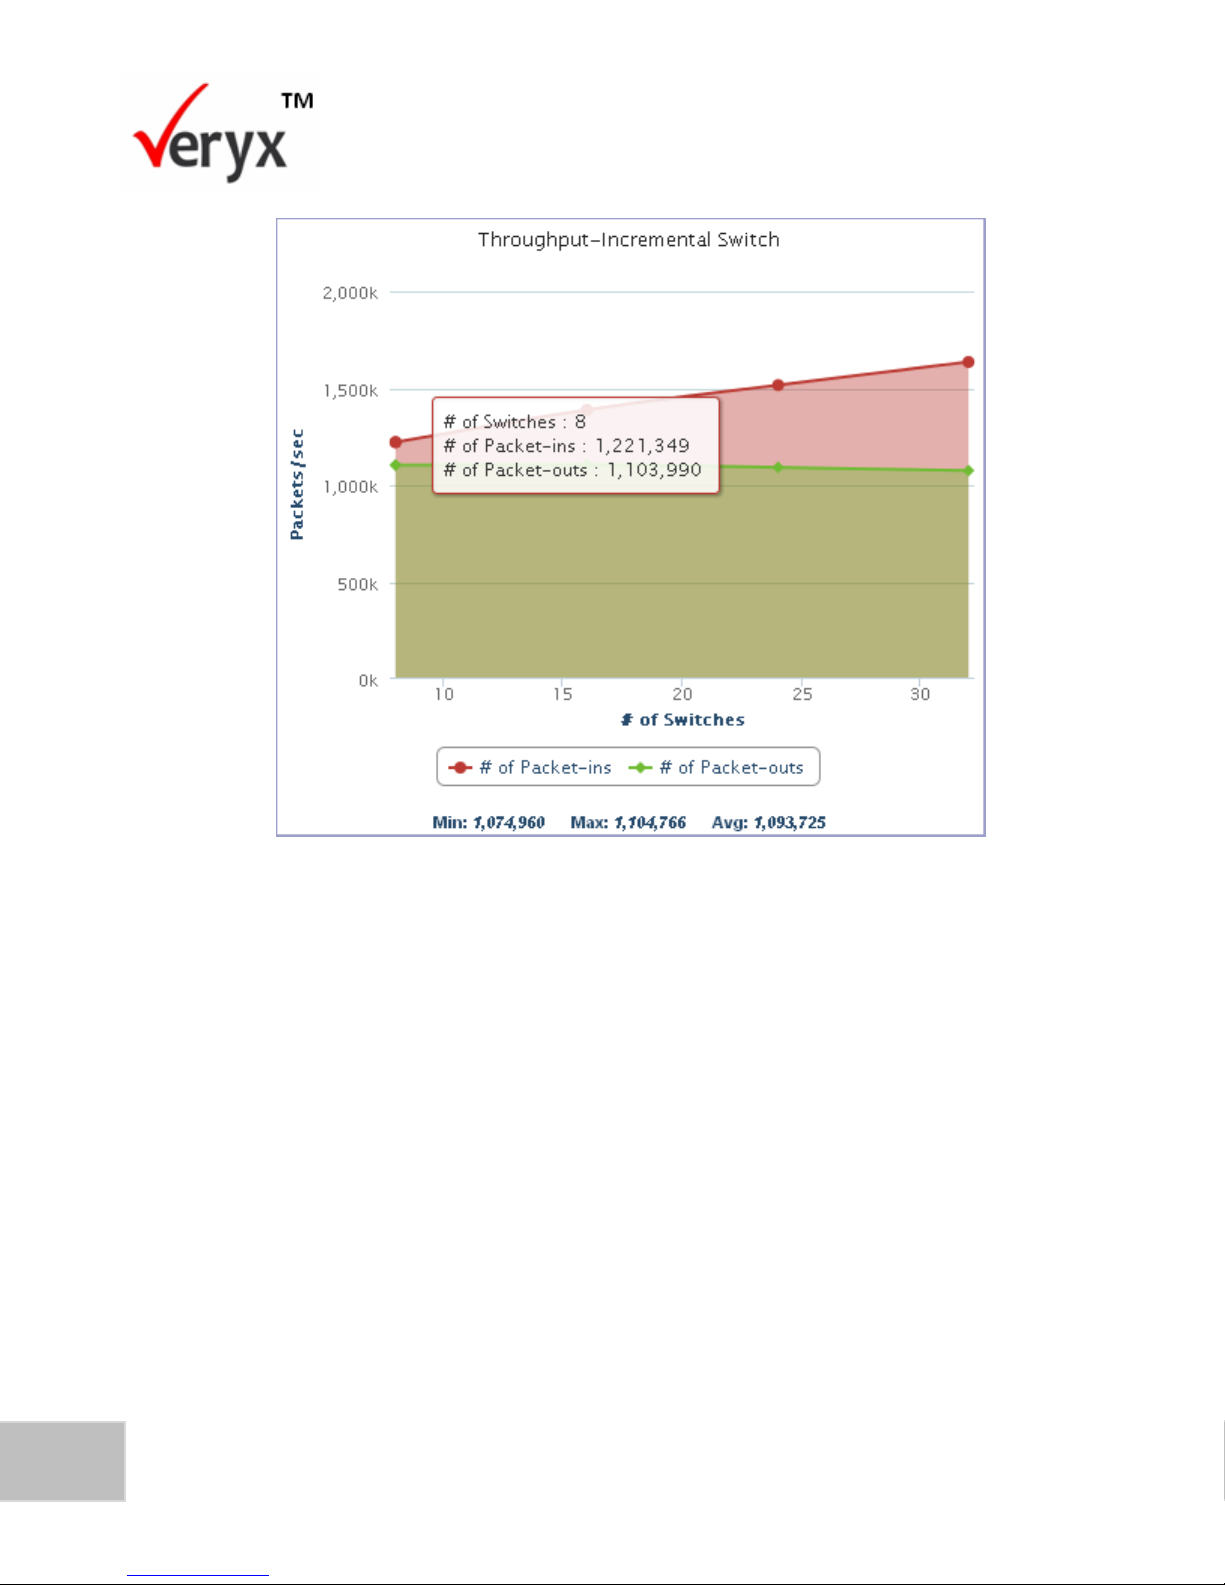
Figure 45: Throughput Incremental Switch Result-Graph
The test result screens display the following information about the test that was
executed.
1. The X-axis in Figure 45 represents the number of switches from which,
packet-in messages are sent to the controller.
2. The Y-axis represents the number of Packet out messages generated by the
controller per second.
3. The flow insertion rate for the number of Packet out messages per second is
plotted for the number of switches on the X-axis. The rate of flow insertion
for the number of responses per second at a specific incremental stage is
displayed as a tooltip.
4. The minimum, maximum, and average number of responses generated per
second is displayed.
Page 70
63
Copyright © Veryx Technologies Pvt. Ltd.
Executing Throughput Tests
5. A comparative plotting of the number of responses generated per second
and the number of packet-in messages. This highlights the performance
trend of the controller with respect to the number of responses received.
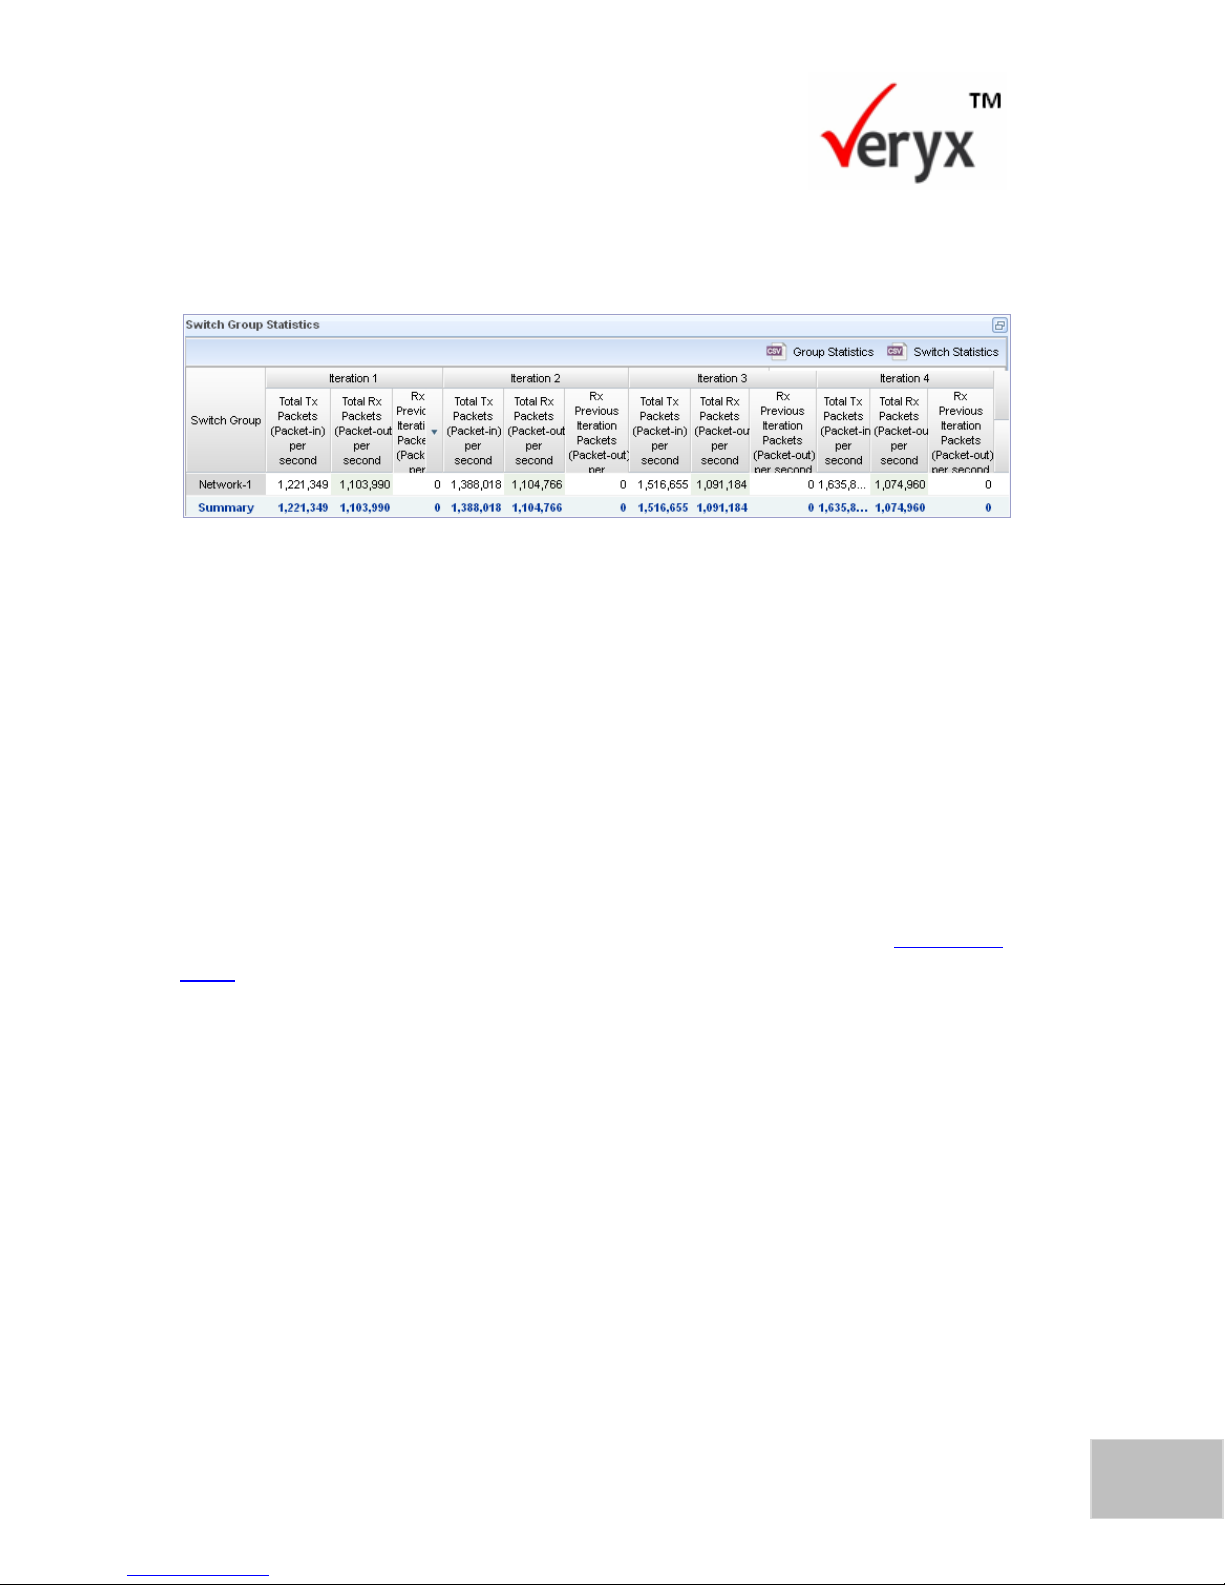
Figure 46: Throughput Incremental Switch Result-Table
6. Figure 46 displays the number of responses per second for each switch that
has been simulated along with the number of previous responses for the
participating switch group network.
To download the test performance results displayed in the Switch Group
Statistics table, click CSV Group Statistics.
To download the details of test performance results for all switches of
the switch group network click CSV Switch Statistics.
The test can be repeated with the same configuration or with a modified
configuration. For more information on executing the test again, refer to Re-execute
a test in the Test Execution Details chapter.
Page 71

64
PktBlaster SDN Controller Test-Performance Benchmarking User Guide
Copyright © Veryx Technologies Pvt. Ltd.
This page has been intentionally left blank.
Page 72

Copyright © Veryx Technologies Pvt. Ltd.
65
8 EXECUTING LATENCY TESTS
Controller latency is the time taken to insert a flow into a switch. This is also known
as the Flow Insertion time and is measured in milliseconds.
It is possible to execute a Latency test in the following modes:
Normal
Incremental
Latency Test in Normal Mode
This mode of testing measures the time taken to receive a response from the
controller under low-load conditions.
During the test, the simulated switches of a participating switch group send a
packet-in message to the controller and wait for a response before sending the next
packet-in message. Latency is computed as the difference in time between the
sending of packet-in message and receiving of the response (packet-out or flowmod) calculated in milliseconds.
Latency measurements are time-stamp based and accurate. This process is repeated
for the configured number of iterations.
To run a latency test in the normal mode:
1. Click the Performance tab to display the Performance screen (Figure 25).
2. Configure the Select Controller pane and the Network Configuration pane
(Figure 27).
For details of how to configure the panes, refer to Configure Test Parameters section in the
Performance Tests chapter.
P a g e | 6565
Page 73
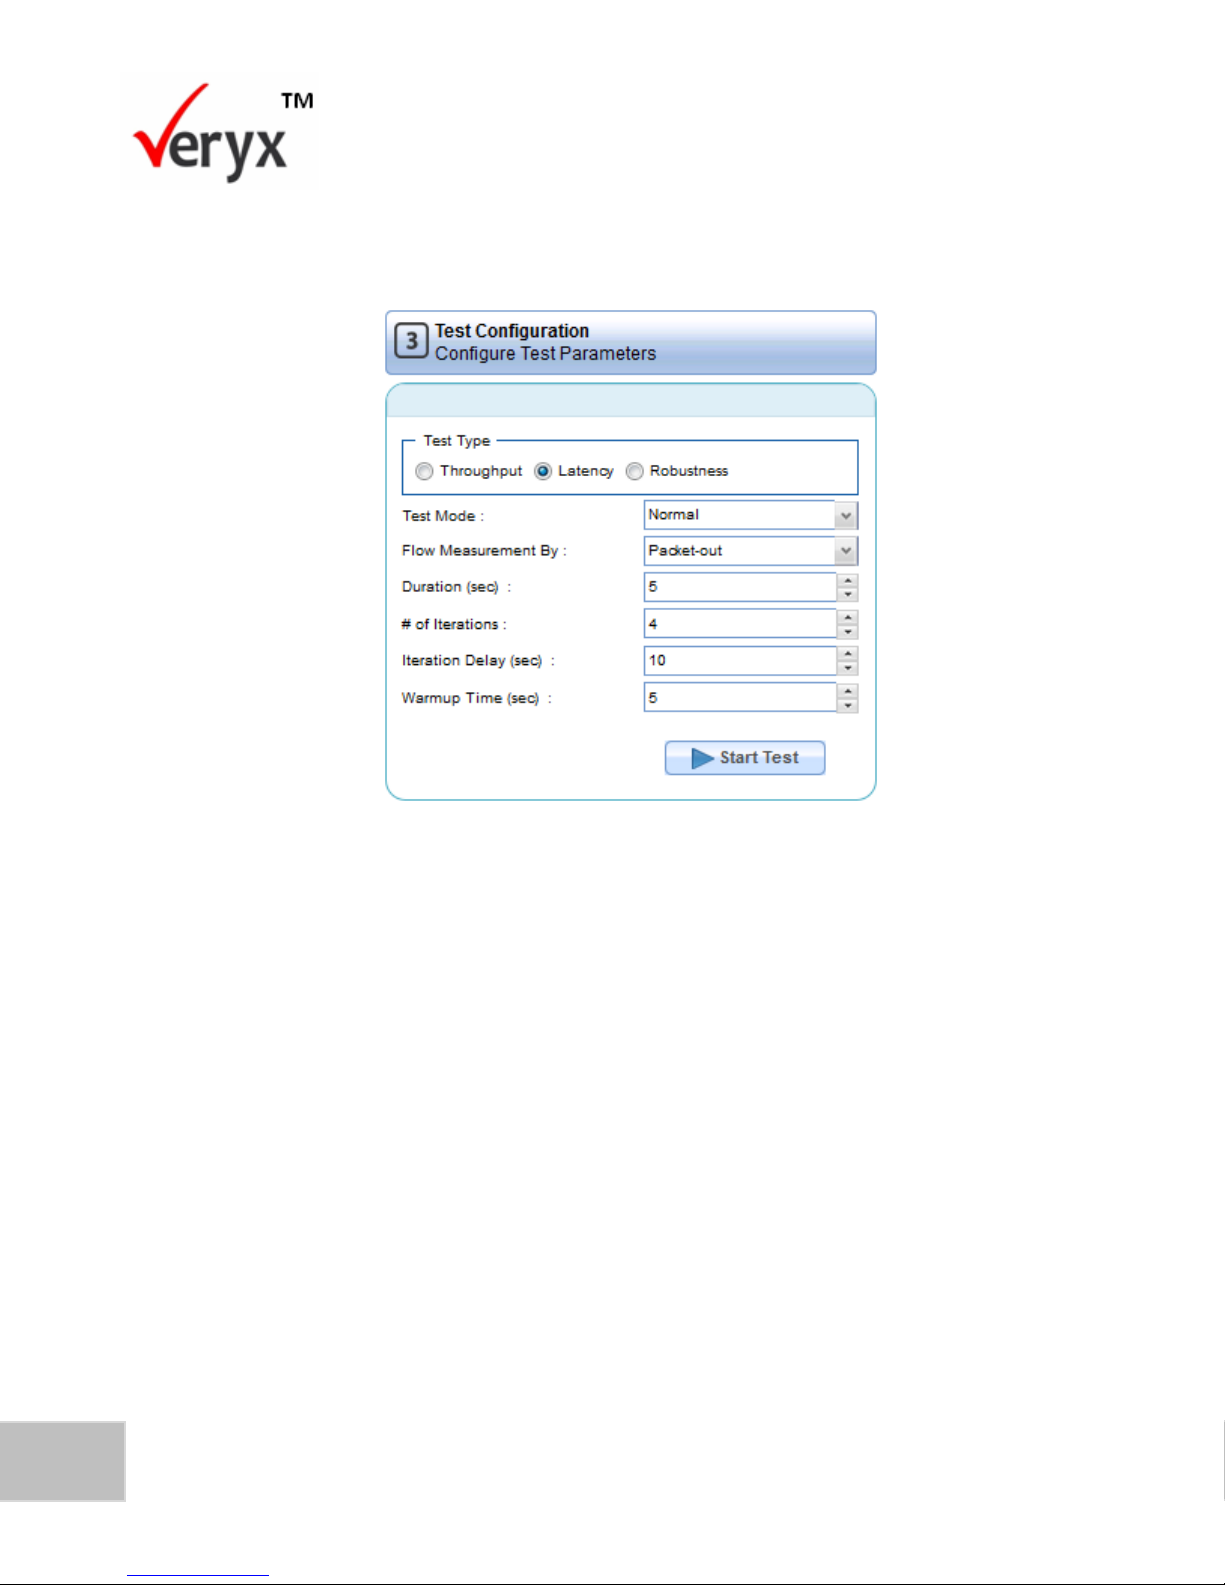
66
PktBlaster SDN Controller Test-Performance Benchmarking User Guide
Copyright © Veryx Technologies Pvt. Ltd.
3. To configure the latency test normal mode parameters, go to the Test
Configuration pane.
Figure 47: Test Configuration-Latency Normal Mode
4. Under Test Type, select Latency.
5. From the Test Mode drop-down list, select Normal.
6. In Flow Measured By, select the type of response the controller should send
to the simulated switches.
7. In the Duration (sec) box, type or select the test duration. Here, the test
duration is set to 5 seconds.
8. In the # of Iterations box, type or select the number of times the test has to
be repeated. Here, the number of iterations is set to four.
9. In the Iteration Delay (sec) box, specify the number of seconds the test
should pause before it starts the next iteration to flush out the requests
received during the previous iteration.
10. In Warmup Time (sec), specify the number of seconds the test should wait
after the handshake with the controller is completed.
Page 74
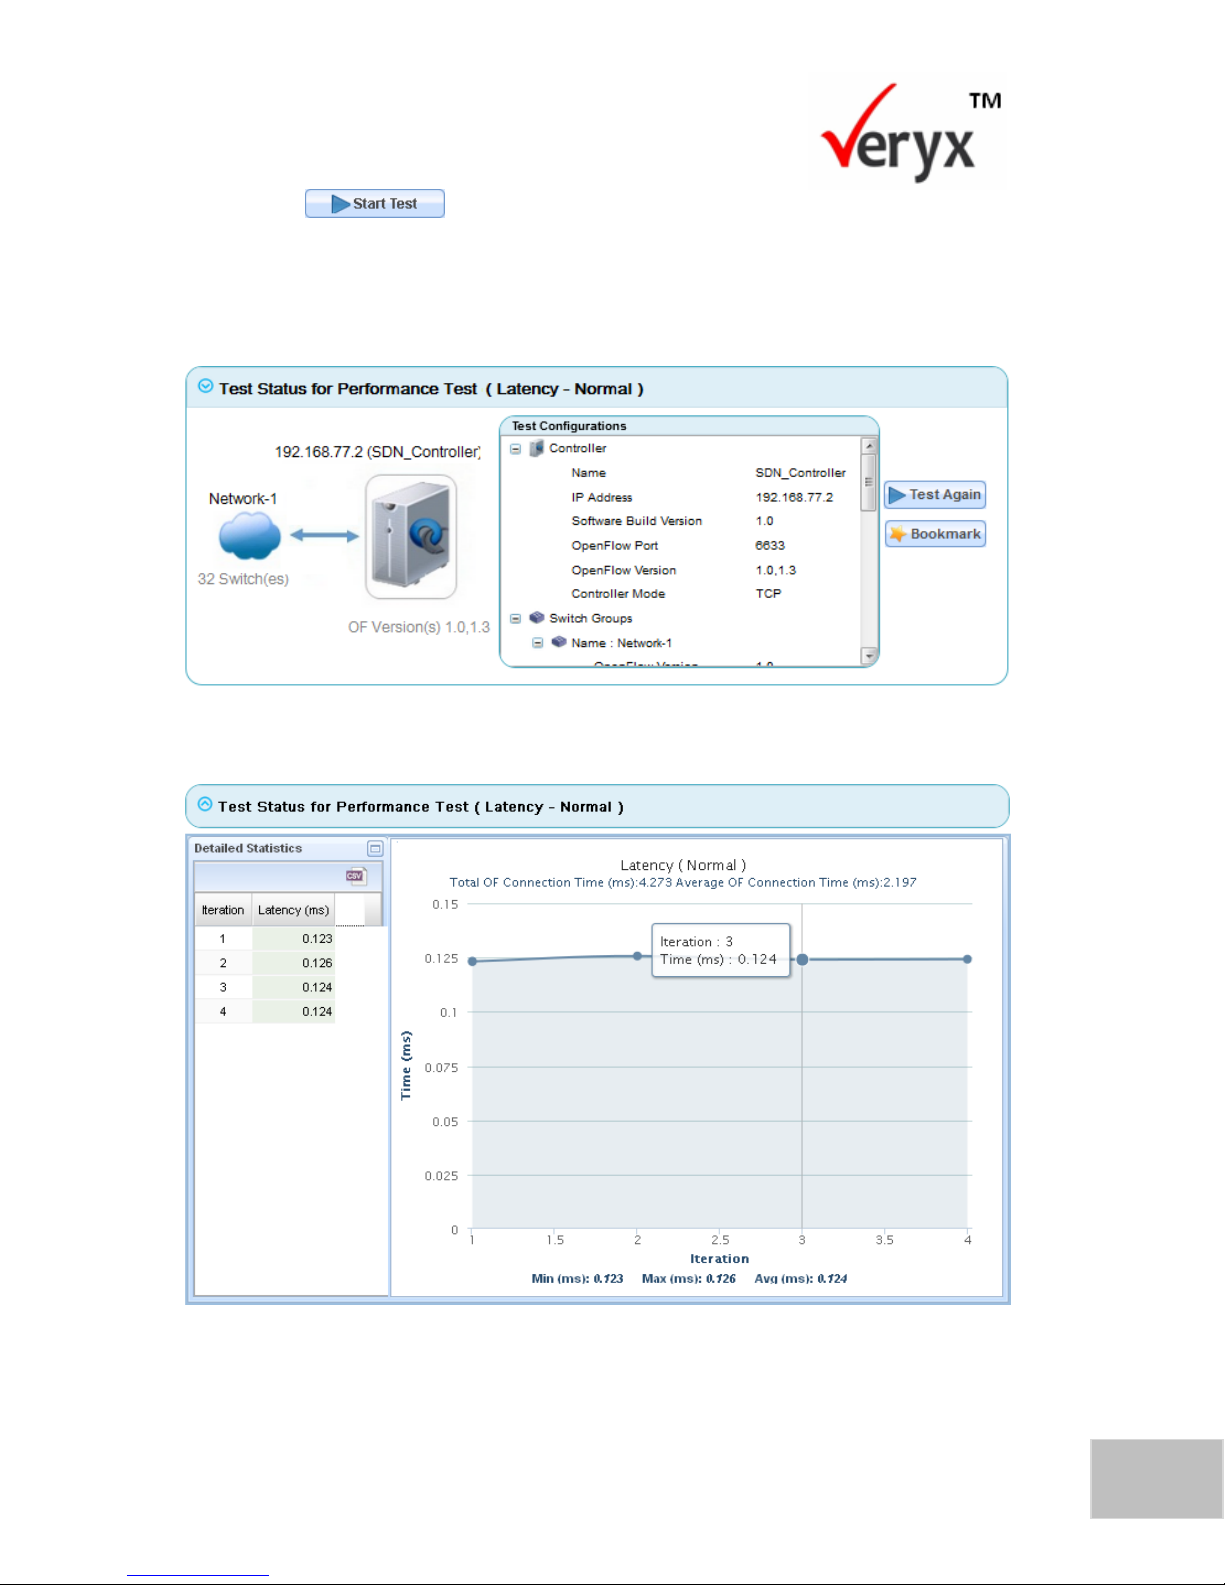
67
Copyright © Veryx Technologies Pvt. Ltd.
Executing Latency Tests
11. Click to run the test.
The Test Status for Performance Test- Latency Normal Mode (Upper and Lower)
screens (Figure 48 and Figure 49) shows the test execution progress for a latency
test in Normal mode. The performance is measured based on Packet out messages.
Figure 48: Latency Normal Mode (Upper)
Figure 49: Latency Normal Mode (Lower)
Page 75
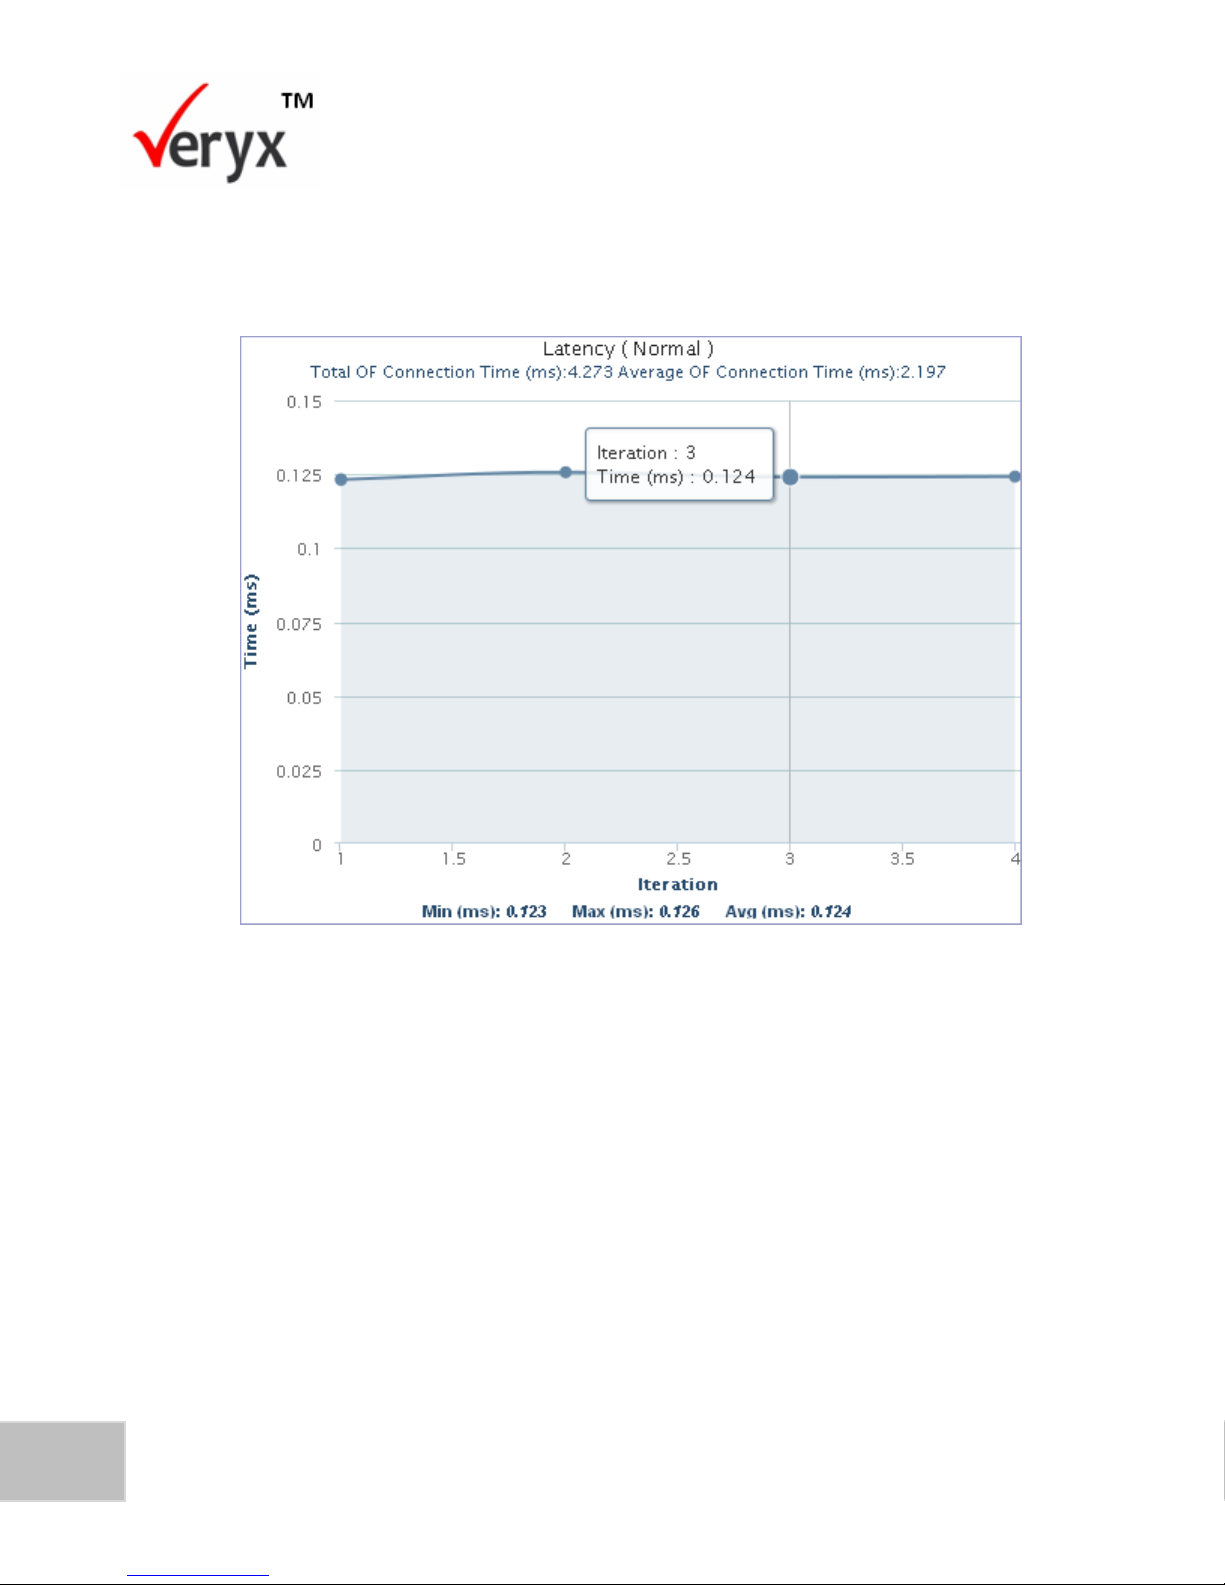
68
PktBlaster SDN Controller Test-Performance Benchmarking User Guide
Copyright © Veryx Technologies Pvt. Ltd.
View Test Result
The result for this test execution is displayed in the Latency Normal Result screen.
Figure 50: Latency Normal Result
The Latency Normal Result screen (Figure 50) and Latency Normal Table Report
(Figure 51) display the following information about the test that was executed.
1. The X-axis represents the number of iterations. (Here, number of iterations is
4).
2. The Y-axis represents the latency time in milliseconds.
3. The graph shows the average time taken to process a packet-in message in
each iteration. (Packet-in messages are sent from switches of configured
switch groups for 5 seconds). The average time taken to process a packet-in
message during a specific iteration is displayed as a tooltip.
Page 76
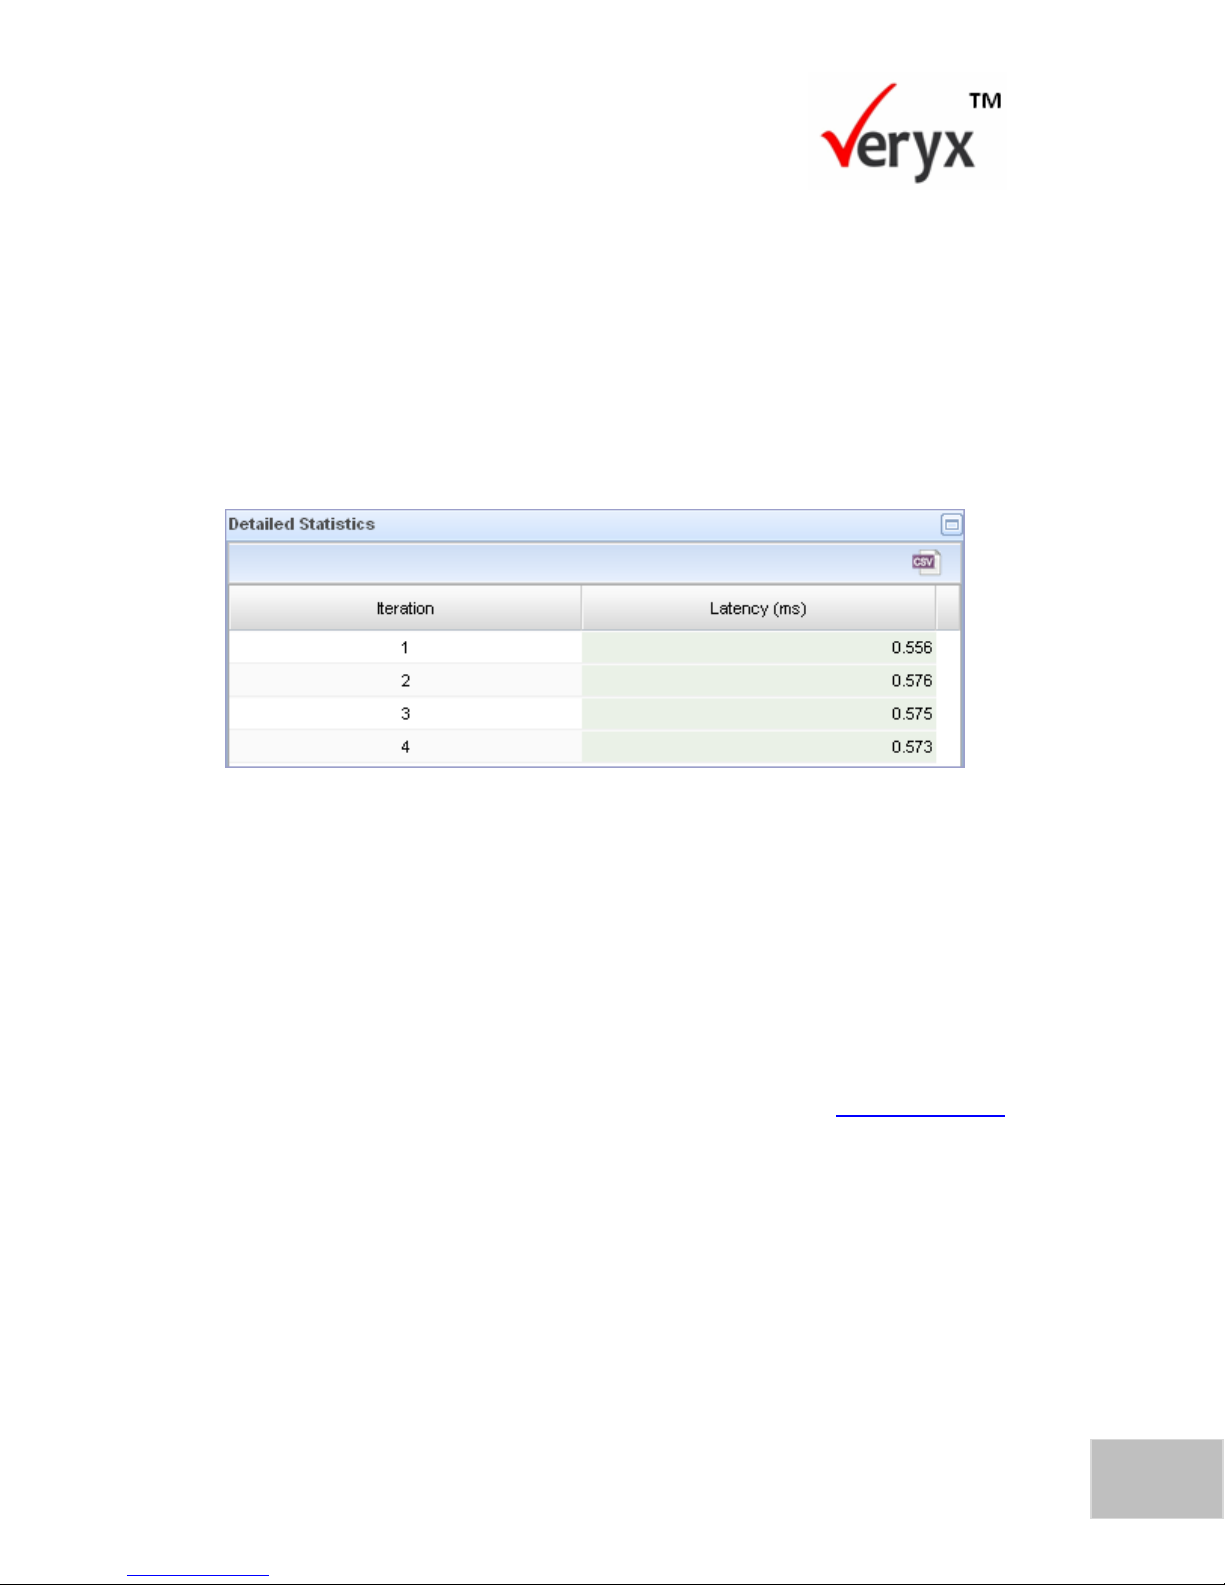
69
Copyright © Veryx Technologies Pvt. Ltd.
Executing Latency Tests
OF Connection Time (ms): Time taken by all the switches to establish a
connection with the controller and to complete the handshake with the
controller.
Average OF Connection Time (ms): Average open flow connection time
taken for all the switches to establish a connection with the controller
and complete the handshake.
4. The minimum, maximum, and average time taken to process a packet-in
message is displayed.
Figure 51: Latency Normal Table Report
5. The Detailed Statistics table displays the number of iterations the test will
run. Each iteration shows the total time, measured in milliseconds, taken by
all the simulated switches to receive a response from the controller.
To download a copy of the Latency Normal Table Report click on the CSV
situated at the top right corner of the Detailed Statistics screen.
The latency test can be repeated with the same configuration or with a modified
configuration. For more information on repeating the test, refer to Re-execute a test
in the Test Execution Details chapter.
Latency Test in Incremental Switch Mode
This mode measures the time taken by the controller to process a packet-in message
under incremental switch load conditions. This is achieved by increasing the number
of switches part of a switch group that send packet-in messages to the controller in
steps of 25%.
Page 77
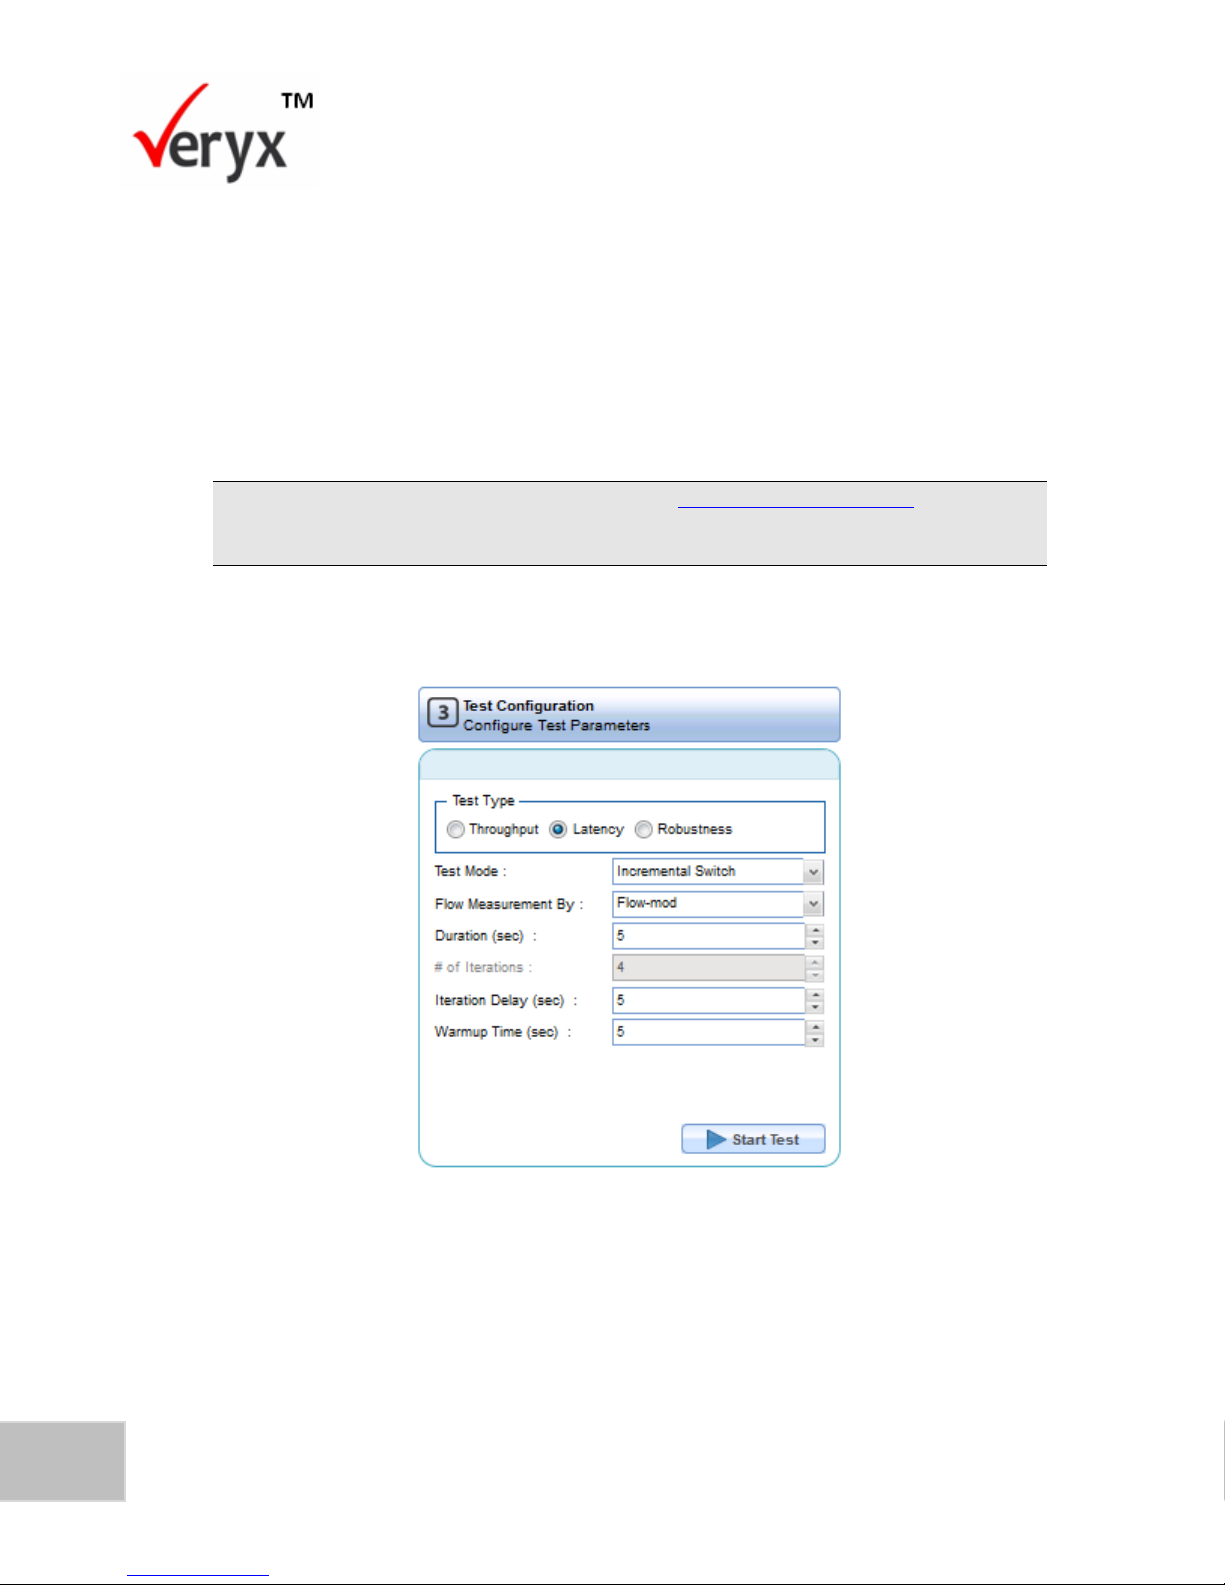
70
PktBlaster SDN Controller Test-Performance Benchmarking User Guide
Copyright © Veryx Technologies Pvt. Ltd.
The process of sending the packet-in messages is the same as in the latency test
executed in the Normal mode.
To run a latency test in the Incremental Switch mode:
1. Click the Performance tab to display the Performance screen (Figure 25).
2. Configure the Select Controller pane and Network Configuration pane
(Figure 27).
For details of how to configure the panes, refer to Configure Test Parameters section in the
Performance Tests chapter.
3. To configure the latency test incremental mode parameters, go to the Test
Configuration pane.
Figure 52: Test Configuration-Latency Incremental Switch Mode
4. Under Test Type, select Latency.
5. From the Test Mode drop-down list, select Incremental Switch.
6. In the Flow Measured By, select the response type the controller sends to
the simulated switches.
Page 78
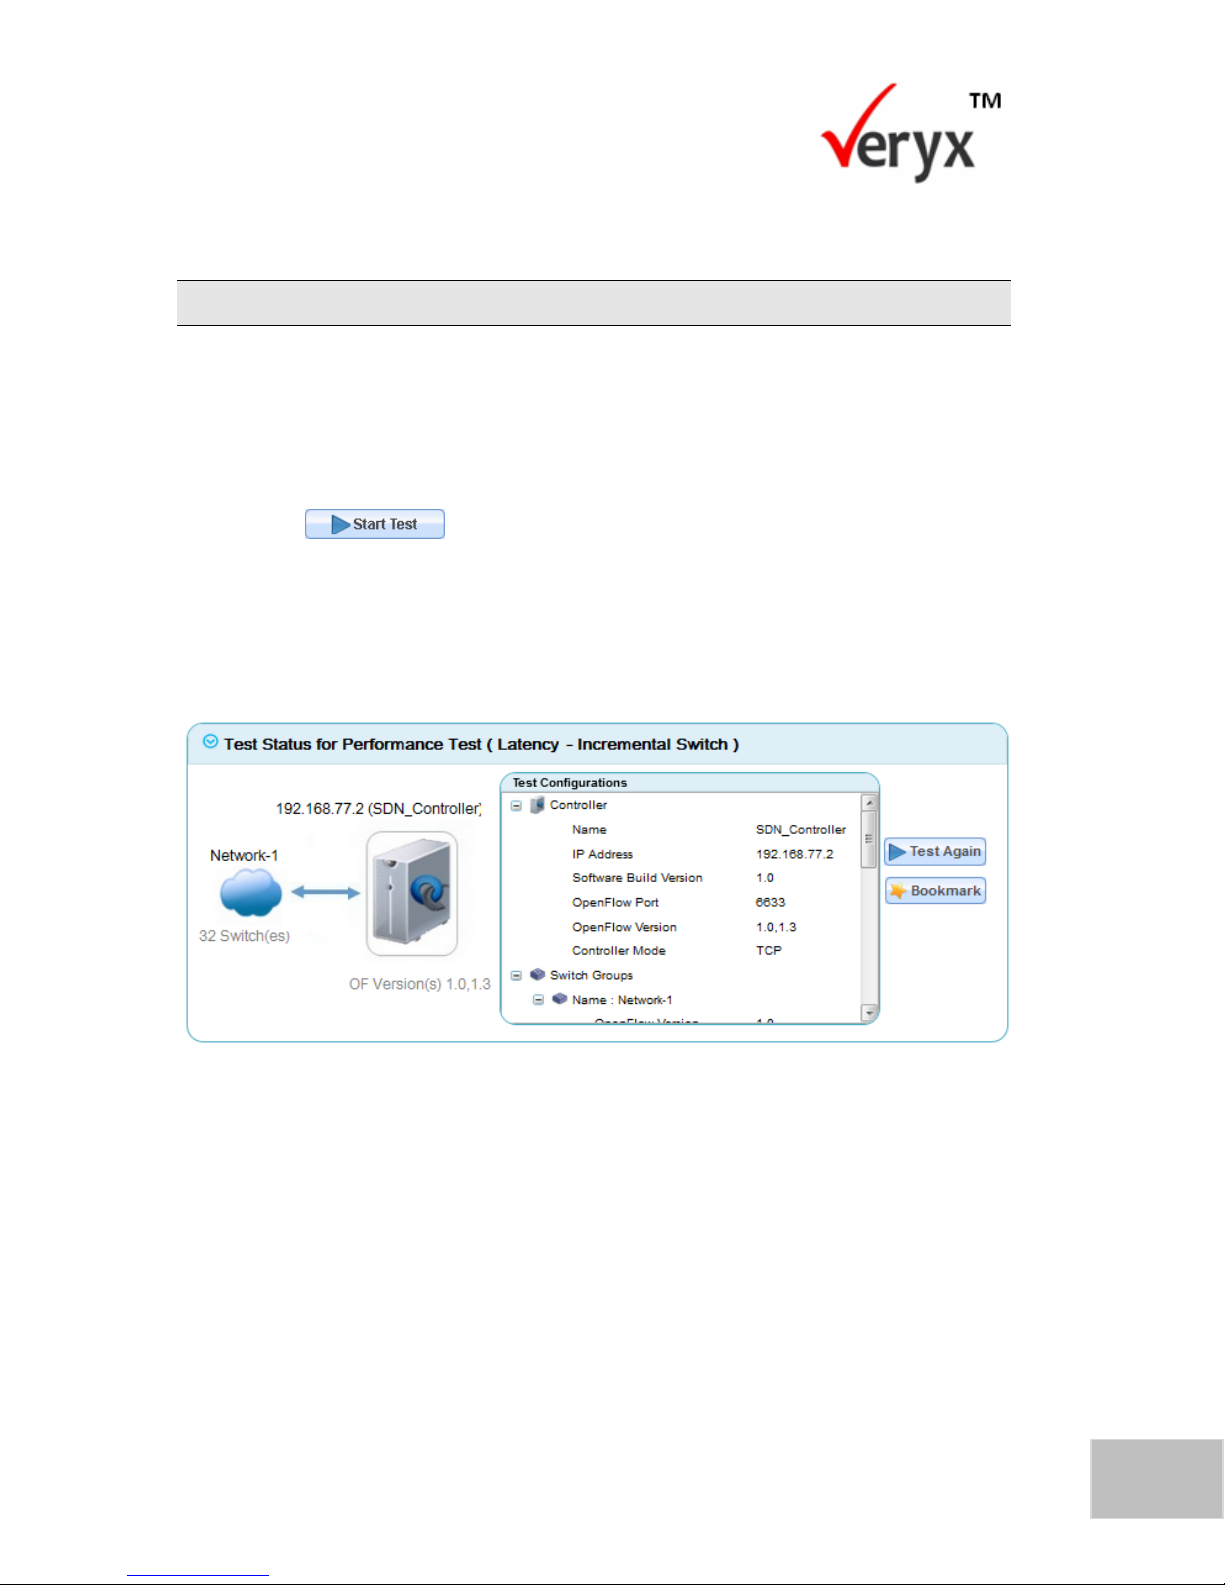
71
Copyright © Veryx Technologies Pvt. Ltd.
Executing Latency Tests
7. In the Duration (sec) box, type or select the test duration. Here, the test
duration is set to 5 seconds.
The # of Iterations box is disabled in this mode as the test is set to repeat for 4 iterations.
8. In the Iteration Delay (sec) box, specify the number of seconds the test
should pause before it starts the next iteration.
9. In Warmup Time (sec), specify the number of seconds the test should wait
after the handshake with the controller is completed.
10. Click to run the test.
The Test Status for Performance Test- Latency Incremental Switch Mode screen
(Figure 53 and Figure 54) shows the test execution progress for a latency test in
Incremental Switch mode of the participating switch group network. The responses
are measured based on Flow Mod messages.
Figure 53: Latency Incremental Switch Mode (Upper)
Page 79
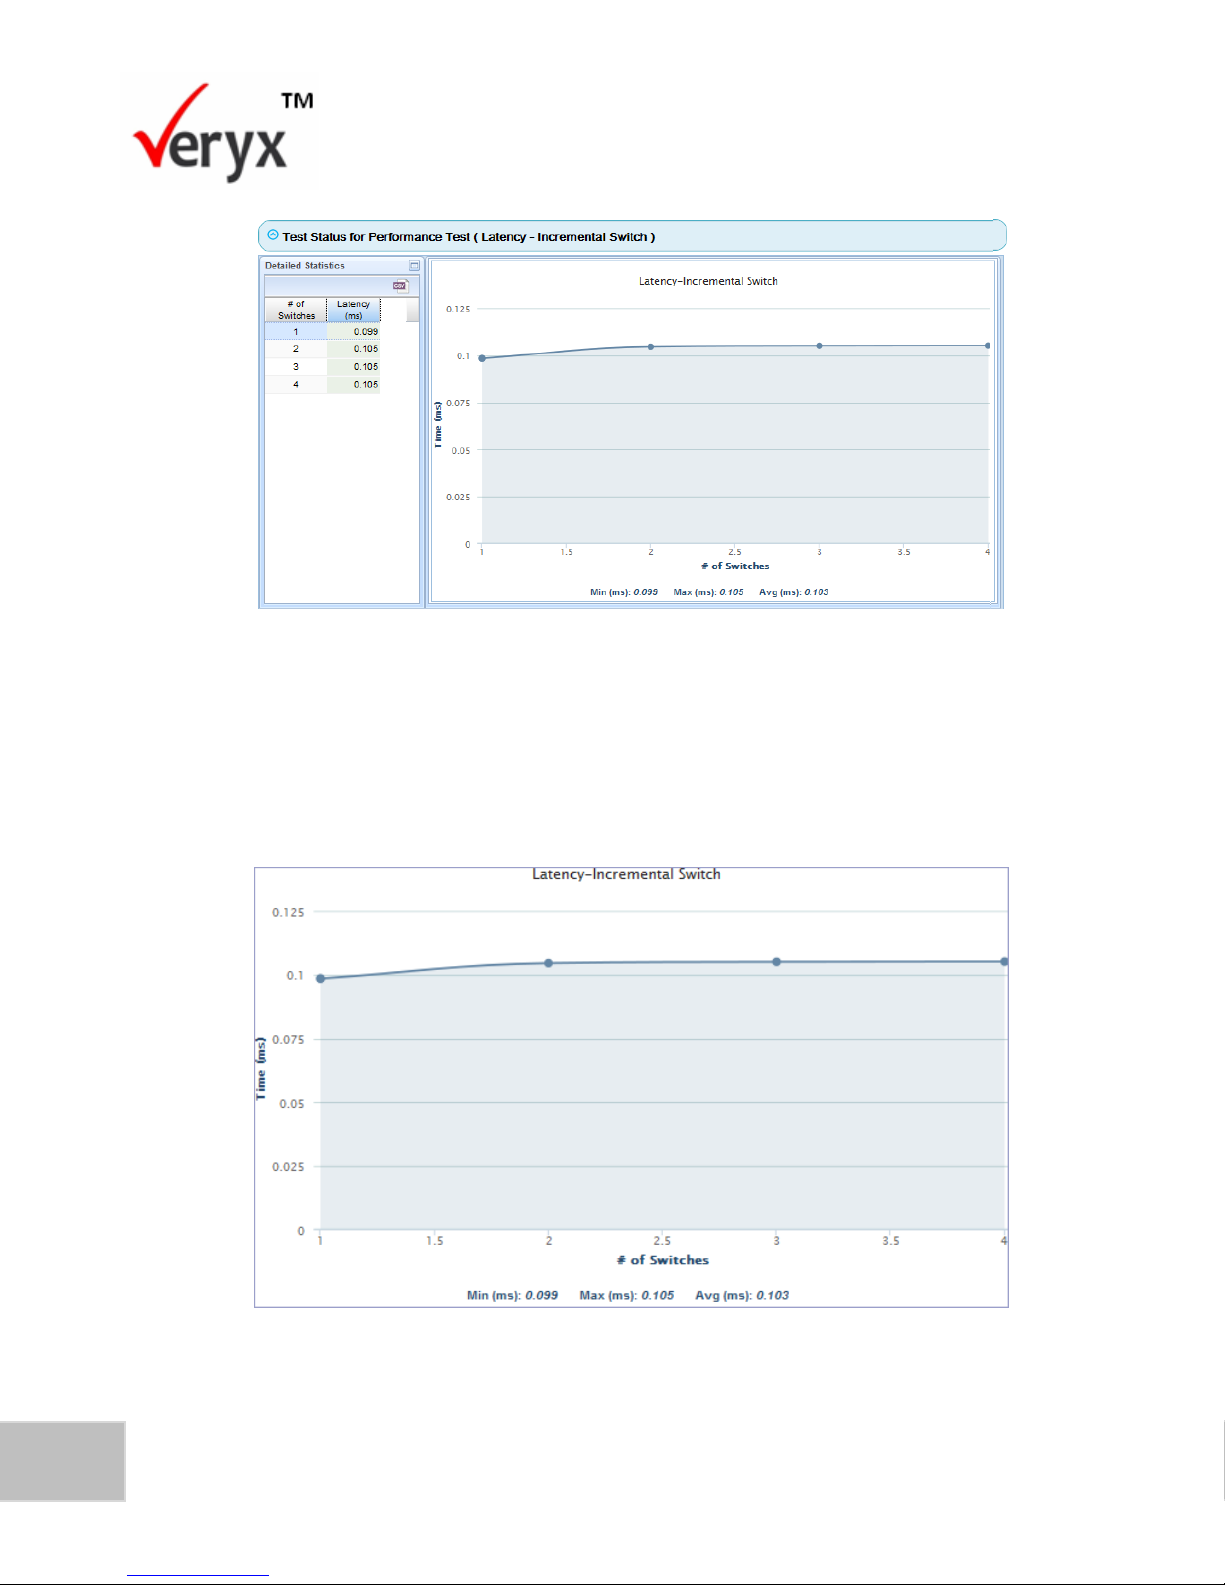
72
PktBlaster SDN Controller Test-Performance Benchmarking User Guide
Copyright © Veryx Technologies Pvt. Ltd.
Figure 54: Latency Incremental Switch Mode (Lower)
View Test Result
The result for this test execution is displayed as shown in Latency Incremental
Switch Result screen and Latency Incremental Switch Table Result.
Figure 55: Latency Incremental Switch Result
Page 80
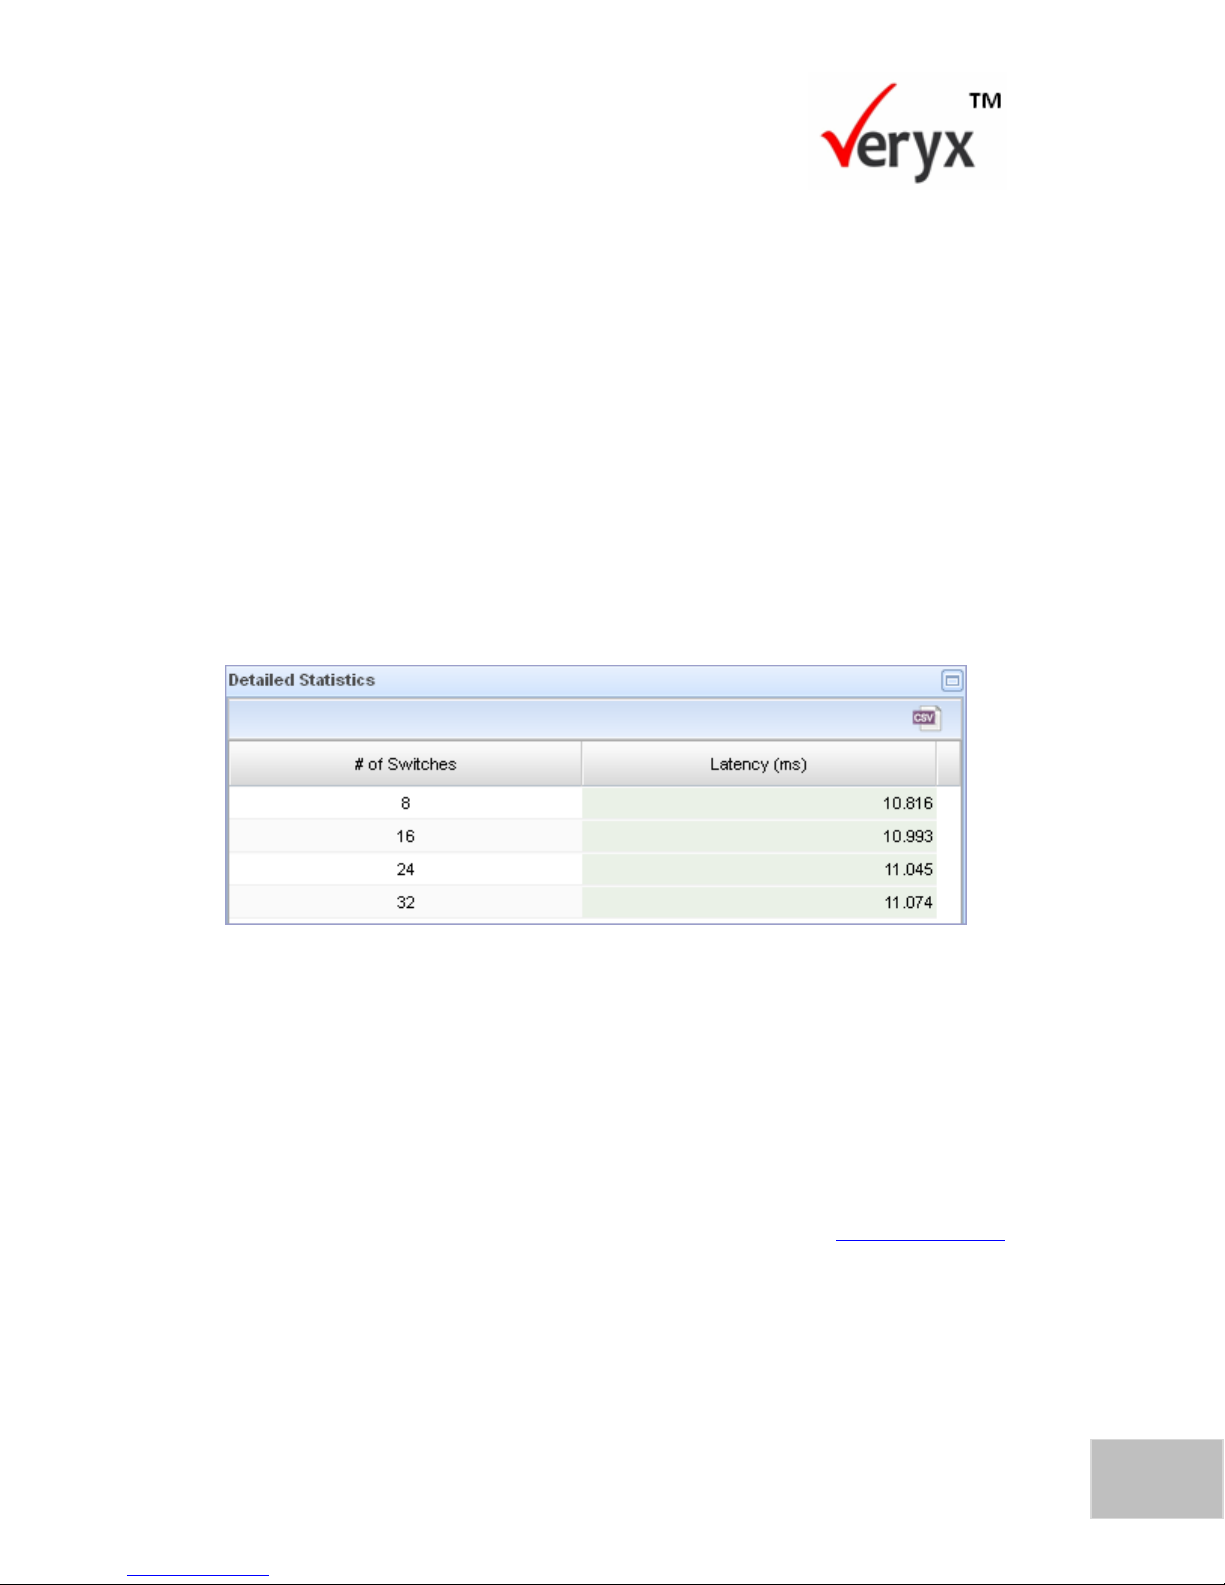
73
Copyright © Veryx Technologies Pvt. Ltd.
Executing Latency Tests
The Latency Incremental Switch Result screen displays the following information
about the test that was executed:
1. The X-axis represents the number of switches. (Here, the participating switch
group network determines the number of switches).
2. The Y-axis represents the latency time in milliseconds.
3. The graph shows the average time taken to process a packet-in message
when the number of switches is incremented by 25%. Successive test
iterations will have the number of switches incremented in this manner. The
average time taken to process a packet-in message during a specific
incremental stage is displayed as a tooltip.
4. The minimum, maximum, and average time taken to process a packet-in
message is displayed.
Figure 56: Latency Incremental Switch Table Result
5. Figure 56 displays the number of switches for each iteration is computed in
multiples of 8 and the latency is measured in milliseconds.
To download a report of Incremental Switch Table Result, click CSV at the
top right of the detailed statistics screen.
The test can be repeated with the same configuration or with a modified
configuration. For more information on repeating the test, refer to Re-execute a test
in the Test Execution Details chapter.
Page 81

74
PktBlaster SDN Controller Test-Performance Benchmarking User Guide
Copyright © Veryx Technologies Pvt. Ltd.
This page has been intentionally left blank.
Page 82
75
Copyright © Veryx Technologies Pvt. Ltd.
Executing Robustness Tests
9 EXECUTING ROBUSTNESS TESTS
A Robustness test is done to monitor the behavior of the controller. Test
performance is measured depending on the response type. The response type and
number of malformed packet-in messages are configured using test parameters.
Valid packet-in messages along with malformed packet-in messages are sent to the
controller and the controller should handle and respond to valid packet-in messages.
There are no test modes in the Robustness Test.
To run a Robustness test:
1. Click the Performance tab to display the Performance screen (Figure 25)
2. Configure the Select Controller pane and the Network Configuration pane
(Figure 27).
For details of how to configure test parameters, refer to Configure Test Parameters section in
the Performance Tests chapter.
3. To configure the robustness test parameters, go to the Test Configuration
pane.
The Test Configuration procedures for Flow Mod messages and Packet out messages are
similar.
Page 83
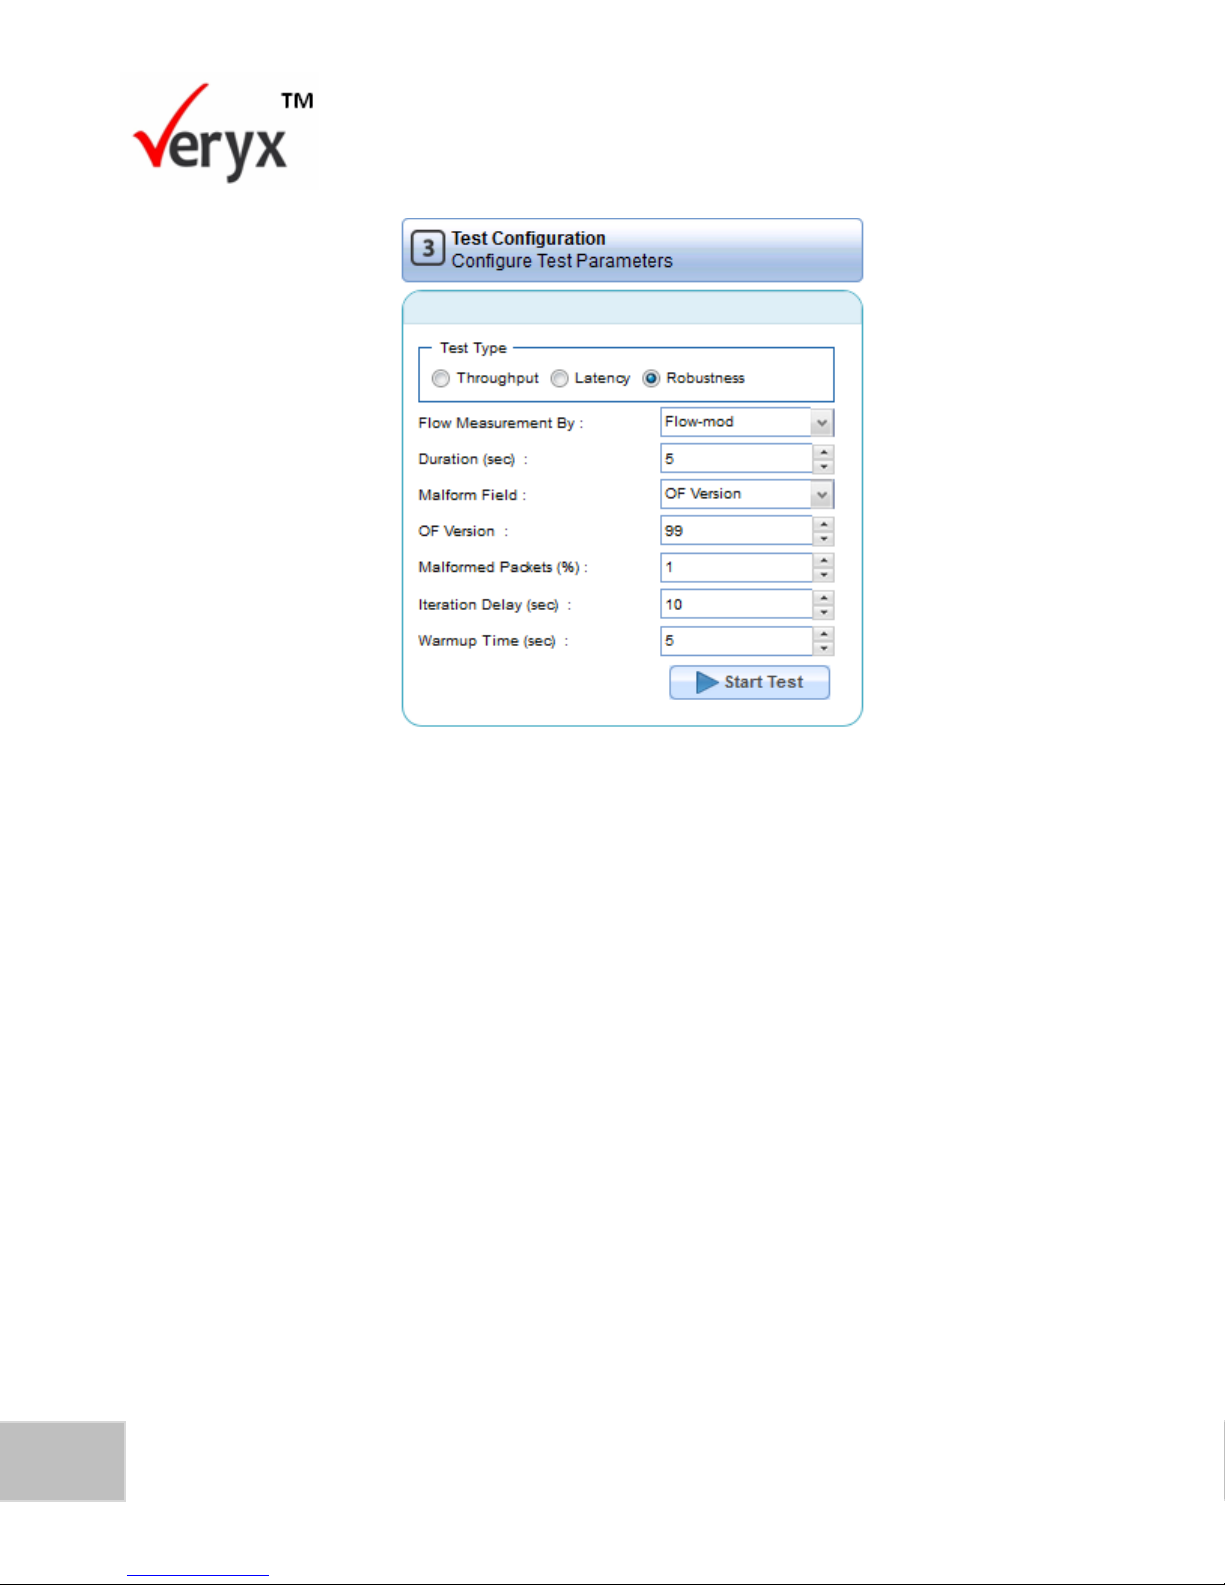
76
PktBlaster SDN Controller Test-Performance Benchmarking User Guide
Copyright © Veryx Technologies Pvt. Ltd.
Figure 57: Robustness Flow Mod Test Configuration
4. Under Test Type, select Robustness.
5. In Flow Measured By, select the type of response the controller should send
to the emulated switches.
6. In the Duration (sec) box, type or select the test duration. Here, the test
duration is set to 5 seconds.
7. In the Malform Field, you can select the packet-in message fields that can be
malformed. They are:
OF Version: OF version in the OF header.
OF Header Length: Total length of the packet-in message in the OF header.
OF Message Type: Type of message in the OF header.
8. In the OF Version field, specify the value of the Malform field from the given
range.
9. In Malform Pkts%, specify the percentage of Malform packet-in messages
that will be sent along with normal packet-in messages. The error value
depends on the Malform field.
Page 84
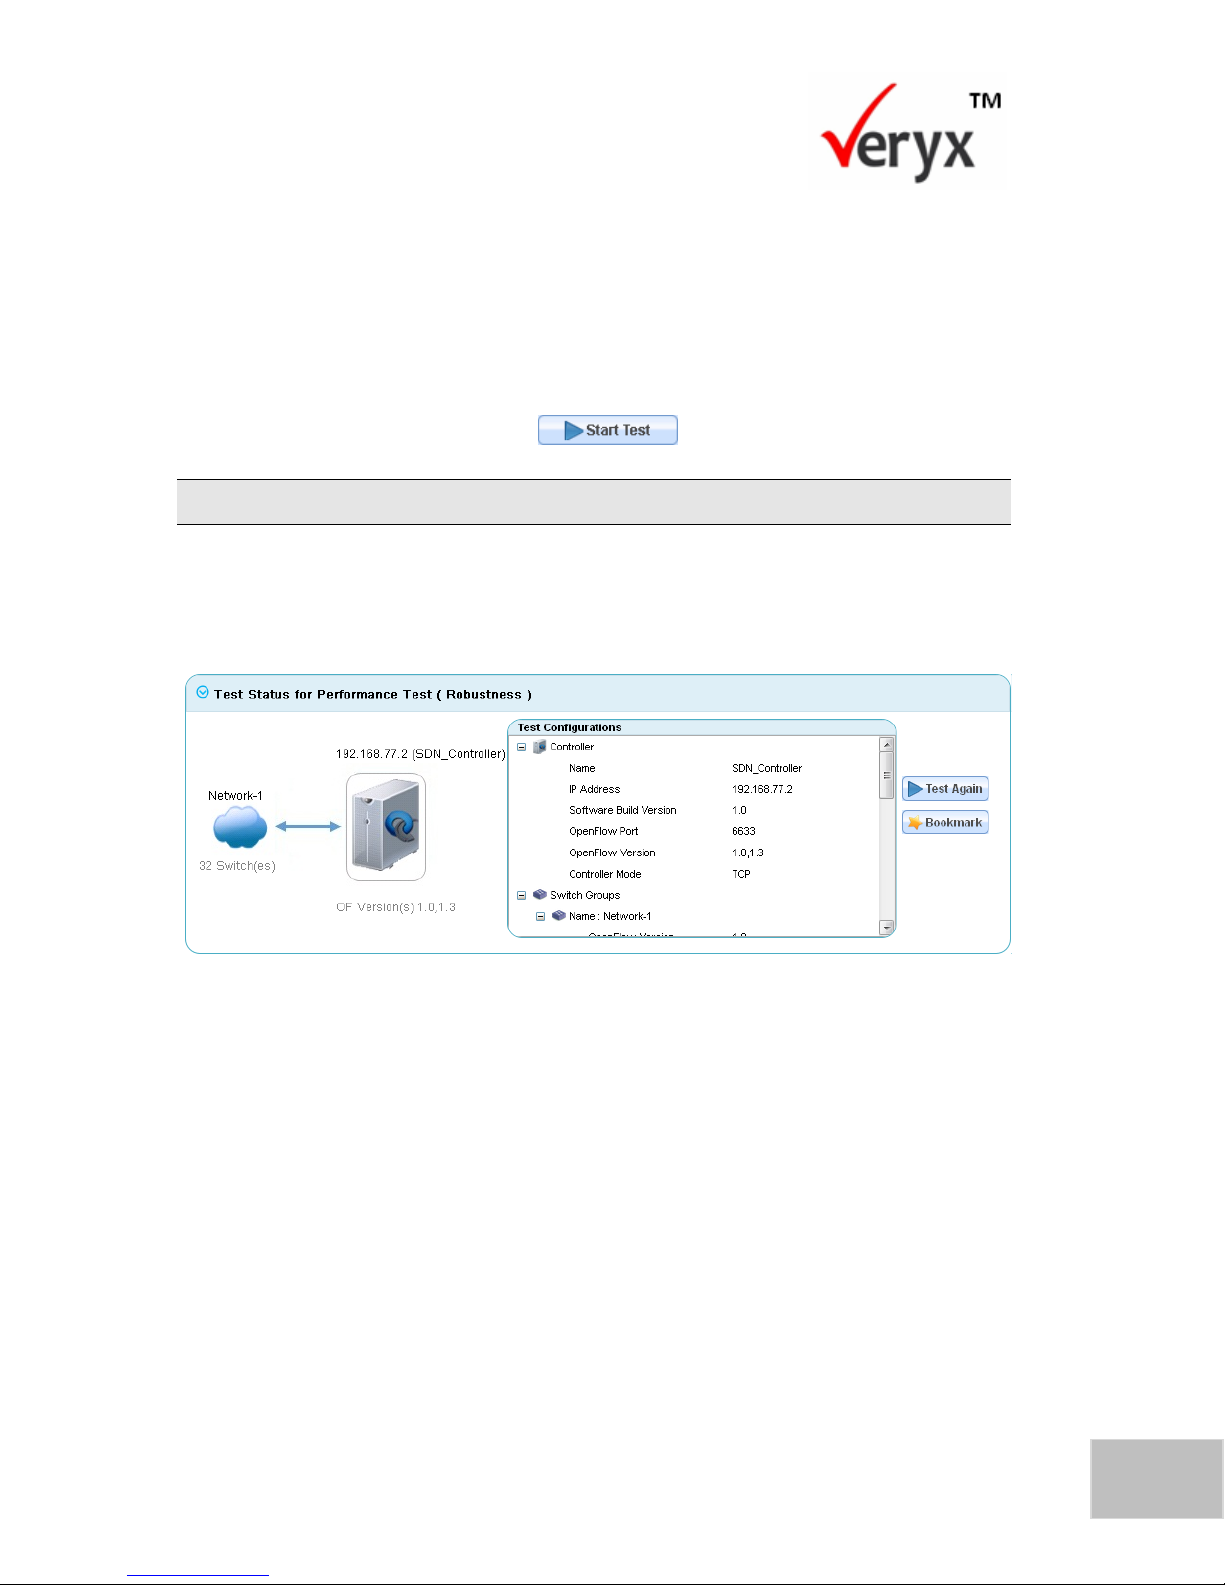
77
Copyright © Veryx Technologies Pvt. Ltd.
Executing Robustness Tests
10. In the Iteration Delay (sec) box, specify the number of seconds the test
should pause before it starts the next iteration to flush out the responses
received during the previous iteration.
11. In Warmup Time (sec), specify the number of seconds the test should wait
after the handshake with the controller is completed.
12. To run the test, select the switch group network in the network
configuration pane and click to run the test.
The Robustness test will run only for four iterations.
The Test Status for Performance Test- Robustness Flow Mod Result Report (Upper
and Lower) measures performance Robustness are displayed in Figure 58 and Figure
59.
Figure 58: Robustness Flow Mod Result Report (Upper)
Page 85
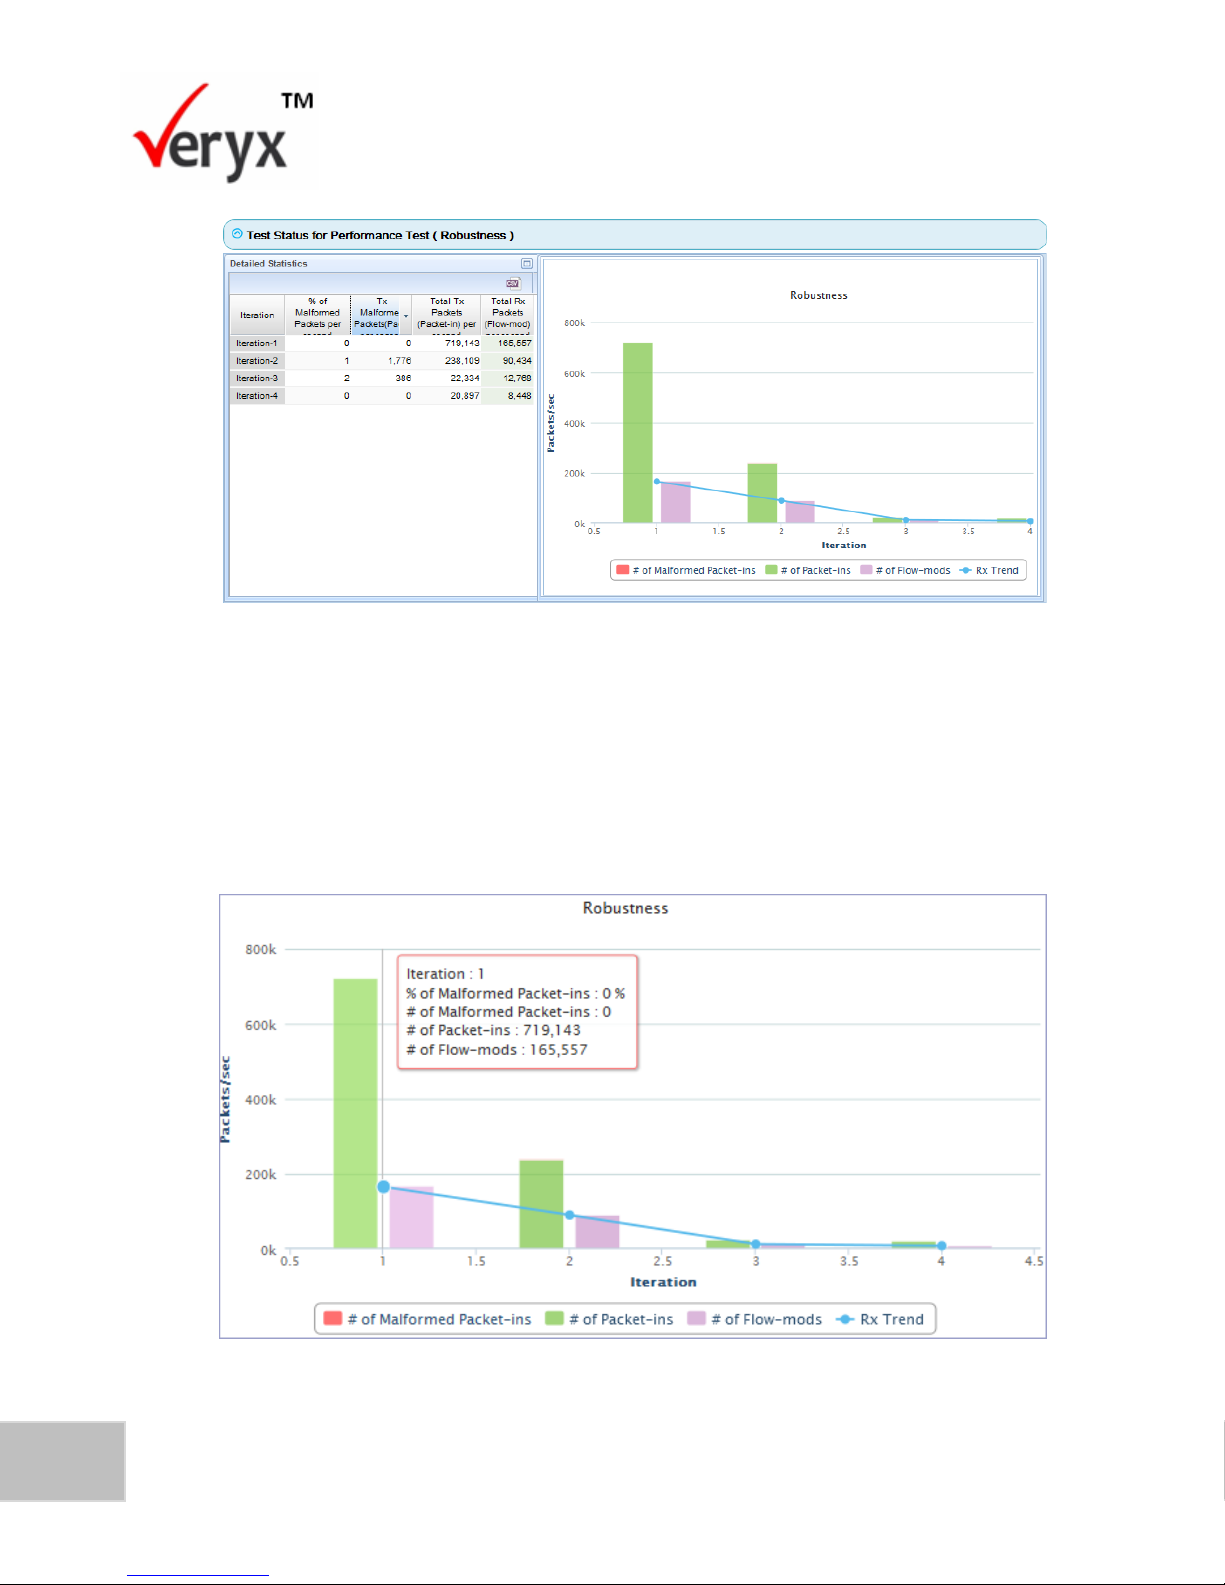
78
PktBlaster SDN Controller Test-Performance Benchmarking User Guide
Copyright © Veryx Technologies Pvt. Ltd.
Figure 59: Robustness Flow Mod Result Report (Lower)
View Test Result
The test results for Packet-out messages are displayed in a manner similar to those
for Flow Mod messages. The result of this test execution is displayed in the
Robustness Flow Mod Result Report (Lower) screen (Figure 59).
Figure 60: Robustness Flow Mod Graph Result
Page 86
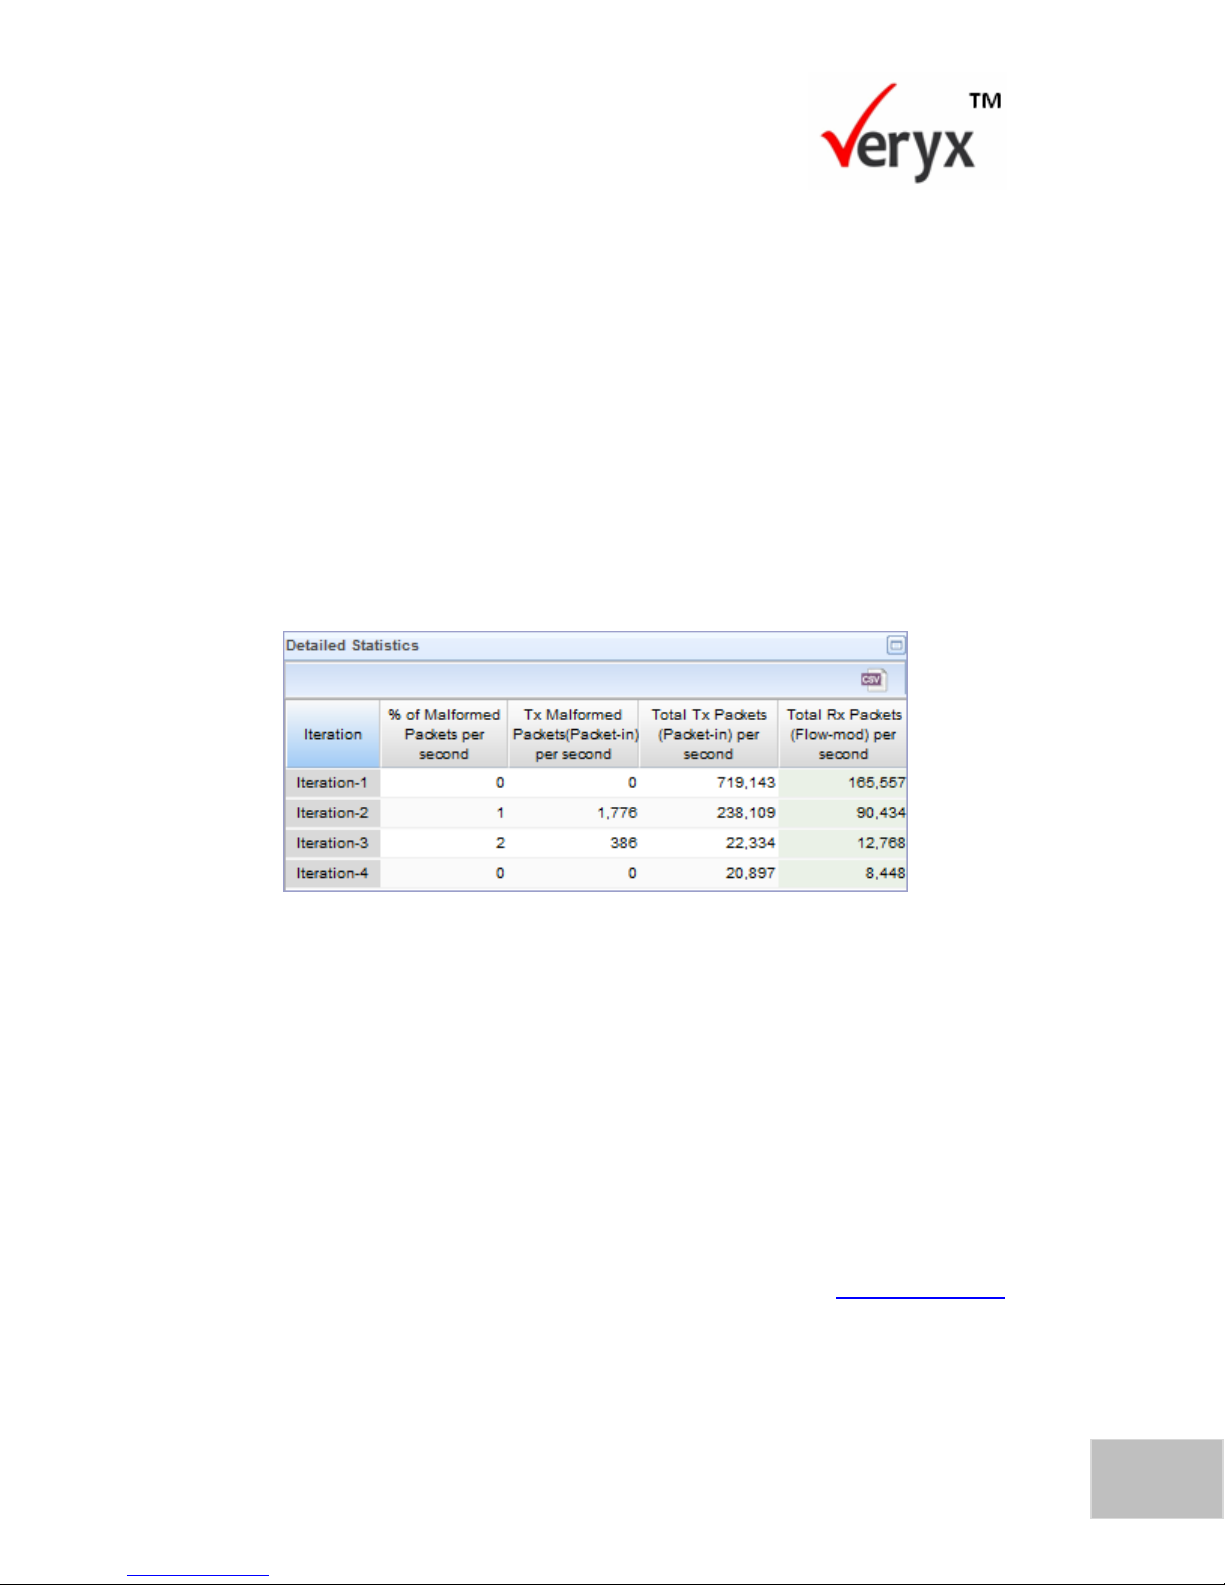
79
Copyright © Veryx Technologies Pvt. Ltd.
Executing Robustness Tests
The Robustness Flow Mod Graph Result screen (Figure 60) and Robustness Flow
Mod Result Table Report (Figure 61) display the following information about the
test that was executed.
1. The X-axis represents the number of iterations. (Here, number of iterations is
set to 4).
2. The Y-axis represents the number of malformed packet-in messages along
with valid packet-in messages.
3. The graph displays the number of valid packet-in messages along with
malformed packet-in messages and Rx trend chart for the no of responses
received during each iteration.
4. The graph allows you to click on series that you do not want to display.
Figure 61: Result Table Report
5. The Result Table Report (Figure 61) displays the number of iterations the
test will run. The statistics provided for each iteration are: the percentage of
malformed packets, the number of malformed packets, and the number of
valid packets sent to the controller and the number of packet-out messages
received from the controller.
To download a copy of the Result Table Report click CSV situated at the topright corner of the Detailed Statistics screen.
The Robustness test can be repeated with the same configuration or with a modified
configuration. For more information on repeating the test, refer to Re-execute a test
in the Test Execution Details chapter.
Page 87

80
PktBlaster SDN Controller Test-Performance Benchmarking User Guide
Copyright © Veryx Technologies Pvt. Ltd.
This page has been intentionally left blank.
Page 88
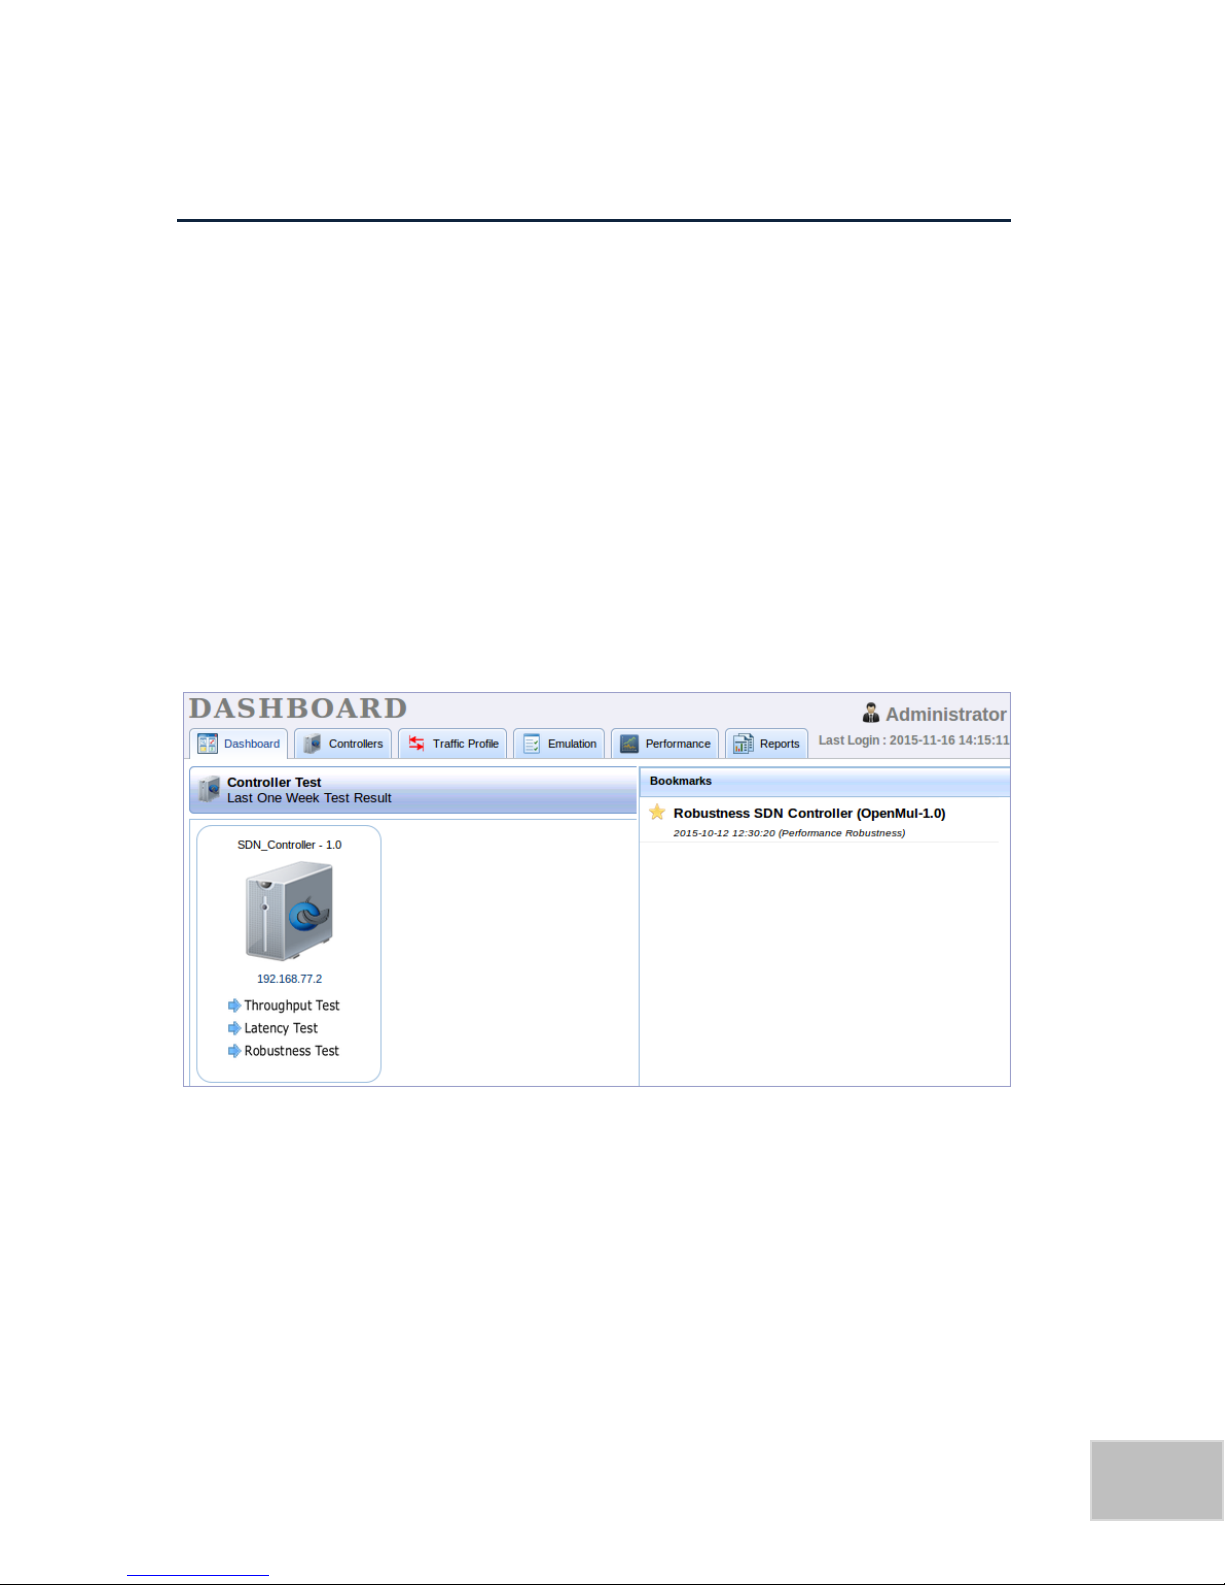
Copyright © Veryx Technologies Pvt. Ltd.
81
10 VIEWING AND GENERATING REPORTS
This chapter describes the reporting feature of PktBlaster SDN Controller Test. The
different reports that are generated provide comprehensive information about the
tests that were performed. The reports display results pertaining to the last one
week by default. However, you can change the period for which you want to view
results.
View the Dashboard
After PktBlaster SDN Controller Test has been used to test controllers, you will see
the dashboard when you log in to the tool.
The Dashboard (Figure 62) is displayed as a high-level view of test details in the
Home screen.
The dashboard in the Home screen displays a high-level view of testing progress for
each controller as shown in Figure 62. When you click on any of the controllers,
further test details will be displayed.
P a g e | 8181
Figure 62: Dashboard
Page 89
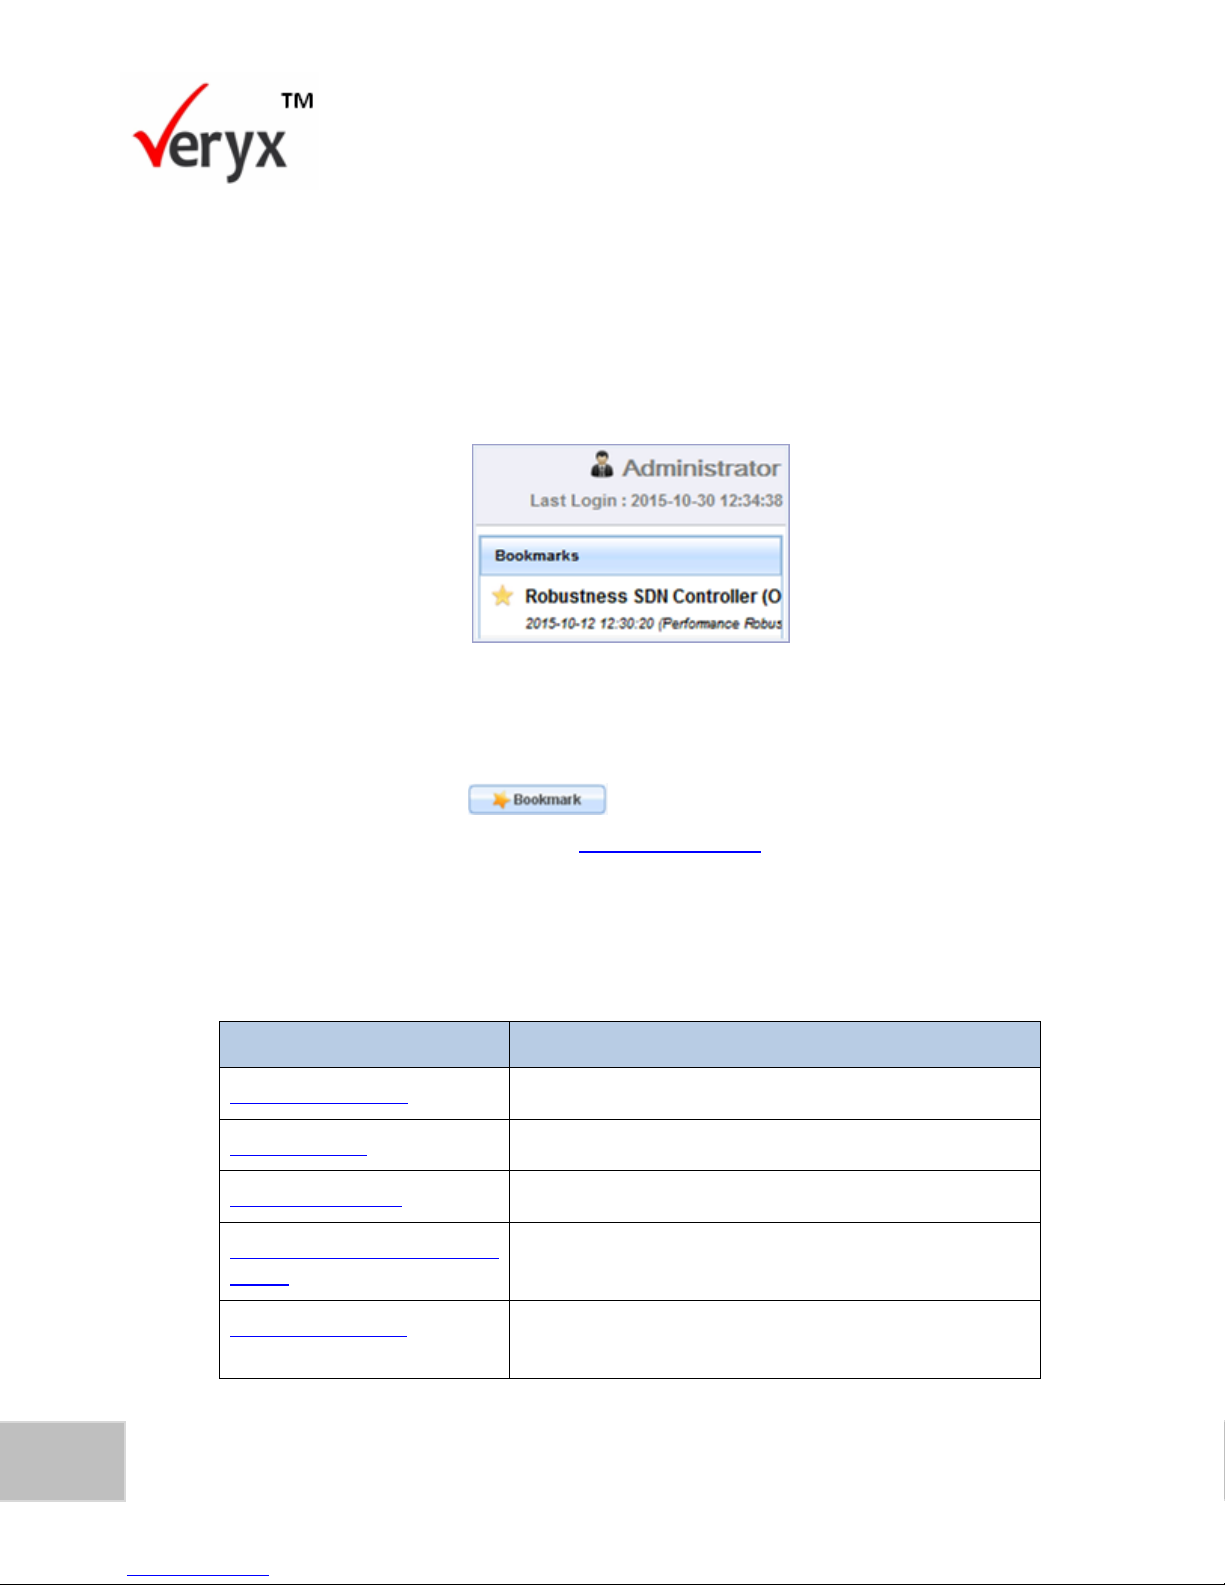
82
PktBlaster SDN Controller Test-Performance Benchmarking User Guide
Copyright © Veryx Technologies Pvt. Ltd.
REPORT
DESCRIPTION
Throughput report
Displays a summary of throughput test results
Latency report
Displays a summary of latency test results
Robustness report
Displays a summary of robustness test results
Individual test execution
report
Displays the results of a specific test execution
Search for a report
Display the different types of reports for a specific search
criterion.
View Bookmarks
In the Home screen, you can also see the Bookmarks pane (Figure 63) that will
display previously marked test results for quick reference. The Bookmarks pane
contains complete test details and controller information used during the relevant
test.
Figure 63: Bookmarks Pane
When you click on a test that is bookmarked, you will see the test details.
To bookmark a test, click when the test is being executed. For details
on how to execute tests, refer to the Performance Tests chapter.
The following table displays the types of reports generated and other features of the
reporting module.
Table 6: Report Types
Page 90
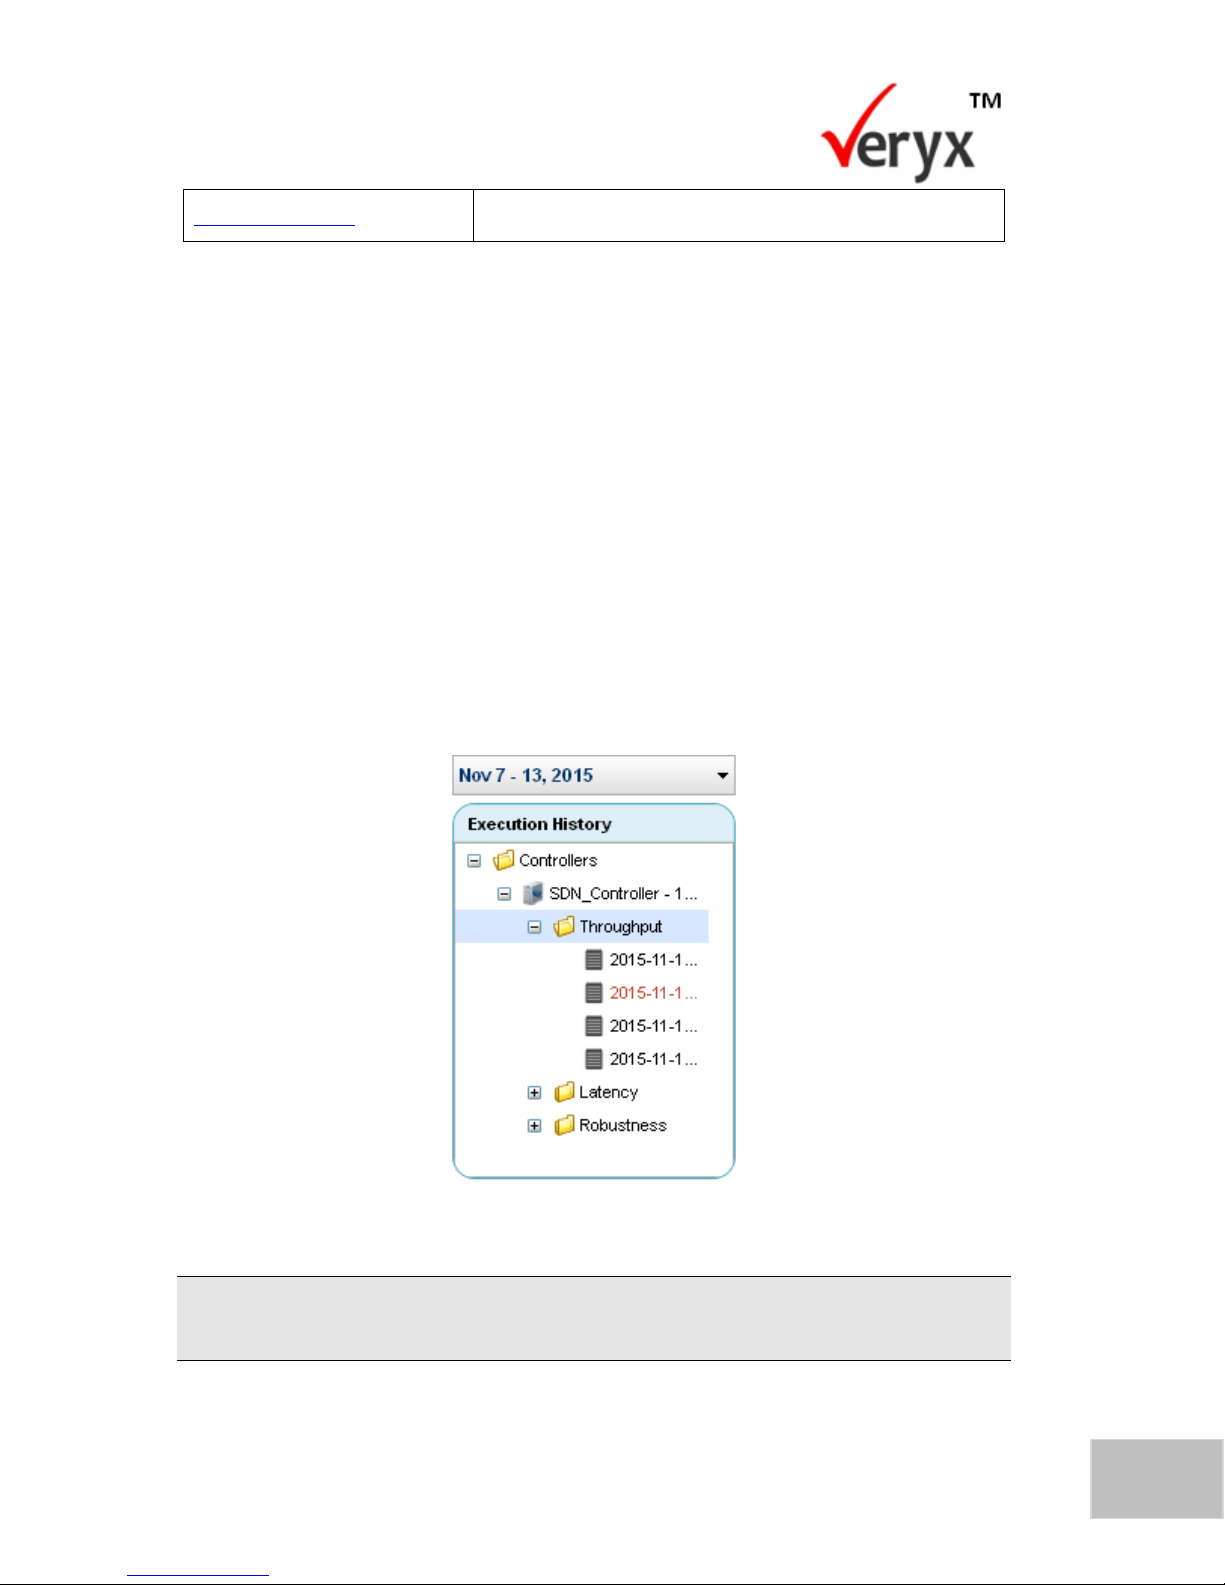
83
Copyright © Veryx Technologies Pvt. Ltd.
Viewing and Generating Reports
Download report
Download the result displayed in PDF format.
View Throughput Report
The Throughput report displays a summary of the throughput tests that were
executed. In this report, you can view:
Detailed summary results for testing mode(s) that were used to execute
tests. (A throughput test can be executed in normal mode or incremental
switch mode).
Test configuration for each mode of testing.
To view a throughput summary report:
In the Execution History pane (Figure 64) of the Reports screen, click Throughput
under the relevant controller.
Figure 64: Execution History Pane
If the controller is highlighted in red indicates the test is aborted, black indicates the test is
completed and yellow indicates the test is in progress.
Page 91
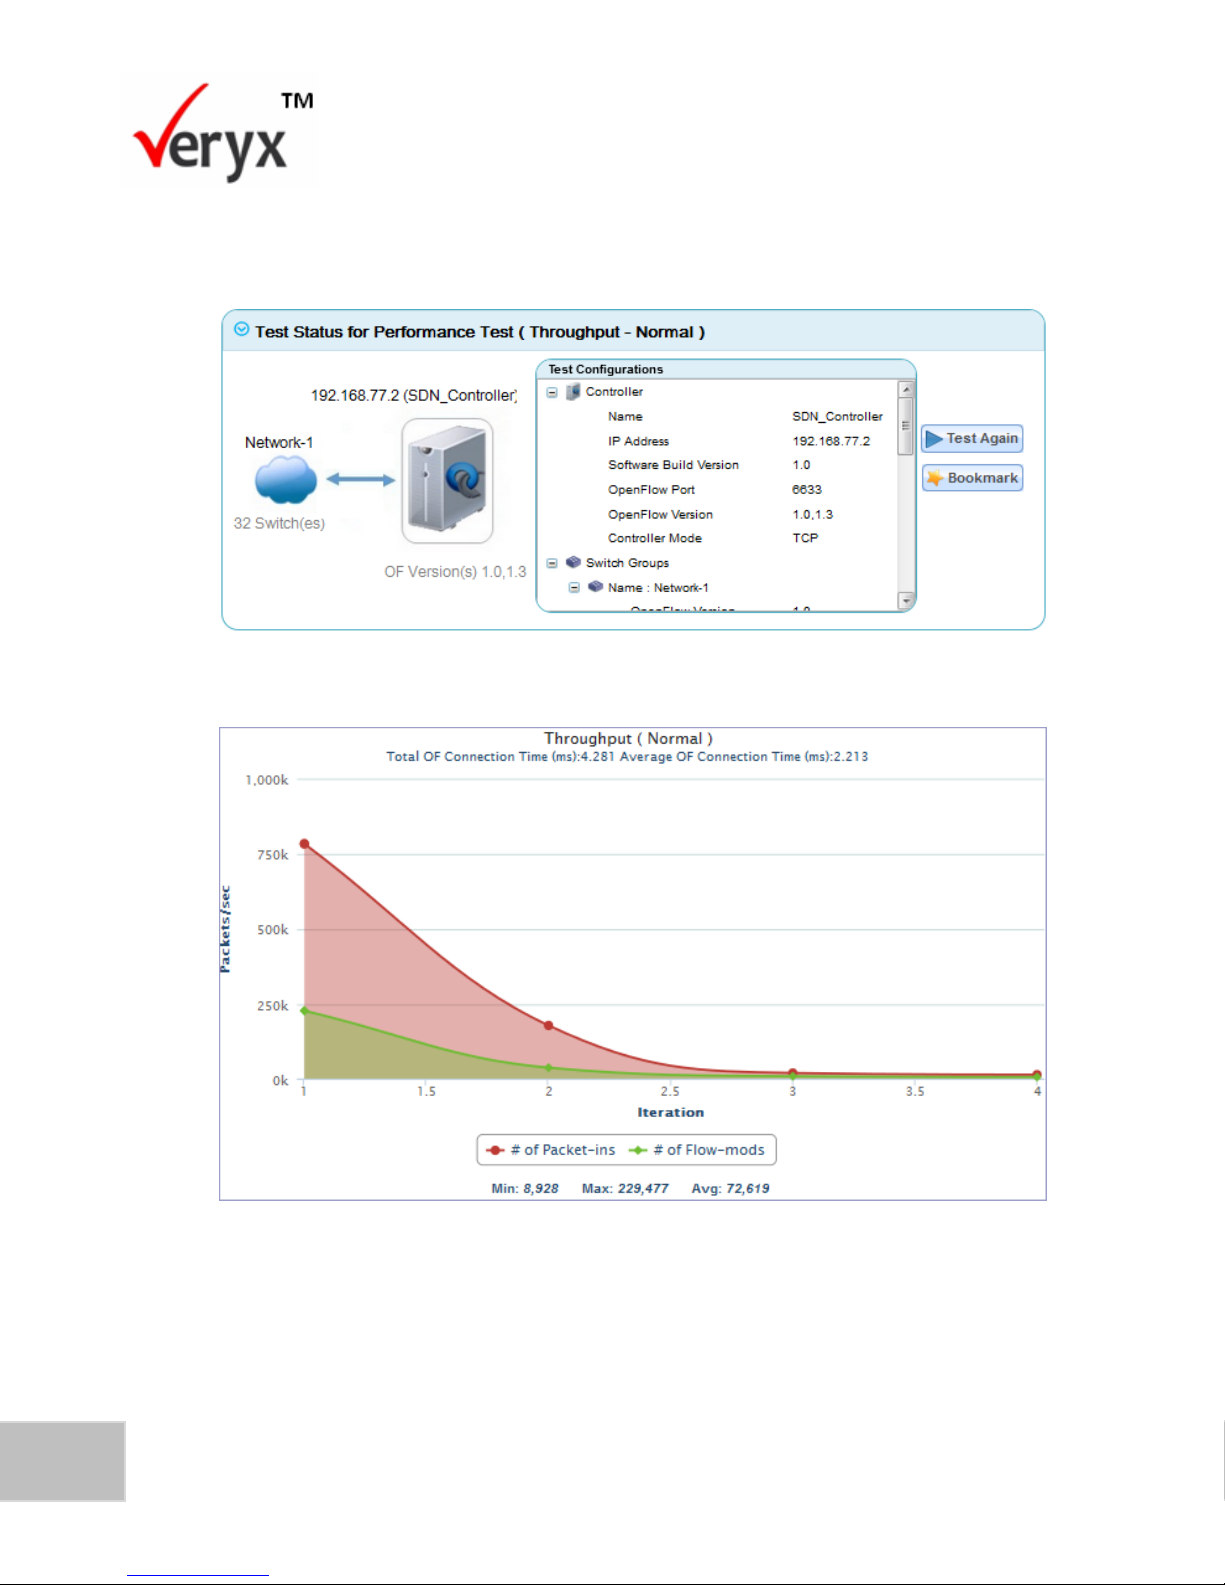
84
PktBlaster SDN Controller Test-Performance Benchmarking User Guide
Copyright © Veryx Technologies Pvt. Ltd.
The Throughput Summary Report (Upper and Lower) screens are displayed in
Figure 65 and Figure 66.
Figure 65: Throughput Summary Report (Upper)
Figure 66: Throughput Summary Report (Lower)
The Throughput Summary Report screen shows the summary information for the
modes in which the throughput tests have been executed.
Page 92
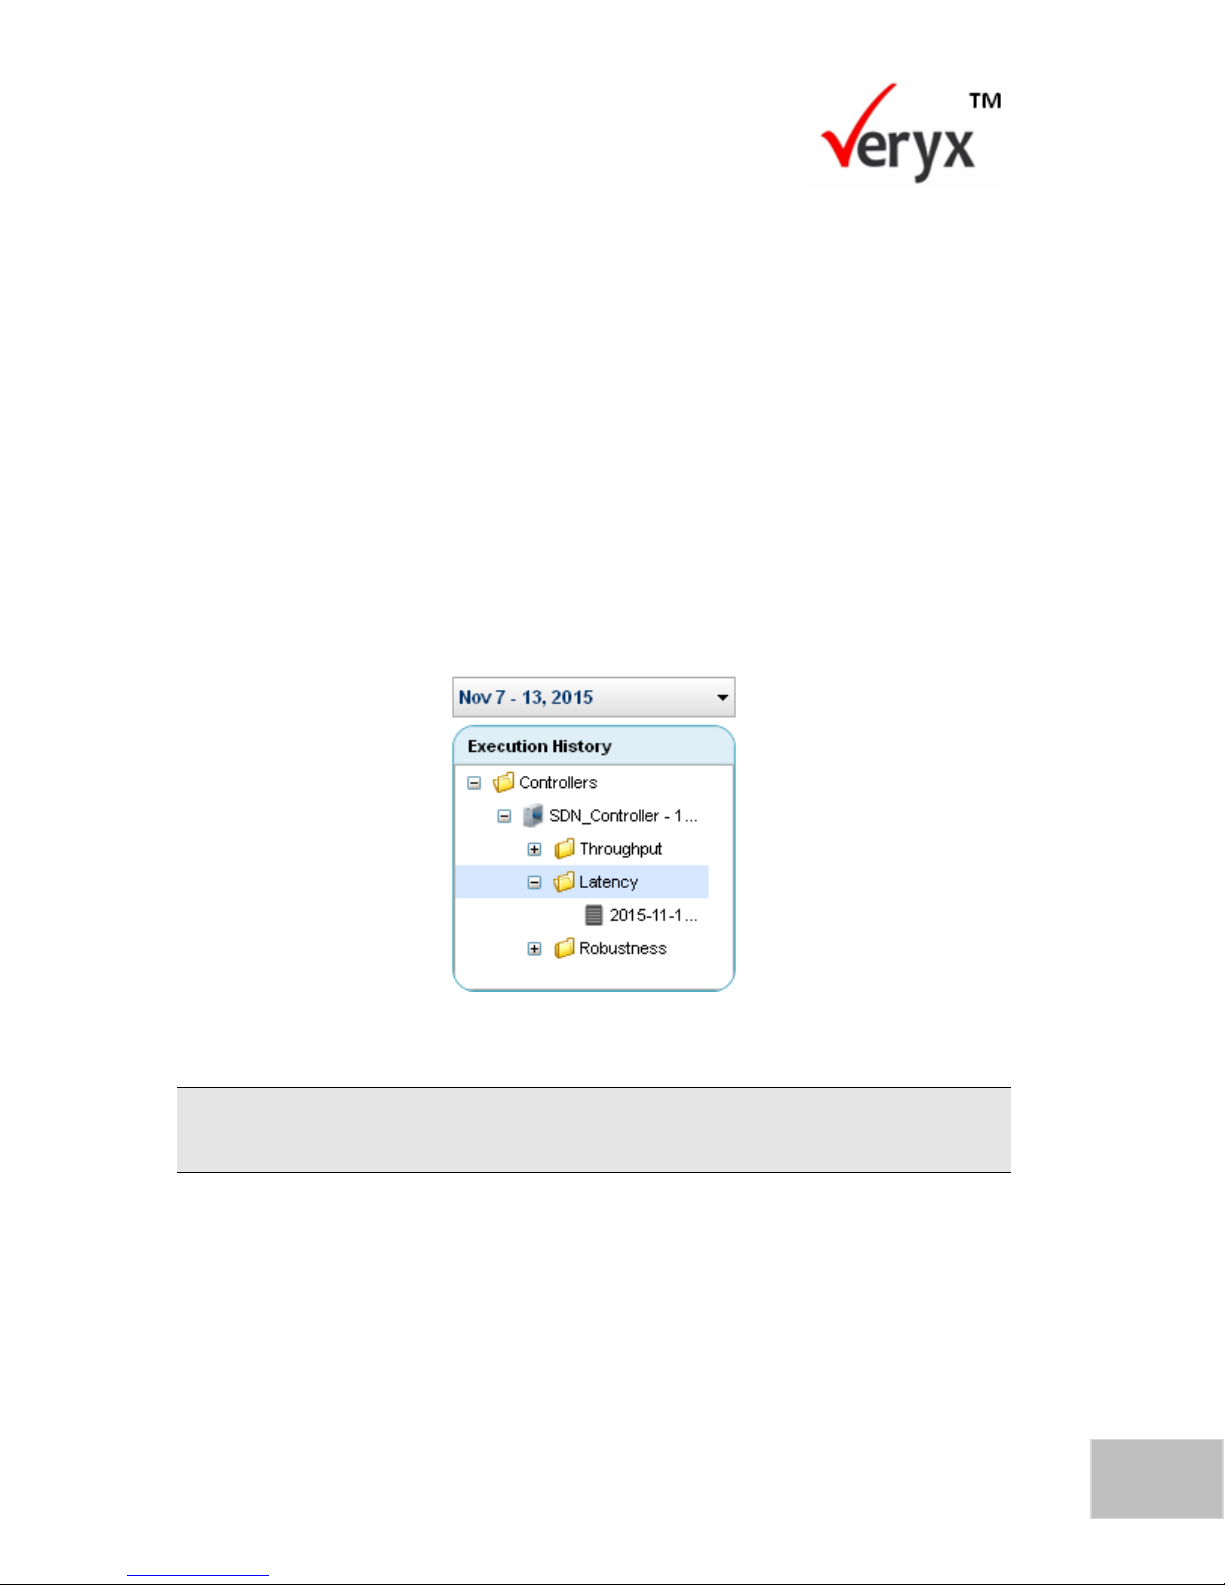
85
Copyright © Veryx Technologies Pvt. Ltd.
Viewing and Generating Reports
View Latency Report
The Latency report displays a summary of the latency tests that were executed. In
this report, you can view:
Detailed summary results for the testing mode(s) that were used to execute
tests. (A latency test can be executed in normal mode or incremental switch
mode).
Test configurations for the relevant testing modes.
To view a latency summary report:
In the Execution History pane (Figure 67) of the Reports screen, click Latency under
the relevant controller.
Figure 67: Execution History Pane
If the controller is highlighted in red indicates the test is aborted, black indicates the test is
completed and yellow indicates the test is in progress.
The Latency Summary Report (Upper and Lower) screens are displayed in Figure 68
and Figure 69.
Page 93
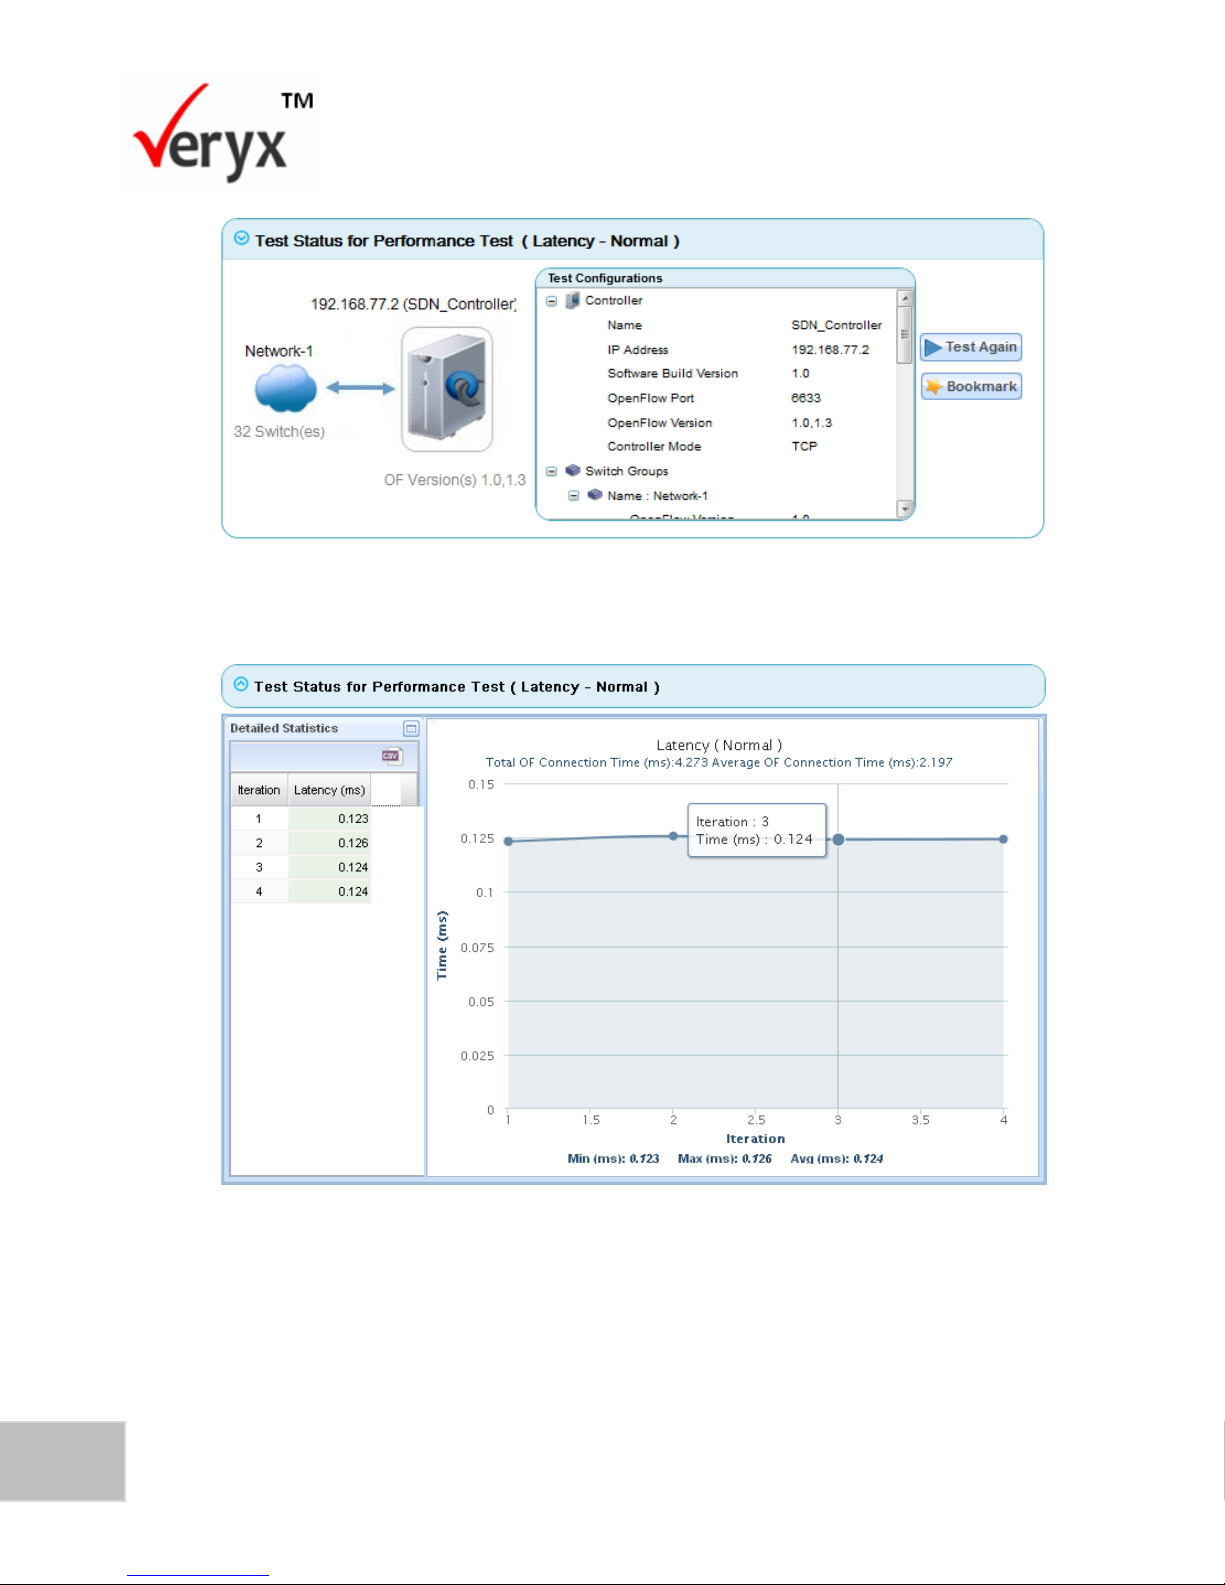
86
PktBlaster SDN Controller Test-Performance Benchmarking User Guide
Copyright © Veryx Technologies Pvt. Ltd.
Figure 68: Latency Summary Report (Upper)
Figure 69: Latency Summary Report (Lower)
The Latency Summary Report screen shows the summary information for the modes
in which the latency tests have been executed.
Page 94
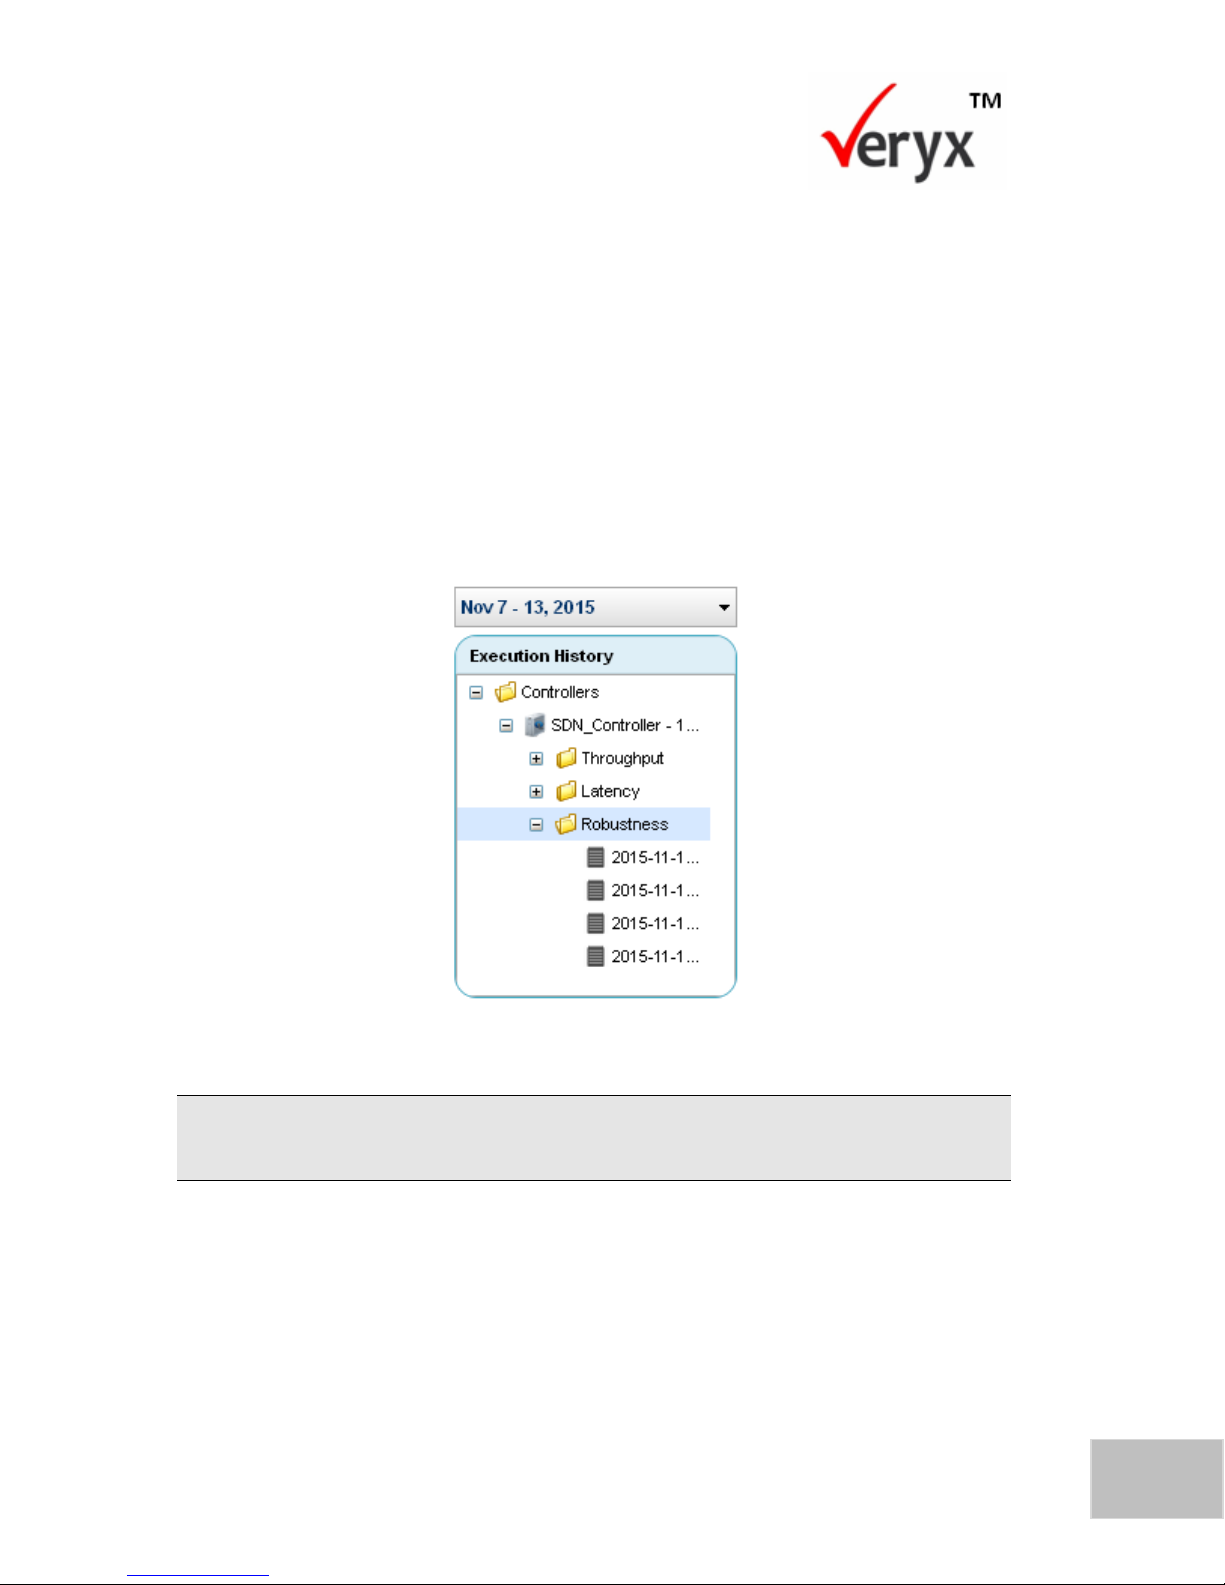
87
Copyright © Veryx Technologies Pvt. Ltd.
Viewing and Generating Reports
View Robustness Report
The Robustness report displays a summary of the tests that were executed. In this
report, you can view:
Detailed summary results of the robustness test measured in either Flow
Mod messages or Packet out messages.
To view a robustness summary report:
In the Execution History pane (Figure 70) of the Reports screen, click Robustness
under the relevant controller.
Figure 70: Execution History Pane
If the controller is highlighted in red indicates the test is aborted, black indicates the test is
completed and yellow indicates the test is in progress.
The Robustness Summary Report (Upper and Lower) screens are displayed in Figure
71 and Figure 72.
Page 95
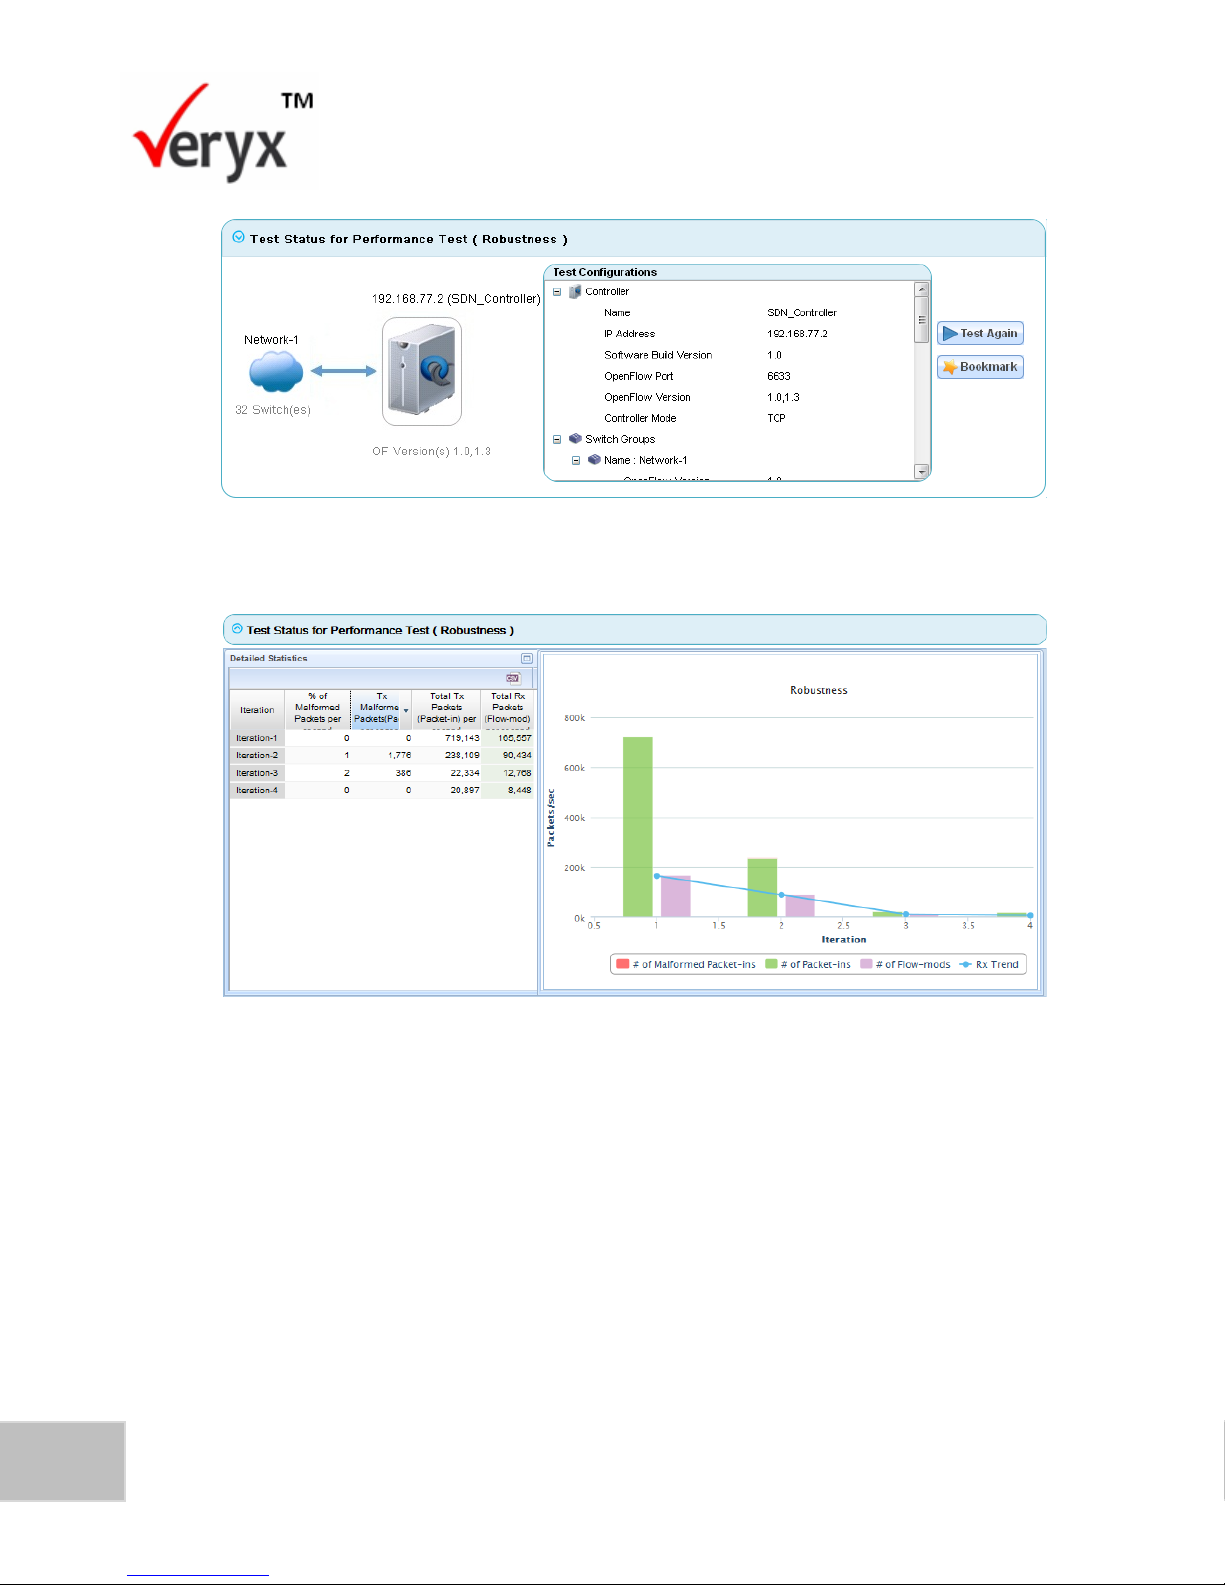
88
PktBlaster SDN Controller Test-Performance Benchmarking User Guide
Copyright © Veryx Technologies Pvt. Ltd.
Figure 71: Robustness Summary Report (Upper)
Figure 72: Robustness Summary Report (Lower)
The Robustness Summary Report screen shows the summary information for the
modes in which the robustness tests have been executed.
View Individual Test Execution Report
The individual test report displays the test results pertaining to a specific test
execution. The tool captures the results of all test executions and these results are
stored for analysis.
To view the results of an individual test:
Page 96
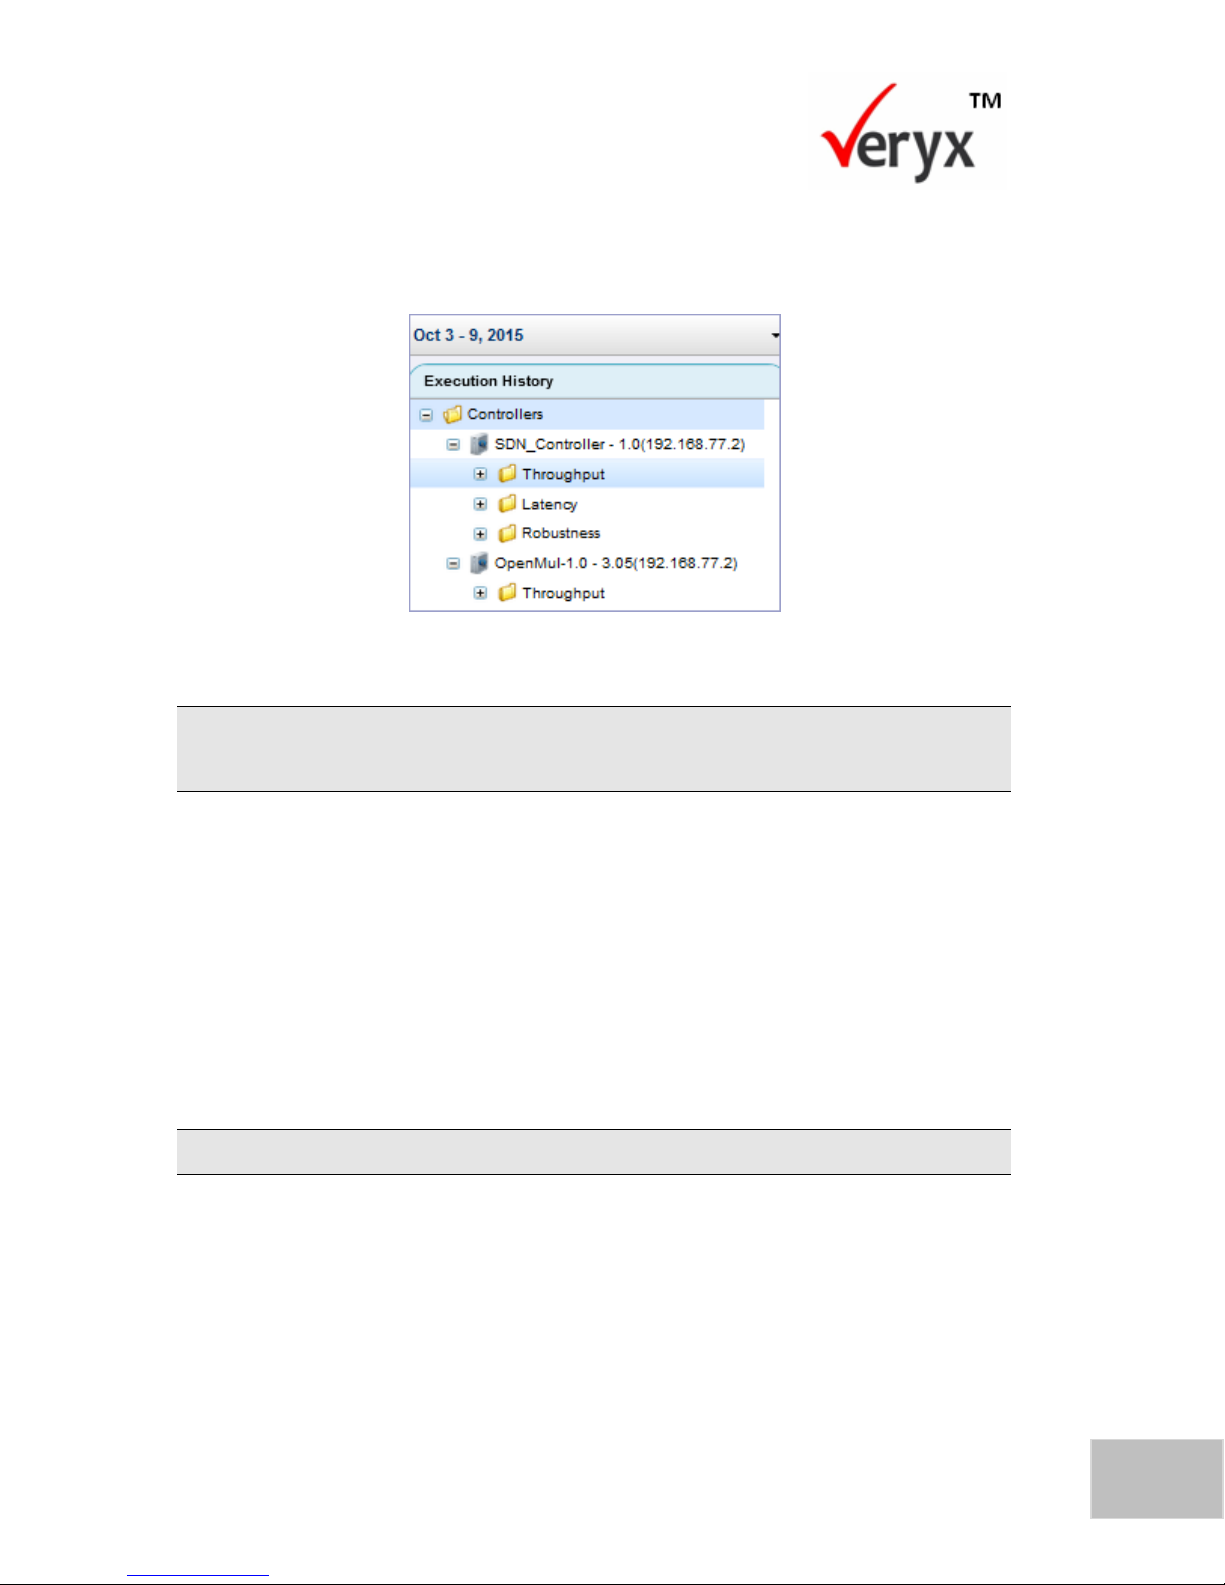
89
Copyright © Veryx Technologies Pvt. Ltd.
Viewing and Generating Reports
1. In the Execution History pane of the Report screen click to expand the tree
under Throughput, Latency or Robustness. The Execution History-Individual
Test Results screen is displayed.
Figure 73: Execution History-Individual Test Results
If the controller is highlighted in red indicates the test is aborted, black indicates the test is
completed and yellow indicates the test is in progress.
In the Execution History-Individual Test Results screen:
The test executions are grouped under the relevant test type (Throughput,
Latency or Robustness).
The test executions are displayed in order of the date and time when they
were performed.
The configuration information about the tests is displayed.
Failed test executions are displayed in red.
2. Click on the relevant test execution to display the Test Execution Results
(Upper and Lower) screen as shown in Figure 74 and Figure 75.
Page 97
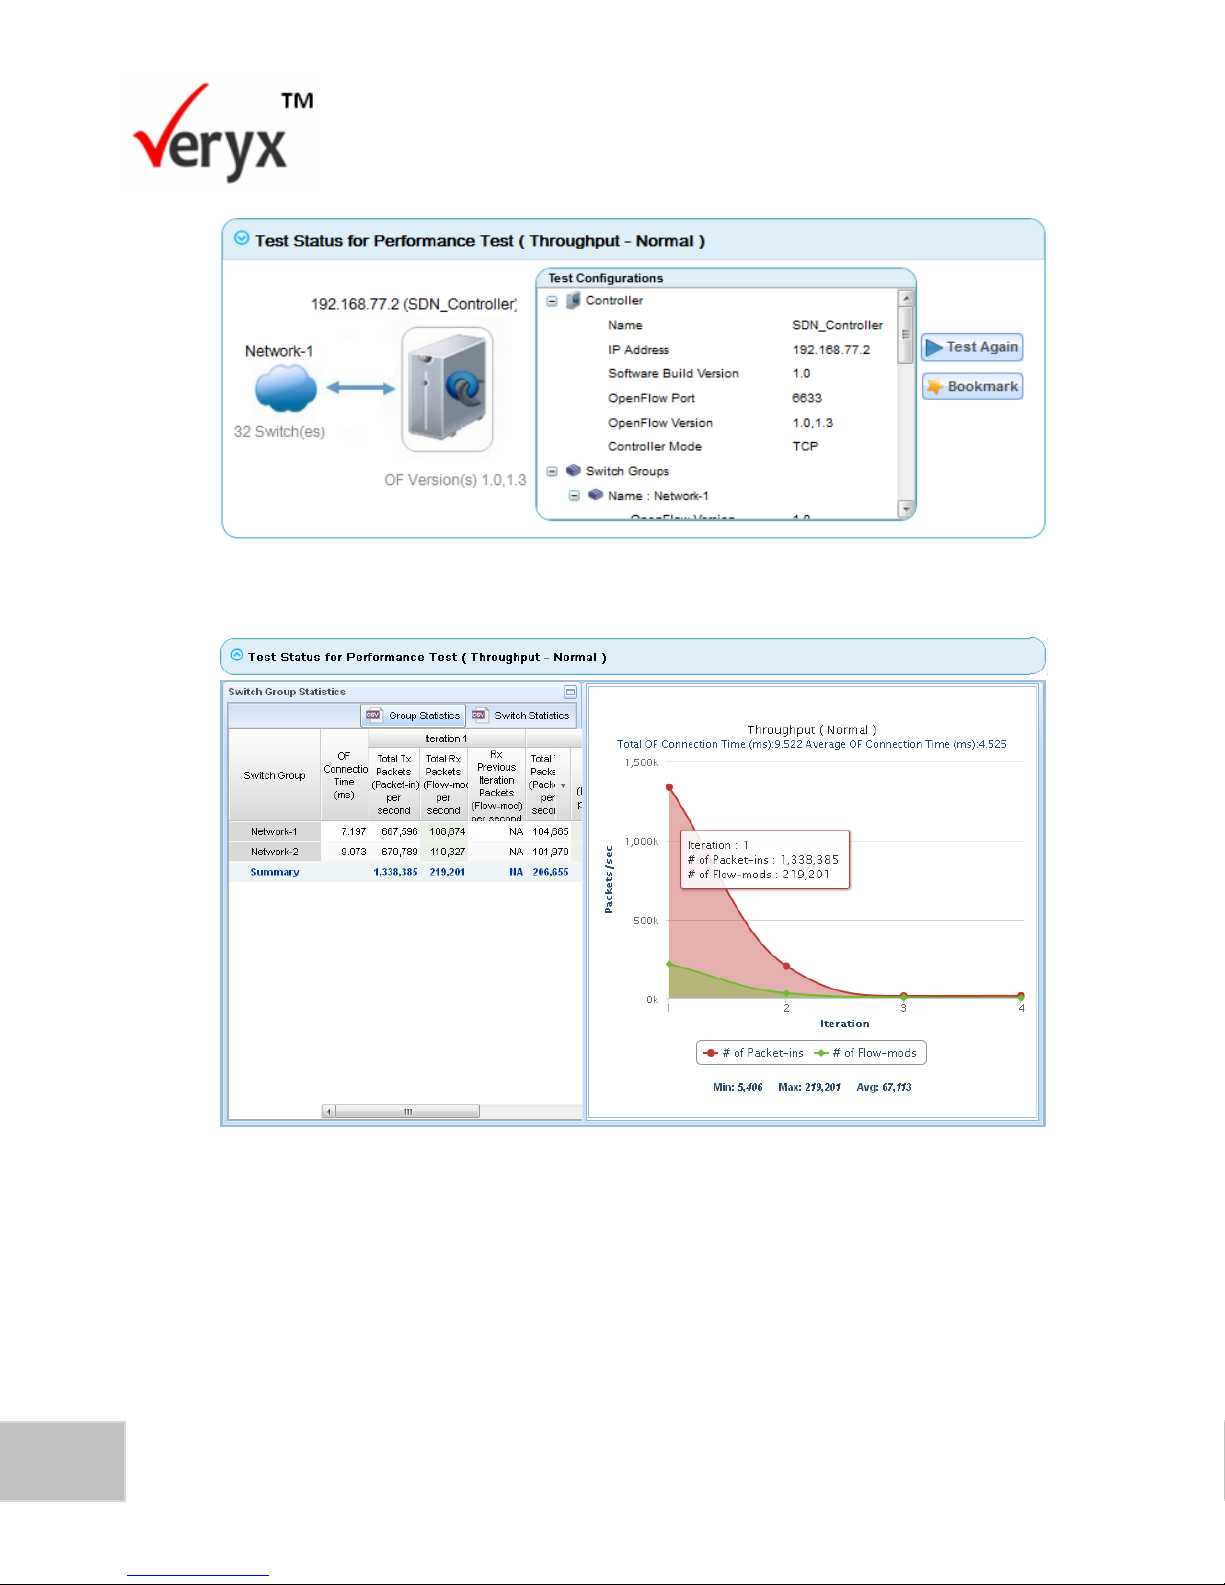
90
PktBlaster SDN Controller Test-Performance Benchmarking User Guide
Copyright © Veryx Technologies Pvt. Ltd.
Figure 74: Test Execution Results (Upper)
Figure 75: Test Execution Results (Lower)
In the Test Execution Results screen, the results are displayed in the form of an
intuitive graph.
Page 98
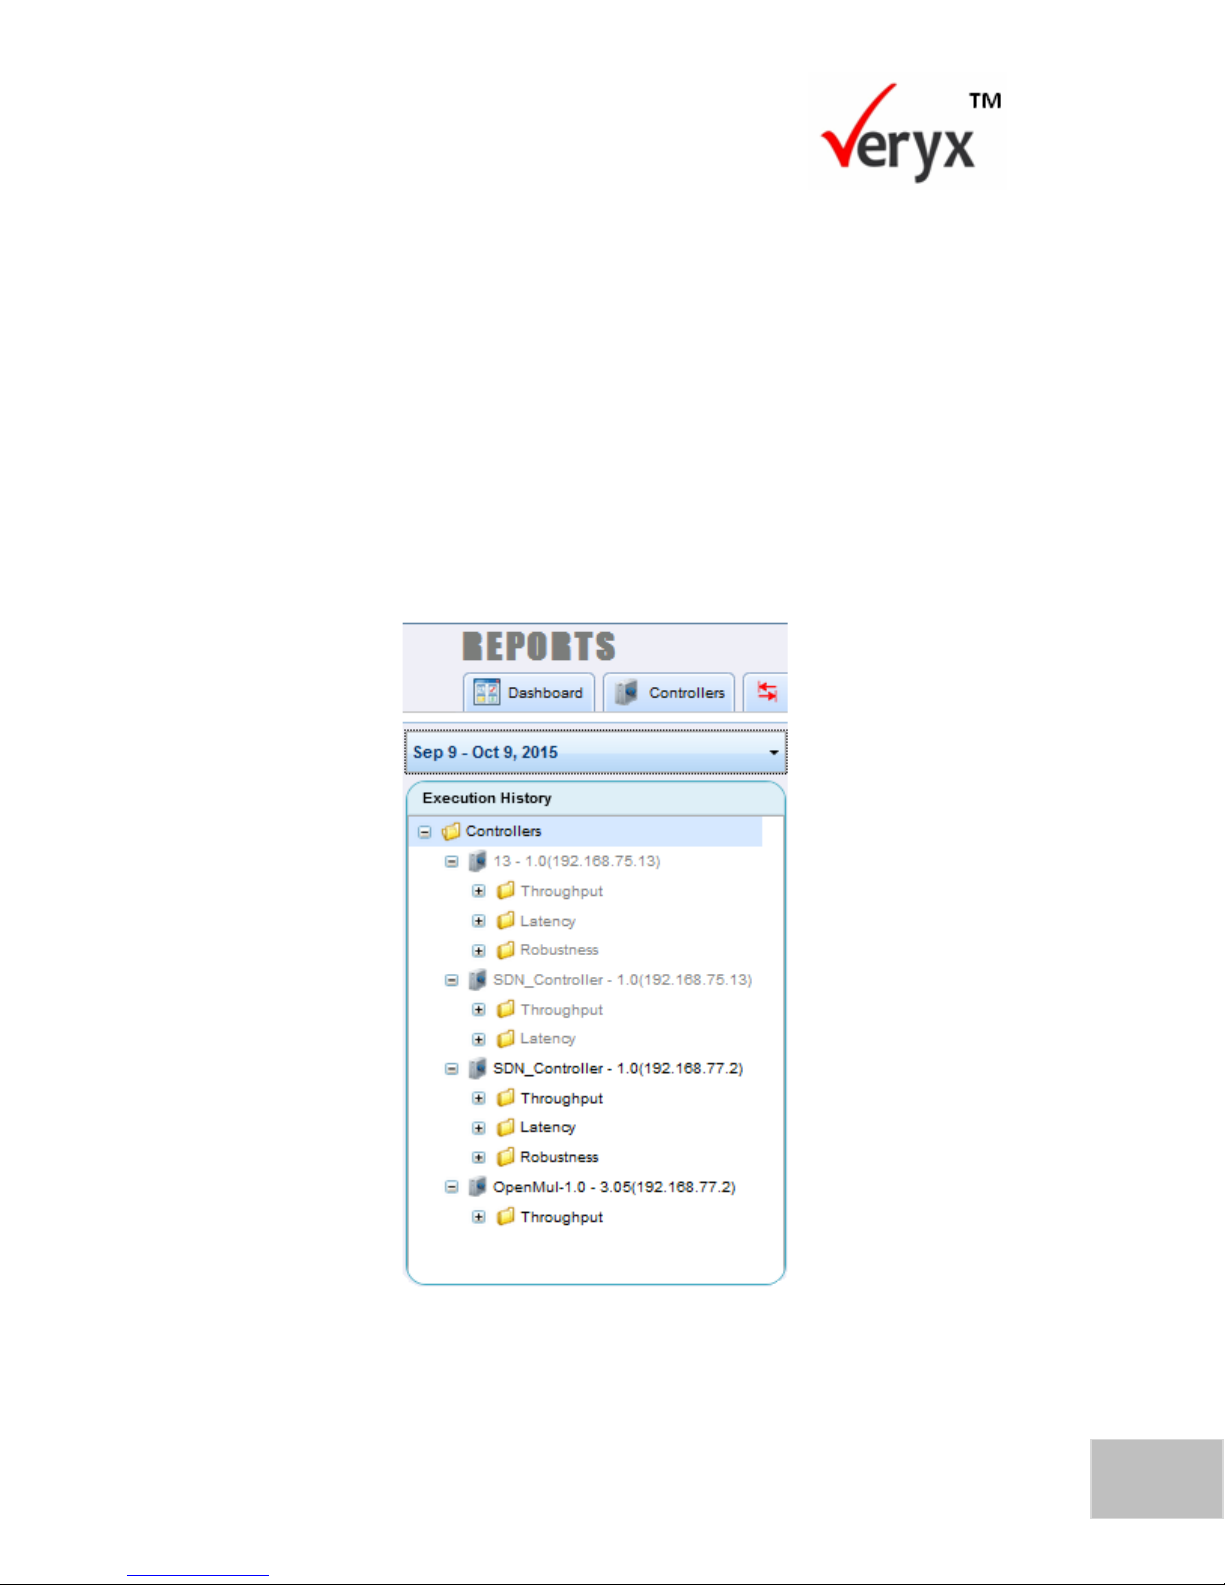
91
Copyright © Veryx Technologies Pvt. Ltd.
Viewing and Generating Reports
Search for a Report
The reports generated by the PktBlaster SDN Controller Test pertain to the test
executions performed in the last one week. However, you can change the period for
which the report is generated by:
Selecting one of the pre-defined time periods
Specifying a date range
To specify a time period or a date range to generate reports:
1. Click the default date range displayed above the Execution History pane as
indicated in the Reports screen.
The Search Options screen is now displayed.
Figure 76: Reports Screen
Page 99
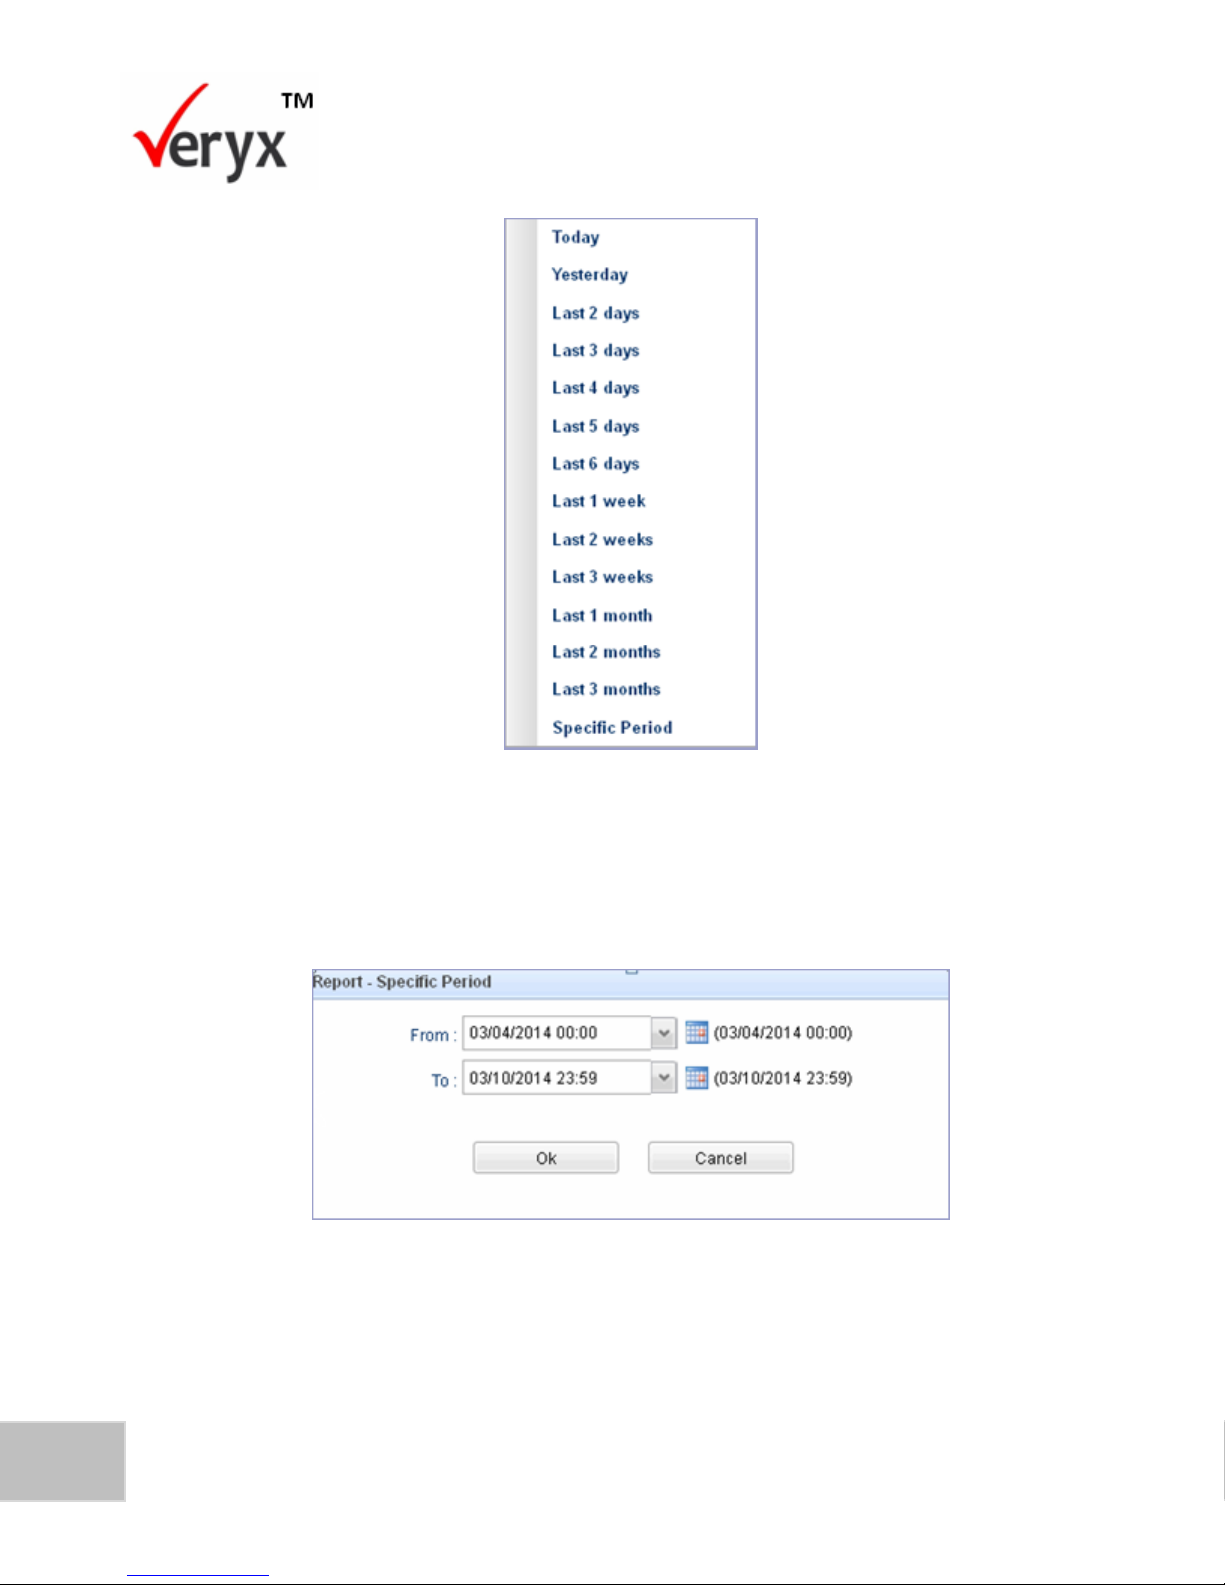
92
PktBlaster SDN Controller Test-Performance Benchmarking User Guide
Copyright © Veryx Technologies Pvt. Ltd.
Figure 77: Search Options
2. You can now select a specific time-period displayed in the list or select
Specific Period to specify a date range as shown in the Report-Specific
Period screen.
Figure 78: Report-Specific Period
The reports are now generated for the time-period that is specified.
Page 100
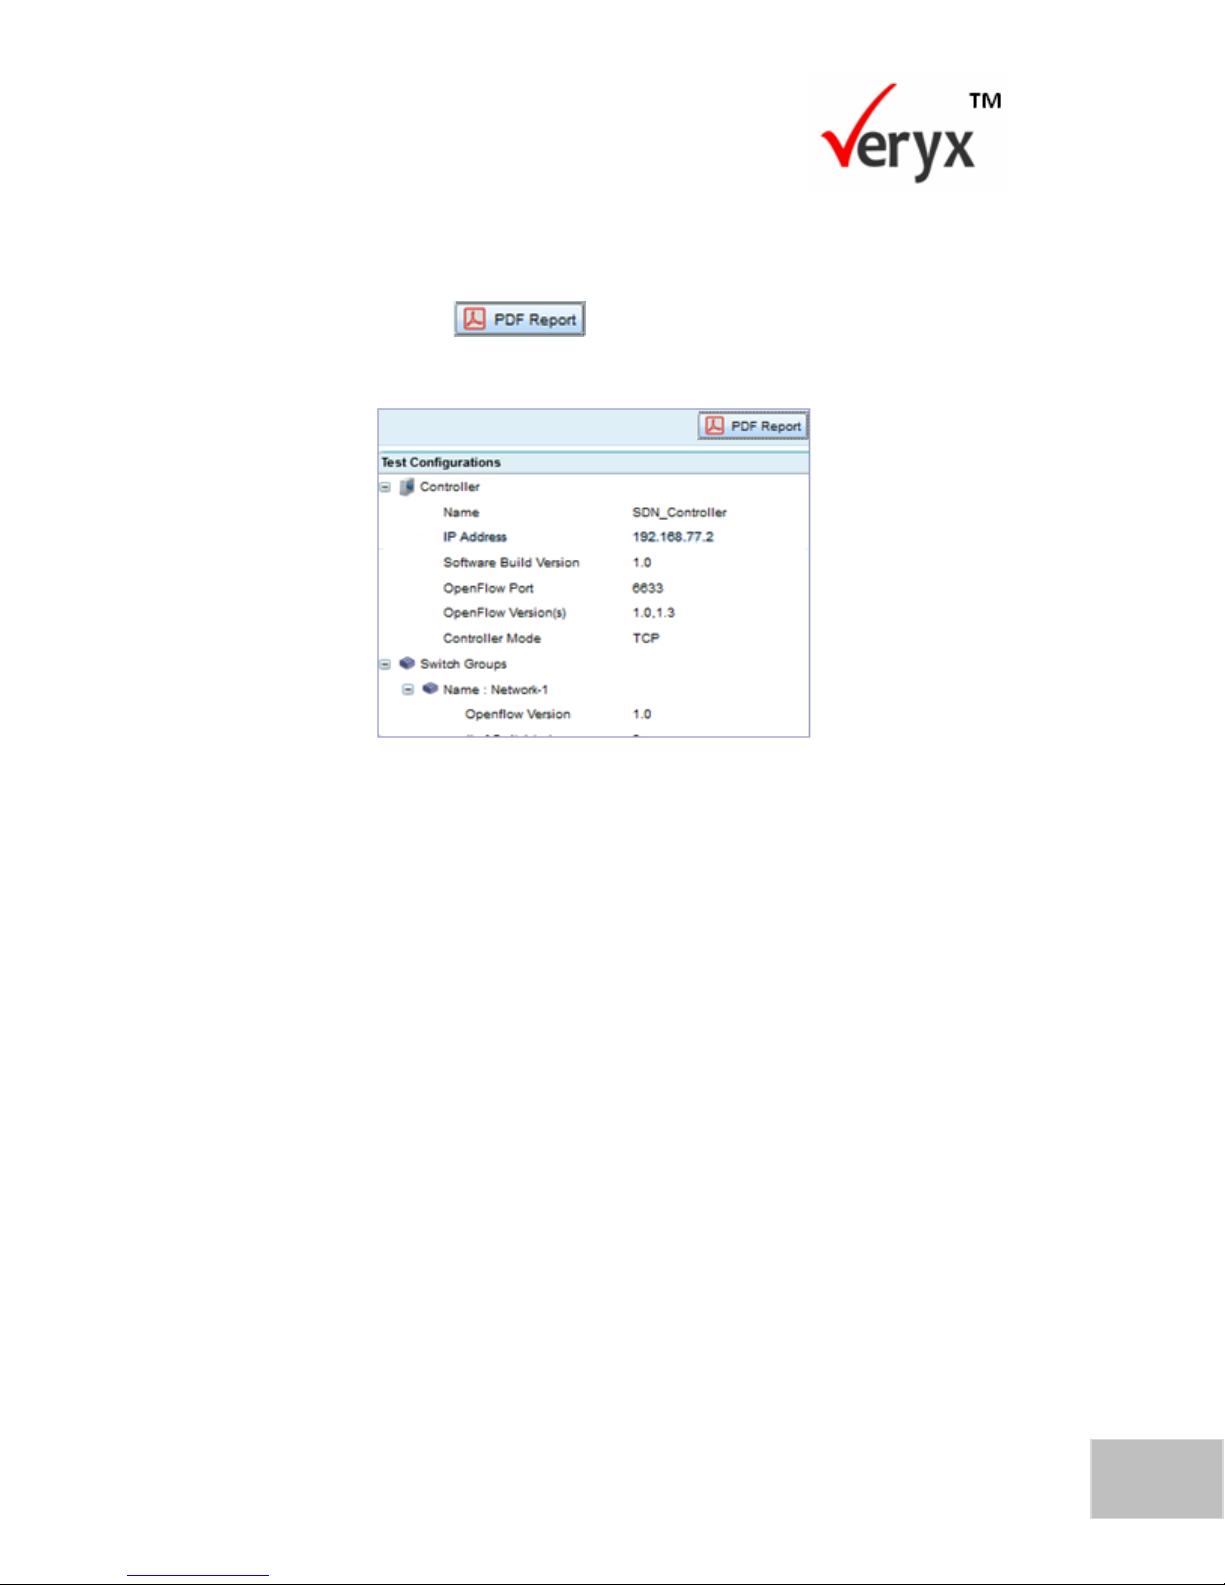
93
Copyright © Veryx Technologies Pvt. Ltd.
Viewing and Generating Reports
Download Report in PDF Format
You can download a report that is displayed in PDF format.
To download a report, click at the top of the relevant report as shown
in the Download Report screen.
Figure 79: Download Report
The report is now downloaded to your system. The PDF Report Figure 80 displays
details of Controller Information, Test Configuration and participating Switch Group
Network(s) along with Performance Chart.
 Loading...