

Page 1

Vernier Flash
Photolysis
Spectrometer
(order code: VSP-FP)
Educational Flash Photolysis Spectrometer
Reference Manual
(version: 12/14/2015)
© Ultrafast Systems LLC/Vernier Software & Technology
Page 2

Table of Contents
1
General Information ............................................................................................................................... 4
1.1 Introduction ...................................................................................................................................... 4
1.2 Specifications .................................................................................................................................. 4
1.2.1 Spectrometer Specifications .................................................................................................... 4
1.2.2 Equipment Specifications ......................................................................................................... 6
1.2.3 Detector Specifications ............................................................................................................ 7
2 Safety Information .................................................................................................................................. 8
3 Layout and Basic Principles of Operation ......................................................................................... 10
4 Hardware Description .......................................................................................................................... 12
4.1 Turning the Spectrometer On and Off ........................................................................................... 12
4.2 Optical Filters ................................................................................................................................. 12
4.3 Software Description ..................................................................................................................... 13
4.3.1 Graph Controls ....................................................................................................................... 14
5 The Basic Principles of Chemical Kinetics ....................................................................................... 15
5.1 Stoichiometry ................................................................................................................................. 15
5.2 Reaction Rate ................................................................................................................................ 15
5.3 The Rate Expression and the Rate Constant ................................................................................ 16
5.4 Order of Reaction .......................................................................................................................... 17
5.5 The Experimental Approach .......................................................................................................... 18
5.6 The Relationships Between Rate Constant, Half Life, and Life Time ........................................... 18
5.7 Pseudo Order ................................................................................................................................ 20
6 Data Treatment ..................................................................................................................................... 21
6.1 Data Acquisition............................................................................................................................. 21
6.2 Kinetic Analysis ............................................................................................................................. 23
6.3 The Basics of Photochemistry ....................................................................................................... 25
7 Flash Photolysis Experiments ............................................................................................................ 26
7.1 Base Catalysis of the cis-trans Isomerization of Congo Red ........................................................ 26
7.2
Isomerization of Mercury Dithizonate ............................................................................................ 31
7.3 Determination of the Activation Energy of the Thermal Back Reaction of One Spiropyran in
Toluene .......................................................................................................................................... 34
8
Appendix ............................................................................................................................................... 38
8.1 Spectra of Flash Lamp and White Light LED ................................................................................ 38
8.2 Spectra of Optical Filters ............................................................................................................... 40
© Ultrafast Systems LLC/Vernier Software & Technology
Page 3

List of Figures
Figure 1: Examples of Vernier Flash Photolysis Spectrometer data ........................................................... 5
Figure 2: Detector responsivity vs. wavelength ........................................................................................... 7
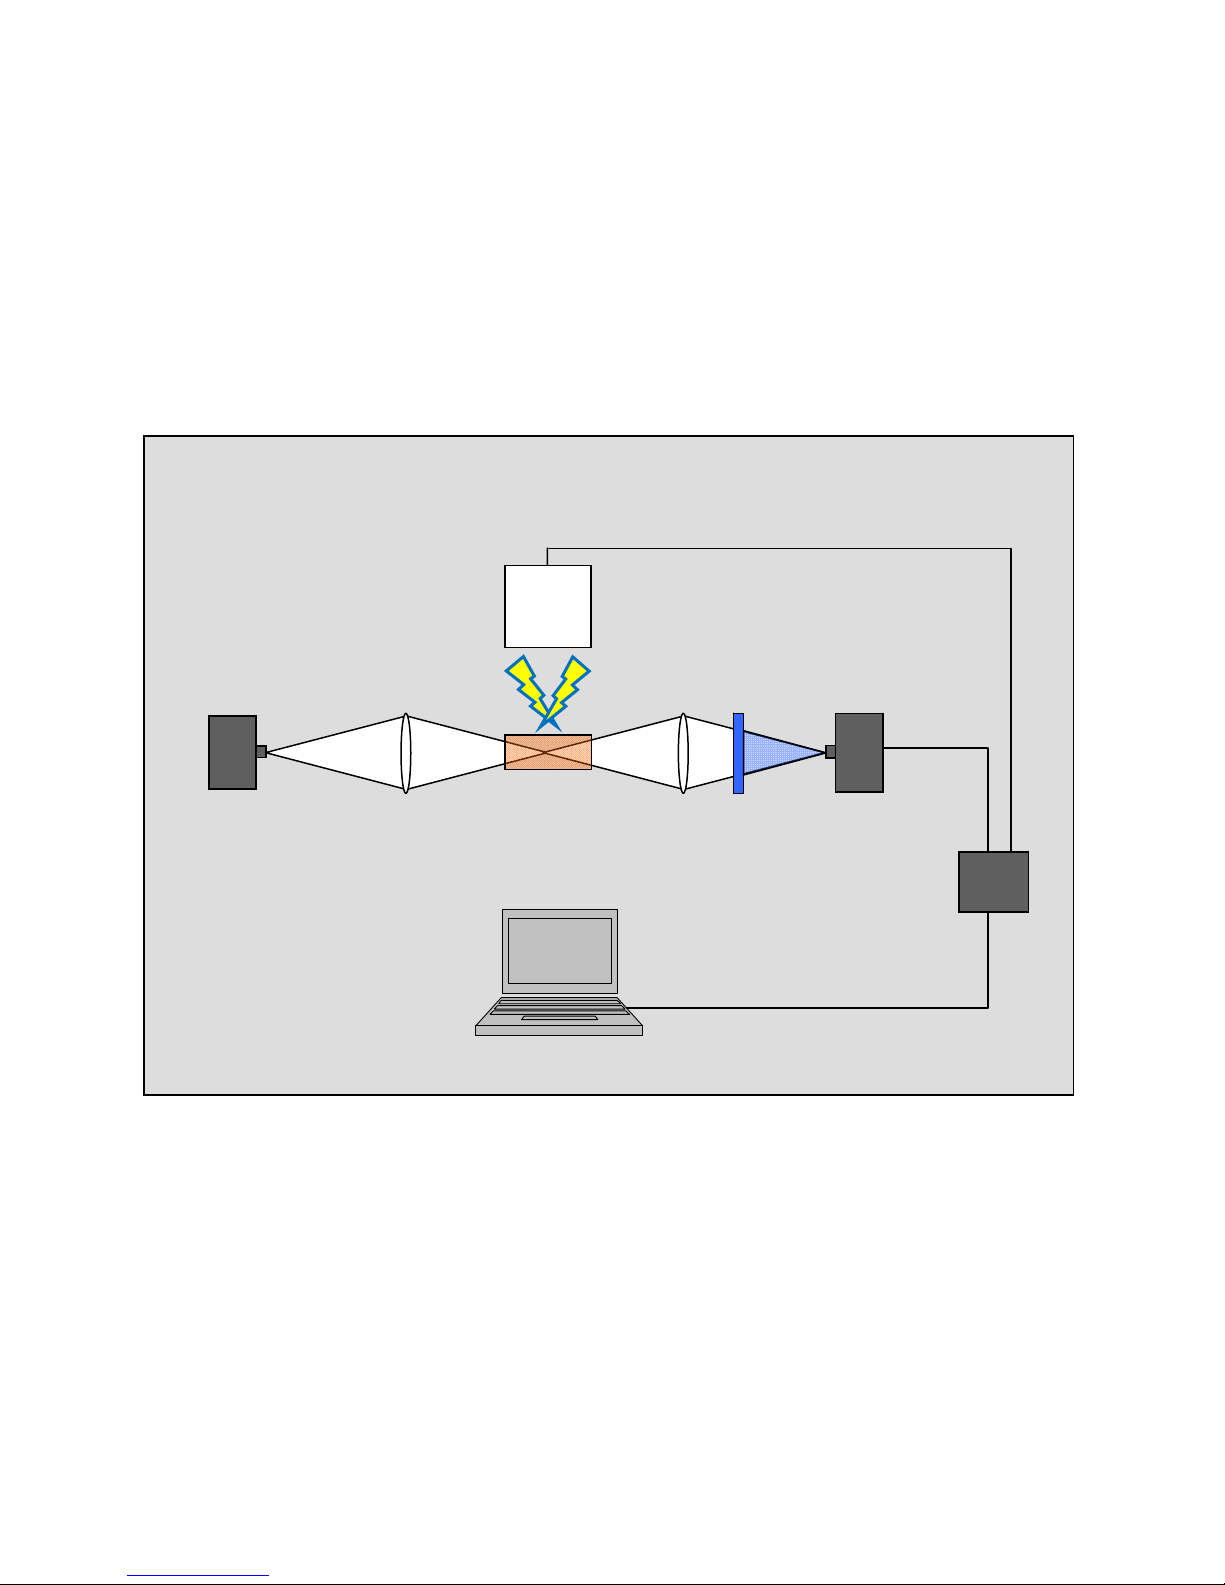
Figure 3: Schematic of the Vernier Flash Photolysis Spectrometer .......................................................... 10
Figure 4: Screenshot of Vernier Flash Photolysis Spectrometer Software ................................................ 13
Figure 5: Concentration time profiles of reactant and product ................................................................... 18
Figure 6: Example of a voltage-time waveform after importing into Logger Pro ........................................ 21
Figure 7: Time and voltage (raw data) and absorbance (calculated) ........................................................ 22
Figure 8: Example of a temporal profile of the scattered excitation light. .................................................. 23
Figure 9: Absorption (left) and emission (right) kinetic profilesincluding the scattered excitation light
picked up by the detector ............................................................................................................ 24
Figure 10: Decay portion of the A-time profile ......................................................................................... 24
Figure 11: Congo red, MW=696.67 ............................................................................................................ 26
Figure 12: Ground state absorption spectrum of Congo red (trans conf.) in 20% water in ethanol .......... 27
Figure 13: Kinetic profile of Congo red in 20% water in ethanol ................................................................ 29
Figure 14: Absorption kinetic profile of Congo red in 20% water in ethanol with 2 mM OH- ions .............. 30
Figure 15: Photoinduced isomerization of mercury dithizonate ................................................................. 31
Figure 16: Ground state absorption spectrum of mercury dithizonate (trans conf.) in ethanol .................. 32
Figure 17: Trifluoroacetic acid (TFA); MW = 114.03 .................................................................................. 33
Figure 18: Kinetic profile of mercury dithizonate in ethanol ....................................................................... 33
Figure 19: Structure and photochromic reaction of 6-NO
Figure 20: Ground state absorption spectrum of one spiropyran in toluene .............................................. 36
Figure 21: Transient absorption at 600 nm of one spiropyran in toluene .................................................. 36
Figure 22: Example decay and exponential fit for 55°C measurement ..................................................... 37
Figure 23: Actual data example of ln() as a function of 1000/T ................................................................ 37
Figure 24: Emission spectrum of xenon flash lamp ................................................................................... 38
Figure 25: Emission spectrum of white light LED ...................................................................................... 39
Figure 26: Transmission spectrum of 600 nm bandpass filter ................................................................... 40
-BIPS ............................................................... 34
2
© Ultrafast Systems LLC/Vernier Software & Technology
Page 4

1 General Information
1.1 Introduction
The Vernier Flash Photolysis Spectrometer is designed to be a simple, user-friendly device for
demonstrating to chemistry students the fundamental principles of chemical kinetics. Every process that
we label as “chemical” occurs as the result of chemical bonds being broken or formed, i.e., nuclei change
their spatial positions with respect to each other. Chemical kinetics is one of the major divisions of
physical chemistry and is basically the quantitative study of the rates and mechanisms of chemical
reactions. Chemical change can be induced in a variety of ways—the one employed in the Vernier Flash
Photolysis Spectrometer is by absorption of light. Thus the instrument serves also as a way of introducing
the student to the concepts and practice of photochemistry.
1.2 Specifications
1.2.1 Spectrometer Specifications
Spectral Coverage
450–750 nm
Spectral Resolution
Determined by an interference filter used. Typically ~10 nm
Temporal Resolution
~100 µs
Time Window
15 ms
© Ultrafast Systems LLC/Vernier Software & Technology
4
Page 5
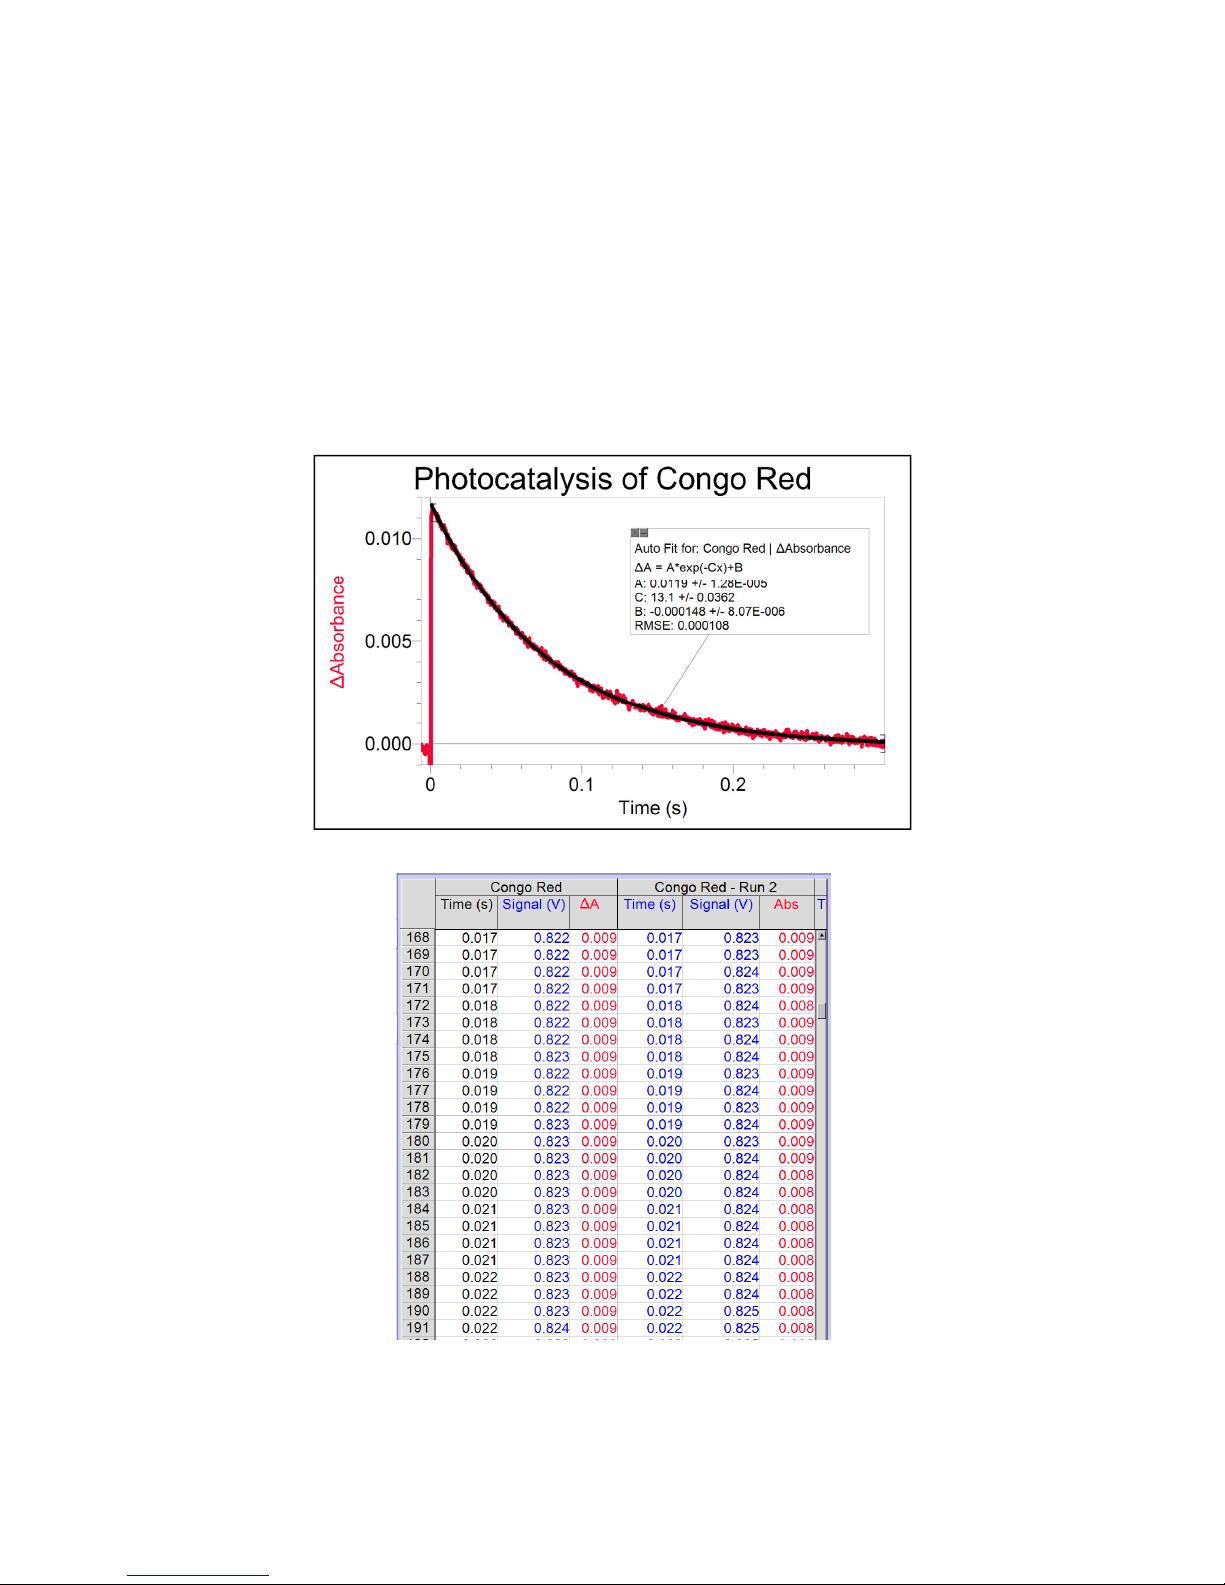
Software
The Vernier Flash Photolysis Spectrometer comes with data-acquisition software necessary to
collect the signal waveform from the photodetector. Subsequent data processing, such as conversion of
the acquired voltage waveform into temporal profile of A and fitting the A profile to an appropriate
function in order to extract the rate constants, can be done by exporting the data into Vernier Logger Pro
®
software or Microsoft
Excel®.
Data Format
The Vernier Flash Photolysis Spectrometer produces A vs. time data in a form of an ASCII CSV
file that can be easily processed with Logger Pro.
Figure 1: Examples of Vernier Flash Photolysis Spectrometer data processed in Logger Pro
© Ultrafast Systems LLC /Vernier Software & Technology
5
Page 6

1.2.2 Equipment Specifications
Weight: 10 lbs
Footprint: 8" x 8" (20.3 cm x 20.3 cm)
UL94 rating: V–0
Meets UL796 requirements
Voltage range: 100–120 V & 210–240 V
Frequency range: 50 Hz & 60 Hz
Power rating: 50 W maximum
DC battery: A23 12 V
USB cable: 28 AWG shielded
AC power cable: 18 AWG 300 V
© Ultrafast Systems LLC /Vernier Software & Technology
6
Page 7
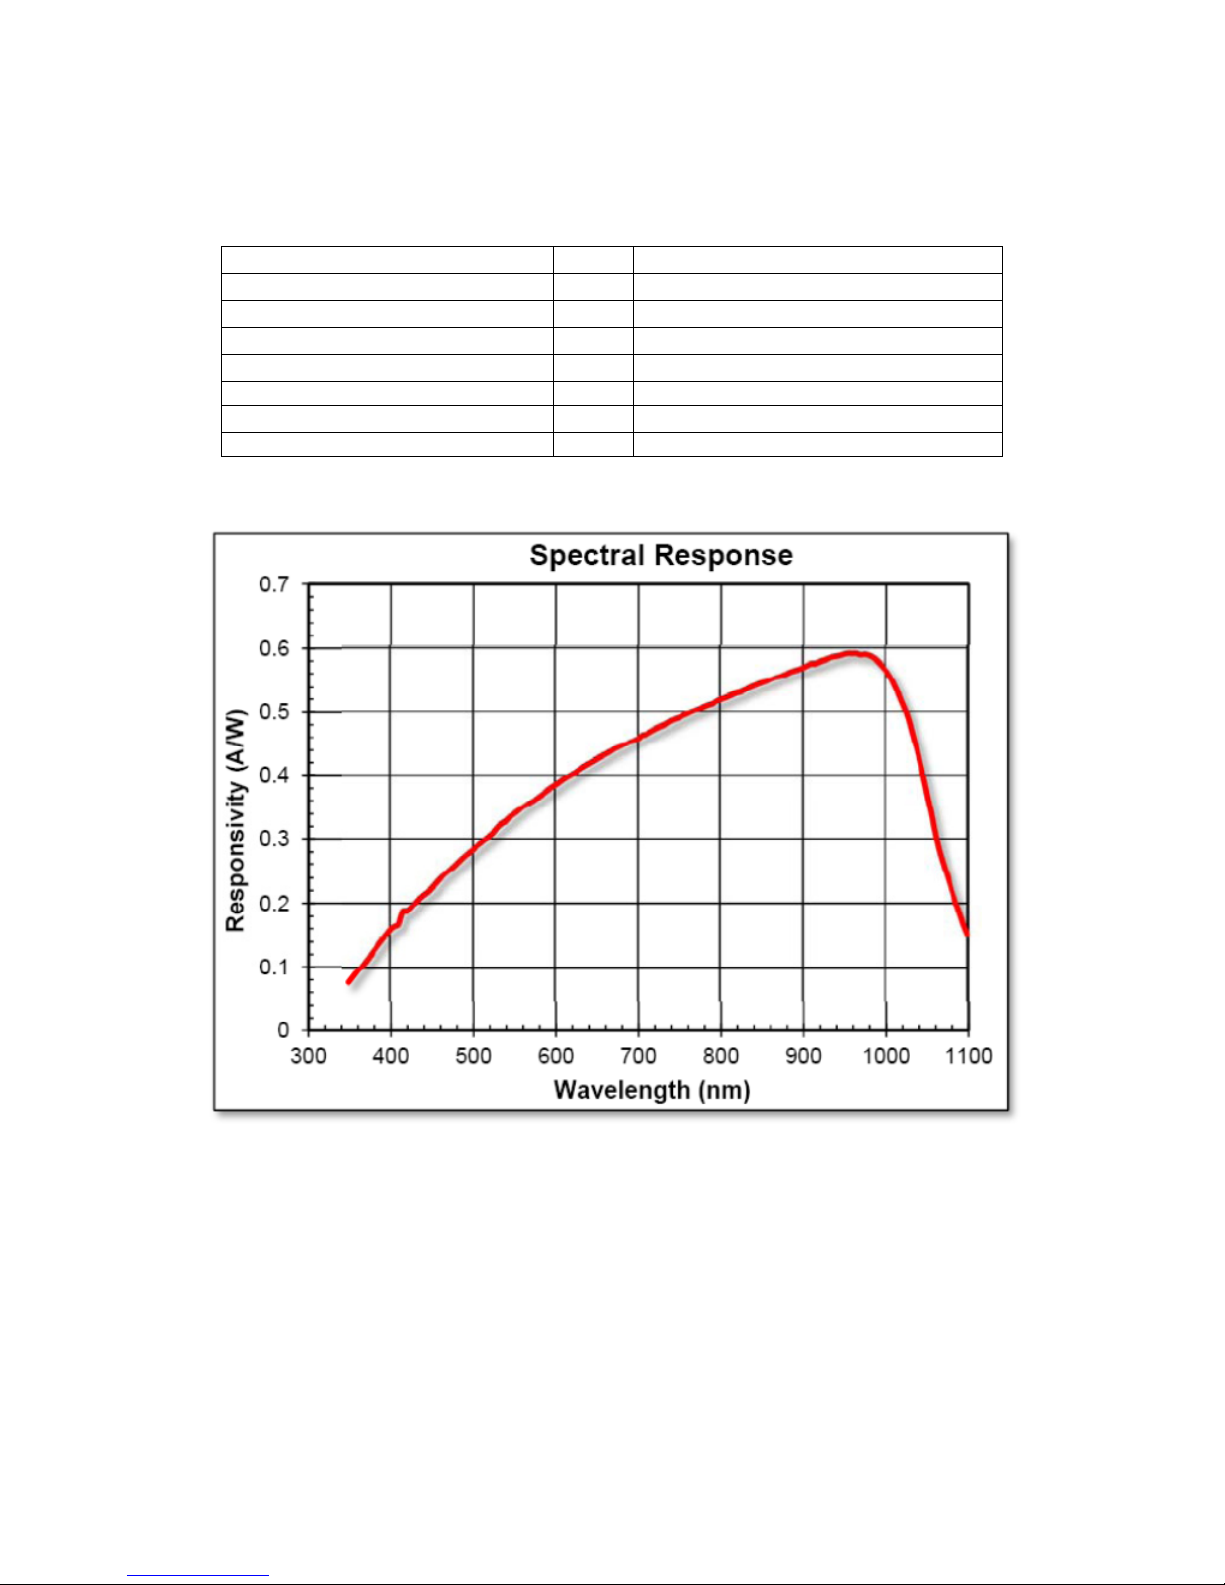
1.2.3 Detector Specifications
All measurements were performed with a 50 load unless stated otherwise.
Detector Silicon PIN
Active area 3.6 x 3.6 mm (13 mm2)
Wavelength range 350 to 1100 nm
Peak wavelength p 970 nm
Rise time tr 14 ns
Bias voltage VR 10 V
Dark current (with 1 M load) ID 0.35 nA
Output voltage VOUT 0 to 10 V
Figure 2: Detector responsivity vs. wavelength
© Ultrafast Systems LLC /Vernier Software & Technology
7
Page 8

2 Safety Information
The Vernier Flash Photolysis Spectrometer is designed and manufactured for kinetic analysis of a
chemical specimen by means of transient absorption spectrometry. It is not sold, nor intended for, nor
should ever be used for any other purpose. The product should be used solely in accordance with the
instructions provided.
Use a compliant surge protector when exposing equipment to voltage. Failure to do so may result
in damaging the unit.
Do not use this equipment in or near water.
Use extreme caution in handling the cuvette when it is filled with liquid. Never fill or refill the
cuvette when it is in the sample holder. Failure to use a cuvette with a dry outer surface or a
cuvette that is leaking liquid can result in the flash housing to malfunction or short.
This system is designed to work optimally at room temperature or an approximation of room
temperature.
Do not disassemble the spectrometer case. Doing so may result in damaging the excitation light
source and electric shock.
If the spectrometer does not appear to be functioning properly, do not attempt to repair it yourself.
Please contact Vernier Technical Support for assistance.
Every effort has been made to ensure that the information in this manual is accurate. All
information in this document is subject to change without notice. Ultrafast Systems makes no
representation or warranty, either expressed or implied, with respect to this document. In no event will
Ultrafast Systems be liable for any direct, indirect, special, incidental, or consequential damages resulting
from any defects in this documentation.
If this equipment is used in a manner not specified in this manual, the protection provided by this
equipment may be impaired.
The following are definitions of the Warnings, Cautions, and Notes that are used throughout this
manual to call your attention to important information regarding your safety, the safety and preservation of
your equipment, or an important tip.
© Ultrafast Systems LLC /Vernier Software & Technology
8
Page 9

WARNING
Situation has the potential to cause bodily harm or
death.
CAUTION
NOTE
Additional information the user or operator should consider.
Situation has the potential to cause damage to
property or equipment.
© Ultrafast Systems LLC /Vernier Software & Technology
9
Page 10
3 Layout and Basic Principles of
Operation
Xe flash lamp
Detector
LED
L1 L2
F
photodiode
Sample
Digitizer
Figure 3: Schematic of the Vernier Flash Photolysis Spectrometer
© Ultrafast Systems LLC /Vernier Software & Technology
10
Page 11

A white light LED is utilized for probing the spectral changes taking place after the sample has
been exposed to an excitation flash. The white light is sent through a sample cuvette via lens L1 and
subsequently delivered to the photodetector diode by passing through an optical interference filter and
objective lens L2. The optical interference filter is used to select the desired wavelength out of the broad
emission spectrum of the LED. While the continuous wave (CW) output from the LED is being monitored
by the photodiode, the photoexcitation flash is sent through the sample. The photo-induced transient
species cause the absorption of the sample to deviate from what it was before the excitation flash. This
results in changes in the intensity of the LED light passing through the sample. These changes are
detected by the monitoring photodiode. The output voltage waveform from the photodiode is collected
and digitized by an internal DAQ device and transferred to the computer for further manipulation.
© Ultrafast Systems LLC /Vernier Software & Technology
11
Page 12

4 Hardware Description
4.1 Turning the Spectrometer On and Off
Connect the power cord to the AC input located at the rear of the Vernier Flash Photolysis
Spectrometer.
Connect the Vernier Flash Photolysis Spectrometer to the computer via a USB cable.
Wait until Windows
Start the Vernier Flash Photolysis Spectrometer Software.
NOTE
The 12 V battery that powers the photodiode can be accessed by removing the battery compartment
lid on the side of the housing.
®
recognizes the new USB device.
4.2 Optical Filters
A 600 nm interference filter is included with the Vernier Flash Photolysis Spectrometer. Insert the
filter into the filter housing that is also included. These filters select the wavelength monitored by the
photodiode. Additional filters can be purchased from any filter company. The size that fits the housing is
12.5 mm (OD), 9.0 mm (ID).
© Ultrafast Systems LLC /Vernier Software & Technology
12
Page 13

4.3 Software Description
The user interface of the Vernier Flash Photolysis Spectrometer Software is rather intuitive
(Figure 4). The I
value (PD level, V) at the top-right of the screen reflects the amount of probe light
0
reaching the detector photodiode. Please keep in mind that at 2500 mV the detector will saturate, and
your signal will be distorted. A typical I
values are lower than 500 mV or higher than 2000 mV, please contact Vernier Technical Support. For
I
0
emission measurements, the LED light turns off and the I
should not be larger than 2 V for absorption measurements. If the
0
value should drop close to zero (<10 mV).
0
During data acquisition, the Vernier Flash Photolysis Spectrometer will wait for approximately
2 seconds between flashes to allow enough time for the flash capacitors to recharge. By default, the
software will adjust the axis scales automatically: the y-axis range will adjust to display the signal only,
cutting off the large scattered flash pulse around time = 0. The default x-axis setting is “Auto Scale.” To
change this, right-click anywhere on the plot and choose the desired option. Alternatively, you can use the
graph controls on the top of the screen (Figure 4).
The data are saved in CSV (comma delimited values) ASCII format. The first column is time in
milliseconds and the second column is light intensity in millivolts.
Figure 4: Screenshot of Vernier Flash Photolysis Spectrometer Software
© Ultrafast Systems LLC /Vernier Software & Technology
13
Page 14

4.3.1 Graph Controls
Graph controls on the top of the screen allow you to zoom in the graph after measurements have
been completed. By default, the cursor mode on the graph is y-axis zoom, with the following graph
controls:
/ Axis Auto Scale mode OFF and ON.
Autoscale axis once
Pan graph
Select between graph zoom modes:
Select X and Y region to zoom in.
Select X region to zoom in, keep Y limits unchanged.
Default, select Y region to zoom in, keep X limits unchanged.
Autoscale both x- and y-axes once to fit graph.
Zoom in; Zoom out.
© Ultrafast Systems LLC /Vernier Software & Technology
14
Page 15

5 The Basic Principles of
H
A
Chemical Kinetics
Most chemical reactions that occur, either in nature or in the laboratory, are complex. That is,
they occur via a series of simple, or elementary, processes, which can proceed at different rates. An
elementary process is a single-step reaction in which there are no chemically-identifiable intermediates.
For a given complex reaction, its rate will be determined by the rate of the slowest of the participating
elementary reactions. The major advantage of using photons to initiate reactions is that in this way it is
relatively straightforward to initiate elementary processes and it is these that are best used to understand
the fundamental principles of chemical kinetics.
Now some necessary definitions:
5.1 Stoichiometry
Every chemical change can be represented by a stoichiometric, or balanced, equation in symbolic
form. For example, the acid-base reaction between sulfuric acid and a metal hydroxide is represented by
22
This equation tells us nothing about the mechanism of the process; it simply expresses the
overall chemical equivalency.
SO NaOH Na SO H O
24 24 2
5.2 Reaction Rate
The rate of a chemical reaction is expressed as the variation with time of the concentration of
either reactants or products. In solution phase reactions, as studied here, the units of reaction rate are
-1
concentration units per second, i.e., mole per liter per second, Ms
In the (elementary) reaction
BC
The rate (change in concentration as a function of time) is expressed in the form of a derivative
Equation 1
.
Rate =
© Ultrafast Systems LLC /Vernier Software & Technology
[] [] []dA dB dC
dt dt dt
-1
Ms
Equation 2
15
Page 16

A
A
A
For the rate to be a positive quantity the derivatives of [A] and [B] with time are negative because
the concentrations of these reactants decrease as time proceeds.
In the case of the symbolic elementary reaction
2
which could represent a dimerization process, the rate is given by
Rate =
since A is removed twice as quickly as the product is formed.
C
Equation 3
1[] []
dA dC
2
dt dt
Equation 4
5.3 The Rate Expression and the Rate Constant
Empirical observations of the rates of chemical processes led to the Law of Mass Action which
states that
The rate of a chemical reaction is directly proportional to the active masses of the reacting
species.
For reactions taking place in dilute homogeneous solution, the term “active masses” can be
-1
replaced by molar concentrations (mole L
For the elementary reaction
, or M).
B products Equation 5
the mathematical formulation of the Mass Action Law is
[]
dA
[][]
-1
B
Ms
Equation 6
dt
and replacing the proportionality sign with a constant of proportionality, k, we find
[]
dA
[][]
kA B
-1
Ms
Equation 7
dt
Equation 7 is known as the rate expression, or rate equation, and the proportionality constant is
referred to as the rate constant. This equation tells us that since the concentrations of the reactants
decrease during the course of the reaction, then the rate (but not the rate constant) decreases with time
© Ultrafast Systems LLC /Vernier Software & Technology
16
Page 17

elapsed. Thus the rate constant provides the experimenter with a useful measure of the velocity of a
A
reaction, and it is this quantity that we usually seek in a study of chemical kinetics.
5.4 Order of Reaction
In Equation 7, the concentrations of A and B both appear to the first power, and we say that this
reaction is first order in [A] and first order in [B], and that it is second order overall. However the rate
expression for the elementary process 3 will be
[]
dA
[][] []
kA A kA
dt
For this reaction it is seen that the concentration of A appears as the 2
the reaction is second order in [A] and second order overall.
Also, the symbolic elementary process
2
Ms-1 Equation 8
nd
power, and we say that
products
would be expected to have a rate expression such as
[]
dA
[]
kA
-1
Ms
Equation 9
dt
and the reaction would be said to be first order in [A] (and first order overall). Orders higher than 2 and
also fractional and zero orders are found in special cases. These are not considered here because of lack
of relevance to the Vernier Flash Photolysis Spectrometer concept.
SPECIAL NOTE: It is important to realize that assignment of order by inspection is only valid for
elementary reactions; we cannot do this for stoichiometric equations.
© Ultrafast Systems LLC /Vernier Software & Technology
17
Page 18

5.5 The Experimental Approach
The data that are obtained in a kinetics experiment could look something like those presented in
Figure 5, which shows the change in concentration of reactant A (open circles) and product B (filled
circles) as a function of time; M is the generic species (A or B).
Figure 5: Concentration time profiles of reactant and product
On the plot you can see a pair of horizontal lines, one blue (at 0.5) and one red (at 0.37). The
blue one is drawn at the point of 50% reaction (half of the initial concentration of A has been converted
into B). By inspection this occurs after an elapsed time of about 28 milliseconds. This represents the half
life, or half time, of the reaction. The red line is drawn when about 37% of the initial concentration of A
has been converted to B; this represents the reaction life time.
5.6 The Relationships Between Rate Constant, Half Life,
and Life Time
First, we shall consider a first order reaction symbolized by
Aproducts
The rate of this reaction is as written in Equation 9 as
© Ultrafast Systems LLC /Vernier Software & Technology
[]
dA
[]
kA
dt
Ms
-1
18
Page 19

given as
A
A
A
A
A
Setting [A]0 as the initial concentration of A, the integrated form of this differential rate equation is
[] []exp( )
Akt
0
which shows us that the concentration of A decreases as an exponential function of time. The shape of
the decrease of [A] curve in the above Figure 5 is exponential in time. Since the argument of the
exponential term must be dimensionless, it is clear that the units of k, the first order rate constant, are
-1
, and conventionally, time is measured in seconds, or sub-multiples of seconds such as ms, µs, or
time
ns.
At the half-life point,
[] 0.5[]AA
whence
The lifetime of a reaction, usually written as
Thus Equation 10 can be written as
and at t = ,
or, at the life-time point, the concentration of A has fallen to 36.8% (about 37%) of its initial value.
Note that in processes that are first order overall, the half life and the life time are independent of
ln 2 / 0.693/tkk
1/2
[] []exp( /)
At
0
Equation 10
exp( ) 1/ 2kt
50% 0
and a measurement of t
[ ] [ ] exp( 1) 0.368[ ]
and
, is defined as the inverse of the rate constant, 1/k
Equation 11
AA
00
1/ 2
leads to the rate constant.
1/2
,
.
time and initial concentration.
So far we have considered only the reaction that can be written
products
This implies that we are considering the spontaneous conversion of some compound into another,
chemically distinct, species. Such a process could be the spontaneous decay of an electronically excited
state of a molecule that has been generated by the absorption of photons (see Section 6.3). In this case
the product(s) could be the original ground state of the molecule, or an isomer thereof (cis-trans
photoisomerization). Such reactions are termed unimolecular because there is only one molecule
involved. Such reactions will show first order kinetics overall.
Now let us consider the elementary process
B products
Clearly this is now bimolecular because it requires a molecule of A and a molecule of B to react
together. At first sight, we would expect this process to show second order kinetics overall, but, as we
shall see, the order actually observed in an experiment will be determined by the reaction conditions.
© Ultrafast Systems LLC /Vernier Software & Technology
19
Page 20

Under conditions where the initial concentrations of A and B are equal, the rate equation is as in
A
A
A
Equation 7, viz
[]
dA
[][]
kA B
dt
Integrating this and setting [A] = [B] leads to
11
[] []AAkt
This is also the result for the case of the reaction
At the half-time point [A] = 0.5[A]0 then
Thus we see that the half time depends on the initial concentration, unlike the first order case.
0
2
21 1
[] [] []
AA A
00 0
or 1/ [ ]
tkA
products
1/ 2 0
kt
1/ 2
Equation 12
5.7 Pseudo Order
In the bimolecular elementary process
B products
If the initial concentration of one of the reacting species, say B, is very much higher than that of
the other, A, then changes in concentration of B through reaction become negligible compared to those of
A, which go from 100% to zero during the course of the reaction. Then the rate equation
[]
dA
[][]
kA B
dt
becomes
[]
dA
dt
Upon integration this becomes
[] []exp( ')
This bimolecular process is seen to be first order in A and first order overall. This is referred to as
“pseudo-first order” by some practitioners, but the important thing to realize is that the process behaves in
[][] '[]
kB A k A
0
where k’ = k[B]
Akt
0
0
a first order manner in the experiment. This behavior can be detected by evaluating the first order rate
constant at different initial concentrations of B, when the behavior will be found to depend linearly on [B].
© Ultrafast Systems LLC /Vernier Software & Technology
20
Page 21

6 Data Treatment
6.1 Data Acquisition
The Vernier Flash Photolysis Spectrometer Software will produce a file containing two columns of
numbers in CSV format. One column (#1) is time, the other (#2) is voltage from the detector. On the
computer screen, you will observe the waveform built from these columns. These are your raw data.
Once you have acquired the data files you will need to transfer them to the Logger Pro or Excel for
analysis. For Figure 6, the raw data were imported into Logger Pro. In cases where the voltage has been
generated from an emission experiment (no probe beam), the kinetic analysis can proceed with the raw
data as displayed. In an absorption experiment, further processing is necessary before kinetic analysis
can proceed. In an absorption experiment, the detector monitors the intensity of light transmitted by the
sample as a function of time prior to, during, and after the firing of the photoflash.
Figure 6: Example of a voltage-time waveform after importing into Logger Pro
© Ultrafast Systems LLC /Vernier Software & Technology
21
Page 22

A
Figure 7: Time and voltage (raw data) and absorbance (calculated)
Viewing the trace in Figure 6, you see that at the left side (for about 400 ms before time zero) the
voltage level is stable with an average of 1.335 V. This corresponds to the intensity of the transmitted
beam prior to the firing of the flash lamp. We define this voltage as I
portion of the data plotted in Figure 6. Note that the time goes from negative to positive, as on Figure 6,
and that the first 10 voltage values are ~1.335, our I
voltage dips to 0.024 volts and eventually, as seen clearly on Figure 6, it returns to the initial level. This
tells us that a species that absorbs light at the observation wavelength is generated by the flash, and thus
the resulting solution transmits less of the monitoring beam.
Except under certain conditions, the transmitted intensity is not directly proportional to
concentration of the generated transient. We need to process the raw data to obtain absorbance (A(t)),
which is proportional to concentration through the relationship
I
() log ()
tctl
where Itr is the transmitted voltage at a given time, is the molar decadic extinction coefficient of the
generated transient, and l is the optical path length. Most spreadsheet software allows you to write a
simple transform, with I
to that in column 3 (‘ΔA’). Logger Pro allows you to do this by creating a calculated column. After having
done this, you can generate and display an absorbance vs. time graph.
= 1.335 V in the example shown here, to convert the data in column 2 (‘Signal’)
0
© Ultrafast Systems LLC /Vernier Software & Technology
0
()
It
tr
value as shown in Figure 6. During the flash the
0
Equation 13
. The table in Figure 7 displays a
0
22
Page 23

6.2 Kinetic Analysis
The light-generated species in the suggested experiments are formed on a time scale much
shorter than response time of the Vernier Flash Photolysis Spectrometer (~100 microseconds). Therefore
we are only interested in studying the decay part of kinetic profiles. One important thing to consider when
analyzing the kinetic profiles acquired with Vernier Flash Photolysis Spectrometer is the scattered
excitation light recorded by the photodetector (Figure 8).
15
10
I/ mV
5
0
-0.2-0.10.00.10.20.30.40.5
Time / ms
Figure 8: Example of a temporal profile of the scattered excitation light
In Figure 8, it can be seen that the scattered excitation light effect on the kinetic profile diminishes
within the first 150 s. Therefore it is safe to exclude only the first 150 s along with the pre-trigger points
(negative time) from the waveform to be analyzed (Figure 9).
© Ultrafast Systems LLC /Vernier Software & Technology
23
Page 24

0.3
0.05
0.04
0.2
0.03
A
0.1
0.0
-0.05 0.00 0 .05 0.1 0 0.15 0.20 0.2 5
Time / ms
0.02
I/ V
0.01
0.00
-0.05 0.00 0.05 0.10 0.15 0.20 0.25
Time / ms
Figure 9: Absorption (left) and emission (right) kinetic profile including the
scattered excitation light picked up by the detector
The processed A vs. time data (Figure 10) can now be fitted by the algorithms representing first
order and second order behavior. To do this you will need to write transforms derived from Equations 11
and 12, and test the data against the transformed data. In many spreadsheet programs, including
Logger Pro, the requirement for the fitting transform is to express the absorbance as a function of time
with rate constant, initial intensity, and any significant baseline offset as fitting parameters.
0.3
0.2
A
0.1
0.0
0.00.20.40.60.81.01.21.41.61.82.0
Time / ms
Figure 10: Decay portion of the A-time profile
© Ultrafast Systems LLC /Vernier Software & Technology
24
Page 25

6.3 The Basics of Photochemistry
Light, as is true for all types of electromagnetic radiation, is a form of energy. A beam of light can
be thought of as a train of energetic particles that we call photons. The light to which our eyes are
sensitive is in the spectral range of about 350 nm (violet) to 800 nm (red). The amount of energy
contained by a photon is in inverse proportion to the wavelength. The energy content of the shorter
wavelengths (200–500 nm) is sufficient to break chemical bonds and even the longer wavelengths can
have chemical consequences.
Useful relationships are provided in the following equations, where E is the photon energy:
1
() ( ) ( )EJ hJs s
() ( ) ( )/ ()EJ hJs cms m
When a photon comes within close approach of a molecule, if its energy (see Equation 14) is
equivalent to that of another state of the molecule, the whole of the photon energy can be given to the
molecule with annihilation of the photon. We say that the molecule has absorbed the light, meaning the
energy of the photon has become transferred to the molecule. In doing so, the molecule changes its
nature—its electronic configuration is altered from that in the ground state-an excited electronic state has
Equation 14
1
Equation 15
been generated. This electronic change is usually accompanied by changes to the motions of the nuclei,
resulting in vibrational (and torsional) excitations. Since it is the electronic configuration of a molecule that
governs its chemical properties, excited electronic states show different chemical properties from their
parent ground states. It is the study of the chemical nature of molecules in excited states that is the
essence of photochemistry.
Molecules that have been promoted to excited states by absorption of photons are intrinsically
unstable. They seek to reduce their energy content and reach a lower energy condition. One of the ways
to do this is to lose the energy in a radiative process such as fluorescence or phosphorescence. Often,
these emissions can be observed, and in such cases, the observation provides us with a means to
measure the rates of decay of the excited species. Another way to reduce energy is by chemical
transformations in which chemical bonds are broken or formed. These new species may also be unstable
and react further to produce another generation of products. The intermediates in the sequence and the
eventual final products are likely to absorb light themselves in spectral regions that are different from the
parent compound. We can follow the process of the chemical sequence by the use of spectrophotometric
methods. Since the life times of the intermediates are often very short (ms, µs, ns, and less) and their
reactions are fast, it is necessary for the methods to be capable of high time resolution. The experiments
with the Vernier Flash Photolysis Spectrometer are designed to demonstrate the use of time-resolved
techniques in a straightforward and cost-effective way.
© Ultrafast Systems LLC /Vernier Software & Technology
25
Page 26

7 Flash Photolysis Experiments
7.1 Base Catalysis of the cis-trans Isomerization of
Congo Red
Excitation wavelength: <500 nm
Observation wavelength: 600 nm
Chemicals needed
Congo red (CR)
Sodium hydroxide
Ethanol, commercial grade for solvent
Background
Congo red (CR) is a diazo dye that is a derivative of azobenzene. As can be seen from the
skeletal structure in Figure 11, CR has two identically substituted azobenzene moieties.
Figure 11: Congo red, MW=696.67
The absorption spectrum of a solution of CR in its trans-ground state (as depicted in Figure 13) in
20% water/ethanol is shown in Figure 12. The dye absorbs strongly throughout the visible range with a
maximum near 510 nm. Note that the absorbance is very weak at 600 nm.
© Ultrafast Systems LLC /Vernier Software & Technology
26
Page 27

Figure 12: Ground state absorption spectrum of Congo red (trans conf.) in 20% water in ethanol
When light within the broad visible band is absorbed by the dye, some ground state molecules
are converted into an excited state in which the electronic structure of the dye is changed. This shift in
electron density causes the –N=N- bond to have significantly less double-bond character, and because of
this, the molecule becomes torsionally flexible. Thus, in its attempt to rid itself of the energy imparted by
the absorption of a photon, CR flips rapidly from a trans-excited state to a cis-ground state that is a higher
energy state than the trans-ground state. This cis-state is therefore metastable with respect to the trans-
ground state, and in fluid media at room temperature, a cis-trans isomerization will occur with the result
that CR in its initial state is regenerated. Overall then, all that happens is that light energy is converted to
heat in the solution.
However, this photoreaction provides an opportunity for the student to follow the progress of a
thermal cis-trans isomerization and measure its rate on timescales that cannot be achieved by traditional
mixing methods. Moreover, the rate is found to be catalyzed by both acids and bases, and the student is
-
required to find the bimolecular rate constant for catalysis by OH
ions.
© Ultrafast Systems LLC /Vernier Software & Technology
27
Page 28

Procedure
Obtain and wear goggles. Prepare 100 mL of 20% water in ethanol using de-ionized or distilled
water. It may be convenient to use 190 proof ethanol, which is 5% in water, and add the requisite volume
of water to bring it to 20%. Note that the exact percentage of water is not important, but the water must be
pure. Add small quantities of solid CR to the water-alcohol mixture until the color is a light red. Again the
amount of dye is not important; you need to have just enough to generate a quantity of the cis-
photoproduct to provide an absorbance that has a good signal-to-noise ratio in the Vernier Flash
Photolysis Spectrometer. A useful check is to transfer some of the solution to the 10 mm x 10 mm cuvette
and place it in the sample position with the 600 nm band pass filter inserted in front of the detector. If the
reading on the lower-left of the Vernier Flash Photolysis Spectrometer Software is about 20% lower
I
0
than the value without the cuvette in the sample position (or with an empty cuvette), the solution is
adequate for the purpose.
Remove 50 mL of the prepared dye solution and add sufficient 0.1 M NaOH solution in water to
bring it to 2 mM in NaOH (the amount of water you add here is not significant in the total).
Now you have two equivalent solutions of dye in the solvent mixture, one of which is 2 mM in OH
ions.
By mixing appropriate amounts of the two solutions, prepare 5 mL amounts that range from 0 to
0.1 mM in OH
-
ions. These solutions all contain the same CR concentration in the same water/ethanol
-
mixture.
Starting with the 0 mM sample, transfer about 3 mL to a clean, dry cuvette. Place the cuvette in
the sample position and confirm that Averages is set to 1. Then, click the Start button. You should see a
time profile similar to that in Figure 10, where the y-axis is Amplitude in mV and the x-axis is in ms.
© Ultrafast Systems LLC /Vernier Software & Technology
28
Page 29

Figure 13: Kinetic profile of Congo red in 20% water in ethanol
In Figure 14, you can see that the flash at t = 0 causes a vertical (on these time scales) drop in
the mV reading; it drops from ~1.275 V prior to the flash to ~1.245 V after. Subsequently, the value
increases over hundreds of milliseconds. The flash induces the changes outlined earlier, and very quickly,
at shorter times than software can follow, the ground state of the cis-form is generated. The ground state
of the cis-form absorbs light passing through the 600 nm filter, and the detector registers a drop in
transmission. Then, the cis-form returns to the trans-form over many milliseconds, and it is the rate of this
process that you are required to extract from the data set.
Repeat data collection with the averages set to 10 (or more) and save the resulting data.
Do the same procedure for the other samples you have prepared, and save their averaged data
sets. As you go through the series, you see that the recovery rate increases; to account for this, you will
need to adjust the time window setting and the time scale in order to obtain curves that use as much of
the time window as possible.
The samples that you have examined have been stored as comma-separated values (CSV) files.
Import the data into Logger Pro to evaluate the rate constants for the cis-trans conversion of CR as a
-
function of [OH
linear function of [OH
]. You should find that the decays follow an exponential rate law with a constant that is a
-
] and the slope of the line (or the best fit of the regression) is the bimolecular rate
constant for the catalytic process.
© Ultrafast Systems LLC /Vernier Software & Technology
29
Page 30

Figure 14: Absorption kinetic profile of Congo red in 20% water in ethanol with 2 mM OH
-
ions
© Ultrafast Systems LLC /Vernier Software & Technology
30
Page 31

7.2 Isomerization of Mercury Dithizonate
Excitation wavelength: <500 nm
Observation wavelength: 600 nm
Chemicals needed
Mercury dithizonate (HgDz)
Trifluoroacetic acid (TFA)
Ethanol, commercial grade for solvent
Background
h
Figure 15: Photoinduced isomerization of mercury dithizonate
This photoisomerization event occurs within the flash lamp profile (i.e., “instantaneously” on our
time scale). The trans-to-cis back reaction occurs in the dark period following the flash, and the color
reverts thermally with a lifetime of ~650 ms. This inversion of color can be catalyzed by acids and bases.
In this experiment the solution of the HgDz complex is excited by the flash lamp and the decay of the
transient absorption at 600 nm is monitored as a function of time after the flash.
The decay is exponential in time with a rate that is first order in the concentration of an acid such
as trifluoroacetic acid (TFA). The experimental conditions are such that the TFA is at a much higher
concentration than the photo-produced trans-isomer of the complex and so the conditions correspond to
the pseudo-order situation as described in the kinetics theory section (Section 5.7). A plot of the observed
rate constant as a function of acid concentration is linear with a slope that provides the bimolecular rate
constant for the catalysis process.
© Ultrafast Systems LLC /Vernier Software & Technology
31
Page 32

Figure 16: Ground state absorption spectrum of mercury dithizonate (trans conf.) in ethanol
Procedure
Obtain and wear goggles. Prepare a 25 mL stock solution of HgDz in ethanol with sufficient solute
-5
to provide absorbance of ~1/cm at 500 nm (roughly 10
TFA in ethanol. Prepare at least 5 sample solutions, each containing 3 mL of HgDz stock, aliquots of TFA
stock in the range of 0–1 mL and sufficient ethanol to bring total volume to 4.0 mL. These sample
solutions will all have the same concentration of HgDz and varying concentrations of TFA in the range
0–0.02 M TFA. Place ~4 mL of the [TFA] = 0 M sample solution in a 10 mm x 25 mm rectangular
borosilicate cuvette with all faces polished and proceed to photoexcitation.
Photoexcitation of an air-saturated ethanol solution of the Hg complex with the dithizone ligand in
the cis-form induces cis-to-trans isomerization, and the compound changes color from orange to blue
= 605 nm).
(
max
M). Prepare 25 mL of 0.01 M stock solution of
© Ultrafast Systems LLC /Vernier Software & Technology
32
Page 33

Figure 17: Trifluoroacetic acid (TFA); MW = 114.03
Figure 18: Kinetic profile of mercury dithizonate in ethanol
© Ultrafast Systems LLC /Vernier Software & Technology
33
Page 34

7.3 Determination of the Activation Energy of the
Thermal Back Reaction of One Spiropyran in
Tolu ene
Excitation wavelength: <400 nm
Observation wavelength: 600 nm
Chemicals needed
1’,3’-dihydro-1’,3’,3’-trimethyl-6-nitrospiro(2H-1-benzopyran-2,2’-2H-indole) (6-NO
Toluene
1
Background
-BIPS)
2
6-NO2-BIPS is a type of spiropyran molecule that is colorless in its normal form (N isomer) and
undergoes a photochemical ring-opening reaction to yield an isomeric colored merocyanine form (MC
isomer) when irradiated with UV light. It has been proposed that the MC isomer is a zwitterion, as shown
in Figure 19.
Figure 19: Structure and photochromic reaction of 6-NO
-BIPS
2
The N isomer is the thermodynamically more stable isomer and absorbs in the UV region,
whereas the MC isomer absorbs in both the UV and visible regions. The MC isomer exhibits a strong and
characteristic absorption band between 550 and 650 nm. Upon UV irradiation of 6-NO
formation of the MC isomer is induced. The increase in the concentration of the MC isomer results in the
increase of absorbance in the visible region of the absorption spectrum. The MC isomer spontaneously
returns to the N isomer once the UV irradiation is stopped. The kinetics of this back reaction process can
be characterized by measuring the visible absorption at 600 nm of the MC isomer as a function of time. In
1
Reference: Piard, Jonathan, “Influence of the Solvent on the Thermal Back Reaction of One Spiropyran” Journal
of Chemical Education. 2014, 91, 2105–2111.
© Ultrafast Systems LLC /Vernier Software & Technology
-BIPS, the
2
34
Page 35

this experiment, the kinetics of the back reaction will be measured for a range of temperatures in order to
determine the activation energy, E
, of the back reaction. The activation energy can be determined from
a
the slope of ln(τ) as a function of 1/T according to the Arrhenius equation:
1
where k is the rate constant, τ is the time constant of the back reaction process, T is the temperature in
kelvin, A is the pre-exponential factor in reciprocal time units, and R is the universal gas constant. The
literature reported value for E
= 62.5 kJ mol-1.
a
Procedure
Prepare the solution by taking 0.032 mg of 6-NO
of toluene to give a 5.0 × 10
-6
mol L-1 solution. The concentration was chosen such that the absorbance at
-BIPS and dissolving it in approximately 20 mL
2
λ = 300nm in a 1 cm cuvette of the UV absorption peak was 0.5 at room temperature (see Figure 16).
This avoids any dimerization processes as well as allows the UV irradiation to propagate through the
entire sample. If using a common UV-visible spectrometer in an undergraduate laboratory,
should not
max
exceed 1.
Fill the provided cuvette with 4 ml of the 6-NO
-BIPS/toluene solution.
2
Prepare a hot bath of water that can be temperature controlled and use a thermometer to monitor
the temperature. The bottom half of the cuvette should be placed into the hot bath to allow the solution to
come into thermal equilibrium with the water. Remove the cuvette once it is in thermal equilibrium with
5 different temperatures between 30 and 60 °C (Figure 21 shows an example of measurements done at
five varying temperatures.) and place the cuvette in the Flash Photolysis Spectrometer. Set the time
window appropriately and take one measurement, returning the cuvette to the hot bath afterwards. For
multiple measurements at the same temperature, return the cuvette to the hot bath in between
measurements. This will ensure that the solution is at thermal equilibrium with the warm water for each
measurement.
An example of the generated absorbance vs. time profile is shown in Figure 22 for a temperature
of 55°C. Also shown in this plot is the fitted exponential decay function (red line) generated using Logger
Pro software. This fit will provide the lifetime of the back reaction, which in this example is 1.33 seconds.
Once lifetimes at five different temperatures are obtained, a plot like the one in Figure 23 can be
generated. Using Logger Pro, a line is fit through the five data points and the slope of this line is used to
calculate the activation energy, E
, of the back reaction.
a
© Ultrafast Systems LLC /Vernier Software & Technology
35
Page 36

Figure 20: Ground state absorption spectrum of one spiropyran in toluene
Figure 21: Transient absorption at 600 nm of spiropyran in toluene
© Ultrafast Systems LLC /Vernier Software & Technology
36
Page 37

Figure 22: Example decay and exponential fit for 55°C measurement
Figure 23: Actual data example of ln(τ) as a function of 1000/T.
© Ultrafast Systems LLC /Vernier Software & Technology
37
Page 38

8 Appendix
8.1 Spectra of Flash Lamp and White Light LED
1.0
0.8
0.6
0.4
Relative Irradiance
0.2
0.0
200 300 400 500 600 700 800
Wavelength / nm
Figure 24: Emission spectrum of xenon flash lamp
© Ultrafast Systems LLC /Vernier Software & Technology
38
Page 39

1.0
0.8
0.6
0.4
Relative Irradiance
0.2
0.0
400 500 600 700
Wavelength / nm
Figure 25: Emission spectrum of white light LED
© Ultrafast Systems LLC /Vernier Software & Technology
39
Page 40

8.2 Spectra of Optical Filters
60
50
40
30
Transmission / %
20
10
0
550 560 570 580 590 600 610 620 630 640 650
wavelength / nm
Figure 26: Transmission spectrum of 600 nm bandpass filter
© Ultrafast Systems LLC /Vernier Software & Technology
40
 Loading...