

Page 1
Sound Level Meter
(Order Code SLM-BTA)
The Sound Level Meter measures sound level in decibels. It
can be used for activities such as
environmental noise studies
sound level comparisons
investigating room acoustics
sound isolation modeling
sound propagation modeling
Inventory of Items Included with the Sound Level Meter
Check to be sure that each of these items is included in your Sound Level Meter
package:
Sound Level Meter
Wind screen (black foam cover for the sensing element)
4 AAA batteries (preinstalled in the meter)
Cable to connect the sensor to a data-collection interface (order code
CB-SLM)
NOTE: Vernier products are designed for educational use. Our products are not
designed nor recommended for any industrial, medical, or commercial process such
as life support, patient diagnosis, control of a manufacturing process, or industrial
testing of any kind.
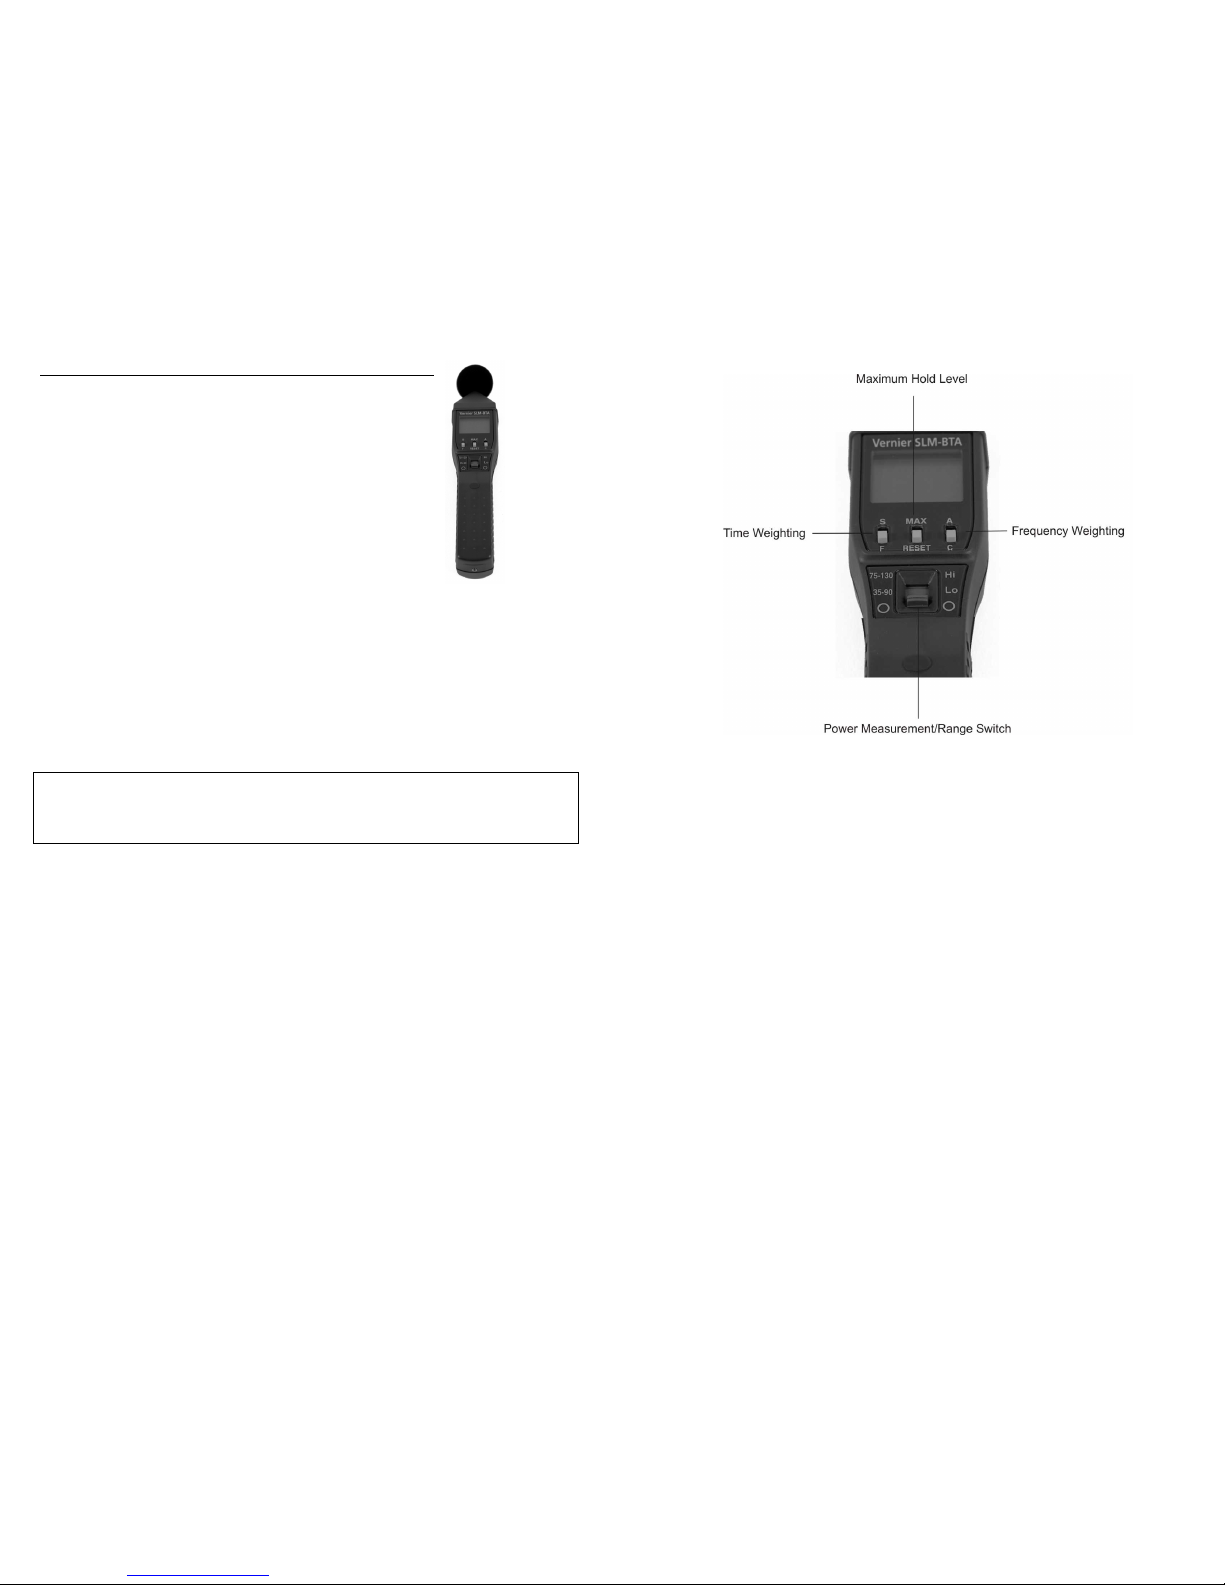
Sound Level Meter Description
The sensing microphone on the Sound Level Meter is located at the end of the silver
barrel at the top of the meter. Below the LCD, you will find three switches labeled
S/F, MAX/RESET, A/C. Below these switches you will find the power/measurement
range switch. Further description of these switches follows. The battery
compartment is located on the back of the Sound Level Meter. A signal output
terminal is located on the bottom of the meter. The output of this terminal is sent to
data collection interface.
The LCD panel displays noise levels in dB. A low battery level indicator and an
upper/lower range indicator are also displayed.
The sensor comes with a foam windscreen. The windscreen helps reduce the
detection of false high signals caused by wind blowing across the microphone. It
also protects the microphone from dust and debris.
2
Panel Switches
Power/Measurement Range Switch–This slide switch, labeled “O/35–90/75–130,”
turns the sensor on and sets the measurement range. When set to the 35–90 range
(LO), the sensor is designed to measure sound levels in the range of 35 to 90 dB.
When the switch is set to the 75–130 range (HI), the sensor is designed to measure
sound levels in the range of 75 to 130 dB. A range warning will appear if the
measured sound is beyond the range of the current setting. If this warning appears
continuously, set the switch to the appropriate range.
Time Weighting–The S/F switch just below the LCD sets the time weighting. For
normal measurements set the switch to the slow setting “S.” For fluctuating noise,
set the weighting to fast “F.” In the classroom, you will probably set it to “S.”
Maximum Level Hold–Setting the MAX/RESET button to MAX sets the sensor
meter to show the maximum, weighted sound level. In the classroom you will
probably set it to RESET, in which case the display will continually display the
sampled reading. Setting this switch to MAX does not affect the output signal sent to
the data-collection interface.
Frequency Weighting–The A/C switch is used to set the weighting scale. “A”
weighted setting is the sound level value that most closely matches that of the human
hearing range. It is the weighting scale most commonly used for Occupational Safety
and Health Administration (OSHA) and Department of Environmental Quality
(DEQ) regulatory measurements. The “C” weighted scale is useful for monitoring
sources such as engines, explosions and machinery. This setting would also be used
if you wish to use the Sound Level Meter to get the total unweighted sound level of
the noise source.
Page 2

3
Operating the Sound Level Meter
Here are the general operating procedures:
1. Slide the power switch to the appropriate range.
2. Set the time weighting switch to “S.”
3. Set the maximum level hold switch to “RESET.”
4. Set the frequency weighting to “A.”
The Sound Level Meter functions as a standalone device, and you can monitor sound
levels
1
by reading the LCD panel. If you want to collect sound level data, you need
to connect the Sound Level Meter to a data-collection interface.
Connecting the Sound Level Meter to Vernier Products
The Sound Level Meter package includes a removable cable (order code
CB-SLM). Connect the mini-plug end of the cable into the bottom of the sensor.
Connect the other end to the data-collection interface, e.g., Vernier LabQuest
®
2,
Go!
®
Link, CBL 2™, or EasyLink®.
Collecting Data with the Sound Level Meter
This sensor can be used with the following interfaces to collect data.
Vernier LabQuest 2 or original LabQuest
®
a standalone device or with a
computer
Vernier LabQuest
®
Mini with a computer
Vernier LabPro
®
with a computer or TI graphing calculator
Vernier Go!
Link
Vernier EasyLink
Vernier SensorDAQ
®
CBL 2
TI-Nspire™ Lab Cradle
Here is the general procedure to follow when using the Sound Level Meter:
1. Connect the Sound Level Meter to the interface.
2. Start the data-collection software.
3. The software will identify the Sound Level Meter and load a default datacollection setup. You are now ready to collect data.
Data-Collection Software
This sensor can be used with an interface and the following data-collection software.
Logger Pro 3 This computer program is used with LabQuest 2, LabQuest,
LabQuest Mini, LabPro, or Go!Link.
Logger Lite This computer program is used with LabQuest 2, LabQuest,
LabQuest Mini, LabPro, or Go!Link.
1
A table of common sources of noise appears in the Additional References section of this
manual.
4
LabQuest App This program is used when LabQuest 2 or LabQuest is used as a
standalone device.
EasyData App This calculator application for the TI-83 Plus and TI-84 Plus can
be used with CBL 2™, LabPro, and Vernier EasyLink. We recommend version
2.0 or newer, which can be downloaded from the Vernier web site,
www.vernier.com/easy/easydata.html, and then transferred to the calculator. See
the Vernier web site, www.vernier.com/calc/software/index.html for more
information on the App and Program Transfer Guidebook.
DataMate program Use DataMate with LabPro or CBL 2™ and TI-73, TI-83,
TI-84, TI-86, TI-89, and Voyage 200 calculators. See the LabPro and CBL 2™
Guidebooks for instructions on transferring DataMate to the calculator.
DataQuest™ Software for TI-Nspire™ This calculator application for the
TI-Nspire can be used with the EasyLink or TI-Nspire Lab Cradle.
LabVIEW National Instruments LabVIEW™ software is a graphical
programming language sold by National Instruments. It is used with SensorDAQ
and can be used with a number of other Vernier interfaces. See
www.vernier.com/labview for more information.
NOTE: Vernier products are designed for educational use. Our products are not
designed nor recommended for any industrial, medical, or commercial process such
as life support, patient diagnosis, control of a manufacturing process, or industrial
testing of any kind
Specifications
Sensor: ½" electret (prepolarized) condenser microphone
Power: four AAA batteries
Battery life: 50 hours typical
Display: 3½" LCD
Measurement range: Low: 35 dB to 90 dB
High: 75 dB to 130 dB
Frequency range: 31.5 Hz to 8000 Hz
Resolution: 0.1 dB
Accuracy: 1.5 dB (ref 94 dB @ 1 kHz)
Output: DC: 10 mV/dB
AC: 1.0 Vrms corresponding to the top of the
selected range
Stored calibrations
slope: 100 dB/V
intercept: 0 dB/V
Page 3

5
How the Sound Level Meter Works
The Sound Level Meter uses an electric condenser microphone mounted on the end of
a shaft. The output of this microphone is fed into a series of filters, amplifiers,
integrators, and adder circuits to produce a single sound pressure level measurement.
The Sound Level Meter uses a directional microphone, which requires the instrument
be pointed in the direction of the noise source unless ambient noise levels are being
monitored.
Acoustical engineers organize the audio spectrum into sound octave bands.
3
The
weighting switch on your Sound Level Meter is used to add or subtract different
values to the octave band components. The “A” weighted sound level discriminates
against low frequencies, in a manner similar to the response of the ear. In this setting
the meter primarily measures in the 500 to 10,000 Hz range. It is the weighting scale
most commonly used for OSHA and DEQ regulatory measurements. The “C”
weighted sound level does not discriminate against low frequencies and measures
uniformly over the frequency range of 30 to 10,000 Hz. This weighting scale is
useful for monitoring sources such as engines, explosions and machinery. The sound
levels measured with these two weightings have units of “dBA” and “dBC”,
respectively.
Calibration Information
You should not need to calibrate the Sound Level Meter for classroom use.
Calibration is possible, but it will require access to a special calibrator, not
commonly available in the classroom.
This sensor is equipped with circuitry that supports auto-ID. When used with
LabQuest 2, LabQuest, LabQuest Mini, LabPro, Go! Link, SensorDAQ, TI-Nspire™
Lab Cradle, EasyLink, or CBL 2™, the data-collection software identifies the sensor
and uses pre-defined parameters to configure an experiment appropriate to the
recognized sensor.
Suggested Experiments
Sound Level Studies
You can collect sound level data in many real-world situations; for example, you can
collect sound levels before, during and after a concert or dance.
collect sound levels throughout the day in a school hallway or shopping mall.
use the Sound Level Meter to judge cheering contests at pep rallies.
collect data outside and inside a car equipped with a stereo system.
make a model of an ear and ear canal. Measure sound levels at the “ear drum”
when a headset is placed over the ear. Repeat the experiment but place an earplug
between the headset and the meter.
Set up the Sound Level Meter to collect readings in a variety of situations. Use
the following chart to determine the acceptable duration for exposure to the
sound level you measure.
3
A table of the frequency bands for each octave band appears in the Additional References
section of this manual.
6
The following chart4 shows the sound level exposure rates set by the OSHA
Occupational Noise Exposure Standard. In a work environment, for example, it is
acceptable to be exposed to 90 dB for eight hours as measured on the “A” weighted
scale. If the sound level is 100 dB, the acceptable duration is two hours.
Duration per day
(hrs)
Sound level, slow-response
(dBA)
8.0 90
6.0 92
4.0 95
2.0 100
1.0 105
0.5 110
0.25 115
Environmental Measurements
Environmental measurements can be made anywhere people spend significant
amounts of time, such as their residence. The DEQ noise standard uses statistical
sound level values that are applied to residential measurements. One of these
measurements is the equivalent hourly sound level, L
eq
. You can collect sound level
data with the Sound Level Meter set on “A” weighting and slow response. If you
collect data for an hour and determine the average, you will have an estimate of L
eq
.
These values can then be compared to the local DEQ standards.
Room Acoustics
One goal of acoustic engineers is to “tune” a room for a specific purpose. A room
tuned for lecture will be tuned differently than a library. The Sound Level Meter can
be used to investigate acoustics in a room. One of the indicators of good room
acoustics is the length of time sound stays in the room. Hard surface in a room allow
sound to “reverberate” for relatively long periods of time. Soft surfaces dampen the
reverberation. For example, if you clap your hands in an empty gymnasium, you will
hear a relatively long echo. Repeat the experiment in a library, music room, or
concert hall, and you will hear a shorter echo. Use the Sound Level Meter and a
computer or calculator to try this experiment:
1. Set the equipment up to collect data for 5 seconds.
2. Use the triggering feature of the software so the data collection is initiated with a
loud sound.
3. Collect a set of data and examine the graph.
4
Paragraphs 29 CFR 1910.95, Table G-16 of the OSHA Occupational Noise Exposure
Standard.
Page 4

7
4. Determine how long it takes the sound level to fall by a specific dB level from the
peak level.
5. Repeat the experiment in a different room.
In this example, room acoustics were investigated in a sound booth and in a large
room with hard, flat surfaces. Two boards were struck together to produce a loud
sound. The sound level in the sound booth dropped 20 dB in 0.35 s. In the room with
bare walls, it took 0.51 s for the sound level to drop 20 dB.
Dampening of Sound in Two Rooms
The Color of Noise
You have probably heard the terms pink noise and white noise. You probably cringe
when you hear fingernails being drawn across a chalkboard but think nothing of
lawn mower noise. These sounds may all have the same sound level, but the
frequency content is vastly different.
White noise is a sound that has a uniform spectral level over the range of human
hearing. This means that every frequency between 20 Hz and 20,000 Hz has an equal
energy level. White noise sounds like it is rich in high frequencies, but this is not the
case. This perception occurs because each successive octave is twice as wide as the
one preceding it. For example, the 500 Hz octave band has width of 354 Hz. The
next octave, the 1000 octave band, has a width of 707 Hz. The net result is that there
is more energy in the high frequency components. The sound of water and wind
resemble white noise.
Pink noise is a variant of white noise. Pink noise is white noise that has been filtered
so that each octave has equal energy. This is done to compensate for the increase in
the number of frequencies per octave.
You can demonstrate the difference between pink and white noise using the Sound
Level Meter. Set the Sound Level Meter to measure “C” weighted sounds. Pick
8
several sounds that have the same “C” weighted sound level. Now measure these
same sounds with the “A” weighting. Compare the difference between the two
weightings for each sound.
Static with an AM radio using “A” Weighting and “C” Weighting
Sound Isolation
Sound isolation is important in everyone’s life. People living near a freeway or an
airport hear that difference when they go inside and close the door. Acoustical
engineers work with architectural engineers to select materials that attenuate sound.
For example, a wall constructed with gypsum board on a wooden frame will
attenuate sound differently than a cinder block wall with the same area. A window
with a single pane of glass will attenuate sound differently than a window with two
panes of glass separated by an air space.
You can test this by doing the following experiment. Place a radio in a room that has
an outside wall and a window. Tune the radio to an unused AM frequency so that
you hear only static. Turn the volume up so that you can just hear the sound through
the wall. Measure the sound level at the wall. Next measure the sound level at the
window, and then measure the sound level within the room. How much did the
sound level change? Did you notice a difference in frequency content?
Additional References
Web Sites
Here are some web sites that provide additional information on sound level
measurement:
www.tir.com/~ms/
This site provides a brief
int
r
oduction to acoustics.
www.nonoise.org/library/whonoise/whonoise.htm
This site expands on the
topics presented above.
Page 5

9
Example Sound Levels
Source
Sound Pressure Level
(dBA)
Large Rocket (nearby) 180 to 194
Jet Aircraft 150
Shotgun Blast 145
Propeller Aircraft 140
Pneumatic Riveter, Threshold of Pain 130
Rock Concert, Thunder 120
Construction Noise 110
Subway Train 100
Heavy Truck 90
N
oisy Restaurant 80
Busy Traffic, Normal Radio 70
N
ormal Conversation, Dishwasher 60
Quiet Office 50
Library 40
Soft Whisper 30
Rustling Leaves 20
N
ormal Breathing 10
Threshold of Hearing 0
Standard Octave Band Frequencies Ranges with Corresponding A and
C Weighting Values
Center Frequency
(Hz)
Effective Band
(Hz)
A Weighting
(dB)
C Weighting
(dB)
31.5 22.1–44.2
–
39.4
–
3.0
63 44.2–88.4
–
26.2
–
0.8
125 88.4–177
–
16.1
–
0.2
250 177–354
–
8.6 -0
500 354–707
–
3.2 -0
1000 707–1,414 -0 -0
2000 1,414–2,828 1.2
–
0.2
4000 2,828–5,657 1.0
–
0.8
8000 5,657–11,314
–
1.1
–
3.0
Warranty
This product is manufactured by OMEGA Engineering. OMEGA warrants it to be
free from defects in materials and workmanship for a period of 13 months from the
date of shipment to the customer. This warranty does not cover damage to the
product caused by abuse or improper use.
10
Page 6

11
12
Vernier Software & Technology
13979 S.W. Millikan Way Beaverton, OR 97005-2886
Toll Free (888) 837-6437 (503) 277-2299 FAX (503) 277-2440
info@vernier.com www.vernier.com
Rev 6/5/2012
Logger Pro, Logger Lite, Vernier LabQuest 2, Vernier LabQuest, Vernier LabQuest Mini, Vernier LabPro, Go! Link,
Vernier EasyLink and other marks shown are our trademarks or registered trademarks in the United States.
TI-Nspire, CBL 2, TI-GRAPH LINK, and TI Connect are trademarks of Texas Instruments.
All other marks not owned by us that appear herein are the property of their respective owners, who may or may not be
affiliated with, connected to, or sponsored by us.
Printed on recycled paper.
 Loading...