

Page 1
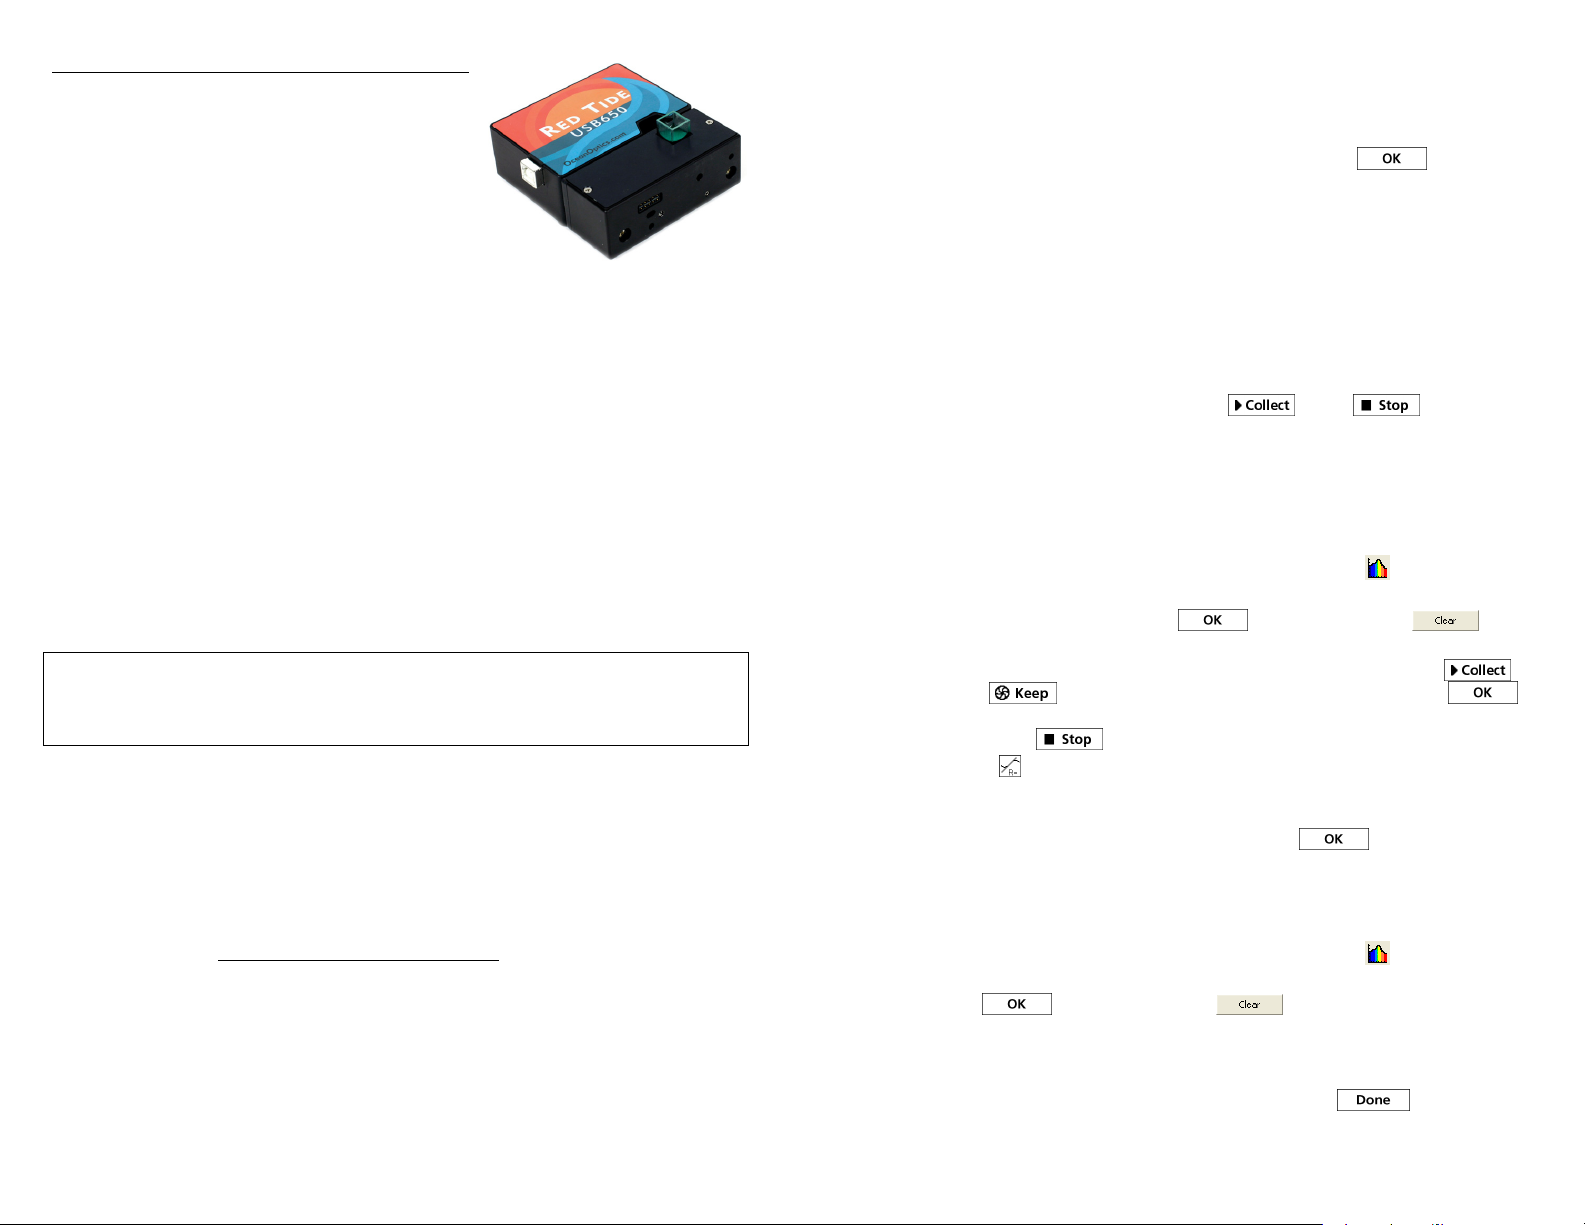
Vernier Spectrometer
Ocean Optics Red Tide
Spectrometer
(Order Codes: V-SPEC, SPRT-VIS)
These spectrometers are portable light
spectrophotometers, combining a spectrometer and a light source/cuvette holder. The
light source/cuvette holder may be detached and an optical fiber assembly attached
to the spectrometer for emission spectrum experiments.
What is included with the Spectrometer?
One spectrometer with light source/cuvette holder (Vernier Spectrometer, Ocean
Optics™ Red Tide Spectrometer)
One package of 15 plastic cuvettes and lids
One USB cable
Software Requirements
Logger Pro® 3 (version 3.8.5 or newer) software is required. If you own a previous
version of Logger Pro 3, you may upgrade the software free of charge. You need the
LabQuest
LabQuest as a standalone device with a spectrometer. Visit
http://www.vernier.com/LabQuest/updates
NOTE: Vernier products are designed for educational use. Our products are not
designed nor recommended for any industrial, medical, or commercial process such
as life support, patient diagnosis, control of a manufacturing process, or industrial
testing of any kind.
Get Started
Using a Spectrometer with Your Computer
1. Install Logger Pro 3 software (version 3.8.5 or newer) on your computer before
2. Connect the spectrometer to a powered USB port or a powered hub. Allow the
3. The first time you connect a spectrometer, your computer may ask you a few
Windows computers (Windows XP or Vista) Follow the New Hardware Wizard
Macintosh computers (Mac OS 10.3 or newer) If it appears, follow the New
®
application version 1.1 or newer to use a LabQuest 2 or original
using an Ocean Optics spectrometer.
spectrometer to warm up for a few minutes.
questions. Note: Do not go online for device drivers
installed when you installed Logger Pro 3.
instructions to download the drivers automatically.
Device instructions.
. The device drivers were
Calibrate the Spectrometer for Measuring Absorbance or %T
With the spectrometer connected to your computer and Logger Pro 3 running,
choose Calibrate ► Spectrometer from the Experiment menu. Follow the
instructions in the dialog box to complete the calibration. Click
.
Collect Data
There are three general types of data collection measuring absorbance – absorbance
vs. wavelength which produces a spectrum, absorbance vs. concentration for Beer’s
law experiments, and absorbance vs. time for kinetics experiments.
Measure the Absorbance Spectrum of an Aqueous Sample
(Absorbance vs. Wavelength)
1. Calibrate the spectrometer as described above.
2. Fill a cuvette about ¾ full of the solution to be tested. Place the sample in the
cuvette holder of the spectrometer and click
data collection.
3. To store the spectrum data, choose Store Latest Run from the Experiment menu.
. Click to end the
Conduct a Beer’s Law Experiment (Absorbance vs.
Concentration)
1. Measure an absorbance spectrum as described above.
2. Click on the Configure Spectrometer Data Collection button,
3. Click Abs vs. Concentration. The wavelength of the maximum absorbance will be
automatically selected ( max). Click
select a wavelength on the graph or in the list of wavelengths.
4. Place your first Beer’s law standard solution in the spectrometer. Click
and then click . Enter the concentration of the sample and click .
Repeat this step for the remaining standard samples. After you have tested the
final standard, click
5. Click linear fit,
6. Place an unknown sample of solution in the spectrometer. Choose Interpolation
Calculator from the Analyze menu. A helper box will appear, displaying the
absorbance and concentration of the unknown. Click
, to see the function for the standard solutions.
to end the data collection.
to continue or click
.
and
.
Conduct a Kinetics Experiment (Absorbance vs. Time)
1. Measure an absorbance spectrum as described above. If you wish to store the
data, select Store Latest Run from the Experiment menu.
2. Click on the Configure Spectrometer Data Collection button,
3. Click Abs vs. Time. The wavelength of maximum absorbance will be selected as
before. Click
the graph or in the list of wavelengths.
4. The default settings are 1 sample per second for 200 seconds. To change the
data-collection parameters for your experiment, choose Data Collection from the
Experiment menu and make the necessary changes. Click
to continue or click and select a wavelength on
.
.
2
Page 2
5. Mix the reactants, transfer ~2 mL of the reaction mixture to a cuvette and place
the cuvette in the spectrometer. Click . You may click to end
data collection early.
6. Click Curve Fit,
, to calculate a function for your data.
Using a Spectrometer to Measure Emission Spectra
You may use your spectrometer to measure the emission spectrum of a light source
such as an LED or a gas discharge tube. To do so, you may want to purchase an
optical fiber assembly (order codes: VIS-NIR or UV-VIS).
Measure an Emission Spectrum
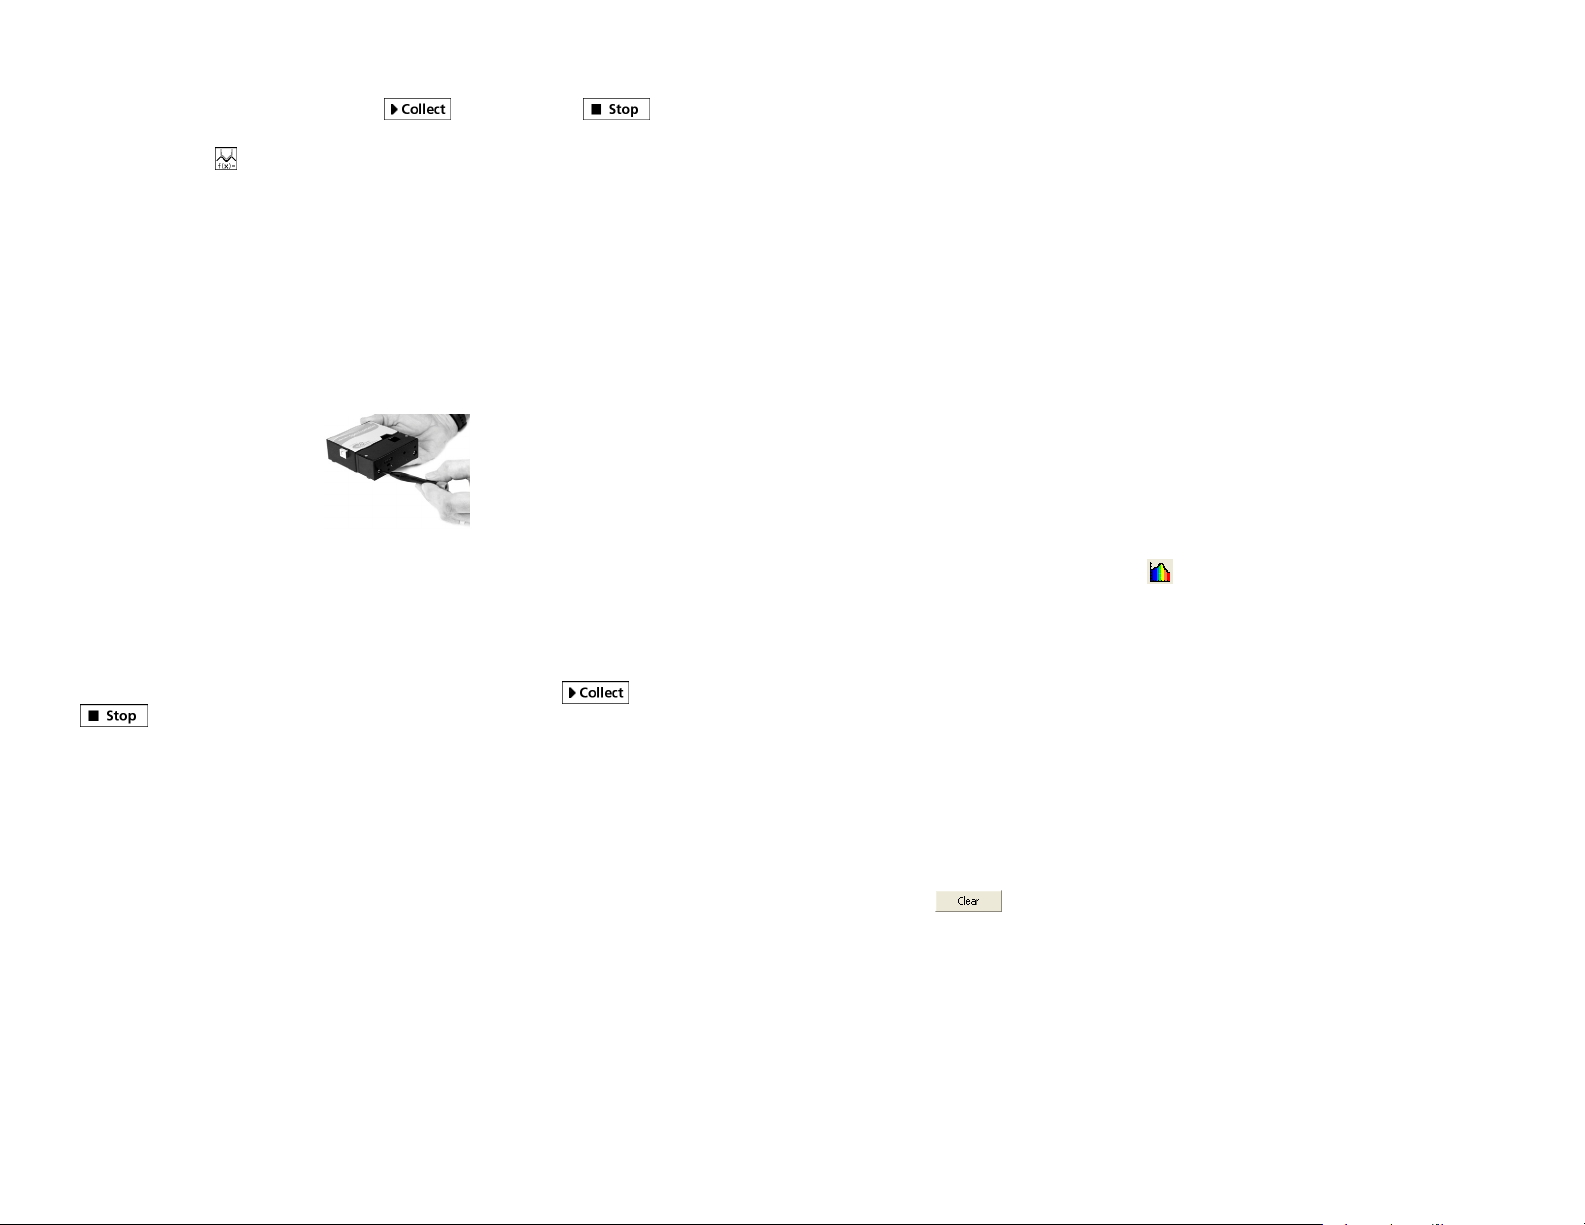
1. Use a small screwdriver to loosen the two screws that connect the cuvette holder
to the spectrometer (see Figure 1). Remove the cuvette holder and connect an
optical fiber assembly to the spectrometer.
2. Use a USB cable to connect the spectrometer to your computer.
3. Start Logger Pro 3.
4. Choose Change Units ► Spectrometer ► Intensity from the Experiment menu.
Intensity is a relative measure.
5. Aim the tip of the optical fiber cable at a light source. Click
to end data collection. If the spectrum maxes out (flat and wide peaks),
increase the distance between the light source and the tip of the optical fiber cable
or reduce the sample time. To adjust the data collection parameters, choose Set
Up Sensors ► Spectrometer from the Experiment menu. Set the Sample Time to
a suitable value and decrease the Samples to Average to 1.
Figure 1
. Click
Using the Stored Emissions Files in Logger Pro 3
Logger Pro 3 contains a folder of emissions graphs from selected discharge tubes,
including: argon, helium, hydrogen, mercury, oxygen, sodium, and xenon. You can
display and analyze these graphs without a spectrometer connected to your
computer. Follow the steps below to view one of these graphs.
1. Choose Open from the File menu.
2. Open the Sample Data folder.
3. Inside the Sample Data folder, open the Physics folder.
4. Inside the Physics folder, open the Gas Discharge Spectra. Open the desired file.
You can use the mercury emissions graph to test fluorescent lighting for the presence
of mercury.
Changing the Settings in Logger Pro 3
Spectrometer Dialog Box
The Spectrometer dialog box lists all of the settings for the device. To display this
box choose Set Up Sensors ► Show All Interfaces from the Experiment menu.
For most experiments, the default settings work well.
There are four parameters listed in the dialog box.
Sample Time: think shutter speed of a camera. Logger Pro 3 automatically selects
the proper sample time during calibration. Note: For emission studies, you may
need to change the sample time manually.
Wavelength Smoothing: the number of adjacent readings on either side of a given
value that is used to calculate an average value.
Samples to Average: the number of readings taken at a given wavelength to
calculate an average reading.
Wavelength Range: the range is determined by the type of spectrometer in use.
By clicking on the picture of the spectrometer in this dialog box, you will gain
access to four options: calibrate, configure data collection, go to support web page,
and units of measure. Click on an item to select it.
Configure Spectrometer Data Collection Dialog Box
To display this box, click on its icon,
toolbar.
There are three regions in this box and four buttons at the bottom.
Graph: The graph displays a full spectrum analysis of the sample in the cuvette
holder. By default, the wavelength of greatest absorbance (peak) will be marked
with a box. You may select other wavelengths by clicking on the plot at the
desired wavelength. A checkbox beneath the graph allows you select a portion of
the graph and analyze it as a single range of wavelengths.
Set Collection Mode: Three options for data collection are offered. A full
spectrum analysis (Abs vs. Wavelength) is the default.
Full Spectrum/Select Wavelength: This column lists all the available
wavelengths. It becomes active when you select Abs vs. Concentration or Abs vs.
Time. Check the box for each wavelength you wish to use in an experiment.
When you select a wavelength from the list, a box appears on the graph.
Use the
button to remove all of the wavelengths selected on the graph.
, located on the right hand side of the
3
4
Page 3

Determining the Wavelength(s) to Use in an Experiment
When you conduct a Beer’s law lab or a kinetics lab, it is common to select one
wavelength at which to follow the experiment. However, in Logger Pro 3.4.6 you
may select as many wavelengths as you wish. There are two ways to select the
wavelength or wavelengths.
1. Perform a Full Spectrum Analysis of the Solution to Be Tested
Measure the full spectrum of a sample of solution and then click Configure
Spectrum Data Collection (
). Select Abs vs. Concentration or Abs vs. Time.
The wavelength of maximum absorbance ( max) will be automatically selected.
2. Use a Sample of Solution to Determine the Peak Absorbance
This is a variation of the previous method. After calibrating the Spectrometer,
place a sample of solution in the Spectrometer and then click Configure Spectrum
Data Collection (
). Select Abs vs. Time or Abs vs. Concentration. The
wavelength of maximum absorbance ( max) will be automatically selected. If
you don’t want to use the max, click
and select a wavelength on the
graph or in the list of wavelengths.
Selecting a Range of Wavelengths to Use in an Experiment
You may wish to measure the absorbance or %T of a sample over a group of
wavelengths rather than a single wavelength. There are two ways to select a group of
wavelengths from the Configure Spectrum Data Collection dialog box.
Select the wavelengths one at a time by checking the boxes in the Select
Wavelength column.
Place the cursor on the graph in the dialog box. Left click and drag across the
region of wavelengths that you wish to analyze. Make sure to check the “Treat
Contiguous Wavelengths as a Single Range” box.
Measurement
You can set up the spectrometer to measure intensity, absorbance, or
% transmittance. Choose Change Units ► Spectrometer from the Experiment menu.
Click on the unit of choice from the list.
Using an Ocean Optics Spectrometer with a LabQuest 2 or
Original LabQuest
1. Use the USB cable to connect the spectrometer to a LabQuest 2 or original
LabQuest. Allow the spectrometer to warm up for a few minutes.
2. Turn on the LabQuest 2 or LabQuest. The LabQuest app will launch
automatically and the meter screen will be displayed.
Calibrate the Spectrometer
1. Fill a cuvette about ¾ full with distilled water and place it in the spectrometer.
Align the cuvette so a clear side of the cuvette is facing the light source.
2. Choose Calibrate ► USB:Spectrometer from the Sensors menu. At the prompt,
select Finish Calibration. After the message “Calibration Completed” appears,
select
.
Measure the Absorbance Spectrum of an Aqueous Sample
(Absorbance vs. Wavelength)
1. Fill a cuvette about ¾ full of the solution to be tested and place it in the
spectrometer.
2. Start the data collection. Tap the red Stop button to end data collection.
3. Note: The wavelength of maximum absorbance (λ max) is automatically selected.
This λ max will be used for any subsequent data collection, such as a Beer’s Law
experiment (abs vs. conc.) or a kinetics experiment (abs. vs. time). If you wish to
choose another wavelength, you can tap on the graph to select a new wavelength
or you can used the arrow keys on the keypad to move the cursor to a new
wavelength.
Conduct a Beer’s Law Experiment (Absorbance vs. Concentration)
1. Measure an absorbance spectrum as described above. On the Meter screen, tap
Mode. Change the mode to Events with Entry.
2. Enter the Name (Concentration) and Units (mol/L). Select OK.
3. A message will appear warning you to either save or discard the full spectrum
run. Make your choice and proceed with the data collection.
4. Place your first Beer’s law standard solution in the spectrometer. Start the data
collection. After the absorbance reading stabilizes, tap Keep. Enter the
concentration of the solution and select OK.
5. Place your second standard sample in the spectrometer. After the absorbance
readings stabilize, tap Keep. Enter the concentration of the second sample and
select OK.
6. Repeat Step 5 for the remaining standard samples. After you have tested the final
standard, tap the red Stop button to end the data collection.
7. To calculate a best fit line equation for your standards, choose Curve Fit from the
Analyze menu. Select Linear for the Fit Equation, and then select OK. The graph
screen will appear again with the linear regression equation displayed.
8. Place a cuvette containing an unknown sample of solution in the spectrometer.
Tap the Meter tab and write down the displayed absorbance value. Tap the graph
tab and trace the linear regression equation to determine the concentration of the
unknown.
Conduct a Kinetics Experiment (Absorbance vs. Time)
1. Measure an absorbance spectrum as described above. On the Meter screen, tap
Mode. Change the data-collection mode to Time Based.
2. You can change the rate, interval, and/or length of time of data collection, if
desired. Select OK when you are ready to proceed.
5
6
Page 4

3. A message will appear warning you to either save or discard the full spectrum
run. Make your choice and proceed with data collection.
4. Mix the reactants, transfer ~2 mL of the reaction mixture to a cuvette and place
the cuvette in the spectrometer. Start the data collection. You may tap the red
Stop button to end the data collection early.
5. To calculate a function for your data, choose Curve Fit from the Analyze menu.
Select the Fit Equation, and then select OK. The graph screen will appear again.
Measure an Emission Spectrum
1. Use a small screwdriver to loosen the two screws that connect the cuvette holder
to the spectrometer (see Figure 1). Remove the cuvette holder and connect an
optical fiber assembly to the spectrometer.
2. Turn on the LabQuest 2 or original LabQuest. The LabQuest App will launch
automatically and the meter screen will be displayed.
3. On the meter screen, tap Change Units ► USB:Spectrometer ► Intensity from
the Sensors menu. The spectrometer measures intensity in relative units.
4. Aim the tip of the optical fiber cable at a light source. Start the data collection.
Tap the red Stop button to end the data collection.
If the spectrum maxes out (flat and wide peaks), increase the distance between the
light source and the tip of the optical fiber cable or reduce the sample time.
If data collection is unusually slow, tap Sensors and choose Data Collection. Set the
Sample Time to a suitable value and decrease the Samples to Average to 1.
Determining the Wavelength to Use in an Experiment
After you collect a full absorbance spectrum of a sample, LabQuest 2 or LabQuest
will identify the wavelength of maximum absorbance (λ max). If you wish to select a
different wavelength, tap on the full spectrum graph or use the arrow keys on the
keypad to identify the wavelength of choice. Another way to change the wavelength
is to navigate to the meter screen, tap on the meter itself, and select Change
Wavelength. Enter the wavelength of your choice and select OK. If the wavelength
you type in is not measured by the UV-VIS unit, LabQuest 2 or LabQuest will
automatically choose the wavelength closest to your choice.
Specifications
Vernier Spectrometer (order code: V-SPEC)
Dimensions: 10 cm × 8.7 cm × 3 cm (includes cuvette holder/light source)
Power: from computer via USB cable
Wavelength Range: 380 nm–950 nm
Resolution: 2 nm
Red Tide Spectrometer (order code: SPRT-VIS)
Dimensions: 10 cm × 8.7 cm × 3 cm (includes cuvette holder/light source)
Power: from computer via USB cable
Wavelength Range: 380 nm–950 nm
Resolution: 1 nm
Ocean Optics USB4000 VIS-NIR Spectrometer (order code: SP-VIS)
Dimensions: 10 cm × 8.7 cm × 3 cm (includes cuvette holder/light source)
Power: from computer via USB cable
Wavelength Range: 380 nm–950 nm
Resolution: 0.2 nm
Warranty
Vernier warrants this product to be free from defects in materials and workmanship
for a period of three years from the date of shipment to the customer. This warranty
does not cover damage to the product caused by abuse or improper use. Bulbs for the
light source are covered by a one-year warranty. This product is manufactured by
Ocean Optics, Inc.
Measurement
You can set up the spectrometer to measure intensity, absorbance, or
% transmittance. On the Meter screen, choose Change Units from the Sensors menu.
Click on the unit of choice from the list.
Sample Experiments
There are several experiments available for use with the Spectrometer. You may
download the labs from our web site (www.vernier.com/spectroscopy).
7
Vernier Software & Technology
13979 S.W. Millikan Way Beaverton, OR 97005-2886
Toll Free (888) 837-6437 (503) 277-2299 FAX (503) 277-2440
Rev. 6/18/2012
Logger Pro, Vernier LabQuest 2, Vernier LabQuest, and other marks shown are our trademarks or registered trademarks
in the United States.
All other marks not owned by us that appear herein are the property of their respective owners, who may or may not be
affiliated with, connected to, or sponsored by us.
Printed on recycled paper.
info@vernier.com www.vernier.com
8
 Loading...